
Energy Consumption in Central and Eastern Europe (CEE) Households in the Platform Economics


Warsaw School of Economics, 02-554 Warsaw, Poland
Energies 2021, 14(4), 1002; https://0-doi-org.brum.beds.ac.uk/10.3390/en14041002
Submission received: 8 January 2021
/
Revised: 4 February 2021
/
Accepted: 8 February 2021
/
Published: 14 February 2021
(This article belongs to the Special Issue Economic and Policy Challenges of the Energy Transition in CEE Countries)
Abstract
:The ongoing digitization of the economy has led to the creation and functioning of platform model socio-economic systems. It is also reflected in the changes in patterns of energy consumption in households. In the first cross-section, it is an industrial revolution, with environmental benefits. However, platforms are primarily a revolution in the consumption sphere, and here, the effects of digitization are not fully recognized. Our social needs are increasingly met “through accessibility” without us leaving our home. Due to the home’s multifunctionality, based on the availability of platform services, household energy consumption should be viewed differently today than before. The article aims to show the changes in Central and Eastern Europe (CEE) household energy consumption between 2008–2018 and their assessment through the prism of the economy’s platformization methods. The study presents the changes in energy consumption in households and determines the correlations between platformization (the author’s index) and changes in energy consumption in households with the use of taxonomic methods. The platformization leaders—Estonia and Lithuania—were subjected to a more detailed analysis. The presented method(s) may be useful in predicting the changes in households’ energy consumption caused by the digitization of other countries in the region (countries under transformation and outsiders-Bulgaria, Romania), in implementing household energy management systems, and in a better adjustment of regulations directed at these consumers.
1. Introduction
The socio-economic systems of the current platform business model are a consequence of continuous digitization of the economy [1]. Platforms help the market forces of supply and demand work together. In the first cross-section, we are dealing with an industrial revolution (industry 4.0). Less energy and natural resources consumed and fewer greenhouse gases emitted are just a few of the environmental benefits [2,3,4,5,6]. Here platforms primarily revolutionize consumers’ market, so the effects of digitization are not fully recognized. This reduced level of resource consumption broadly affects socio-economic activity, that is the consumption of energy. The emphasis is attached to the energy-intensive industry and transport sectors [7,8,9,10,11]. Yet digitization has brought about significant changes to both the labor market [12,13,14] and the way we live [15,16]. Thanks to digital competencies and advances in technology, work environments are becoming more virtual. These virtual offices are supported by both open or closed platforms. Due to the different activities that take place in the modern residence, the energy consumption in today’s households should be viewed differently than in the industrial era. The problem gained importance by 2020. The COVID-19 pandemic has significantly changed socio-economic life, with households wired for digital platforms that will take an increasing share of energy consumption.
The issues of energy consumption in households are not new [17,18]. There is plenty of space in the subject literature dedicated to them in the context of digitization [19].
The literature indicates the household is better and better equipped with digital consumer devices (e.g., personal computers, mobile phones, TV sets, and home entertainment systems [20], it also shows the increasing energy efficiency of these devices [21] and the optimization of energy consumption [22]. The considerations disregard the digital competences which, when better developed, allow us to understand how to implement and operate energy-efficient digital household solutions based on platforms. The article aims to try to show the changes in energy consumption in households in 2008–2018 in Central and Eastern Europe (CEE) countries, and, using taxonomic methods, to identify the correlation between energy consumption and platform adoption by these economies.
The article begins with the literature review that consists of three steps: (1) the platforms’ specificity, (2) key factors influencing the amount of energy consumption in households, (3) digitization versus location’s multifunctionality. It aims to show how the residence’s multifunctionality which is continuously growing thanks to platforms can affect the energy consumption in households.
In the context of changes in energy models, it is subject to debate what has a greater role: technologies or behavioral factors [23]. The influence of behavioral and technological factors is not linear [24]. Our activities are often routine and our practices are interrelated [25]. Similar observations result from digital competences.
The third section is methodological. For the purposes of this article, we constructed an indicator of economic platformization. Synthetic indicators of the digitization of the economy and society are encountered in practice. They are based on indicators of the availability of digital infrastructure and digital competences (e.g., DESI [26] and IMG [27]). In contrast, the proposed platformization indicator is based on the actual use of platform tools, and not only their availability, in three sections: society, economy, and administration. The platformization index is a new, original research perspective on changes in energy consumption in households.
The taxonomic methods used in the study–section fourth, based on Euclidean distance matrices (EDMs) [28,29], are classified as important data mining techniques [30]. They are used, among others, to study the development of phenomena in spatial terms [31] and to classify objects based on data identifying these objects. Although the first applications of EDMs date back to the 1930s [32], these methods are gaining momentum due to new applications, in particular in research based on machine learning [33,34]. Agglomeration methods made it possible to divide the CEE countries into three groups. Their separation was based on similarities in terms of the interdependencies between the level of platformization and changes in energy consumption in households. The platformization leaders, Estonia and Lithuania, were subjected to a detailed analysis explaining the obtained regularities.
The approach presented may also be useful in (a) predicting changes in household energy consumption caused by digitization, (b) implementing energy management systems, and (c) better adjustment of regulations addressed to platform users.
2. Literature Review
2.1. Internet Platforms
The dynamic development of the platform-based economy creates a new landscape for the global economy and affects the lives of citizens around the world [35]. The very term “platform” is defined very differently [36,37,38]. Gawer [38] defines platforms as evolving organizations or meta-organizations that: (1) bring together and coordinate the activities of constitutive, innovative, and competing agents; (2) create value, generate and use benefits from the supply and/or demand side of the market; (3) are characterized by a modular technological architecture that consists of a core and a periphery [39]. A platform is typically recognized as a set of subsystems and interfaces (in the broader sense, the Internet [40]), that makes up the company’s own business ecosystem for customers, partners, programmers, institutions, or is used by them. Platforms operate on the so-called multi-sided market-on multilateral platforms, sometimes referred to as a two-sided market [41]. Platforms are generally recognized as a meeting place that facilitates interactions between individuals [42].
Platforms operate in production and consumers’ markets concurrently. In the context of production, we are dealing with the industrial revolution (industry 4.0) [43], according to which the reduction of costs, improvement of efficiency, and quality of products are achieved through automation employing real-time data exchange and artificial intelligence. Industry platforms are open to external connections, which facilitate innovation into their ecosystems [44]. Digital transformation brings environmental benefits such as lower consumption of energy, lower use of natural resources, and reduced greenhouse gas emissions.
Platforms also play an important role in the energy sector [45], most importantly, in the distribution of energy [46]. However, platforms are primarily a revolution in exchange [36]. They completely change how we think, work, and learn. At work and home, we increasingly meet our needs through available and open platforms. The price we pay for it is our data [47]. The more data platforms have about their customers, the more they can offer them. The most famous 1.0 platforms (Amazon, Facebook, and Google) are investing heavily in and developing artificial intelligence and blockchain technologies which are expected to become the basis of 2.0 platforms. Algorithms based on machine learning and deep learning supported by artificial intelligence not only meet our needs to an increasingly better extent but also create them (they know faster and better what we need). To use their services, all you need is the Internet, a computer (more and more often a smartphone), and digital competences. The latter is a set of knowledge, skills, and attitudes necessary for active participation in social life. The Digital Competence 2.0 framework, defined by the European Commission, covers five areas: information and data literacy, communication and collaboration, digital content creation, security, and problem solving [48]. Thanks to them, we navigate through the virtual network provided to us by platforms with growing efficiency.
2.2. Energy Consumption in Household Factors
Households have for a long time been assigned an important role in the implementation of a country’s energy policy, in the literature that has been written on the subject, as well as in the economic practice. In the EU, the strategic goal of improved climatic conditions is sought through energy transformation, primarily industry, transport, and construction sectors [49]. In Europe, the housing sector is responsible for approx. 30% of energy consumption and 16% of total CO2 emissions [50]. These values are influenced not only by the state of the construction industry and the energy demand related to its operation (although it is responsible for the most important part of energy consumption in this cross-section [51]) but also by household energy consumption models. The latter, along with technological progress [52], may play an important role in the transition of European economies to the path of sustainable development.
The factors influencing the amount of energy consumption in households are extremely diverse. They are the result of individual decisions made under the influence of socio-economic and contextual conditions. The role of behavioral factors (attitudes, beliefs, norms) is widely recognized in the field of social and environmental psychology [53,54,55,56,57]. It is often emphasized that consumer decisions are often irrational and routine. Their declarations, for example, on the importance attached to the problem of climate change, do not translate into practical actions, such as saving energy or changing the sources of energy [58]. Consumers’ environmental “awareness” is important, but not sufficient to implement the principles of sustainable development at the household level [58,59]. Consumers’ energy-related behavior is strongly embedded in their environment [60,61]. The latter are sometimes seen through the prism of institutional economics [62]. According to North’s approach [63], the institutional environment consists of (a) formal institutions-legal regulations (tax incentives, regulations, standards), (b) informal institutions-customs, culture, fashion (e.g., ecology [64]), and (c) a mechanism for implementing and enforcing formal and informal rules of the game (e.g., enforcement of penalties for air pollution).
In explaining household consumption patterns, much attention is paid to contextual factors. These are permanent or temporary factors influencing the energy usage behavior of individuals or households, specific to place and time of energy consumption [65,66]. The Covid-19 pandemic should be recognized as a contextual factor. Contextual factors play an important role in energy management [67], i.e., ensuring: (a) energy availability, (b) energy security, (c) household energy efficiency. The implementation of the above objectives requires many coordinated actions, such as assessment of the real needs of the household, selection of an energy mix adequate to the needs and possibilities, and monitoring of equipment operation based on safety and efficiency standards in accordance with the country’s energy policy [68].
The complexity and interdependence of household energy consumption model factors prompt many authors to treat them holistically and interdisciplinary [17,18,62,69]. One of the most comprehensive and, at the same time, structured classification of factors influencing energy consumption in households is the approach of Frederiks et al. [69]. Individual prognostic factors and situational factors are distinguished in their classification. There are two categories in the first group: (a) socio-demographic factors (e.g., age, gender, education, employment status, household type, or location) and (b) psychological factors (e.g., values, motivation, vulnerability). According to this approach, situational factors, in turn, are legal regulations, available technology, prices, infrastructure, as well as all other unmentioned political, economic, social, and cultural factors influencing the environment. The above-mentioned factors are interdependent and change over time. Household energy consumption models evolve over time [70]. The digital revolution appears to be a substantial driving force behind these changes. In the second decade of the 21st century, attention is paid primarily to the so-called intensifying technologies. They are characterized by wide application (they can be used in various contexts), easy to adapt to individual needs, and practically trouble-free updating [71,72,73]. The group of important supporting technologies driving the digital economy includes Internet of Things (IoT), cloud computing, artificial intelligence algorithms, robotics, and blockchain.
Digitization has also penetrated individual prognostic factors shaping household energy consumption patterns (see Figure 1). This point of view broadens the holistic approach of Frederiks et al. to include digital components [69]. In the group of socio-demographic factors, these are digital competences-not always dependent on age or education level. Digital competences can be acquired formally through training courses, and informally [74,75]. The daily use of generally available platforms is part of the second source-informal. Research confirms that even using Wikipedia can increase our digital competences [76]. Thanks to them, the Internet and the media are an important source of information. They strongly influence the consumption decisions we make, also in the area of shaping pro-ecological practices [76,77].
2.3. Digital Transformation of Households
The digital transformation of households has two interdependent dimensions: (a) a technological one, (b) and a social dimension, which are expressed through the growth of digital competencies and the increase of family online daily activity thanks to platforms [80]. The first dimension consists primarily of digital solutions that can lead to a reduction in household energy consumption and a change in their consumption patterns [22,81]. Intensifying technologies play an important role in households’ technological digital transformation. IoT-the network of connections between physical objects equipped with sensors enables the data to flow between them.
The objects that belong to the network identify one another and communicate digitally with other devices-the objects “talk to each other” behind the scenes [82]. Thus IoT technology, supported by artificial intelligence, allows us to monitor all devices that use energy in the household and optimize the energy consumption at the same time [83,84,85]. The projects implemented in the EU, namely USmartConsumer [86] and E-Balance [87] are good examples thereof. These projects spent significant financial resources to help the end-user [88]. These digital solutions fit into the concept of the so-called “smart homes”. Their popularity is largely determined by environmental awareness [89]. The main barriers to the dissemination of this concept (i.e., smart homes), however, are the complexity and variety of systems and their price.
The methods for forecasting household energy consumption are based on new technological possibilities (IoT, cloud computing, algorithms) and disregard the impact of social transformation. They focus on the technological possibilities of the measure only [90]. The social digital transformation before the pandemic was slow. Working remotely was reserved for the so-called liberal professions and not for full-time workers [91]. Digital competences were most often perceived through the prism of institutional solutions-study and work [92]. As a result of the covid-19 pandemic and the need to keep social distance, the social digital transformation has accelerated significantly. During the Covid-19 pandemic, the home has become a workplace for many. An estimated 40% of Europeans have moved to work remotely during the pandemic, while only about 15% had ever done it before its outbreak [93]. Not only work, but also learning takes place online. We satisfy various types of our needs—shopping, entertainment, and social contacts—through publically accessible platforms. The result is a drastic decline in total energy consumption [94,95], its growth in households [96], and, due to it, a noticeable increase in the cost of living for households [97]. Consumption of electricity has become the primary concern. It has been observed in all regions of the world affected by the pandemic [98,99,100]. Surveys show that the increase in energy consumption in households varies according to their size. In small families-up to 2 members in 2018–2019, this is an increase of approx. 10.8%, 18% in medium-sized families (3–4 people) and as much as 37% in large families (over 4 people) [101]. Research also shows that consumers are afraid of an increase in energy expenditure, especially while there is a decline in their income [102]. With the increasing platformization of the economy, access to household energy, energy management, and its affordability are the elements that are taking on a slightly different meaning than they had in the past [103]. They determine not only the basic conditions of life, but also work, study, and the fulfillment of higher-order needs (e.g., culture).
On the other hand, the accelerated digital social transformation implies a significant increase in digital competences. We increase digital competences not only through remote working and learning but also through routine activities (such as paying bills online). Zoom data shows that from March to April 2020 alone, the daily number of users of this platform increased from 200 to 300 million, compared to about 10 million in December 2019. That’s a 30-fold increase in just four months. In turn, Microsoft Teams announced that the user base in April 2020 was 44 million compared to 20 million in March of the same year [104]. Acquiring digital competences does not apply to everyone equally. Their lack may even lead to digital exclusion [105].
3. Data and Methodology
The research methodology consists of three stages.
Stage 1—volatility in household energy consumption in 2008–2018 for the following developed CEE countries: Bulgaria, Estonia, Lithuania, Latvia, Poland, Czech Republic, Romania, Slovakia, Slovenia, and Hungary [29]. A similar level of development allows for a wider inference. The basis of the statistical analysis is the Eurostat database [106]. Due to its limitations (the latest data most often comes from 2018), as well as the possibility of making comparisons of the phenomena included in the study, the analysis covered the years 2008–2018.
The study covered changes in energy consumption in households in general and per capita. Patterns, including similarities and differences between CEE countries, were assessed in a wider context. The benchmark for this assessment was the trends in changes in total energy consumption, energy prices, and the level of socio-economic development of the surveyed countries.
Stage 2—platformization of CEE economies and the amount of energy consumption.
To synthetically assess the level of platformization of the CEE countries, the taxonomic method of the development pattern, initiated by Professor Zdzisław Hellwig [107], was applied. This method is one of the taxonomic methods included in the clustering methods group [29]. It is based on the study of Euclidean distances between the studied objects [108,109]. Taxonomic methods are used to assess the level of differentiation of objects (in this case countries) in terms of the statistical features assigned to them. This approach provides the basis for grouping like objects based on similar properties [110]. Objects that have similar characteristics are grouped in the same group.
The research algorithm categorized the CEE countries into groups (i.e., high, medium, and low) based on their level of economic platformization, using the following approach:
- Selection of variables. When selecting partial measures, the criteria used in spatial research were taken into account, including (a) significance from the point of view of the analyzed phenomenon and exhausting its scope, (b) maintaining proportionality in the representation of partial phenomena, (c) measurability, availability, and completeness of statistical information.
The degree of platformization of the CEE countries was determined based on the selection of 45 diagnostic variables covering various aspects of digitization, both of society (natural persons) and enterprises. The variables presented both the technical and social dimensions of digitization.
The independence of selected features was set by determining the Pearson linear correlation coefficient (r) between all variables [111]. It is one of the most frequently used coefficients (the correlation coefficient of zero means no relationship between the variables, and the further it reaches +1 or −1, the stronger the relationship between the variables, positive or negative, respectively).
The criterion of a strong correlation of variables was r³ 0,7 (with such a correlation one variable explains 50% of the variability of the other). The application of the above criterion has made it possible to eliminate the mutually strongly correlated features.
As a result of the correlation analysis, 11 variables were omitted in the further study: X4, X5, X7, X12, X15, X20, X30, X33, X34, X37, X43. This meant that a total of 34 variables were used to evaluate the synthetic index, which are presented in Table 1 (their description below the table). As a result of the correlation analysis, 11 variables were omitted in the further study: X4, X5, X7, X12, X15, X20, X30, X33, X34, X37, X43. This meant that a total of 34 variables were used to evaluate the synthetic index, which are presented in Table 1.
Variables description:
- X1
- Individuals carried out free online training or self-study to improve skills relating to the use of computers, software, or applications in total,
- X2
- Individuals carried out training paid by themselves to improve skills relating to the use of computers, software, or applications in total,
- X3
- Enterprises that employ ICT specialists as % of all enterprises without the financial sector, and employing 10 or more people,
- X4
- The development of web solutions is mainly performed by own employees as % of all enterprises without the financial sector, and employing 10 or more people—omitted in the further study,
- X5
- Enterprises with e-commerce sales of at least 1% turnover,
- X6
- Enterprises’ total turnover from e-commerce sales,
- X7
- Use enterprise’s blog or microblogs (e.g., Twitter, Present.ly, etc.) (as of 2014),
- X8
- Use social media to develop the enterprise’s images or market products,
- X9
- Use social media to share opinions of customers,
- X10
- Involve customers in the innovation of goods or services through social media,
- X11
- Involve customers in the development or innovation of goods or services through social media,
- X12
- Enterprises that have ERP software package to share information between different functional areas,
- X13
- Enterprises that bought cloud computing services,
- X14
- Enterprises that bought Customer Relationship Management software (as a CC service),
- X15
- Enterprises analyzing big data from social media,
- X16
- Individuals used a laptop, notebook, netbook, or tablet computer to access the internet away from home or work,
- X17
- Individuals used a mobile phone (or smartphone) to access the internet,
- X18
- Individual’s main job tasks changed as a result of the introduction of new software or computerized equipment,
- X19
- Individuals needed further training to cope well with the duties relating to the use of computers, software, or applications at work,
- X20
- Individuals’ skills correspond well to the duties related to the use of computers, software, or applications at work,
- X21
- Individuals choosing, modifying, or testing new software or computer equipment at work,
- X22
- Individuals whose main job tasks changed as a result of the introduction of new software or computer equipment,
- X23
- Individuals had to learn how to use new software or computer equipment at work
- X24
- Individuals needed further training to cope well with the duties relating to the use of computers, software, or applications at work,
- X25
- Individuals used social media at work,
- X26
- Individuals created or supported IT software or programs,
- X27
- Individuals used specialized software at work,
- X28
- Individuals created or edited electronic documents in their work,
- X29
- Individuals used computers, laptops, smartphones, tablets, or other portable devices at work,
- X30
- Individuals used computers, laptops, smartphones, tablets, other portable devices, or other computerized equipment or machinery,
- X31
- Individuals’ satisfaction level on the usefulness of available information: greatly satisfied,
- X32
- Individuals carried out at least one financial activity over the internet,
- X33
- Individuals used smartphones with some security system, installed automatically or provided with the operating system,
- X34
- Individuals used smartphones with some security system, installed by them or provided with the subscription,
- X35
- Individuals already lost information, pictures, documents, or other kinds of data on the smartphone as a result of a virus or other hostile type of programs,
- X36
- Individuals never restricted or refused access to personal data, when using or installing an app on the smartphone,
- X37
- Individuals did not know it was possible to restrict or refuse access to personal data when using or installing an app on the smartphone,
- X38
- Individuals used the internet to interact with public authorities,
- X39
- Households-level of internet access,
- X40
- Individuals used computers, laptops, smartphones, tablets, or other portable devices away from home and work,
- X41
- Internet use: seeking transportation service,
- X42
- Internet use: seeking housing service,
- X43
- Internet, phone, video call use,
- X44
- Individuals using social media (creating profiles, publishing information, posting on Facebook, Twitter, etc.),
- X45
- Internet use: seeking health information.
- 2.
- Standardization [111] of variables performed to obtain the comparability of variables. Standardization was performed using the formula:
- 3.
- Setting a pattern of development P0-combining all the best features of the surveyed units. The basis for the construction of an abstract pattern of development is a normalized matrix of features (Z). To distinguish the stimulant and destimulant subsets from the set of features (s), the vector P0 is defined, where:
The diagnosis of the diagnostic variables adopted in the study shows that all of them turned out to be stimulants.
- 4.
- Calculation of taxonomic distances between the studied units and the development pattern.
- 5.
- Determining the di * development measure on the basis of taxonomic distances:
The development index (di) is in the range of 0–1 and the closer the value of the measure approaches zero, the higher the level of development of a given unit. This allows the ranking of the CEE countries according to the degree of development of platformization. This ranking was the basis for the division of the surveyed countries into three groups that differ least in terms of the studied characteristics. A group was selected with a high, medium, and low level of economic platformization. A detailed analysis of the studied regularities is presented based on Lithuania and Estonia.
Stage 3—Lithuania and Estonia-case study taking into account the Global Connectivity Index (GCI) indicator.
The Global Connectivity Index (GCI) indicator was used to conduct a comprehensive approach in assessing the digitization of the economy, including the advancement of the implemented technologies and the possibility of their different impact on the level of energy consumption (also as a result of various digital competences) in countries with the highest level of platformization, namely Lithuania and Estonia [112]. GCI consists of four pillars: the supply of ICT products and services, the demand for these products, the experience of the end-users (individuals and organizations), and the ICT potential. It comprises 40 indicators measuring the impact of ICT on the economy, digital competitiveness, and future growth. Their selection was aimed at capturing the development of ICT and digital transformation in terms of four levels of technology, i.e., broadband, cloud, IoT, and AI. The comparability of indicators between countries was ensured by relating them to the potential of the economy (e.g., GDP), the number of households, or the population. Each indicator is rated on a scale of 1 (low) to 10 (high). The final total GCI level (10–100) is an aggregation of indicators from the four segments indicated above.
Given the above, the analysis of the relationship between platformization and energy consumption in households will be embedded in the differences in the digitization of the different examples of Lithuania and Estonia.
4. Results
4.1. Changes in Household Energy Consumption
The changes taking place in societies and the economy, largely caused by the digital revolution, mean that there are significant shifts in the structure of energy consumption, i.e., between its main consumers. Hence, in the search for answers to the questions posed in the article, it is important to analyze changes in energy consumption in the countries in the study. Among the CEE countries, households account for a significant share of the total energy consumption. In 2018, it ranged from approx. 1/5 of total consumption in countries such as Slovakia, Slovenia, and Bulgaria to approx. 30–33% of total consumption in Latvia, Estonia, Hungary, and Romania [113]. Between 2008 and 2018, most CCE countries saw a decline in total household energy consumption. The highest was recorded in Latvia (by 15.2%), the remaining countries recorded a decline of 0–5% (see Figure 2). Only in Bulgaria and the Czech Republic, we saw an increase (by 5.5% and 8.2%, respectively). It is worth adding that these changes took place in the context of a decrease in total energy consumption in the CEE countries. It amounted to approx. 6%, except for Poland, Lithuania, Hungary, and Bulgaria, where actually an increase in total energy consumption was recorded (the highest in Poland, reaching almost 15% in 2008–2018).
At the same time, the CEE countries with the highest energy consumption in households per capita include Estonia, the Czech Republic, and Lithuania, where in 2018 it was at a level exceeding 600 thousand tons (in oil equivalent—TOE) [113,114]—see Figure 3. The smallest consumption, on the other hand, was characteristic of Bulgaria, Slovakia, and Romania, where it did not exceed 400 thousand tons of energy per capita.
It was related to the level of socio-economic development and a different course of the political and energy transformation [115,116]. The group of countries with the highest energy consumption includes countries with the highest level of socio-economic development among the CEE countries. Countries with the lowest energy consumption were also characterized by a relatively low level of development-Figure 4.
In the analyzed period, there was a decrease in this consumption in half of the analyzed countries (the largest in Slovenia, slightly lower in Slovakia and Latvia). In turn, a large increase in per capita household energy consumption was recorded in Bulgaria and Lithuania, (i.e., about 10–15%), i.e., countries representing both high and low levels of this consumption.
Also, in the case of electricity consumption, one of the forms of energy consumption in households (expressed in thousands of tons of oil equivalent) in 2008–2018, in most CEE countries we saw an increase (except for Latvia and Hungary). It ranged from approx. 1−2% (Estonia, the Czech Republic), through 5–9% (Slovenia, Poland, Bulgaria, Lithuania) to approx. 12% in Slovakia and the largest amount was 22% in Romania [117]. Only in 2015–2020, it was accompanied by an increase in energy prices in households (euro per kilowatt excluding taxes and charges). The highest increase was recorded in Lithuania (by 28.7%) as well as the Czech Republic and Romania (14.6% and 11.4% respectively) [117].
In turn, their highest level in this period (2015–2020) was characteristic in 2018 for the Czech Republic, Slovenia, Latvia, Estonia (0.13–0.10 EUR) and in 2020 for the Czech Republic, Lithuania, Slovakia, Slovenia and Romania (from 0.13 to 0.10 euro).
Countries such as Estonia, the Czech Republic, Latvia and Lithuania are also countries with a high level of energy consumption in households per capita-Figure 5.
In 2018, in the Czech Republic, Slovenia, Estonia, Poland, Romania, and Latvia, the price of electricity was higher in households than in other sectors of the economy [118,119]. In 2020, it was characteristic of the Czech Republic (5.89), Slovenia (2.52), Lithuania (2.40), and Estonia (2.07). Only in Hungary, the price of electricity in households was lower than that offered to other users by (0.37).
4.2. The Platformization of CEE Economies and the Amount of Energy Consumption
Taking into account the applied research approach, i.e., the taxonomic method of distance from the pattern, which was used to classify the CEE countries in terms of the level of platformization, the highest level was achieved by Lithuania and Estonia. As a result, they were included in the first group (Figure 3). The average level of platformization was characteristic of the Czech Republic, Hungary, Slovenia, Poland, Slovakia, and Latvia. The lowest level of digitization as defined above (group III) was achieved by Romania and Bulgaria. Among the CEE countries, they recorded the lowest level of socio-economic development measured by GDP per capita and expressed both according to the official exchange rate and purchasing power. Only countries with a high level of platformization showed relatively low energy consumption in total and in households. In other groups distinguished in terms of platformization, it is difficult to notice the relationship between the level of platformization and the above-mentioned energy consumption (e.g., Bulgaria, representing the 3rd platformization group, has a level of energy consumption in total and in households similar to Slovakia’s from group II, and Latvia’s level, from group II, is lower than Lithuania’s, included in group I).
Taking as the reference point energy consumption per capita total, one can state that relatively more often its higher level is observed in the countries with a higher level of platformization. Such a tendency, however, cannot be observed in the case of energy consumption in households per capita (see Figure 6). The levels of implementation of digital solutions are varied in these countries. Their level of modernization varies as well. This translates in turn into different energy efficiency and is associated with different ranges of skills needed to use digital solutions. These countries also show large differences in demographic and economic potentials and their structures.
The trends in energy consumption outlined above do not clearly indicate dependence and appear to result from many conditions, including the force of individual factors, internal or external in nature. The percentage of people who worked remotely during the pandemic (2020) confirms cardinally the emerging trends. The percentage of people surveyed shows differences among the CEE countries. It ranges from about 1/5 in Poland, Slovakia, Bulgaria, and Hungary, through about 1/4 in Romania and the Czech Republic, to about 1/3 in Lithuania (Estonia, Latvia and Slovenia were excluded in the study due to insufficient case studies).Moreover, the research shows that these people indicated the regular performance of work-related duties also in their free time more often than those, who worked at their employer’s premises or in various places away from home (this concerned approx. 1/5 of the respondents, while in the case of working at the employer’s or other places away from home-6% of respondents in both cases) [93].
Taking into account the progress in the digitalization of societies and the economy (platformization), it would seem that the increase in household energy consumption will mostly affect the countries that show its greatest advancement, i.e., Estonia and Lithuania. Yet no clear tendency emerges, in this respect, from the analysis of the current trends in the changes in household energy consumption, including per capita. The overall growth of consumption (only in the Czech Republic and Bulgaria), high level per capita (in Slovenia, Estonia, and Latvia), and changes in the latter (the largest in Lithuania, Latvia, and Poland) refer to the countries that differ from one another in terms of their level of platformization. Moreover, these trends result from factors that interpenetrate or even “cancel” themselves at times.
5. Case-Study-Lithuania and Estonia
The GCI data for 2015–2019 show that of the 79 countries that study the impact of ICT on the economy (they collectively generate 95% of global GDP), Estonia (21) ranked highest among the CEE countries-indicator value at 62, followed by Czech Republic (25)-indicator value 58, Lithuania (28, 56, respectively), Slovenia (29, 56), Hungary (31, 54), Slovakia (32, 53), next Bulgaria (34, 51), Poland (36, 51), and Romania (37, 51) [112].
Estonia, known as ‘e-Estonia’, achieved particularly high positions, exceeding the global average for broadband technologies (84 against the average of 63 for the countries in the study), but also for IoT (42 against 35, respectively). Taking into account the examined pillars included in the GCI, Estonia stands out in particular in terms of the users’ demand and experience in the use of communications (70 against 53 and 75 against 61, respectively). The development of broadband technology and its high accessibility level were associated with great affordability, much higher than the world average. High-speed broadband has been widely available and used in providing digital public services, including tax system support. Recognition of Estonia as a pioneer of the electronic transformation of public services ensured the implementation of Government Cloud solutions. A certain drawback in this area is the lower level of saturation of less urbanized areas with broadband connections. Their implementation in rural areas may improve general access to such a network and reduce costs for its users. The modernization of the information systems in use is aimed at maintaining the efficiency in providing e-services by government agencies and also by other service providers. In Estonia, much of the local data is stored in the cloud and the use of the cloud is widely accepted. The created legal provisions relating to individual ICT areas, including digital signatures, consumer protection, and e-commerce have built a base for the dynamic development of ICT. The level of their implementation was rated above the average of the surveyed countries (9 against 7).
Similarly, among the partial indicators in the delivery pillar, the level of subscription of 4G services is highly rated, i.e., mobile devices of people and organizations giving access to the 4G network (8 vs. 6), as well as Internet capacity in relation to the total capacity of the international internet band (in Mb/s)-(5 against 3). Values above average, often reaching the maximum value (i.e., at the level of 9–10 points), are also characteristic in the procurement pillar for the share of smartphones in overall connections, mobile broadband subscription, server security, as well as the number of households with access to a computer.
In the area of user experience in using connectivity, Estonia records higher levels of indicators in most of the indicators included in this pillar (mobile broadband availability, e-government services, percentage of inhabitants using the Internet, awareness of cybersecurity, and affordability of access to fixed broadband) than the average among the surveyed countries. The indicators in the potential pillar were scored slightly higher than those in the supply pillar. This concerned in particular the impact of ICT on the implementation of new business models, the assessment of the forecast of the annual growth rate on the IoT and AI market, and the number of programmers per capita. The latter was reflected in the level of indicators (within 5–8 points), still above the average level of the surveyed countries.
The indicators of GC for Lithuania, ranked 28th, are also above the world average. It especially refers to users’ demand for connectivity and their experience in this area (68 with an average of 62 and 62 against 53, respectively). On the other hand, in the case of basic technologies for the development of GCI, higher than average level of indicators is recorded (in particular) in the area of broadband technologies and access to the cloud (84 against the average of 63 and 54 against 51, respectively). Lithuania has performed particularly well in smartphone penetration and mobile broadband subscriptions (availability and affordability stimulate demand while network security and speed build a good experience) and has reached a level exceeding the global average. User interest in the areas of e-commerce and server security has also increased. In the demand area, a high level (above the world average) was recorded in the number of households with Internet access (8 vs. 7), apart from the broadband network subscription and connection penetration dominated by smartphones. In the area of experience, Lithuania stands out in terms of the cost-effective subscription for mobile and wired broadband, the development of e-government services, the universal use of the Internet by citizens, and also the quality of services available in the cloud.
To a large extent, the basis for a good user experience are the activities in the supply pillar, especially investments in modern network infrastructure (7 vs. 4). They manifested, among others, through an increase in 4G coverage in 2019, high quality of services provided by access to the 4G network (7 vs. 6), and the adequacy of regulations related to the development of ICT (global average). As mentioned above, in terms of the development of technologies crucial for the development of communications, the global average was exceeded by investments in "cloud" technologies (54 against 51). However, Lithuania still lags behind in the area of factors enabling the development of advanced information and communication technologies. Investments in the potential area are among the lowest, especially those relating to the implementation of artificial intelligence and IoT. These investments are below average, especially in AI, with a slightly better rating of IoT (18 against 27 and 33 against 35, respectively).
Lithuania is taking steps to increase state expenditure on the development of infrastructure that provides access to the Internet of new generation and support for this type of investment undertaken by the private sector. Such initiatives are manifested by, among others, support by the National Digital Agenda for investments in broadband infrastructure, also in cases where the limitation is the low economic profitability of the investment. An important task in increasing Lithuania’s digitalization is to improve the digital skills of Lithuanians, apart from stimulating the demand for access to high-quality communication. The goal is to achieve 100% coverage of the country with the Internet with a speed of 30 Mb/s and 50% of households with a network with a speed of 100 Mb/s by 2020.
When comparing the two countries with the highest level of platformization among the CEE countries surveyed, it is Estonia that has generally achieved a higher level of the implementation of key technologies underpinning the digital economy (high-speed broadband, cloud services, AI, and IoT). This difference applies in particular to IoT and AI technologies-(Figure 7) (i.e., 42 against 33 in Lithuania, respectively, with the world average being 35, and 27 against 18 in Lithuania, with an average of 27). Estonia, in the group of CEE countries, also records large investments in the cloud. As a result, Estonia is included in the group of adapters (after the beginners and ahead of the leaders in the three-tier classification in the GCI ranking), also in terms of achievements in the field of IoT technology. The development of AI requires a solid foundation in the field of cloud technology and IoT. In the list of adapters in the general classification of GCI, Estonia took 1st place, Lithuania was 8th.
Lithuania, on the other hand, has made more progress in the field of technologies related to cloud services. The highest level amidst the indicated technologies was achieved in the development of broadband technologies; it is at the same level in both countries.
Taking the pillars of the digital economy, i.e., demand, supply, experience, as a point of reference, it is worth noting that both countries exceeded the global average in these areas, but only Estonia has exceeded it in the potential pillar. Taking into account the individual indicators included in the pillars of the digital economy, one must note Estonia’s advantage in accessing the 4G network, regulations on ICT technology, equipping farms with the necessary equipment, server security, development of e-administration services, awareness of cybersecurity as well as activities for the development of the IoT market. On the other hand, when compared to Estonia, Lithuania has had greater achievements recorded in terms of telecommunications investments and equipping households with optical fiber, as well as the quality of services available in the cloud and the created potential of the IoT market.
6. Conclusions and Perspectives for Further Research
In 2008–2018, in most CEE countries, we observe a decrease in energy consumption by households (except Bulgaria and Romania). In the case of energy consumption in households per capita, it concerns already half of the studied group of CEE countries, with a significant increase in energy consumption in Lithuania and Bulgaria. However, we cannot clearly evaluate these trends from the point of view of the ongoing economic platformization underway in these countries. On the one hand, platformization, the impact of which is exacerbated by the pandemic, may lead to an increase in energy consumption, especially electricity consumption in households. Digital technologies based on freely available networks create new opportunities for companies: they delegate more tasks to consumers, tighten their relationship with the customer thanks to complex and integrated applications, and deliver personalized product packages at any time and place. As a result, we can do many more routine activities remotely at home, and, if there are any infrastructure limitations in the office, we perform more of them at work too. Similar observations are made regarding working remotely and the wider growth of the home office, especially at the present requirements of social distancing.
Working from home blurs the boundaries between the workspace and family life. It also leads to an increase in costs imposed on households. In the case of work performed at the company’s premises, these costs are borne by the employer. We include among them the costs of water consumption, waste disposal, and also energy costs. This type of phenomenon may, at least in the short term, lead to an increase in energy consumption in households, which can be verified already at the beginning of 2021 (there are no comprehensive post-covid statistics at present).
On the other hand, the expected increase in energy consumption does not have to be a long-term trend. Although the home use of many different types of devices for activities related to work, study, entertainment, or simply social contacts is increasing, its impact on the energy costs of households can be verified by various factors. This is due to technologies that contribute to the introduction of more effective solutions reducing energy consumption, as well as the increased demand for work organization management systems. Moreover, the accelerated digitization leads to an increase in digital competences and so-called “smart” solutions are becoming much more affordable than in the past. In other words, platformization has a positive long-term effect on energy consumption in households, provided that its level is high and is based on the latest solutions.
There are tangible benefits for enterprises. These are: (1) costs passed on to the customer (e.g., online transactions via financial platforms), advertising (e.g., opinions about the product, the seller posts by customers in social networks), product testing, etc. In return, the customer receives “attractive ” affordable offers. By entering into more and more advanced relations with various types of organizations (e.g., e-commerce companies, e-administration), the client increases his digital competences in an informal manner.
The above interdependencies are confirmed by an in-depth analysis of countries with the highest level of platformization, namely Lithuania and Estonia. In these countries, changes in energy consumption in households are associated with different progress in the digitization of society and the economy. It is reflected in the level of platformization, as well as the GCI index used in the study. Estonia appears to be an example of an earlier entry into the digitization processes and thus shows smaller increases in this respect. As a consequence, we observe a relatively small decrease in energy consumption in households and a slight increase in energy consumption per capita. In turn, Lithuania has been catching up with digital backlogs revealed by their dynamic development, has achieved both a high level of platformization and associated with it increase in energy consumption in households per capita. This increase in the burden of costs on households (the largest increase among CEE countries) is related to a greater inclination of the Lithuanians to bear these costs by individuals working from home. It also results from the introduction of large-scale working from home. In this crisis situation, the Lithuanians used their savings to a greater extent, which allowed them to maintain the current standard of living (only 10% of teleworkers and 15% of partial teleworkers indicated no savings during the pandemic, compared to 28% of employees working at employer’s premises) [76].
The above analysis does not give a full picture of the impact of the transfer of our professional and private activity via platforms onto households and their energy consumption. It shows, however, that in the long run, platformization can reduce this consumption, but it does not happen automatically. The two key elements responsible for the course of this process are: (1) the level of platformization and quality of digital infrastructure (in general, not limited to energy distribution), and (2) digital competences. These are promising research areas from the point of view of energy management in the household and energy policy. In the first cross-section, the main question is: how do platformization and digital competences affect household implementations of intelligent energy management systems? The issues related to the impact of platformization on energy consumption in households constitute one of the potential dimensions of energy policy in the 21st century. The Covid-19 pandemic also creates new challenges. The basic insight relates to solving this dilemma: should the states support subsidies to the rising energy costs in households or invest in science and digital competences and publicly available digital infrastructure, that actively counteracts digital exclusion? These questions are important because, even though the pandemic should be seen as a contextual, time-related factor, our digital habits might not go back to the times before the pandemic. Platformization is our future.
Funding
This research received no external funding.
Institutional Review Board Statement
Not applicable.
Informed Consent Statement
Not applicable.
Data Availability Statement
Publicly available datasets were analyzed in this study. This data can be found here: https://ec.europa.eu/eurostat/data/database.
Conflicts of Interest
The author declare no conflict of interest.
References
- Kenney, M.; Zysman, J. The rise of the platform economy. J. Sci. Technol. 2016, 32, 61–69. [Google Scholar]
- International Institute for Applied Systems Analysis (IIASA). TWI2050: Transformations to Achieve the Sustainable Development Goals. Report Prepared by the World in 2050 Initiative. 2018. Available online: https://iiasa.ac.at/web/home/research/twi/Report2018.html (accessed on 22 November 2020).
- International Institute for Applied Systems Analysis (IIASA). TWI2050: The World in 2050. The Digital Revolution and Sustainable Development: Opportunities and Challenges. Report Prepared by the World in 2050 Initiative. 2019. Available online: https://iiasa.ac.at/web/home/research/twi/Report2019.html (accessed on 22 November 2020).
- Ordieres-Meré, J.; Remón, T.P.; Rubio, J. Digitalization: An Opportunity for Contributing to Sustainability From Knowledge Creation. Sustainability 2020, 12, 1460. [Google Scholar] [CrossRef] [Green Version]
- George, G.; Merrill, R.K.; Schillebeeckx, S.J.D. Digital Sustainability and Entrepreneurship: How Digital Innovations Are Helping Tackle Climate Change and Sustainable Development. Entrep. Theory Pract. 2020. [Google Scholar] [CrossRef] [Green Version]
- Snooks, G. New perspectives on the industrial revolution. In Was the Industrial Revolution Necessary? Routledge: Abingdon, UK, 1994; pp. 13–38. [Google Scholar]
- Rossotto, C.M.; Das, P.L.; Ramos, E.G.; Miranda, E.C.; Badran, M.F.; Licetti, M.M.; Murciego, G.M. Digital platforms: A literature review and policy implications for development. Compet. Regul. Netw. Ind. 2018, 19, 93–109. [Google Scholar] [CrossRef]
- Margetts, M. Makers: The New Industrial Revolution; The New Industrial Revolution; Consumers, Globalisation and the End of Mass Production. J. Mod. Craft 2017, 10, 107–109. [Google Scholar] [CrossRef]
- Ideas. Global Economic Review: Special issue on new industrial platform and innovation in east asia: Economics of the 4th industrial revolution. Glob. Econ. Rev. 2019, 48, 111. [Google Scholar] [CrossRef] [Green Version]
- Baron, R.; Zintel, M.; Zieries, M.; Mikulla, D. Digital Platforms in Freight Transportation. A True Industry Disraptor? Arthur D. Little. 2017. Available online: https://www.adlittle.com/en/insights/viewpoints/digital-platforms-freight-transportation (accessed on 21 January 2021).
- OECD. Going Digital: Shaping Policies, Improving Lives. 2019. Available online: https://www.oecd.org/publications/going-digital-shaping-policies-improving-lives-9789264312012-en.htm (accessed on 23 January 2021).
- Perrons, D. The new economy, labour market inequalities and the work life balance. In Geographies of Labour Market Inequality, 1st ed.; Martin, R., Morrison, P.S., Eds.; Routledge: London, UK, 2002; pp. 129–148. [Google Scholar]
- Dengler, K.; Gundert, S. Digital Transformation and Subjective Job Insecurity in Germany. Eur. Sociol. Rev. 2021. [Google Scholar] [CrossRef]
- Udd, E. Digital leisure, the internet and popular culture: Communities and identities in a digital age, by Karl Spracklen. Leisure 2016, 40, 245–246. [Google Scholar] [CrossRef]
- Denegri-Knott, J.; Molesworth, M. Concepts and practices of digital virtual consumption. Consum. Mark. Cult. 2010, 13, 109–132. [Google Scholar] [CrossRef]
- Kalogeropoulos, A. Online News Video Consumption. Digit. J. 2017, 6, 651–665. [Google Scholar] [CrossRef]
- Costanzo, M.; Archer, D.; Aronson, E.; Pettigrew, T. Energy conservation behavior: The difficult path from information to action. Am. Psychol. 1986, 41, 521–528. [Google Scholar] [CrossRef]
- Stern, P.C. New Environmental Theories: Toward a Coherent Theory of Environmentally Significant Behavior. J. Soc. Issues 2000, 56, 407–424. [Google Scholar] [CrossRef]
- Martiskainen, M.; Coburn, J. The role of information and communication technologies (ICTs) in household energy consumption—Prospects for the UK. Energy Effic. 2010, 4, 209–221. [Google Scholar] [CrossRef]
- Corcoran, P.; Desbonnet, J.; Bigioi, P.; Lupu, I. Home network infrastructure for handheld/wearable appliances. IEEE Trans. Consum. Electron. 2002, 48, 490–495. [Google Scholar] [CrossRef]
- Andrae, A.S.G.; Edler, T. On Global Electricity Usage of Communication Technology: Trends to 2030. Challenges 2015, 6, 117–157. [Google Scholar] [CrossRef] [Green Version]
- Erdmann, L.; Hilty, L.; Goodman, J.; Arnfalk, P. The Future Impact of ICTs on Environmental Sustainability; Institute for Prospective Technological Studies: Seville, Spain, 2014. [Google Scholar]
- Gram-Hanssen, K. Efficient technologies or user behaviour, which is the more important when reducing households’ energy consumption? Energy Effic. 2012, 6, 447–457. [Google Scholar] [CrossRef]
- Aune, M. Energy comes home. Energy Policy 2007, 35, 5457–5465. [Google Scholar] [CrossRef] [Green Version]
- Gram-Hanssen, K. Understanding change and continuity in residential energy consumption. J. Consum. Cult. 2011, 11, 61–78. [Google Scholar] [CrossRef]
- European Commission. The Digital Economy and Society Index (DESI). 2020. Available online: https://ec.europa.eu/digital-single-market/en/digital-economy-and-society-index-desi (accessed on 10 January 2021).
- Bris, A.; Cabolis, C. The IMD World Digital Competitiveness Ranking. How Does Your Country Rank? 2019. Available online: https://www.imd.org/research-knowledge/articles/the-imd-world-digital-competitiveness-ranking/ (accessed on 10 December 2020).
- Iglesias, F.; Kastner, W. Analysis of Similarity Measures in Times Series Clustering for the Discovery of Building Energy Patterns. Energies 2013, 6, 579–597. [Google Scholar] [CrossRef] [Green Version]
- Kumar Malhotra, V.; Kaur, H.; Alam, M.A. An Analysis of Fuzzy Clustering Methods. Int. J. Comput. Appl. 2014, 94, 9–12. [Google Scholar] [CrossRef] [Green Version]
- Rokach, L.; Maimon, O. Clustering Methods. In Data Mining and Knowledge Discovery Handbook, 1st ed.; Maimon, O., Rokach, L., Eds.; Springer: Boston, MA, USA, 2005; pp. 321–352. [Google Scholar]
- Munandar, T.A.; Musdholifah, A.; Arsyad, L. Modified agglomerative clustering with location quotient for identi-fication of regional potential sector. J. Theor. Appl. Inform. Technol. 2017, 95, 1191–1199. [Google Scholar]
- Young, G.; Householder, A.S. Discussion of a set of points in terms of their mutual distances. Psychometrika 1938, 3, 19–22. [Google Scholar] [CrossRef]
- Turk, M.; Pentland, A. Eigenfaces for Recognition. J. Cogn. Neurosci. 1991, 3, 71–86. [Google Scholar] [CrossRef] [PubMed]
- Alfakih, A.Y.; Khandani, A.; Wolkowicz, H. Solving Euclidean distance matrix completion problems via semidefinite pro-gramming. Comput. Optim. Appl. 1999, 12, 13–30. [Google Scholar]
- Evans, P.C.; Gawer, A. The Rise of the Platform Enterprise: A Global Survey, The Center for Global Enterprise. 2016. Available online: https://www.thecge.net/app/uploads/2016/01/PDF-WEB-Platform-Survey_01_12.pdf (accessed on 10 January 2020).
- Parker, G.G.; Van Alstyne, M.W.; Choudary, S.P. Platform Revolution: How Networked Markets Are Transforming the Economy—And How to Make Them Work for You; W.W. Norton & Company Inc.: New York, NY, USA, 2016. [Google Scholar]
- Evans, D.; Hagiu, A.; Schmalensee, R. Invisible Engines: How Software Platforms Drive Innovation and Transform Industries; The MIT Press: Cambridge, MA, USA, 2006. [Google Scholar]
- Gawer, A.; Cusumano, M.A. Platforms and Innovation. In The Oxford Handbook of Innovation Management; Dodgson, M., Gann, D.M., Phillips, N., Eds.; Oxford University Press: Oxford, UK, 2014; pp. 649–656. [Google Scholar]
- UNCTAD. The ‘New’ Digital Economy and Development. Technical Note. 2017. Available online: https://unctad.org/system/files/official-document/tn_unctad_ict4d08_en.pdf (accessed on 12 January 2020).
- Evans, D.; Schmalensee, R. The Antitrust Analysis of Multi-Sided Platform Businesses; Working Paper 18783; National Bureau of Economic Research: Cambridge, MA, USA, 2013. [Google Scholar] [CrossRef]
- Rysman, M. The Economics of Two-Sided Markets. J. Econ. Perspect. 2009, 23, 125–143. [Google Scholar] [CrossRef] [Green Version]
- Evans, D.S.; Schmalensee, R.; Noel, M.D.; Chang, H.H.; Garcia-Swartz, D.D. Platform Economics: Essays on Multi-Sided Businesses. In Platform Economics: Essays On Multi-Sided Businesses; Evans, D.S., Ed.; Competition Policy International: Brussels, Belgium, 2011; Available online: https://papers.ssrn.com/sol3/papers.cfm?abstract_id=1974020 (accessed on 10 February 2020).
- Nowicka, K.; Szymczak, M. Logistyka i łańcuchy dostaw w obliczu czwartej rewolucji przemysłowej. STUDIA Bas. 2020, 3, 61–84. [Google Scholar] [CrossRef]
- Gawer, A. Bridging differing perspectives on technological platforms: Toward an integrative framework. Res. Policy 2014, 43, 1239–1249. [Google Scholar] [CrossRef] [Green Version]
- Kloppenburg, S.; Boekelo, M. Digital platforms and the future of energy provisioning: Promises and perils for the next phase of the energy transition. Energy Res. Soc. Sci. 2019, 49, 68–73. [Google Scholar] [CrossRef]
- Van Dijck, J.; Poell, T.; De Waal, M. The Platform Society: Public Values in a Connective World; University Press Oxford: Oxford, UK, 2018. [Google Scholar]
- Steel, E.; Locke, C.; Cadman, E.; Freese, B. How Much Is Your Personal Data Worth? Financial Times, 12 June 2013. Available online: https://ig.ft.com/how-much-is-your-personal-data-worth/(accessed on 1 November 2019).
- European Commission. The Digital Competence Framework 2.0. 2020. Available online: https://ec.europa.eu/jrc/en/digcomp/digital-competence-framework (accessed on 1 November 2020).
- European Commission. Communication from the Commission to the European Parliament, The Council, The European Economic and Social. Committee and the Committee of the Regions. 2020. Available online: https://ec.europa.eu/clima/sites/clima/files/eu-climate-action/docs/com_2030_ctp_en.pdf (accessed on 1 November 2020).
- Energy Information Administration (EIA). International Energy Outlook. 2016. Available online: https://www.eia.gov/outlooks/ieo/pdf/0484 (accessed on 5 June 2020).
- Brounen, D.; Kok, N.; Quigley, J.M. Energy literacy, awareness, and conservation behavior of residential households. Energy Econ. 2013, 38, 42–50. [Google Scholar] [CrossRef]
- European Commission. A Roadmap for Moving to a Competitive Low Carbon Economy in 2050; Communication from the Commission to the European Parliament, the Council, the European Economic and Social Committee of the Regions; European Commission: Brussels, Belgium, 2011. [Google Scholar]
- Kaiser, F.G.; Wölfing, S.; Fuhrer, U. Environmental attitude and ecological behaviour. J. Environ. Psychol. 1999, 19, 1–19. [Google Scholar] [CrossRef] [Green Version]
- Abrahamse, W.; Steg, L. How do socio-demographic and psychological factors relate to households’ direct and indirect energy use and savings? J. Econ. Psychol. 2009, 30, 711–720. [Google Scholar] [CrossRef]
- Lindenberg, S.; Steg, L. Normative, Gain and Hedonic Goal Frames Guiding Environmental Behavior. J. Soc. Issues 2007, 63, 117–137. [Google Scholar] [CrossRef] [Green Version]
- Yeboah, F.K.; Kaplowitz, M. Explaining Energy Conservation and Environmental Citizenship Behaviors Using the Value-Belief-Norm Framework. Hum. Ecol. Rev. 2016, 22, 159–237. [Google Scholar] [CrossRef]
- Frederiks, E.R.; Stenner, K.; Hobman, E.V. Household energy use: Applying behavioural economics to understand consumer decision-making and behaviour. Renew. Sustain. Energy Rev. 2015, 41, 1385–1394. [Google Scholar] [CrossRef] [Green Version]
- Schipper, L.; Bartlett, S.; Hawk, D.; Vine, E. Linking Life-Styles and Energy Use: A Matter of Time? Annu. Rev. Energy 1989, 14, 273–320. [Google Scholar] [CrossRef]
- Gram-Hanssen, K. New needs for better understanding of household’s energy consumption-behaviour, lifestyle or practices? Arch. Eng. Des. Manag. 2013, 10, 91–107. [Google Scholar] [CrossRef]
- Barr, S.; Gilg, A.W.; Ford, N. The household energy gap: Examining the divide between habitual- and purchase-related conservation behaviours. Energy Policy 2005, 33, 1425–1444. [Google Scholar] [CrossRef]
- Guagnano, G.A.; Stern, P.C.; Dietz, T. Influences on Attitude-Behavior Relationships. Environ. Behav. 1995, 27, 699–718. [Google Scholar] [CrossRef]
- Vasseur, V.; Marique, A.-F.; Udalov, V. A Conceptual Framework to Understand Households’ Energy Consumption. Energies 2019, 12, 4250. [Google Scholar] [CrossRef] [Green Version]
- North, D.C. Institutions. J. Econ. Perspect. 1991, 5, 97–112. [Google Scholar] [CrossRef]
- Owens, S.; Driffill, L. How to change attitudes and behaviours in the context of energy. Energy Policy 2008, 36, 4412–4418. [Google Scholar] [CrossRef]
- Tanner, J.F., Jr.; Raymond, M.A. Principles of Marketing, Version 2.0. May 2012. Available online: https://catalog.flatworldknowledge.com/catalog/editions/tanner_2-0-principles-of-marketing-2-0 (accessed on 10 June 2020).
- Wambugu, H.W. Effects of situational factors and packaging characteristics on the outcome of shoppers’ behaviour in Kenyan supermarkets. Eur. J. Bus. Manag. 2015, 7, 47–60. [Google Scholar]
- Kuhe, A.; Bisu, D.Y. Influence of situational factors on household’s energy consumption behaviour. Int. J. Energy Sect. Manag. 2019, 14, 389–407. [Google Scholar] [CrossRef]
- International Energy Agency (IEA). Developing Energy Efficiency Indicators to Track Efficiency Progress: Why? 2014. Available online: https://www.iea.org/reports/energy-efficiency-market-report-2014 (accessed on 18 July 2020).
- Frederiks, E.R.; Stenner, K.; Hobman, E.V. The Socio-Demographic and Psychological Predictors of Residential Energy Consumption: A Comprehensive Review. Energies 2015, 8, 573–609. [Google Scholar] [CrossRef] [Green Version]
- Kolk, A. The role of consumers in EU energy policy. Carbon Manag. 2012, 3, 175–183. [Google Scholar] [CrossRef] [Green Version]
- Bresnahan, T.F.; Trajtenberg, M. General purpose technologies ‘Engines of growth’? J. Econ. 1995, 65, 83–108. [Google Scholar] [CrossRef] [Green Version]
- Teece, D.J. Profiting from innovation in the digital economy: Enabling technologies, standards, and licensing models in the wireless world. Res. Policy 2018, 47, 1367–1387. [Google Scholar] [CrossRef]
- Seufert, S.; Scheffler, N. Developing Digital Competences of Vocational Teachers. Int. J. Digit. Lit. Digit. Competence 2016, 7, 50–65. [Google Scholar] [CrossRef]
- Treglia, E.; Tomassoni, R. The Development of Digital Competences and Emotional Skills Through the Use of Audio-Visual Technologies. Int. J. Digit. Lit. Digit. Competence 2019, 10, 55–60. [Google Scholar] [CrossRef]
- Petrucco, C. Wikipedia as Training Resource for Developing Digital Competences. Int. J. Digit. Lit. Digit. Competence 2010, 1, 29–35. [Google Scholar] [CrossRef] [Green Version]
- Young, W.; Russell, S.V.; Robinson, C.A.; Barkemeyer, R. Can social media be a tool for reducing consumers’ food waste? A behaviour change experiment by a UK retailer. Resour. Conserv. Recycl. 2017, 117, 195–203. [Google Scholar] [CrossRef] [Green Version]
- Sujata, M.; Khor, K.-S.; Ramayah, T.; Teoh, A.P. The role of social media on recycling behaviour. Sustain. Prod. Consum. 2019, 20, 365–374. [Google Scholar] [CrossRef] [Green Version]
- Mukhamedova, D.; Rakhimova, I.; Nigmatullina, L.; Majidov, N.; Abdullayev, B. Psychological aspects of addiction to social media, computer and computer games. Int. J. Psych. Rehab. 2020, 24, 319–324. [Google Scholar]
- van Emmerik, M.L.; de Vries, S.C.; Bos, J.E. Internal and external fields of view affect cybersickness. Displays 2011, 32, 169–174. [Google Scholar] [CrossRef]
- OECD. An Introduction to Online Platforms and Their Role in the Digital Transformation. 2019. Available online: https://www.oecd.org/innovation/an-introduction-to-online-platforms-and-their-role-in-the-digital-transformation-53e5f593-en.htm (accessed on 22 July 2020).
- Miller, P.; Wilsdon, J. Digital Futures—An Agenda for a Sustainable Digital Economy. Corp. Environ. Strateg. 2001, 8, 275–280. [Google Scholar] [CrossRef]
- Arthur, W.B. The second economy. McKinsey Q. 2011, 4, 1–9. [Google Scholar]
- Miller, B.; Nixon, T.; Tai, C.; Wood, M. Home networking with Universal Plug and Play. IEEE Commun. Mag. 2001, 39, 104–109. [Google Scholar] [CrossRef]
- Digital Living Network Alliance (DLNA). Networked Device Interoperability Guidelines. 2006. Available online: http://docshare04.docshare.tips/files/11856/118566774.pdf (accessed on 22 November 2019).
- Naus, J.; Spaargaren, G.; Van Vliet, B.J.; Van Der Horst, H.M. Smart grids, information flows and emerging domestic energy practices. Energy Policy 2014, 68, 436–446. [Google Scholar] [CrossRef]
- European Commission. Smart Consumer—Smart Customer—Smart Citizen. FP7-ENERGY—Specific Programme “Coopera-tion”: Energy. 2015. Available online: https://cordis.europa.eu/project/id/308765/pl (accessed on 11 November 2019).
- European Commission. Balancing Energy Production and Consumption in Energy Efficient Smart Neighbourhoods FP7-ICT—Specific Programme “Cooperation”: Information and Communication Technologies. 2017. Available online: https://cordis.europa.eu/project/id/609132 (accessed on 11 November 2019).
- Acuner, E.; Kayalica, M. Özgür A review on household energy consumption behavior: How about migrated consumers? Environ. Econ. 2018, 9, 8–21. [Google Scholar] [CrossRef] [Green Version]
- Kastner, W.; Neugschwandtner, G.; Soucek, S.; Newman, H.M. Communication systems for building automation and control. Proc. IEEE 2005, 93, 1178–1203. [Google Scholar] [CrossRef]
- Li, J.; Just, R.E. Modeling household energy consumption and adoption of energy efficient technology. Energy Econ. 2018, 72, 404–415. [Google Scholar] [CrossRef]
- European Commission. Telework in the EU before and after the COVID-19: Where We Were, Where We Head to. 2020. Available online: https://ec.europa.eu/jrc/sites/jrcsh/files/jrc120945_policy_brief_-_covid_and_telework_final.pdf (accessed on 10 November 2019).
- Novichenko, N. Digital competences in the system of key human competences for lifelong learning: Development trends in Europe and Ukraine. Public Adm. Asp. 2020, 8, 54–59. [Google Scholar] [CrossRef]
- Eurofound. Living, Working and COVID-19, COVID-19 Series. 2020. Available online: https://www.eurofound.europa.eu/publications/report/2020/living-working-and-covid-19 (accessed on 10 November 2019).
- Hook, L.; Raval, A. Coronavirus Leads to ‘Staggering’ Drop in Global Energy Demand. Financial Times, 29 April 2020. Available online: https://www.ft.com/content/ee88c064-2fac-4a08-aad5-59188210167b(accessed on 10 November 2020).
- International Energy Agency (IEA). Global Energy Demand to Plunge This Year as a Result of the Biggest Shock since the Second World War. 2020. Available online: https://www.iea.org/news/global-energy-demand-to-plunge-this-year-as-a-result-of-the-biggest-shock-since-the-second-world-war (accessed on 19 September 2019).
- European Parliament. Energy Poverty in Europe and Support for Families Following the COVID-19 Pandemic. 2020. Available online: https://www.europarl.europa.eu/doceo/document/E-9-2020-004352_EN.html (accessed on 10 November 2020).
- Meinrenken, C.J.; Modi, V.; Mckeown, K.R.; Culligan, P.J. New Data Suggest COVID-19 Is Shifting the Burden of Energy Costs to Households. 2020. Available online: https://blogs.ei.columbia.edu/2020/04/21/covid-19-energy-costs-households/ (accessed on 10 November 2020).
- Household Electricity Consumption during the COVID-19 Lockdown. 2020. Available online: https://www.prayaspune.org/peg/blogs/household-electricity-consumption-in-india-during-the-covid-19-lockdown-insights-from-metering-data.html (accessed on 10 November 2020).
- Using Electricity Data to Understand COVID-19 Impacts. 2020. Available online: https://www.abs.gov.au/AUSSTATS/[email protected]/mf/4661.0 (accessed on 10 November 2020).
- European Commission. Market Reports for 2nd Quarter Highlight Impact of Covid Lockdown on Electricity and Gas Markets. 2020. Available online: https://ec.europa.eu/info/news/market-reports-2nd-quarter-highlight-impact-covid-lockdown-electricity-and-gas-markets-2020-oct-12_en (accessed on 22 November 2020).
- Chhetri, R. Effects of COVID-19 Pandemic on Household Energy Consumption at College of Science and Technology. Int. J. Sci. Res. Eng. Dev. 2020, 3, 1383–1387. [Google Scholar]
- Consumers’ Experiences with Energy During the Covid-19 Pandemic—Summary of Research Findings. 2020. Available online: https://www.ofgem.gov.uk/publications-and-updates/consumers-experiences-energy-during-covid-19-pandemic-summary-research-findings (accessed on 22 November 2020).
- Birol, F. The Coronavirus Crisis Reminds Us That Electricity Is more Indispensable than Ever. IEA. 2020. Available online: https://www.iea.org/commentaries/the-coronavirus-crisis-reminds-us-that-electricity-is-more-indispensable-than-ever (accessed on 10 November 2020).
- 54 Zoom Statistics. Available online: https://usefyi.com/zoom-statistics/ (accessed on 10 May 2020).
- Pięta, P. Development of social capital by strengthening of digital competences among groups exposed to social exclusion. Ann. Mark. Manag. Econ. 2018, 4, 73–87. [Google Scholar] [CrossRef]
- Eurostat. Database. Available online: https://ec.europa.eu/eurostat/data/database (accessed on 1 September 2020).
- Hellwig, Z. Zastosowanie metody taksonomicznej do typologicznego podziału krajów ze względu na poziom ich rozwoju oraz zasoby i strukturę wykwalifikowanych kadr. Przegląd Stat. 1968, 4, 307–326. [Google Scholar]
- Liao, T.W. Clustering of time series data—A survey. Pattern Recognit. 2005, 38, 1857–1874. [Google Scholar] [CrossRef]
- Fahad, M.; Shahid, A.; Manumachu, R.R.; Lastovetsky, A. A Novel Statistical Learning-Based Methodology for Measuring the Goodness of Energy Profiles of Applications Executing on Multicore Computing Platforms. Energies 2020, 13, 3944. [Google Scholar] [CrossRef]
- Sharma, N.; Bajpai, A.; Litoriya, R. Comparison the various clustering algorithms of weka tools. Int. J. Emerg. Technol. Adv. Eng. 2012, 2, 73–80. [Google Scholar]
- Milligan, G.W.; Cooper, M.C. Methodology Review: Clustering Methods. Appl. Psychol. Meas. 1987, 11, 329–354. [Google Scholar] [CrossRef] [Green Version]
- Huawei. Global Connectivity Index. Methodology. 2020. Available online: https://www.huawei.com/minisite/gci/en/methodology.html (accessed on 20 July 2020).
- Eurostat. Final Energy Consumption by Sector Thousand Tonnes of Oil Equivalent. Available online: https://ec.europa.eu/eurostat/databrowser/view/TEN00124/bookmark/table?lang=en&bookmarkId=2d41074e-914c-4d80-bdd1-109e9b56c1f6 (accessed on 10 November 2020).
- Eurostat. Population. 2020. Available online: https://ec.europa.eu/eurostat/databrowser/view/tps00001/default/table?lang=en (accessed on 10 November 2020).
- Cornillie, J.; Fankhauser, S. The energy intensity of transition countries. Energy Econ. 2004, 26, 283–295. [Google Scholar] [CrossRef]
- Markandya, A.; Pedroso-Galinato, S.; Streimikiene, D. Energy intensity in transition economies: Is there convergence towards the EU average? Energy Econ. 2006, 28, 121–145. [Google Scholar] [CrossRef]
- Eurostat. Share for Transmission and Distribution in the Network Cost for Gas and Electricity—Annual Data. 2020. Available online: https://appsso.eurostat.ec.europa.eu/nui/show.do?dataset=nrg_pc_206&lang=en (accessed on 10 November 2020).
- Eurostat. Electricity Prices for Household Consumers—Biannual Data (from 2007 Onwards). 2020. Available online: http://appsso.eurostat.ec.europa.eu/nui/show.do?dataset=nrg_pc_204 (accessed on 10 November 2020).
- Eurostat. Electricity Prices for Non-Household Consumers—Biannual Data (from 2007 Onwards). 2020. Available online: https://appsso.eurostat.ec.europa.eu/nui/show.do?dataset=nrg_pc_205&lang=en (accessed on 10 November 2020).
Figure 1.
Household energy behavior in the digital era main factors.

Figure 2.
Total changes in energy consumption in households in CEE countries in 2008–2018.

Figure 3.
Changes in energy consumption in households per capita in the CEE countries in 2008–2018.

Figure 4.
Energy consumption in households per capita and GDP per capita in the CEE countries in 2007 and 2018.
Figure 4.
Energy consumption in households per capita and GDP per capita in the CEE countries in 2007 and 2018.

Figure 5.
Electricity prices and energy consumption per capita in households in CEE countries in 2020.
Figure 5.
Electricity prices and energy consumption per capita in households in CEE countries in 2020.

Figure 6.
Platformization of CEE countries and the level of energy consumption in total and in households in 2018 per capita (in thousand tons of oil equivalent).
Figure 6.
Platformization of CEE countries and the level of energy consumption in total and in households in 2018 per capita (in thousand tons of oil equivalent).

Figure 7.
The level of digitization of Lithuania and Estonia based on GCI by types of technology (Broadband, Cloud, IoT, and AI) and digitization pillars (SDEP–Supply, Demand, Experience, and Potential) in 2019 compared to the average of the surveyed countries.
Figure 7.
The level of digitization of Lithuania and Estonia based on GCI by types of technology (Broadband, Cloud, IoT, and AI) and digitization pillars (SDEP–Supply, Demand, Experience, and Potential) in 2019 compared to the average of the surveyed countries.


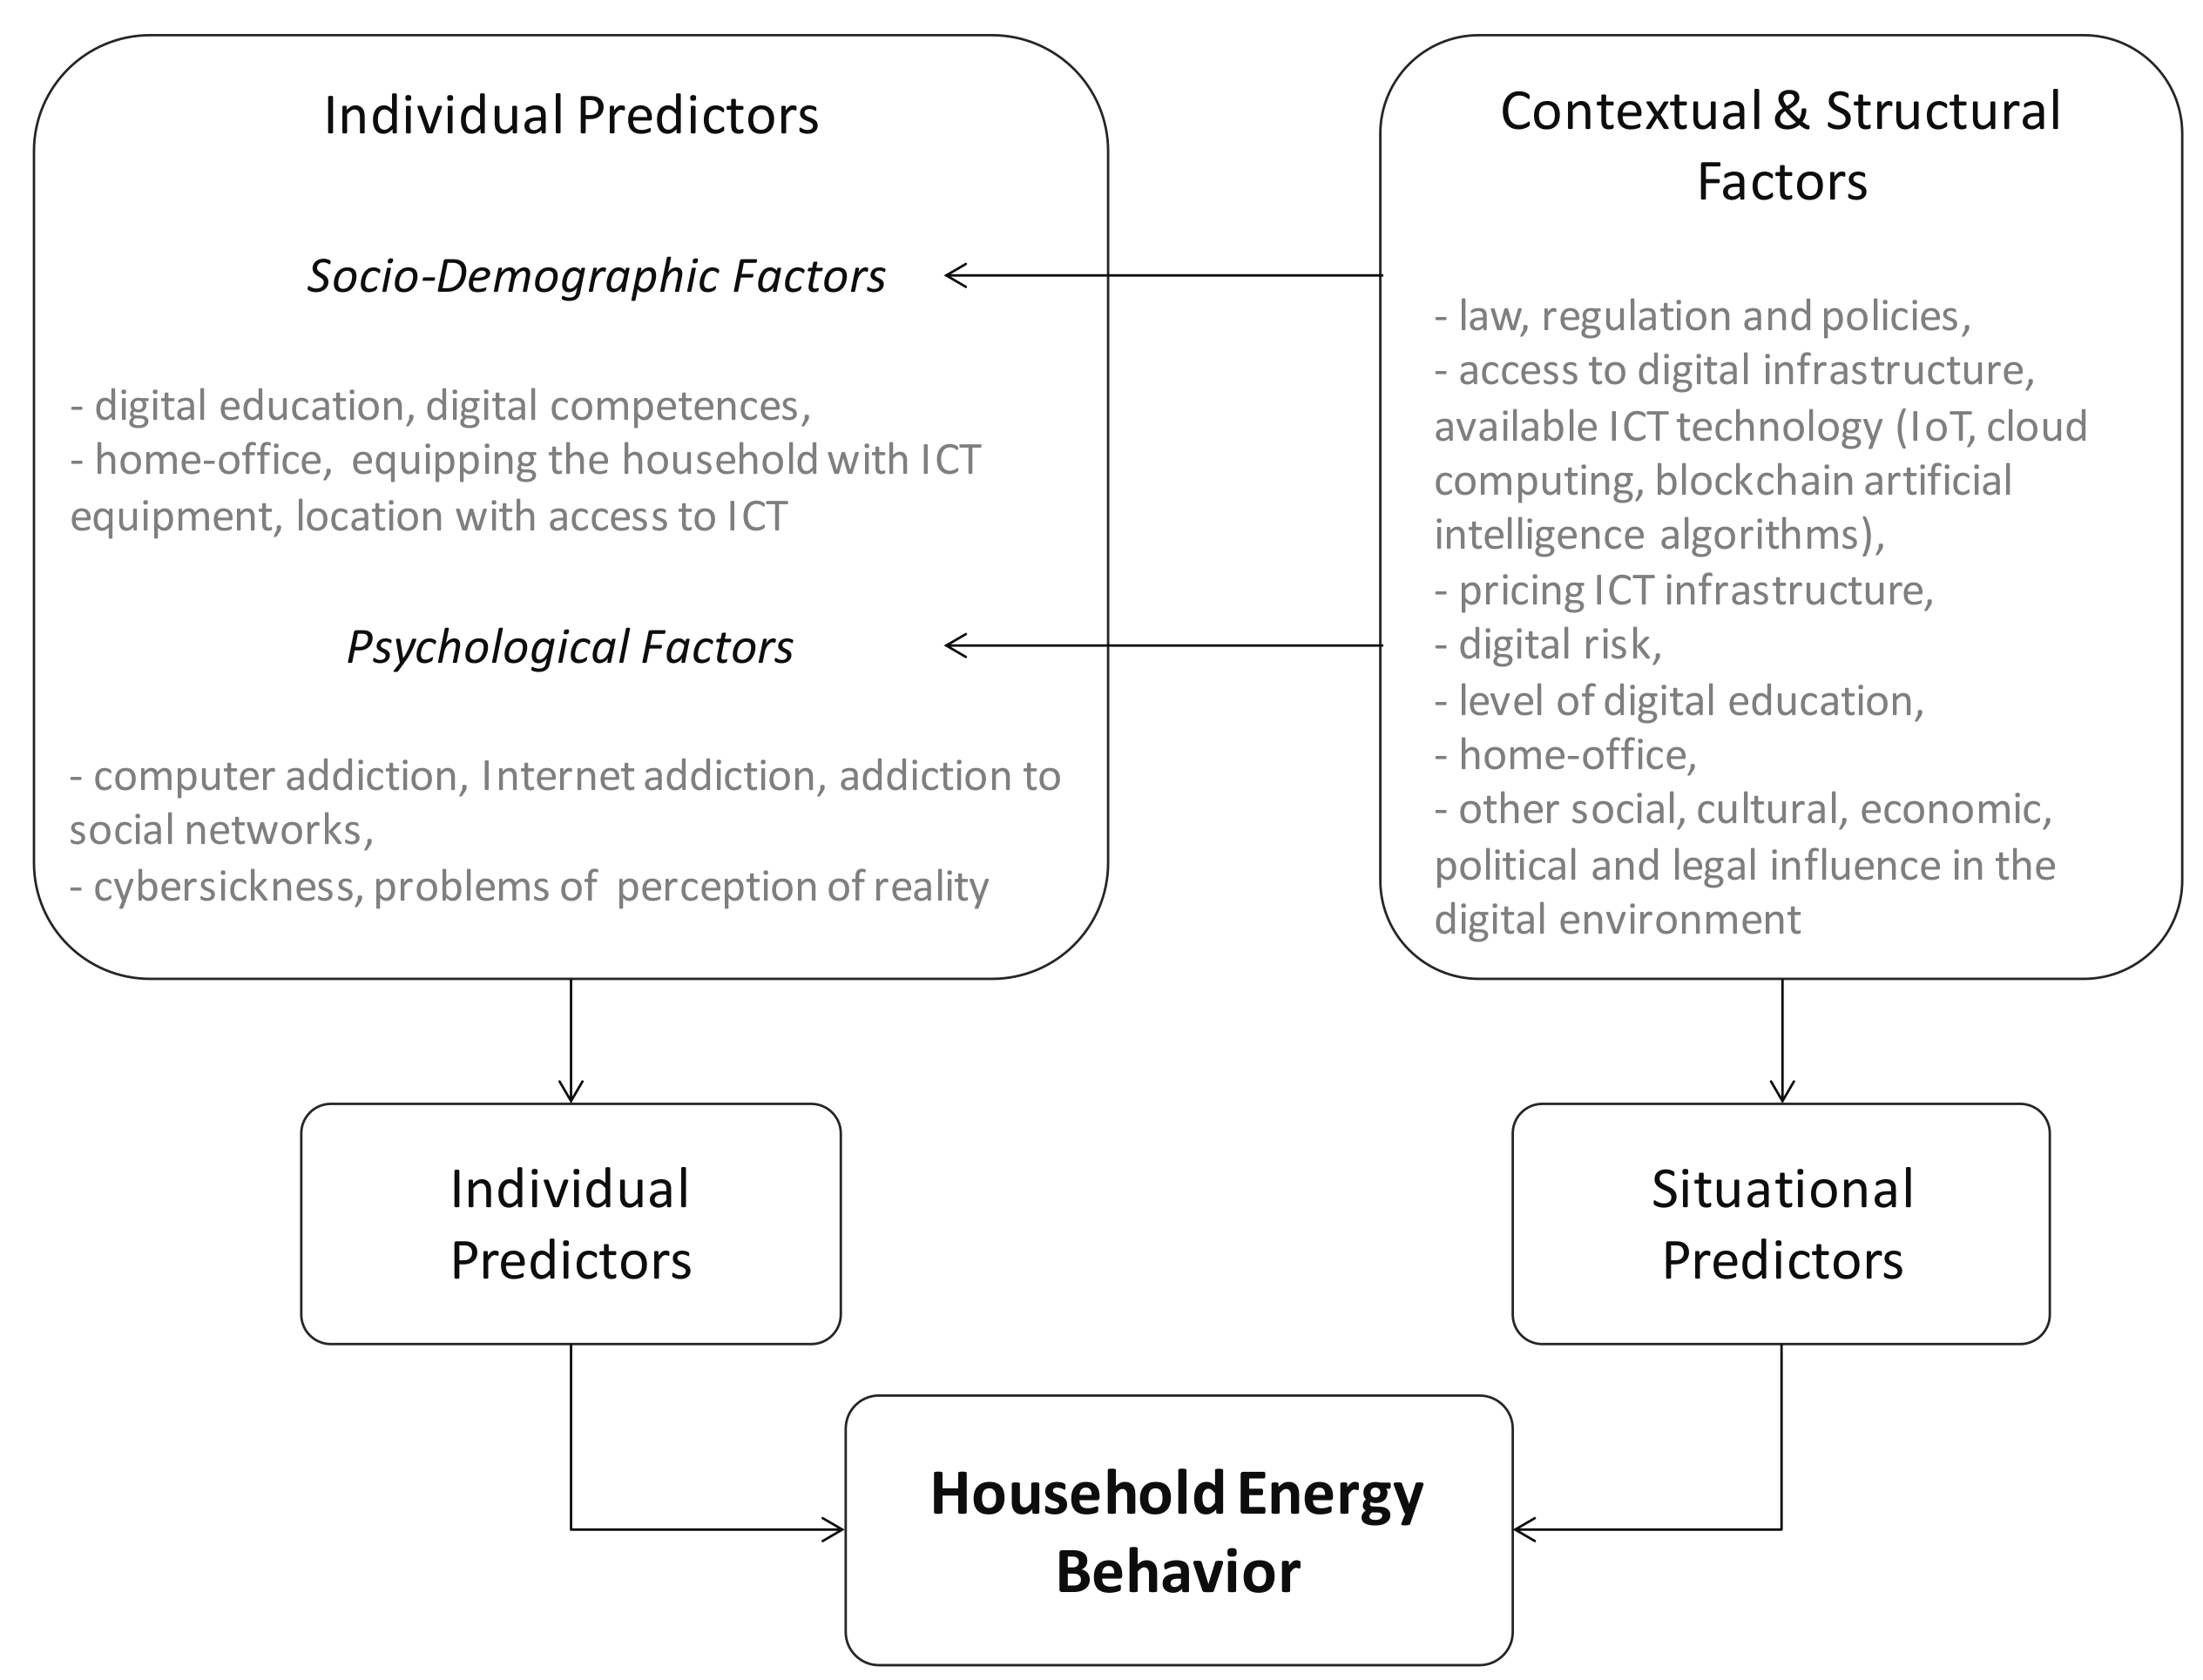
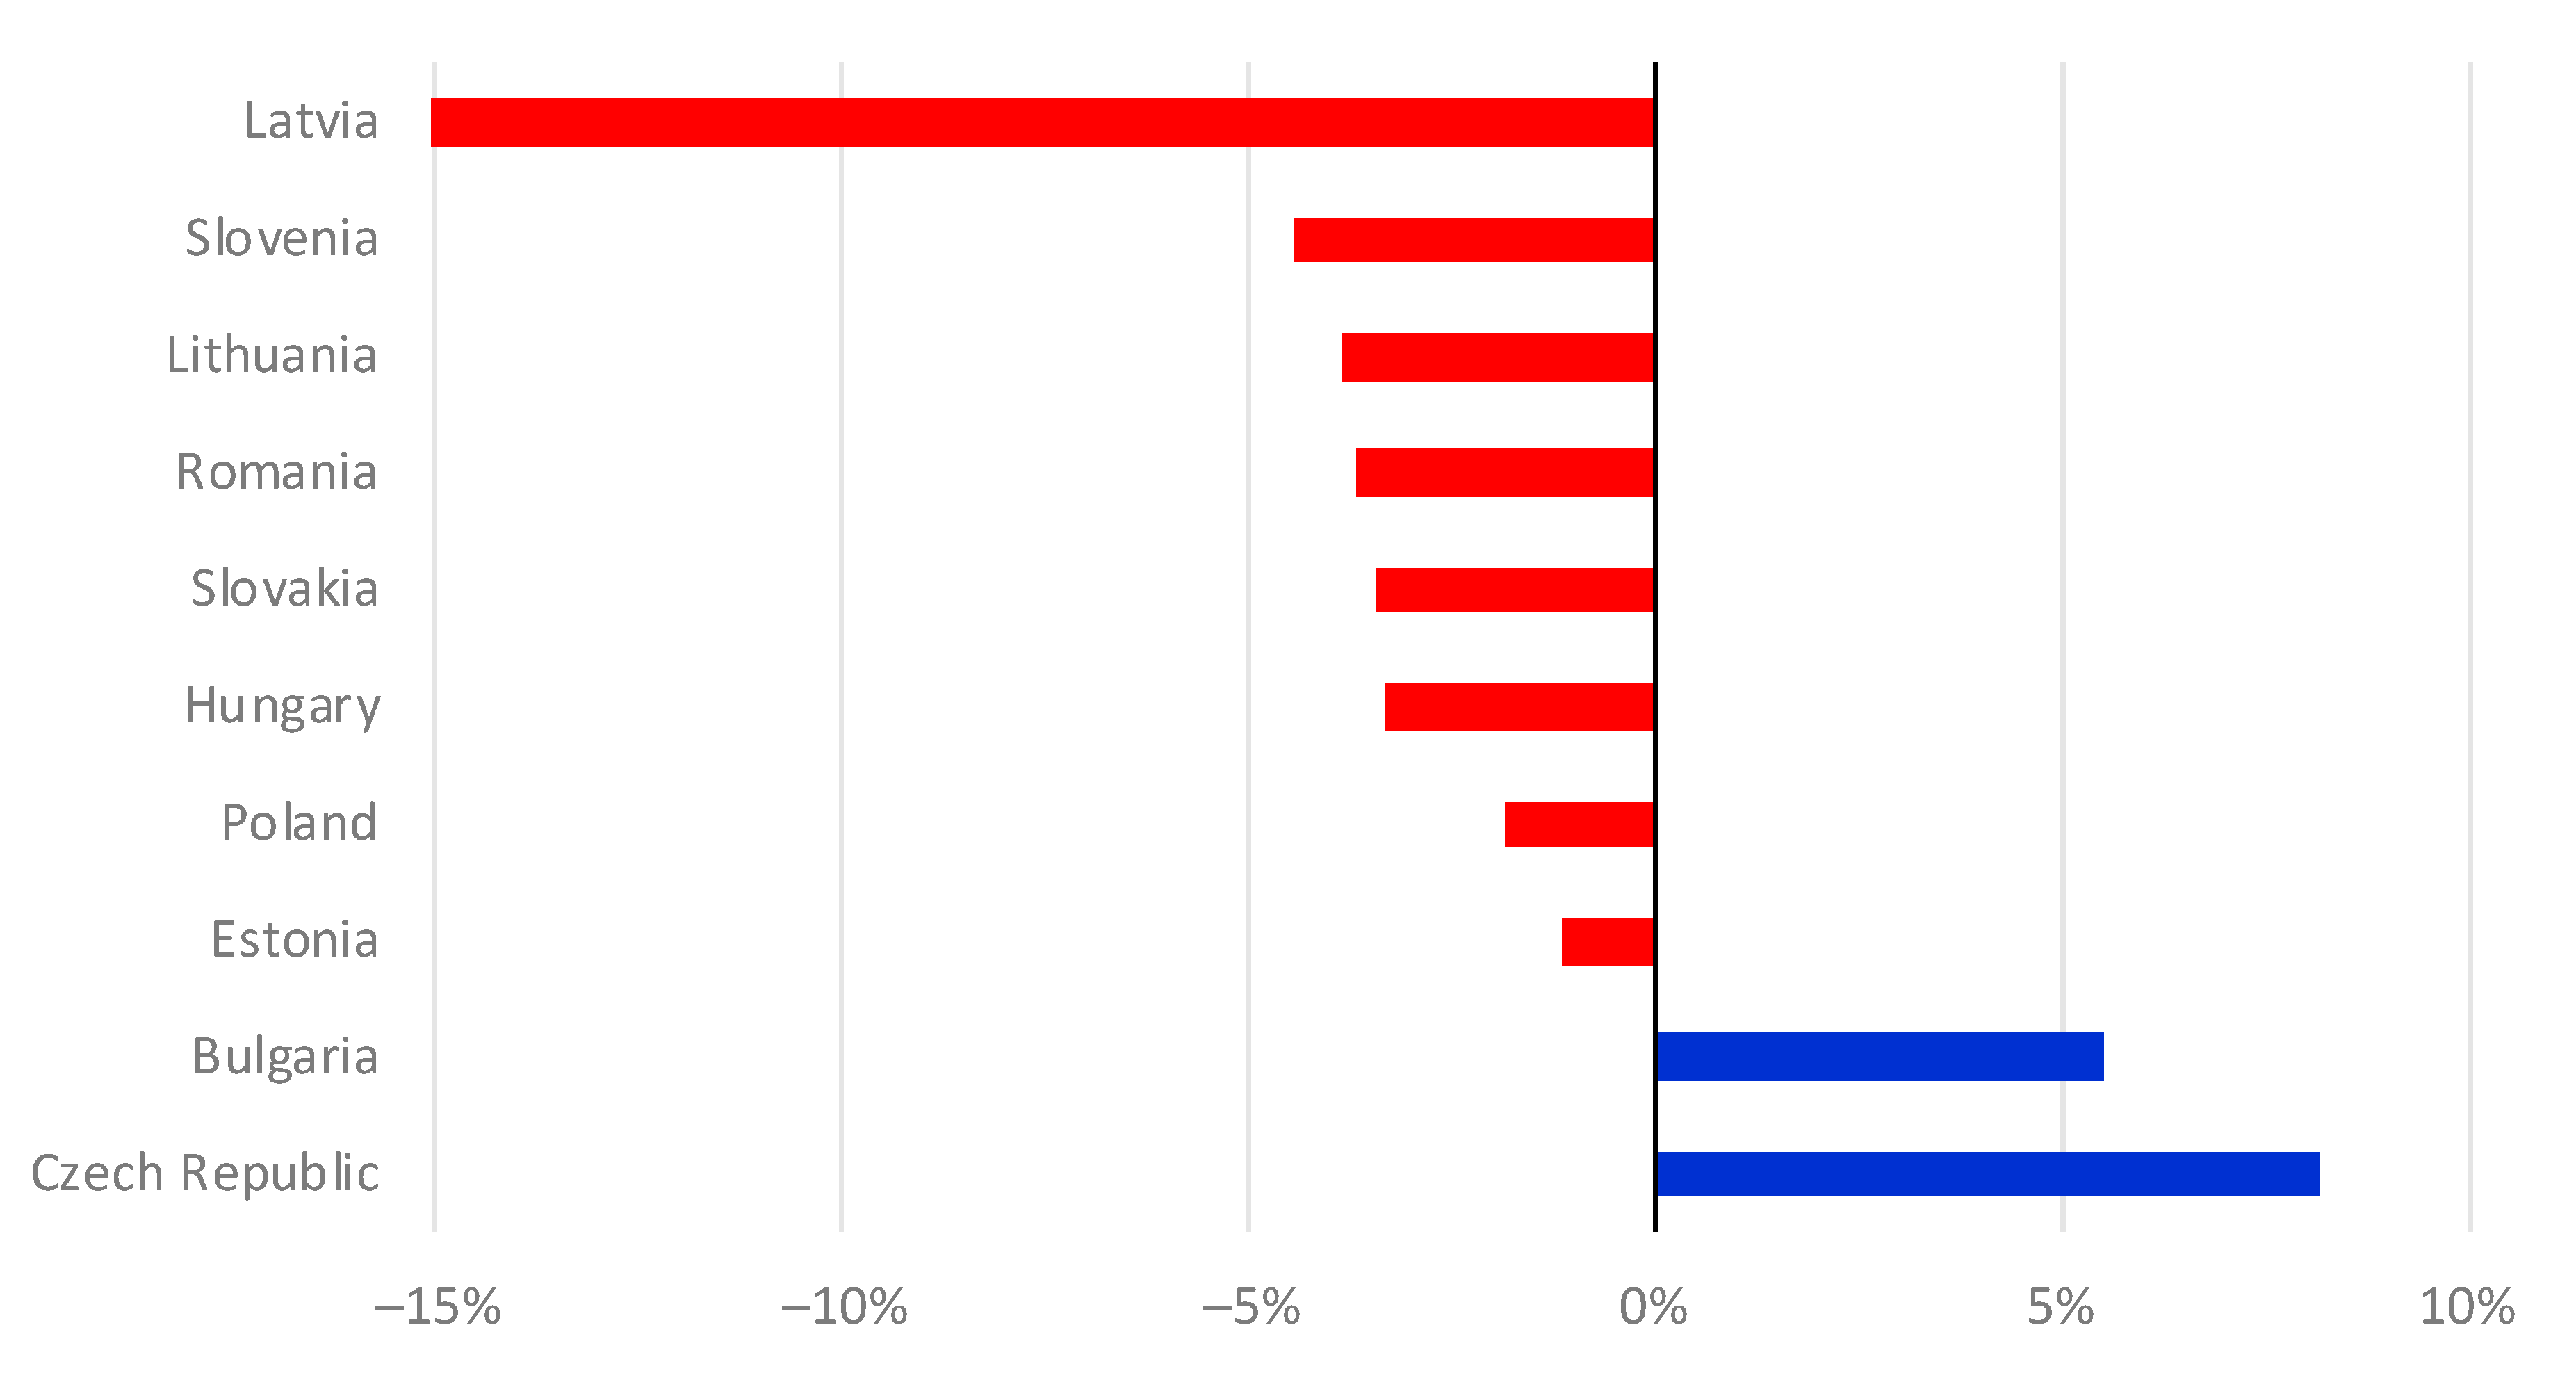
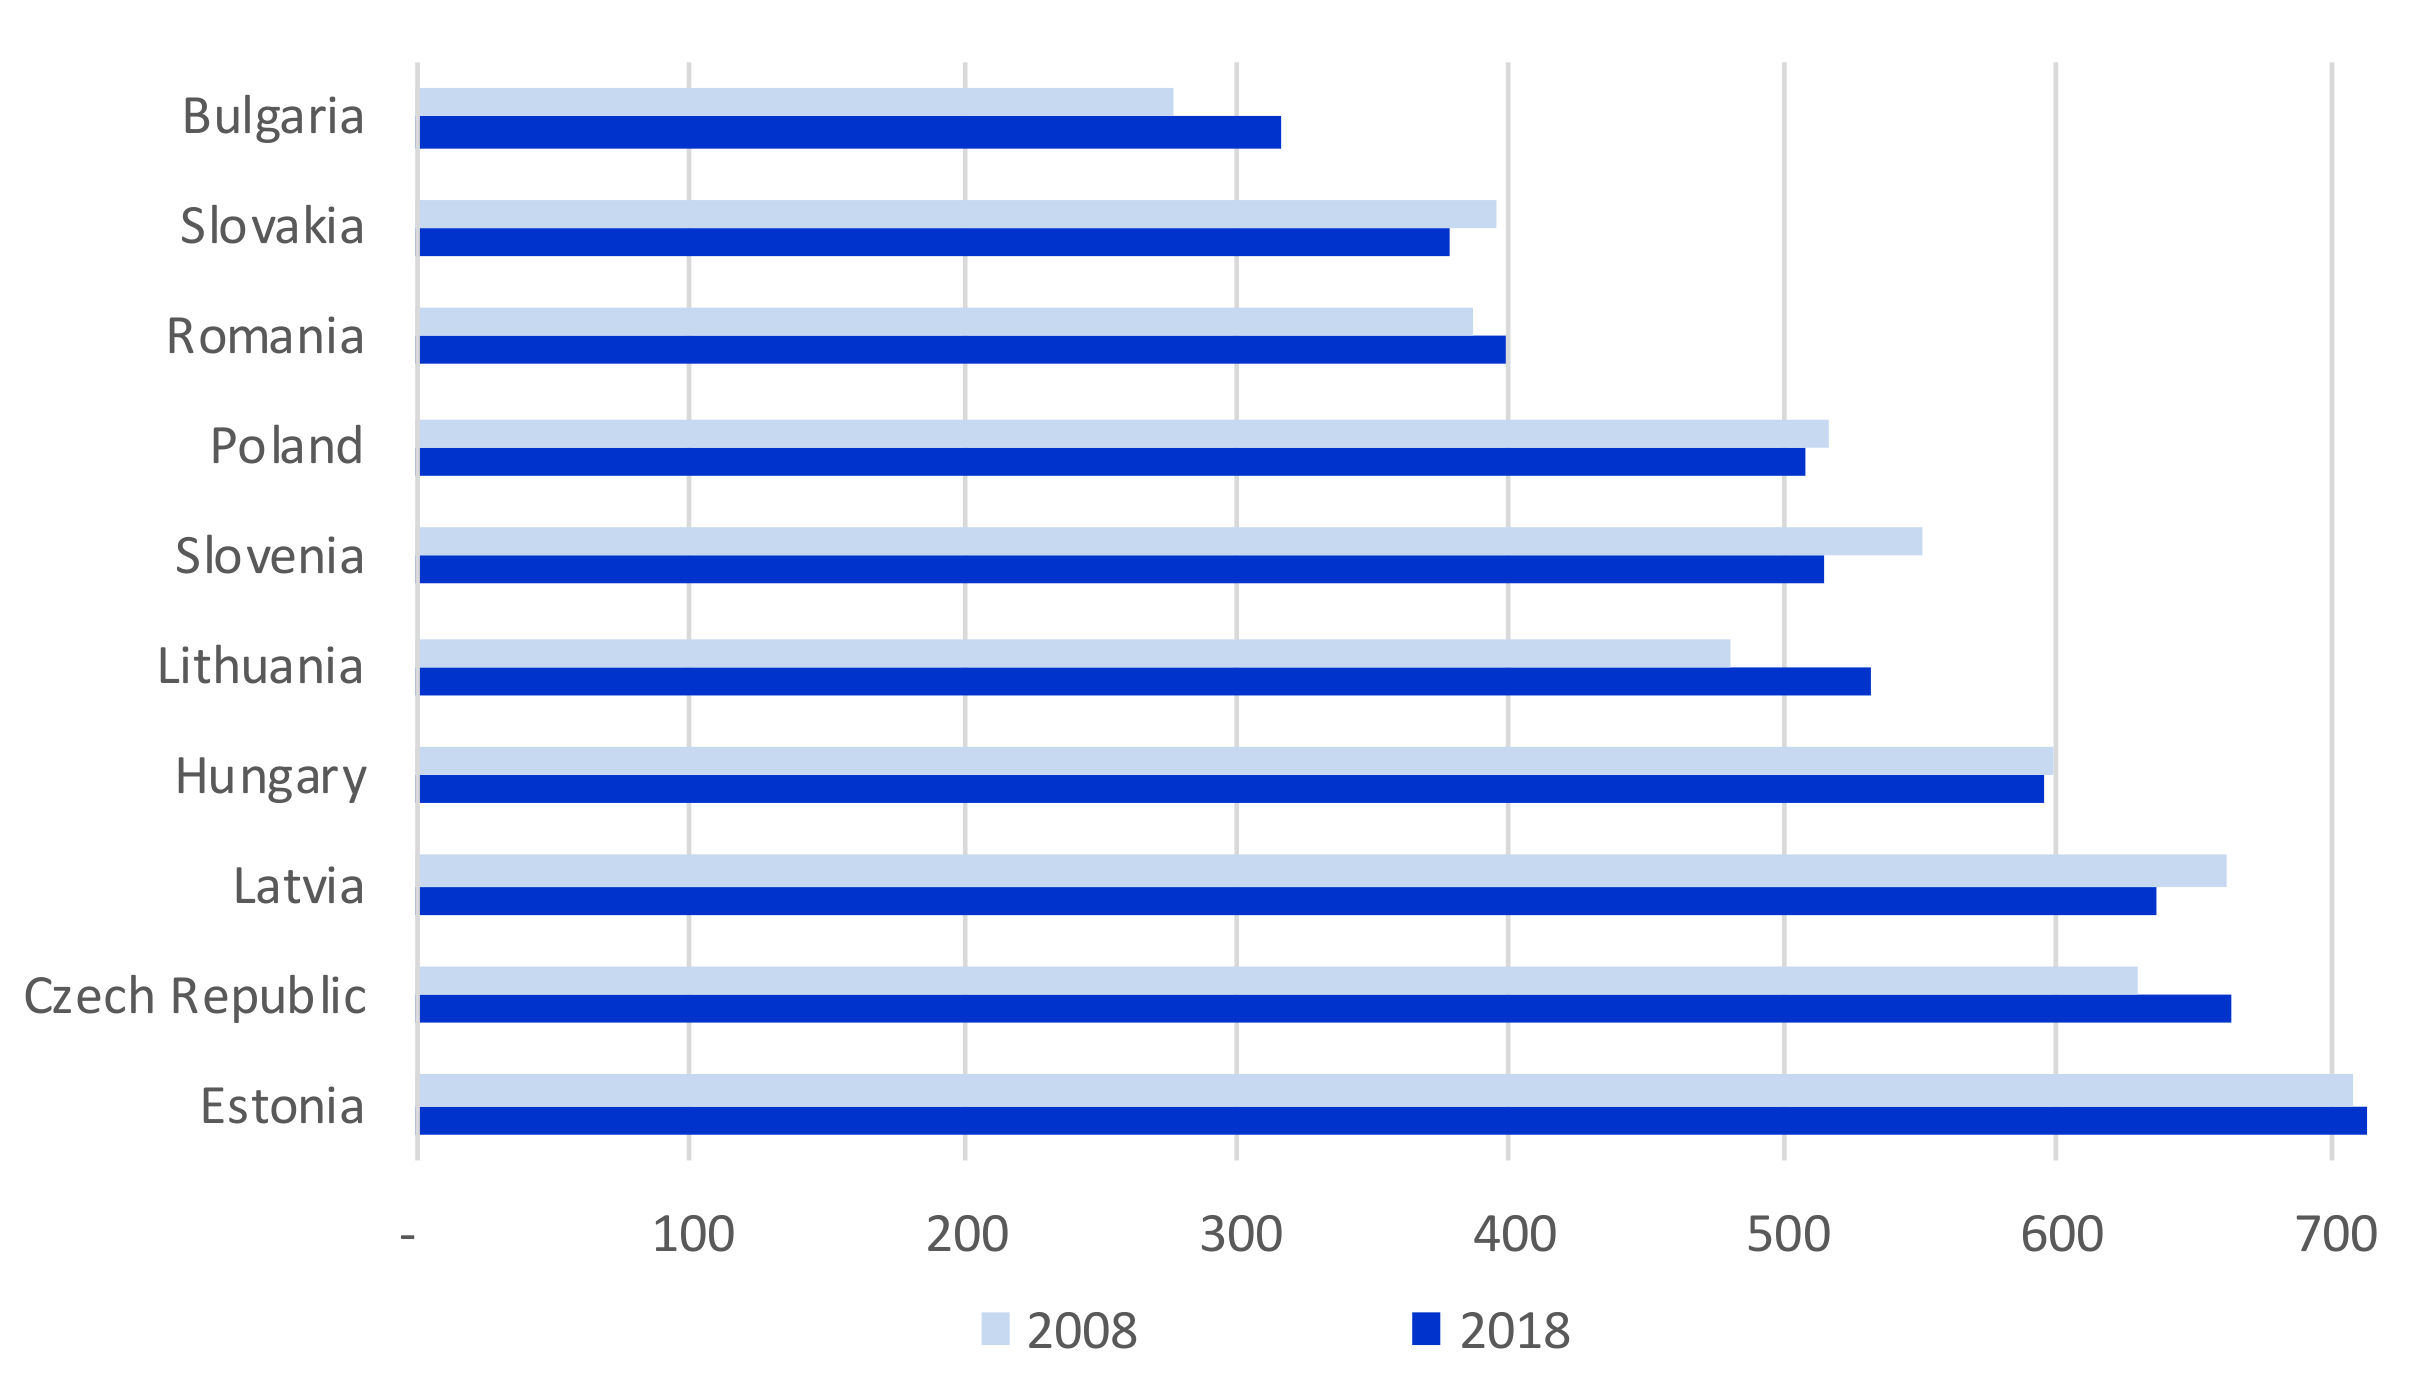
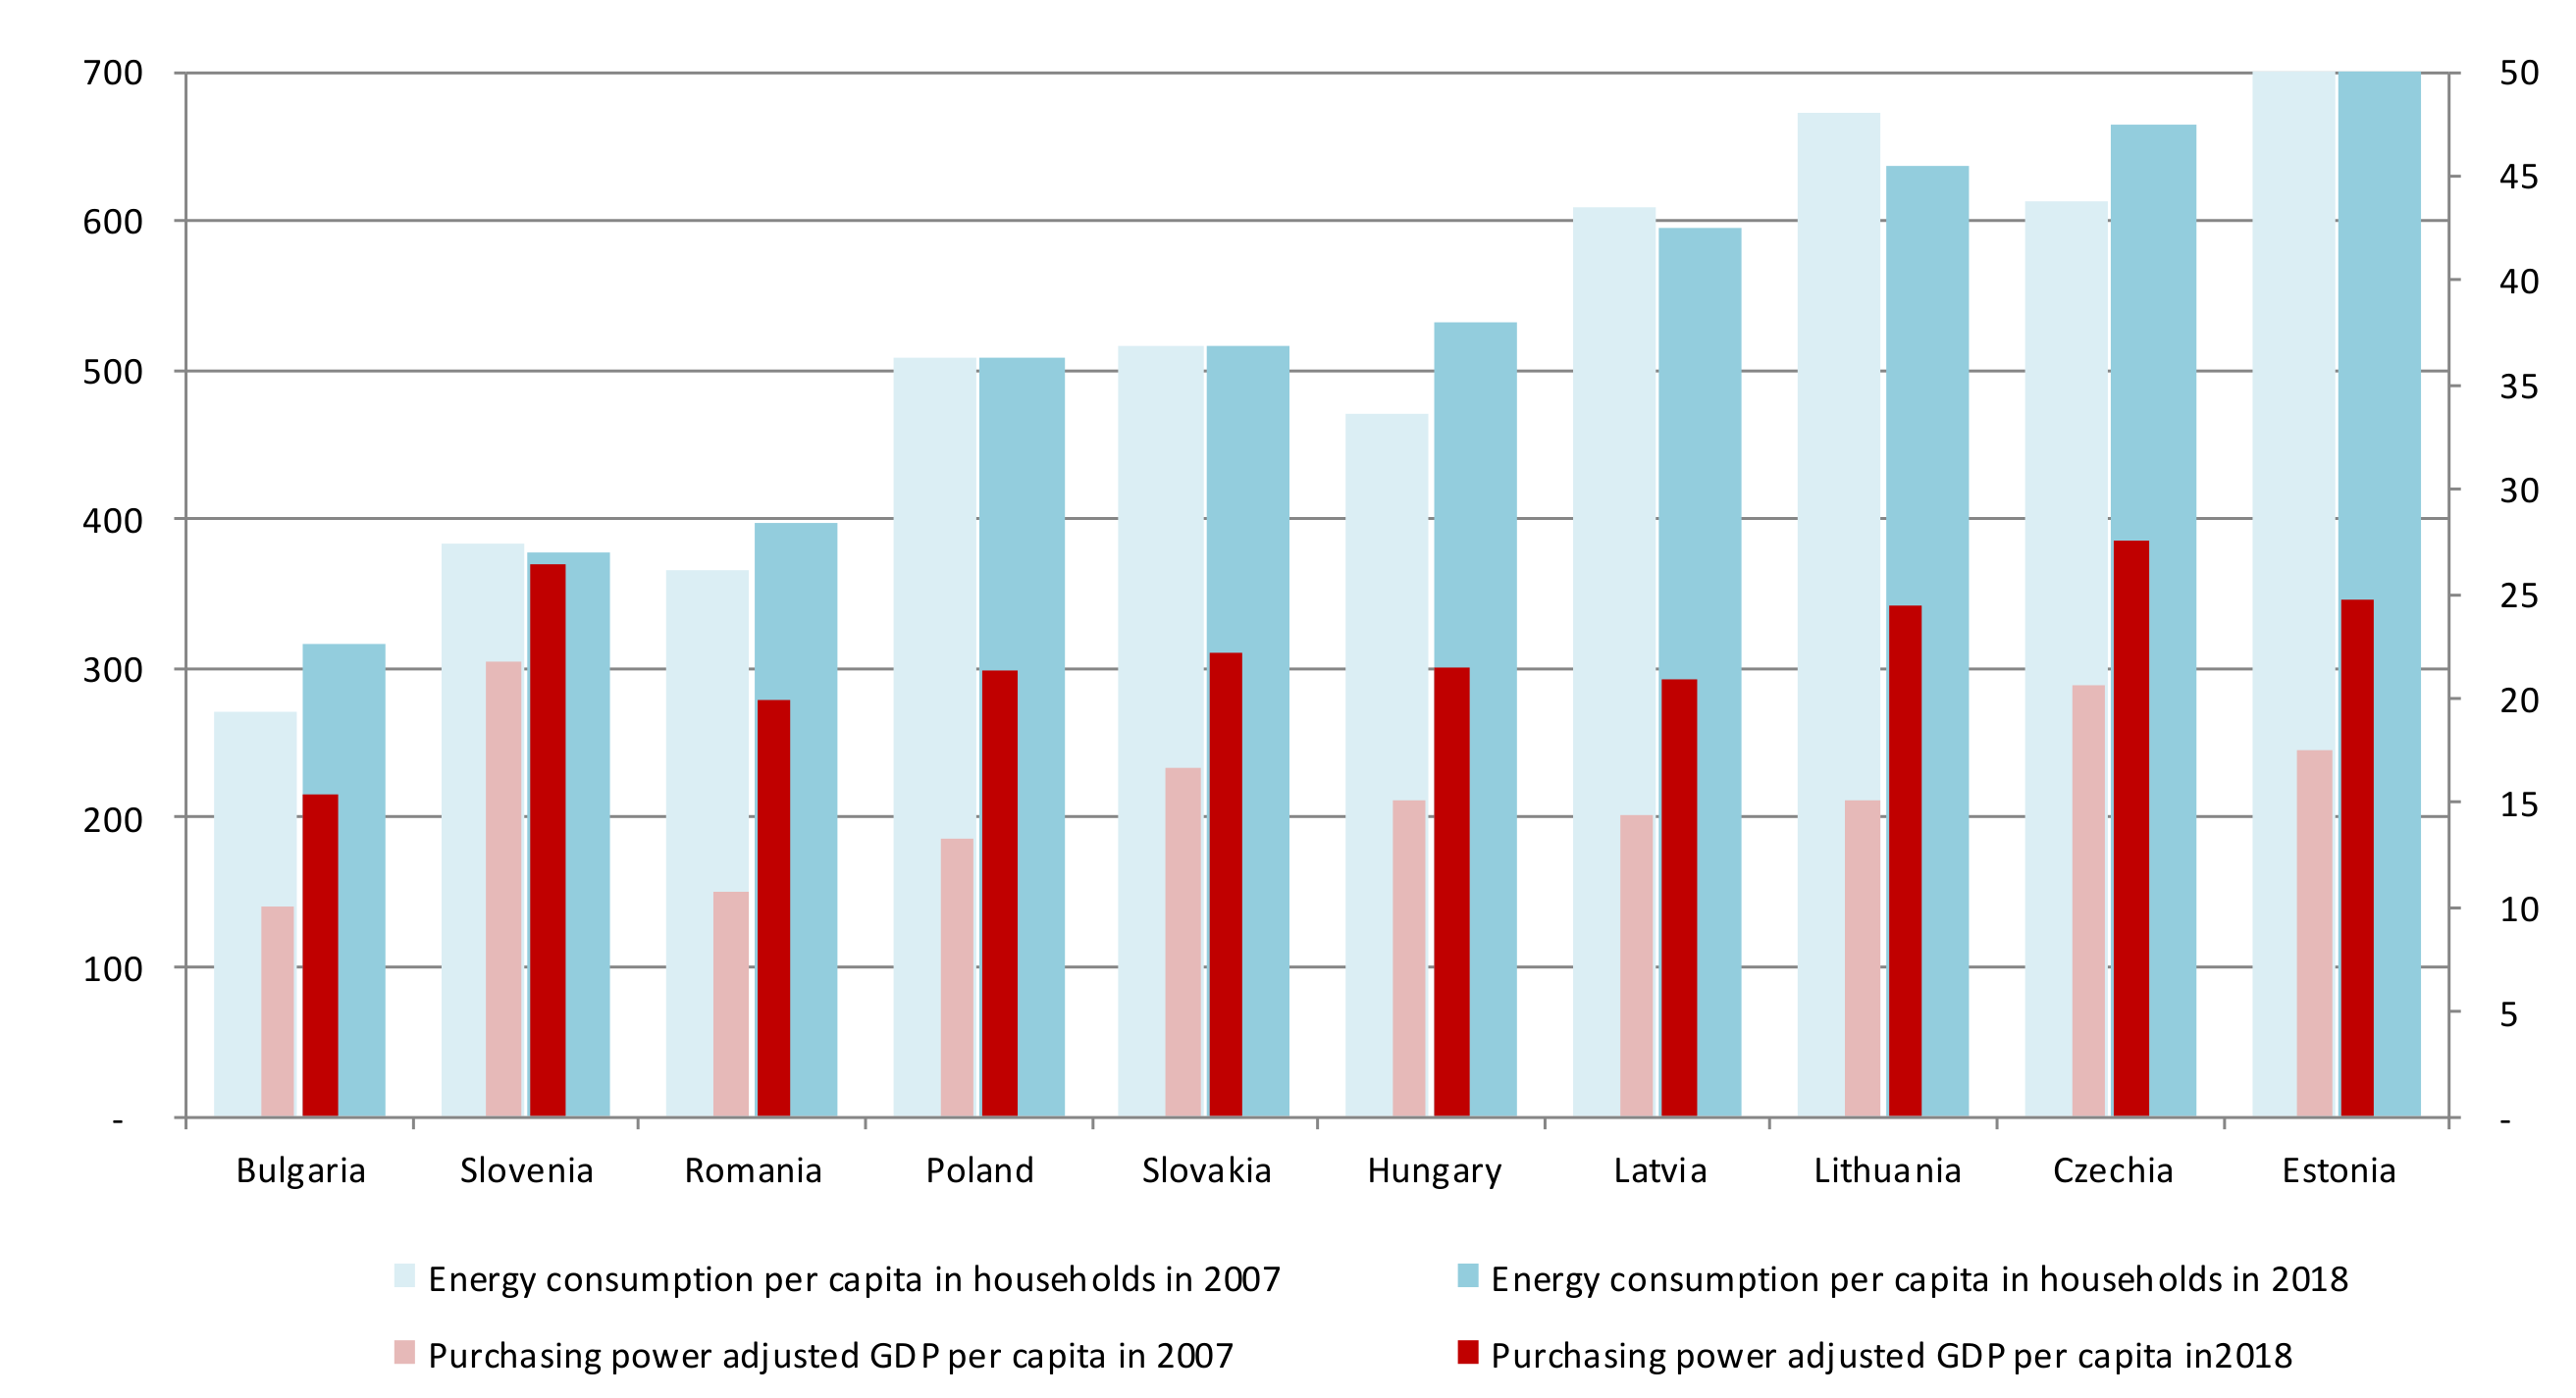
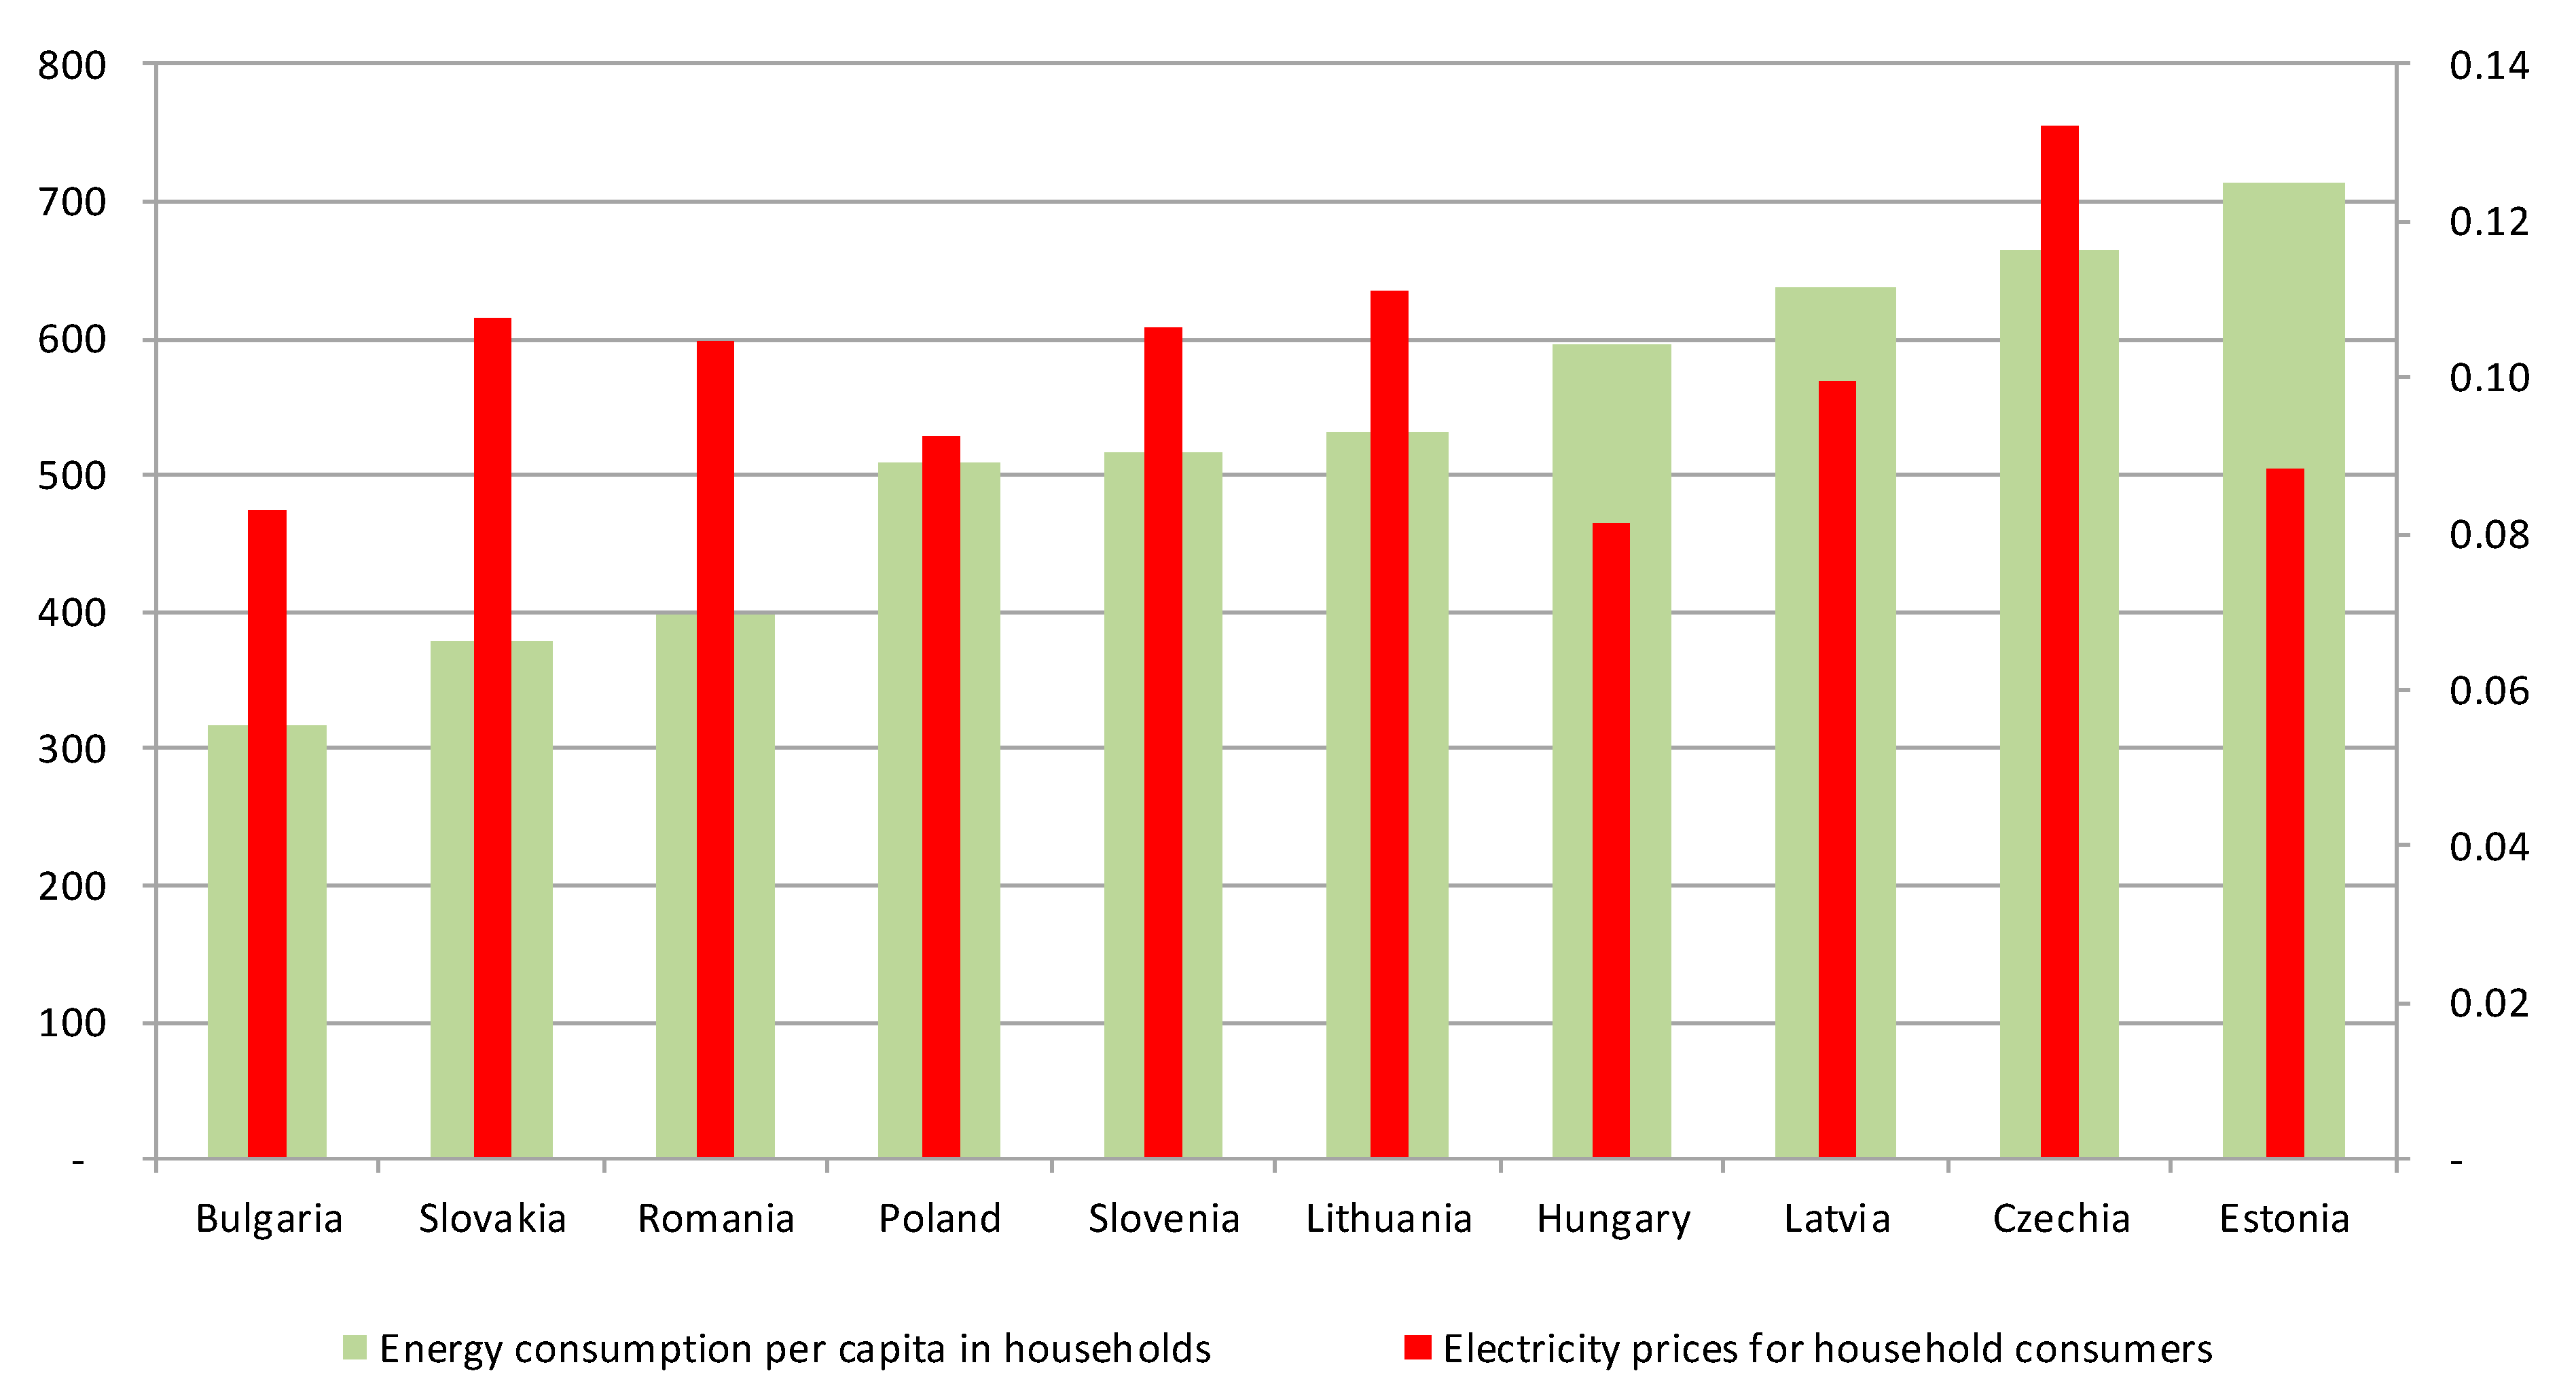
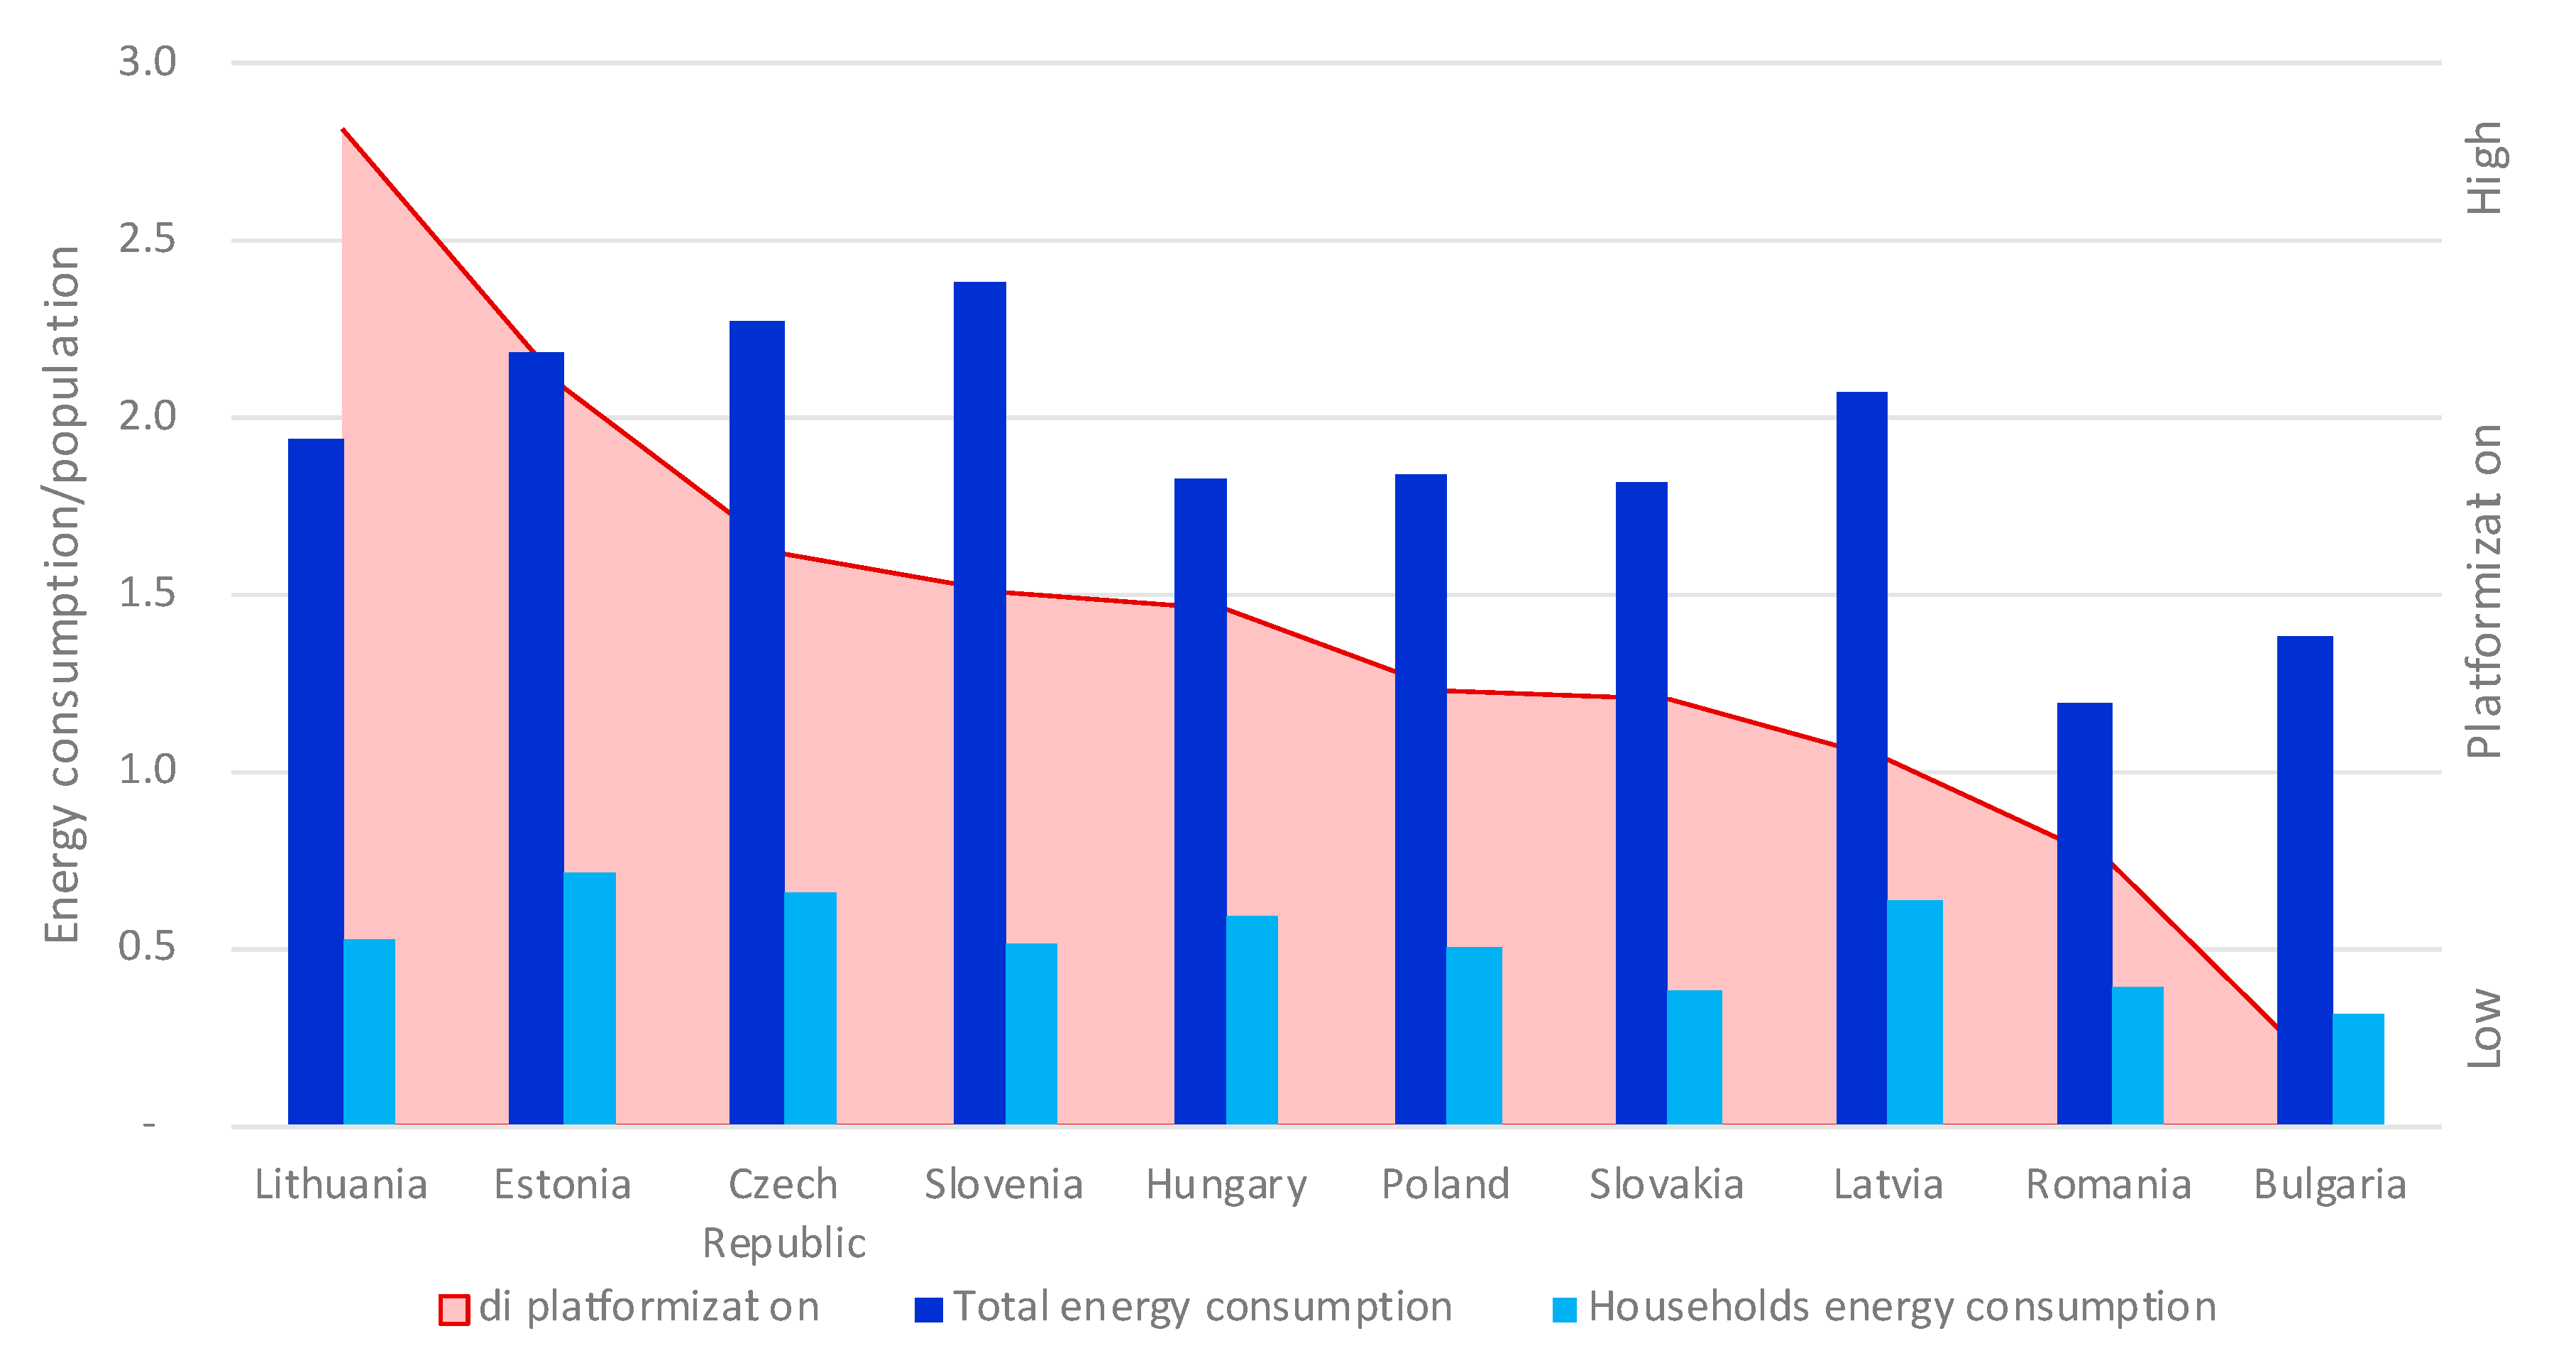
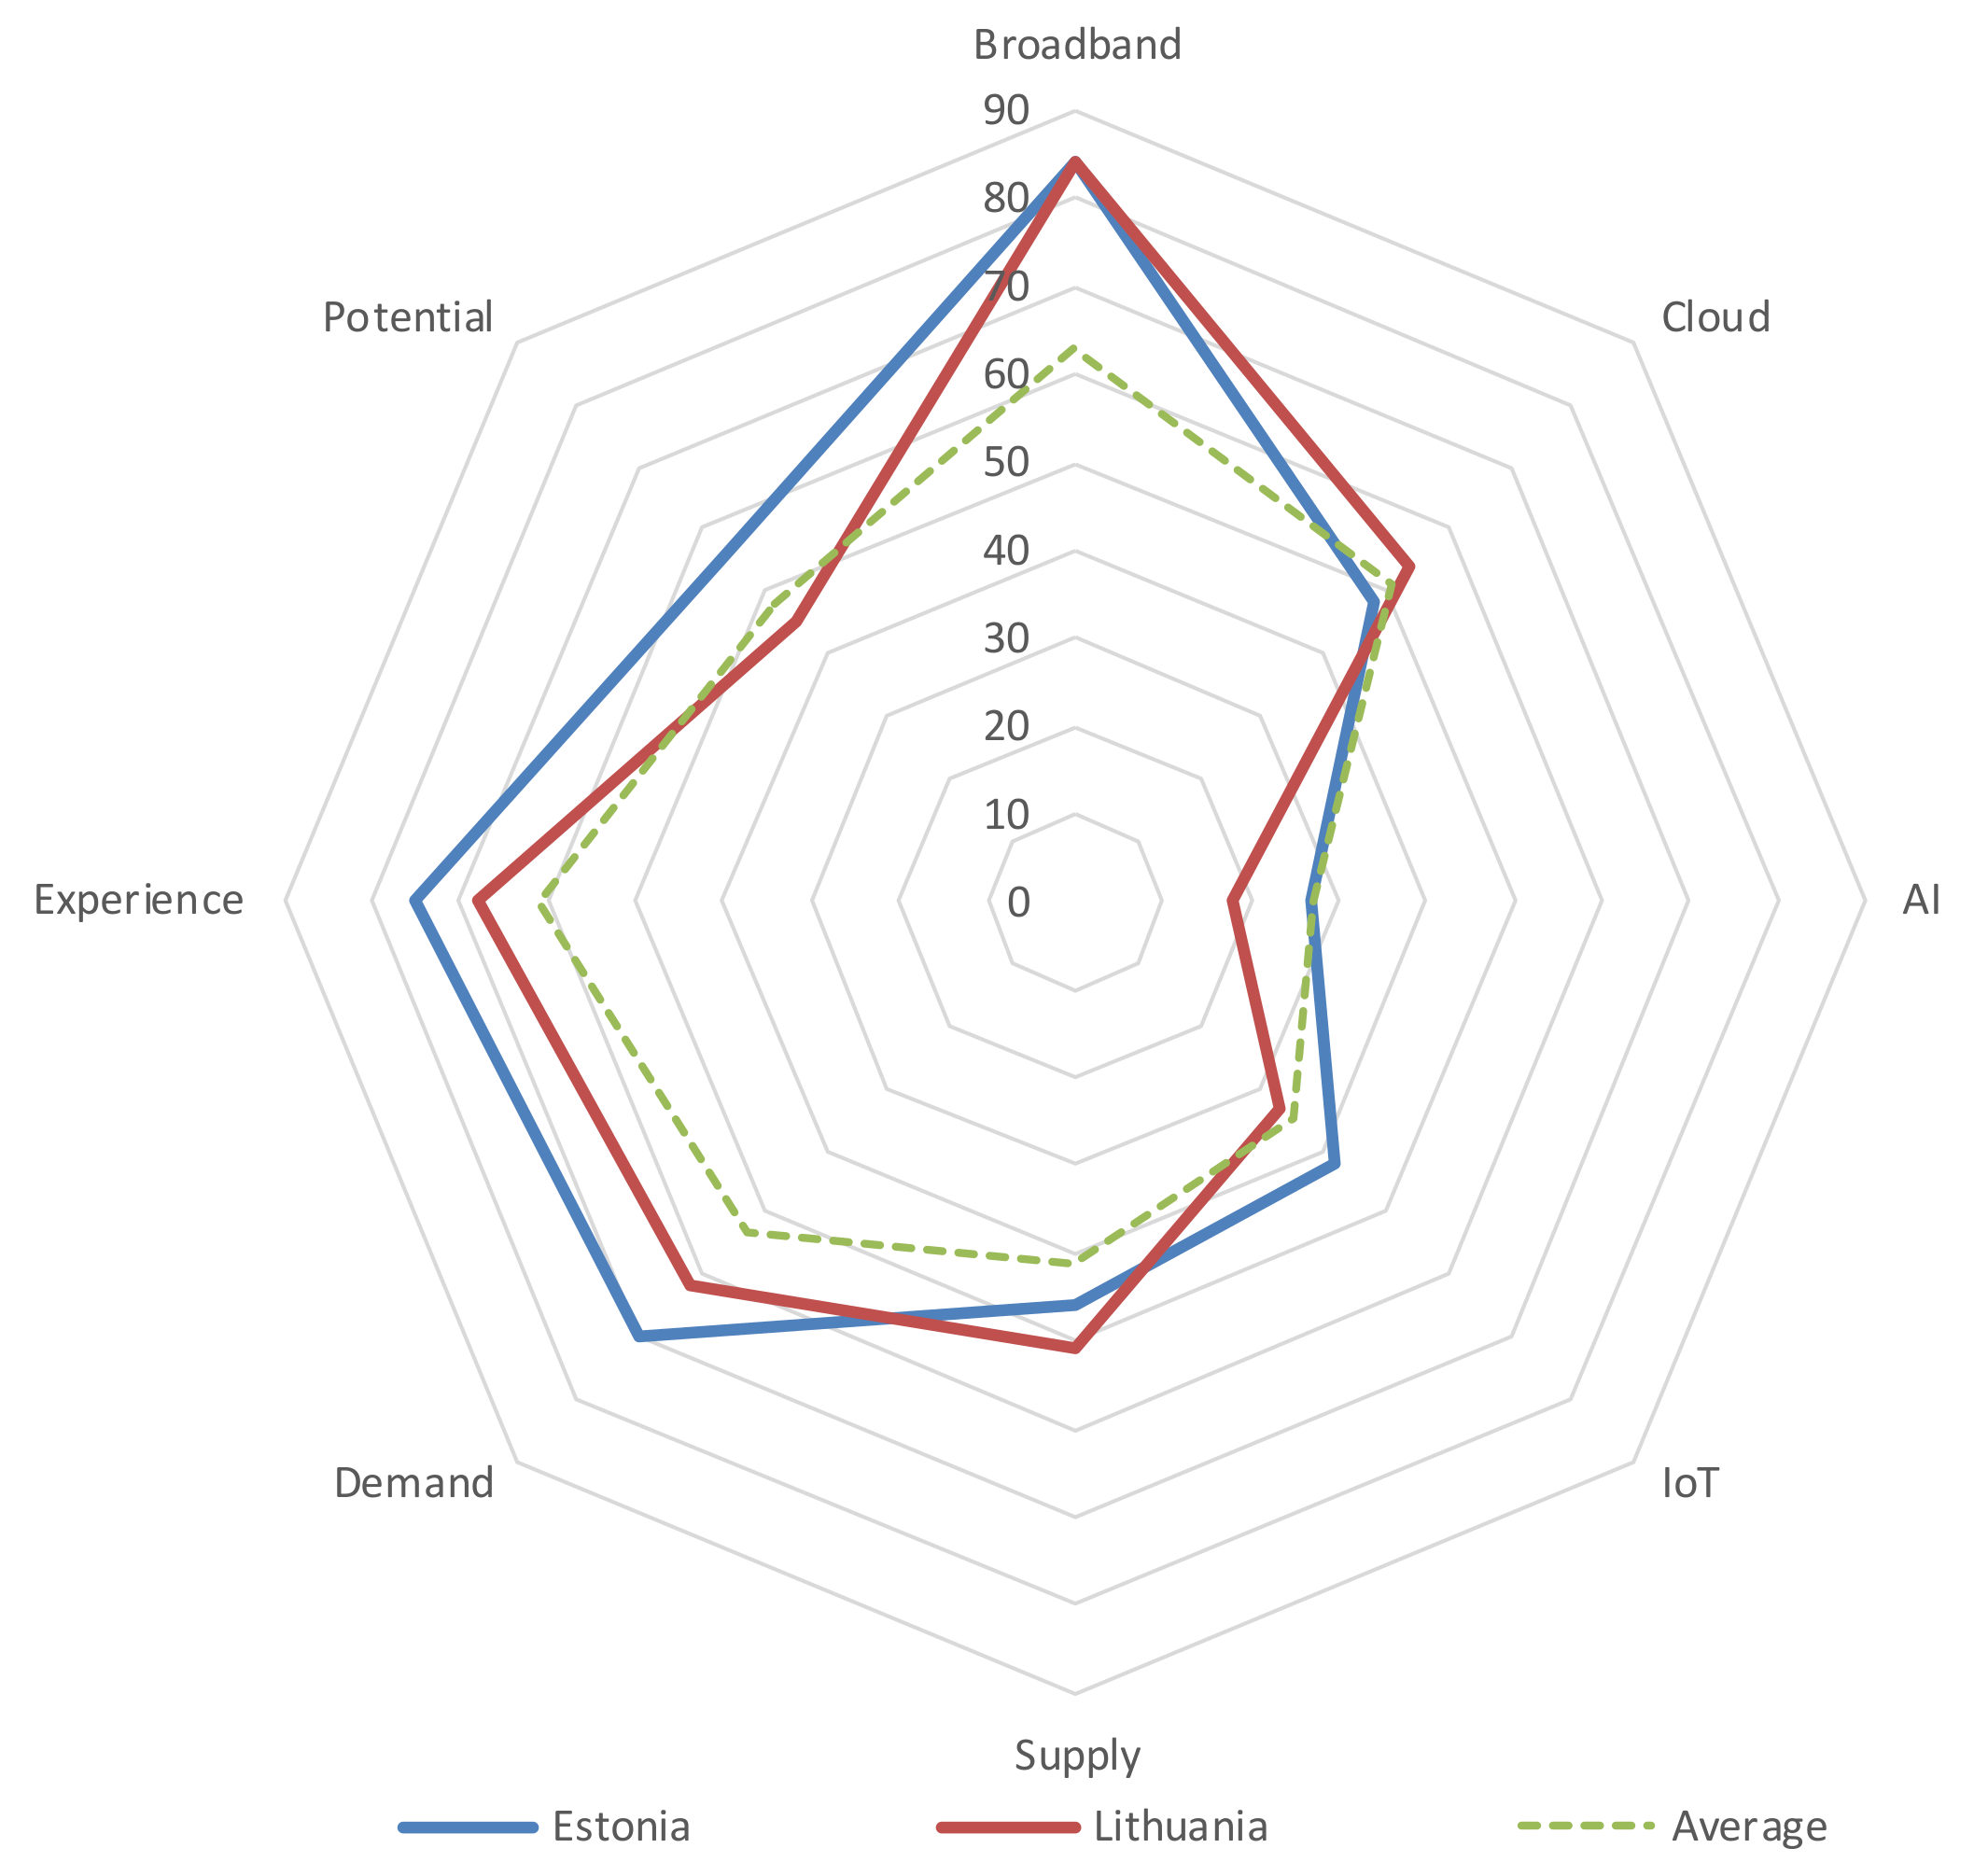
Table 1.
Diagnostic variables in platformization study of the CEE countries after verification * in 2018.
Table 1.
Diagnostic variables in platformization study of the CEE countries after verification * in 2018.
| Kraj | X1 | X2 | X3 | X6 | X8 | X9 | X11 | X12 | X14 | X15 | X17 | X18 | X20 | X23 | X24 | X26 | X28 | X29 | X30 | X31 | X32 | X33 | X34 | X35 | X36 | X37 | X38 | X39 | X40 | X41 | X42 | X43 | X44 | X45 |
|---|---|---|---|---|---|---|---|---|---|---|---|---|---|---|---|---|---|---|---|---|---|---|---|---|---|---|---|---|---|---|---|---|---|---|
| Bulgaria | 8 | 1 | 20 | 4 | 74 | 21 | 14 | 23 | 2 | 2 | 72 | 12 | 21 | 2 | 35 | 8 | 9 | 11 | 2 | 82 | 4 | 30 | 7 | 6 | 27 | 6 | 25 | 75 | 25 | 2 | 9 | 58 | 53 | 30 |
| Czechia | 24 | 2 | 20 | 32 | 88 | 26 | 21 | 38 | 5 | 3 | 77 | 17 | 15 | 2 | 56 | 23 | 29 | 20 | 5 | 78 | 16 | 27 | 23 | 3 | 46 | 3 | 54 | 87 | 31 | 6 | 5 | 45 | 59 | 56 |
| Estonia | 8 | 1 | 15 | 14 | 93 | 21 | 24 | 26 | 7 | 6 | 80 | 29 | 27 | 12 | 43 | 26 | 30 | 40 | 8 | 94 | 50 | 29 | 13 | 2 | 14 | 4 | 80 | 90 | 33 | 29 | 25 | 53 | 65 | 60 |
| Latvia | 7 | 1 | 20 | 7 | 92 | 26 | 39 | 32 | 3 | 3 | 69 | 11 | 17 | 4 | 51 | 19 | 27 | 20 | 4 | 91 | 30 | 30 | 19 | 3 | 27 | 3 | 70 | 85 | 16 | 8 | 8 | 57 | 65 | 48 |
| Lithuania | 14 | 2 | 15 | 13 | 81 | 33 | 25 | 48 | 6 | 8 | 76 | 19 | 25 | 6 | 43 | 18 | 19 | 16 | 4 | 91 | 20 | 40 | 6 | 3 | 27 | 9 | 55 | 82 | 28 | 14 | 14 | 61 | 61 | 61 |
| Hungary | 5 | 2 | 26 | 24 | 77 | 20 | 16 | 14 | 5 | 3 | 77 | 20 | 11 | 5 | 46 | 16 | 15 | 29 | 8 | 88 | 11 | 52 | 17 | 8 | 20 | 3 | 53 | 86 | 47 | 6 | 23 | 61 | 69 | 60 |
| Poland | 6 | 2 | 23 | 18 | 89 | 23 | 26 | 29 | 3 | 2 | 66 | 16 | 20 | 4 | 43 | 13 | 14 | 18 | 5 | 86 | 7 | 35 | 9 | 4 | 24 | 3 | 40 | 87 | 34 | 7 | 20 | 49 | 53 | 47 |
| Romania | 12 | 1 | 10 | 7 | 84 | 18 | 26 | 23 | - | 5 | 77 | 18 | 22 | 7 | 21 | 7 | 7 | 10 | 2 | 63 | 2 | 31 | 8 | 4 | 19 | 7 | 12 | 84 | 32 | 4 | 9 | 49 | 60 | 31 |
| Slovenia | 15 | 3 | 18 | 17 | 70 | 23 | 13 | 33 | 5 | 3 | 79 | 21 | 18 | 9 | 52 | 19 | 27 | 23 | 13 | 92 | 8 | 40 | 7 | 3 | 21 | 6 | 53 | 89 | 22 | 7 | 9 | 42 | 52 | 48 |
| Slovakia | 12 | 3 | 18 | 21 | 67 | 23 | 18 | 31 | 6 | 3 | 71 | 19 | 18 | 3 | 47 | 10 | 7 | 17 | 2 | 72 | 10 | 31 | 12 | 3 | 21 | 4 | 59 | 82 | 40 | 15 | 21 | 55 | 59 | 53 |
Publisher’s Note: MDPI stays neutral with regard to jurisdictional claims in published maps and institutional affiliations. |
© 2021 by the author. Licensee MDPI, Basel, Switzerland. This article is an open access article distributed under the terms and conditions of the Creative Commons Attribution (CC BY) license (http://creativecommons.org/licenses/by/4.0/).
Share and Cite
MDPI and ACS Style
Poniatowska-Jaksch, M. Energy Consumption in Central and Eastern Europe (CEE) Households in the Platform Economics. Energies 2021, 14, 1002. https://0-doi-org.brum.beds.ac.uk/10.3390/en14041002
AMA Style
Poniatowska-Jaksch M. Energy Consumption in Central and Eastern Europe (CEE) Households in the Platform Economics. Energies. 2021; 14(4):1002. https://0-doi-org.brum.beds.ac.uk/10.3390/en14041002
Chicago/Turabian StylePoniatowska-Jaksch, Małgorzata. 2021. "Energy Consumption in Central and Eastern Europe (CEE) Households in the Platform Economics" Energies 14, no. 4: 1002. https://0-doi-org.brum.beds.ac.uk/10.3390/en14041002
Note that from the first issue of 2016, this journal uses article numbers instead of page numbers. See further details here.