Article

Optimal Selection of Metering Points for Power Quality Measurements in Distribution System †

Department of Power Electronics and Energy Control Systems, AGH—University of Science and Technology, 30-059 Kraków, Poland
*
Author to whom correspondence should be addressed.
This paper is an extended version of the paper published in Proceedings of 12th International Conference and Exhibition on Electrical Power Quality and Utilization (EPQU 2020), Cracow, Poland, 14–15 September 2020.
Submission received: 29 December 2020 / Revised: 2 February 2021 / Accepted: 11 February 2021 / Published: 23 February 2021

Abstract

:
Quality of power supply in power distribution systems requires continuous measurement using power quality analyzers installed in the grid. The paper reviews the published methods for optimal location of metering points in distribution systems in the context of power quality metering and assessment. Three methods have been selected for detailed analysis and comparative tests. It has been found that utilization of the methods is possible, but their performance varies highly depending on the test grid’s topology. Since the methods rely on the state estimation approach, their performance is strictly related to observability analysis. It has been found that standard observability analysis used for typical state estimation problem yields ambiguous results when applied to power quality assessment. Inherited properties of the selected methods are also analyzed, which allows for the formulation of general recommendations about optimal selection of metering points in a distribution system.

1. Introduction

1.1. Motivation

The growing energy demand requires transforming power distribution systems into systems that integrate different power generation and consumption types. Both loads and generators connected to the grid have an impact on power quality (PQ). Therefore, maintaining the supply’s quality becomes one of the main tasks of a Distribution System Operator (DSO). Another complexity level is added by combining different energy forms (electricity, heat, gas) into one combined distribution system. It has been reported that integrated electricity and heat systems (IEHS) reduce costs and increase efficiency [1] and can also increase the penetration level of renewable energy resources (RES) [2]. Efficient cooperation requires the installation of meters in the right places.
Optimization techniques have been widely applied to power system analysis. Numerous papers have been published with studies on optimal metering. The detailed review of selected methods of optimal location of metering locations is provided in Section 1.2 below. In [3], an initial study of performance of the selected methods has been presented in the context of PQ metering.
Common and wide utilization of optimization tools adds another level of complexity to the challenge of optimal metering. For instance, it has been reported that photovoltaic generating units can be modeled and managed optimally [4,5,6]. Simultaneous usage of different optimization techniques in related fields in the power system may have an unknown impact on the final result.
Keeping PQ is usually supported by metering campaigns using mobile PQ meters or analyzers. In order to control PQ in the entire network in a continuous manner, DSO needs a large monitoring system covering the distribution grid. The system comprises of a great number of PQ meters which enable PQ assessment not only in the point of installation but also for the entire grid. Installing a meter in each node of the grid is not economically nor technically suitable. Therefore, an issue of selecting metering points appears. The points should be carefully selected so the metering system would be useful without high installation costs and further maintenance.
Based on the general rules of generation and distribution of PQ disturbances, it is possible to formulate some recommendations for selecting the metering points. Such recommendations are proposed, e.g., by CIGRE (International Council on Large Electric Systems) joined working group JWG C4.112 and CEER (Council of European Energy Regulators) working groups [7,8,9]. Following these recommendations would require installing PQ meters in all MV substations and connection points of large customers and still would not guarantee complete information about PQ parameters in the entire grid. Consequently, a more analytical framework is needed.
For an optimal selection of metering points, the theoretical framework of operational research is used. Due to the power distribution system’s inherent properties, it may still be difficult to find a reasonable solution. There may be constraints that cannot be embedded easily into the analytical form of the optimization problem. The problem of optimal selection of metering points can be divided into two subproblems:
  • The proposition of an equivalent model and formulation of the optimization problem. The model should allow for expressing measurement goals in an analytical form. Usually, it requires a simplified model of the grid. In order to define the optimization problem, a criterion should be selected and formulated in an analytical form.
  • Solving the optimization problem—which requires selecting the solving method. In most cases, the problem does not have an analytical solution, so numerical methods are utilized. Due to the problem complexity, heuristic methods are preferred. It is also assumed that a sequential approach can be utilized to find a near-optimal solution.

1.2. Literature Review

Literature survey reveals that the published methods for optimal selection of metering points can be divided into three groups. Methods are developed to support:
  • State estimation (SE) problem, also referred to as power flow (PF) or load flow analysis,
  • Fault detection (FD) based on voltage event recording and analysis,
  • Harmonics flow analysis, also referred to as harmonic state estimation (HSE).
Methods related to SE problem support estimation of the unknown vector variable x referred to as the state. It is assumed that measurements performed in the grid are a known function of the state vector altered by unknown and/or random error according to the equation:
z = h ( x ) + e
where z is a measurement vector, x is the state vector, h ( x ) is a function which transforms the state vector into the measurement vector, e is a random error or measurement uncertainty vector. In order to find an estimate x ^ of the state vector x based on measurements z an iterative approach using weighted least squares (WLS) method is usually applied, for which the Jacobian of h ( x ) is required. The theory is well-known and described in many textbooks (e.g., [10]). In order to find the estimate, the sufficient measurements have to be gathered, which means that metering has to be done in a number of nodes or branches of the grid. Therefore, the general task for the optimization method can be defined—to find a minimal set of metering points (i.e., meters) to provide measurements sufficient for successful SE with the smallest error of the estimation.
In [11,12], a cost function J is introduced according to the formula:
J = i = 1 N ( σ x i λ x i ) 2 ,
where N is the total number of nodes in the network, i is the current node, σ x i is the estimated variance of x in node i , λ x i is the limit imposed for the variance in the node i . The cost function J is therefore minimized subject to constraints, so in no node the estimated variance σ x i is greater than the limit λ x i . The problem is solved by means of Bellman’s dynamic programming.
In [13], a cost function comprising both the sum of all expenses (including the cost of a meter, transducers, installation, communication, and so on) and state estimation errors are defined. The minimum of the function has to be found keeping the accuracy requirement, i.e., the estimated variance less than the specified limits. The problem is solved using a genetic algorithm (GA) approach.
In [14], it is proposed to divide the Jacobian of h ( x ) into two parts. The first part is related to critical meters, i.e., meters that are essential to keep the system observable the second part relates to the rest of meters referred to as additional meters. Measurement data from additional meters can be used to improve observability, e.g., when data from a critical meter are lost. The cost function involves all expenses to install a meter in a selected node. This is used to formulate an integer programming problem.
In [15], the three-stage approach is presented. First, a set of metering locations are proposed to minimize the total cost while maximising the estimation accuracy. The iterative procedure removes from an arbitrary, large set of metering points these, which have the lowest influence on the estimation variances. The procedure continues until the system becomes unobservable. The first stage ensures only observability at the lowest cost possible. The second and third stage adds metering points in order to increase metering reliability and improve bad data processing ability. The first stage is a combinatorial optimization problem and is solved using either complete enumeration (CE) or bread-first type search. Other stages use specialized algorithms described in detail in [15].
In [16], it has been concluded that the optimization problem based on the minimization of the total root-mean-squared error (RMSE) of the estimation requires significant computational effort. This is because the RMSE depends on the parameters of the SE Equation (1). However, it is possible to build an equivalent model of the network so that the dependence of the RMSE on the metering points can be expressed a mixed-integer linear problem with constraints. The optimization criterion can incorporate estimation errors and the metering system’s cost (including all expenses). In [16], the method is compared with two other methods using a standard IEEE 13-node test feeder and another 33-node radial grid. The method is thoroughly explained. However, the process of building the equivalent model seems to be very complex and may be difficult to apply in practice.
In [17], it is proposed to employ a multiobjective optimization method to minimize the metering system’s total cost, the average relative error of magnitude and phase of the estimated voltage phasors. Because the criteria are conflicting, a Pareto-based approach can be employed to optimize according to all objectives. The method can be extended so other criteria can be added. The paper proposes a new multiobjective hybrid particle swarm–krill herd Pareto-based optimization algorithm with selected evolutionary computations features. The IEEE 69-node test feeder and real-case based on the 85-node grid in India are used to prove the method’s efficiency. The method relies on a large number of arbitrarily chosen constants which have a significant impact on the performance and the final result. For the version presented in [17], there are 13 constants (without the population size).
In [18], it is proposed to apply an ordinal optimization approach. The proposed method minimizes the probability that the maximal value of the relative error of the voltage estimates exceeds a specified threshold. The paper describes the formulas that allow for computing the exact or approximate value of the probability. The key assumption is that the objective function (i.e., the criterion) does not change much in the optimum global proximity. Therefore, it is possible to reduce the set of candidate solutions and to search for the optimum in the reduced set. The algorithm is demonstrated using a 96-node MV distribution network.
In [19], another multiobjective approach is described. The proposed method considers the installation costs of a meter, supply reliability monitoring, network loss monitoring and voltage levels analysis and the estimation error. The method can also take into account other devices to provide important information about the grid-like reclosers or voltage regulation devices. The method uses the analytic hierarchy process (AHP) to prioritize the involved criteria and make the final judgement about the points of metering in the grid. The method evaluates metering points separately according to the criteria, unlike a typical approach which evaluates a set of locations. Application of the method to the real-case mixed urban-rural network of an unknown number of nodes is presented.
A multiobjective approach is also proposed in [20]. The paper proposes a method for finding the optimal location of meters for a novel SE method referred to as the Adaptive State Optimization (ASE). The ASE is a two-stage process which uses both a typical Newton–Raphson algorithm with singular value decomposition (SVD). Optimal metering points in a grid should minimize the number of meters used and maximize the measurements’ quality. The paper proposes an evolutionary approach which finds Pareto-optimal solutions. The method is tested using an IEEE 13-bus test feeder.
In [21], a simplified method is described. The method supports only load estimation in distribution networks, but it may be extended to support full SE. The locations of metering are chosen in a way, so the estimation error is minimized. For this, a two-stage process is used: the estimation error for the proposed set of metering locations is evaluated first, then the confidence levels are evaluated assuming random variability of loads in given limits. It is possible to include also other constrains like existing meters, space availability, etc. The method is applied to a simple radial 32-node grid comprising one main feeder and three lateral branches. In [22], an updated version of the method is presented. The modifications include division of the grid into zones and further development in selecting candidate locations for metering.
In [23], it is proposed to introduce a system of weighting factors which is able to evaluate every node regarding its importance in PQ assessment. According to strictly defined rules, the factors are assigned: fulfilment of the Kirchhoff’s current law, load connection, and the beginning point of a branch. Further development presented in [24] also mentions customers with special supply requirements, key nodes to provide system observability and branching points. In [25], the method is extended to use Pareto-based multiobjective optimization supported by GA. The method is selected for further tests and is described in the next chapter.
In [26], a connectivity matrix is proposed to express the relation between state variables and nodes’ measurements. The matrix defines which state variables can be obtained by measurements in selected nodes and is an expression of the Kirchhoff’s voltage law. The other matrix, called co-connectivity matrix, contains information about the mutual connection of nodes. By introducing a decision vector, it is possible to find out which state variables are unobservable and the introduction of a cost vector gives information about measurement cost in a node. The objective is to minimize the system’s total cost, keeping the system observable, which is ensured by the analysis of the matrixes and observability vectors. The optimization problem is solved using a standard branch-and-bound algorithm. Results of application to the IEEE 30-node test feeder are also presented.
A similar method is presented in [27]. The connectivity and co-connectivity matrixes are created as in [26]. Additional matrix, called the density matrix, is introduced to describe the observability constraints based on Kirchhoff’s laws analysis. The objective is to minimize the cost of the system keeping the constraints expressed by the density matrix. The optimization problem is solved using a branch-and-bound algorithm. Results of application to the real-case 65-node system are presented.
The method presented in [28,29] is based on an analysis of nodes’ mutual connection. The analysis is used to define the connection matrix. The analysis also defines constraints for the optimization problem, which is to minimize the number of meters. This defines an integer linear programming problem with constraints solved by typical algorithms. The method is developed for transmission systems and relies on phasor measurement unit (PMU) meters. The method allows incomplete observability, which means having a part of the grid unobservable but with decreased total metering units involved. Results of application to 9-node and 57-node IEEE test feeders are presented.
A similar method is presented in [30]. The main difference is modifying the connection matrix, the introduction of primary and backup meters, and different cost considerations. Finally, the binary integer linear programming (BILP) problem is defined. The paper analyses the result of an application to 30-node, 57-node, and 118-node IEEE test feeders.
In [31], the problem of observability is analyzed using probability theory. It is possible to estimate the probability of observability for the entire grid. The probability is related to the metering points, mutual connection of nodes and data availability. Based on this, it is possible to define mixed integer-linear programming with nonlinear constraints. Linearization of the constraints is proposed, so it is possible to find a solution using standard algorithms for integer problems. The method supports multistage deployment of the meters. The paper presents the results of the application to the IEEE 57-node system.
Installation of meters for harmonics flow analysis and harmonic state estimation (HSE) enables a different type of network modeling. A linear relationship between voltage and current for a given spectral component (i.e., a harmonic) is assumed. Sources of distortion are modeled as current sources. Therefore, the resultant voltage distortion comes from the voltage drop across the system equivalent impedances for a given spectral component. A state equation can be formulated similarly to Equation (1), which is a base for introducing HSE theory [32,33]. Due to the assumption of linearity and usage of voltages and currents, it is possible to express the relationship in a linear manner:
[ U u ( ω ) U o ( ω ) ] = [ Z u u ( ω ) Z u o ( ω ) Z o u ( ω ) Z o o ( ω ) ] [ I u ( ω ) I o ( ω ) ] ,  
where U u ,   I u are vectors of unknown (i.e., non-measured) voltages and currents respectively, U o ,   I o are vectors of measured voltages and current respectively, Z u u , Z u o , Z o u ,   Z o o are vectors of spectral impedances which relate the known and unknown voltages and currents to each other. It is also possible to formulate Equation (3) using admittances instead of impedances [32]. The optimal location of meters is therefore related to obtaining the lowest estimation error. It can be accomplished using sensitivity analysis or minimization of the estimation error variance [33,34,35].
In [36,37] a comprehensive observability analysis based on Kirchhoff’s laws is employed to define constraints on the minimization process. The goal is to minimize the metering system’s total cost, which is the sum of individual node metering costs. The problem is solved using a branch and bound algorithm and also GA. The method is selected for further tests and is described in the next chapter.
In [38], another approach based on observability analysis is presented. The key concept is to divide the method into two stages. The first stage selects nodes which give maximum options for the grid observability. A simple iterative algorithm does this. The second stage uses an optimization algorithm to find nodes that complete the observability requirement, i.e., giving full observability when added to these selected in the first stage. The stage utilizes a binary particle swarm optimizer to solve the optimization problem. The method is also selected for further tests and is described in the next chapter.
In [39], it is proposed to use a fuzzy expert system. First, the analysis of harmonics flow is performed to find voltage levels and power loss in the considered grid. Next, an expert system evaluates every node and assigns the sustainability index based on a set of fuzzy rules. The index expresses the importance of a node to PQ assessment. Observability analysis is then performed to select nodes with high indexes to ensure observability. The paper presents application results to an IEEE 9-node test feeder and a 17-node system.
Installation of PQ meters for fault detection (FD) based on voltage event recording and analysis also requires a specific modeling technique. Majority of papers utilize the so-called meter (or monitor) reach area matrix (MRA), sometimes referred to as binary observability matrix. Entries of the matrix are related to the possibility of detecting a voltage drop below a specified value p [40]. The value is usually defined as a typical threshold for voltage dip detection, i.e., 90% of the node’s nominal voltage. However, the value may be selected differently for other purposes. Therefore, if a fault somewhere in the system generates voltage dips, the MRA matrix analysis will show which nodes are affected by or which meters will record the dips related to the fault. The MRA matrix is obtained usually using specialised simulation software packages. Therefore, the optimal meter location problem can be defined as a set of meters installed in selected nodes, so a fault in any location of the system can be recorded by n meters, where n is at least one. The value of n may be related to other purposes of the metering system, e.g., assumed metering redundancy or fault source location. The optimization problem can be solved using integer programming with constraints [41]. In [40], the binary integer programming problem is defined to solve the optimization problem and is solved using branch-and-bound and GA approach. Fuzzy logic can also be used to define MRA and solve the optimization problem [42].
In [43,44], it is proposed to consider the topological relationships between nodes together with the MRA matrix. It forms the topological meter reach area (TMRA) matrix, which makes the method more suited for distribution (radial) systems. The optimization problem is defined to find the minimal number of meters to record dips created by a fault in any node. The problem is solved using GA.
In [45], a stochastic approach to the modeling of the grid is presented. It allows for considering only the most likely fault locations. It also decreases the total number of meters needed to monitor the system. The paper describes the network reduction, node grouping, and definition of fault conditions. GA approach is used to find the best locations for monitoring node voltages.
The literature survey can be concluded that the problem of optimal selection of metering points has many approaches. The problem is strictly related to the goal of the measurement. The problem is secondary to the more general problem, e.g., state estimation (SE) or fault detection (FD). SE framework seems to be the most appropriate for PQ metering. A review of estimation techniques for power quality is presented in [46] and [47]. Methods related to the optimal selection of metering points for SE should also be useful for PQ measurements.
The literature survey also explains how the published methods classify the optimization problem and what approaches are used to solve it. The finding is summarized below:
  • CE or undisclosed algorithm: [14,16,22,29,31,32,33,34,35].
  • Branch and bound method: [26,27,37,40,41].
  • Standard binary programming (e.g., BLIP): [30].
  • Dynamic Programming: [11,12].
  • GA or other evolutionary: [13,20,25,35,36,40,43,45].
  • Typical heuristic (e.g., particle swarm optimization): [38].
  • Other algorithm or mixed approach: [15,17,18,19,21,23,39,42].

1.3. Contribution and Paper Organization

The literature review reveals what approaches are used to define the optimization problem and what techniques are used to solve it. In this work, three methods were chosen for tests using different tests grids. The selection is based on the applicability of a method to the PQ measurement in the entire distribution grid. The results of the tests allow for drawing general conclusions about the existing techniques. It has been noted that the description of methods leaves some freedom of interpretation. It means that two implementations of a method according to the source papers may give different results when applied to the same case. Also, state definition and observability checking are strictly related to the standard SE problem, focusing on power flow study and voltage level analysis.
In this paper, the three selected methods are analyzed in the context of PQ measurements. The analysis emphasises practical, technical and organisational limitations that can be encountered on-site in real-world cases.
The paper is divided into five sections: Section 1 introduces the concept and provides literature review in the field of optimal metering; Section 2 describes in details three selected methods of optimal selection of metering points and introduces the testing methodology; Section 3 shows the results of tests. Finally, Section 4 and Section 5 presents a discussion of the results and conclusion of the work.

2. Materials and Methods

Considering the type of measurements and the tree-like topology rendered by the distribution system’s radial structure, some methods might be preferred than others. In the paper, three methods have been chosen to test their performance when applied to selecting metering points for PQ measurement. The chosen methods support SE approach since the ability to estimate voltages may be advantageous when the estimation of PQ parameters is considered.

2.1. Selected Methods

Method 1, described in detail in [23], tries to combine expert knowledge with observability analysis. The expert knowledge is expressed in a weighting system to define the importance of nodes based on experience. Therefore, for each grid element, a numerical weight is defined. The priority of the element in PQ analysis is also introduced. Observability analysis ensures that full SE is possible. The method can be extended by defining new weights and usually does not require complex numerical algorithms to find a solution.
The grid is modeled as a graph in the form of a rooted tree and contains information about the type of grid elements and mutual connections. For each element, the weighting factors can be defined according to strictly defined rules:
  • Kirchhoff current law criterion states that current in a line can be computed by the summation of currents in other lines. It means that in a node comprising n lines, only n−1 can be monitored without losing the system’s observability.
  • Customer connection point—when a PQ parameter exceeds limits, it may affect customers. Therefore, branch customers connected to it should be selected to monitor with a high priority.
  • The number of branches fed form a node. Elements near the supply source are more important for monitoring due to the total number of elements connected.
  • Connection point (the beginning) of a branch—allows for monitoring all branches elements when a meter is installed in the node. It increases the observability of the system.
By applying the rules mentioned above, weighting factors are defined, and the total weight is computed as a product of all weighting factors. The total weight is a numerical value that describes the importance of the measurements gathered from the element. A ranking of elements can be built in this way, so meters should be installed to monitor the elements with as higher total weight as possible. An ambiguity index is introduced to ensure observability. The index describes how large is the fragment of the grid that cannot be observed. The index’s value equals zero means that the entire grid is observed, so full SE is possible. For instance, it is also possible to find a disturbance source if it is detected by the nearby meters.
The method’s application is as follows: the first total weight for each element is computed, then an iterative procedure starts. The procedure places a meter to monitor an element with the highest total weight and compute the ambiguity index. If the index is greater than zero, the next meter is placed, and the index is recomputed. The procedure stops when the index reaches zero, which means that the grid is observable and the meters monitor the grid elements which give measurements of the highest importance.
The method is fast and easy to implement. It can be easily extended, e.g., to include preinstalled meters. The method also introduces the concept of meter’s section, which can be useful in further analysis of the metering system, e.g., by supporting measurements using mobile meters or dividing the metering system into stages.
Method 2 presented in [38] focuses on harmonics metering and considers harmonic phasor measurement. Voltage phasor meters placed in nodes selected according to the method allow for locating distortion sources in the power system. The method also requires knowledge (i.e., measurement) of the active and reactive power of each load.
Application of the method is divided into two stages:
  • Observability analysis using an iterative procedure referred to as index method. Nodes are selected based on mutual connection analysis in a way that the total observability is maximized. This stage decreases the number of nodes to analyze in the next stage. It comes from the assumption that the optimal solution can be found from a reduced set of nodes.
  • Optimization procedure finds a minimal set of nodes to monitor, having preselected those chosen in Stage 1. The procedure minimizes a fitness function which depends on the number of used meters (in this stage) and the metering redundancy, i.e., the number of meters that can monitor a single node. The fitness function is nonlinear, and the optimization procedure also has to keep constraints related to observability. Therefore, there is no analytical solution, and heuristic algorithms should be used for the performance reason. In [38], binary particle swarm optimization (BPSO) procedure is used for this task, but any other solver for binary problems can also be used.
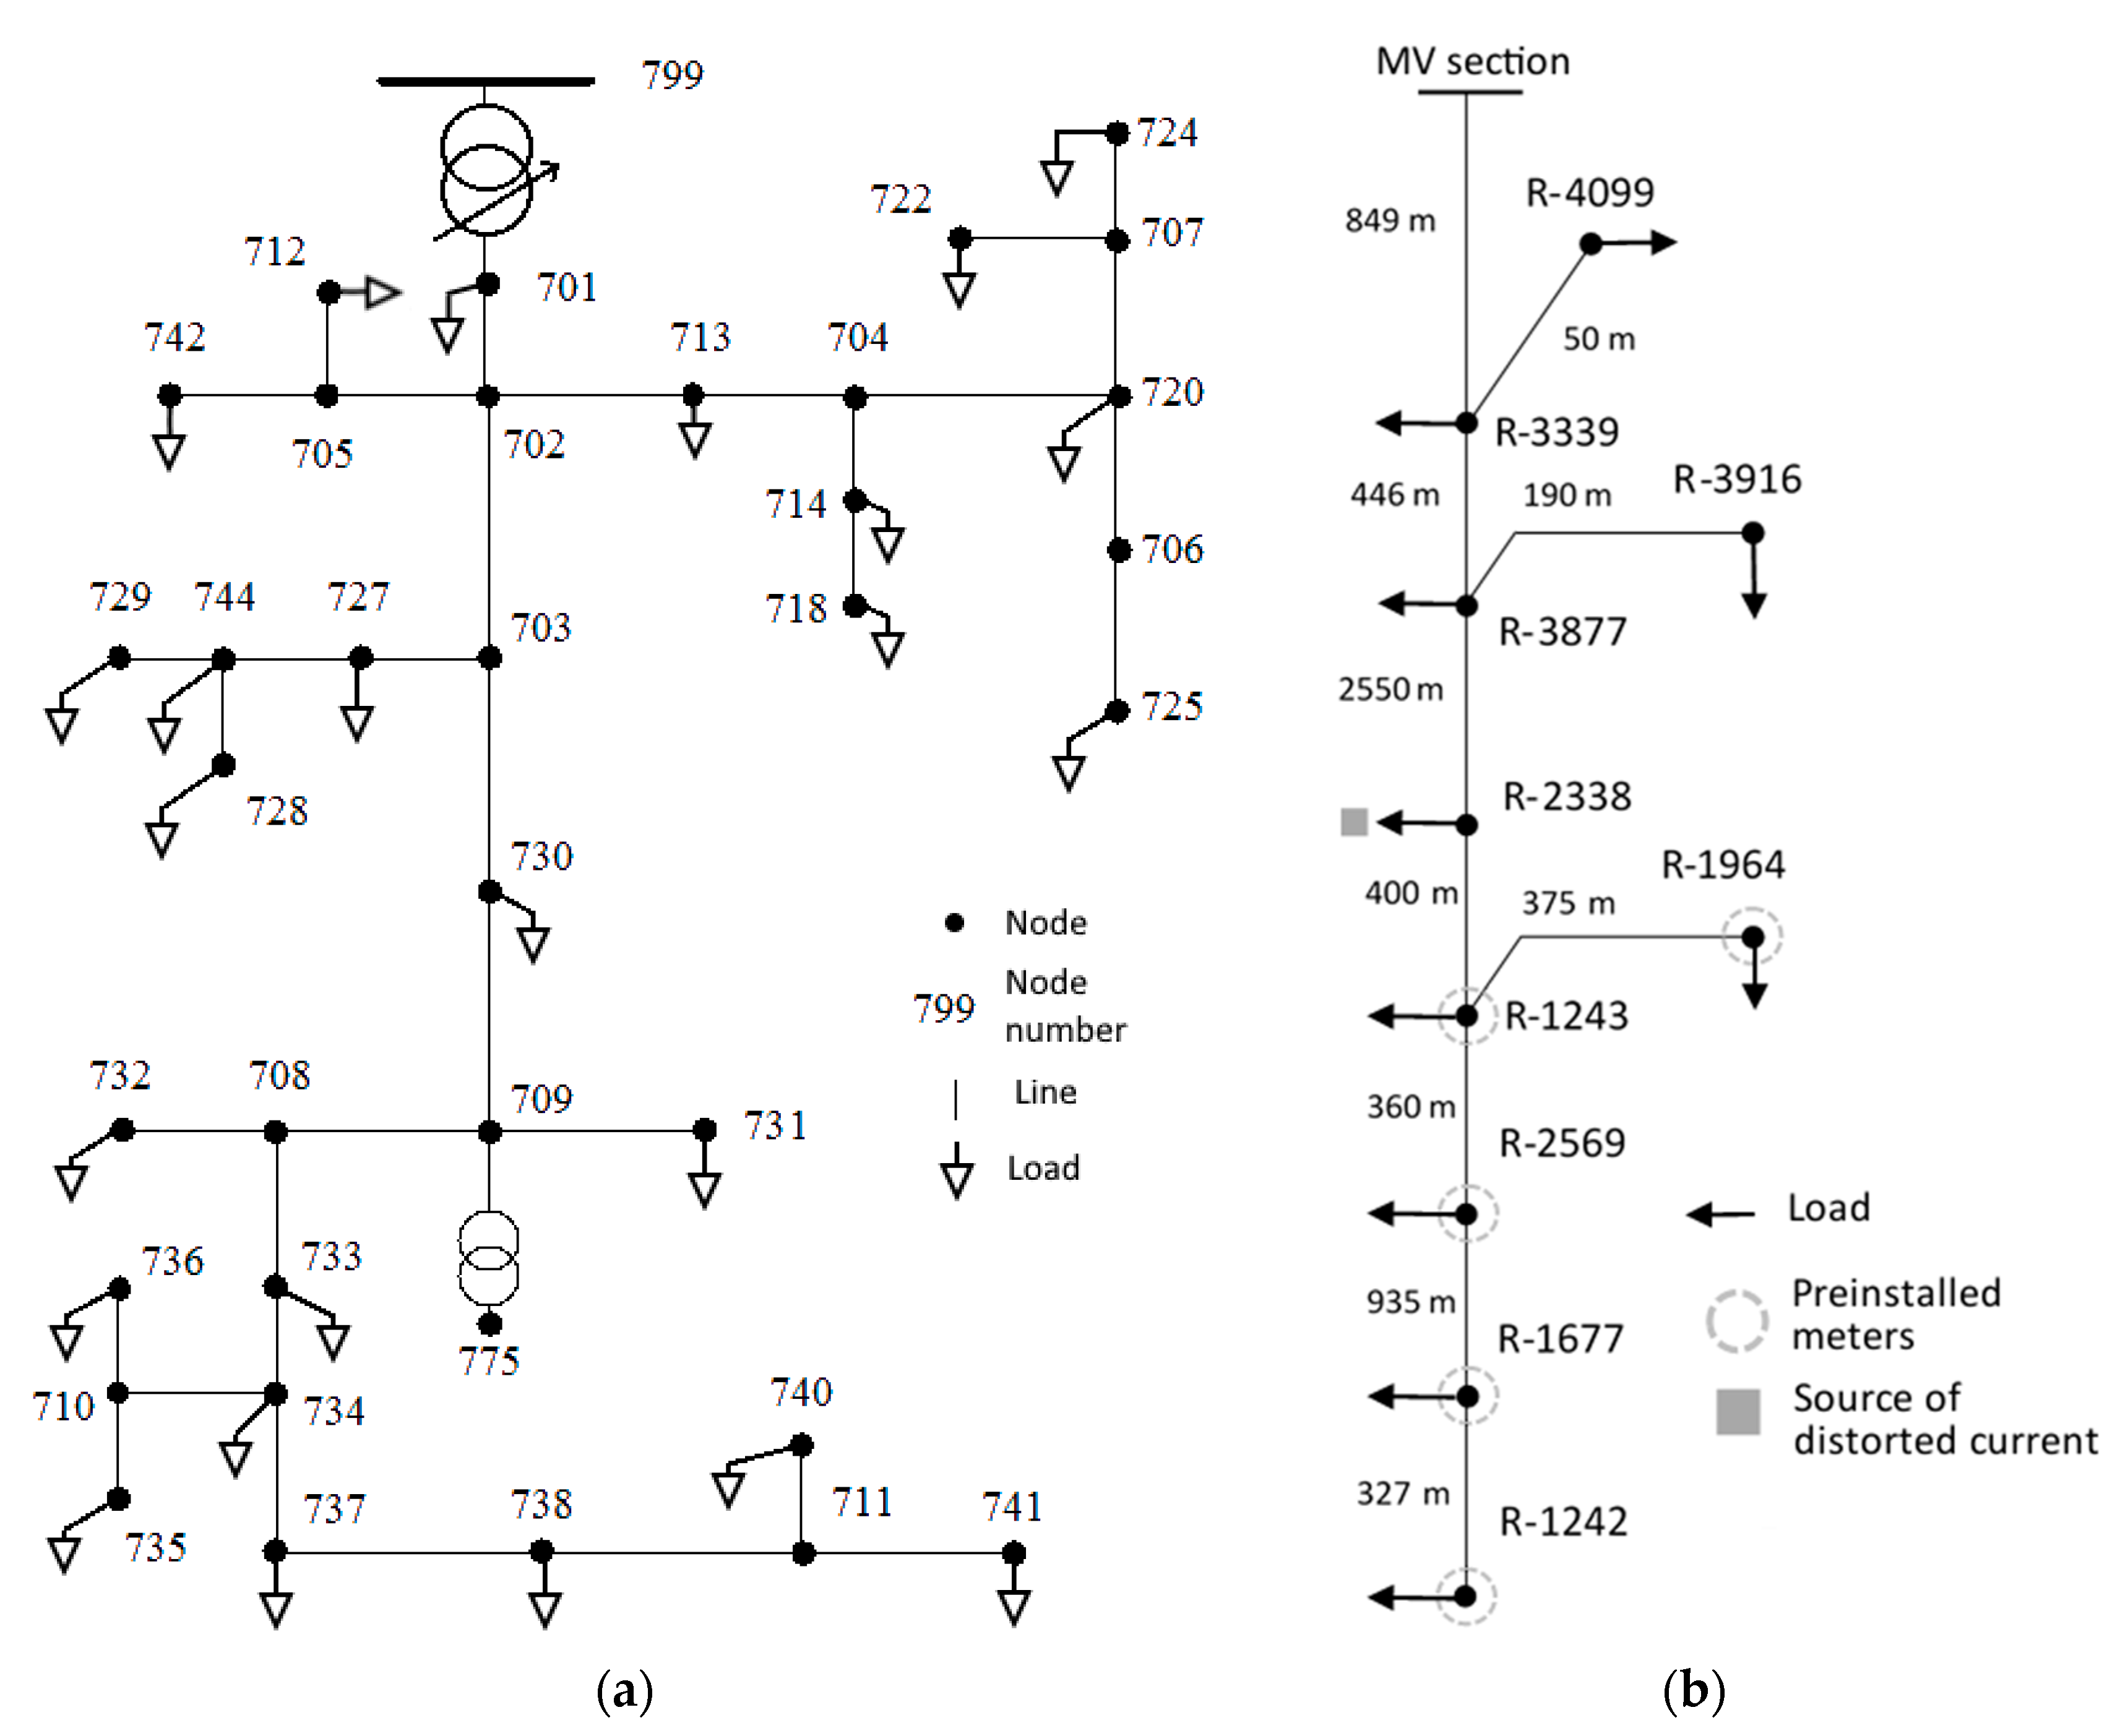
The method guarantees observability of the grid, which enables HSE and identification of distortion source locations.
Method 3 presented in [36,37] was originally developed for harmonic state estimation in the system. The method focuses on an analysis of connections between nodes to provide full observability. It allows for computing harmonic voltages and current in every point of the network based on the measurements and known grid parameters. The observability analysis uses Kirchhoff’s current and voltage laws to check whether it is possible to compute quantities in nodes or branches. The method considers voltage and current measurement separately. Although a typical meter measures voltage in one node and current in one branch, the method can include multi-channel meters, i.e., performing current measurements in several branches connected to that node.
The optimization problem is formulated in a way that the cost of the metering system is minimized. The cost can include voltage and current transducers, data transmission and acquisition equipment, etc.
The source papers do not specify whether the phasor or rms value of voltage and current is required to measure. If harmonic SE is required, this needs to be clarified. However, when only metering points are considered, the issue is of minor importance.
The optimization problem defined by the method may be solved using different approaches. For performance reasons, a heuristic algorithm based on GA is implemented.

2.2. Test Grids

Performance of the methods can be analyzed by application to a common test grid. Several test grids have been chosen for this task:
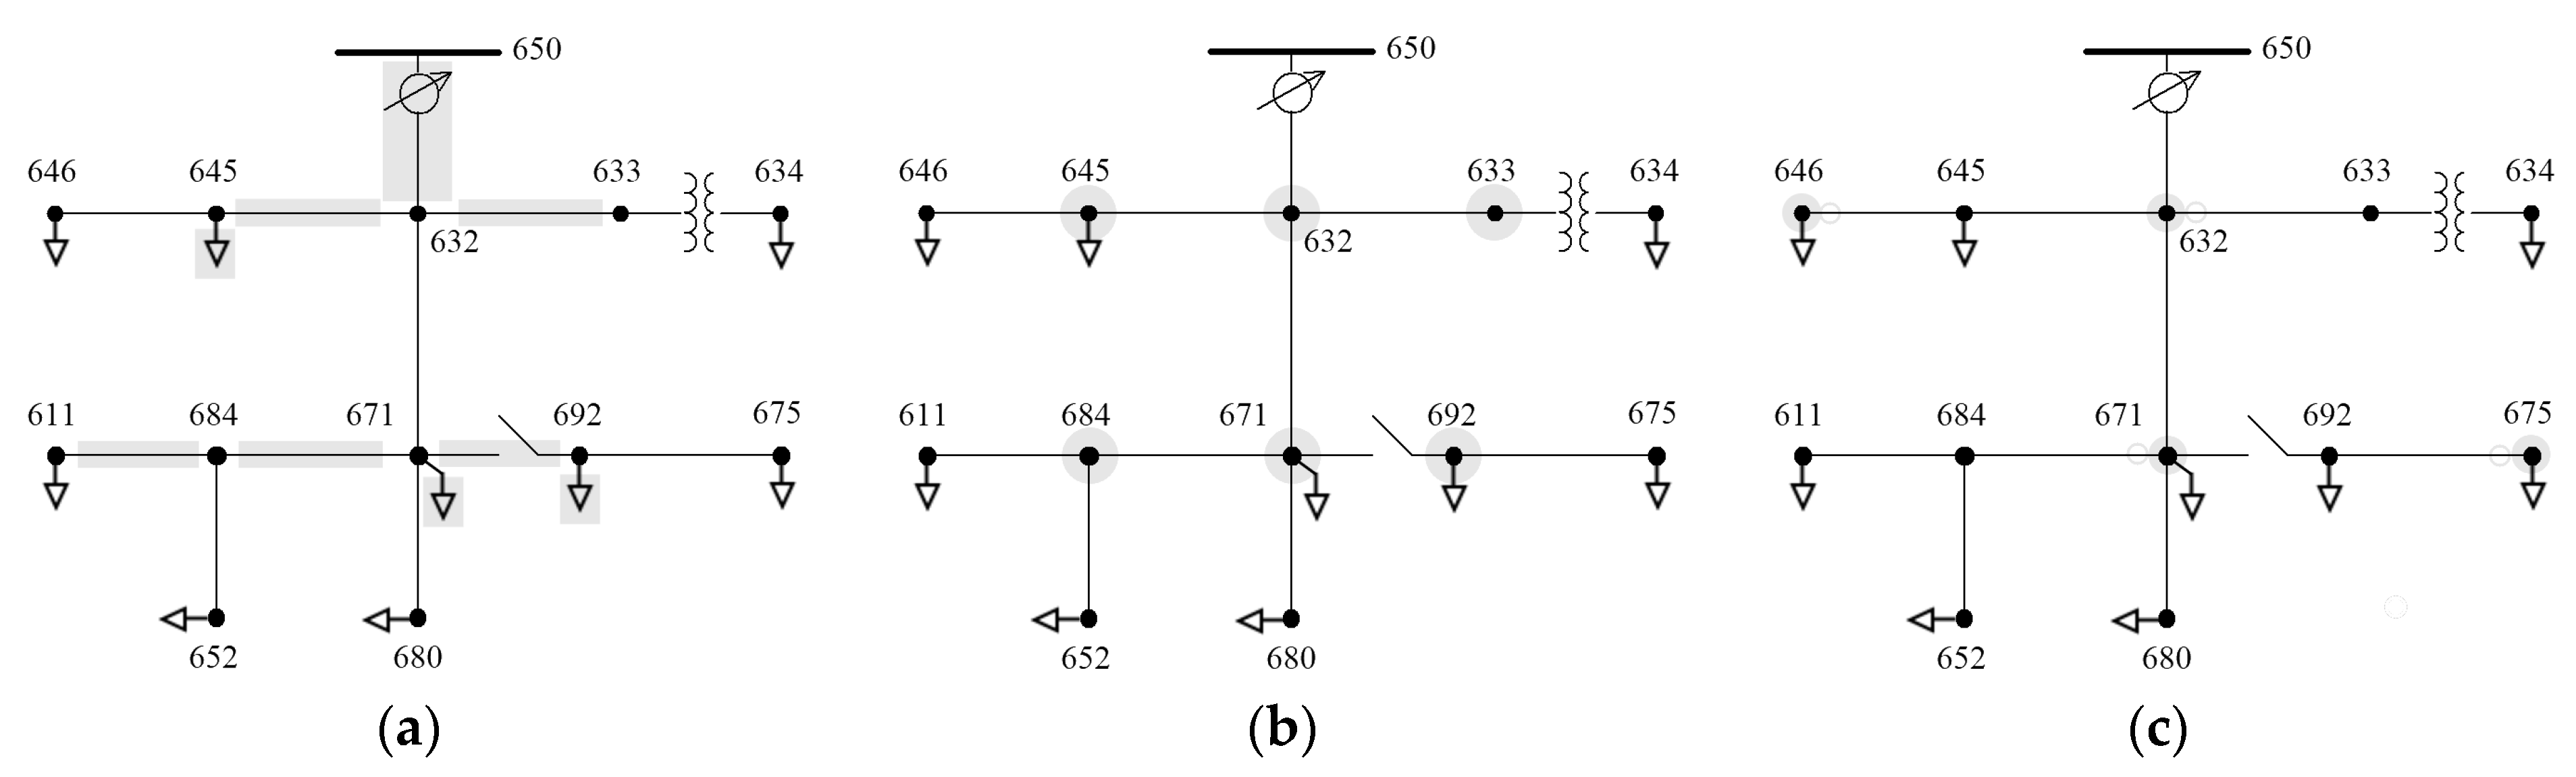
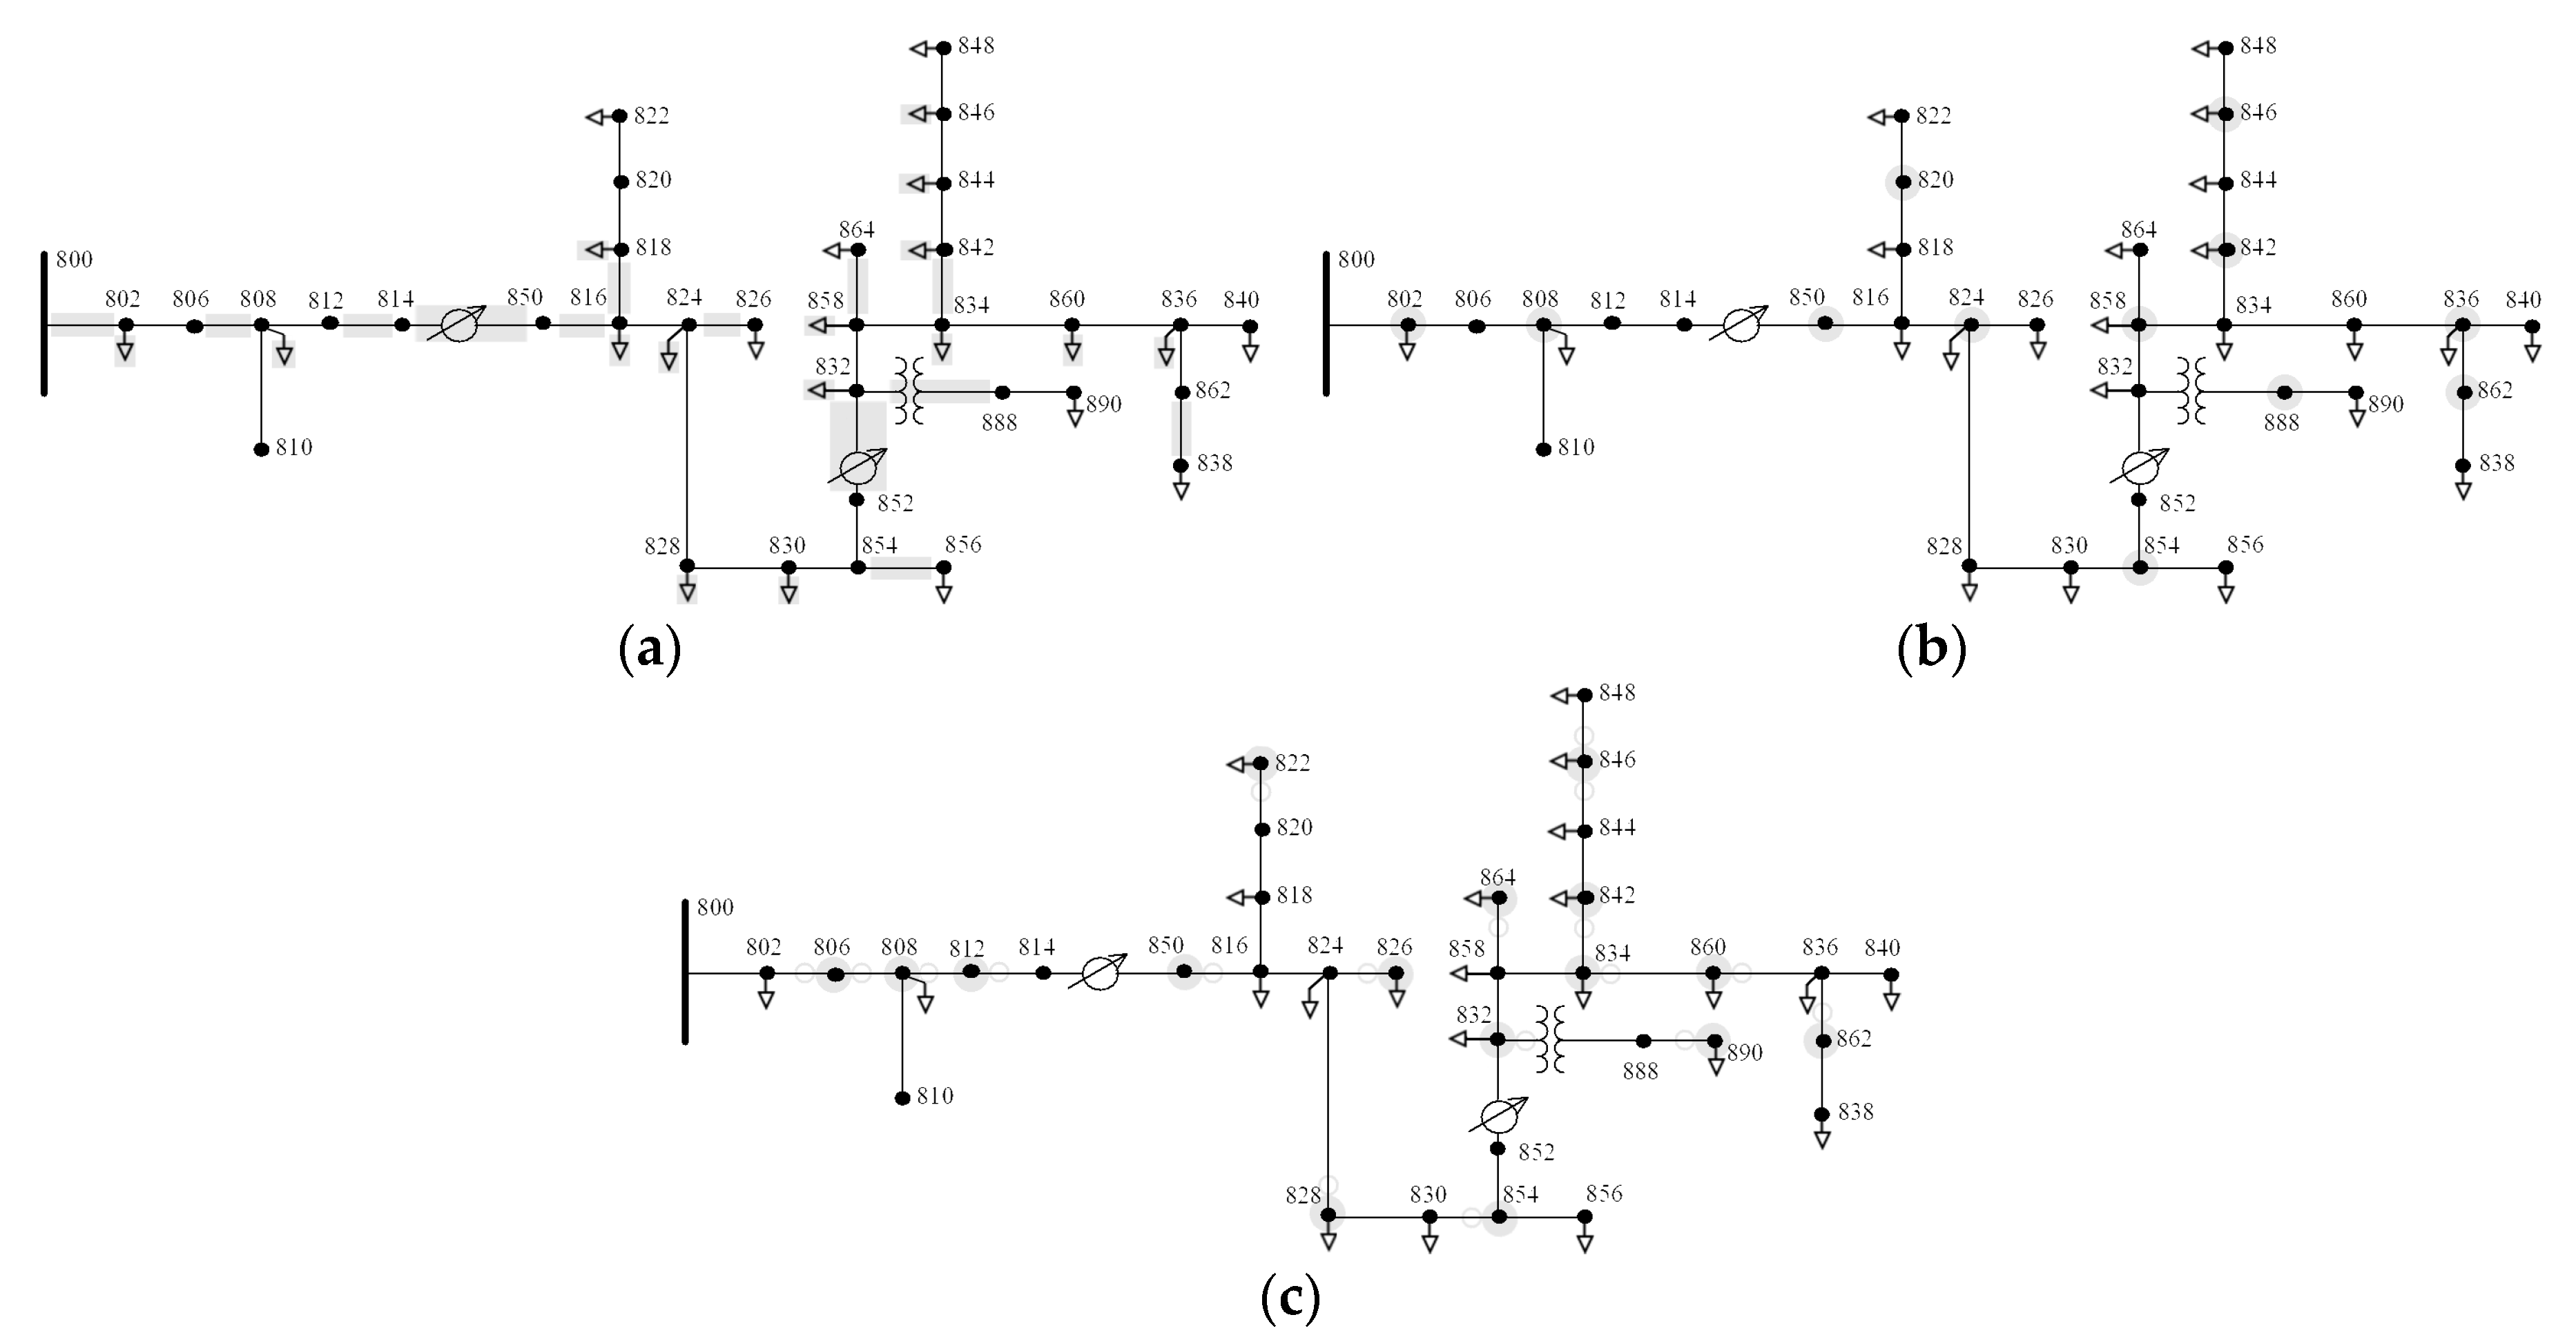
  • IEEE test feeders: 13-node, 34-node, and 37-node test feeder [48],
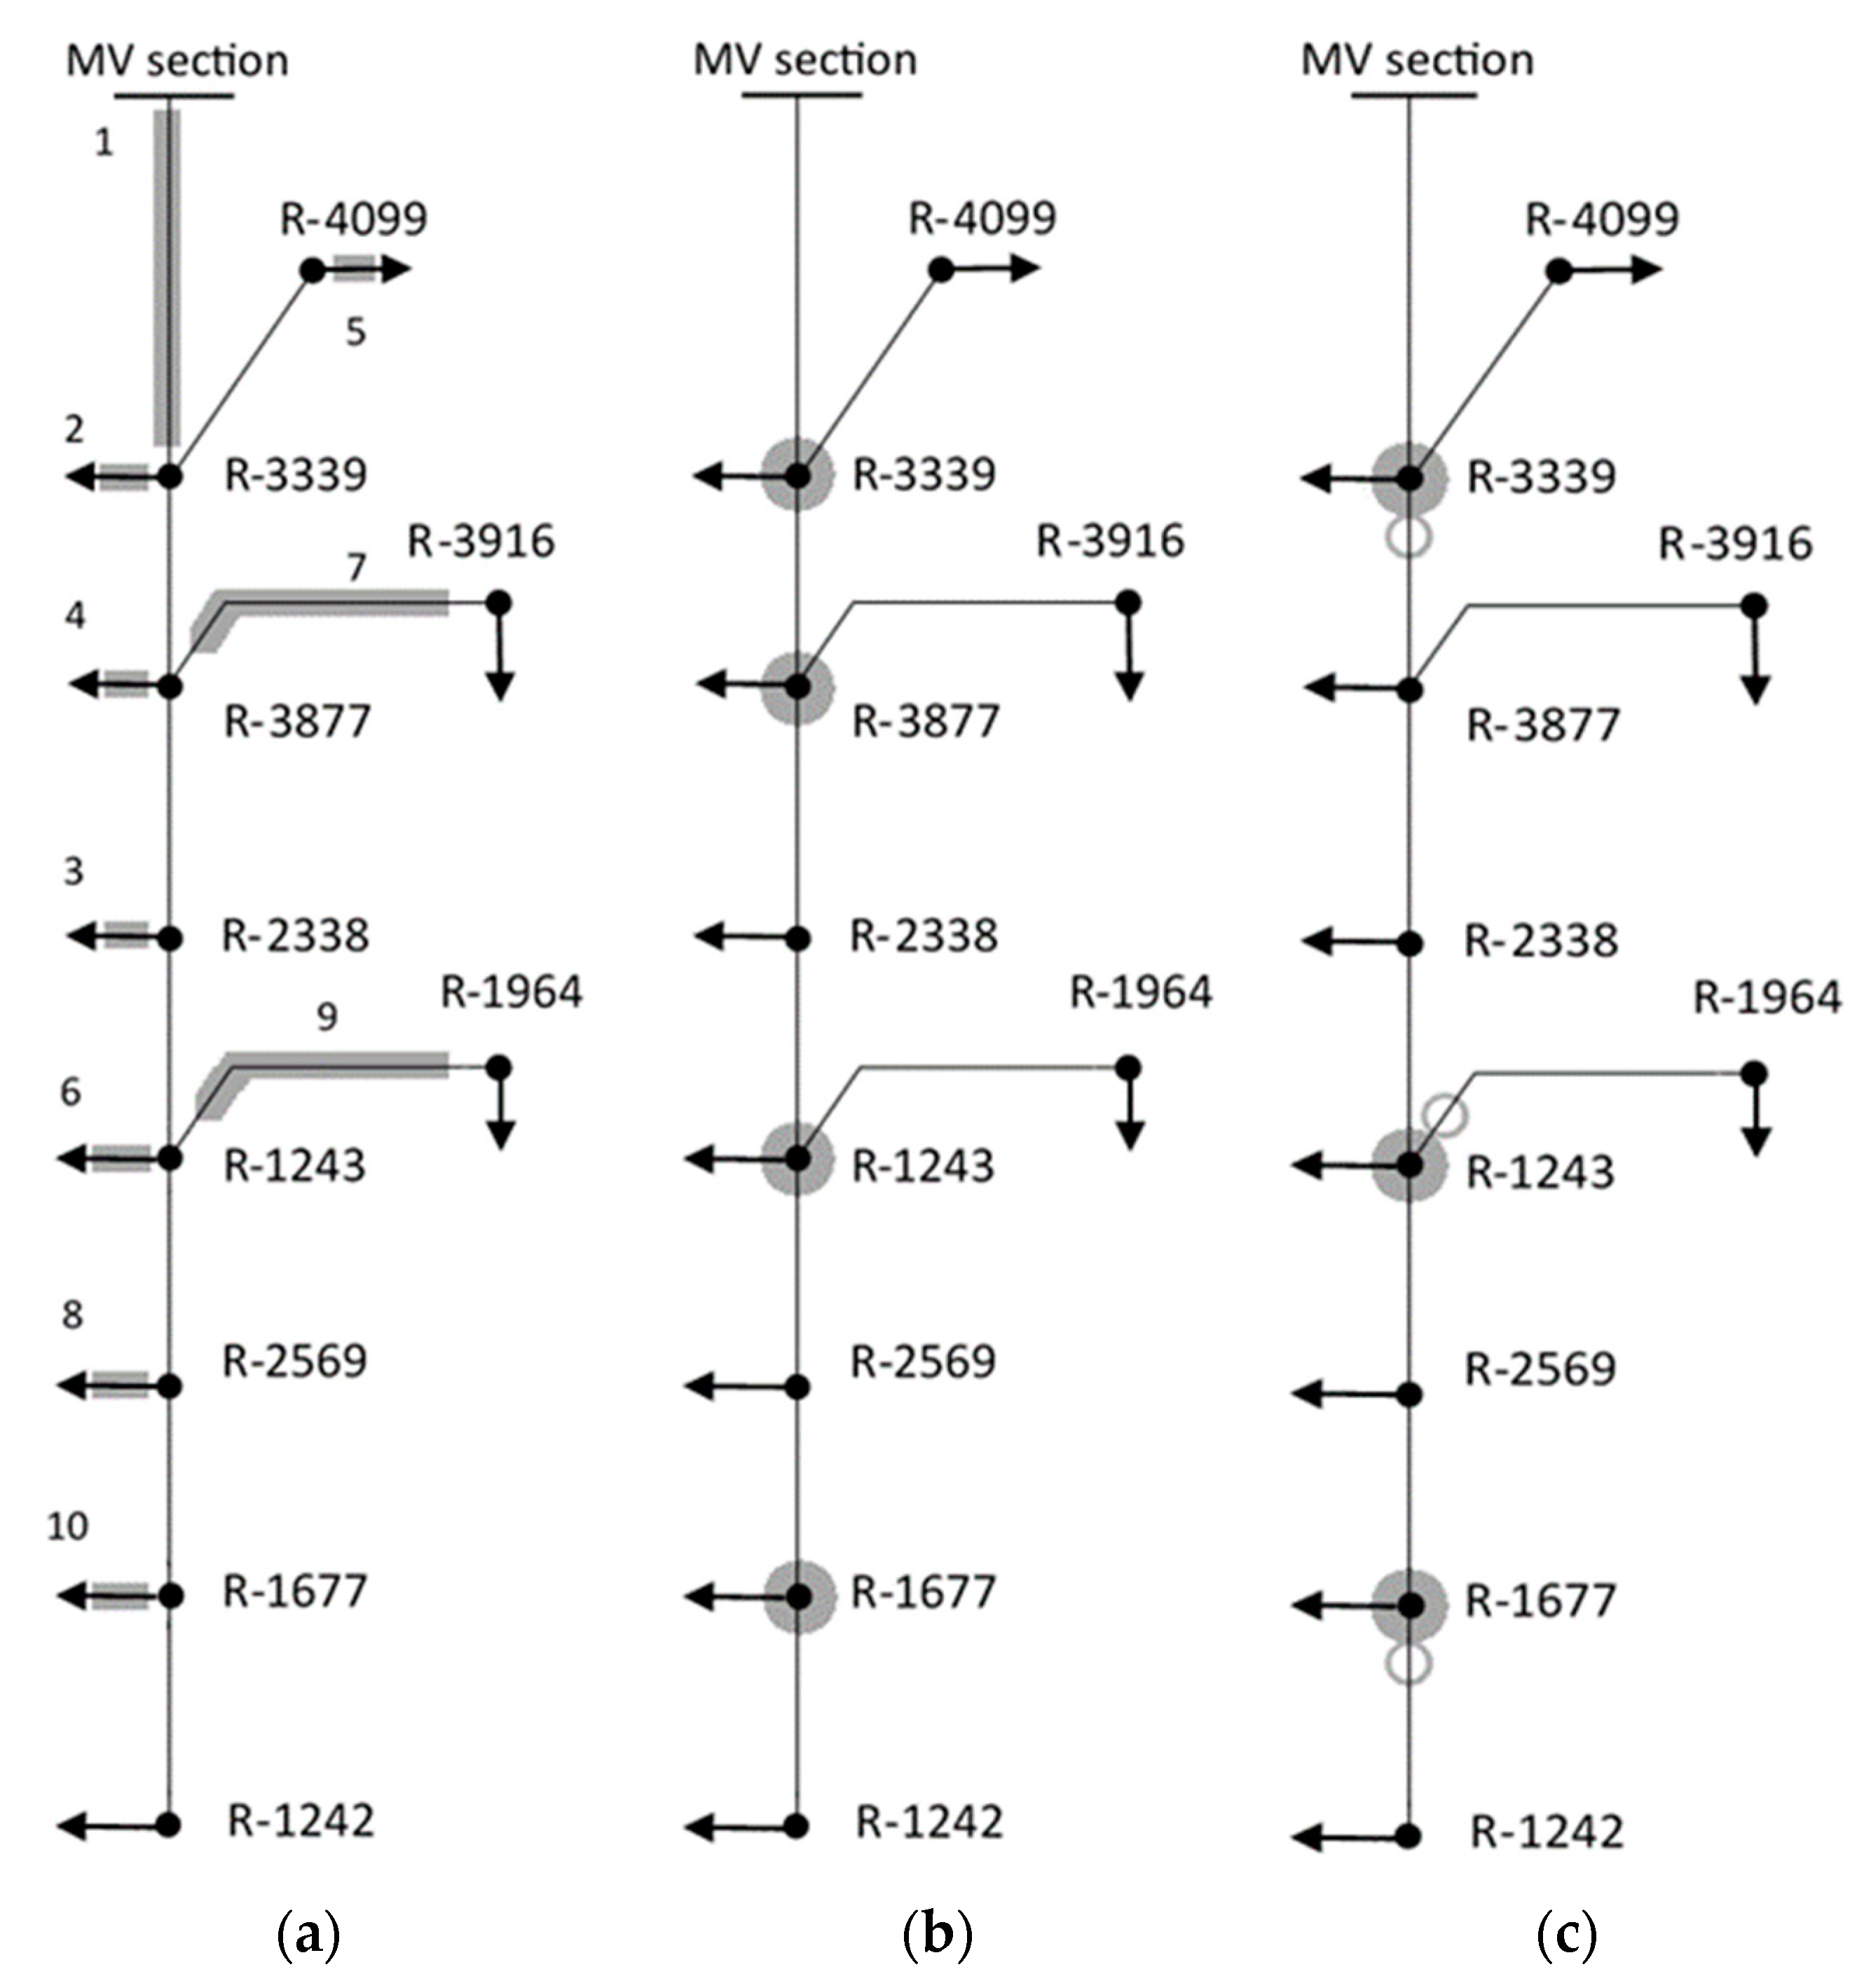
  • A typical MV feeder in an urban area.
The IEEE 37-node feeder has been chosen due to its radial structure, typical for a distribution system. Figure 1a shows the simplified diagram of the test feeder. Most nodes contain a load (marked with a triangle on the diagram). Node 775 is not loaded, so the node and the transformer supplying it may be further removed from the analysis.
For other chosen IEEE test feeders, some minor adjustments have been made. The adjustments are usually also applied to the feeders [49]. The feeders define distributed loads that are connected between two specific nodes. The loads have been connected to either sending or receiving node of the branch. For the IEEE 34-node test feeder, the 810 nodes and line connecting node 808 and 810 are removed.
The available description of the test feeders does not specify the main feeder. The feeder is to be inferred from the topology of the grid. It is assumed that the main feeder connects nodes:
  • for IEEE 13-node: 650, 632, 617, and 680,
  • for IEEE 34-node: 800, 802, 806, 808, 812, 814, 850, 816, 824, 828, 830, 854, 852, 832, 858, 834, 860, and 836.
Information about the main feeder is required for method 1, and the method may render different results when the main feeder is defined differently.
Part of an MV distribution system in a large city is also used as a test grid. Figure 1b shows a simplified diagram of the feeder. There are 11 nodes in total, 10 nodes contain a MV/LV transformer which supplies mostly residential LV loads. Nodes are connected by means of underground cable lines. There is also one node with a load causing a distorted current flow (marked with a grey square). In some nodes, substation meters are installed. The meters provide energy metering and the reduced subset of PQ parameters. The meters may be optionally considered as a part of the PQ metering system.

2.3. Implementation

The selected methods have been implemented in Python programming language following description in [23,36,37,38]. The meters are assumed to be single-channel devices. It means that a meter measures three phase voltages in one node and line currents in one branch connected to this node. Multi-channel meters have not been considered. However, method 1 and 3 allow for a modification that enables it.
For the purpose of tests, GA implementation in Python programming language was used for method 2 and 3. A different set of parameters has been checked, and multiple runs were performed to validate the final result. The most useful parameters are: 200 generations, 50 population size, and increased probability of mutation to 10%.
Since the optimization problem has many solutions, the result of GA is usually only a selected one. It applies especially to method 3, where the cost function is sensitive only to the number of meters and constraint violation. The solution presented in the paper is the most frequent one.

3. Results

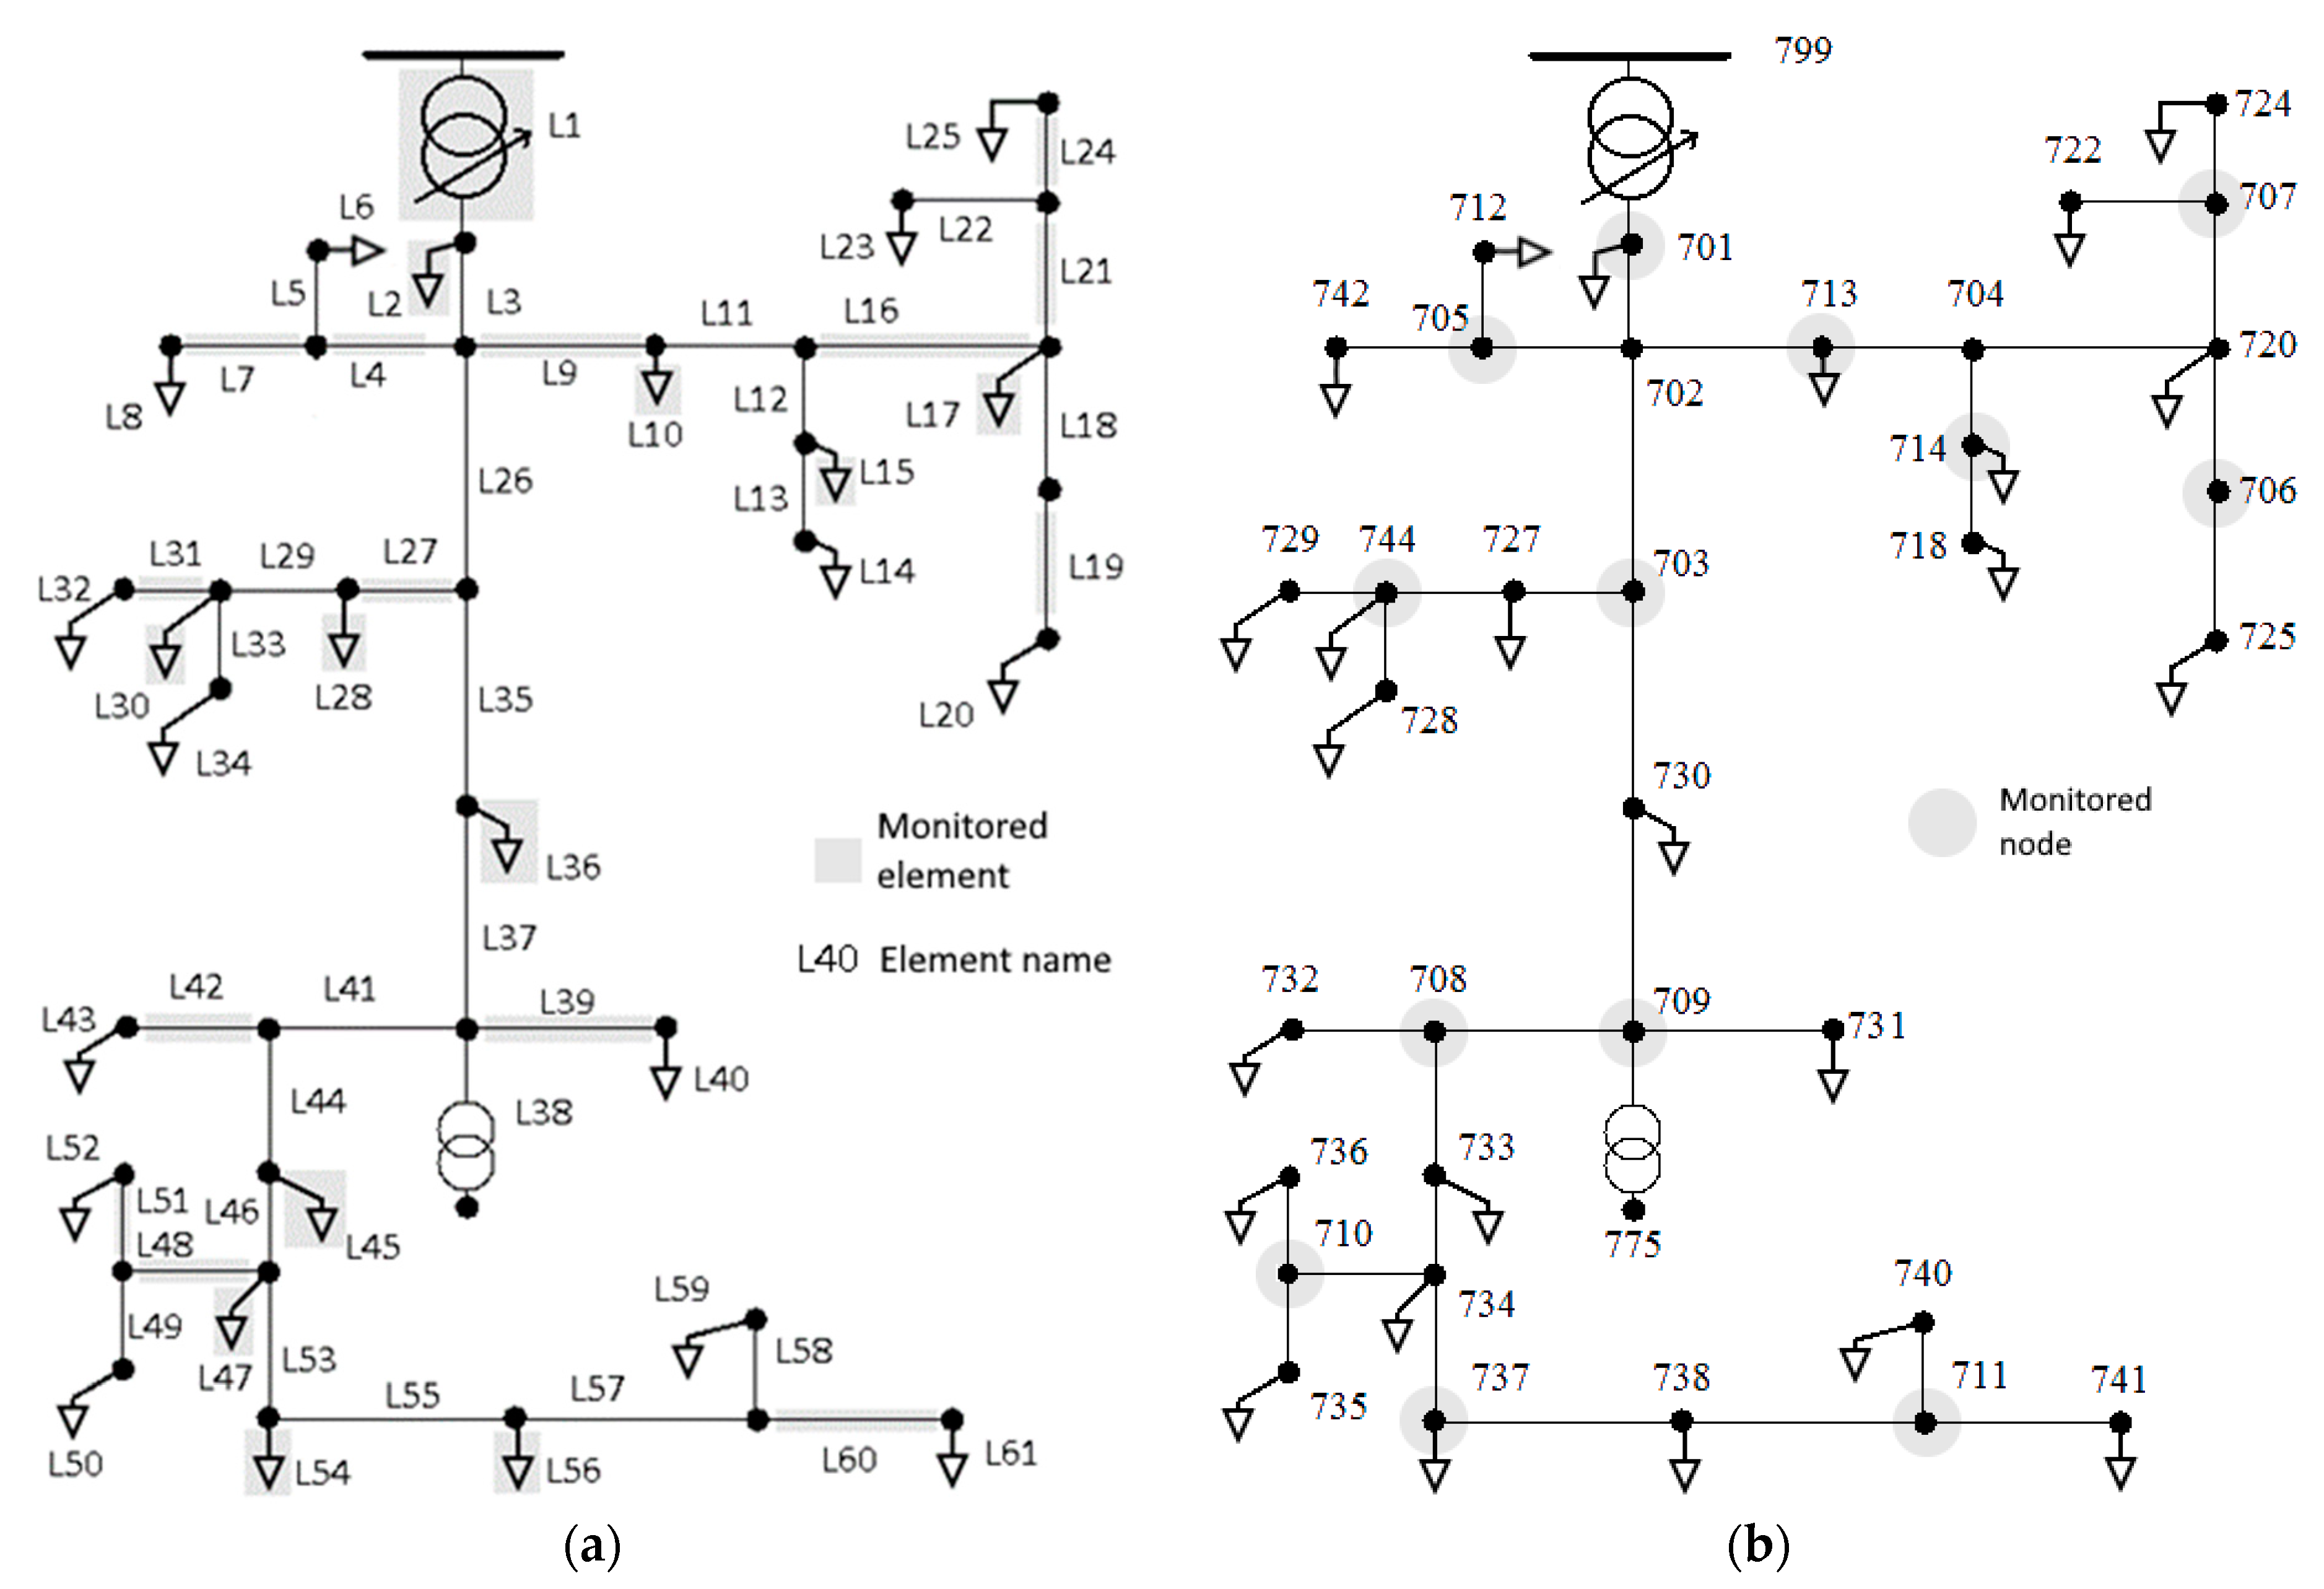
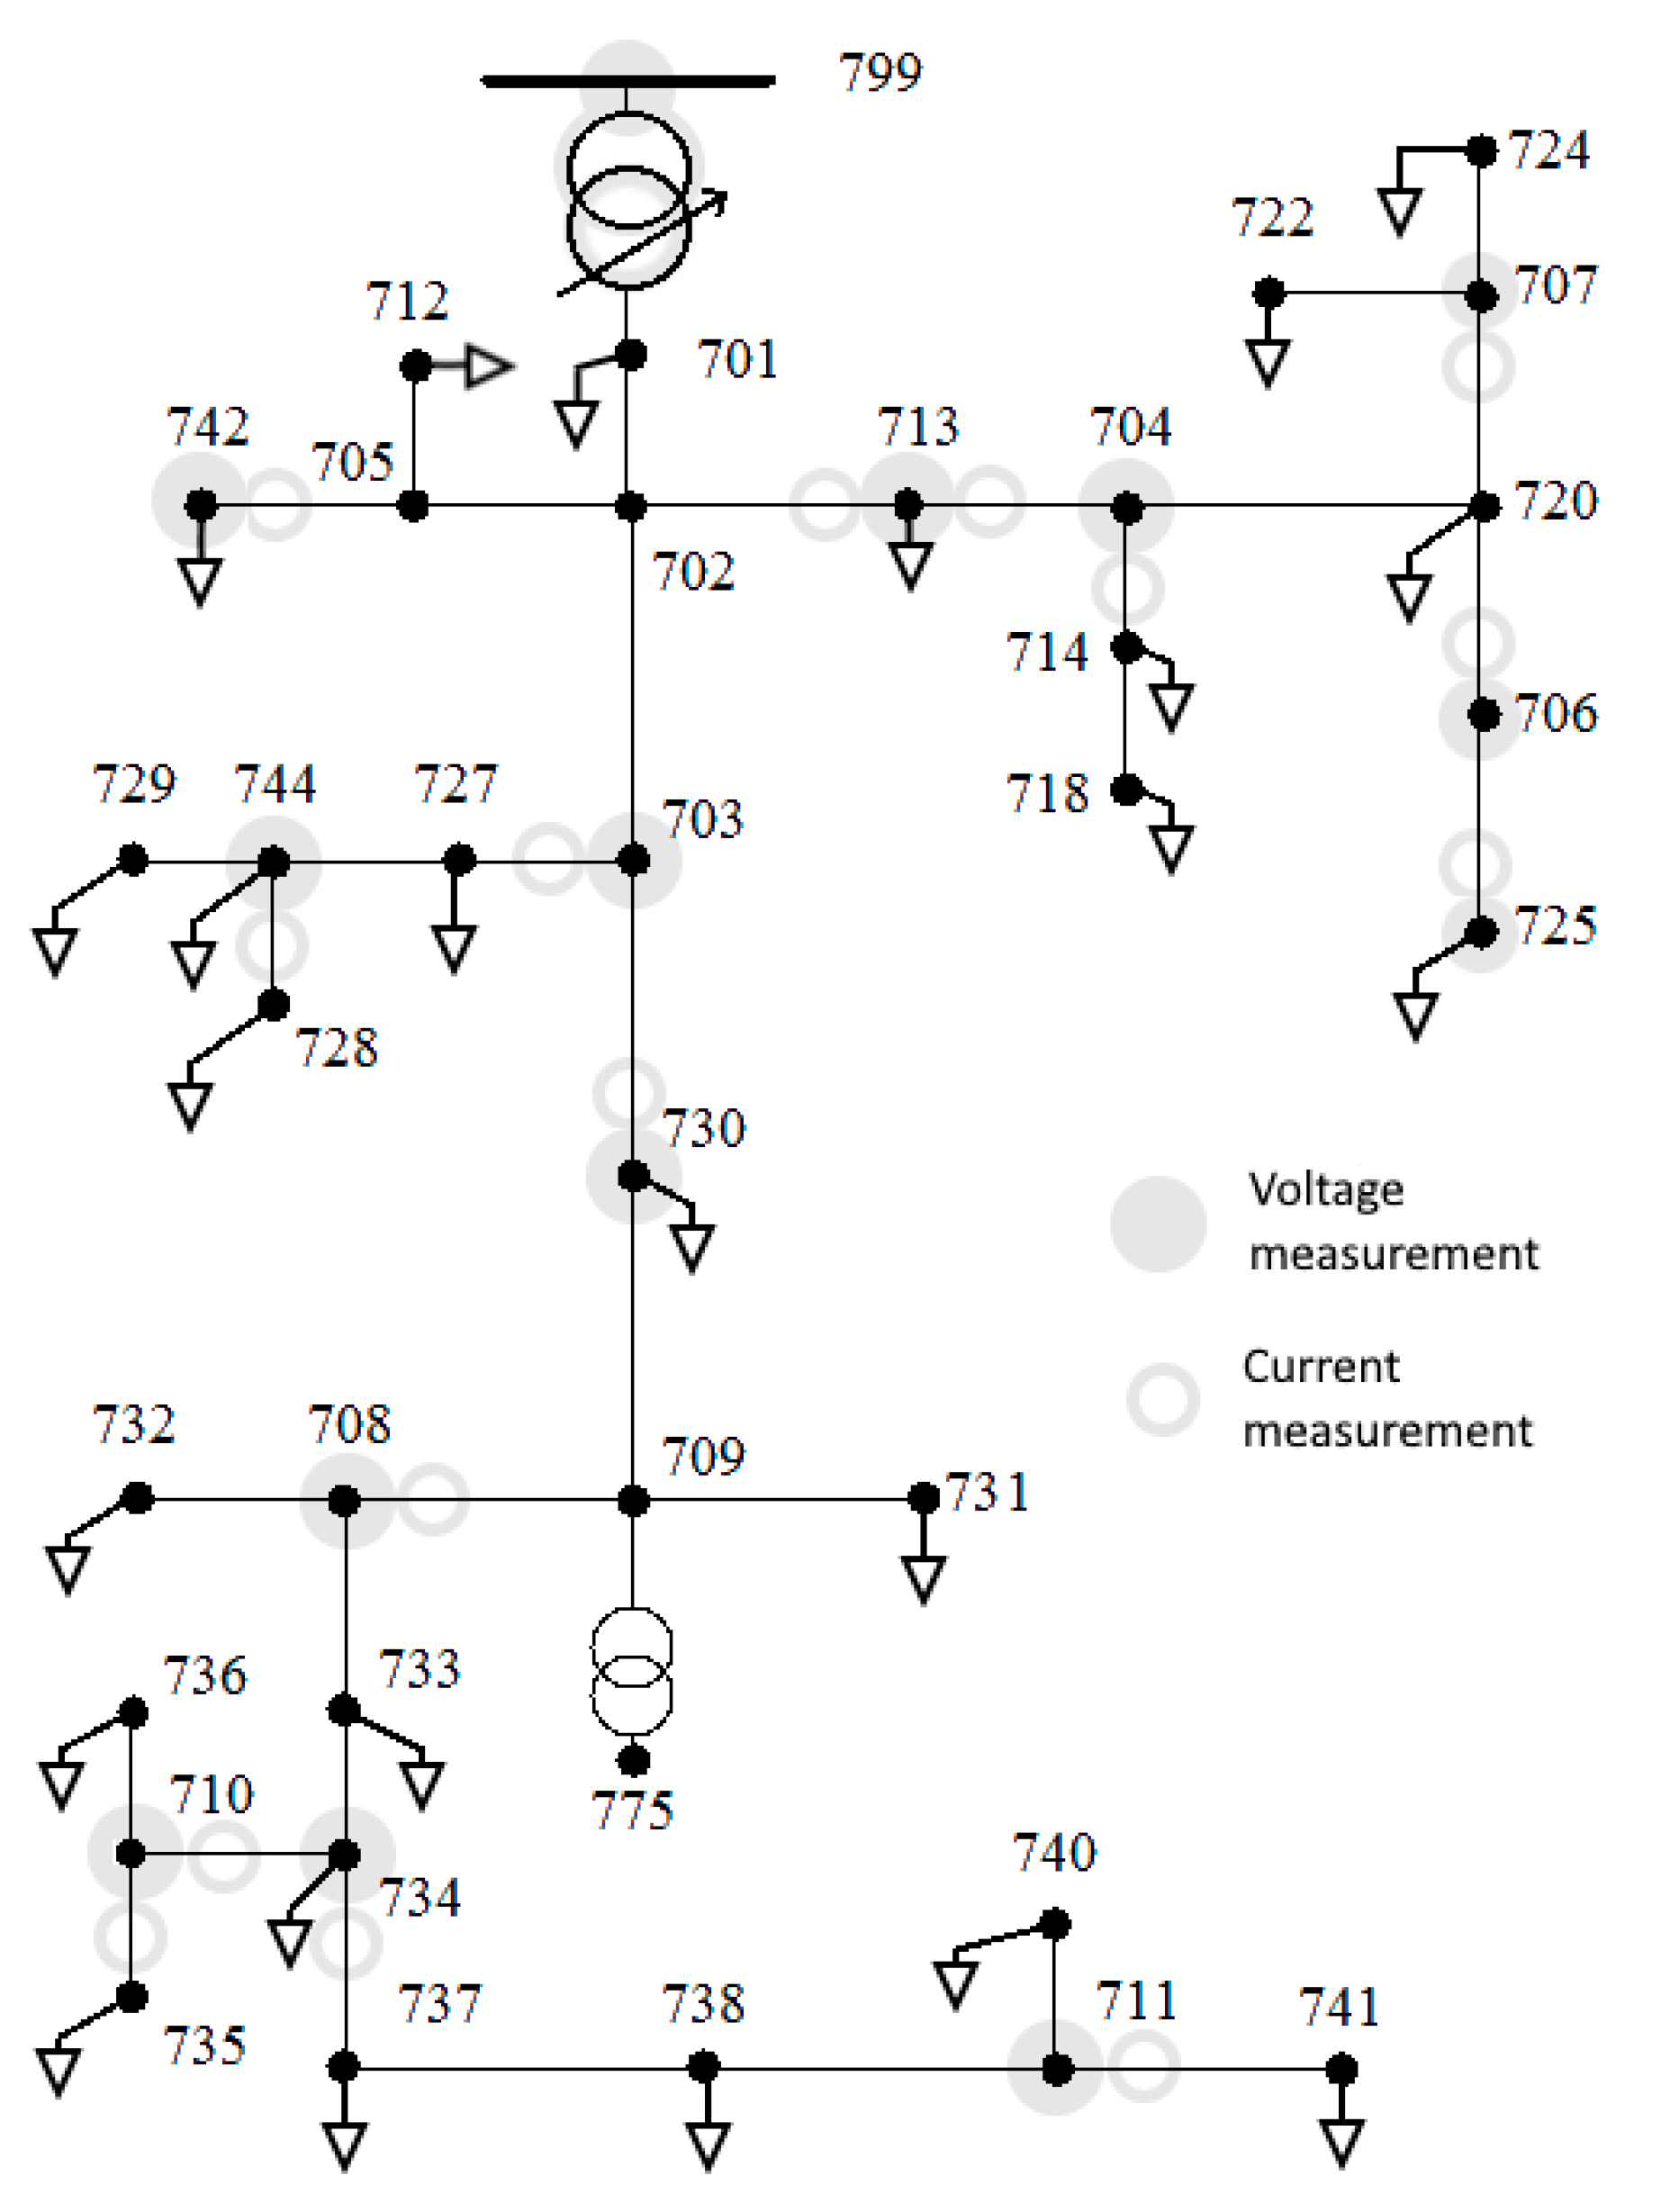
3.1. Application to the IEEE 37-Node Test Feeder

The feeder is considered as an example of a complex radial distribution grid. In method 1, the grid is represented in the form of a graph. The graph contains each grid element, i.e., lines, transformers, loads, etc. Due to the radial structure, a graph is a form of a tree with one root and multiple branches. The root of the graph represents the main supply which is HV/MV substation in the case. Full observability is achieved by 26 m which monitor the elements shown in Figure 2a. When an element is chosen for monitoring, measurement of the voltage in the upstream node and current in the element’s branch is required. The meter should also provide other parameters which enable PQ assessment. Therefore, the installation of a PQ meter is required. The method prefers monitoring lines overloads in the proximity of the main supply point. It is related to rule 3 of the method, which maximizes observability.
The source papers leave some implementation choices to the user. It involves a situation when weighting factors are equal. The situation may be shared in radial networks similar to the test feeder, especially when the application of rule 1 is considered. Therefore, the implementation according to [23,24] may yield different results. It is still acceptable provided that the final result is nearly optimal and applicable in practice.
Method 2 requires two stages of computation. In Stage 1 (the index method) 11 nodes are selected. In Stage 2, two extra nodes are added to these found in Stage 1. Stage 2 of the method requires solving the optimization problem using a heuristic algorithm. In this paper, a GA is used instead of BPSO proposed in [38]. Finally, the method selects 13 nodes for voltage monitoring.
It is worth to note that the current measurement is not considered by the method. The method requires the only measurement of voltages phasors. However, to achieve full observability, also currents of loads should be monitored, which involves an extra 25 m. The final result is visualized in Figure 2b.
Method 3 considers voltage and current metering separately. This results with the highest number of combinations to check. For the test feeder, it gives 71 possible voltage and current metering options. It is worth to note that constraints and fitness function defined in [36] do not yield a unique solution. Instead, several solutions (optimal in the sense of the method) exist, and a heuristic algorithm usually finds only one of them. Solution found by the implementation of GA for the purpose of this paper is presented in Figure 3. It is expected that the utilization of a different heuristic algorithm may yield a different result.
Figure 3 shows that full observability is achieved by voltage metering in 14 nodes and current metering in 16 branches. Harmonic SE requires load current metering, which adds extra 25 m, resulting in 41 m in total. Usually, the current measurement is done in a branch connected to the node with voltage measurement. There are nodes with two branches selected for current monitoring, e.g., node 713 and 710. The situation enables utilization of multi-channel meters if such units are available. It can further decrease the total number of needed meters. Multi-channel metering can also be enabled by modification of the cost function.
In [36], the optimization problem has been classified as linear programming. However, the problem contains constraints in the form of a highly nonlinear function without analytical form. It makes utilization of typical algorithms used for linear programming impossible. To solve the issue, the optimization problem can be redefined by introducing a nonlinear fitness function similar to the one in Method 2. It changes the problem to a nonlinear one and limits further the choice of solving algorithms. Among the selected methods, this one is the most computationally demanding.

3.2. Application to Others IEEE Test Feeders

Two additional IEEE test feeders have also been used. Results of the application are presented in Figure 4 and Figure 5. For the IEEE 13-node feeder method 1 selects 9 elements to monitor, method 2 selects 6 nodes for voltage metering, method 3 selects 4 nodes and corresponding branches for voltage and current metering, respectively. Methods 2 and 3 also require load metering, so the total number of meters should be increased by 9.
For the IEEE 34-node feeder method 1 selects 28 elements to monitor, method 2 selects 12 nodes for voltage metering, method 3 selects 16 nodes for voltage metering and 18 branches for current metering. Since the implementation considers single-channel meters only, a single meter measures voltages in one node and currents in one branch, the final number of meters selected by the method is 18. Methods 2 and 3 also require load metering, so the total number of meters should be increased by 23.

3.3. Application to a Typical MV Distribution Feeder

In order to test the performance of the methods in a real-world case, a typical MV feeder has been selected. Effect of application of Method 1 is presented in Figure 6a. Total observability of the system is provided by 10 m. The elements selected for monitoring are in grey. When a line is selected for monitoring, it involves measuring voltage in the upstream node and measurement of the line currents. The monitoring of a load involves measuring the transformer’s secondary side’s voltage and the total transformer current.
Figure 6a also shows the position in the ranking. Smaller numbers indicate the more important elements to monitor which is equivalent to high priority to install a meter. The method can be extended to include preinstalled meters.
Effect of application Method 2 is shown in Figure 6b. The method places four voltage phasor meters in nodes marked with grey circles. The solution is found in Stage 1, so there is no need to apply a numerical optimization procedure. To achieve total observability, also currents of all loads should be measured. If preinstalled meters can be used for this task, the number of meters increases by 5, yielding 9 m in total.
Method 3 considers voltage and current metering separately. There are 20 options for metering voltage and current. The method heavily relies on the numerical optimization procedure and also a formulation of the cost function. Due to the low number of combinations, both GA and CE algorithm has been tested. The application of CE has been found that observability is achieved by 3 m, which can be placed in 16 different configurations. The solution found both by CE and GA is shown in Figure 6c. Nodes selected for voltage monitoring are marked with grey circles, branches selected for current monitoring are marked with grey rings. Loads also should be monitored, which involves an extra 5 m, provided that preinstalled meters can be utilized.

4. Discussion

Summary of the results is presented in Table 1. The utilization of the described methods in order to find metering points for PQ assessment is possible, but the performance of the methods varies highly. Direct comparison of the total meter numbers required to achieve full observability yields, that for a complex, tree-like grid, Method 1 results in the smallest number of meters. However, for a simple feeder, the performance is almost equal. Method 1 may still be preferred due to the number of meters without utilizing the preinstalled ones. Load metering is required for Method 2 and 3 and increases the number of meters by 25 for the complex grid. If we drop the requirement, Method 2 will be superior yielding only 13 m. A similar situation occurs for the second test grid. The difference in the final results (10 m to 13 m) arises from the observability analysis. The ability to use the existing metering infrastructure is another difference between methods.
It is worth noting that the final result of method 3 for IEEE 34-node and IEEE 37-node feeders yields the same number of meters. It is related to the topology of the grid but may also reveal issues with the cost function.
Observability analysis is the crucial factor which differentiates the presented methods. The methods rely on SE framework and use a typical state definition. Observability in the meaning of SE is often defined as the possibility to compute voltages and currents based on typical measurements and general knowledge of the grid topology and parameters. Observability is usually ensured by testing Kirchhoff’s laws or by analysis of topology. Usual state definition involving voltage and current phasors is not necessarily related to PQ parameters except the voltage variations. PQ analysis also involves the assessment of harmonics level and total harmonic distortion, flicker, and asymmetry coefficients.
On the other hand, voltage drop in a given point of the system is related to the equivalent impedance. The impedance is a common coupling factor for the propagation of any voltage disturbance. Consequently, it is not clear how the definition of observability affects the PQ assessment in the grid. Definition of observability in the context of PQ assessment should be further reworked.
Practical limitations, including technical or organisational limitations, also add an additional level of complexity to the optimization procedure. Such issues are not usually included in a typical analysis. It must be concluded that there are different requirements for a method applicable in the real-world grid and for theoretical analysis. The former should result in a metering system easy and cheap to implement and maintain. For the latter, the solution has to be consistent with all constraints and prerequisites defined under the method’s framework.

5. Conclusions

The research allows drawing some general conclusions. The majority of existing methods have been developed for other purposes than PQ assessment. Extension to PQ metering is still possible but maybe not straightforward.
In the context of PQ measurements, there still exist some knowledge gaps associated with:
  • the definition of the state and the state vector,
  • observability analysis.
It has also been noted that the method described allows for different implementations which may yield different results for the same case. The abovementioned issues need further development and clarification.
For distribution grids with a relatively simple structure—i.e., one main feeder with a few short lateral branches—a right approach is to install meters in points of connection of loads, starting from ones sensitive to voltage disturbances or emitting excessive disturbances. Continuous PQ metering in the points would be necessary for keeping voltage quality and would be useful in customer complaints.
For distribution systems with the complex tree-like structure, it should be necessary to apply an analytical method. Method 1 can be utilized due to its original purpose. However, some method properties have to be taken into account—e.g., the relatively significant number of meters to achieve total observability or tendency to select branches instead of loads in the proximity of the main supply node (HV/LV substation).

Author Contributions

Conceptualization, K.P., M.D., S.B., A.F., K.C. and Z.H.; methodology, K.P., M.D., S.B., A.F., K.C. and Z.H.; writing—original draft, K.P.; writing—review and editing, M.D., S.B., K.C., A.F. and Z.H.; supervision, Z.H.; project administration, K.C.; funding acquisition, A.F. All authors have read and agreed to the published version of the manuscript.

Funding

The research has been carried out under the project “The propagation assessment and power quality parameters improvement system in power distribution grids—SOPJEE”, implemented under the “PBSE” Power Sector Research Program No. POIR.01.02.00-00-0203/16-00—The National Centre for Research and Development.

Institutional Review Board Statement

Not applicable.

Informed Consent Statement

Not applicable.

Data Availability Statement

Not applicable.

Conflicts of Interest

The authors declare no conflict of interest.

Abbreviations

AHPAnalytic Hierarchy Process
ASEAdaptive State Optimization
BILPBinary Integer Linear Programming
BPSOBinary Particle Swarm Optimization
CEComplete Enumeration
CEERCouncil of European Energy Regulators
CIGREInternational Council on Large Electric Systems
DSODistribution System Operator
FDFault Detection
GAGenetic Algorithm
HSEHarmonic State Estimation
HVHigh Voltage
LVLow Voltage
MRAMeter Reach Area
MVMedium Voltage
PFPower Flow
PMUPhasor Measurement Unit
PSOParticle Swarm Optimization
PQPower Quality
RMSERoot Mean Squared Error
SEState Estimation
SVDSingular Value Decomposition
TMRATopological Meter Reach Area

References

  1. Chen, Y.; Zhang, Y.; Wang, J.; Lu, Z. Optimal operation for integrated electricity–heat system with improved heat pump and storage model to enhance local energy utilization. Energies 2020, 13, 6729. [Google Scholar] [CrossRef]
  2. Zhang, M.; Wu, Q.; Wen, J.; Lin, Z.; Fang, F.; Chen, Q. Optimal operation of integrated electricity and heat system: A review of modeling and solution methods. Renew. Sustain. Energy Rev. 2021, 135, 110098. [Google Scholar] [CrossRef]
  3. Piatek, K.; Firlit, A.; Chmielowiec, K.; Dutka, M.; Barczentewicz, S.; Hanzelka, Z. Optimal Selection of Metering Points for Power Quality Measurements in Distribution System. In Proceedings of the 12th International Conference and Exhibition on Electrical Power Quality and Utilisation (EPQU), Kraków, Poland, 14–15 September 2020. [Google Scholar]
  4. Gomez-Gonzalez, M.; Hernandez, J.; Vera, D.; Jurado, F. Optimal sizing and power schedule in PV household-prosumers for improving PV self-consumption and providing frequency containment reserve. Energy 2020, 191, 116554. [Google Scholar] [CrossRef]
  5. Hernandez, J.C.; Sanchez-Sutil, F.; Munoz-Rodriguez, F.J.; Baier, C.R. Optimal sizing and management strategy for PV household-prosumers with self-consumption/sufficiency enhancement and provision of frequency containment reserve. Appl. Energy 2020, 277, 115529. [Google Scholar] [CrossRef]
  6. Hernandez, J.C.; Sanchez-Sutil, F.; Munoz-Rodriguez, F.J. Design criteria for the optimal sizing of a hybrid energy storage system in PV household-prosumers to maximize self-consumption and self-sufficiency. Energy 2019, 186, 115827. [Google Scholar] [CrossRef]
  7. Kilter, J. Guidelines for Power Quality Monitoring—Results from CIGRE/CIRED JWG C4.112. In Proceedings of the 16th International Conference on Harmonics and Quality of Power (ICHQP), Bucharest, Romania, 25–28 May 2014. [Google Scholar]
  8. Bollen, M.H.J. CIGRE/CIRED JWG C4.112—Power Quality Monitoring. In Proceedings of the International Conference on Renewable Energies and Power Quality (ICREPQ), Cordoba, Spain, 8–10 April 2014. [Google Scholar]
  9. Guidelines of Good Practice on the Implementation and Use of Voltage Quality Monitoring Systems for Regulatory Purposes. Council of European Energy Regulators (CEER), Energy Community Regulatory Board. Available online: https://www.ceer.eu/documents/104400/-/-/bdd2c6cb-5ccf-b342-2728-3e6c38536daf (accessed on 22 January 2021).
  10. Ahmad, M. Power System State Estimation; Artech House: Boston, MA, USA, 2013. [Google Scholar]
  11. Muscas, C.; Pilo, F.; Pisano, G.; Sulis, S. Optimal Allocation of Multichannel Measurement Devices for Distribution State Estimation. IEEE Trans. Instrum. Meas. 2009, 58, 1929–1937. [Google Scholar] [CrossRef]
  12. Muscas, C.; Pilo, F.; Pisano, G.; Sulis, S. Optimal Placement of Measurement Devices in Electric Distribution Systems. In Proceedings of the IEEE Instrumentation and Measurement Technology Conference (IMTC), Sorrento, Italy, 24–27 April 2006. [Google Scholar]
  13. Liu, J.; Ponci, F.; Monti, A.; Muscas, C.; Pegoraro, P.A.; Sulis, S. Optimal Placement for Robust Distributed Measurement Systems in Active Distribution Grids. In Proceedings of the IEEE International Instrumentation and Measurement Technology Conference (I2MTC), Minneapolis, MN, USA, 6–9 May 2013. [Google Scholar]
  14. Abur, A.; Magnago, F.H. Optimal Meter Placement against Contingencies. In Proceedings of the IEEE Power Engineering Society Summer Meeting, Vancouver, BC, Canada, 24–27 April 2001. [Google Scholar]
  15. Baran, M.E.; Zhu, J.; Zhu, H.; Garren, K.E. A meter placement method for state estimation. IEEE Trans. Power Syst. 1995, 10, 1704–1710. [Google Scholar] [CrossRef]
  16. Chen, X.; Lin, J.; Wan, C.; Song, Y.; You, S.; Zong, Y.; Guo, W.; Li, Y. Optimal Meter Placement for Distribution Network State Estimation: A Circuit Representation Based MILP Approach. IEEE Trans. Power Syst. 2016, 31, 4357–4370. [Google Scholar] [CrossRef]
  17. Prasad, S.; Kumar, D.M.V. Optimal Allocation of Measurement Devices for Distribution State Estimation Using Multiobjective Hybrid PSO—Krill Herd Algorithm. IEEE Trans. Instrum. Meas. 2017, 66, 2022–2035. [Google Scholar] [CrossRef]
  18. Singh, R.; Pal, B.C.; Jabr, R.A.; Vinter, R.B. Meter Placement for Distribution System State Estimation: An Ordinal Optimization Approach. IEEE Trans. Power Syst. 2011, 26, 2328–2335. [Google Scholar] [CrossRef]
  19. Milbradt, R.G.; Canha, L.N.; Zorrilla, P.B.; Abaide, A.R.; Pereira, P.R.; Schmaedecke, S.M. A Multicriteria Approach for Meter Placement in Distribution Systems. In Proceedings of the 10th Int. Conf. the European Energy Market (EEM), Stockholm, Sweden, 27–31 May 2013. [Google Scholar]
  20. Buscher, M.; Lehnhoff, S.; Rohjans, S. Optimized Allocation of Measurement Points in Under-Determined Power Syst. In Proceedings of the IEEE Int. Energy Conf. (ENERGYCON), Leuven, Belgium, 4–8 April 2016. [Google Scholar]
  21. Yu, D.C.; Liu, H.; Chiang, H.D. A Heuristic Meter Placement Method for Load Estimation. IEEE Power Eng. Rev. 2002, 22, 913–917. [Google Scholar] [CrossRef]
  22. Divsheli, P.H.; Ghadiri, H.; Hesaminia, A.H.; Amini, B. A Novel Approach for Meter Placement for Load Estimation in Radial Distribution Networks. In Proceedings of the Third International Conference Electric Utility Deregulation and Restructuring and Power Technologies (DRPT), Nanjing, China, 6–9 April 2008. [Google Scholar]
  23. Won, D.-J.; Moon, S.-I. Optimal number and locations of power quality monitors considering system topology. IEEE Tran. Power Deliv. 2008, 23, 288–295. [Google Scholar] [CrossRef]
  24. Xie, Z.; Yu, Z.; Weng, G.; Wang, Q. Research on Allocation Optimization for Power Quality Monitors in Smart Distribution Grid. In Proceedings of the International Conference Power System Technology, Chengdu, China, 20–22 October 2014. [Google Scholar]
  25. Li, H. Optimal Number and Location of Power Quality Monitors for Power System. In Proceedings of the Chinese Automation Congress (CAC), Wuhan, China, 27–29 November 2015. [Google Scholar]
  26. Eldery, M.A.; El-Saadany, E.F.; Salama, M.M.A.; Vannelli, A. A novel power quality monitoring allocation algorithm. IEEE Trans. Power Deliv. 2006, 21, 768–777. [Google Scholar] [CrossRef]
  27. Freitas, A.F.; Amaral, F.V.; Silva, J.A.L.; Saldanha, R.R.; Silva, S.M. Optimum allocation of power quality monitors in electric Power Systems—A case study. In Proceedings of the 17th International Conference Harmonics and Quality of Power (ICHQP), Belo Horizonte, Brazil, 16–19 October 2016. [Google Scholar]
  28. Gou, B. Generalized Integer Linear Programming Formulation for Optimal PMU Placement. IEEE Trans. Power Syst. 2008, 23, 1099–1104. [Google Scholar] [CrossRef]
  29. Gou, B. Optimal Placement of PMUs by Integer Linear Programming. IEEE Trans. Power Syst. 2008, 23, 1525–1526. [Google Scholar] [CrossRef]
  30. Abbasy, N.H.; Ismail, H.M. A Unified Approach for the Optimal PMU Location for Power System State Estimation. IEEE Trans. Power Syst. 2009, 24, 806–813. [Google Scholar] [CrossRef]
  31. Aminifar, F.; Fotuhi-Firuzabad, M.; Shahidehpour, M.; Khodaei, A. Probabilistic Multistage PMU Placement in Electric Power Syst. IEEE Trans. Power Deliv. 2011, 26, 841–849. [Google Scholar] [CrossRef]
  32. Madtharad, C.; Premrudeepreechacharn, S.; Watson, N.R.; Saeng-Udom, R. An optimal measurement placement method for power system harmonic state estimation. IEEE Trans. Power Deliv. 2005, 20, 1514–1521. [Google Scholar] [CrossRef]
  33. Farach, J.E.; Grady, W.M.; Arapostathis, A. An optimal procedure for placing sensors and estimating the locations of harmonic sources in Power Syst. IEEE Trans. Power Deliv. 1993, 8, 1303–1310. [Google Scholar] [CrossRef]
  34. Rad, M.S.; Mokhtari, H.; Karimi, H. An Optimal Measurement Placement Method for Power System Harmonic State Estimation. In Proceedings of the International Conference and Exposition on Electrical and Power Engineering, Iasi, Romania, 25–27 October 2012. [Google Scholar]
  35. Kumar, A.; Das, B.; Sharma, J. Genetic algorithm-based meter placement for static estimation of harmonic sources. IEEE Trans. Power Deliv. 2005, 20, 1088–1096. [Google Scholar] [CrossRef]
  36. Almeida, C.F.M.; Kagan, N. Harmonic state estimation through optimal monitoring systems. IEEE Trans. Smart Grid 2013, 4, 467–478. [Google Scholar] [CrossRef]
  37. Almeida, C.F.M.; Kagan, N.; Souza, T.P.; Matsuo, N.M.; Duarte, S.X.; Neto, A.B.; Suematsu, A.K. Locating Power Quality Meters in Order to Perform Harmonic State Estimation. In Proceedings of the IEEE 15th International Conference Harmonics and Quality of Power (ICHQP), Hong Kong, China, 17–20 June 2012. [Google Scholar]
  38. Saxena, D.; Bhaumik, S.; Singh, S.N. Identification of Multiple Harmonic Sources in Power System Using Optimally Placed Voltage Measurement Devices. IEEE Trans. Ind. Electr. 2014, 61, 2483–2492. [Google Scholar] [CrossRef]
  39. Kumar, P.; Singh, A.K.; Singh, N. Fuzzy Expert System Based Power Quality Meter Placement. In Proceedings of the IEEE 15th International Conference Harmonics and Quality of Power (ICHQP), Hong Kong, China, 17–20 June 2012. [Google Scholar]
  40. Olguin, G.; Vuinovich, F.; Bollen, M.H.J. An optimal monitoring program for obtaining voltage sag system indexes. IEEE Trans. Power Syst. 2006, 21, 378–384. [Google Scholar] [CrossRef]
  41. Kempner, T.R.; Oleskovicz, M.; Santos, A.Q. Optimal Allocation of Monitors by Analyzing the Vulnerability Area against Voltage Sags. In Proceedings of the 16th International Conference on Harmonics and Quality of Power (ICHQP), Bucharest, Romania, 25–28 May 2014. [Google Scholar]
  42. Haghbin, M.; Farjah, E. Optimal Placement of Monitors in Transmission Systems Using Fuzzy Boundaries for Voltage Sag Assessment. In Proceedings of the IEEE Bucharest PowerTech, Bucharest, Romania, 28 June–2 July 2009. [Google Scholar]
  43. Ibrahim, A.A.; Mohamed, A.; Shareef, H.; Ghoshal, S.P. Optimal Placement of Voltage Sag Monitors Based on Monitor Reach area and Sag Severity Index. In Proceedings of the IEEE Student Conference on Research and Development (SCOReD), Putrajaya, Malaysia, 13–14 December 2010. [Google Scholar]
  44. Ibrahim, A.A.; Mohamed, A.; Shareef, H.; Ghoshal, S.P. A new approach for optimal power quality monitor placement in power system considering system topology. Przeglad Elektrotechniczny 2012, 88, 272–276. [Google Scholar]
  45. Cebrian, J.C.; Almeida, C.F.M.; Kagan, N. Genetic Algorithms Applied for the Optimal Allocation of Power Quality Monitors in Distribution Networks. In Proceedings of the 14th International Conference on Harmonics and Quality of Power (ICHQP), Bergamo, Italy, 26–29 September 2010. [Google Scholar]
  46. Farzanehrafat, A.; Watson, N.R. Review of Power Quality State Estimation. In Proceedings of the 20th Australasian Universities Power Engineering Conference, Christchurch, New Zealand, 5–8 December 2010. [Google Scholar]
  47. Farzanehrafat, A.; Watson, N.R. Power Quality State Estimator for Smart Distribution Grids. IEEE Trans. Power Syst. 2013, 28, 2183–2191. [Google Scholar] [CrossRef]
  48. Kersting, W.H. Radial distribution test feeders. IEEE Trans. Power Syst. 1991, 6, 975–985. [Google Scholar] [CrossRef]
  49. Mwakabuta, N.; Sekar, A. Comparative Study of the IEEE 34 Node Test Feeder under Practical Simplifications. In Proceedings of the 9th North American Power Symposium, Las Cruces, 30 September–2 October 2007. [Google Scholar]
Figure 1. Schematic diagram of the test grids: (a) IEEE 37-node test feeder; (b) a typical MV feeder in an urban area.
Energies 14 01202 g001
Figure 2. Measurement locations selected by the discussed methods: (a) elements selected by the method 1; (b) nodes selected to monitor by method 2.
Energies 14 01202 g002
Figure 3. Nodes and branches selected for metering by Method 3.
Energies 14 01202 g003
Figure 4. Application results to IEEE 13-node test feeder: (a) elements selected by the Method 1; (b) nodes selected to monitor by Method 2; (c) nodes for voltage metering and branches for current metering selected by Method 3.
Energies 14 01202 g004
Figure 5. Application results to IEEE 34-node test feeder: (a) elements selected by the Method 1; (b) nodes selected to monitor by Method 2; (c) nodes for voltage metering and branches for current metering selected by Method 3.
Energies 14 01202 g005
Figure 6. Results of the method applied to a typical feeder in an urban area: (a) elements selected by the Method 1; (b) nodes selected to monitor by Method 2; (c) nodes for voltage metering and branches for current metering selected by Method 3.
Energies 14 01202 g006
Table 1. Summary of results obtained by application of the selected methods to the test grids.
Method 1Method 2Method 3
MV feeder (Simple grid)8 m
(10 m 1)
9 m
(14 m 1)
8 m
(13 m 1)
IEEE 13-node9 m15 m
(6 m 2)
13 m
(4 m 2)
IEEE 34-node28 m35 m
(12 m 2)
41 m
(18 m 2)
IEEE 37-node
(Complex grid)
26 m38 m
(13 m 2)
41 m
(16 m 2)
1 without the preinstalled meters; 2 selected directly by the method, without the required load metering.
Publisher’s Note: MDPI stays neutral with regard to jurisdictional claims in published maps and institutional affiliations.

