
Analysis and Experimental Verification of a Variable Speed Turbo Air Centrifugal Compressor System for Energy Saving


High Power Electric Propulsion Center, Korea Maine Equipment Research Institute, Ulsan 44776, Korea
*
Author to whom correspondence should be addressed.
Energies 2021, 14(4), 1208; https://0-doi-org.brum.beds.ac.uk/10.3390/en14041208
Submission received: 28 January 2021
/
Revised: 19 February 2021
/
Accepted: 19 February 2021
/
Published: 23 February 2021
(This article belongs to the Section F: Electrical Engineering)
Abstract
:Conventional constant speed turbo air centrifugal compressor systems (TACCSs) consist of an electric motor driven at the constant speed and an inlet guide vane (IGV) for pressure control. TACCSs with an inverter for a variable speed drive (VSD) of the electric motor are more efficient than the conventional constant speed TACCS because they have a wide operating range and can minimize the power consumption. Therefore, this paper proposes a quadratic V/f control and VSD to reduce electrical and mechanical energy losses. To verify the energy saving effect of the TACCS with the proposed controls, this paper analyzes the performances of an electric motor drive system (EMDS) using the proposed quadratic V/f control considering load conditions of the turbo air centrifugal compressor (TACC) to reduce electrical energy losses. Furthermore, the performances of the conventional constant speed drive (CSD) using the IGV control and the proposed VSD were compared and analyzed in the test bench that represented an actual factory environment. As a result, the proposed quadratic V/f control and VSD experimentally verified energy savings of 4.44% and 23.37% compared to conventional controls. In addition, the economic feasibility of the proposed VSD was verified in the TACCS by analyzing the recovery period of the initial investment due to the addition of the inverter.
1. Introduction
With urgent demands for high efficiency policies, compressors are being developed to be large in scale, high in speed, and automatic in operation [1]. In particular, a variable speed drive (VSD) of air compressors has seen rapid growth in the last few decades. Air compressors are classified as positive displacement air compressors (PDACs) and turbo air compressors (TACs) according to the compression method [2,3,4]. PDACs use a method of increasing the pressure by reducing the volume of the space where air exists and are suitable for sites where high-pressure ratios and a relatively small capacity are required. TACs use a method of converting speed energy into pressure energy using rotating bodies and are suitable for large capacity compressors with relatively high air flow rates instead of low-pressure ratios [5].
TACs are classified into axial compressors and centrifugal compressors according to the process flow [5]. The air flow of axial air compressors with process flow parallel to the shaft centerline is accelerated in an axial and peripheral direction by the rotation of blades. The air flow of centrifugal compressors with a diffuser that converts velocity from axial to radial direction into pressure is accelerated by the rapidly rotating impeller [6,7,8,9,10,11].
To improve the operating efficiency and the pressure ratios, turbo air centrifugal compressors (TACCs) designed with a multi-stage impeller are widely used. However, they have a narrow operating range to avoid surge [12,13]. The conventional turbo air centrifugal compressor system (TACCS), including the multi-stage impeller, consists of an electric motor for the power transmission and an inlet guide vane (IGV) for the pressure control. Although a precise pressure control is possible using an IGV control, electrical and mechanical energy losses are large due to a constant speed drive (CSD) [14]. Energy losses and the narrow operating range due to the CSD can be minimized and widened by adding an inverter for a variable speed drive (VSD) of the electric motor [15]. However, the addition of the inverter has the problem that the initial investment cost is higher than that of the conventional TACCS [16,17]. Therefore, this paper presents an energy saving effect and economic analysis results according to the use of the inverter. Two types of a quadratic V/f control and VSD are proposed to improve the energy saving effect of the TACCS.
In general, the torque of a TACC-driven electric motor is proportional to the square of speeds. For a conventional linear V/f control, since it has a low torque/current ratio at low speeds, the phase current magnitude of the electric motor increases, resulting in lower efficiency. For the proposed quadratic V/f control, it utilizes the parabolic relationship between a voltage magnitude and an operating frequency, resulting in a lower phase current magnitude and higher efficiency of the electric motor at low speeds [18,19]. The effectiveness of the proposed quadratic V/f control is proved through experimental results of the motor’s efficiency and the system’s efficiency using the torque-controlled load dynamometer considering the mechanical load characteristics of the TACCS.
To verify the energy saving effect by using the VSD in the TACCS, we derive and analyze the performance curves of the TACCS when the CSD using the IGV control and the VSD are, respectively, controlled. Then, the economic analysis is performed through the experimental results of the power consumptions, applying the profile considering the daily consumption air flow rate of the TACCS.
2. Configuration of TACCS
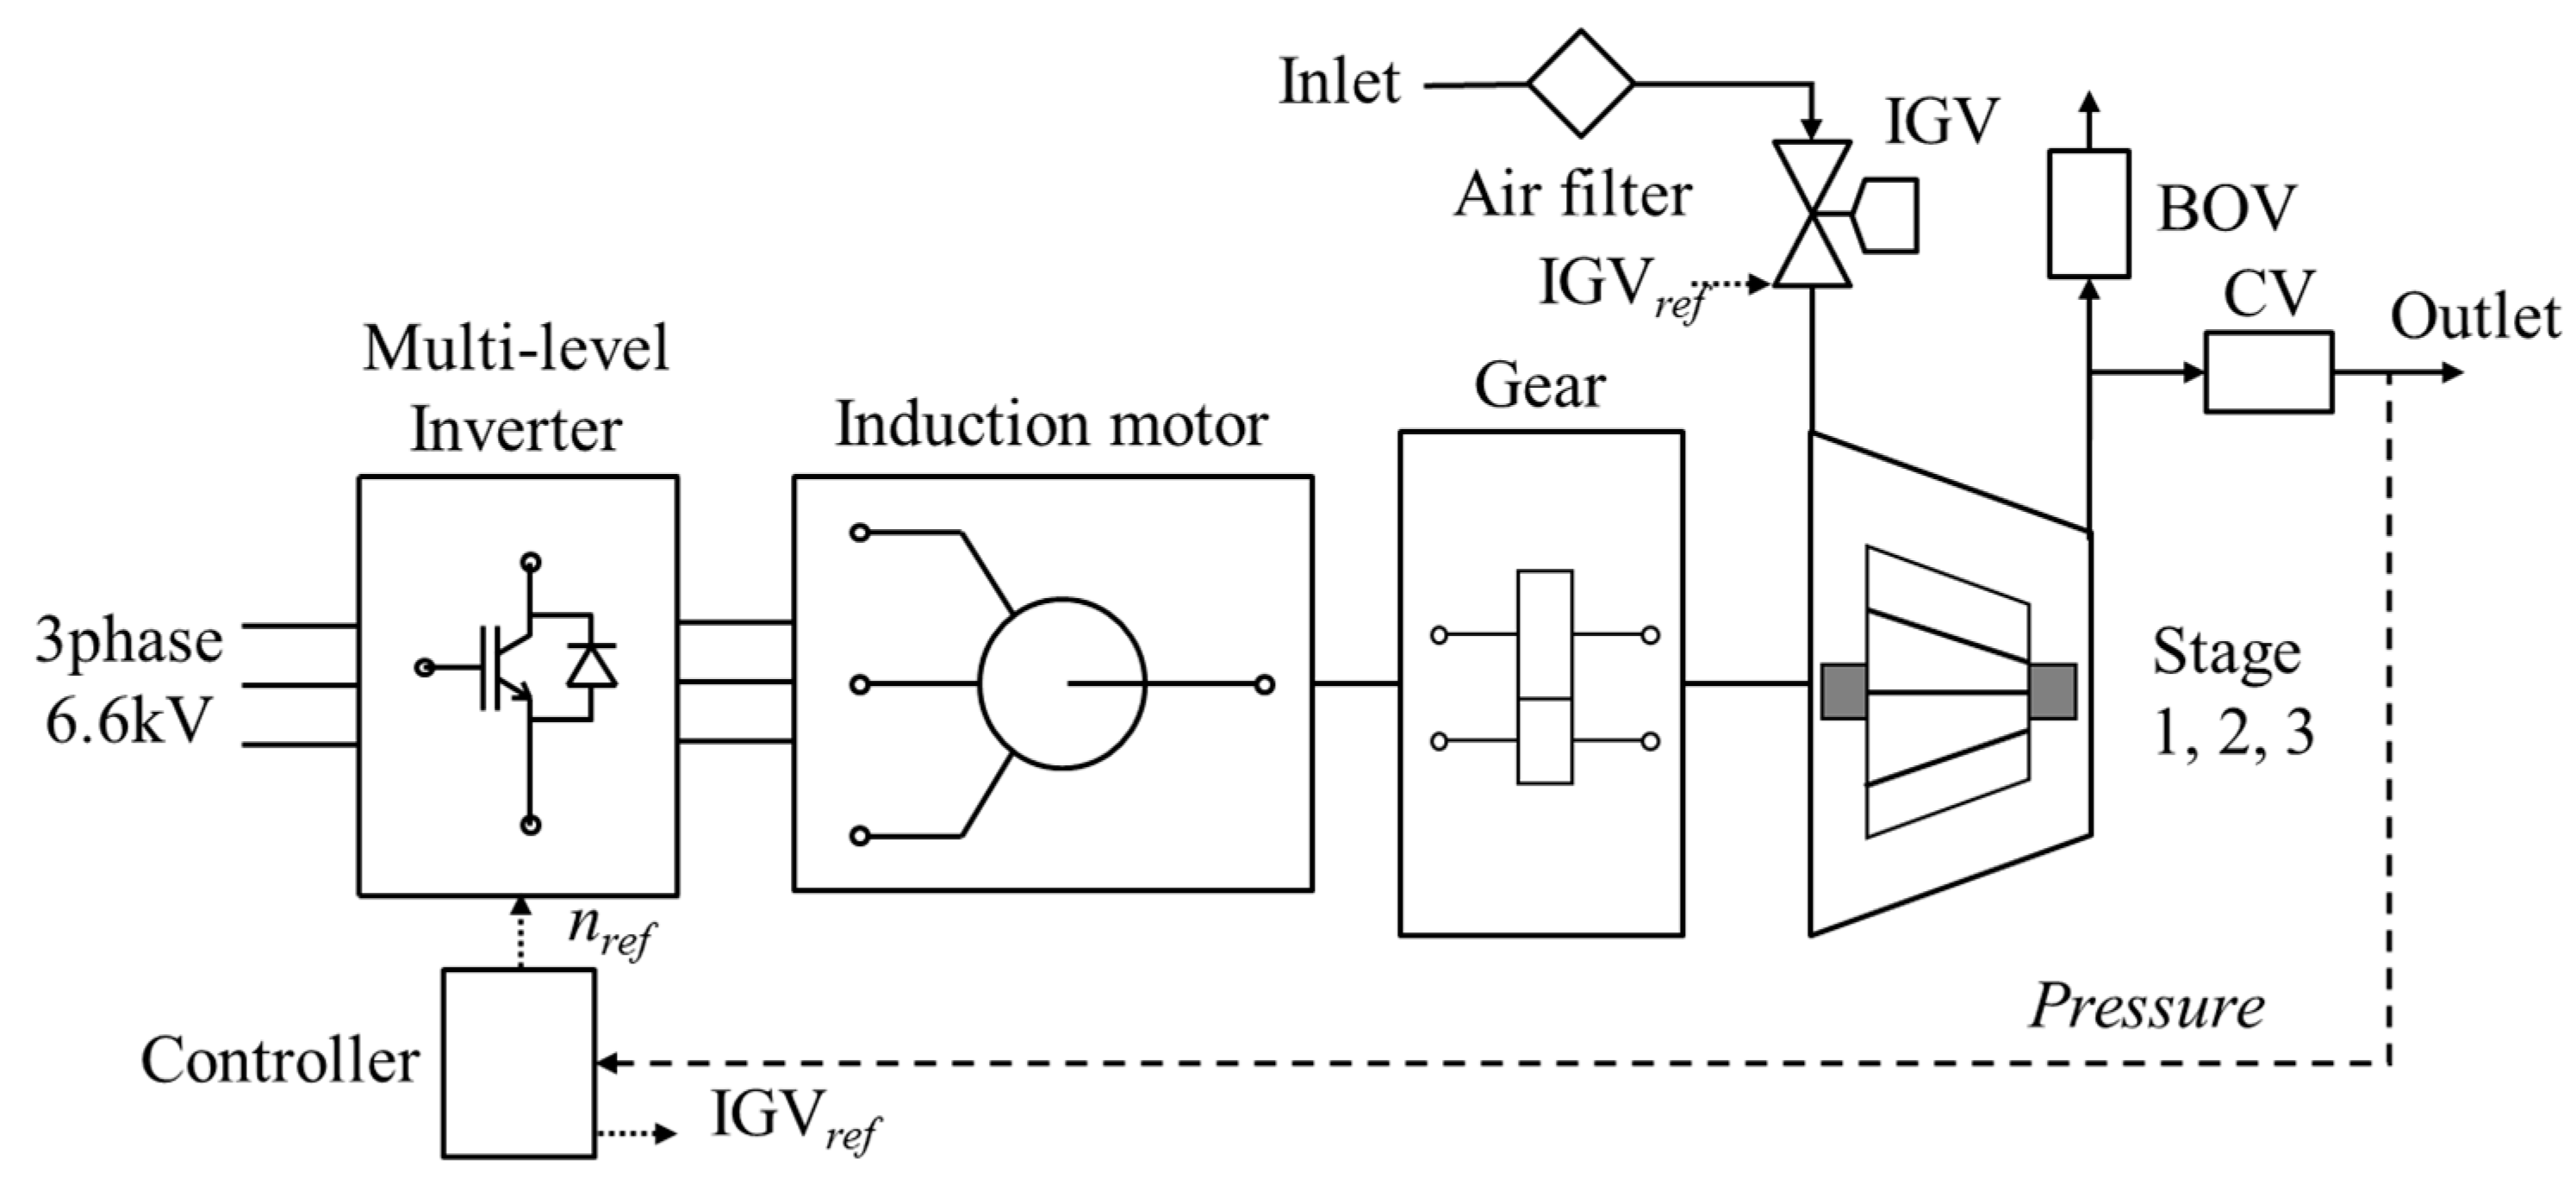
Figure 1 shows a block diagram of a TACCS. The TACCS is classified into a mechanical system and an electrical system. The mechanical system is the TACC composed of an air filter, a gear, the IGV, a blow of valve (BOV), a control valve (CV), and the multi-stage impellers. The electrical system is an electric motor drive system (EMDS), which consists of an induction motor, a multi-level inverter and a controller. Table 1 shows specifications of the TACCS consisting of the TACC, the electric motor, and the multi-level inverter. The 6.6 kV, 1500 KVA multi-level inverter based on TACC is used to validate the proposed controls.
3. Performance Analysis of EMDS and TACCS
3.1. Performance Analysis of EMDS
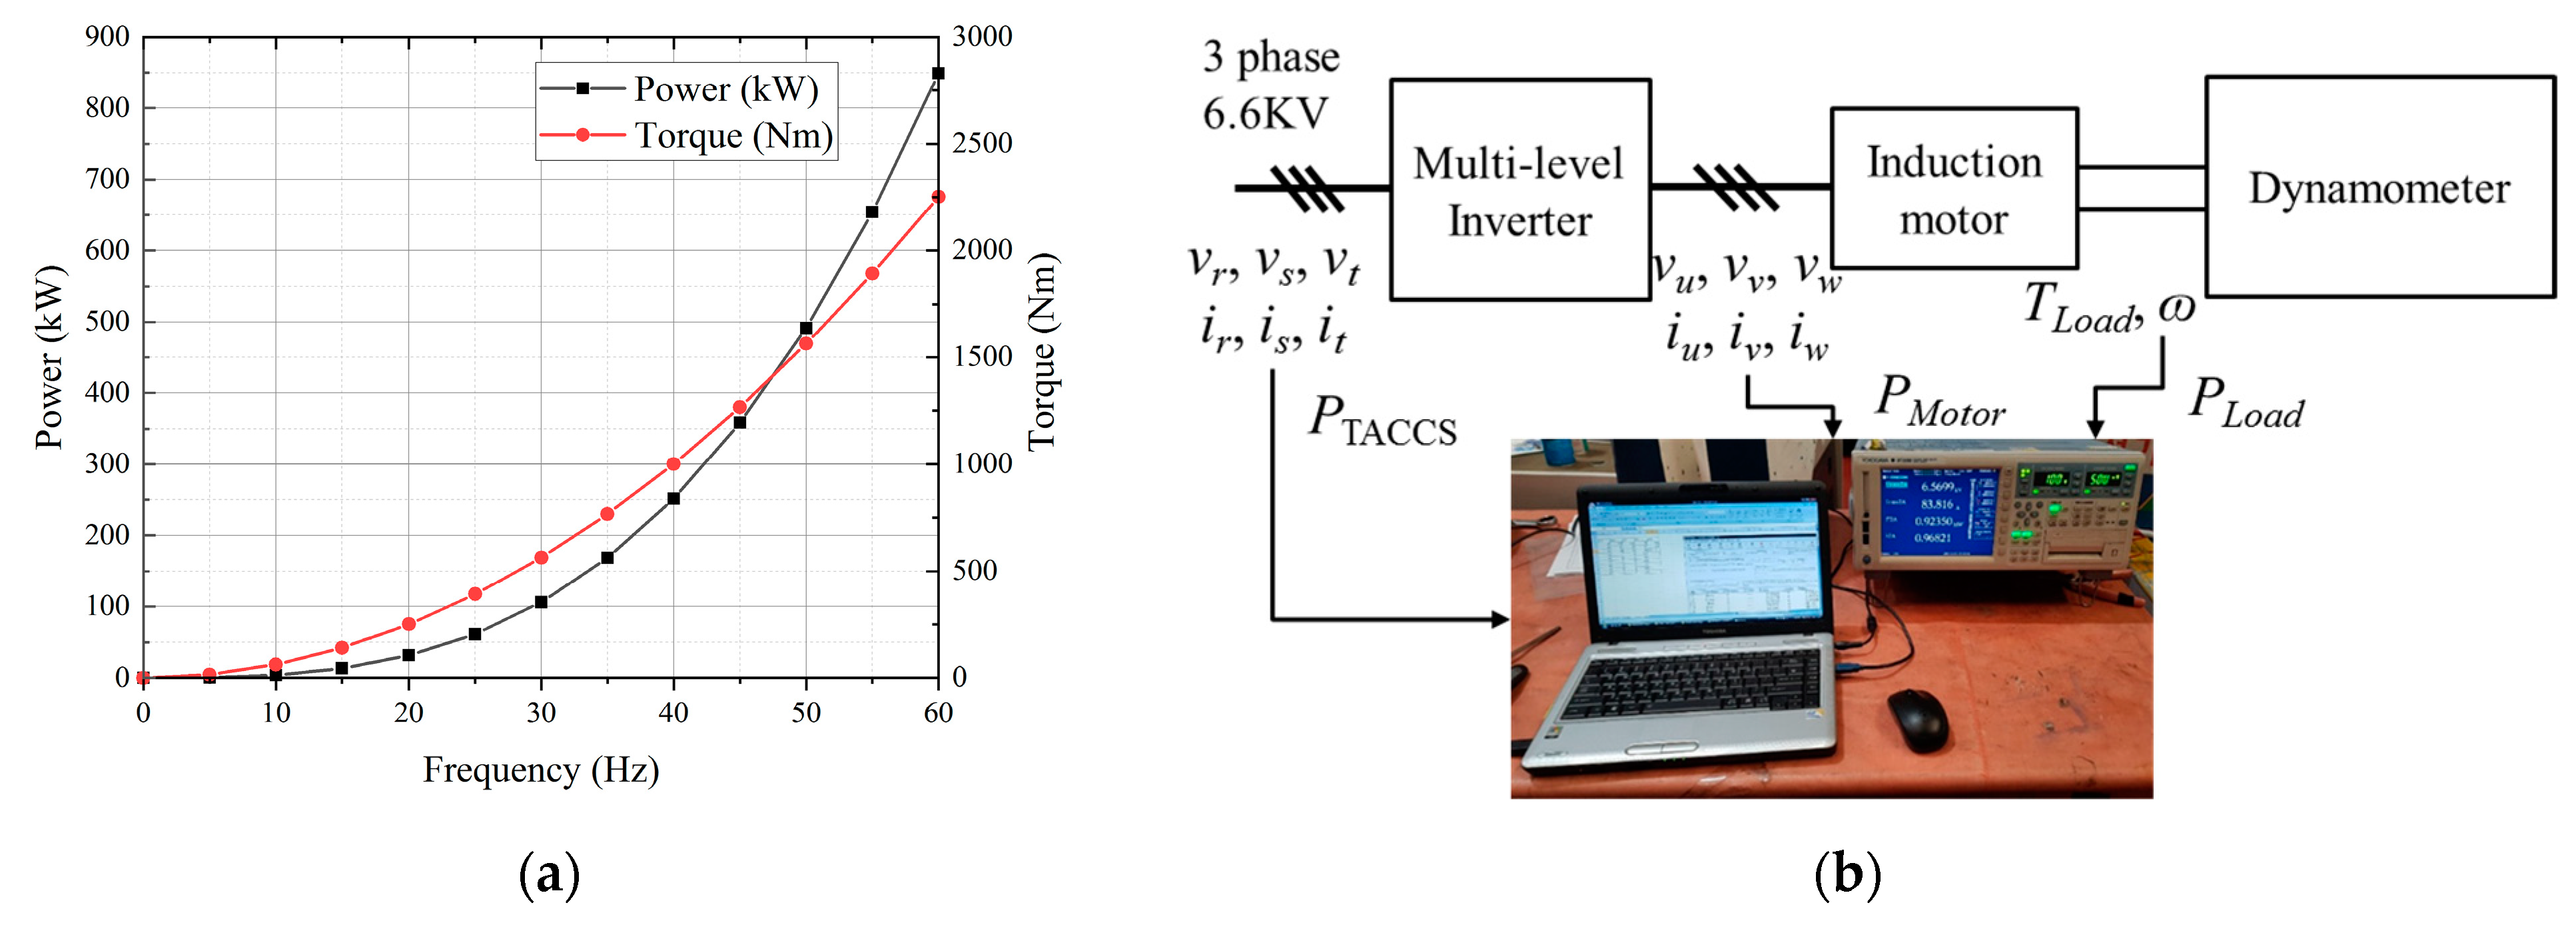
According to the TACC characteristics, load torque TLoad and mechanical power PLoad related to the speed can be expressed as follows:
where Kturbo is the TACC constant, and ω is the rotor rotation speed in rad/s. Figure 2a shows ideal load curves according to the specifications of the TACC as listed in Table 1. Figure 2b shows a diagram of the experimental configuration for a performance evaluation of the EMDS according to the load curves. The power consumption PTACCS of the TACCS and the power consumption PMotor of the electric motor were measured using a power analyzer. A dynamometer was used to control the load of the TACC according to the speeds.
TLoad = Kturbo ω2
PLoad = Kturbo ω3
The efficiency of motor ηmotor and the efficiency of the EMDS ηEMDS can be expressed as follows:
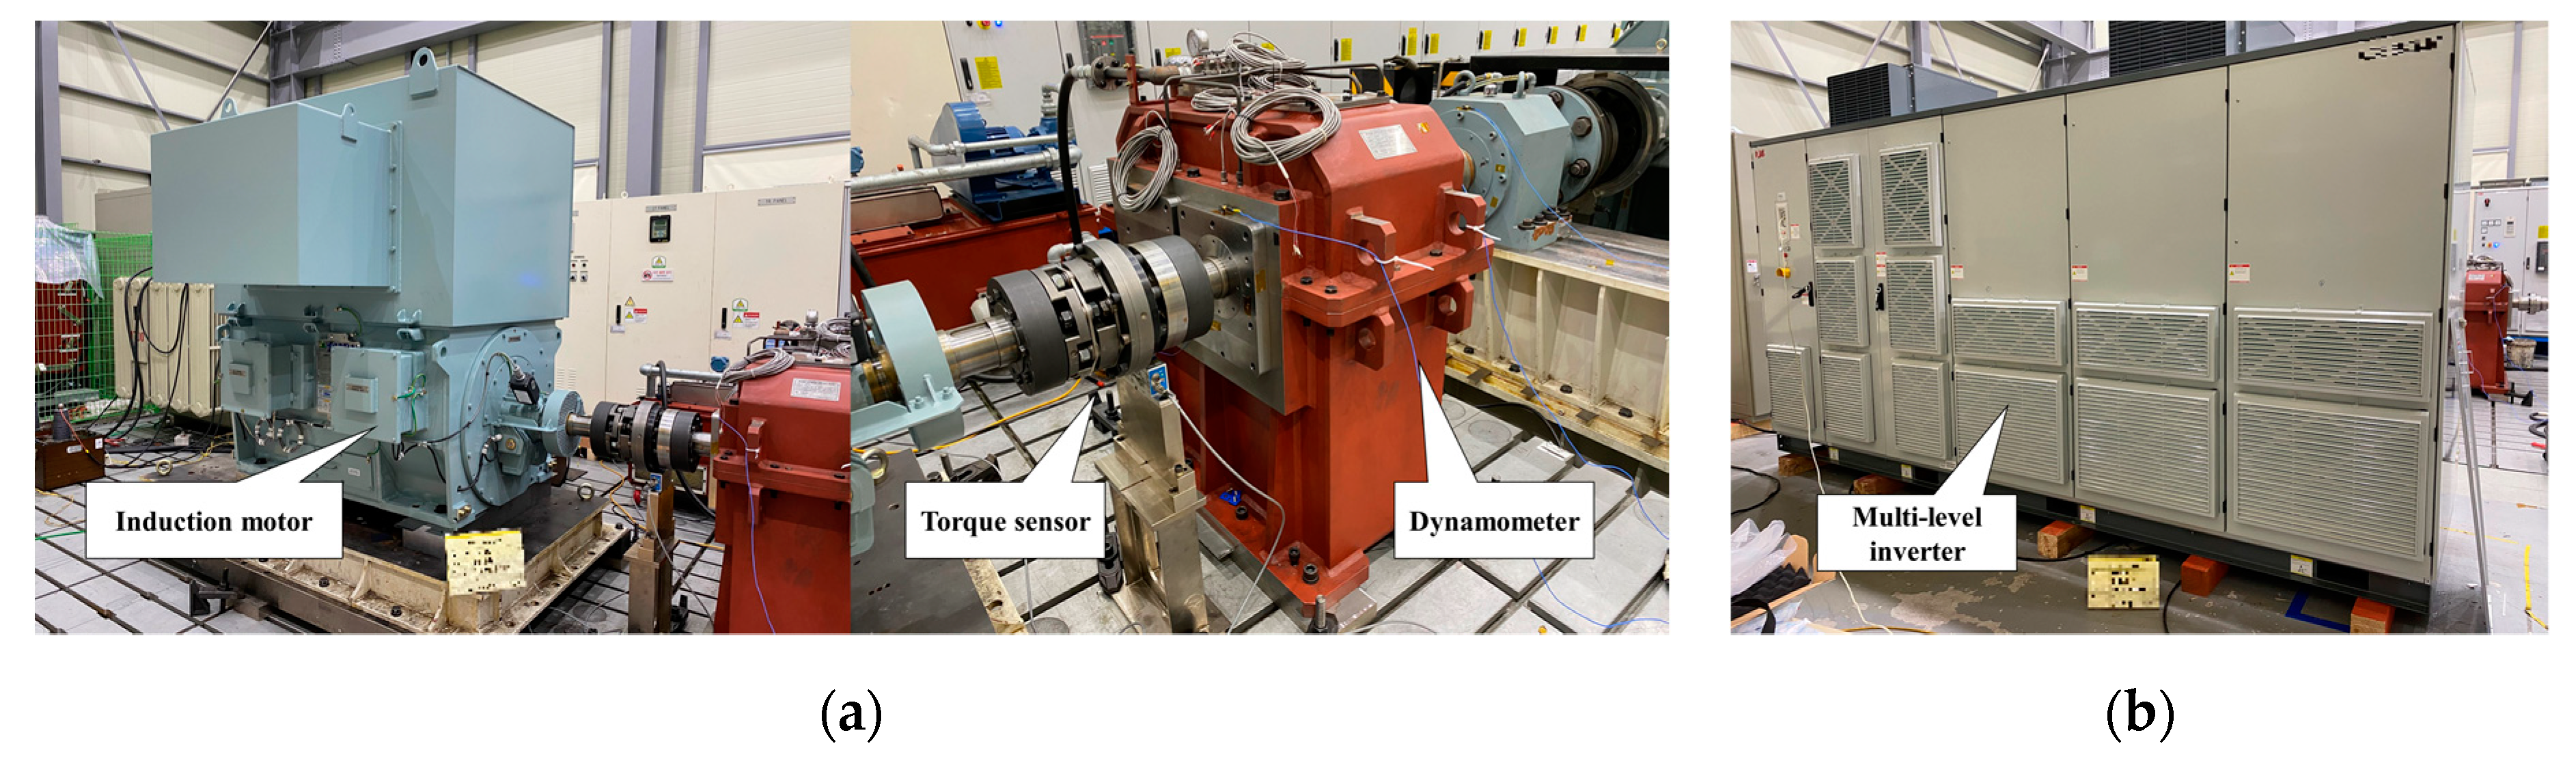
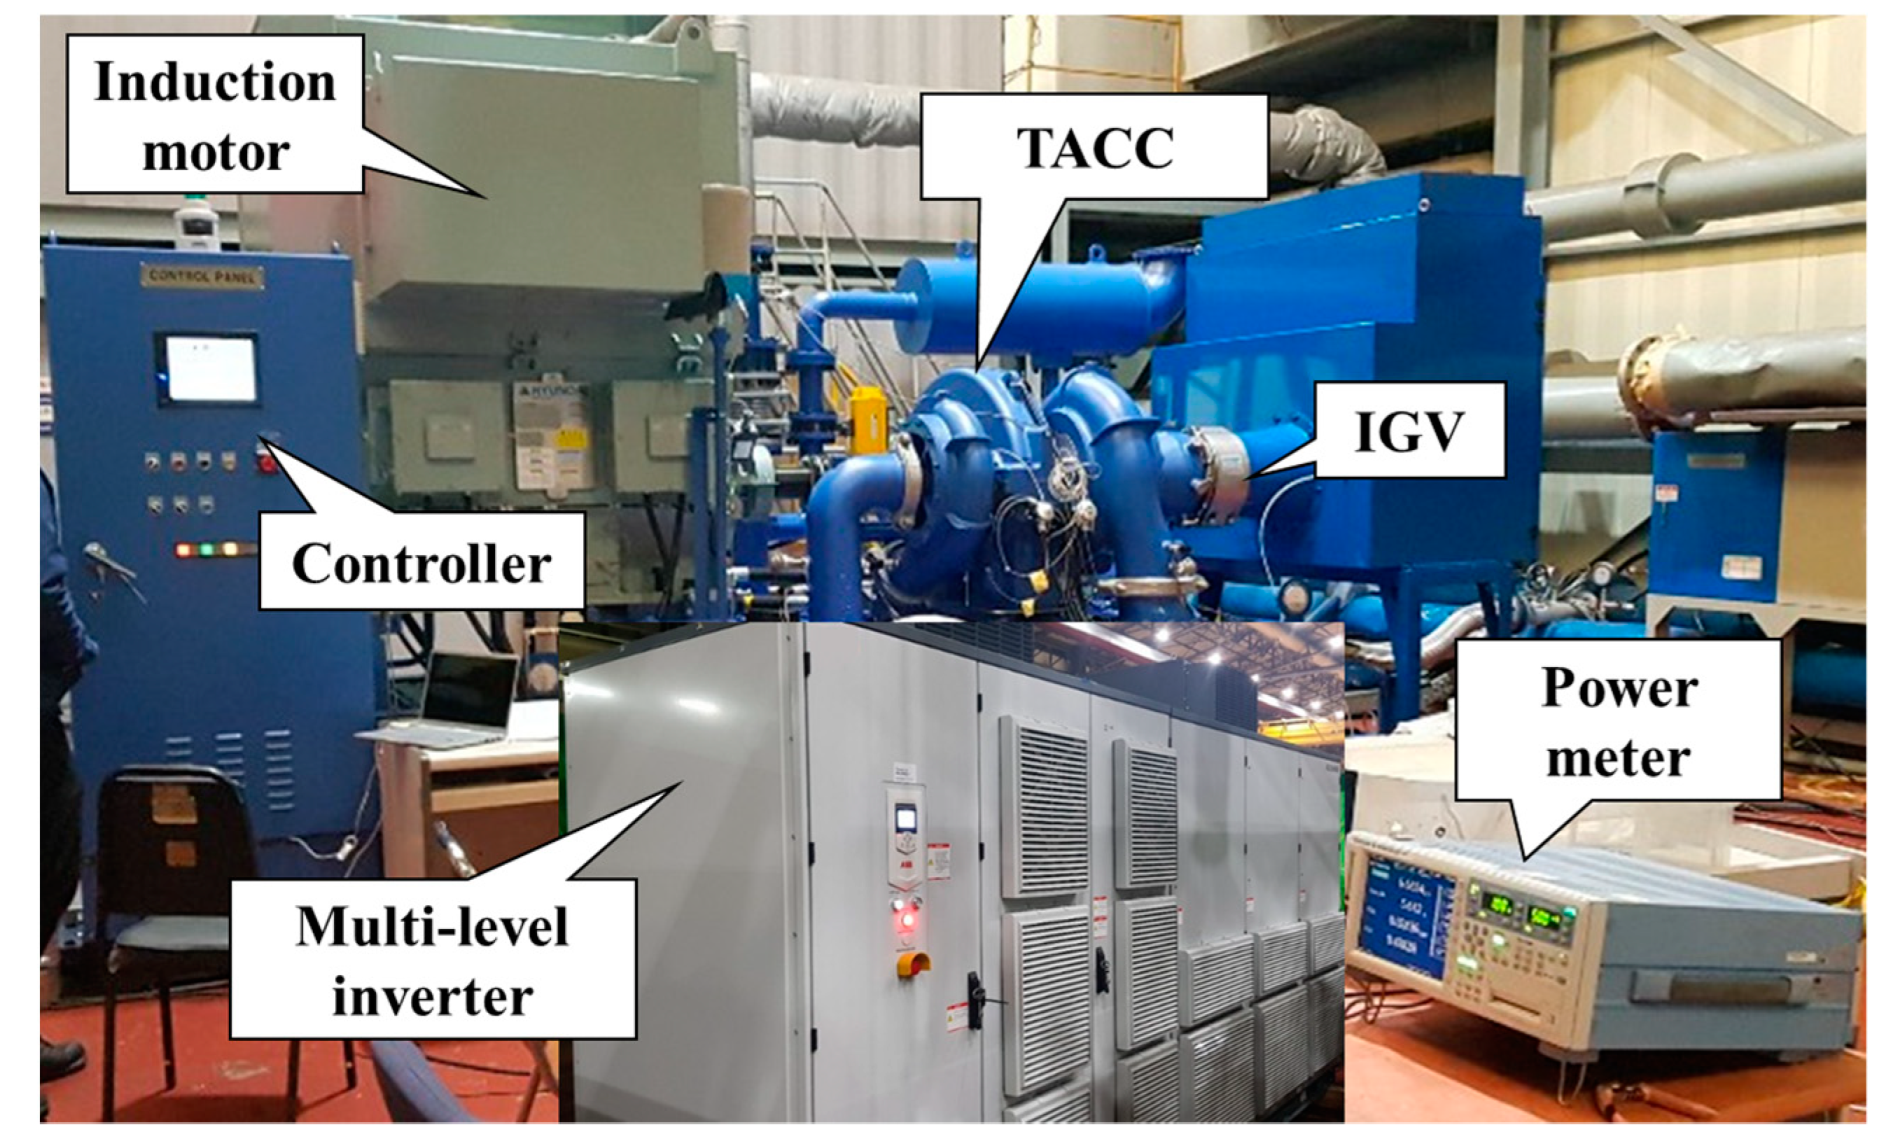
where Pmotor is the input power of the motor. Figure 3 shows the experimental setups for the performance evaluation of the EMDS using the induction motor and the multi-level inverter designed according to the specifications in Table 1.
ηmotor = Pmotor/PLoad × 100
ηEMDS = PTACCS/PLoad × 100
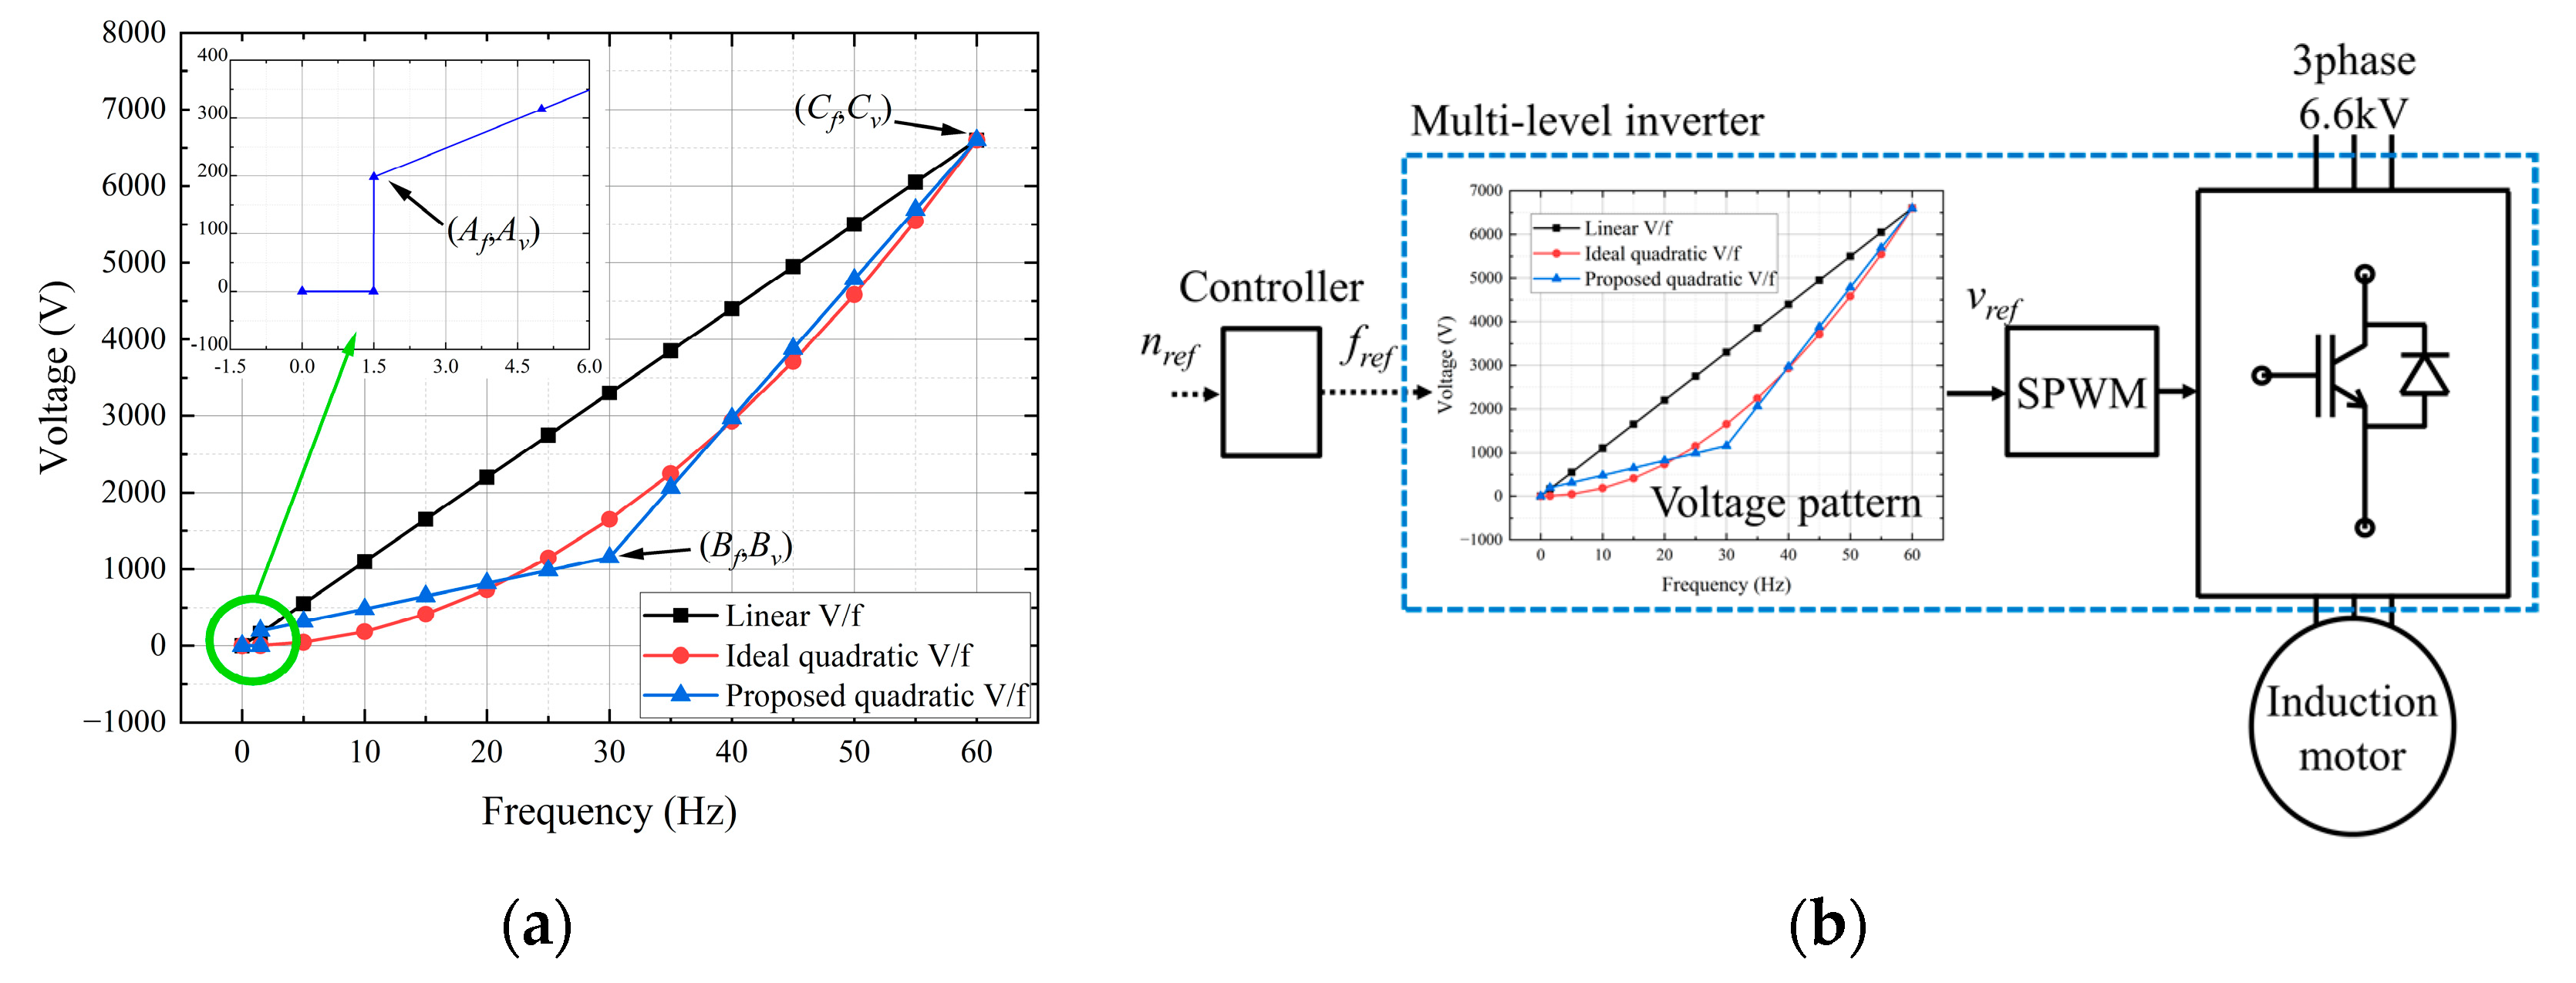
The reference voltage pattern equations of linear V/f control and ideal quadratic V/f control according to the reference frequency fref can be expressed as follows:
where Vrated is the rated voltage of the induction motor, frated is the rated frequency of the induction motor. For the proposed quadratic V/f control, since the induction motor with the TACC requires an initial starting torque due to inertial load and friction load, 198 V offset, which is 2% of the rated voltage was 1.5 Hz, which is 2.5% of the rated frequency. For the section exceeding the reference frequency 1.5 Hz, the following equations were applied to simplify the computational complexity of the microprocessor based on Equation (6).
where Vref(AB) and Vref(BC) are reference voltage values between the reference frequency values 1.5 Hz to 30 Hz and 30 Hz to 60 Hz as shown in Figure 4a. Points A, B, and C are the XY coordinate values in Figure 4a. Figure 4b shows the control configuration using the voltage pattern of linear V/f control, ideal quadratic V/f control, and quadratic V/f control. When the reference speed nref is input to the controller, the output from this controller is the reference frequency. vref is the output value of the voltage pattern curve according to the input of the reference frequency. This value is input to the sinusoidal pulse width modulation (SPWM) and converted into the switching pulses to operate the power semiconductors.
vref(linear) = (vrated/frated) × fref
vref(ideal quadratic) = (vrated/frated2) × fref2
Vref(AB) = ((Bv − Av)/(Bf − Af)) × (fref − Af) + Av
Vref(BC) = ((Cv − Bv)/(Cf − Bf)) × (fref − Bf) + Bv
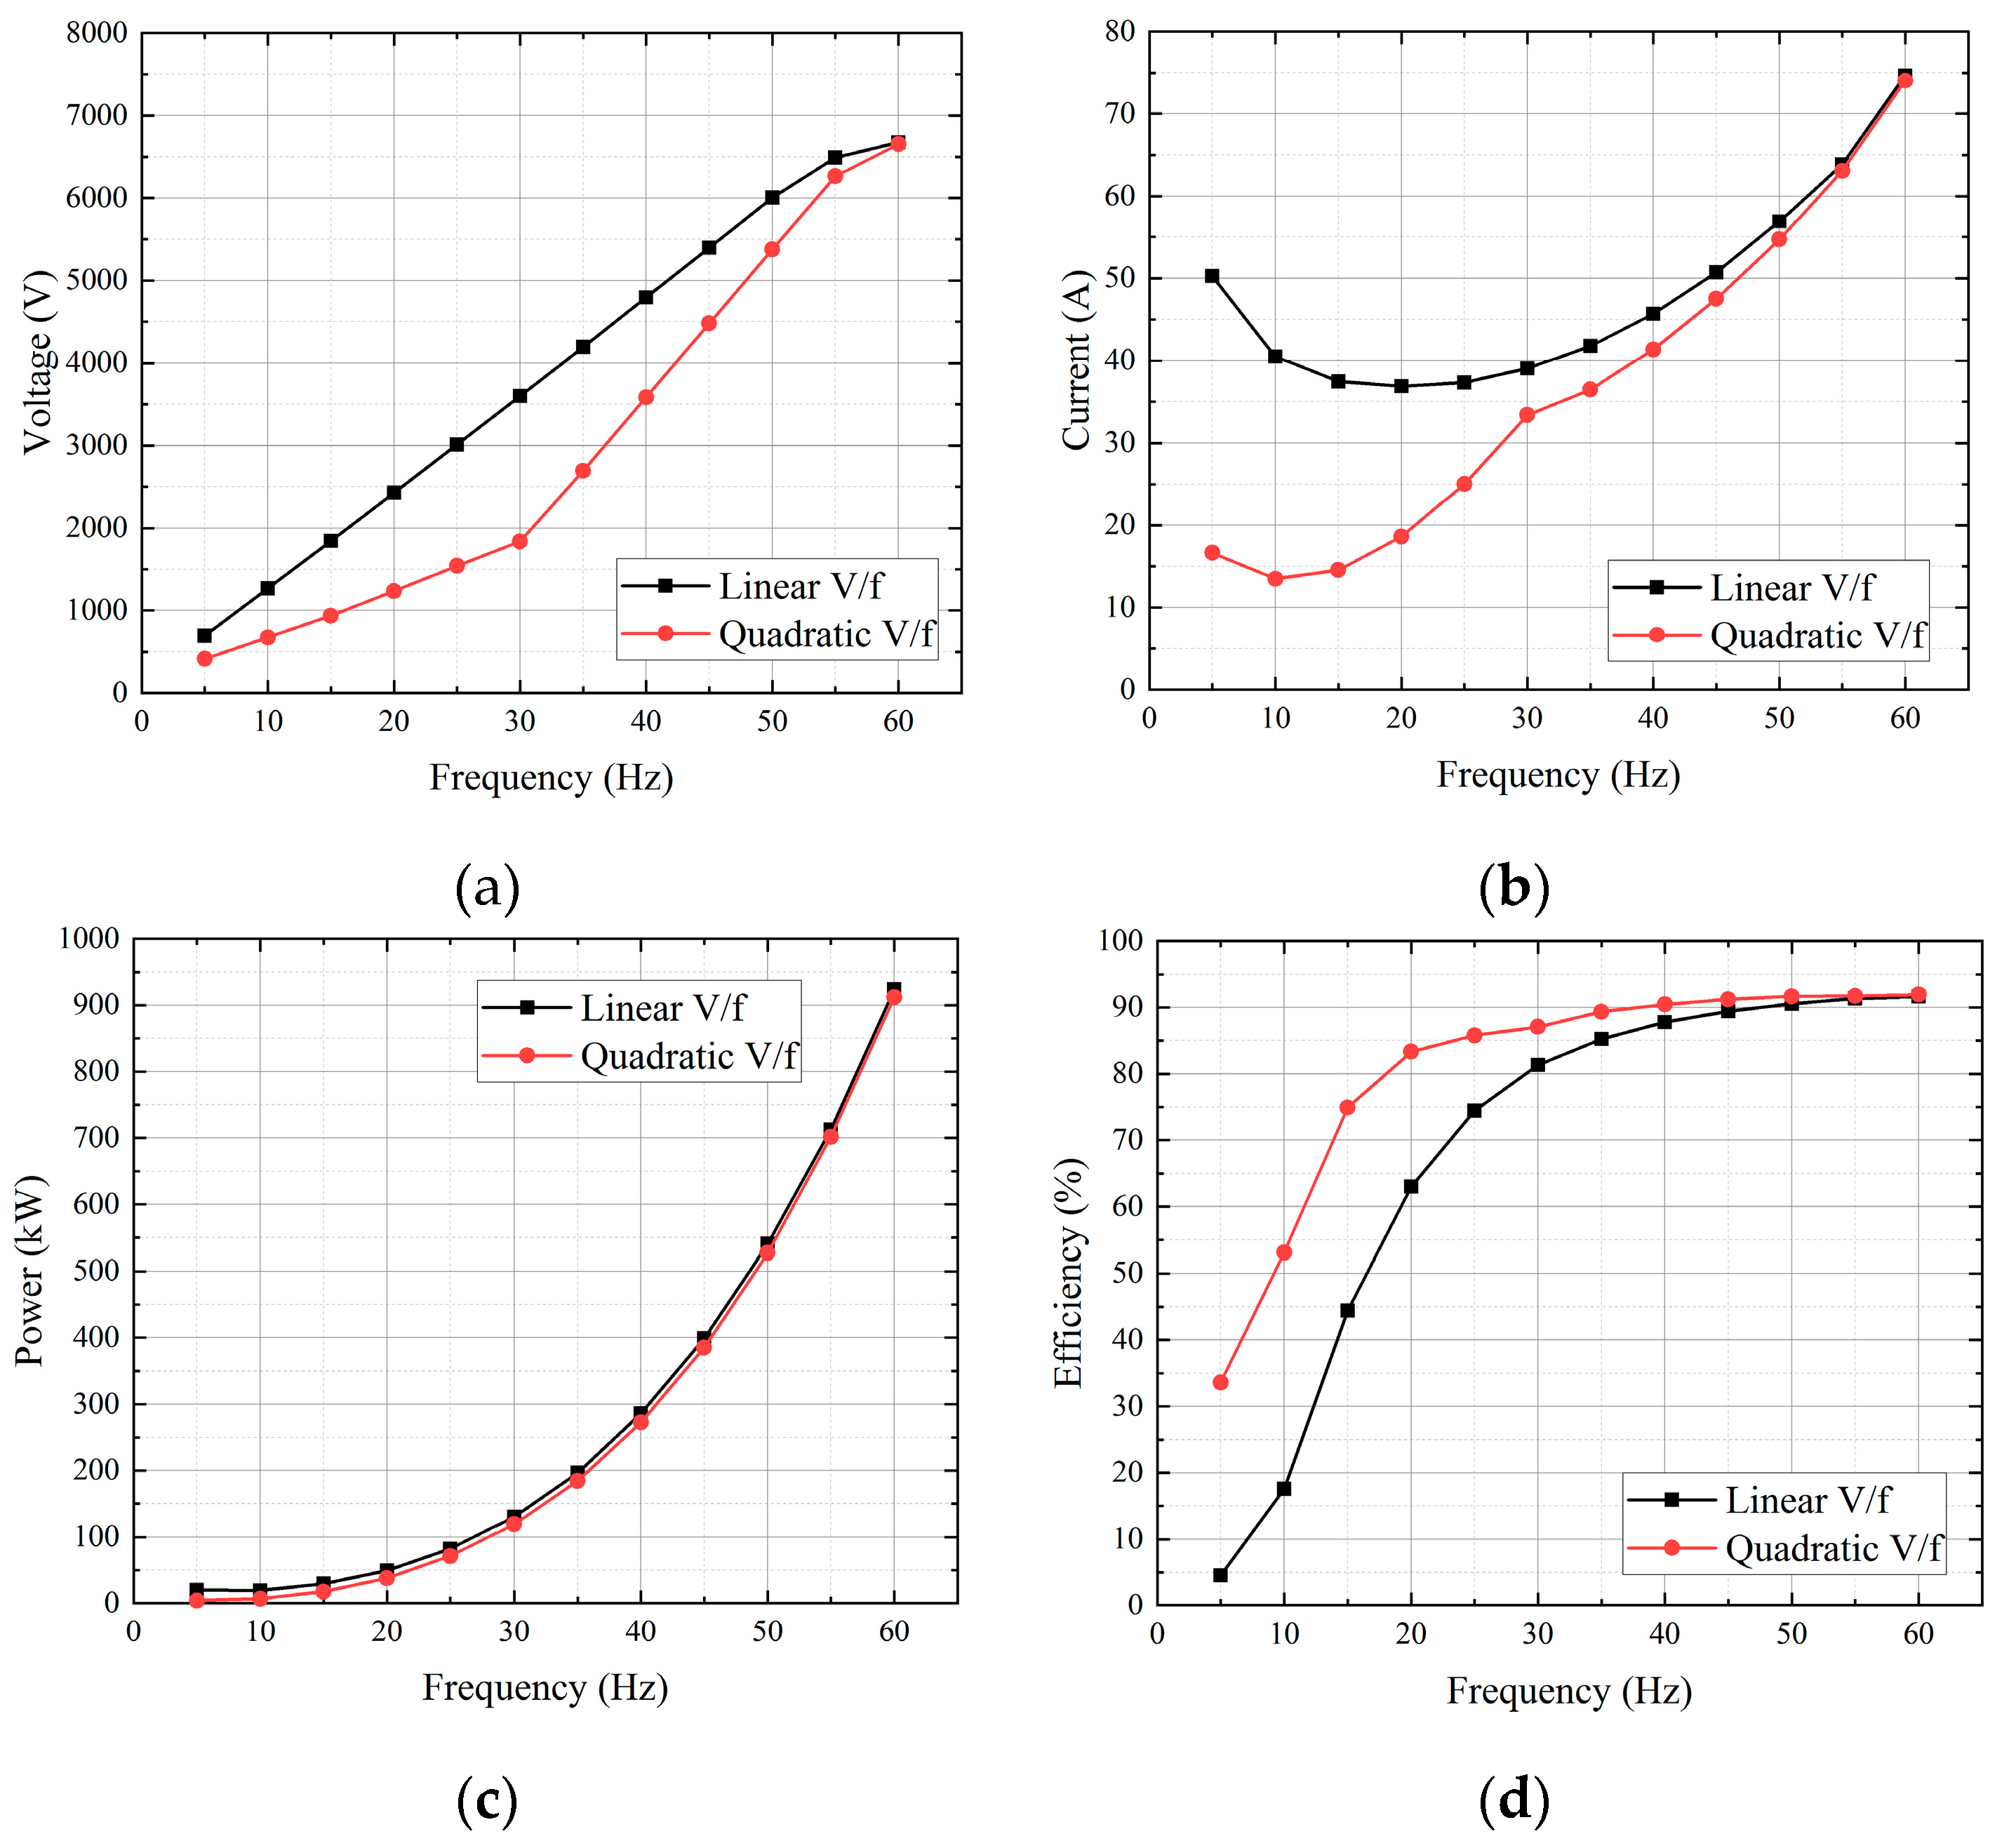
Figure 5 shows performance curves measured at the input terminals of the induction motor according to linear and quadratic V/f controls. Compared with the linear V/f control, the phase current magnitude of the quadratic V/f control is reduced under the same load conditions over the entire operating frequency range. As a result, the power consumption of the induction motor was reduced, and the efficiency of the induction motor is improved.
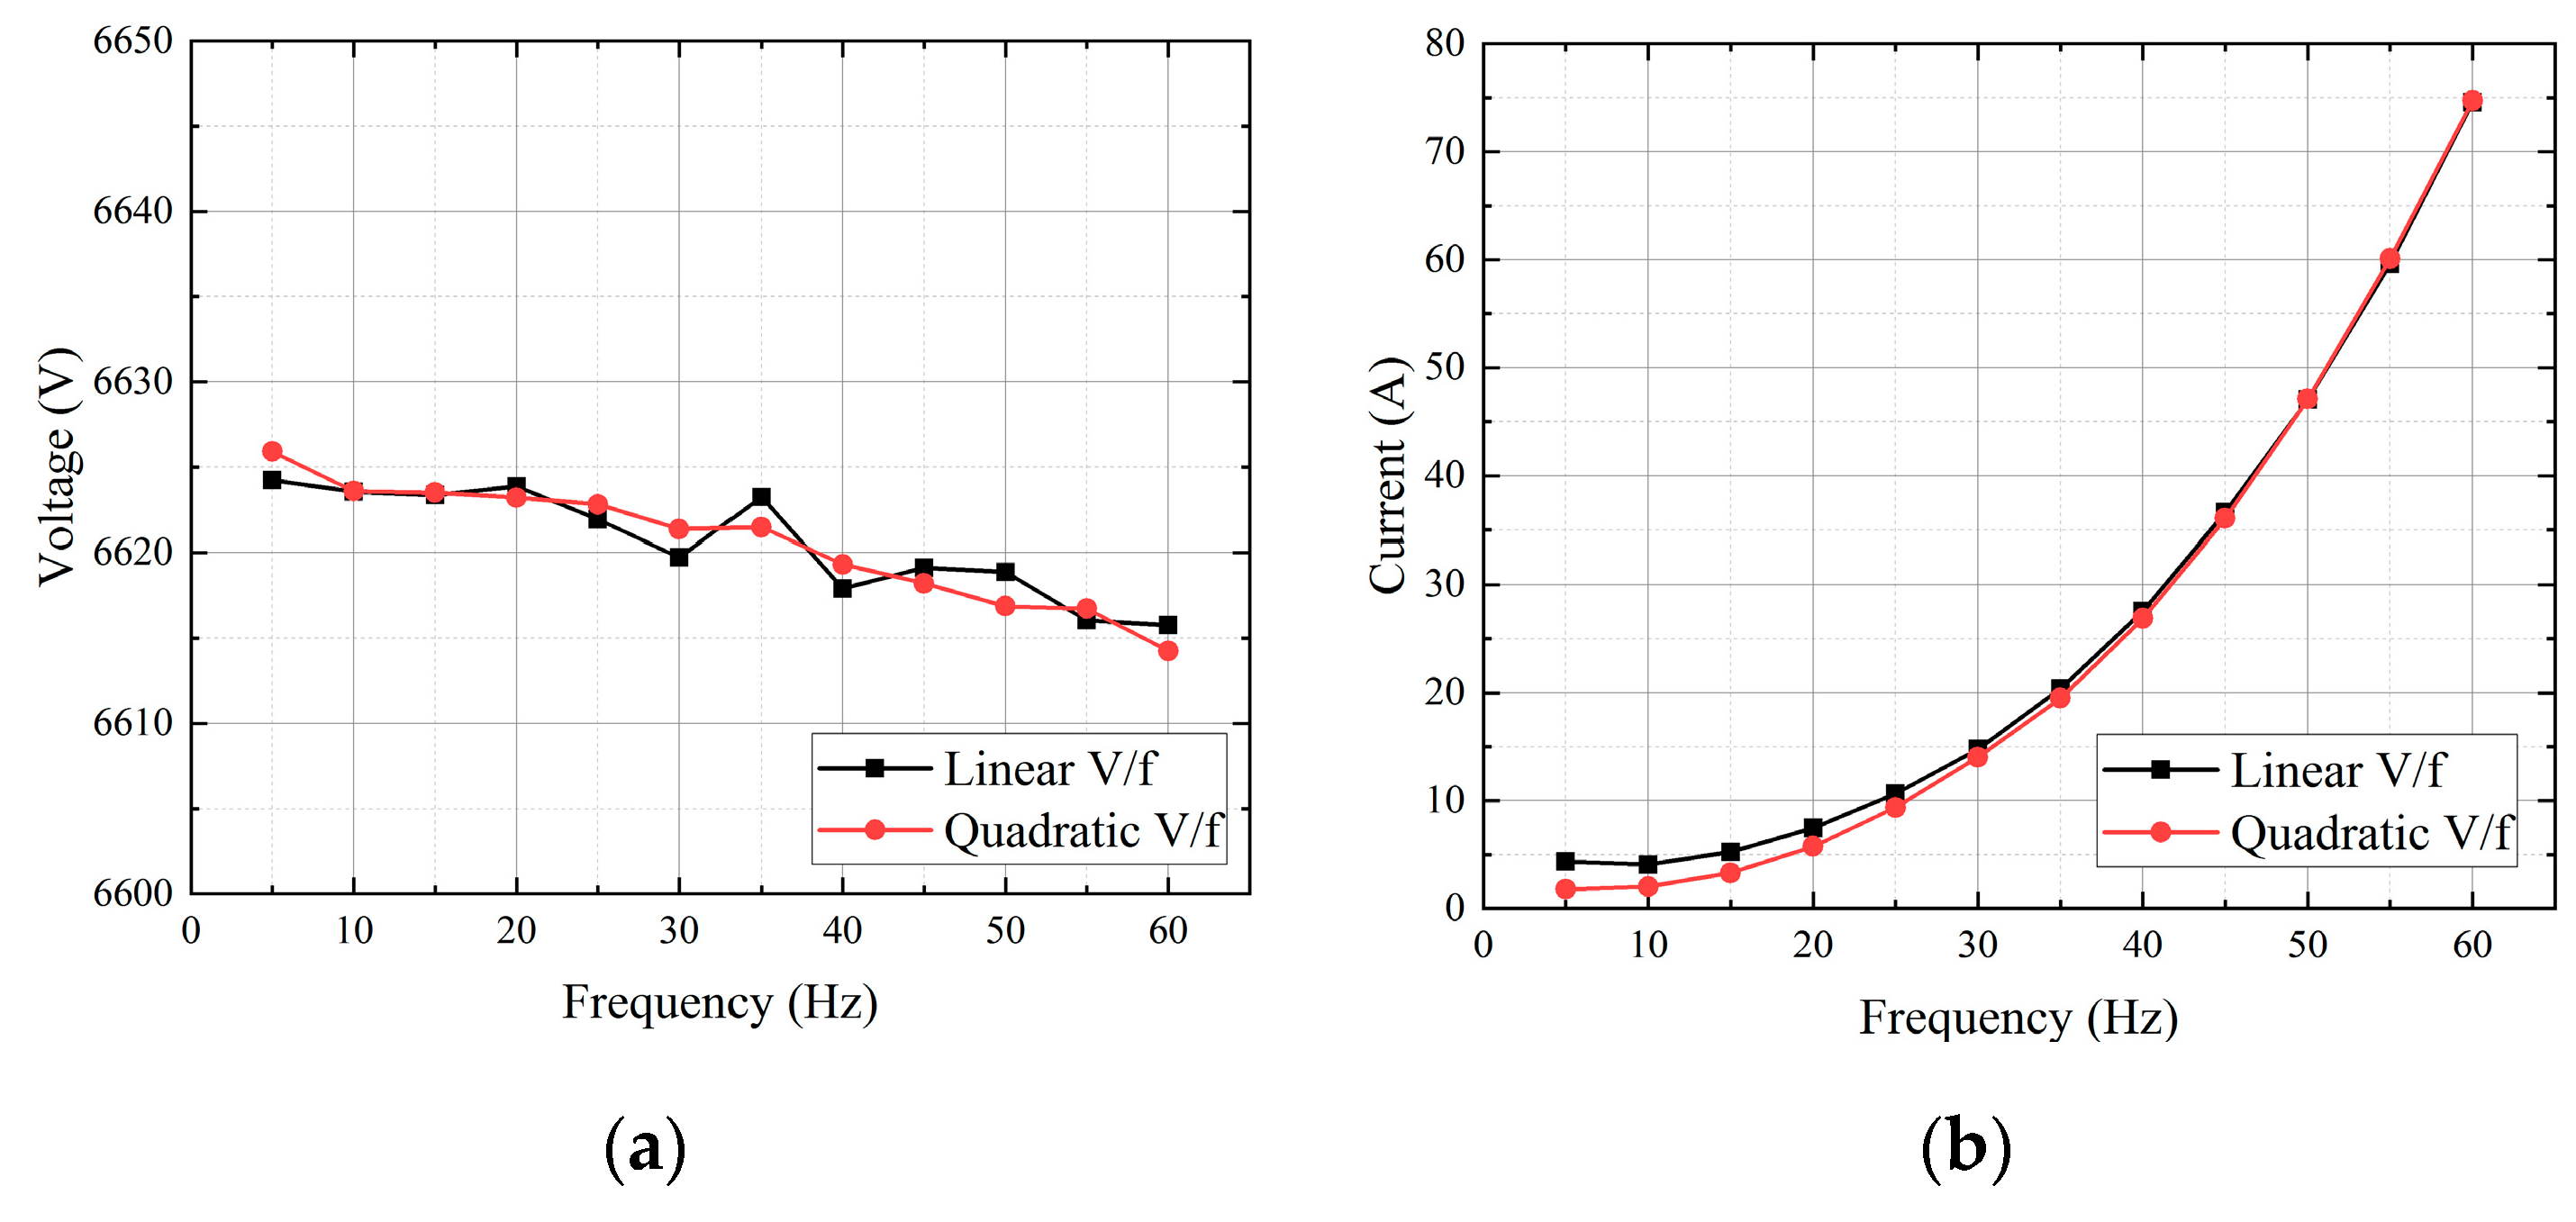
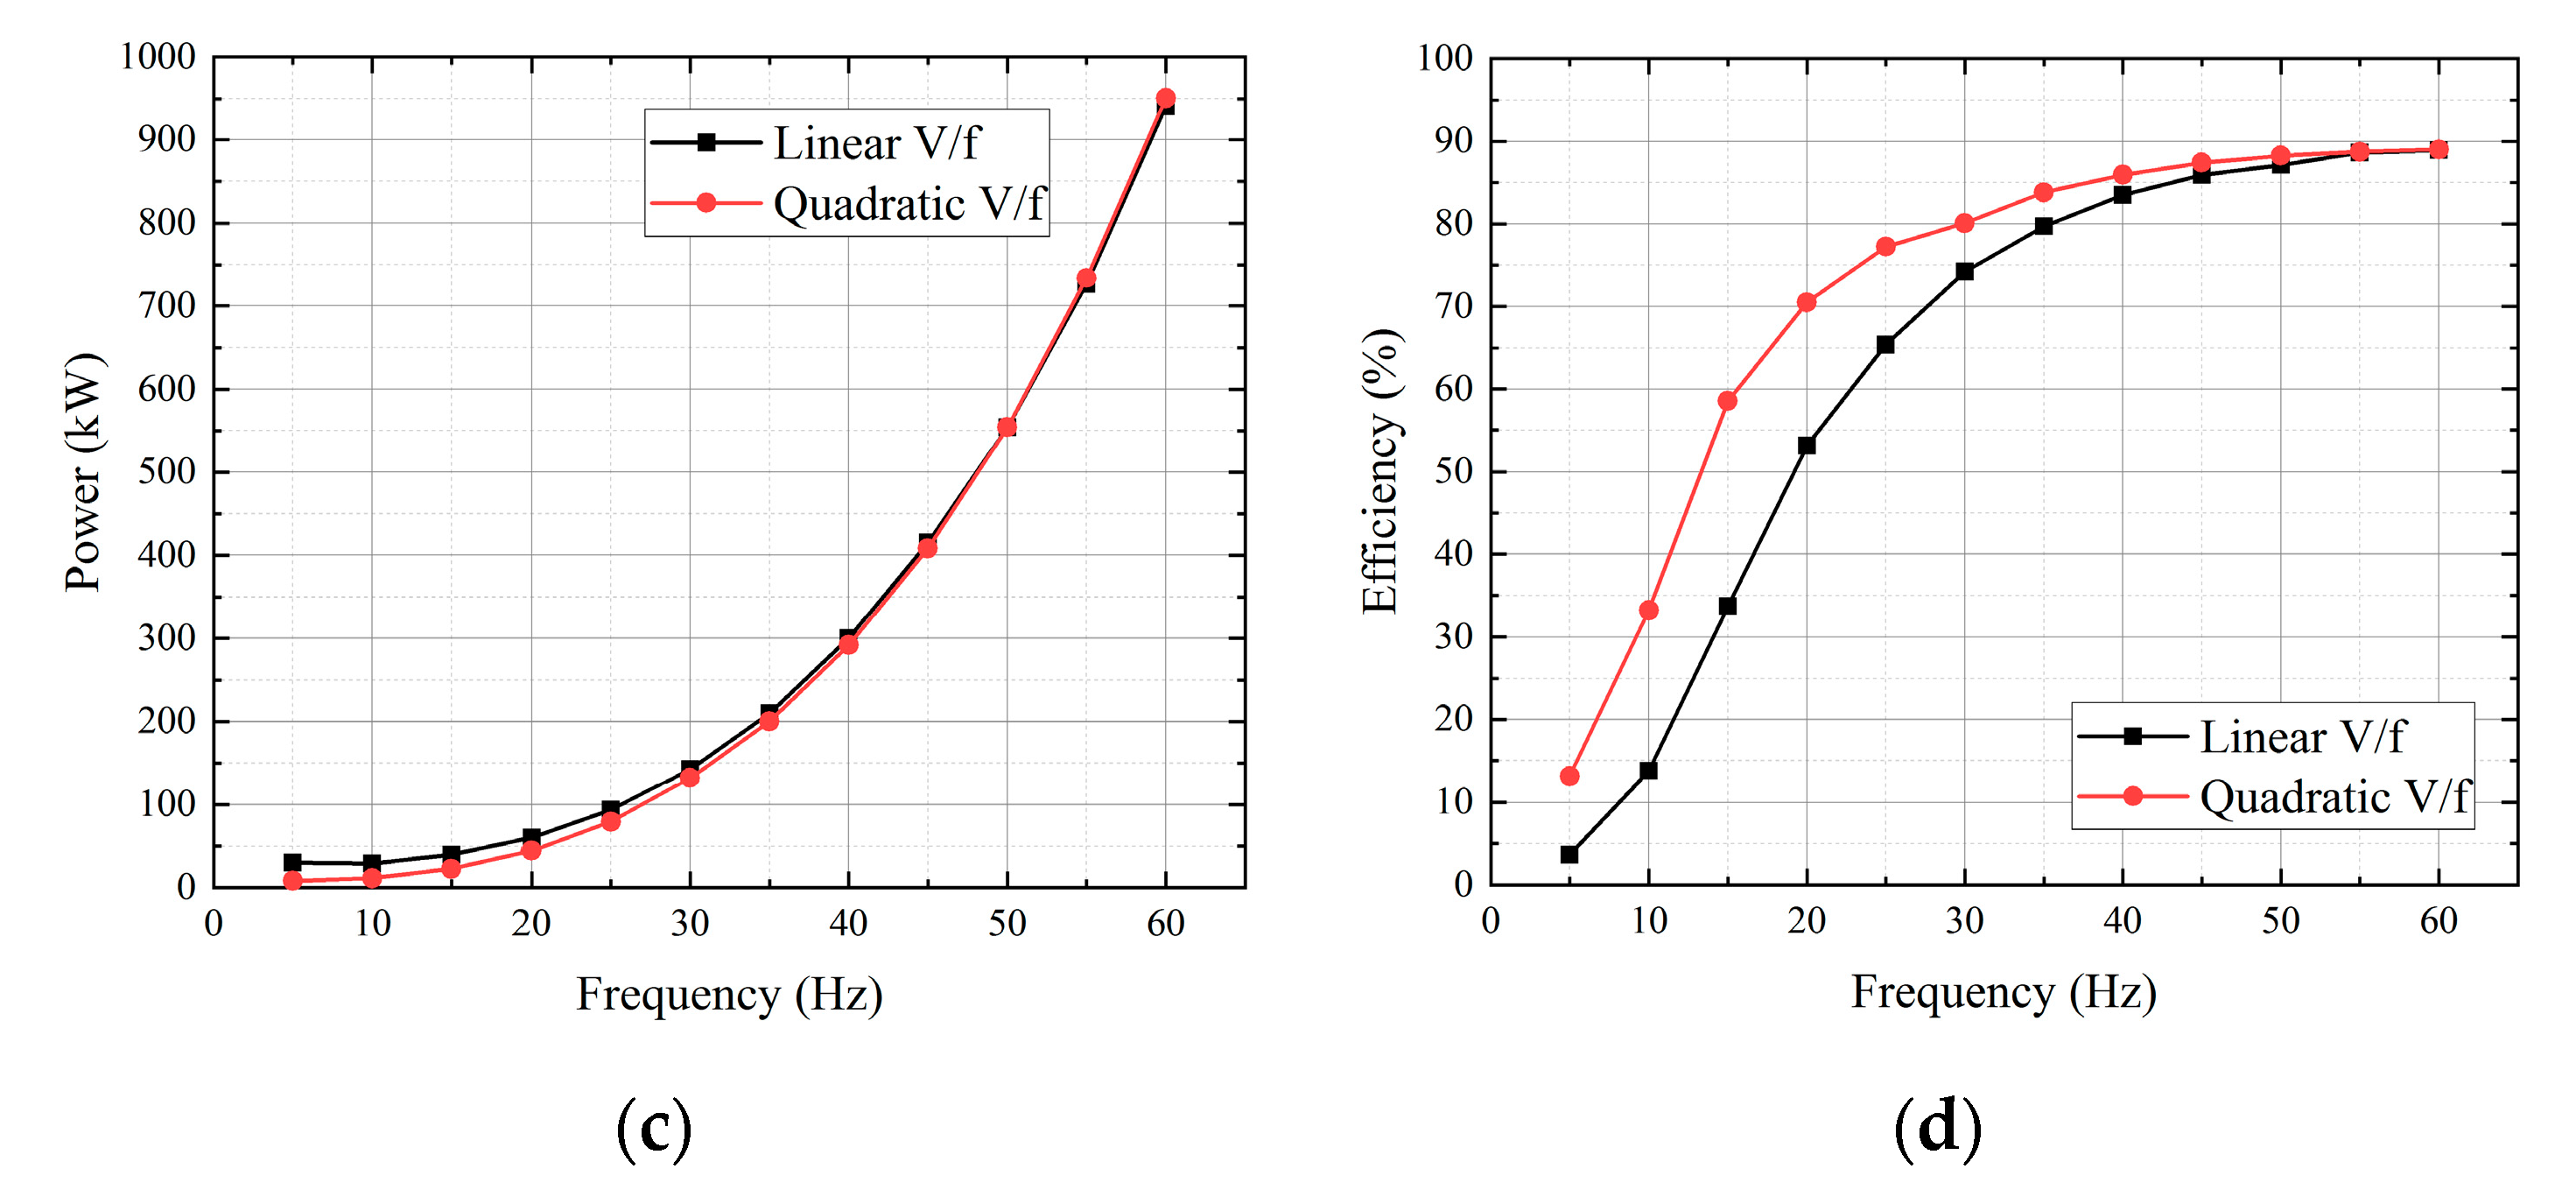
Figure 6 shows performance curves measured at the input terminals of the multi-level inverter according to linear and quadratic V/f controls. Since the copper loss caused by the phase current of the multi-level inverter is reduced due to the reduction of the phase current of the induction motor, the power consumption of the TACCS is reduced and the efficiency of the EMDS is improved.
The equations using trend line analysis of the power curves according to the linear and quadratic V/f controls can be expressed as follows:
where x is time. This time to reach the rated frequency 60 Hz is 120 s, so the calculated power consumptions for each control are 8.83 kWh and 8.04 kWh. The equation of the energy saving rate ES when VSD is applied to the TACCS can be expressed as follows:
where P(CSD) and P(VSD) are the totals of power consumption in each control. The energy saving rate is 8.86%. This implies that the quadratic V/f control provides a higher energy saving rate than that of the linear V/f control in the initial startup.
Y = −0.000002x4 + 0.0011x3 − 0.052x2 + 1.9611x + 4.4686
Y = 0.0000002x4 + 0.0005x3 − 0.0004x2 + 0.2887x + 1.6396
Es = (P(CSD) − P(VSD))/P(CSD) × 100
3.2. Perfomance Analysis of TACCS
Figure 7 shows the experimental setup for the performance evaluation of TACCS. PTACCS was measured using the power meter to analyze the power consumption according to the CSD and VSD. The pressure was also measured and the efficiency of the TACC was calculated using the pressure and temperature sensors.
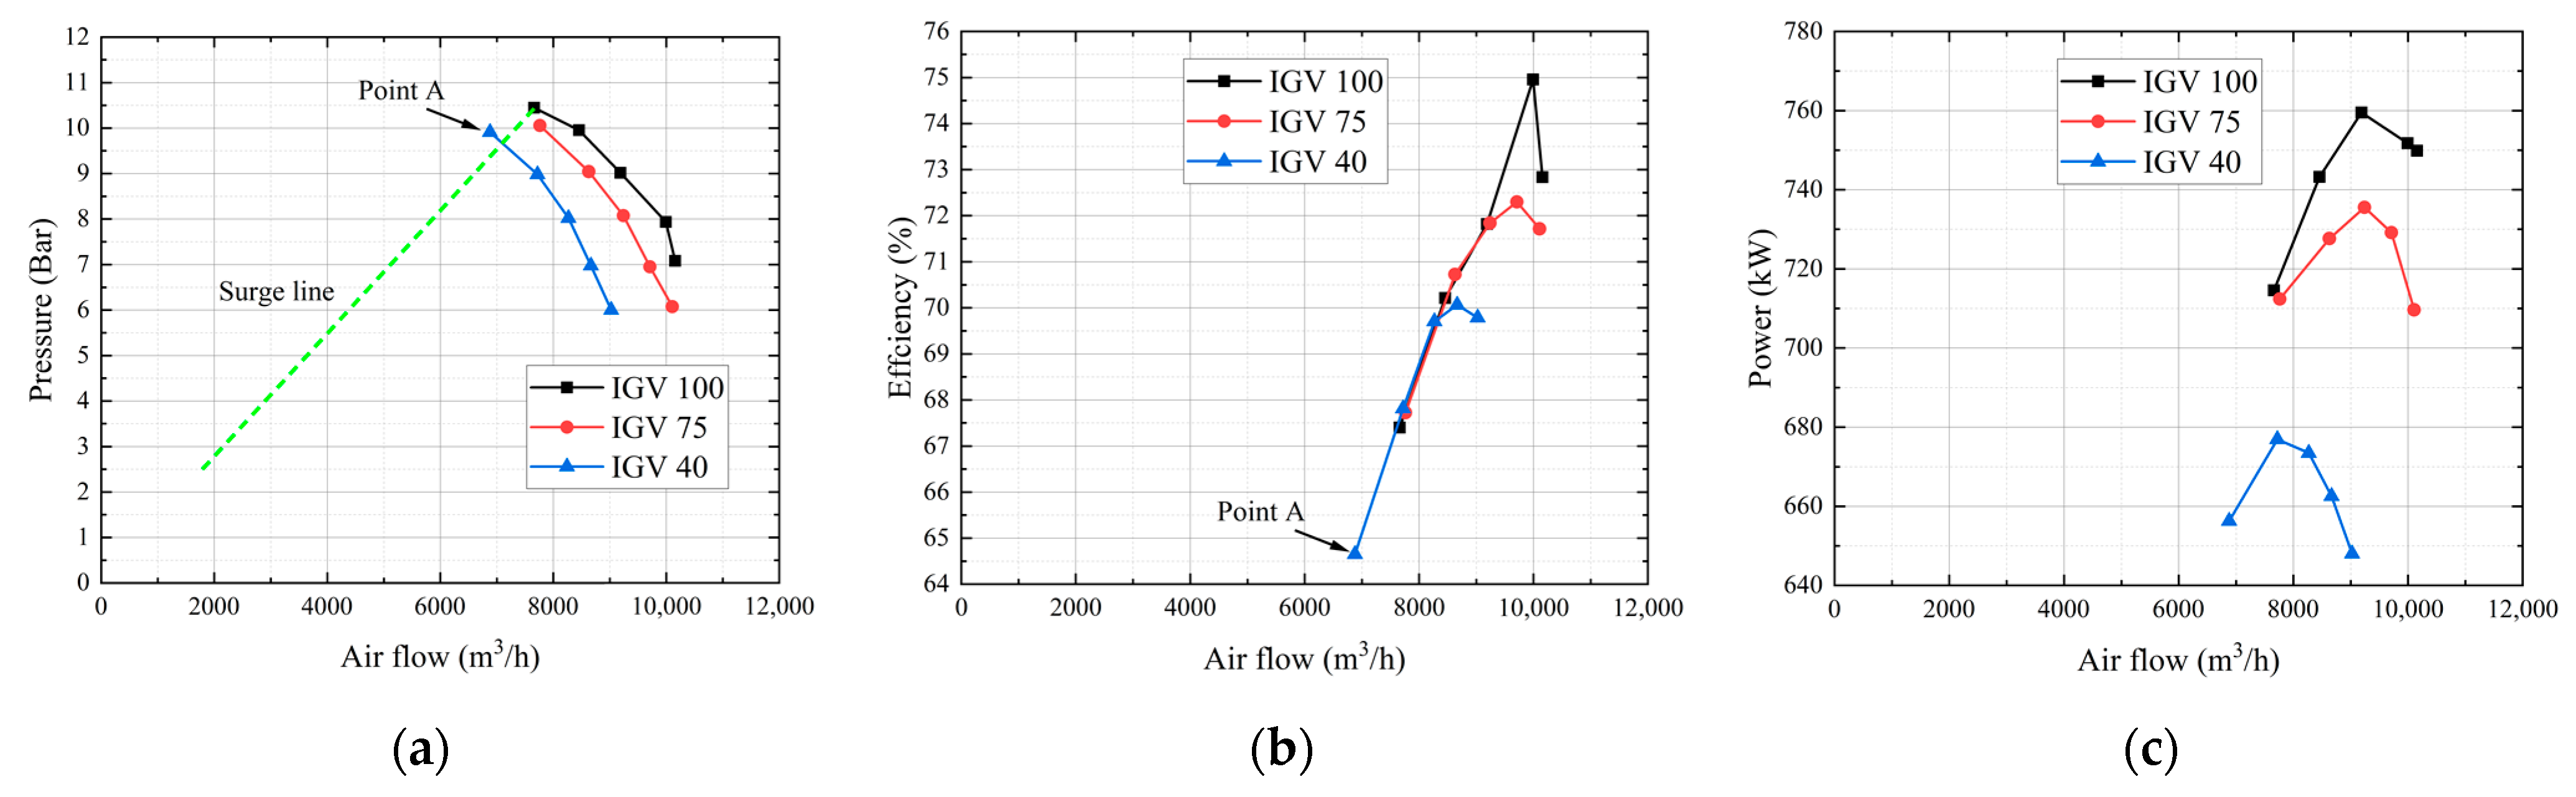
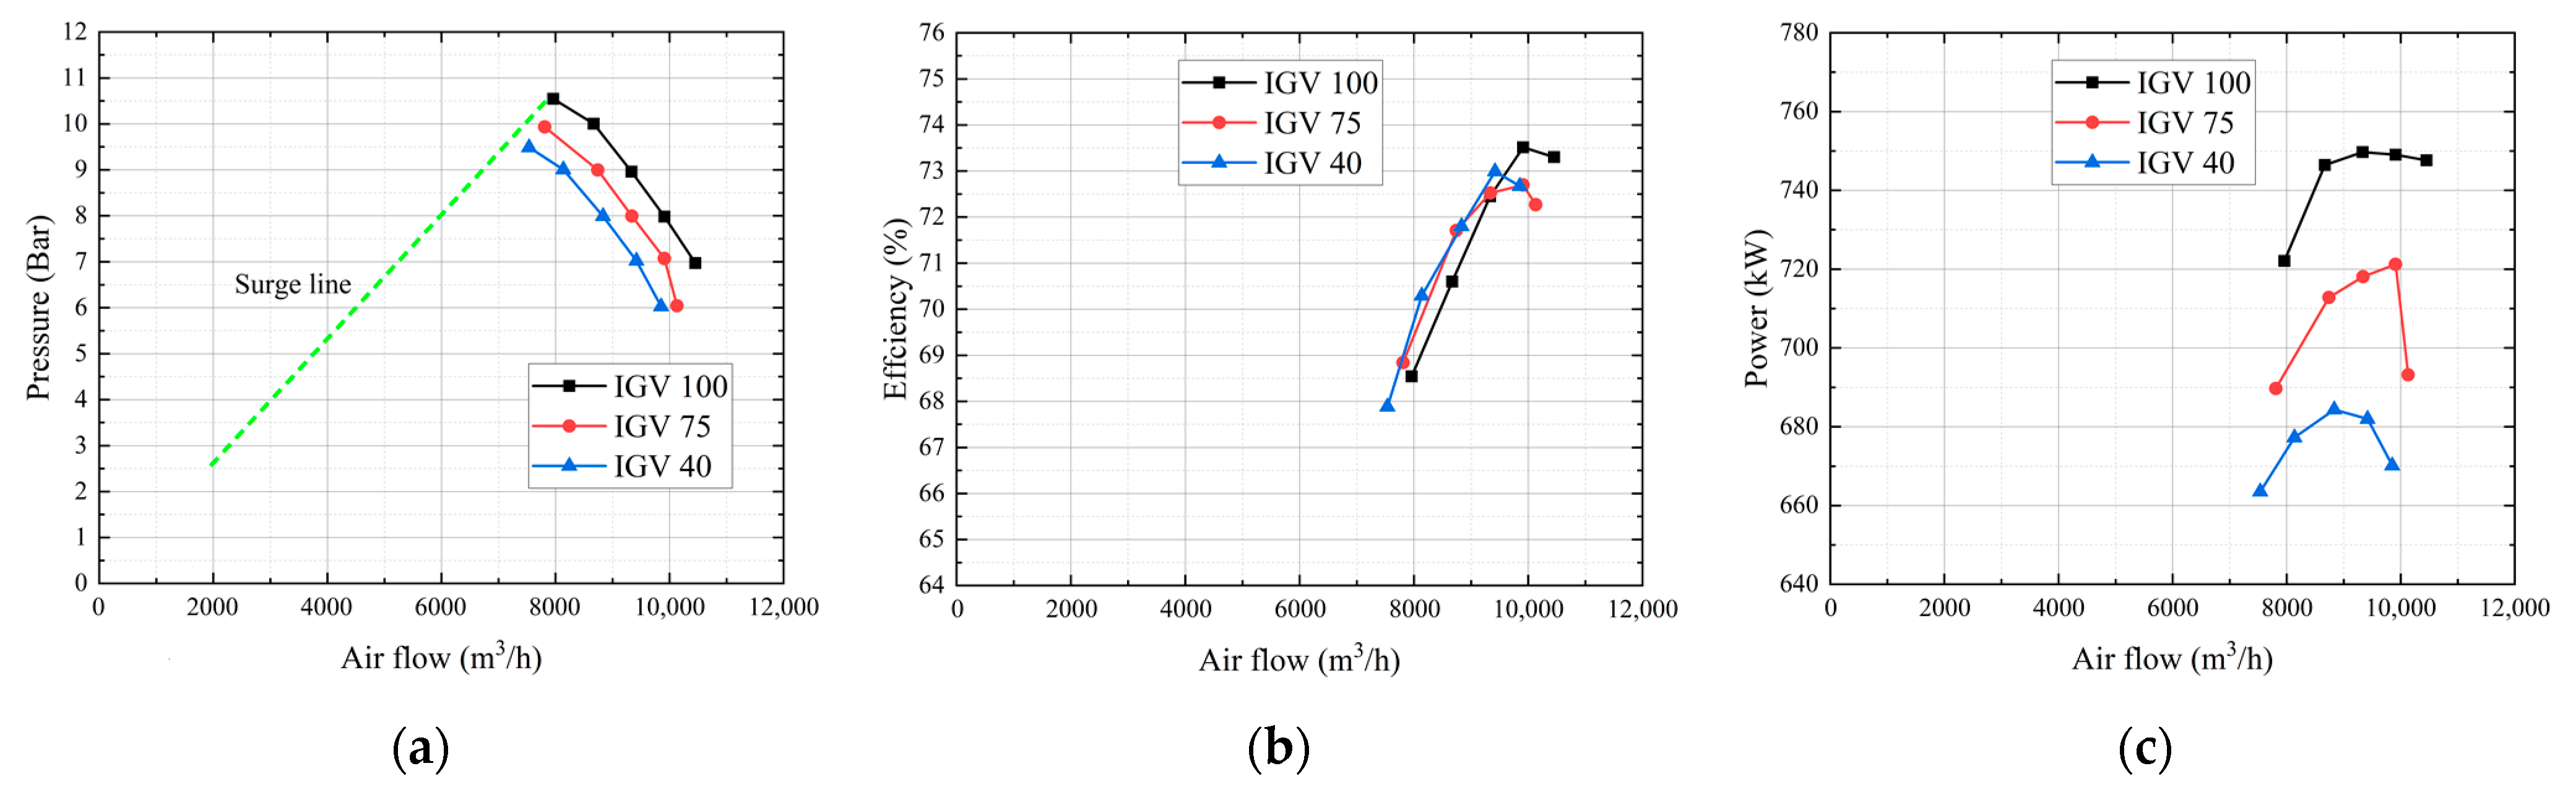
Figure 8 and Figure 9 show the performance curves of the TACCS using CSD and VSD. The pressure control of the CSD can be controlled by the IGV. Tests for the air flow rate control were performed while maintaining the pressure at 0.5 bar intervals from 6 to 10 bar. In the case of the CSD, although the controllable opening degree range of the IGV is 0% to 100%, the range of air flow rate control is very narrow as shown in Figure 8a. On the other hand, in the case of the VSD, the controllable speed range 0 to 60 Hz, and it is easy to control the air flow rate by adjusting the frequency from 58.8 to 60 Hz as shown in Figure 9a. However, the precise and fast response speed control is required to constant the air flow rate.
The equation of isothermal efficiency of TACC can be expressed as follows:
where i is the mass flow rate, Cp is the specific heat at constant pressure, k is the ratio of specific heats, Ti is the absolute temperature of inlet condition, Pd and Pi are the pressures of inlet and discharge conditions, m1,2,3 and h1,2,3 are the mass flow rate and enthalpy of stage 1, 2, and 3, and Pml is the mechanical loss of the TACC. In Figure 8b and Figure 9b, when the rated pressure is 8 bar and the rated air flow rate is 10,000 m3/h, the isothermal efficiency of the TACC is about 1.5% higher in the CSD than in the VSD. In other ranges, the VSD is more efficient than the CSD. In the CSD, point A entered the surge area, so the isothermal efficiency and the air flow rate of the TACC were drastically lowered to about 3.7% and 600 m3/h compared to the VSD. In the case of PTACCS, when the VSD is used, it consumes low power except for the IGV 40 section where the air flow rate is low, as shown Figure 8c and Figure 9c. As a result, when the required air flow rate is greater than about 70% of the rated air flow rate and the variation of the air flow rate is small, the CSD is excellent in controllability. However, the VSD is more effective than the CSD when the required variation of the air flow rate is large. As a result, the CSD using IGV control is advantageous for the precise control of air flow rate, but the VSD has a difference that allows a wide range of air flow rate control.
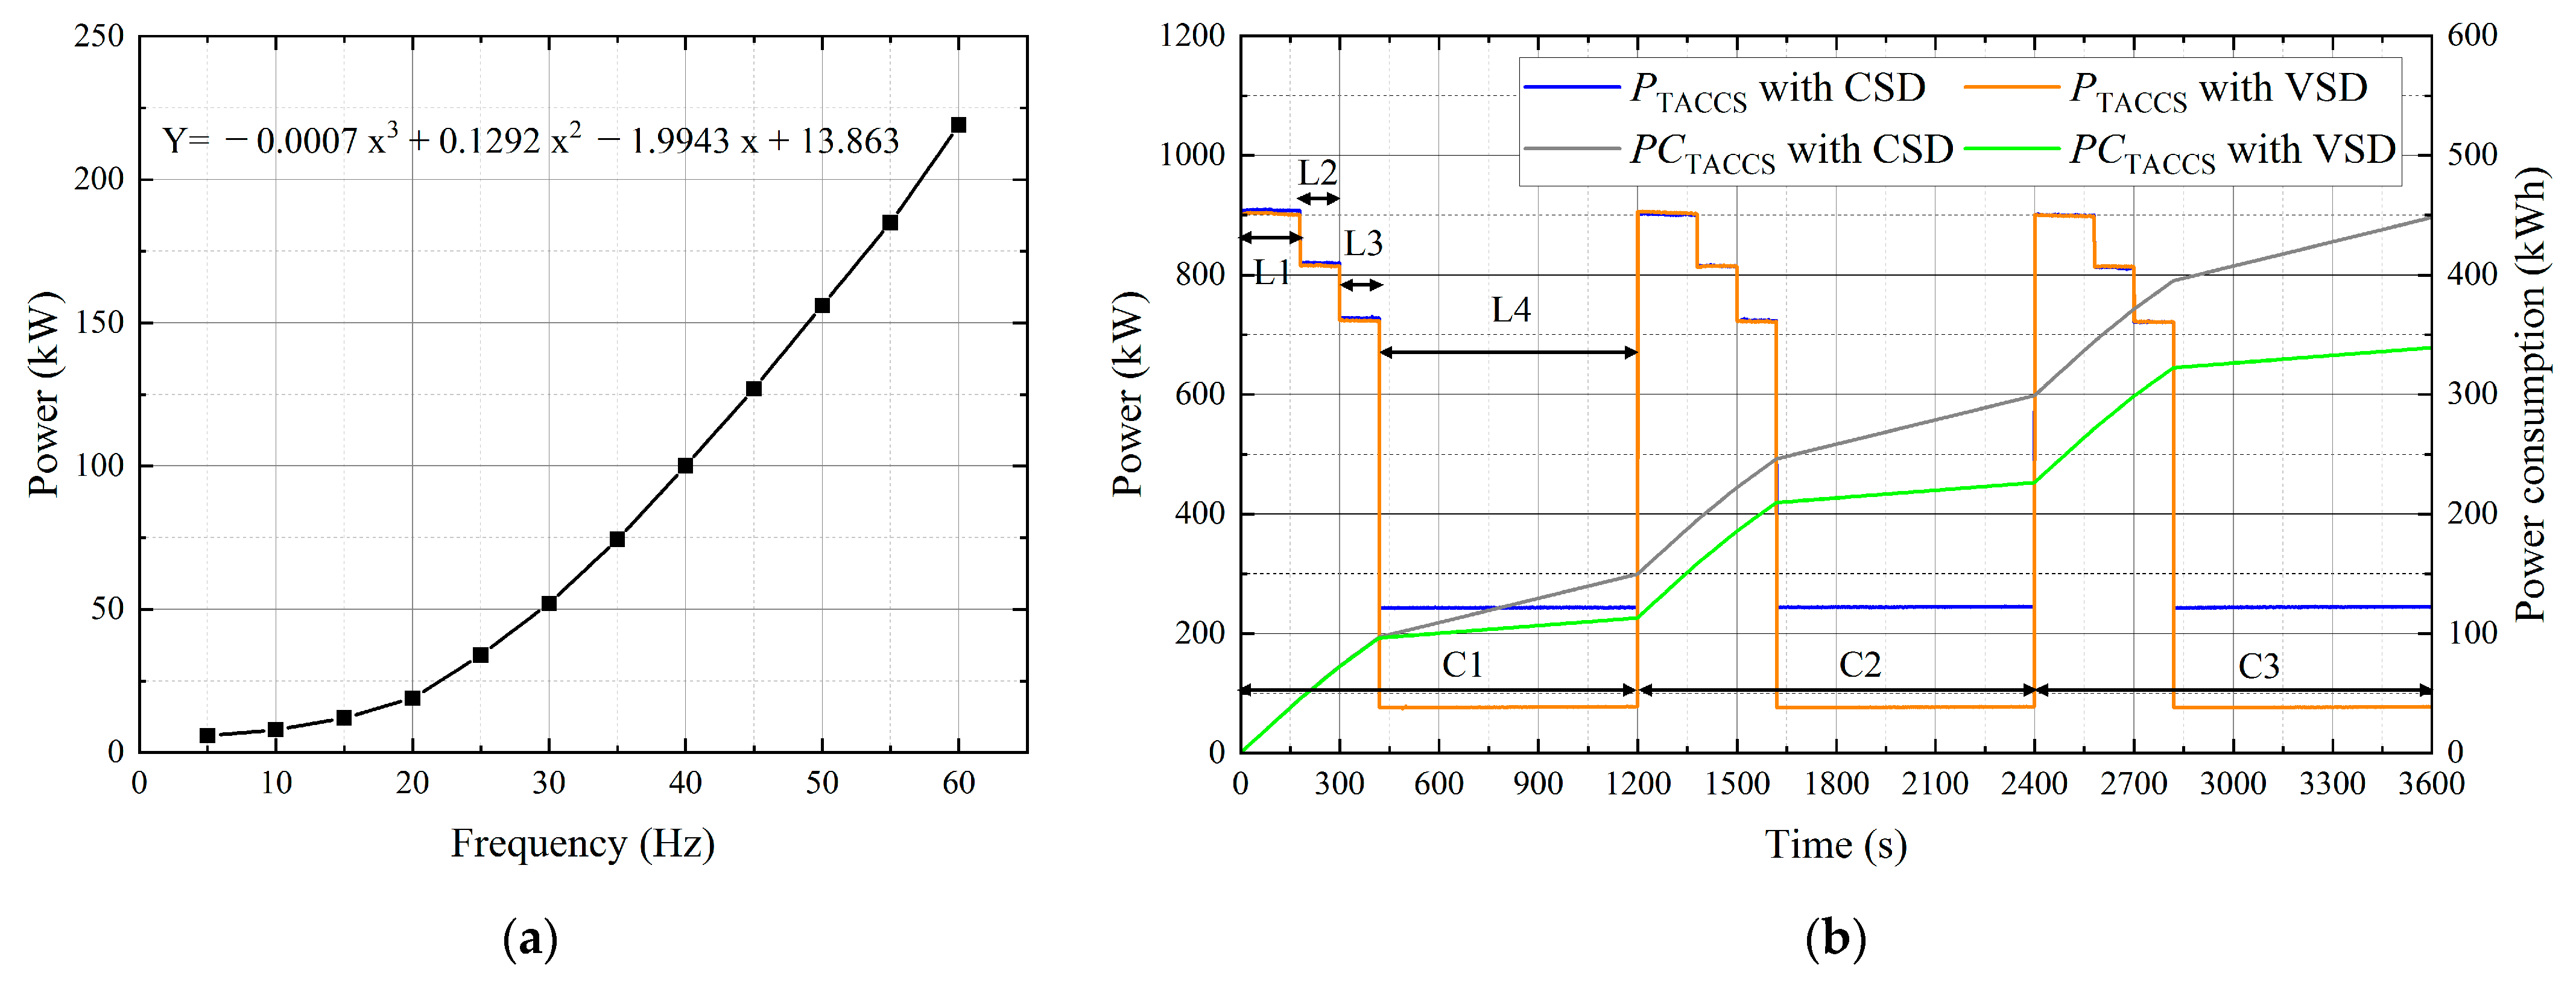
Based on the performance analysis of the experimental results of the TACC according to the CSD and VSD, a test was performed as shown in Figure 10 to analyze the energy saving rate considering the daily consumption air flow rate. Figure 10a shows the PTACCS curve when the TACC is driven at no load condition. As the operating frequency of induction motor increases, the PTACCS increases according to the trend line analysis equation, the VSD with adjustable operating frequency of induction motor can reduce the mechanical loss of TACCS.
Figure 10b shows the comparison of the PTACCS and power consumption (PCTACCS) curves under part load conditions (L1, L2, L3, L4: 100%, 90%, 80%, 0%). The daily consumption air flow rate is varied in three cycles (C1, C2, C3) every 20 min at the rated pressure of 8 bar. Compared with the CSD, when the VSD was used at L4, and PTACCS and PCTACCS were significantly reduced due to the mechanical loss reduction.
Table 2 shows the comparison of the power consumption according to the CSD and VSD in the part load conditions. Compared with the CSD, the total power consumption of the VSD is reduced by 109 kWh. The reason for this difference is that the mechanical loss is reduced through speed control. The energy saving rate is 24.31% from Equation (5). This implies that the VSD provides a higher energy saving than that of the CSD in the part load condition.
4. Economic Analysis
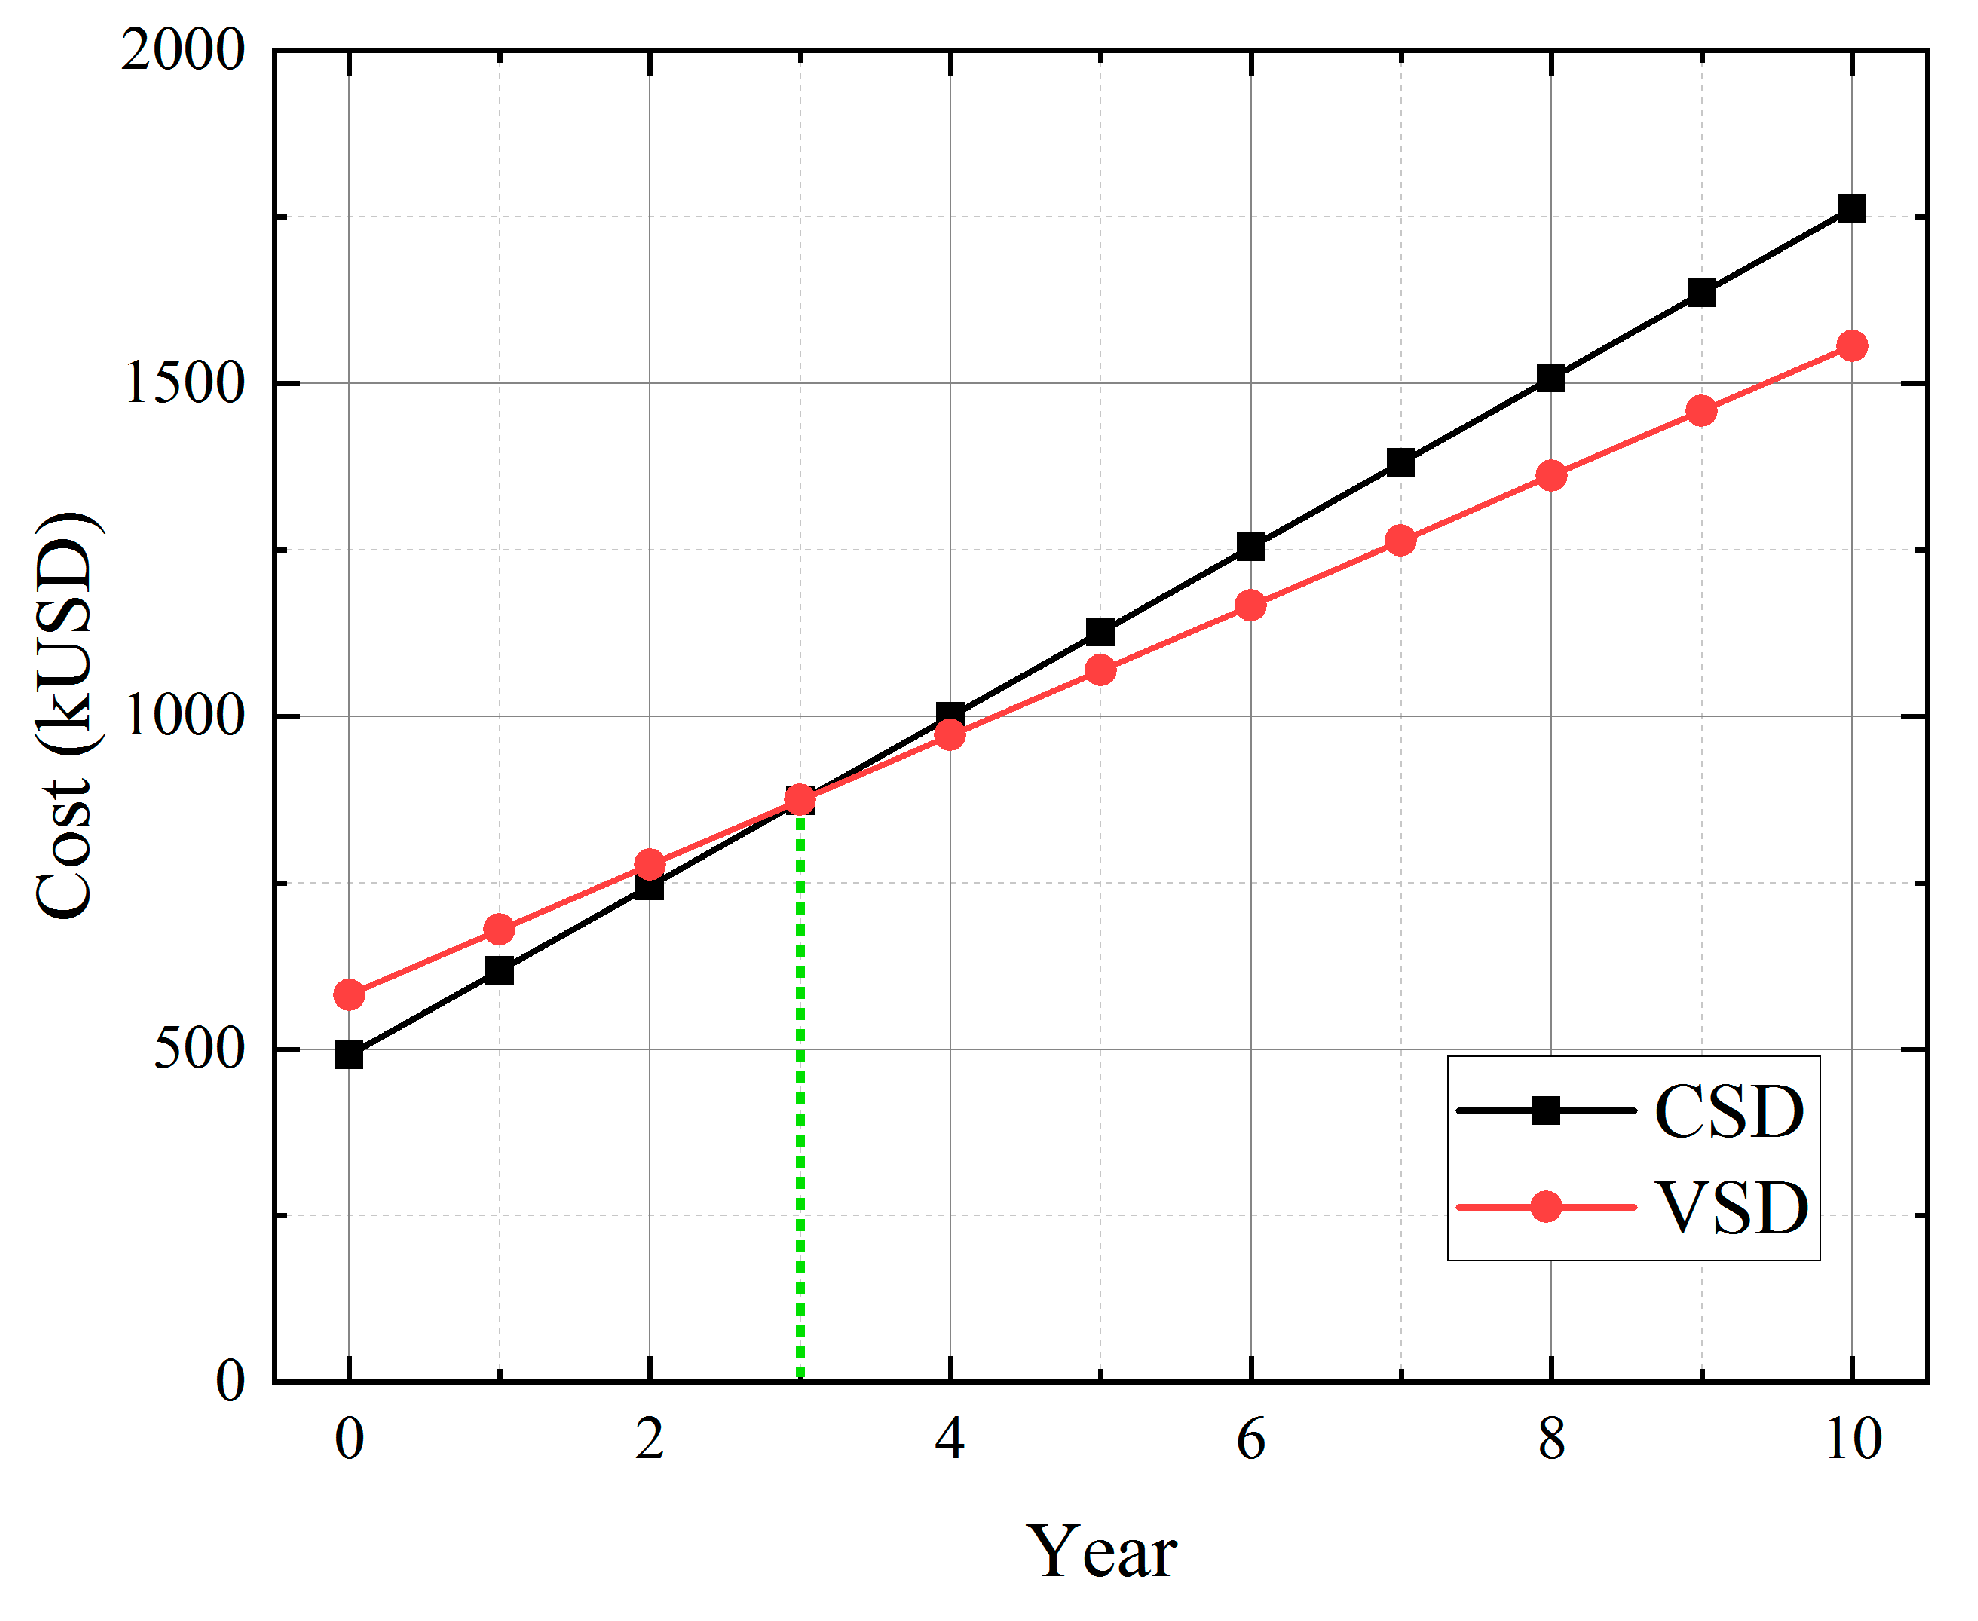
The initial investment cost of the constant speed TACC is a kUSD 364 in Korea. The additional cost of the inverter is a kUSD 120. The annual electricity costs of the CSD and VSD are kUSD 127 and kUSD 97, respectively. The results of the economic analysis for both types (CSD, VSD) of TACCS are shown in Figure 11. With respect to the constant speed TACCS, the payback period of the inverter type is expected to be 3 years in Korea. Assuming the warranty period of a TACCS is 10 years, the inverter using the VSD is kUSD 207 more economical than CSD. Comparing the tone of oil equivalent (TOE), the CSD and VSD are 939.3 TOE/year and 719.8 TOE/year, respectively, saving about 219.5 TOE/year. The greenhouse gas emissions of the CSD and VSD are 1872.5 tco2/year and 1434.9 t co2/year, respectively, which has an improvement effect of about 437.6 tco2/year.
5. Conclusions
In this paper, the energy saving effect of the variable speed TACCS using the inverter with respect to the constant speed TACCS using IGV control was analyzed. In order to reduce power consumption using the VSD in a TACCS, two controls were proposed to reduce electrical and mechanical losses. The proposed quadratic V/f control considering the load characteristics of the TACC significantly reduced the phase current magnitude of the motor at low speeds compared to the conventional linear V/f control, improving the energy saving rate to 8.86%. The effectiveness of the proposed control was verified through the comparative analysis of the experimental results using a dynamometer.
In addition, the performance curves of TACC according to the CSD using IGV control and VSD were derived through tests, and the experimental results were analyzed. As a result, it was confirmed that when the required air flow rate was more than 70% of the rating, the control for a certain pressure was excellent through the IGV control. When less than 70% of rated flow, this control became unstable because it entered the surge area.
In the case of the VSD, the high-precision control is required because it has a very sensitive TACCS response according to the operating frequency of the inverter. To prove the energy saving effect of the VSD on these response characteristics, the energy saving rate of the VSD is improved by 24.31% compared to the CSD through the load conditions that consider mechanical energy loss and daily consumption air flow rate under no load condition. In the economic analysis, the inverter using the VSD has a three-year recovery period from the initial investment and is predicted to have about kUSD 207 cost savings within the warranty period. The energy saving analysis through the proposed controls can provide good empirical evidence to establish TACCS policies.
Author Contributions
Conceptualization, S.-A.K.; methodology, K.-P.H.; software, S.-A.K.; validation, K.-P.H.; formal analysis, K.-P.H.; investigation, S.-A.K.; writing—original draft preparation, S.-A.K.; writing—review and editing, K.-P.H.; visualization, S.-A.K. All authors have read and agreed to the published version of the manuscript.
Funding
This work was supported by the Korea Institute of Energy Technology Evaluation and Planning (KETEP) grant funded by the Korea government (MOTIE) (20182010106640, Energy saving 1000 HP VSD turbo air compressor).
Institutional Review Board Statement
Not applicable.
Informed Consent Statement
Not applicable.
Data Availability Statement
Not applicable.
Conflicts of Interest
The authors declare no conflict of interest.
References
- Li, H.; Zhang, X.; Xu, F. Experimental Investigation on Centrifugal Compressor Blade Crack Classification Using the Squared Envelope Spectrum. Sensors 2013, 13, 12548–12563. [Google Scholar] [CrossRef] [PubMed] [Green Version]
- Baek, G.Y.; Seo, D.H.; In, B.S. Gas compressor introduction and development trend. KSFM J. Fluid Mach. 2009, 12, 76–80. [Google Scholar]
- Gwon, U. Industrial compressor technology status and development. J. KSME 2012, 52, 45–48. [Google Scholar]
- Cha, B.J. Compressor research trend. KSFM J. Fluid Mach. 2007, 10, 85–90. [Google Scholar] [CrossRef]
- Robison, D.H.; Beaty, P.J. Compressor types, classifications, and applications. In Proceedings of the 21st Turbomachinery Symposium, Texas A&M University, Turbomachinery Laboratories, Dallas, TX, USA, 28 September–1 October 1992. [Google Scholar]
- Jiang, W.; Khan, J.; Dougal, R.A. Dynamic centrifugal compressor model for system simulation. J. Power Sources 2006, 158, 1333–1343. [Google Scholar] [CrossRef]
- Zhao, D.; Blunier, B.; Dou, M.; Miraoui, A. Control of an ultra high speed centrifugal compressor for the air management of fuel cell systems. In Proceedings of the 2012 IEEE Industry Applications Society Annual Meeting, Las Vegas, NV, USA, 7–11 October 2012; pp. 1–8. [Google Scholar]
- Xu, C.; Muller, M. Development and Design of a Centrifugal Compressor Volute. Int. J. Rotating Mach. 2005, 2005, 190–196. [Google Scholar] [CrossRef] [Green Version]
- Munari, E.; D’Elia, G.; Morini, M.; Mucchi, E.; Pinelli, M.; Spina, P.R. Experimental Investigation of Vibrational and Acoustic Phenomena for Detecting the Stall and Surge of a Multistage Compressor. J. Eng. Gas Turbines Power 2018, 140, 092605. [Google Scholar] [CrossRef]
- Casey, M.; Robinson, C. A Method to Estimate the Performance Map of a Centrifugal Compressor Stage. J. Turbomach. 2012, 135, 021034. [Google Scholar] [CrossRef]
- Mojaddam, M.; Pullen, K.R. Optimization of a Centrifugal Compressor Using the Design of Experiment Technique. Appl. Sci. 2019, 9, 291. [Google Scholar] [CrossRef] [Green Version]
- Kim, S.-A.; Hong, K.-P. Development of Average Model to Analysis Dynamic Characteristics of Variable Speed Driven Turbo Air Compressor System with Multi Level Inverter. Trans. Korean Inst. Electr. Eng. 2020, 69, 1200–1207. [Google Scholar] [CrossRef]
- Ristanovic, D.; Taher, M.; Getschmann, T.; Bhatia, N. Large Synchronous Motors as Drivers for Centrifugal Compressors in LNG Liquefaction Plants. IEEE Trans. Ind. Appl. 2020, 56, 6083–6093. [Google Scholar] [CrossRef]
- Mohseni, A.; Goldhahn, E.; Braembussche, R.A.V.D.; Seume, J.R. Novel IGV Designs for Centrifugal Compressors and Their Interaction with the Impeller. J. Turbomach. 2011, 134, 021006. [Google Scholar] [CrossRef]
- Bentaleb, T.; Cacitti, A.; De Franciscis, S.; Garulli, A. Multivariable control for regulating high pressure centrifugal compressor with variable speed and IGV. In Proceedings of the 2014 IEEE Conference on Control Applications (CCA), Juan Les Antibes, France, 8–10 October 2014; pp. 486–491. [Google Scholar]
- Lim, J.; Yoon, M.S.; Al-Qahtani, T.; Nam, Y. Feasibility Study on Variable-Speed Air Conditioner under Hot Climate based on Real-Scale Experiment and Energy Simulation. Energies 2019, 12, 1489. [Google Scholar] [CrossRef] [Green Version]
- Chen, I.Y.; Chen, Y.M.; Chang, Y.J.; Wei, C.S.; Wang, C.C. A comparative study between a constant-speed air-conditioner and a variable-speed air-conditioner. ASHRAE Trans. 2009, 115, 326–332. [Google Scholar]
- Al-Tamimi, O.; Kassas, M. Experimental investigation of energy consumption of VFD and ON/OFF A/C systems in residential area in Saudi Arabia. In Proceedings of the 2018 IEEE International Conference on Industrial Technology (ICIT), Lyon, France, 20–22 February 2018; pp. 401–406. [Google Scholar]
- Yussif, N.; Sabry, O.H.; Abdel-Khalik, A.S.; Ahmed, S.; Mohamed, A.M. Enhanced Quadratic V/f-Based Induction Motor Control of Solar Water Pumping System. Energies 2020, 14, 104. [Google Scholar] [CrossRef]
Figure 1.
Block diagram of a turbo air centrifugal compressor system (TACCS). IGV: inlet guide vane; BOV: blow of valve; CV: control valve.
Figure 1.
Block diagram of a turbo air centrifugal compressor system (TACCS). IGV: inlet guide vane; BOV: blow of valve; CV: control valve.

Figure 2.
Experimental configuration for performance evaluation of the electric motor drive system (EMDS) according to load curves. (a) Ideal load curves; (b) diagram of experimental configuration.
Figure 2.
Experimental configuration for performance evaluation of the electric motor drive system (EMDS) according to load curves. (a) Ideal load curves; (b) diagram of experimental configuration.

Figure 3.
Experimental setups for performance evaluation of the EMDS. (a) Induction motor and dynamometer; (b) multi-level inverter.
Figure 3.
Experimental setups for performance evaluation of the EMDS. (a) Induction motor and dynamometer; (b) multi-level inverter.

Figure 4.
Operating principle according to linear V/f control and quadratic V/f control. (a) Voltage pattern curves; (b) control configuration. SPWM: sinusoidal pulse width modulation.
Figure 4.
Operating principle according to linear V/f control and quadratic V/f control. (a) Voltage pattern curves; (b) control configuration. SPWM: sinusoidal pulse width modulation.

Figure 5.
Performance curves measured at the input terminals of induction motor according to linear and quadratic V/f controls. (a) Line to line voltages curves; (b) phase current curves; (c) power curves; (d) efficiency curves of the induction motor.
Figure 5.
Performance curves measured at the input terminals of induction motor according to linear and quadratic V/f controls. (a) Line to line voltages curves; (b) phase current curves; (c) power curves; (d) efficiency curves of the induction motor.

Figure 6.
Performance curves measured at the input terminals of multi-level inverter according to linear and quadratic V/f controls. (a) Line to line voltages curves; (b) phase current curves; (c) power curves; (d) efficiency curves of EMDS.
Figure 6.
Performance curves measured at the input terminals of multi-level inverter according to linear and quadratic V/f controls. (a) Line to line voltages curves; (b) phase current curves; (c) power curves; (d) efficiency curves of EMDS.


Figure 7.
Experimental setup for performance evaluation of TACCS. TACC: turbo air centrifugal compressor.
Figure 7.
Experimental setup for performance evaluation of TACCS. TACC: turbo air centrifugal compressor.

Figure 8.
Performance curves of the TACCS using the constant speed drive (CSD). (a) Pressure curves; (b) isothermal efficiency curves; (c) power curves.
Figure 8.
Performance curves of the TACCS using the constant speed drive (CSD). (a) Pressure curves; (b) isothermal efficiency curves; (c) power curves.

Figure 9.
Performance curves of the TACCS with the variable speed drive (VSD). (a) Pressure curves; (b) isothermal efficiency curves; (c) power curves.
Figure 9.
Performance curves of the TACCS with the variable speed drive (VSD). (a) Pressure curves; (b) isothermal efficiency curves; (c) power curves.

Figure 10.
Power consumption curves of the TACCS according to the CSD and VSD. (a) Power curve of the TACCS at no load condition; (b) comparison of power and power consumption curves.
Figure 10.
Power consumption curves of the TACCS according to the CSD and VSD. (a) Power curve of the TACCS at no load condition; (b) comparison of power and power consumption curves.

Figure 11.
Recovery period of the initial investment in Korea.


Table 1.
Specifications of a TACCS
| Item | Value | Item | Value | ||
|---|---|---|---|---|---|
| Turbo air compressor | Number of stages | 3 | Motor | Motor type | Induction |
| Rated air flow rate | 10,000 m3/h | Rated voltage | 6.6 kV | ||
| Shaft power | 848.9 kW | No. of poles | 2 | ||
| Rated pressure | 8 bar | Rated power | 1050 kW | ||
| Shaft speed | 3600 rpm | Inverter | Input voltage | 6.6 KV | |
| Type | Centrifugal | Topology | 11 level | ||
| Gear ratios | 1:8.8:8.8:10.6 | Switching frequency | 10 kHz | ||
| Control method | V/f | ||||
Table 2.
Comparison of power consumption according to the CSD and VSD.
| Section | Power Consumption (kWh) of the CSD | Power Consumption (kWh) of the VSD | ||||
|---|---|---|---|---|---|---|
| Cycle 1 | Cycle 2 | Cycle 3 | Cycle 1 | Cycle 2 | Cycle 3 | |
| 1 | 45.42 | 45.07 | 44.95 | 45.22 | 44.99 | 44.95 |
| 2 | 27.33 | 27.17 | 27.08 | 27.18 | 27.15 | 27.14 |
| 3 | 24.25 | 24.13 | 24.05 | 24.13 | 24.08 | 24.06 |
| 4 | 52.74 | 52.95 | 52.90 | 16.72 | 16.71 | 16.70 |
| Subtotal | 149.74 | 149.33 | 149.01 | 113.15 | 113.17 | 112.85 |
| Total | 448.08 | 339.17 | ||||
Publisher’s Note: MDPI stays neutral with regard to jurisdictional claims in published maps and institutional affiliations. |
© 2021 by the authors. Licensee MDPI, Basel, Switzerland. This article is an open access article distributed under the terms and conditions of the Creative Commons Attribution (CC BY) license (http://creativecommons.org/licenses/by/4.0/).
Share and Cite
MDPI and ACS Style
Kim, S.-A.; Hong, K.-P. Analysis and Experimental Verification of a Variable Speed Turbo Air Centrifugal Compressor System for Energy Saving. Energies 2021, 14, 1208. https://0-doi-org.brum.beds.ac.uk/10.3390/en14041208
AMA Style
Kim S-A, Hong K-P. Analysis and Experimental Verification of a Variable Speed Turbo Air Centrifugal Compressor System for Energy Saving. Energies. 2021; 14(4):1208. https://0-doi-org.brum.beds.ac.uk/10.3390/en14041208
Chicago/Turabian StyleKim, Sung-An, and Kyung-Pyo Hong. 2021. "Analysis and Experimental Verification of a Variable Speed Turbo Air Centrifugal Compressor System for Energy Saving" Energies 14, no. 4: 1208. https://0-doi-org.brum.beds.ac.uk/10.3390/en14041208
Note that from the first issue of 2016, this journal uses article numbers instead of page numbers. See further details here.