1. Introduction
The current high emission rates of carbon dioxide in the atmosphere has raised the interest in the climate emergency following the estimation of the depletion of the total cumulative carbon allocation in 2057 [
1]. To keep the global average temperature below 2 °C above pre-industrial level [
2], all human activities need to be involved in the process of decarbonization to guarantee a more sustainable future to the planet. The European Commission (EC) with the Energy Performance of Buildings Directive (EPBD) paid particular attention to the building sector, since responsible for 40% of energy consumption and 36% of all greenhouse gas emissions in Europe [
3], and raised the importance of nearly-zero operational energy buildings [
4], defined as a building that has a very high energy performance and low amount of energy required, sourced to a very significant extent by energy from renewable sources [
5]. The adoption of a holistic approach when analysing and optimizing buildings [
6] is made necessary with the growing interest in building fabric, otherwise known as a Fabric First Approach (FFA) [
7]. The key focus of the FFA is on improving airtightness and the fabric U-values, a unit of measurement for heat to flow from the exterior to the interior environment or vice versa, assuming the conditions stay steady [
8]. Besides, FFA suggests reducing TBs and use energy-efficient ventilation [
7]. The same criteria have long been recommended by the German Passivhaus Institute (GPI) standards [
9], which specifies a high level of insulation to pursue very low U-values. The increased demand for TF construction in Wales, United Kingdom (UK), since 2018 is mainly because of the Welsh Government (WG) requiring 60% of new homes to be build with timber [
10], and then in 2019 including TF MMC as one solution in their 10 point plan to mitigate against the climate emergency [
11]. The rise in OSM in the UK is due to several factors underlined in the Farmer report from 2016 [
12], which concluded that if the construction sector continued to favour traditional forms of onsite construction methods then it could not meet the demand for high-quality buildings across many sectors, partly because of increased instances of the performance gap and a growing skills gap. Whereas OSM of MMC, in controlled factory conditions, is deemed to eradicate the performance gap, with techniques such as design for manufacture, lean manufacturing management, and weather-protected materials during storage and manufacture into MMC fabric systems. However, there is concern amongst some that there could be increased risks of thermal bridging in TF MMC, as the engineering performance of timber is not deemed as sufficiently proven as that of concrete and steel [
13], particular related to timber to insulation ration or Timber Frame Fraction (TFF). This paper discusses the second phase of three phases in a PhD research project, responding to the above UK challenges and to increase the thermal performance of OSM TF MMC systems for dwellings. Besides, the paper verifies that as-designed U-values can be achieved in design-for-manufacture and OSM, and not create similar instances of the performance gap when compared with traditional forms of construction. Also, the paper discusses and illustrates results from a methodology which separates the non-repeating and RTBs from five different building typologies built for social housing in Wales. RTBs due to framing elements impacts directly on the thermal transmittance of TF closed panel for exterior wall systems, differing from offsite to onsite, where further timber elements are added for structural connection. From the first phase of the project 2018–2019 [
14,
15], an OSM in south Wales, UK and their closed panel exterior wall TF MMC system was identified as a case study for phase two of the research project. The case study exterior wall system is manufactured with one of three TF stud sizes: 140/197/220 millimeters (mm), using one of the two types of breather membranes (first, with high emissivity, to prevent interstitial condensation, and the second, with low emissivity, to enhance also the thermal performance properties), synthetic non-breathable polyisocyanurate insulation (pumped into the panel), and two ply boards or Oriented Strand Boards (OSB) sheathing options and a flanking insulation layer, either with low or high emissivity finishing layer to achieve U values between 0.25 to 0.10 W/m
2K (the company wish to remain anonymous, hence no citation to their technical details).
Background
The UK’s national plan aims to deliver ‘zero carbon’ new buildings to meet carbon and energy targets, reducing the energy demand and improving the efficiency of construction and equipment [
16,
17]. To satisfy the aspirational benchmarks, actual UK Building Regulations instruct the building compliance through the Standard Assessment Procedure (SAP)—the calculation methodology to evaluate the Dwelling carbon dioxide (CO
2) Emission Rate (DER), which is evaluated on the actual dwelling and then compared with the Target Emission Rate (TER) evaluated on a notional building of the same shape and size [
18,
19,
20,
21]. All regulations across UK impose limits on the fabric U-values to avoid unwanted heat losses or heat gains. U-values are representative of the heat losses through building elements [
22] and differ among the fabric elements as illustrated in
Table 1.
Also, U-value limits are different in the four nations of the UK, where Welsh U-values for exterior wall constructions are the stricter, although not as low as the GPI. The regulator authorities are already aware of the fundamental role of the building envelope in energy balance therefore, the evaluation of the building components thermal properties necessitate a high level of precision [
23]. While the above mentioned UK regulations impose strict benchmarks on the U-value, scarce attention is given to TBs, except for buildings constructed to comply the GPI standards that define ‘TB free’ dwellings by limiting the linear transmittance of non-RTBs [
24]. Also, architectural practices are incline to uniquely implement the U-values of wall, roof and floor according to the regulations in force, while less attracted by evaluating and reducing TBs, by reason of lack of qualified personnel and low interest on TBs [
25].
TBs are defined in the EN ISO 10211 [
26] as a zone with thermal properties significantly different from the surrounding areas, where heat flow through the material is not considerable mono-dimensional due “to full or partial penetration of the building envelope by materials with a different thermal conductivity, and/or a change in thickness of the fabric, and/or a difference between internal and external areas”. TBs are classified into punctual and linear, as shown in
Figure 1. Point TBs happen when three planar elements intersect (for example, two walls and a floor), or when a fixing system is used. Similarly, linear TBs happen when two planar elements intersect (i.e., wall-roof, wall-floor, wall-window, two walls) [
26].
A further classification distinguishes TBs in [
28]: RTBs, (i.e., fixings, mortar joists, timber joists/rafters, etc.) and non-RTBs (i.e., junctions of external walls with roof and floor, windows, doors, etc.). RTBs additional heat flow can be included in the component U-value, while non-RTB extra heat flow is computed separately and included when evaluating the total heat transmission coefficient of a building. TBs are evaluated numerically under steady-state methods in line with the technical standards and regulations in force in the UK, when thermal properties of the materials, the geometry of the detail and boundary conditions are established [
26].
As discussed in the Introduction Section above, OSM TF closed panel systems are classified as MMC which, when used for exterior walls, adopt standardized timber sizes, breathable or non-breathable, synthetic or natural materials for insulation, Vapour Control Layers (VCL) along with careful detailing to ensure durability [
29]. The use of reflective VCLs with self-adhesive tape for tightening performs well with TF solutions [
30] and reduces the building air leakage while enhances the control of the indoor volume of air to ventilate. Building an airtight envelope is perhaps beneficial and necessary in the huge challenge represented by the COVID19 pandemic because the transmission commonly occurs in enclosed indoor spaces incorrectly ventilated [
31]. Monitoring the building ventilation helps to organise a smart strategy to obtain a safe and controlled environment when compared with natural ventilation [
32].
TF structures rely on a composition of timber studs and rails together with a single (called open panel) or double (called closed panel) structural sheathing board, generally OSB, to form a unique frame capable to transmit all vertical and lateral loads to the foundation [
33]. The different insulation solutions, both natural or not, between consecutive studs and/or as a flanking element, satisfy the U-value requirements of the national regulations with the potential to direct the future aim of zero-carbon housing [
34]. Design and workmanship errors, as well as erection and manufacture errors, must be avoided in order to achieve the designed U-values and consequent satisfactory energy efficiency [
35,
36]. Good detailing at junctions, especially around openings is critical, as the added benefit of the insulation can be lost because of discontinuities introduced by manufacturing and site operations, which should guarantee that TF is constructed following the design [
29].
Notwithstanding the precautions of trained personnel and accuracy of the CNC machines [
33], TBs in TF structures increase the heat transfer of external walls, because of the panel layout; alternated studs and insulation elements represent a classic case of linear RTBs extensively spread throughout the wooden structure [
27,
37]. The structural studs create several linear RTBs in the insulation layer, affecting the thermal properties of the layer itself [
38]. Nonetheless, few studies have investigated this aspect related to OSM closed TF panels. The following sections will show in more detail how the TF panels performance is significantly affected by TFF. The methodology to calculate the TFF will be explained and applied to five dwelling types from the Welsh manufacture.
2. Materials and Methods
The TF structure has particular mass distribution and inertia, not comparable to a homogeneous wall with regular and continuous layers of materials: wooden studs create numerous thermal bridges, but they also represent the major part of wall inertia [
38]. The Timber Fraction or TFF is defined as the percentage of the surface area of the wall occupied by framing members that bridge the insulation [
39] and reflects the quantity of wood that breaks the insulation causing an extra heat flow [
40]. This amount of timber is considered as RTB, and therefore must be included in the U-value calculation of the building element.
Few studies have dealt with TFF, however, it is significant since it can impact upon the performance gap, defined as the disagreement of predicted design performance and real measured performance in situ [
41]. Bell and Overend [
42] assessed two dwellings (a terrace of three bedrooms, three-storey townhouses and a two-storey development of student housing) and demonstrated that the 1995 and 2002 UK Approved Document—part L (ADL) of building regulations highly underestimate TFF. The obtained values span from 27.9% to 39.7% (including all the TF elements and without separation of RTBs and non-RTBs). Same accounting method has been adopted by Qasass et al. [
39] in Canada who measured the TFF in seventeen houses, including four detached houses, eight semi-detached houses, and five town-houses. Results showed that TFF can span from 29.3% to 41.8%. Kosny [
43] used a 27% TFF (including only RTB) both on its hot box experiments and computational thermal analysis, to demonstrate the sensitivity of wood-frame structures to imperfection and gaps when compared with an equivalent in steel.
Another research project lead by Carpenter and Schumacher [
37], prepared for The American Society of Heating, Refrigerating and Air-Conditioning Engineers (ASHRAE), audited 120 dwellings to modify the previous ‘typical’ values of the TFF used in practice and concluded that the typical net framed area for an external wall is 25% (including all timber elements). The 2019 Californian Residential Compliance Manual, part of the Building Efficiency Standards—Title 24 [
44] suggest to use a framing factor of 25% for 16-inch (≃406 mm) stud spacing, 22% for a 24-inch (≃609 mm) spacing, and 17% for Advanced Wall Systems (AWS), referring to a set of framing techniques and practices that minimize the amount of wood to build a structurally safe and durable energy-efficient building. Also, specific indications are given to wood-framed walls where a minimum of R-11 (for a given thickness, the R-value, largely used in the US, is equivalent to the inverse of the U-value, therefore for clarity R-11 equates a U-value of 0.09 W/m
2K [
45]) insulation between framing members or the weighted average U-value of the wall assembly shall not exceed 0.110 W/m
2K [
46].
In the UK, the problem of the TFF was first addressed by the 1995 ADL-1a of the England and Wales Building Regulations [
47], where Appendix B includes a calculation example of U-value for a TF wall according to the Proportional Area Method where the fractional area of the stud is obtained dividing the timber stud width (38 mm) by the spacing interval (600 mm) [
28,
47]. The result shows the use of a TFF of 6.3%. The 2002 ADL1 [
48] introduces the Combined Method set out in BS EN ISO 6946 [
49] and in the Appendix B example assumes a fractional area of 15%. Newer versions of ADL, 2006, 2010 and 2013 (actual) [
50,
51,
52], still adopt the Combined Method recalled in the Building Research Establishment Report (BR) 443 (2006) maintaining the default TFF to 15% [
28].
The last consultation document updating the Welsh ADL [
53] proposes to adopt the new version of BR 443 (2019) [
54], which gives guidance on conventions for U-value calculations primarily reflecting changes in British, European and International standards; industry practice; and industry publications. The new BR 443, as well as the old 2006 version, suggests three approaches to the TFF. The first suggests using a default fraction of 15%, calculated on 38 mm timbers at 600 mm centres for 1-storey and 2-storey buildings, and reducing centres on the lower floors of 3-, 4- and 5-storey buildings of 400 mm and 300 mm centres; this percentage represents a common approach widely used among the TF manufacturers according to the designers of the company manufacturer. The second approach suggests using a lower fraction of 12.5% if a list of criteria reducing the presence of timber are met (i.e., single top plate, no timber noggin, etc.). The last approach allows the calculation of the TFF percentage according to a few suggestions: exclude timbers that are outside the wall area used for heat loss calculations; exclude a zone around windows and doors of 50 mm at the sill and each jamb and 175 mm at the top; include all timbers that are not insulated behind.
The 2019 Chartered Institute of Building Service Engineers (CIBSE) Guide A [
55] considers TF a structure consisting of studs, noggins, top and bottom plates and additional framing around windows and doors. The aforementioned guide distinguishes TF walls in wall with windows and doors, TFF equal to 15%; Wall without windows and doors, TFF equal to 10%; Narrow wall with doors and windows or wall with bay windows, TFF equal to 20%.
The importance of TFF is enormous to define for the performance of the building since it is related to the U-value calculation. The U-value of a wall which meets the 2013 Welsh ADL1 regulations of 0.21 W/m
2K with the use of a default TFF of 15% would be in error if the TFF is higher. As an example, a construction detail taken from the case study OSM is analysed adopting the materials’ conductivities declared in 2016 through the British Board of Agrément (BBA) [
56], and, integrated with primary data acquired with a direct interview of staff and an ethnographic study of the manufacturing process. The following
Table 2 shows all the materials, their thermal properties and thicknesses:
The structural TF elements have a constant depth of 38 mm and a variable thickness, spanning from 140 mm of the actual most used standard for external walls to 220 mm. The framing works thickness also defines the one of the insulation between studs, forming with the two OSB boards a unique structural element. On the internal side, the battens used to connect the internal plasterboard finishing, have a rectangular section with edges measuring respectively 25 mm and 50 mm. Externally, the thickness of the flanking insulation added on top of the structural part (composed by the two OSB on the framing timber with infilled insulation) can vary discretely in the step of 10 mm from 50 mm to reach 150 mm thicknesses. This study considers a selection of flanking insulation thickness: 0 (no insulation), 50, 100 and 150 mm. Finally, the surface resistance of the eventual VCL and reflective insulation has been accounted for by following the ISO 6946. When a reflective layer (ε = 0.03, with ε representing the emissivity of the surface) is applied directly on the flanking insulation and facing the ventilated external void, the surface resistance adopted is 0.379 m2K/W. Instead, when a reflective VCL is used in the internal service void (ε = 0.03) the resistance of the air layer is increased to 0.705 m2K/W.
The ISO 6946 describes two methods to calculate the U-values of building elements containing RTBs, such as timber studs and battens. The first method or “simplified calculation” method, also known as the “combined method”, bases the calculation of the U-value on the average of upper and lower resistance. The upper resistance is built considering all the possible thermal heat flow path through the building element considered, then multiplied by the relative fractional area. The lower resistance is built by combining the conductivity of each material composing the bridged layer, and then summing the resistance obtained with the ones of the other non-bridged layers. The second method, also known as “detailed method”, evaluates the U-value by using a numerical simulation of the building element accordingly to the rules set out by the ISO 10211.
For the calculations of this research, a Microsoft Excel spreadsheet was created following the simplified method described by the ISO 6946/BR 433, because it was retained to be the best solution to guarantee the accuracy and flexibility needed to enter all the data to evaluate the U-value of a TF detail; with two bridged layers (air void layer bridged by the battens and the main insulation layer bridged by the studs). Many software tools based on the simplified method in use in 2020, do not allow for the calculation of U-value with two bridged layers, limiting the calculation to a unique bridged layer. A sample of U-values obtained from the spreadsheet were compared with the more sophisticated numerical calculations modelled with Therm [
57], a two-dimensional (2D) conduction heat-transfer analysis tool, based on the finite-element method. Therm can model the complicated 2D geometries of building elements, and Psi-Therm, a three-dimensional (3D) heat transfer tool using the finite-element method. Furthermore, the results have been compared with Passive House Planning Package (PHPP) and Full Standard Assessment Procedure (FSAP), simplified method tools, used in practice in UK, to determine the U-value of the building component.
Table 3 below presents the U-values calculated using the materials of
Table 2 for a construction detail with a single 38 mm stud spaced 600 mm centre-to-centre (TFF-6.33%), composed by (from internal to external) plasterboard (12.5 mm) on timber battens, high emissivity air void (25 mm), OSB-1 (9 mm), insulation (140 mm), OSB-2 (9 mm). The same calculation has been made for the same detail, but with 6 studs (TFF-38%) evenly distributed in the 600 mm section analysed:
Calculations show that there is a common agreement between U-values calculated accordingly to the different methods and tools at low TFF; the spreadsheet results are very close to the ones given by the more detailed 3D finite method analysis. At high TFF, the difference between simplified and detailed method is clearer with a maximum discrepancy of less than 2%. Therefore, the spreadsheet behaves slightly better than the other simplified method tools both at high and low TFF, and for the purpose of this paper is considered sufficiently robust and accurate to continue the analysis of the TFF.
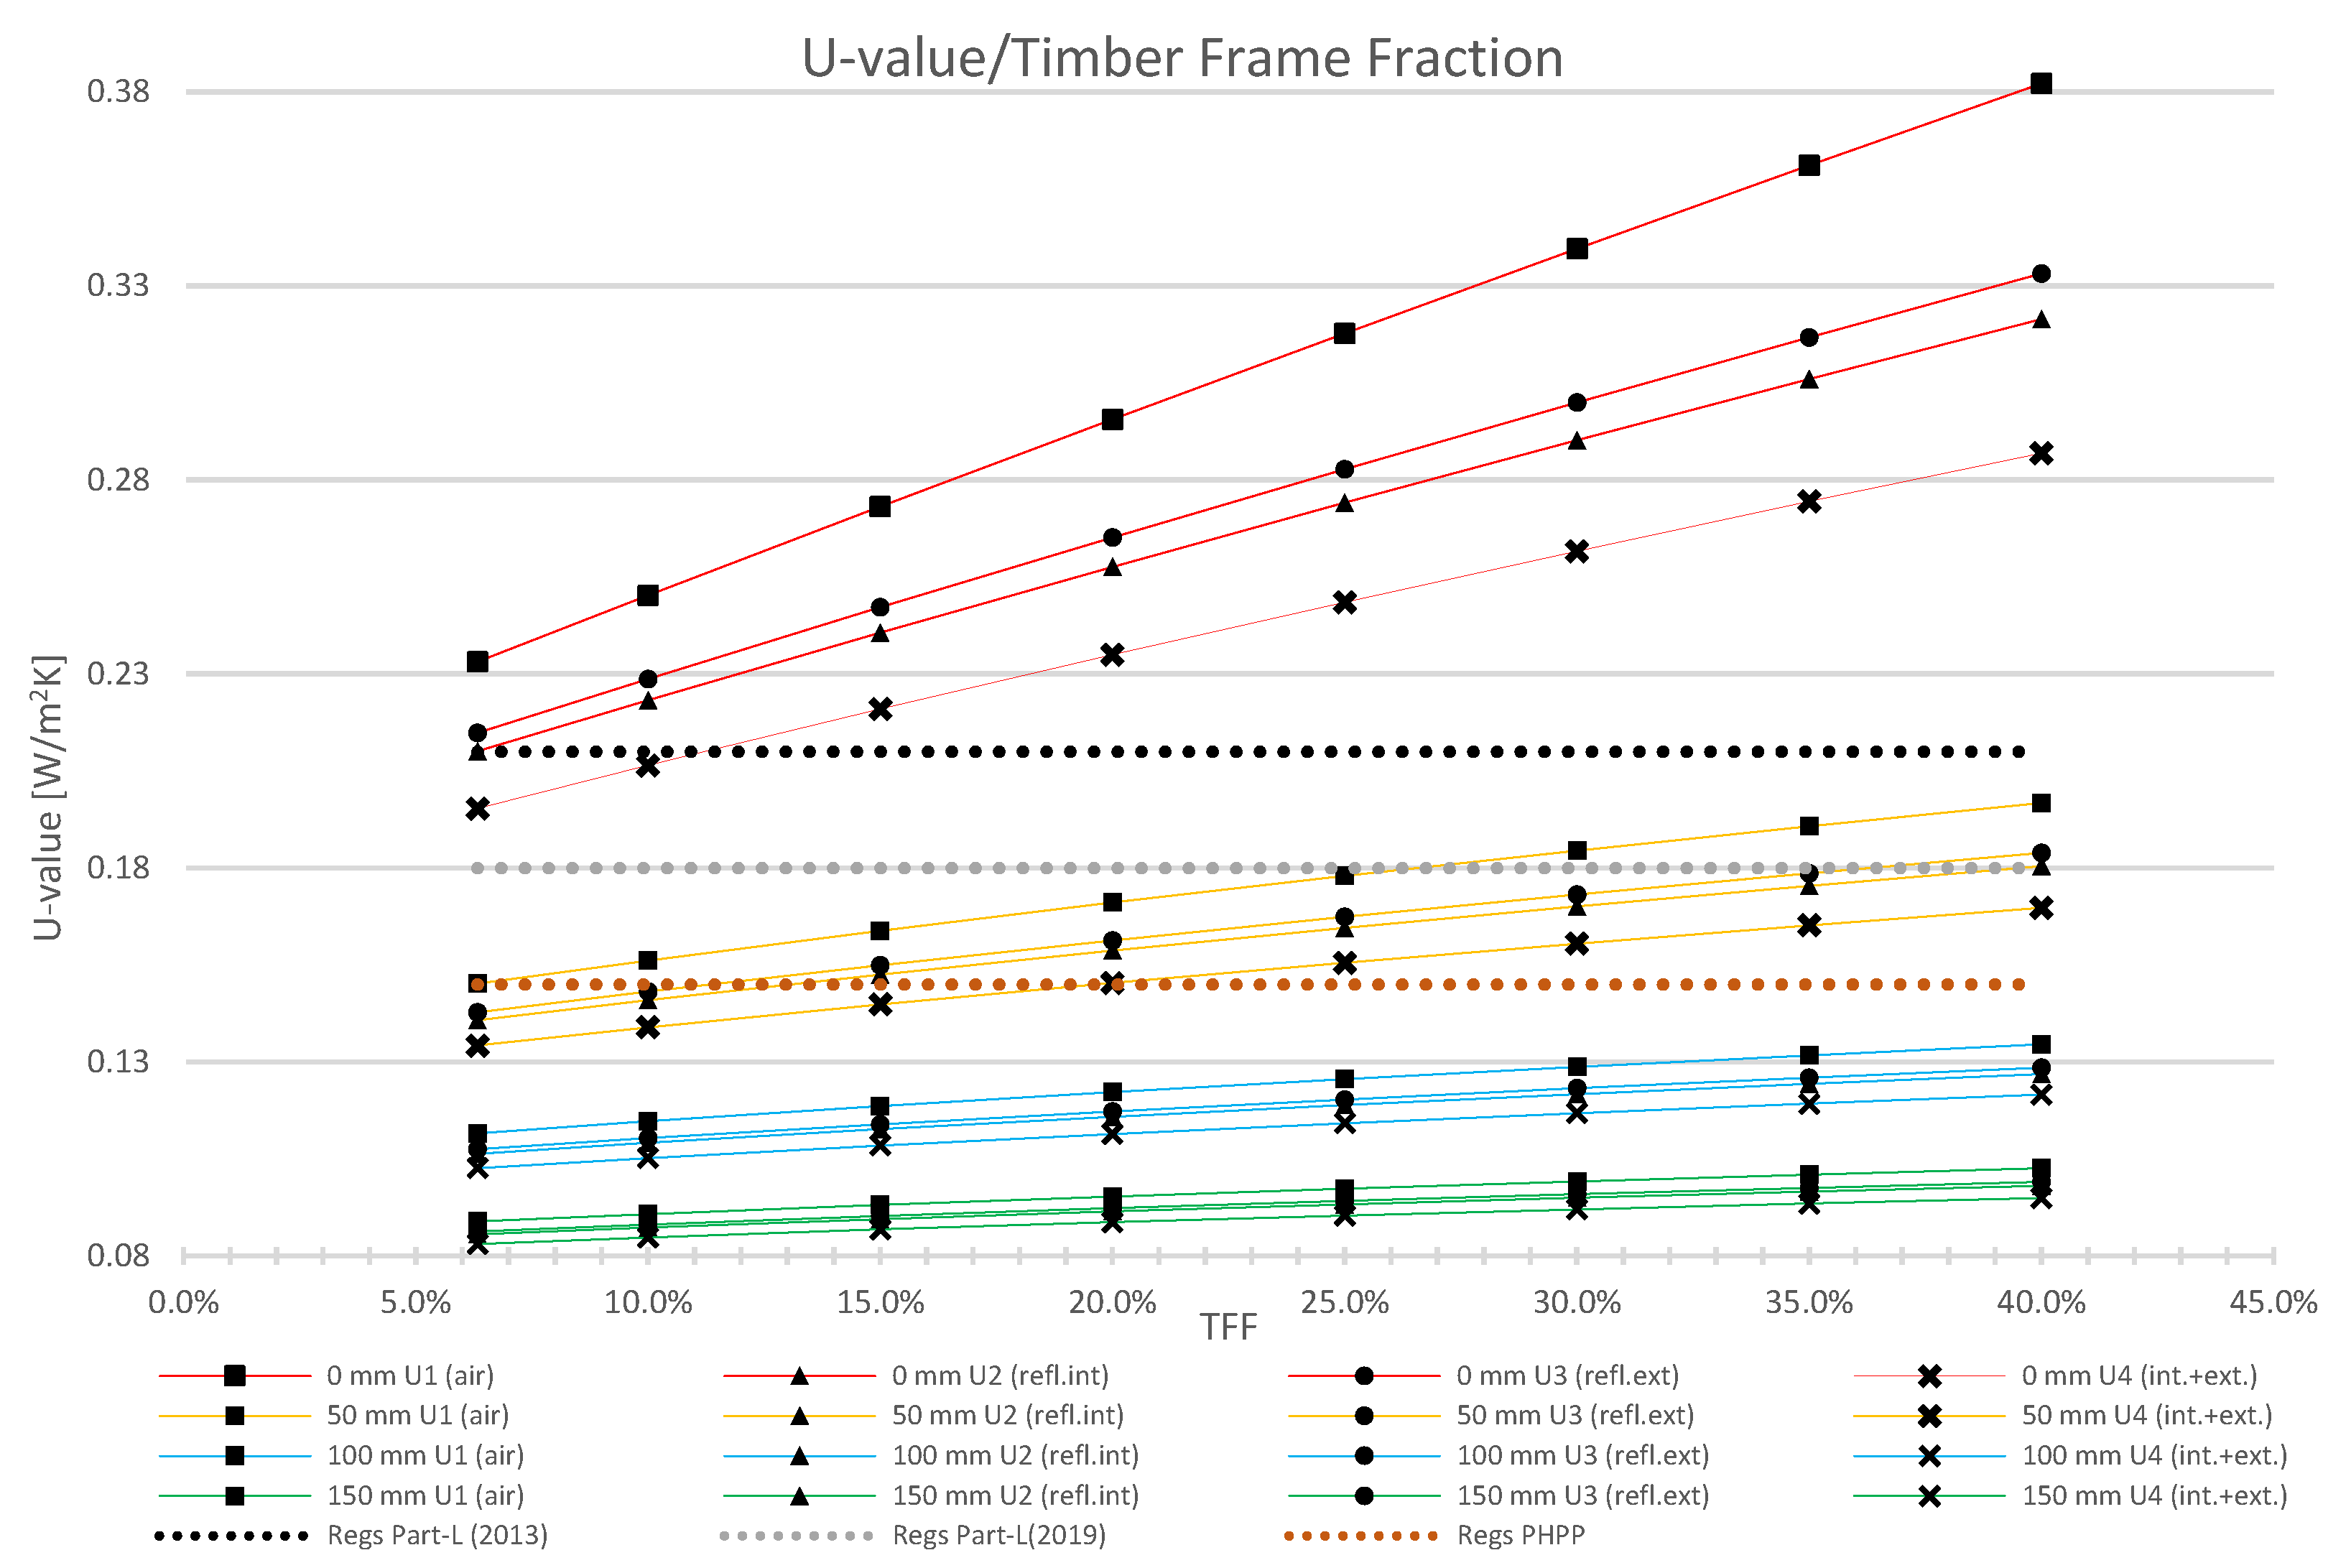
The established properties of the materials, including thicknesses, the location of low emissivity layers (see
Table 2) and the effect of the TFF on the U-value is evaluated through calculations in the spreadsheet. The TFF problem has been analyzed together with the variation of the thickness of flanking and insulation between studs. The results in
Figure 2 below assume constant insulation between studs (140 mm) and different flanking insulation thickness (0, 50 mm, 100 mm, 150 mm). The lines represent the variation of the U-value obtained by changing the TFF in the step of 5% and are clustered by colour, according to the flanking insulation thickness. Also, the use of reflective VCL and/or external reflective insulation layer has been plotted for each flanking insulation thickness.
The results show that higher percentages of TFF correspond to higher U-value of the TF construction, principally because the conductivity of the wood is higher (over four times) when compared with the insulation. It can be deduced that higher thicknesses of flanking insulation mitigate the influence of the TFF, besides the use of reflective internal and external layers reduces the U-value, and their beneficial effect diminishes with low percentages of TFF. The insertion of the only internal low emissivity layer in the air cavity reduces the U-value more significantly if compared with the use of the only reflective flanking insulation.
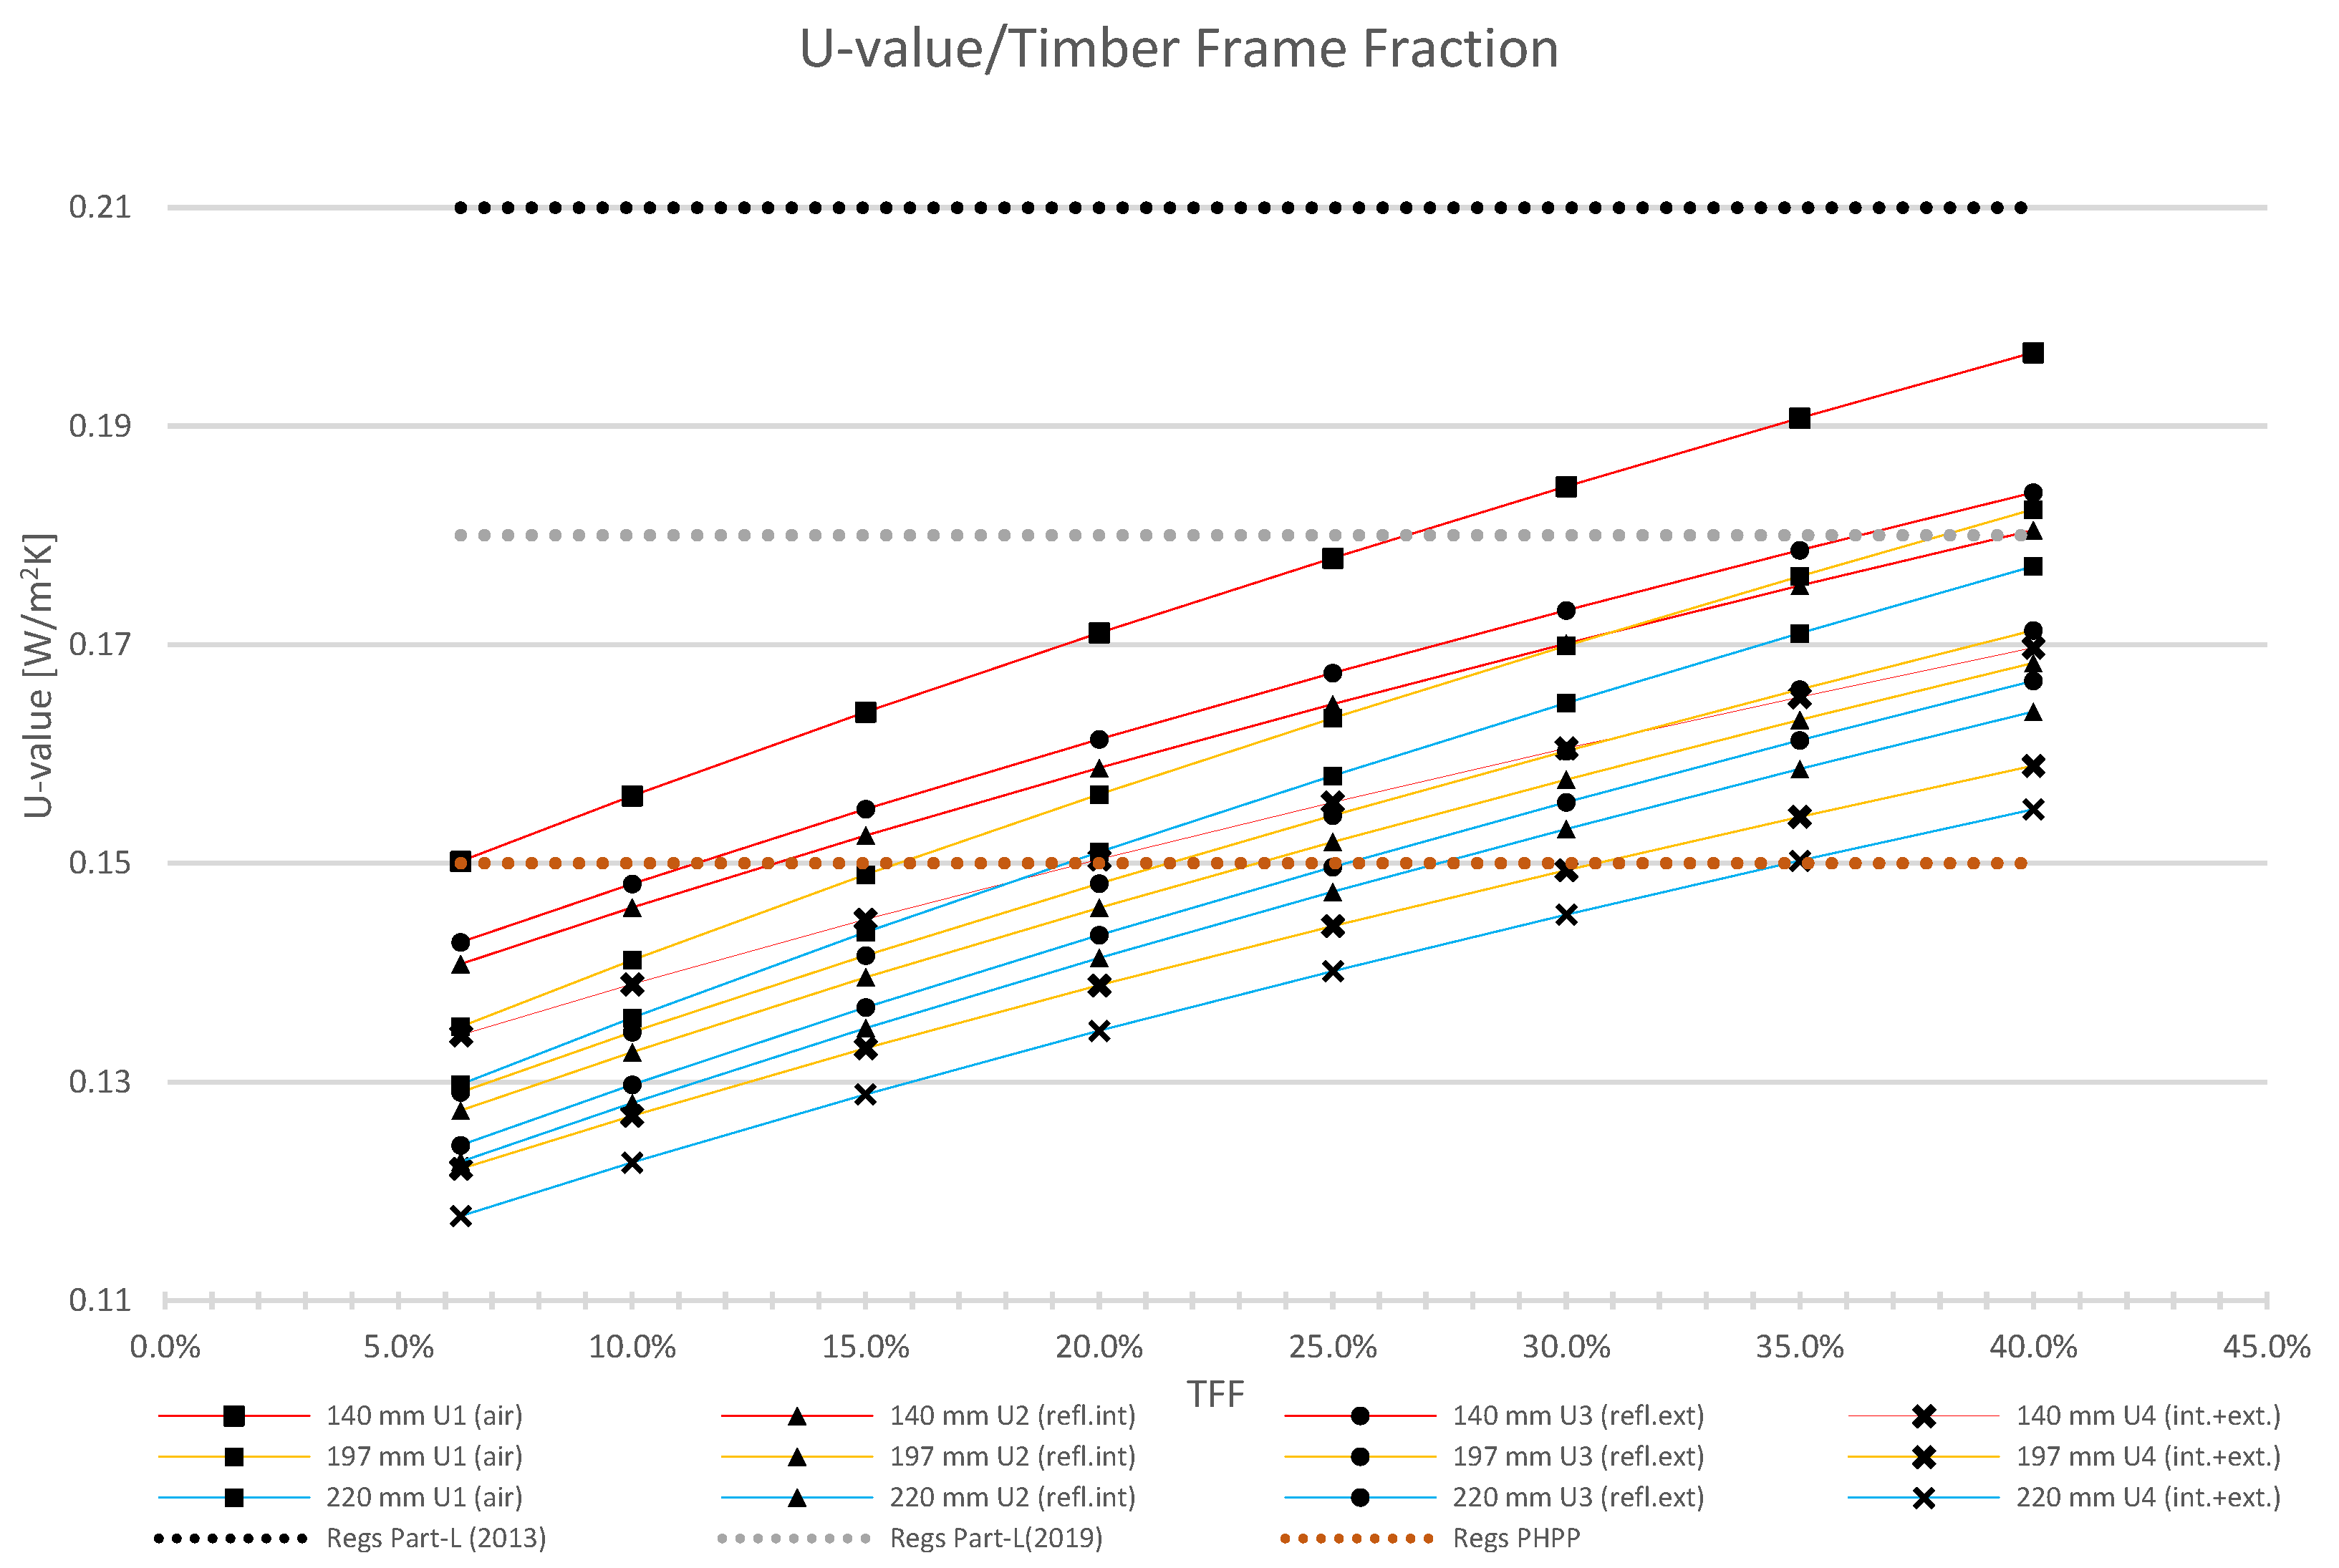
To further investigate the effect of the TFF, the U-value for the detail of
Table 2. has been calculated keeping the flanking insulation constant (50 mm) and varying the thickness of the structural core support within the limit of the available stud thicknesses offered by the UK sawmills (140 mm, 197 mm, and 220 mm). The stud thicknesses are clustered by colour and evaluated with the effect of low emissivity membranes.
Figure 3 shows the plot of changes in U-values due to the TFF:
High percentages of TFF increase the U-value as the previous case, but high thicknesses of insulation between studs attenuate the influence of the TFF to an exceedingly small extent, underlining the importance of the RTB. The use of reflective internal and external layers reduces the U-value, and their impact diminishes with low percentages of TFF. Also, in this scenario, the use of the only air void low emissivity VCL layer reduces more the U-value when compared with the adoption of the external reflective layer on the flanking insulation.
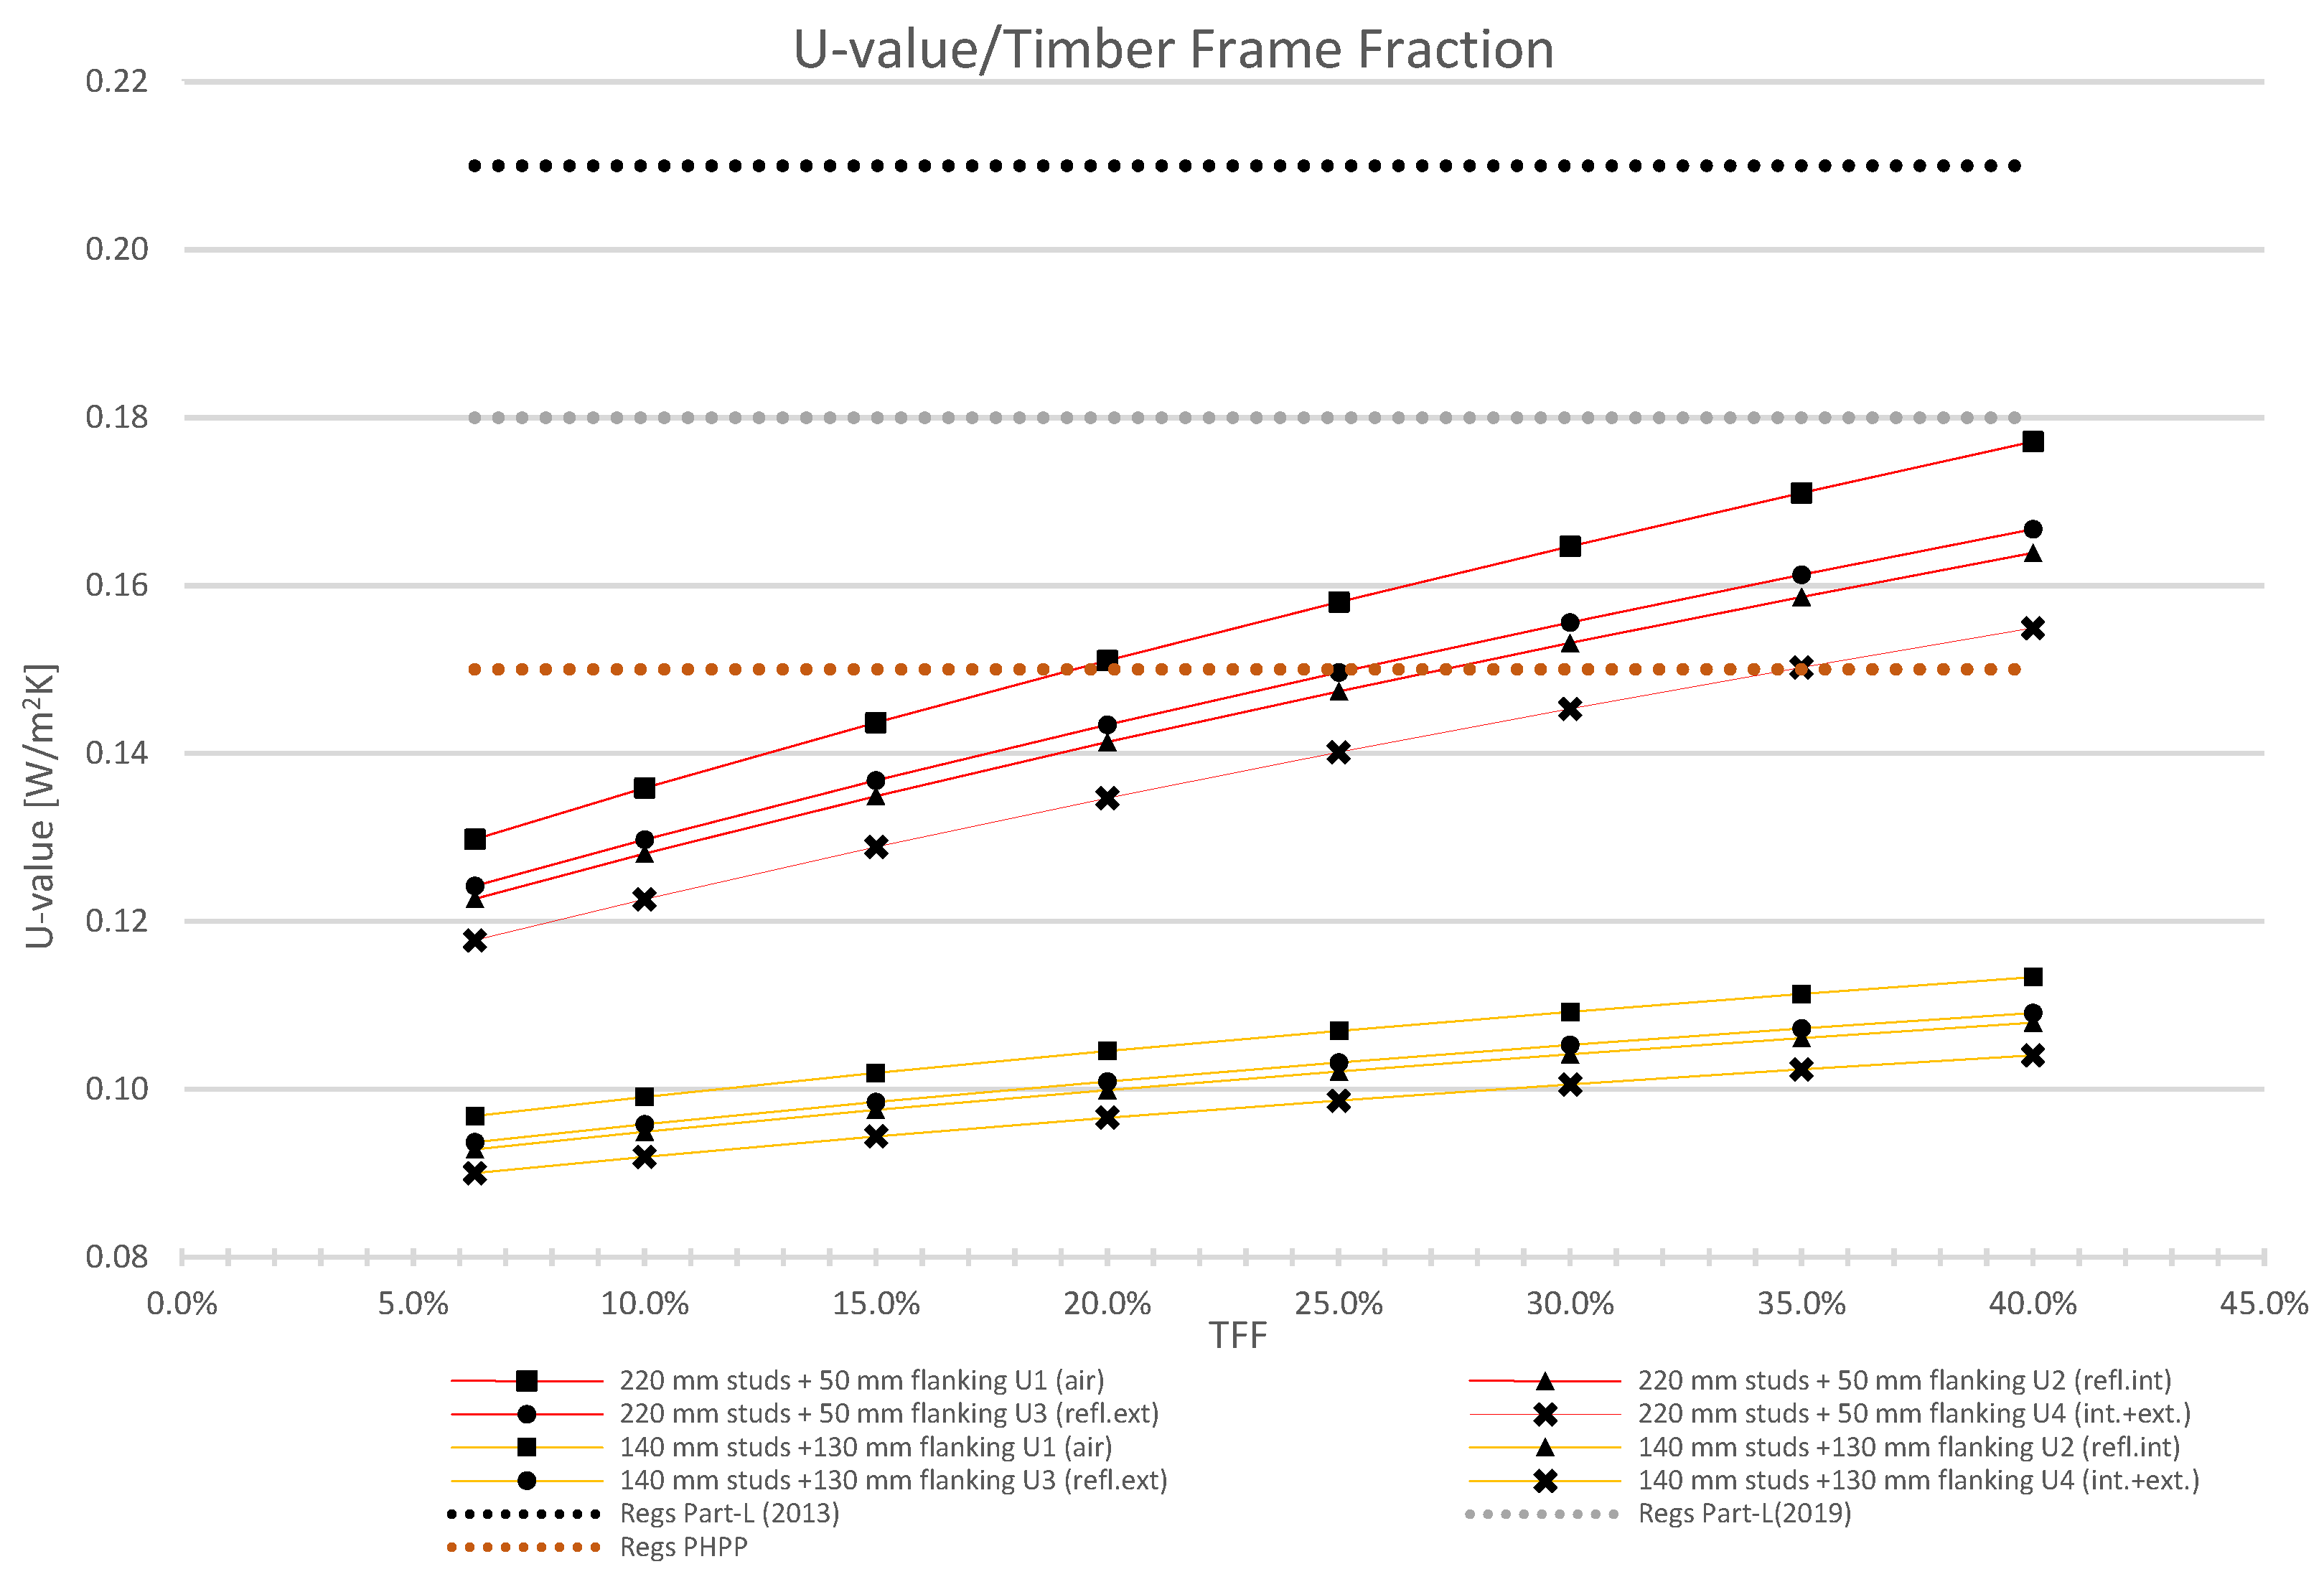
It is legitimate to compare two TF construction typologies with the same total thickness (325.5 mm) adopting two ways of implementing the U-values: one with a structural thickness of 220 mm and flanking insulation of 50 mm; the other with the structural thickness of 140 mm and 130 mm flanking insulation. All the other layers are kept unchanged between the two typologies (See
Figure 4).
The slope of the plotted lines is different, showing that the detail with thicker flanking insulation is less sensitive to changes of TFF, while the contrary can be said for the solution adopting thicker core insulation. Therefore, with the same total construction thickness, the solution adopting thicker flanking insulation is more effective against heat losses and is more resilient to changes of TFF.
In future, lower U-values are likely to be introduced by ADL regulations [
53] to reduce energy consumption aimed to minimize global warming and climate change. Consequently, higher attention to TFF and wrong detailing should be necessary because high TFF dwellings might increase if all guidance continues to ignore this aspect. Studies, regulation, and recommendations must redefine and substitute the low and dispersive knowledge on frame fraction for TF MMC panels. None of the records analysed clarifies the calculation method nor introduces a distinction between RTB and non-RTB within a TF panel, while the two categories cannot be accounted in the only TFF. Given the importance of TFF for U-values determination and the need to agree on the design and real performance, it is difficult to understand why little data exists. Hence the proposed methodology outlined in the next paragraph, analyses a series of TF panels, and defines a set of rules to calculate accurately framing elements accountable for RTB and non-RTBs, avoiding the double-counting of the elements in both categories.
Methodology to Calculate TFF from Manufacturing Drawings
Most of the relevant literature evaluates the TFF on the entire panel and without any separation attributable to thermal bridging considerations. The BR 443 [
28] attempts to define the TFF usable for U-value calculation by articulating some guidelines that suggest excluding timbers that are outside the wall area used for heat loss calculations, discounting as well a zone around windows and doors and all timbers that are not insulated behind. The methodology adopted to measure the TFF in the panels analyzed separates the total framing elements of TF external walls into accountable for RTBs and non-RTBs. For TF panels, the non-repeating category is defined by the surface area of all the elements in the proximity of corners, windows and doors framing; it is the case of connection railings between wall and floor, which are considered in the non-RTB calculations and accountable as ψ-value. The ψ-value is clarified by the ISO 10211 and represents the linear thermal transmittance which is a quantity describing the influence of the linear TB on the total heat flow [
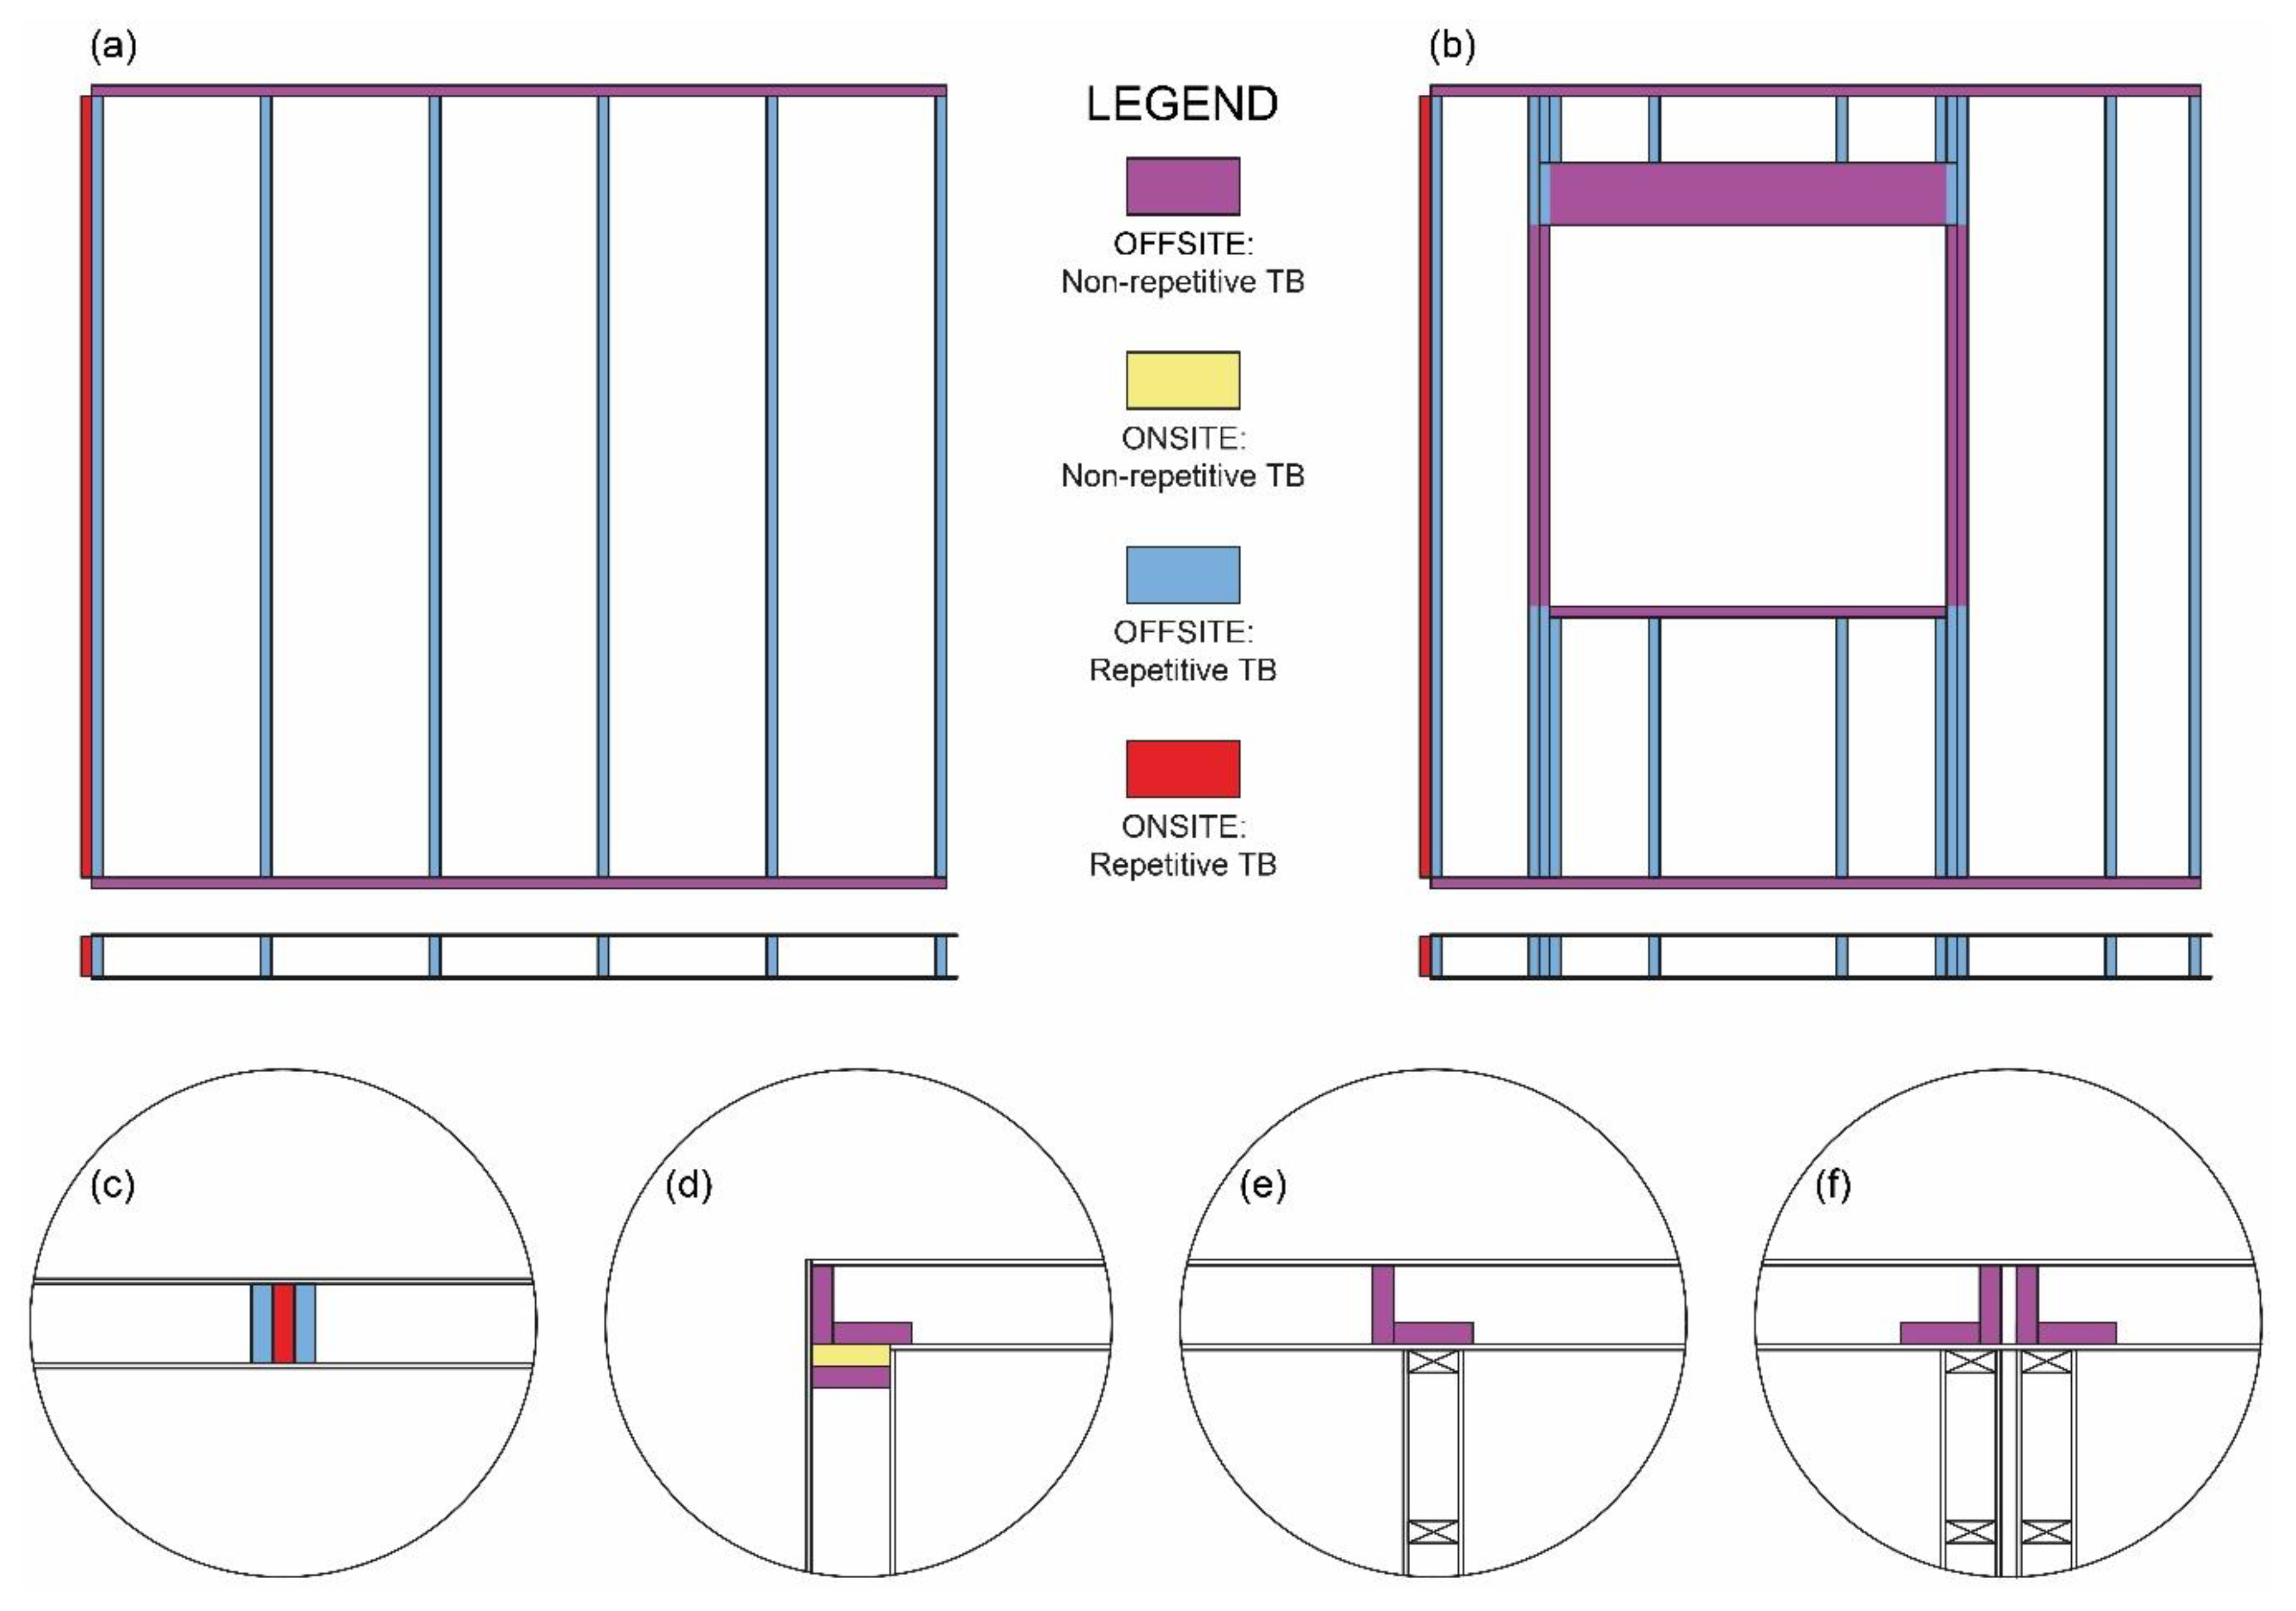
26]. The RTBs category, instead, accounts for the elements repeatedly short-circuiting the insulation and not considered in the first type. The methodology, clarified by
Figure 5 below, distinguishes frame elements accountable for:
Offsite non-RTB (purple): studs placed offsite, next to windows or doors (jamb, lintel or sill), external wall corners, top/bottom rails and studs connecting partition or party wall with the external load-bearing structure. Those timber frame elements are accounted in linear transmittance calculation, otherwise ψ-value.
Offsite RTB (blue): vertical studs placed during the manufacturing process, not included in any non-RTB calculation (not included in the offsite non-RTB). Those elements constitute the TFF, therefore accountable for the U-value calculation.
Onsite non-RTB (yellow): studs added onsite to connect two TF panels forming an external wall corner.
Onsite RTB (red): studs added onsite between two consecutive panels, creating a unique TF structure.
The clarity of the definition and consequent ease of its application makes the method the most effective approach to separate the repeating and non-repeating TF elements. The designers can be instructed with simple and clear rules, enabling the effectiveness of measuring and calculating the correct quantities for heat losses and avoid issues impacting upon the performance gap, including increased energy use and carbon emissions, inadequate indoor thermal comfort and under/over-sized heating/cooling systems [
58].
3. Results and Discussion
The following paragraph aims to show the application of the method described and to discuss in which measure the U-value is affected by the TFF for five different dwelling typologies. The analysis considered a total of N = 226 TF closed panels for exterior walls, manufactured by the OSM company in Wales for housing associations (affordable dwellings for rent): semi-detached, detached, terraced, bungalow and a multi-storey block of flats [
59]. The calculations of TFF are based on drawings sourced from the OSM manufacturer, with the basic building details and layouts for all the panels used for specific projects in development in 2020. The set of drawings also provides information on each panel framing layout and additional on-site wooden elements used to adjoin consecutive panels. Manufacturing drawings are deemed to be comparable with construction site observations since previous research by Bell and Overend [
42] evidenced a very high level of agreement, therefore data coming from manufacturer drawings are considered to describe a very good approximation of reality. Manufacturing drawings have been used to separate repeating and non-repeating TF accordingly to the rules mentioned in the previous paragraph for each panel, attributing and accounting each framing element assisted by a spreadsheet. This is because, at the moment, none of the manufacturer’s tools can perform autonomously this kind of calculation. It is worth pointing out that, the dwellings analyzed show remarkably similar TFF despite the difference in the plan.
Table 4 below summarizes the results obtained for each building typology:
The analysis of closed TF panels evidences how TFF can vary between the design and on-site stage, resulting in a variation of U-values of the external wall construction. High TFF can be the result of the need for the panel design to satisfy a range of requirements including structural integrity, simplicity of manufacture, transportation, erection and the necessity to provide a fixing for standard sheet/board materials [
42]. The findings evidence that there might be differences between TFF of open (one OSB closing the framing work) and closed panels (two OSB closing the framing work); the same happens between offsite and onsite TFF. The variations are attributable to the different connection typologies used for TF open panels, easier to be made and without any addition of onsite elements. Instead, TF closed panels require a further timber stud addition when adjoining two panels onsite. The research found it is more prone to investigate open TF [
39,
42,
43,
60], however, only one study has dealt with closed panel TF for low energy buildings considering a total dwelling TFF of 10%, assumed to be a sensible approach for U-value evaluation [
61]. In this study, the total dwelling TFF, including offsite and onsite timber elements, is between 10.11% to 13.70%, demonstrating that the value adopted by Menedez is lower than at the limit of acceptance and does not allow any safety margin.
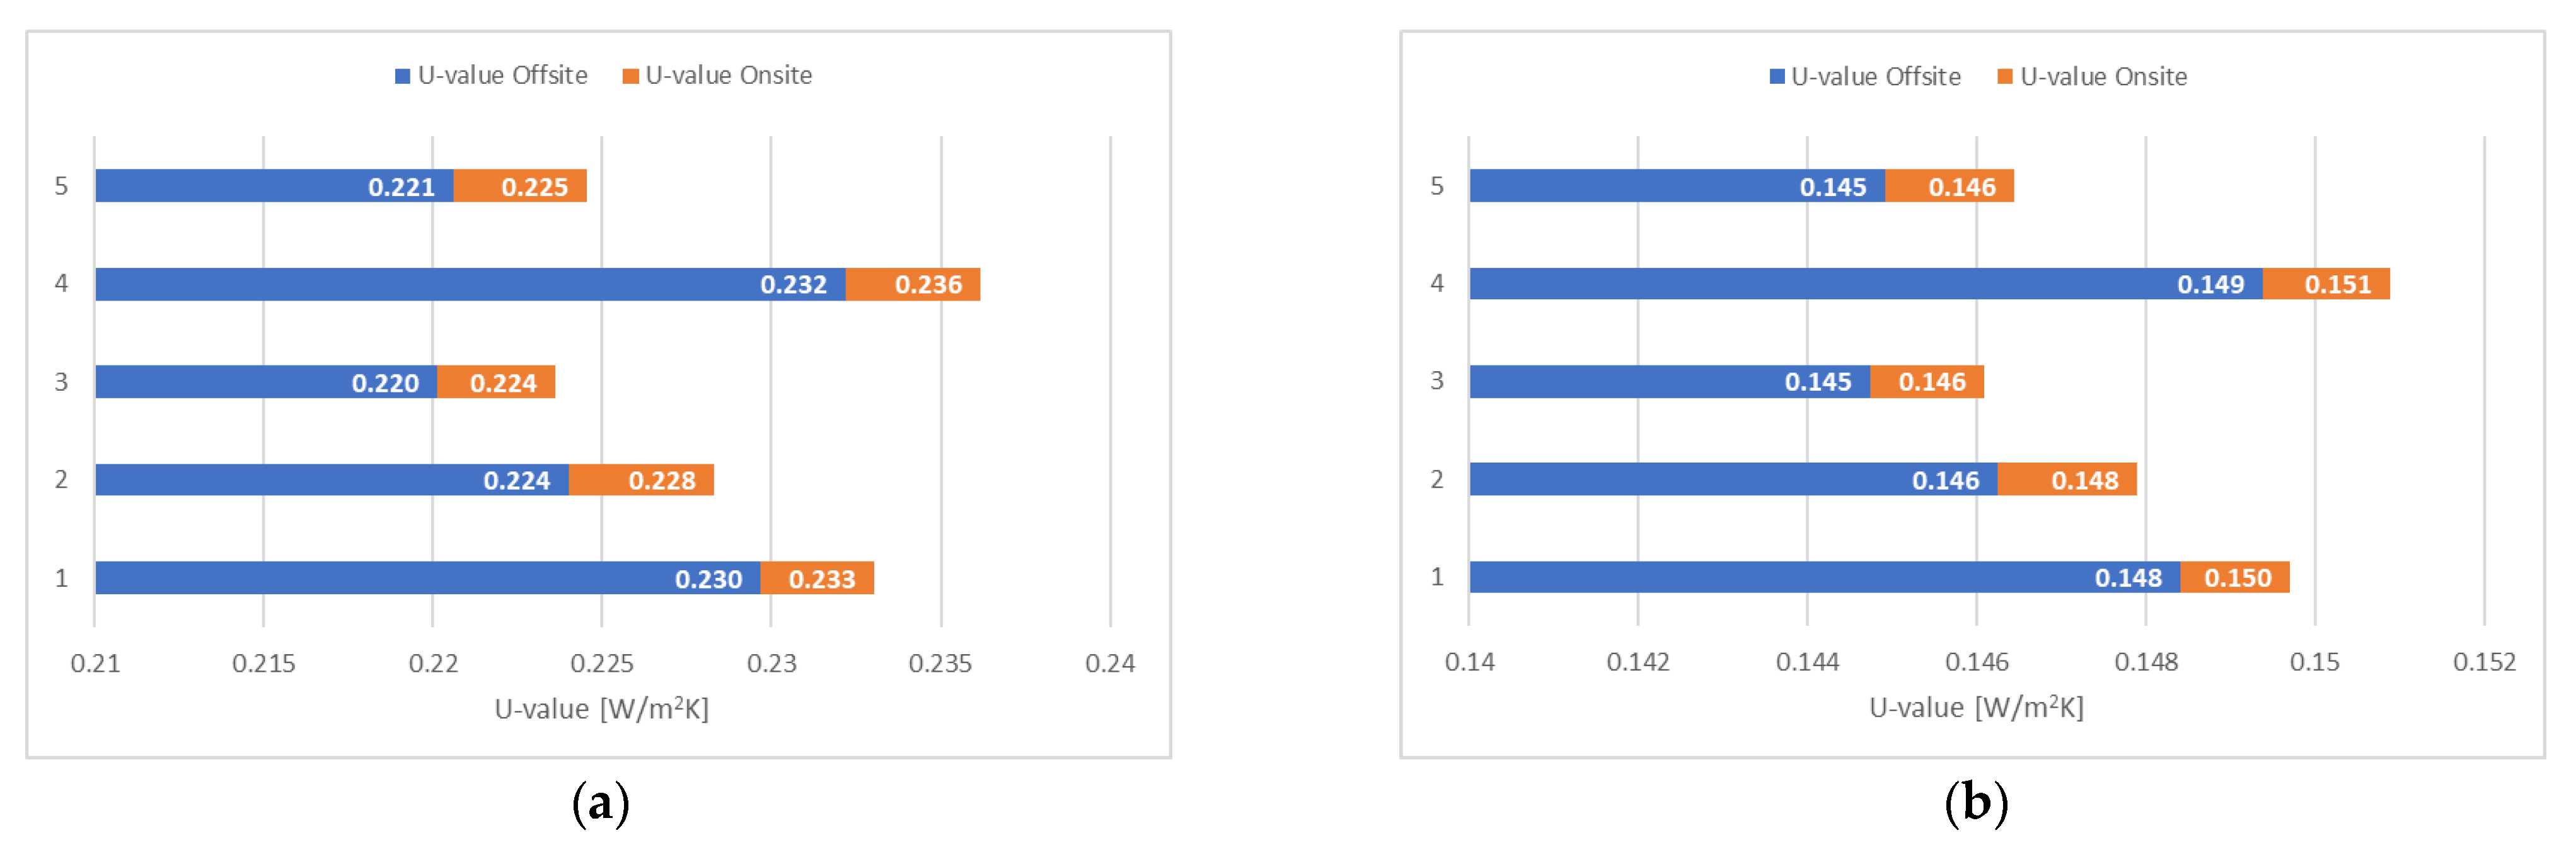
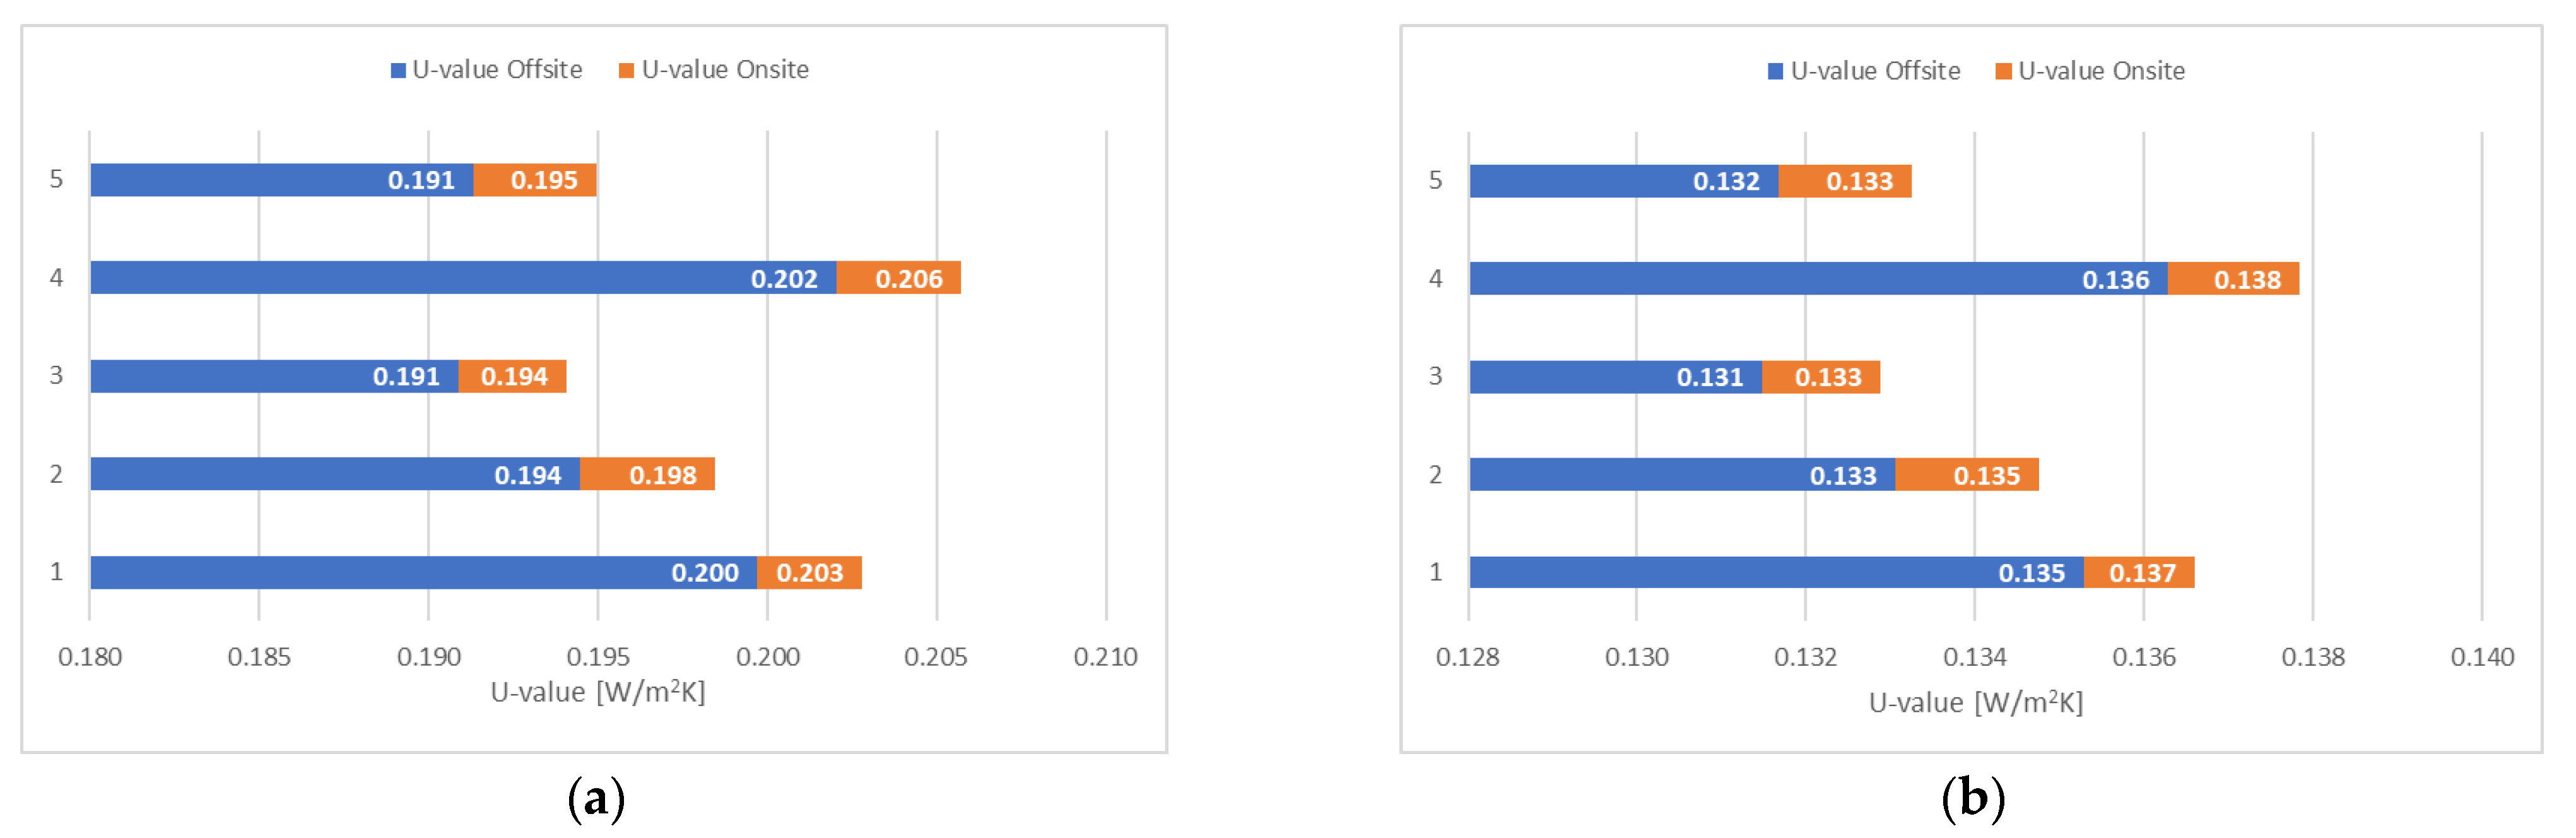
Figure 6 shows the U-value change attributable to onsite and offsite TFF variation for the five dwellings typologies analysed, assuming the construction detail of
Table 2 above, with 0 mm and 50 mm flanking insulation, 140 mm studs and an internal reflective layer (representing a common practice in Wales). For comparison,
Figure 7 below shows the U-value variation due to offsite/onsite TFF change of the same detail, varying only the core stud thickness (197 mm).
The comparison of
Figure 6 and
Figure 7 for a given flanking and different core insulation demonstrate that the U-value variation, from offsite to onsite, consequent to the TFF has the same absolute value. As consequence, the effect of the TFF is not reduced by increasing the core thickness, while it is attenuated when thicker flanking insulations are adopted.
The final U-value, resultant from the sum of TFF offsite and onsite, determines if the construction satisfies the ADL or PHPP benchmarks. Therefore, acknowledging the importance of the TF structure will help to prevent unexpected non-compliant onsite U-values, since at the design stage opportune mitigating provisions can be made. As demonstrated, the TFF influences the U-values more significantly on constructions with low thicknesses of flanking insulation, therefore considering the percentage of further frame added on site is fundamental to erode the performance gap and recognize the additional heat losses.In conclusion, it is recommended that the manufacturer of the closed frame panels increases the area of the panel (principally the width, since the panel height is mostly fixed) to ensure a lower number of onsite connections are fitted. The reduction of frame elements will impact directly on the repeating TB and creating economic savings as well as reduction of waste. As well, bigger panels could offer the manufacturer the possibility of better spacing, trying to match the limit of 600 mm, maximum centre-to-centre stud distance of ordinary framing structures. It has been noted that there have been little attempts on the part of frame designers to minimise the amount of timber used [
42]; No consideration is made by frame designer and architect about the relationship between panel frame spacing and window/door openings dimensions as a common 600 mm stud spacing could trigger a modular design which would reduce without efforts the number of studs.
The reduction of the timber elements can impact also on the number of metal fixings used in the TF closed panels: nails, screws and staples are utilized in closed panel exterior wall and represent a point repeating TB due to the perforation of the structural wood with a highly conductive material. The fixings do not entirely pass through the panels and their impact is predicted to be limited; but the use of metal fixings (there can be over 100 connections in a one-meter square panel) can detrimentally affect the final U-value, especially when considering the overuse of nailing as a common practice among the operators of the production lines.
4. Conclusions
The study has shown how TFF can influence the thermal transmittance of/in TF closed panels by using the simplified U-value calculation method for a closed TF frame panel, manufactured by a Welsh OSM for high-performing applications. The results demonstrate that high TFF affects the U-value, especially when no or low thicknesses of flanking insulation are used to improve the external wall performance. The reflective layers, with equal emissivity, are more effective on the U-value when used on the most exterior layer of the construction.
The research defines an innovative calculation method, which has been used to separate non-RTB, assessed with finite element analysis, and RTB due to TFF. Five different dwelling typologies have been evaluated based on manufacturers’ drawings to determine the impact of linear RTBs on U-values, both offsite and onsite. The results show that this type of MMC is affected by its intrinsic nature since constituted by several structural studs alternated by insulation. Also, the connection type required to structurally join two consecutive panels requires further wooden additions onsite. Measuring the TFF offsite and the additional framing added onsite, with the consequent impact on U-value, demonstrate in which measure the TF closed panel use feed into the performance gap between manufacture production and real building application.
The analysis of linear RTB becomes crucial in relation to the OSM of TF, enhancing the knowledge of the effect of extra wood and extra steel fixings. OSM could achieve a higher quality than on-site construction systems, as many experts have said, nevertheless those expectations may not be fulfilled because findings suggest that there is a performance gap in TF closed panels occurring at the design/manufacturing stage before the MMC is moved to site. A holistic approach to TB in TF construction is required as well as careful consideration of the variation of TFF from design and manufacture, especially when more tight regulations will impose strict U-values. So, manufacturers and designers would no longer be in a position to ignore those aspects.
This paper will be useful for academics, architectural designers, building contractors, engineers, housing developers, OSMs and government stakeholders evaluating the thermal performance of TF construction systems, to be used in nearly-zero or zero operational energy dwellings.


