
A CFD-Based Optimization of Building Configuration for Urban Ventilation Potential


1
Department of Architectural Engineering, Kangwon National University, Chuncheon-si 24341, Korea
2
Department of Integrated Energy and Infra System, Kangwon National University, Chuncheon-si 24341, Korea
3
Institute of Industrial Science, University of Tokyo, Meguro-ku, Tokyo 153-8505, Japan
*
Author to whom correspondence should be addressed.
Energies 2021, 14(5), 1447; https://0-doi-org.brum.beds.ac.uk/10.3390/en14051447
Submission received: 8 January 2021
/
Revised: 2 March 2021
/
Accepted: 3 March 2021
/
Published: 6 March 2021
(This article belongs to the Special Issue Designing, Modeling and Optimizing Energy and Environmental Systems for Buildings)
Abstract
:In this paper, we present a performance-based approach to building configuration design to improve the urban ventilation potential at the conceptual design stage, and we demonstrate its application through a case study. The target performance optimized was the ventilation potential of a district, including a region of interest at a spatial scale of hundreds of meters. To estimate this performance, we used computational fluid dynamics (CFD), coupled with an evolutionary algorithm, to optimize the design alternatives to produce the building configuration most suitable for a given set of site conditions. Three calculation components must be assembled for a CFD-based design optimization: an optimizer, a geometry/mesh generator, and a CFD solver. To provide links between the calculation components, we utilized an in-house parametric design program. A case study was conducted to test the applicability of the proposed design method to identify the optimal solutions that minimize adverse effects on the ventilation potential of the surrounding area. For a configuration of buildings in a dense urban area, the proposed design method successfully improved the design alternatives. The results show that the urban ventilation potential in the case of the optimized building configuration is 16% greater than that of the initial building configuration.
1. Introduction
Recent years have seen extensive research on the urban heat island—a phenomenon in which surface isotherms resemble the topographic contours around an island because of the temperature difference between urban and surrounding areas [1]. Measures to mitigate the impact of urban heat islands, such as reducing heat sources, restraining greenhouse gas emissions, and promoting urban designs to prevent stagnation of heat generated in urban areas, have been examined in many studies [2,3,4,5,6,7,8]. In this study, we have focused on a passive method through which urban design—appropriate to the built environment—is achieved by providing architects with design alternatives that minimize adverse effects on the wind environment of the surrounding area, using an engineering approach. If districts that are better ventilated than other areas are planned using this design method and are connected, a ventilation path can be formed to carry fresh and cool air from the sea or rural areas into the urban area and reduce the stagnated heat in a densely built-up area.
Numerous studies have shown that the urban climate is greatly influenced by the geometry and surface of the urban area [9]. In particular, the properties of inflow into a built-up area depend on the geometry of the surroundings [10]. Properties such as the wind velocity and turbulence characteristics are directly related to the efficiency of heat or contaminant evacuation from within the built-up area. This efficiency is called the urban-scale ventilation potential. Ventilation potential is difficult to predict because the urban geometry, which greatly affects the flow field of the surroundings, is determined not only by the shapes of the urban structures but also by their positional relationships. However, planning a design that considers urban ventilation requires that the ventilation potential be estimated. A wind tunnel experiment or numerical simulation can be conducted for this purpose.
The design method involves iterations of two widely used approaches to obtaining solutions: a case study, in which several design alternatives are ranked in terms of performance; and a parametric study, in which the effects of different sets of design elements on the overall performance of a design alternative are analyzed. Let us suppose that a wind tunnel experiment will be the performance evaluation method. Each design change requires recreating the building configuration model with wooden or polystyrene blocks, then rearranging the model in the wind tunnel, and re-measuring the flow or concentration field. Although a wind tunnel experiment is a reliable and effective method of evaluating ventilation performance, wind tunnel experiments are not typically used to evaluate performance in the design development process because of the cost, time, and level of expertise required. (Full-scale experiments provide the most representative information; however, in this paper, we omit full-scale experiments because they are mainly used for validation purposes.) A simpler method is to use computational fluid dynamics (CFD) to reduce the resources required to evaluate each design alternative, although this method remains costly because each design change requires the CFD user to remodel, remesh, and recompute the flow field [11]. Furthermore, insofar as a case study or parametric study is used, exploring the design option space systematically is difficult, and a potentially optimal solution may be overlooked.
An evolutionary algorithm can provide a solution to the optimization problem. Malkawi et al. drew an analogy between the evolutionary process and the design decision-making process [11]: “the evolutionary approach is a ‘generate-and-test’ approach, which corresponds well to the procedures for design synthesis and evaluation in the design process.” For this reason, several studies have attempted to employ evolutionary algorithms in performance-based design optimization [12,13,14,15,16,17,18,19,20,21,22]. To the extent that this analogy between evolution and design development is correct, it could enable designers to create design alternatives never before considered in a case study and increase the likelihood of finding potential solutions with better performance.
We propose a design method that enables systematic exploration of design alternatives in the early design stage. This exploration process is based on performance assessment through numerical simulations, and the results are provided as reference designs in the early design stage for an architect. In particular, this paper focuses on a method that uses CFD analysis to optimize a building configuration in terms of parcel-level ventilation potential, at a spatial scale of approximately 500 m, to test its applicability. Each design alternative generated in the evolutionary process, which is implemented by a genetic algorithm (GA), responds to site-specific conditions. A CFD solver coupled with an optimizer module automatically evaluates design performance by estimating the ventilation potential for each design alternative, and the results are fed back to the optimizer module. A series of calculation processes is run repeatedly, and the best solutions in terms of urban ventilation are returned.
2. Building Configuration Definition and Parameterization
Advances in computer-aided design (CAD) systems and high-accuracy building simulations with graphic user interfaces now provide architects and building scientists with virtual workspaces for evaluating design performance and feedback from the results. Architects can self-evaluate and improve the performance of their own designs with building simulations. Furthermore, if an identical task platform were provided with interoperability, the design change and corresponding change in performance could easily be fed back between architects and building scientists. However, such ideal processes are unlikely to be viable. Two different types of problems could arise. The first type of problem involves architects lacking the engineering knowledge needed to perform building simulations. The second type of problem involves the interoperability of the task platform being far from adequate. The latter type of problem was mentioned by Flager and Haymaker [23], who noted that a platform must be able to quickly generate and evaluate a variety of design alternatives to reduce the broad area of the unexplored design option space.
Several studies have been conducted to attempt to overcome this challenge. Bowcutt et al. (cited in [23]) employed a parametric geometry definition, automated discipline analysis, and multidisciplinary optimization to develop unconventional approaches in the field of aircraft design [24]. Tahara et al. developed a CFD-based multi-objective optimization method for ship design, which was formulated to maximize ship propulsion and maneuverability [25]. The key concern in these studies was the use of appropriate design variables to control the design change—a procedure called design parameterization. The building configuration in this context is difficult to define. The stereotypical shape of a vehicle, such as an aircraft or ship, is relatively easy to parameterize with several design variables. For example, Flager and Haymaker parameterized aircraft topology using 12 design variables [23]. However, a stereotypical building shape is difficult to define. This difficulty is likely to increase, given current trends in irregularly shaped and dramatic designs that deviate from conventional building shapes (e.g., box-type designs).
Nevertheless, attempts have been made to generate building shapes using an evolutionary approach. The solution in many previous studies has been either to restrict the building shape generated in the design evolution process to those with simple geometries, such as box or polygonal shapes, or to focus on the design of a single building without consideration of the built environment (e.g., surrounding buildings) [12,13,14,26]. Although relatively little research on this subject has been carried out, Yi and Malkawi and Jin et al. have presented good case studies of design using an algorithm capable of generating irregularly shaped buildings [27,28]. They enhanced the diversity of design alternatives using a unique method for defining building shapes. Kim et al. and Yi and Malkawi presented a building design approach that takes the influence of the surrounding buildings into account [29,30]. These studies have been informative in illustrating an engineering approach that uses an evolutionary algorithm for building design. However, a further point to consider is whether an architect will accept a plan derived without respect to the built environment or an irregularly shaped building of impractical design, no matter how superior its performance.
Our objective is to offer a more practical engineering approach to site-specific building planning. The scope of the discussion here concerns a preliminarily developed method of CFD-based building configuration optimization. More precisely, we explain the process of deriving a plan that minimizes adverse effects on the parcel-level ventilation potential of a built environment by adjusting the building arrangement according to an evolutionary algorithm. We emphasize this fact, which is based upon the premise that generating a building form is the domain of an architect. By presenting a case study, we describe how our method enables the generation of an optimized building configuration suitable to the conditions of a given site.
3. Outline of Case Study
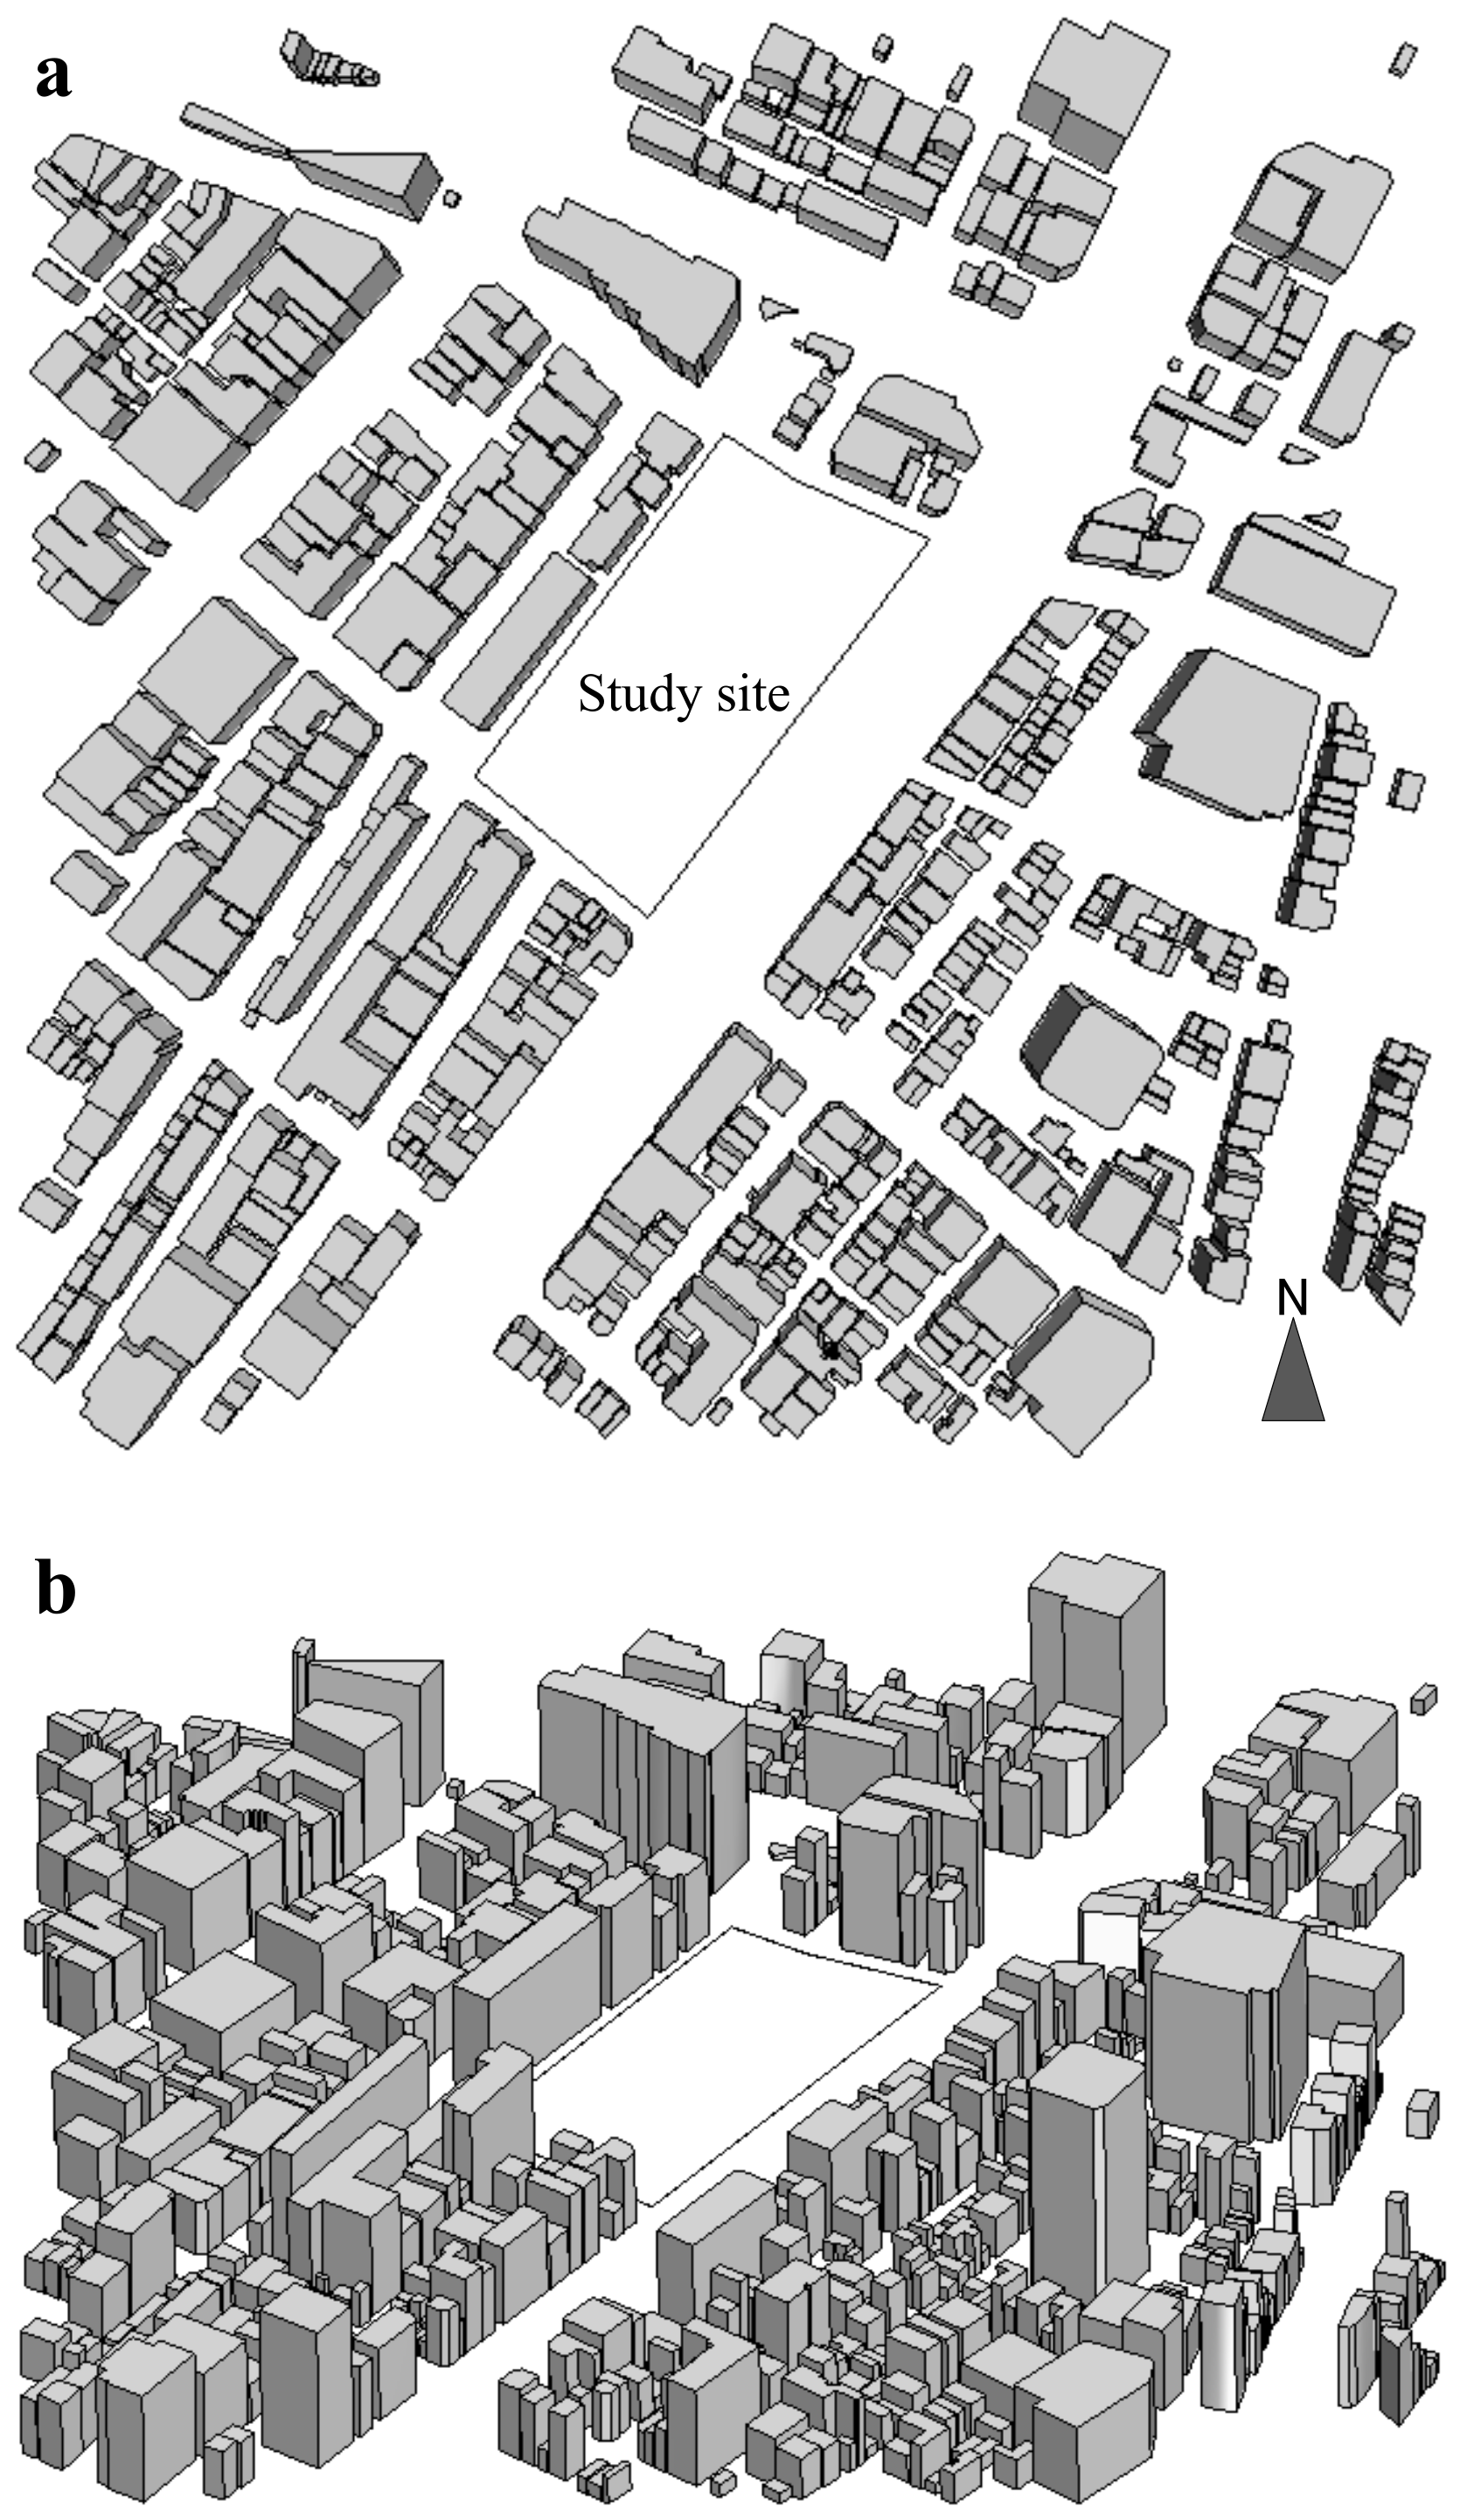
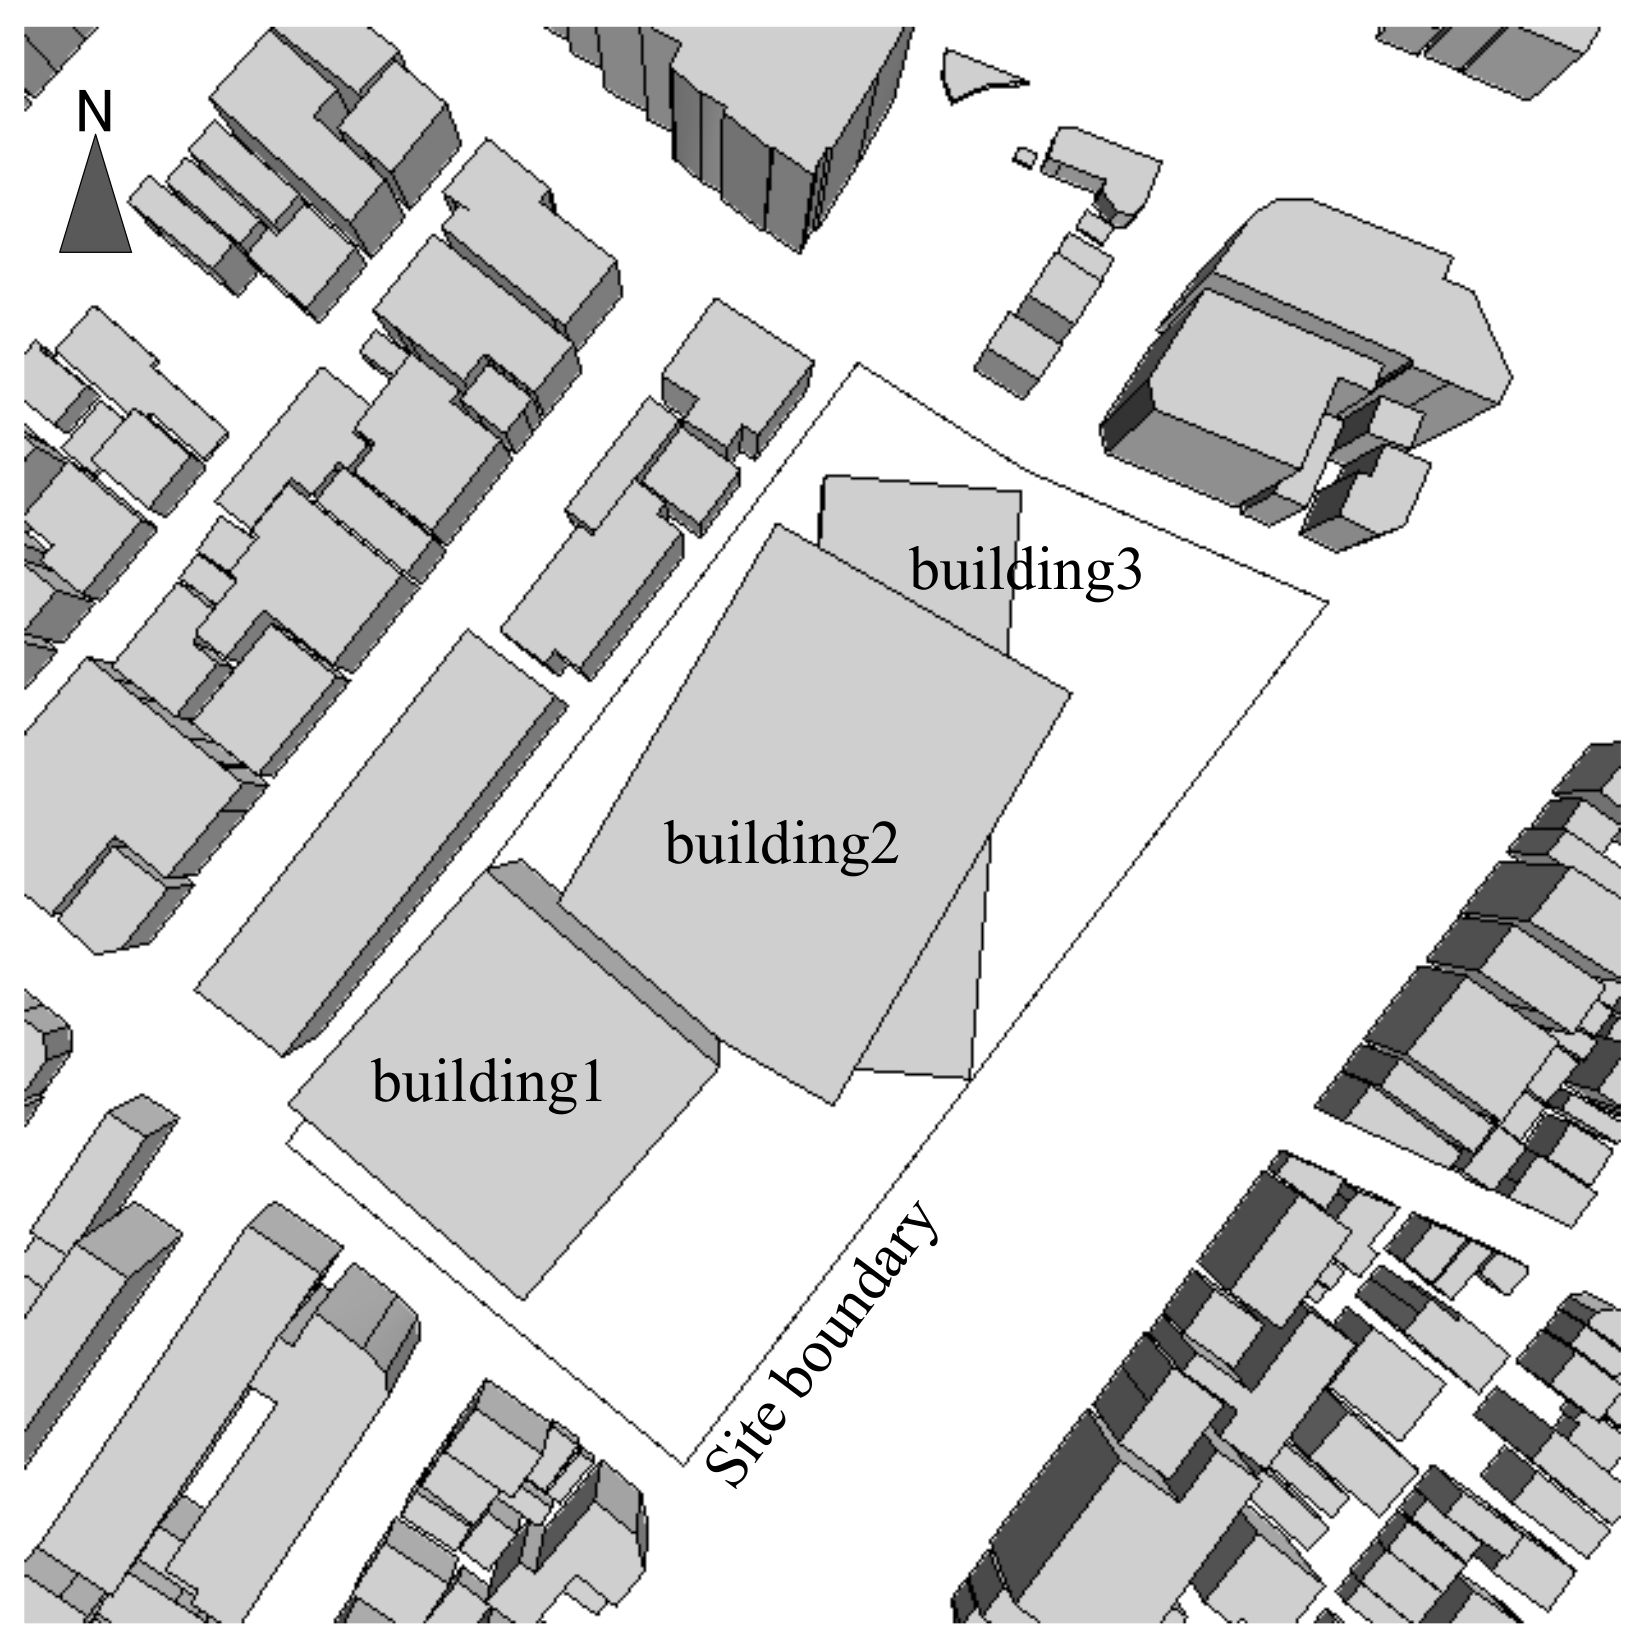
The target area for the case study was an imaginary site that covered a densely built-up area of approximately 500 m × 500 m located in Tokyo, Japan. Figure 1 shows the status of the target area, which resembles the kind of typical built-up area found in most major cities. Large buildings are situated along the streets, and located behind them are buildings of various sizes. The averaged building plan area fraction (i.e., the ratio of the plan area of all buildings to the total surface area of the region of interest) is approximately 35%, and the floor area ratio (i.e., the ratio of the total covered area on all floors of all buildings to the total surface area of the region of interest) is approximately 340%. The morphological properties of the target area are listed in Table 1.
As a first step, we considered a development plan to construct a large-scale commercial complex in the central district of the target area (see study site in Figure 1). In the subsequent design stage, an architect finishes the conceptual building design to determine the building size and considers how to minimize adverse effects on the parcel-level ventilation potential through a suitable building arrangement. If the architect asks for expert advice, a building scientist must consider how to provide a solution. The discussion presented in this paper may be helpful in identifying a suitable approach to determine such a solution.
In the conceptual design stage, ample opportunities exist to improve building performance through successful design adjustments, such as changing the shape, orientation, and arrangement of the building. We chose the parcel-level ventilation potential as the target performance measure and sought to achieve a performance-based design by adjusting the orientation and location of the building in the study site. As mentioned previously, the ventilation potential is influenced by the surrounding geometry. In particular, the ratio of the height of buildings (H) to the distance between them (W) is a dominant factor that influences flow regimes at the building scale [10]. The H/W ratio is difficult to calculate because actual urban areas have irregular configurations. However, in applying this method in our study, the value of H was fixed by an architect, and we adjusted the value of W to optimize ventilation performance.
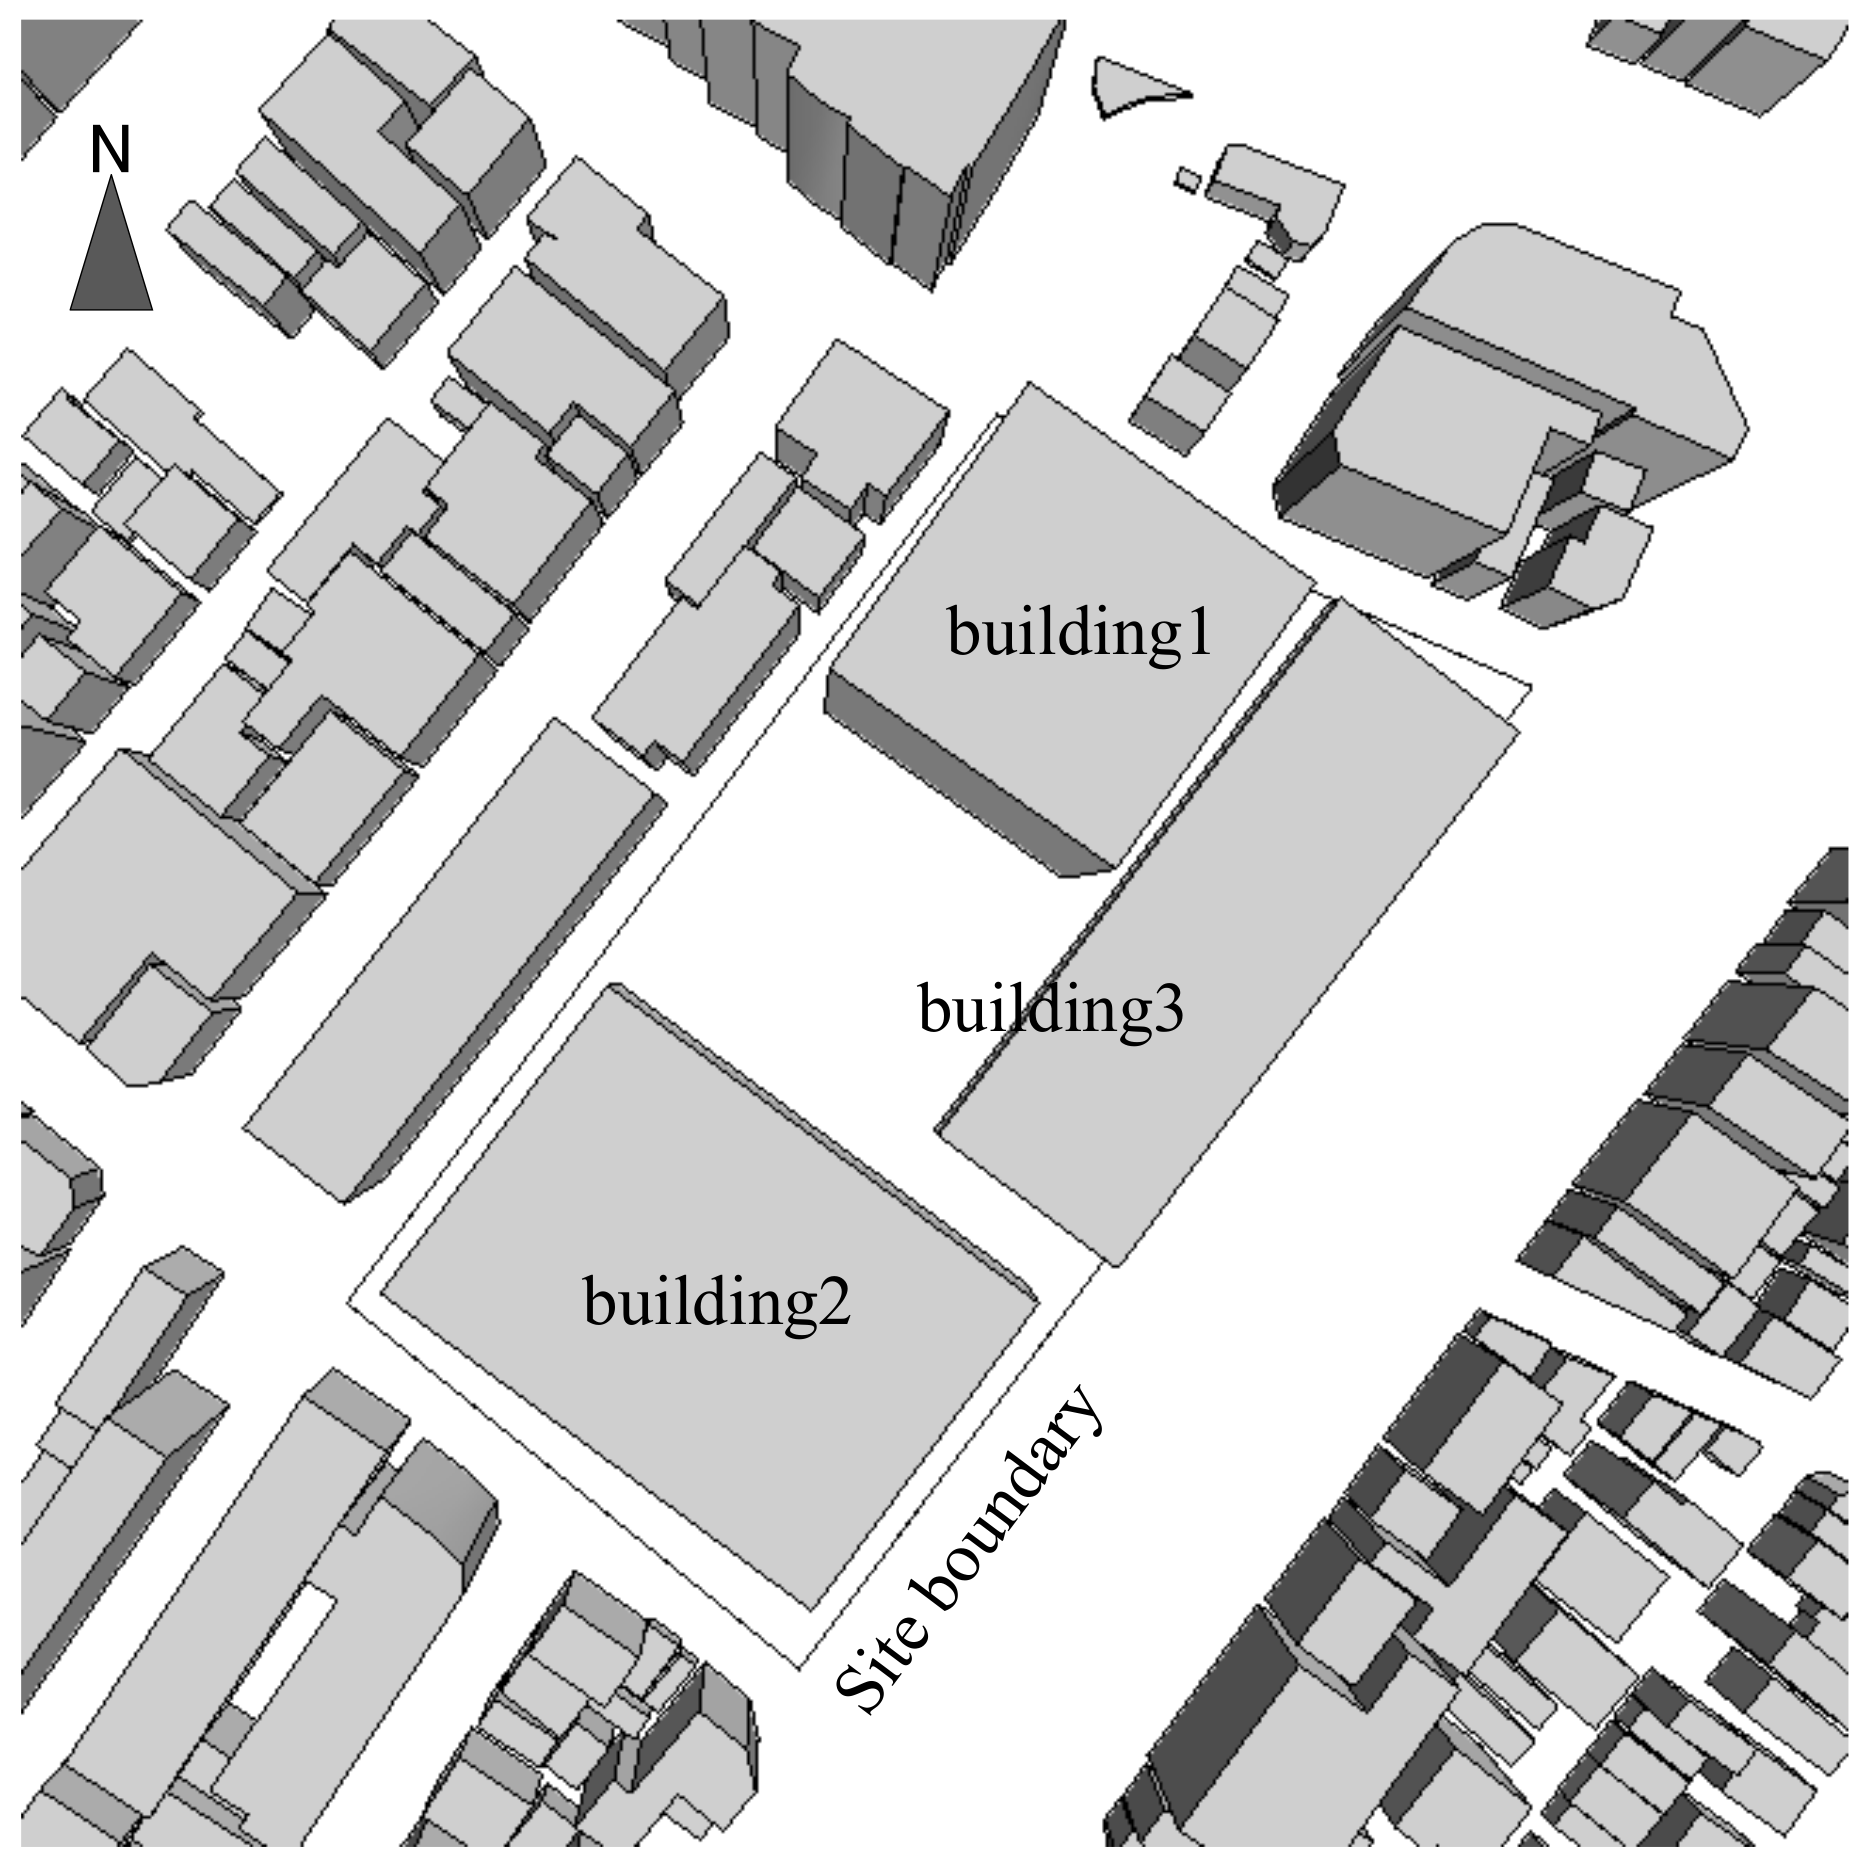
Table 2 lists information on the three building masses to be proposed by the architect. Each design alternative generated in the design evolution process is composed of these three building masses. We created these masses roughly to demonstrate the proposed design method. However, if an actual design were provided by an architect, it could be applied to the current design method, regardless of the irregularity of its shape. Next, a CFD-based optimization was carried out to determine the building configuration (including orientation and location) that maximized the parcel-level ventilation potential.
4. Computational Method
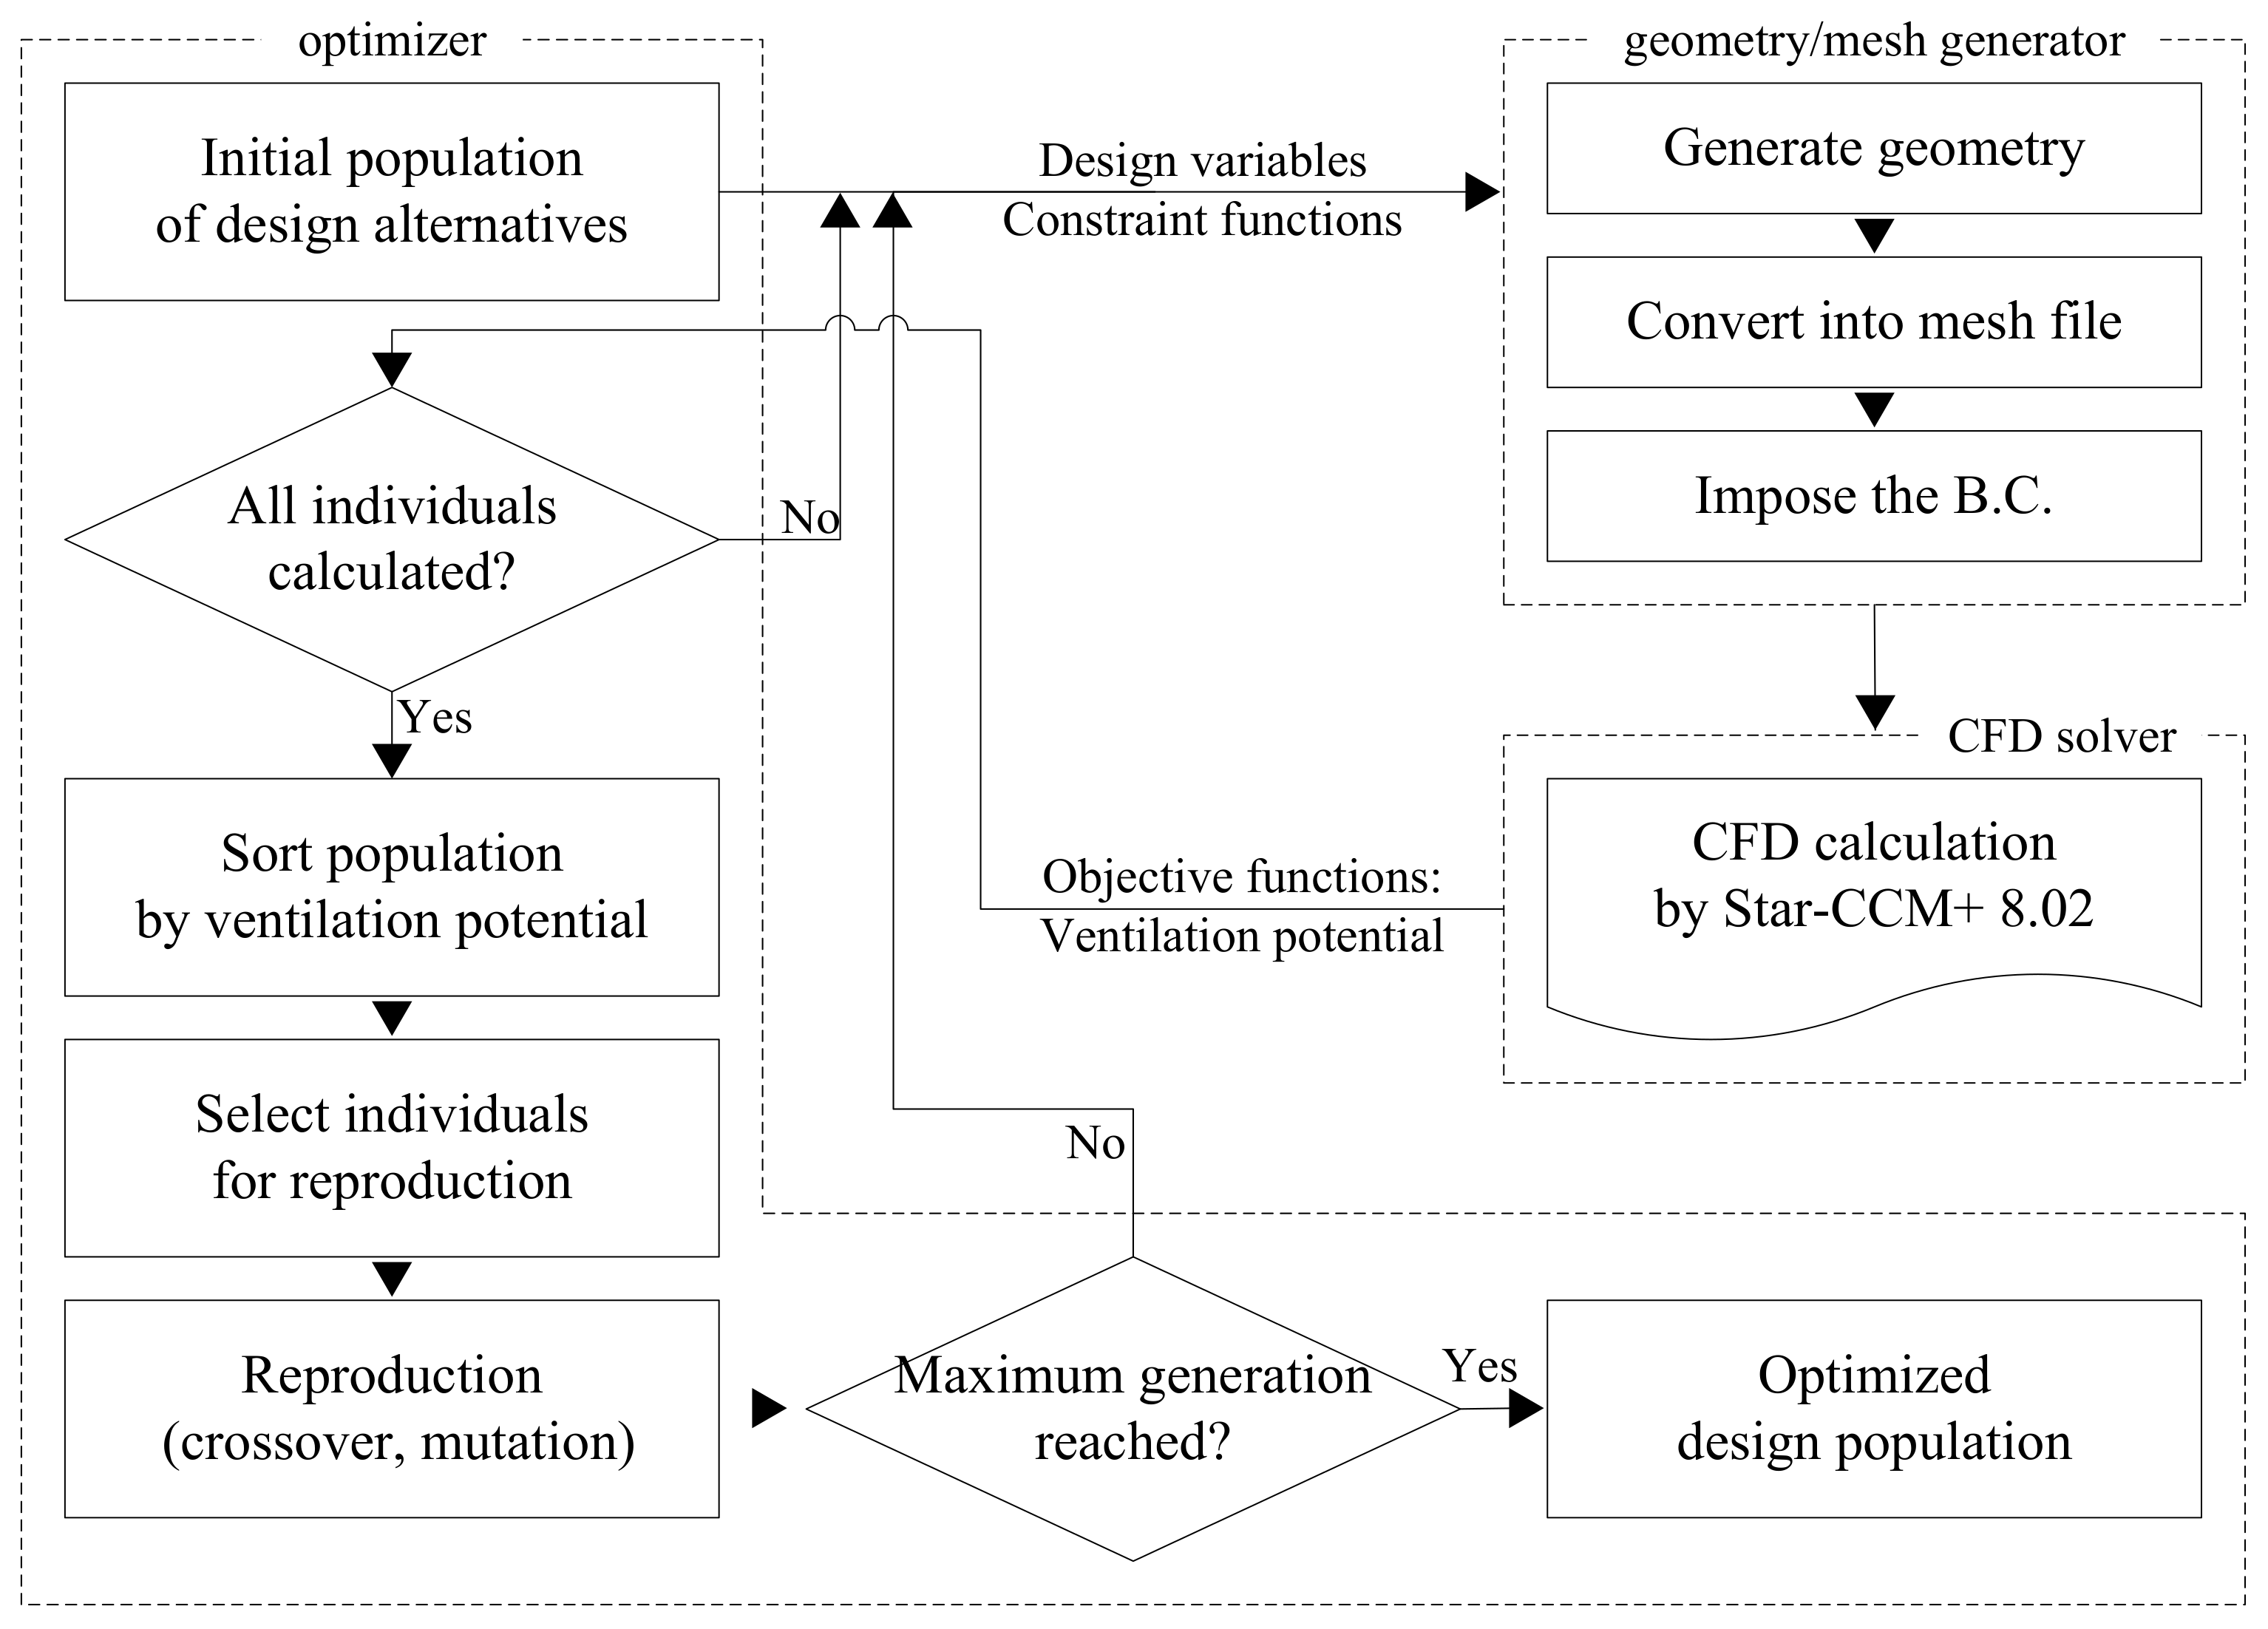
To develop the CFD-based optimization method, three calculation components must be assembled: an optimizer, a geometry/mesh generator, and a CFD solver. The optimizer solves the optimization problem, which comprises the design variables, objective functions, and constraint functions. The geometry/mesh generator creates a building configuration that satisfies the design variables transferred from the optimizer, converts the variables into a mesh file compatible with the CFD solver, and imposes the boundary condition. The CFD solver calculates the flow field for a target area in which design alternatives generated within a geometry/mesh generator are arranged and returns the parameter that represents the parcel-level ventilation potential as the objective function to the optimizer. The optimizer, which is operated by the GA, generates the design variables of the next generation based on the returned value of the objective function. This process is repeated in series, and the optimized solutions (i.e., the designs that least adversely affect the parcel-level ventilation potential of the target area) are explored systematically. For the CFD solver, we used the Star-CCM+ simulation engine. MATLAB was used to implement the optimizer using a GA, and the objective and constraint functions (discussed in the following sections) were programmed using m-files. To handle the geometry and calculation mesh used in this process, we used an in-house parametric design program.
As noted by Tahara et al., the most important component of this design method is the geometry modeling method, which provides the link between the optimizer (the design variables) and CFD solver (the building geometry) [25]. Two approaches can be taken to building such a link. The first uses a commercial CAD program to generate the building geometry. This makes the optimizer directly modify the building geometry through an embedded CAD macro file in which the procedures for building geometry modification, mesh conversion, and CFD pre-processing are described. The other uses a universal data structure, such as the initial graphics exchange specification (IGES) or stereolithography (STL) format. The former offers a more straightforward approach to design implementation. Too often, however, a numerical simulation, such as a CFD solver, requires an exclusive input file; hence, an additional conversion process is involved. In this study, we removed the conversion process by directly creating the design variables in an input file compatible with Star-CCM+ (StarCD input file format) so that the geometry/mesh generator efficiently provided a link between the optimizer and the CFD solver. The flowchart shown in Figure 2 presents an overview of the design evolution process. In the following section, we describe the design variables used to define the building configuration and how they are parameterized.
4.1. Building Configuration Parameterization
The evolutionary GA approach described in this paper maximizes the parcel-level ventilation potential. X denotes a vector of the design variables for each individual, and the objective function F can be expressed as follows:
where g(x) is a calculation function of the parcel-level ventilation potential, as discussed in detail in Section 4.3; and I is a vector of the design variables for the initial building configuration shown in Figure 3.
Improvement of design alternatives through an evolutionary GA approach requires that the building configuration be parameterized by several design variables and a chromosome (an array of allele sets) that represents the design variables to be generated. However, this parameterization, i.e., how to create the vector X shown in Equation (1), is a challenging task (see Section 2).
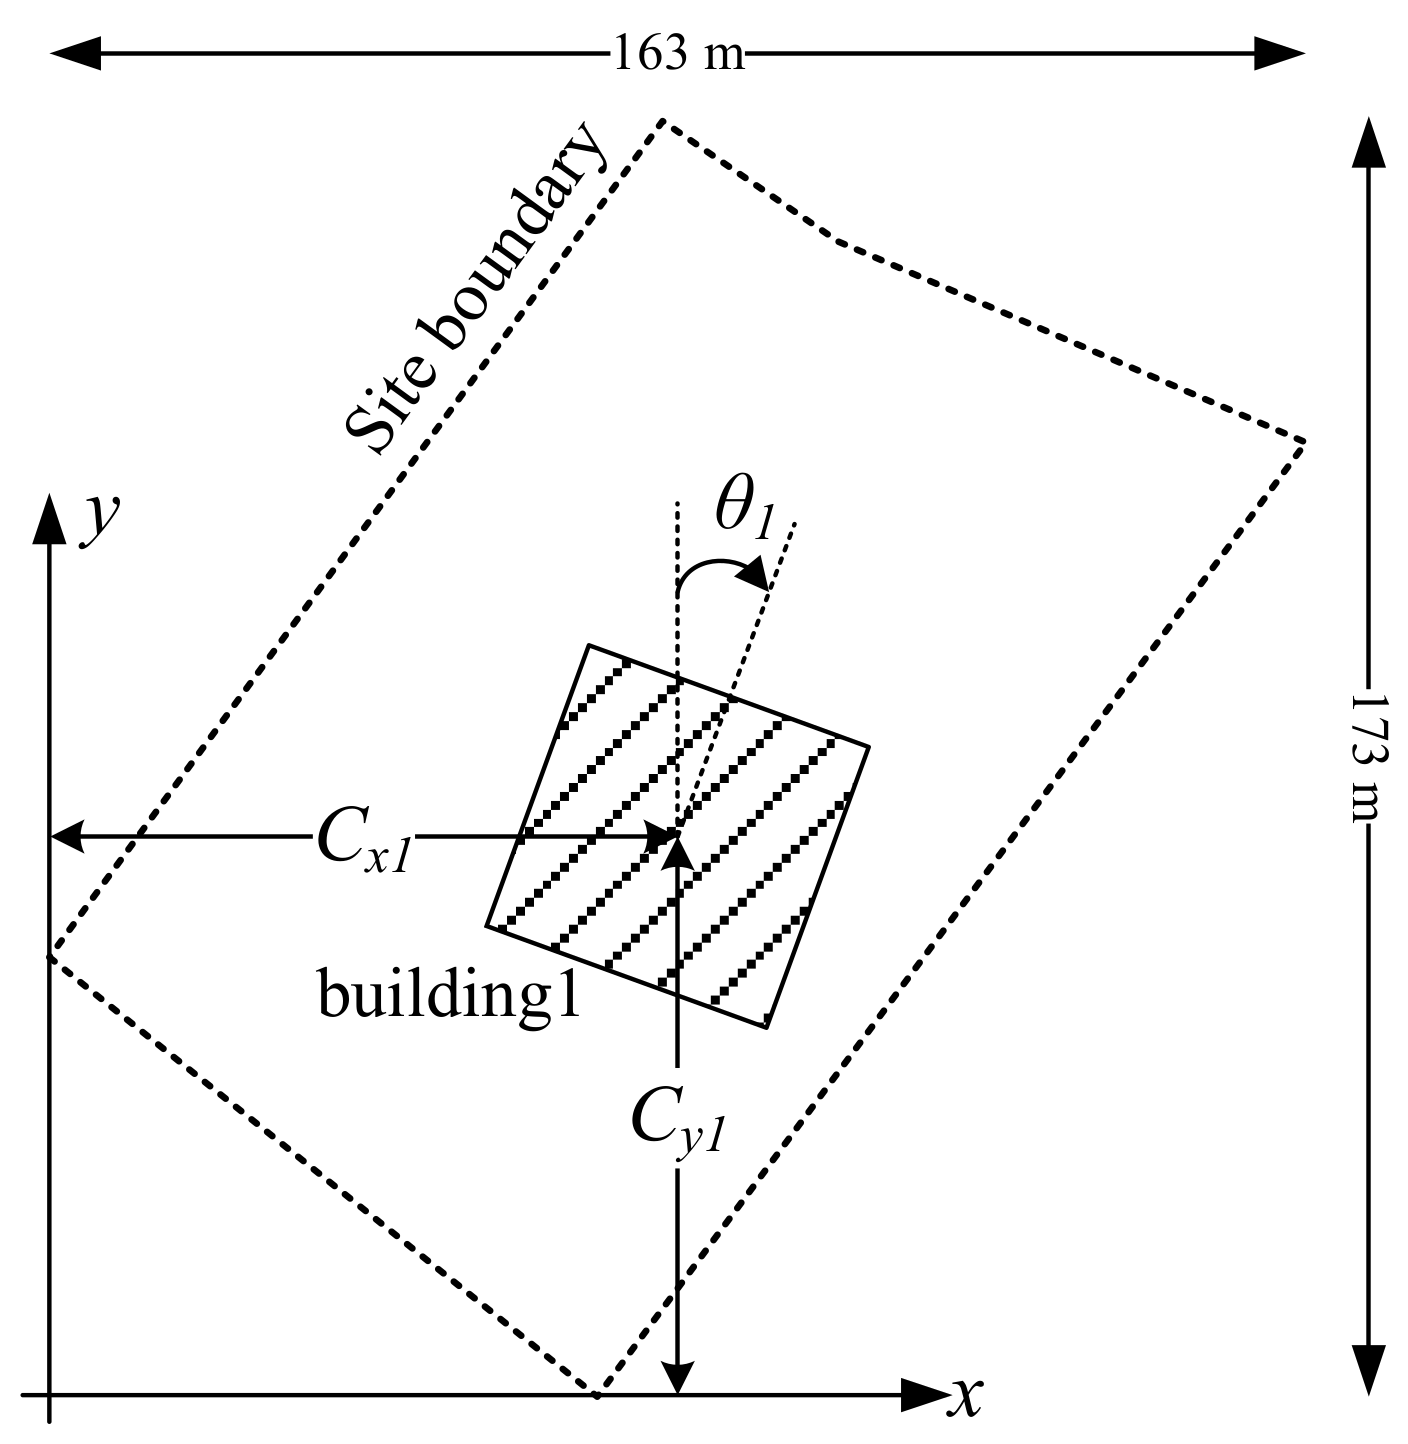
To represent the building configuration as a vector of the design variables, we used the vector presented in Equation (2), where the rows of the vector are the different building masses and the columns are three design variables: the coordinates of the center of the geometry of building n (vn,x, vn,y (m)) and the angle between the axes of the site and building n (vn,θ (deg)).
Figure 4 shows three design variables (v1,x, v1,y, v1,θ) used in the configuration parameterization for Building 1. Buildings 2 and 3 are represented by the same three design variables. Hence, we presented the chromosome for Building 1 only to simplify the explanation.
4.2. Constraint Functions
A constraint function specifies a condition that individuals generated in the evolutionary process must satisfy. In this study, the following two constraint functions were employed: all vertices of the building geometry must be inside the given site, and the building volume density must be uniform.
4.2.1. Vertices of the Building Geometry
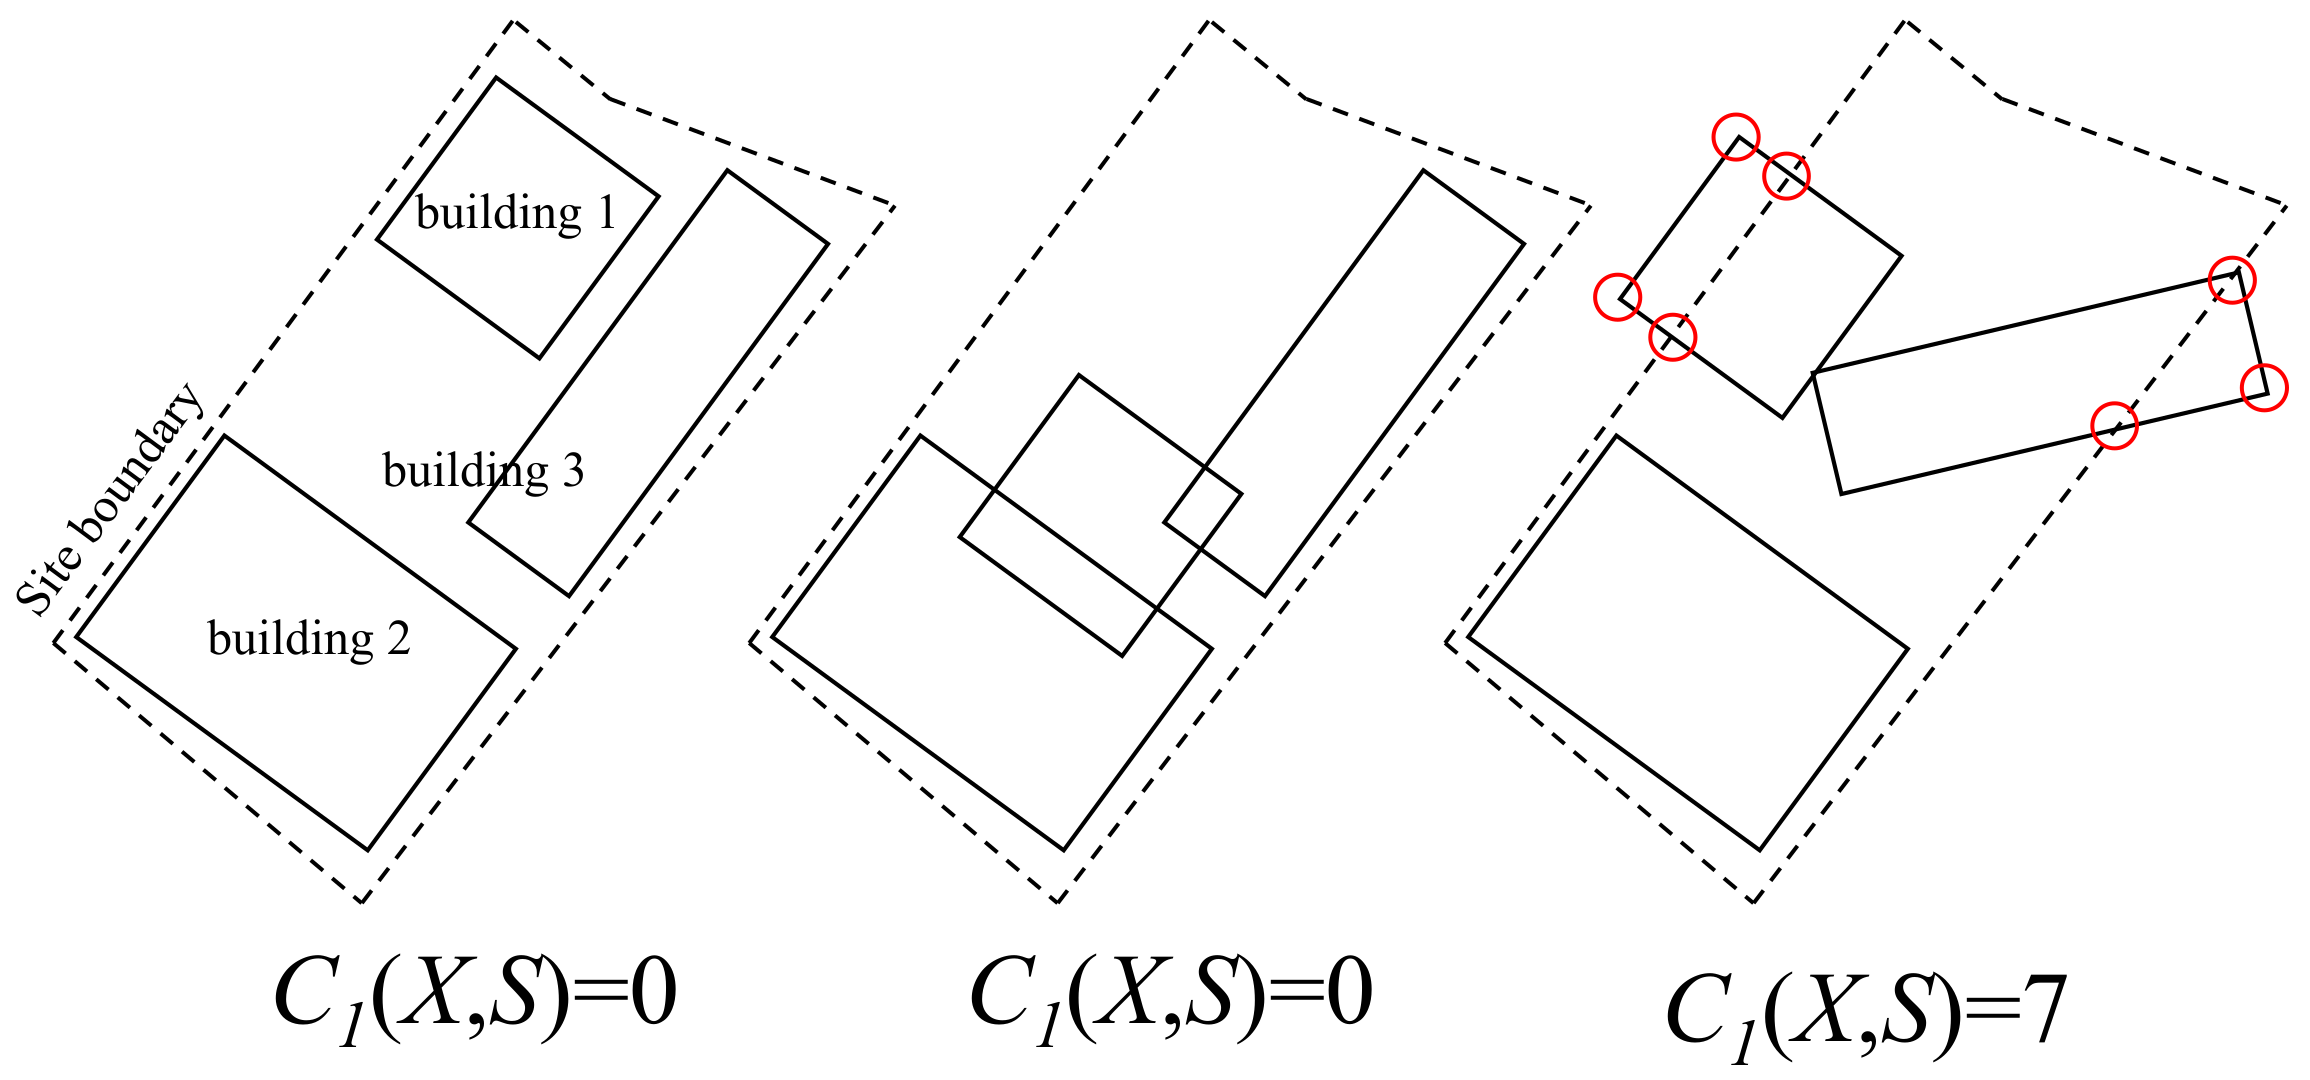
The building configuration depends on a vector of nine design variables that determine the geometric relations between the polygons formed by the site and the horizontal planes of projection of three building masses. The first constraint function concerns these geometric relations: the site polygon should include the building plan polygon with no intersection or contact points (see Figure 5).
The first constraint function C1(X,S) returns the number of vertices if the query vertices of the building geometry specified by a vector X are outside or on the edge of the site polygon area defined by a vector S. When C1(X,S) = 0, individual X satisfies the first constraint.
4.2.2. Building Volume Density
The parcel-level ventilation potential is influenced by the volume fraction occupied by the buildings, which influences the degree of resistance to air flow in a parcel. This is called roughness in aerodynamics and has been represented by parameters such as the roughness density and the building volume density. The building volume density (λac) is defined by the following equation:
where λ(z) is the building plan area fraction at height z (–); Hmax is the height of the highest building (m); and Href is a reference height for the calculation (m).
High ventilation potential in an urban area occurs where the roughness is lower than in other areas [31]. If the calculation algorithm does not include a constraint function for the building volume density, the evolutionary process might make the design alternatives converge on the building configuration with the smallest building volume density. No functional settings were assigned in the building design parameterized with a vector of the design variables, and the configuration was independently adjusted for each building. Therefore, for some design alternatives, three buildings overlapped. Consequently, the design solution derived from an algorithm without any constraints for the building volume density might consist of three entirely overlapping buildings. The calculation algorithm used here was designed to control the building volume density to be uniform so that the acceptability of the design alternatives would be guaranteed.
To satisfy this constraint, we added two conditions for generating design alternatives. The first is that if the building configuration determined by a vector of design variables includes overlapping buildings (see the second diagram in Figure 5), then the height of the building with the smaller plan area is increased so that the overall building volume remains constant. The height increment is expressed by the following equation:
where ΔHn is the height increment of building n (m); Hn is the height of building n (m); Vint is the volume of the intersection of building A and building B (m3); and Pn is the plan area of building n (m2).
The second condition concerns the maximum building height: the tallest of the three buildings can be no higher than 100 m, which is also the value used as the reference height for calculating building volume density. Roughness elements, including buildings, provide resistance to air flow. Wind energy reduced by roughness can recover in open spaces. Given the same conditions as for the building volume, the evolutionary process might make design alternatives converge on a tower-shaped building to decrease roughness near the ground surface and ensure more open space. This is unrelated to the purpose of this study, which attempts to offer practical engineering support for site-specific building planning in the early design stage by providing various design alternatives. Convergence to one type of design does not serve the purpose of using an evolutionary algorithm, which is significant in stimulating design creativity and generating various design alternatives not considered in the conventional design process. In addition, the building height cannot be increased indefinitely and is constrained by laws or regulations on the maximum height of structures. This is considered in the proposed design method to improve its practical applicability. Ultimately, the second constraint function is expressed by the following equation:
This constraint prevents design alternatives from converging on tower-shaped buildings, which leads to diverse designs.
4.3. Objective Function
The properties of inflow into a built-up area depend on the geometry of the surroundings (Section 1). To evaluate the ventilation potential, the movement of fresh and cool outside air into the target area must be predicted. The mechanism of this process depends on turbulent diffusion, not only for transport of contaminants or heat but also for that of momentum and energy. Hence, the parcel-level ventilation potential for each design alternative can be compared from the perspective of energy as well; that is, a design alternative with greater energy can generate effective turbulent diffusion, and this is what we conceive of as a design that minimizes adverse effects on the ventilation potential of the surrounding area. We used kinetic energy to represent the turbulent transport performance quantitatively. Kinetic energy is calculated from the averaged velocity and turbulent components, as defined in Equation (6), which indicates that this parameter can be used to precisely evaluate the convective effects of the air flow [32]:
where KE is the spatially averaged kinetic energy (m2/s2); , , and are the averaged velocity components (m/s); VOL is the volume of the entire target area (m3); and k is the averaged turbulent kinetic energy of the entire target area (m2/s2).
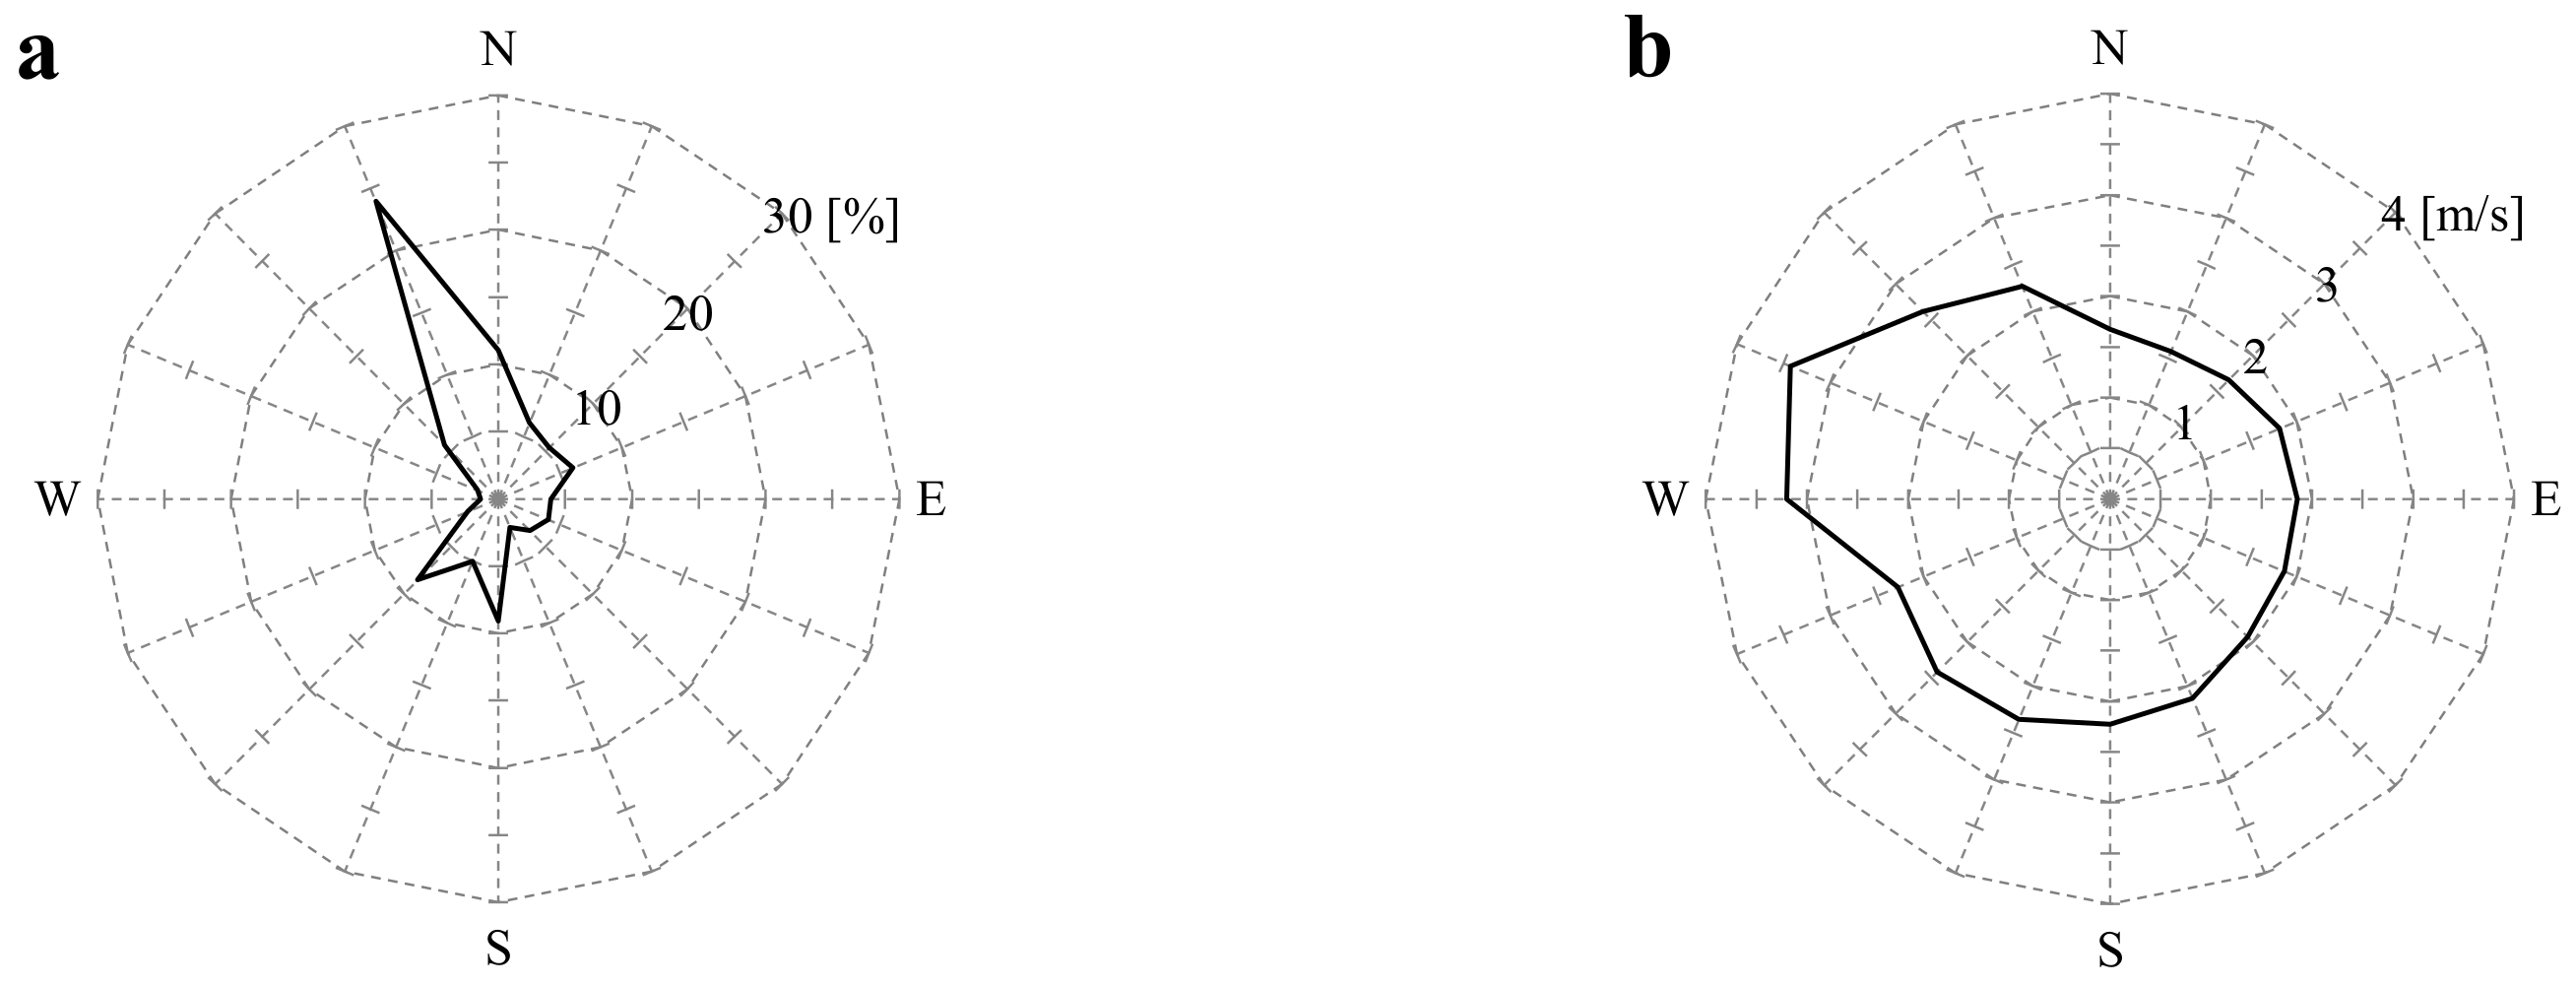
Several previous studies have assessed the outdoor wind environment solely in terms of the flow in the dominant wind direction [29,33,34,35,36]. Although such assessments are straightforward and sufficiently informative for fundamental studies, they are unsuitable for our case study because the effect of the construction of buildings varies with the wind direction. Therefore, we attempted to obtain a more reasonable design solution by considering the annual wind fluctuation in an objective function calculation. First, we determined the percentage of occurrences of each wind direction and the mean velocity of each wind direction from hourly measured statistical data recorded over 10 years (from 1995 to 2004) at the Tokyo Meteorological Observatory (see Figure 6), where the height of the meteorological measurement was 74.5 m. Then, we calculated the annual average KE for each design alternative using Equation (7):
where KEannual is the annual average kinetic energy (m2/s2); KEi is the spatially averaged kinetic energy for wind direction I (m2/s2), and ti is the annual cumulative time for wind direction I to occur (hour).
Although we originally sought to compute the KEannual by calculating KEi for 16 directions, we ultimately performed calculations for four cardinal directions to reduce the computing load associated with achieving our main purpose of demonstrating the proposed design method. Hence, we re-classified the 16 directions into the four cardinal directions listed in Table 3. We regarded the KEanuual obtained from the re-classified wind directions as the annual average value of KE for each design alternative.
The value of KEannual for the initial building configuration shown in Figure 3 is 2.95 m2/s2. Subsequently, we defined the ratio of KEannual for each design alternative (individuals generated in the evolutionary process) to KEannual for the initial building configuration as RKEannual, as shown in Equation (8). This was used as the objective function. The calculation algorithm applied in this case study compares the relative performance for each design alternative using a value of RKEannual, and which is maximized by the evolutionary process.
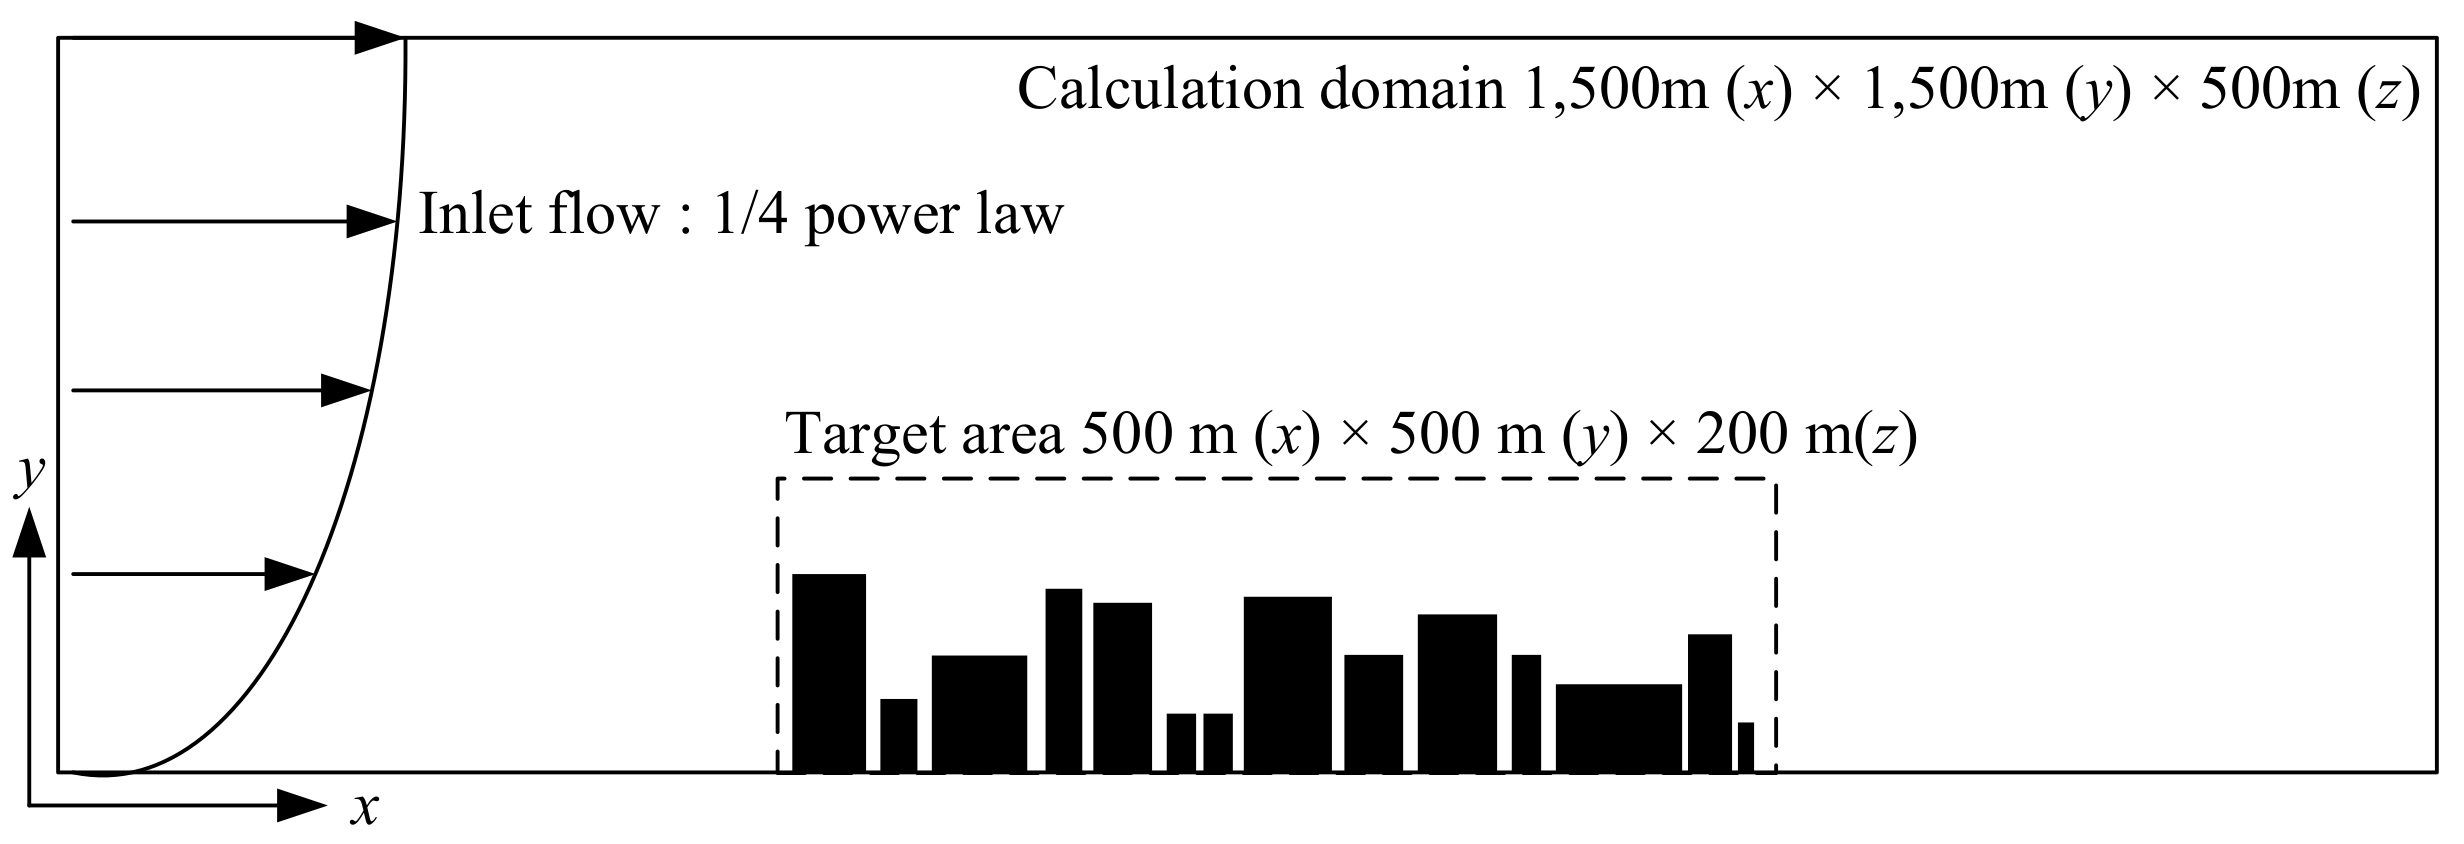
The domain size is one of the factors that influence the accuracy of the simulation results. The CFD simulation modeling for calculating the objective function complies with the Architectural Institute of Japan (AIJ) guidelines for the urban wind environment, as described in Tominaga et al. [37]. In accordance with the guidelines, we determined the calculation domain height to be 500 m and the downstream distance from the target area to be 500 m. Tetrahedral meshes were employed, and finer meshes were arranged in the region near the building and ground surfaces, whereas the meshes expanded farther away from the solid surface. The minimum mesh size near the building was 1 m. The total number of meshes was approximately 11,000,000 on a case-by-case basis. All solid surfaces, including ground and building surfaces, were modeled using a no-slip boundary with zero roughness.
We used the Reynolds-averaged Navier–Stokes (RANS) model to calculate the flow field of the steady state for each design alternative. Large eddy simulation (LES) and direct numerical simulation (DNS) were not compatible with the goal of this study because of their extremely high computational loads, regardless of the accuracy of their results. The goal of this study was to perform a relative evaluation of the ventilation potential for the target area for different design alternatives rather than obtaining detailed information on the flow field. Luo and Li noted in a study on estimation of the overall ventilation rate for an urban area that “the standard and RNG k–ε model are sufficient if the emphasis is on the airflow” (as quoted by Gao and Niu [38,39]). We also chose the RANS model and selected the standard k–ε model as the turbulence model. Details of the computation model are presented in Figure 7 and Table 4.
In Table 4, u(z) is the inlet velocity at height z (m/s); zr is the reference height (=74.5 m, the height of the meteorological measurement); ur is the reference velocity, which is the mean velocity for a given wind direction (Table 4) (m/s); k is the turbulent kinetic energy (m2/s2); I is the turbulent intensity (=0.1) (–); ε is the turbulent dissipation rate (m2/s3); Cμ is a model constant (=0.09) (–); and l is the length scale of the turbulent flow (m).
5. Results
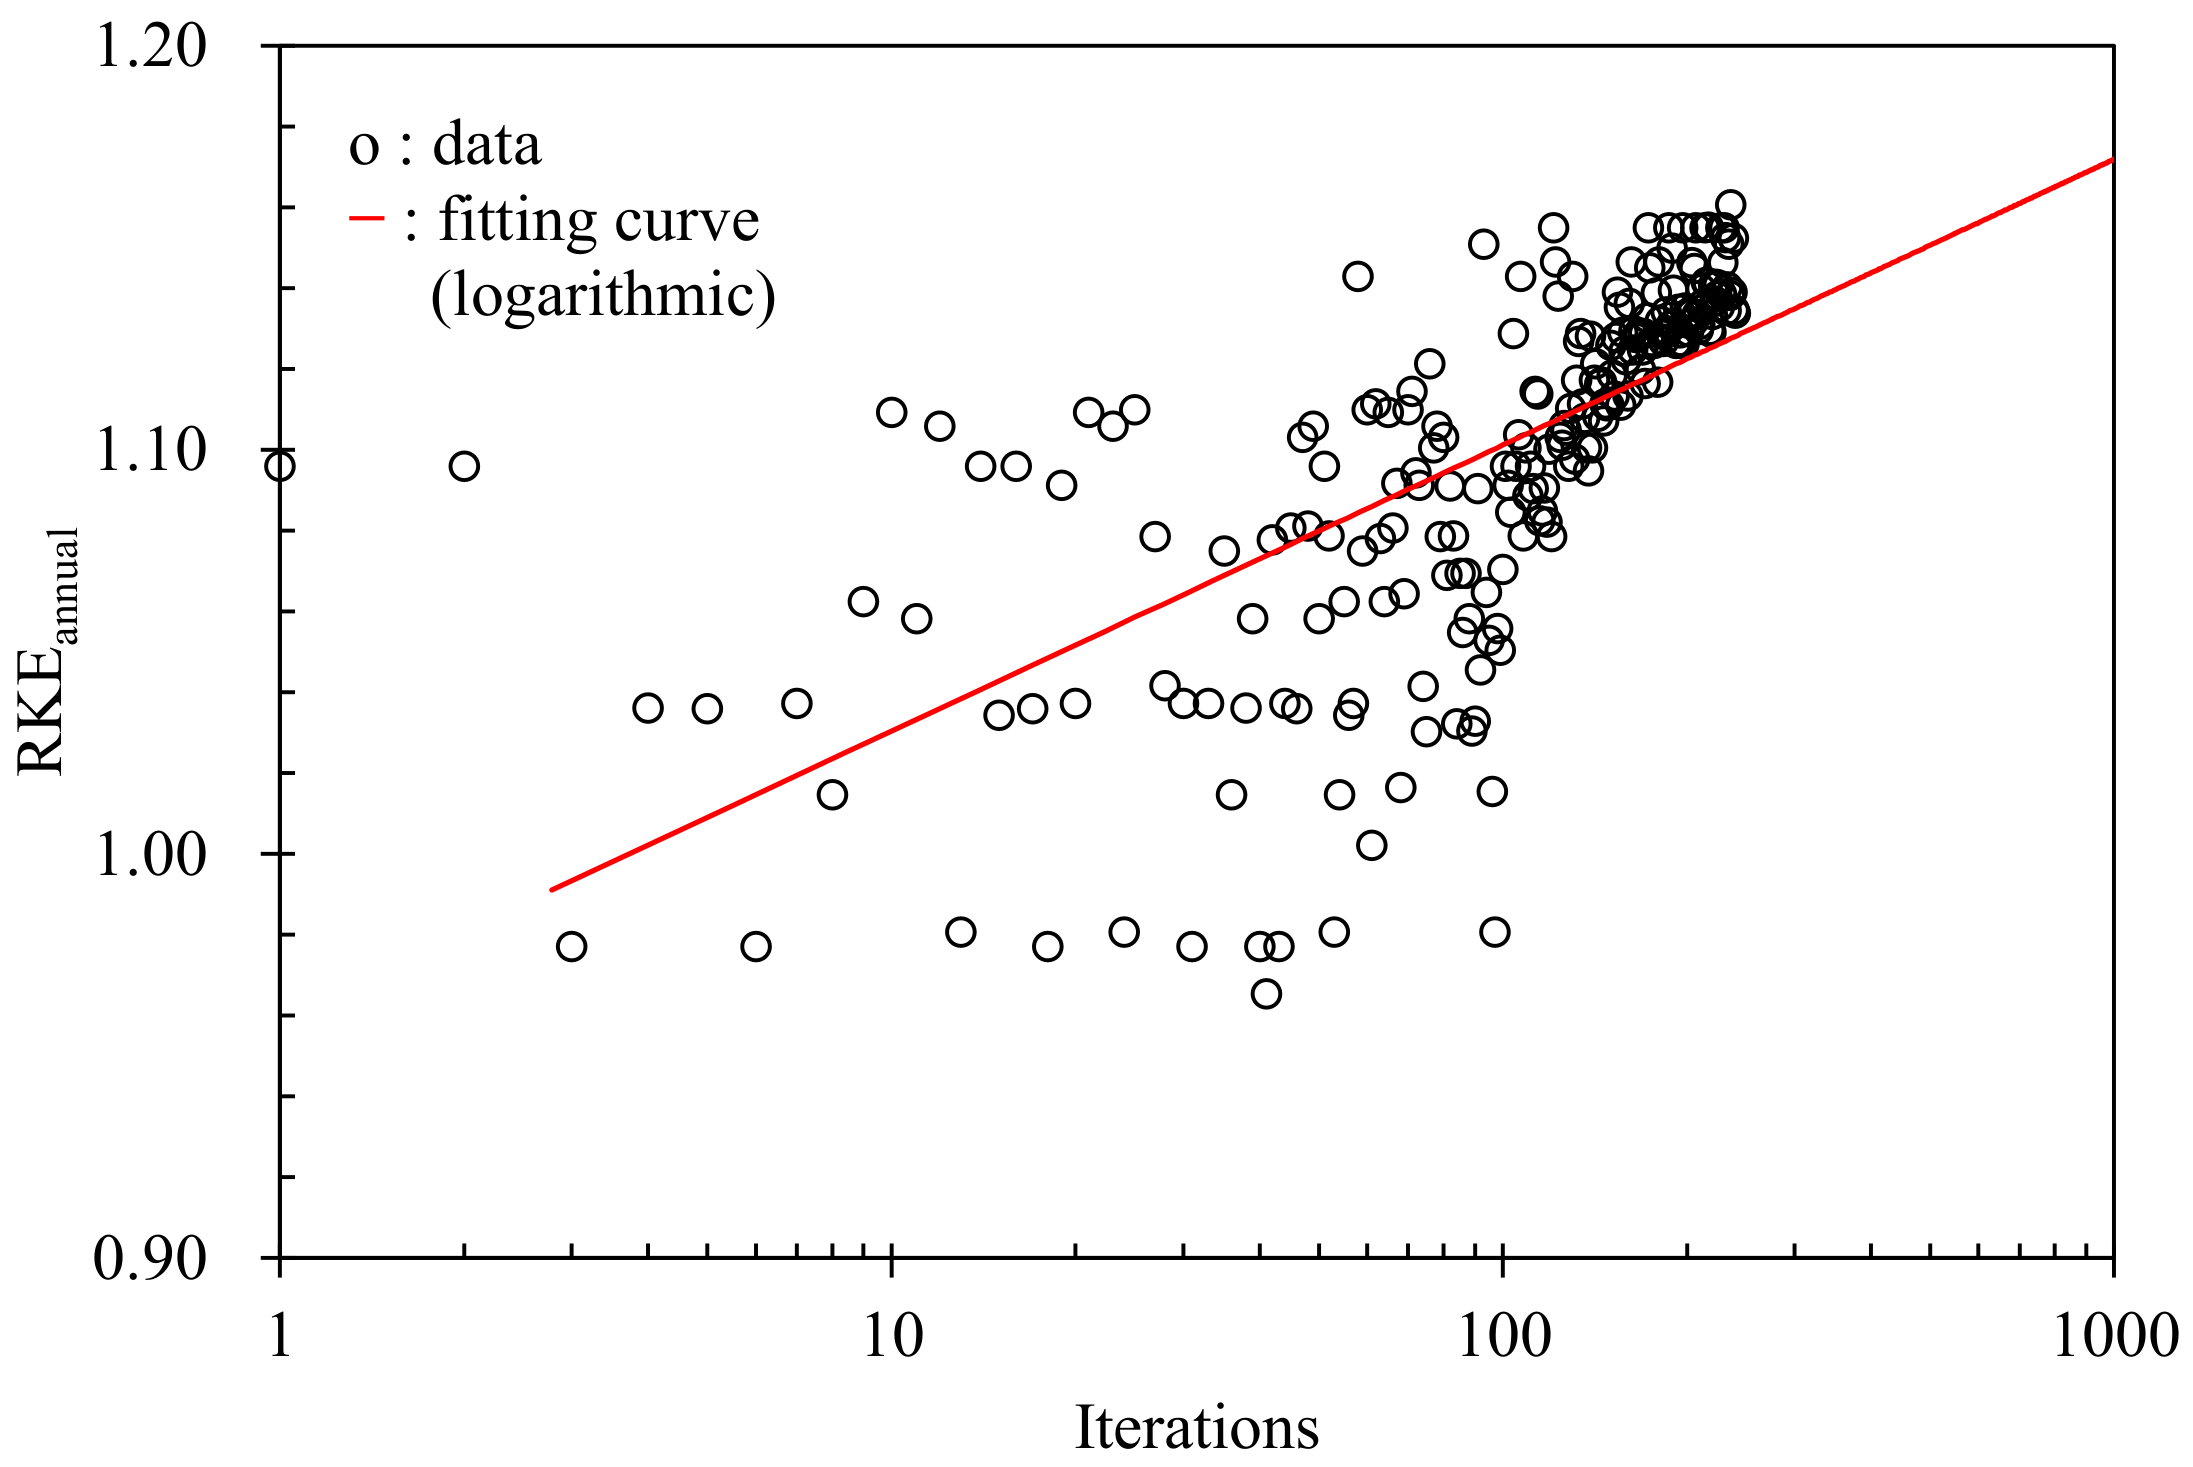
For the GA implementation, the following parameter values were specified: population size = 10; crossover probability = 0.7; mutation probability = 0.03; maximum generation = 24, which is the termination criterion. The calculation algorithm generates vertices of the building plan, changes the location of the vertices in the next generation, and evolves a design plan. Figure 8 shows the evolutionary changes in RKEannual as the calculation progresses. The result shows that the value of RKEannual in the case of the optimized building configuration is 16% greater than that of the initial building configuration. The degree of change in the value of RKEannual was significant in the early calculation stages. As the iterative process progressed, the degree of change became insignificant, and the value of RKEannual appeared to converge to approximately 1.16. In this calculation process, the objective function did not completely converge because of the limit on the number of iterations. However, although the gradual evolution process was expected to converge by the 240th iteration, the incremental changes are quite small compared to the time and resources involved, and the final value can be determined as indicated by the logarithmically fitted line in Figure 8. In this study, we determined that the building configuration in the last iteration had sufficiently evolved in response to the site-specific conditions (e.g., the surrounding geometry and wind condition). According to the calculation results, several design options that ensure improved ventilation performance can be provided to the architect. This reduces the design option space that must be considered, which helps the architect develop the chosen options into performance-based designs easily and quickly in the design development stage.
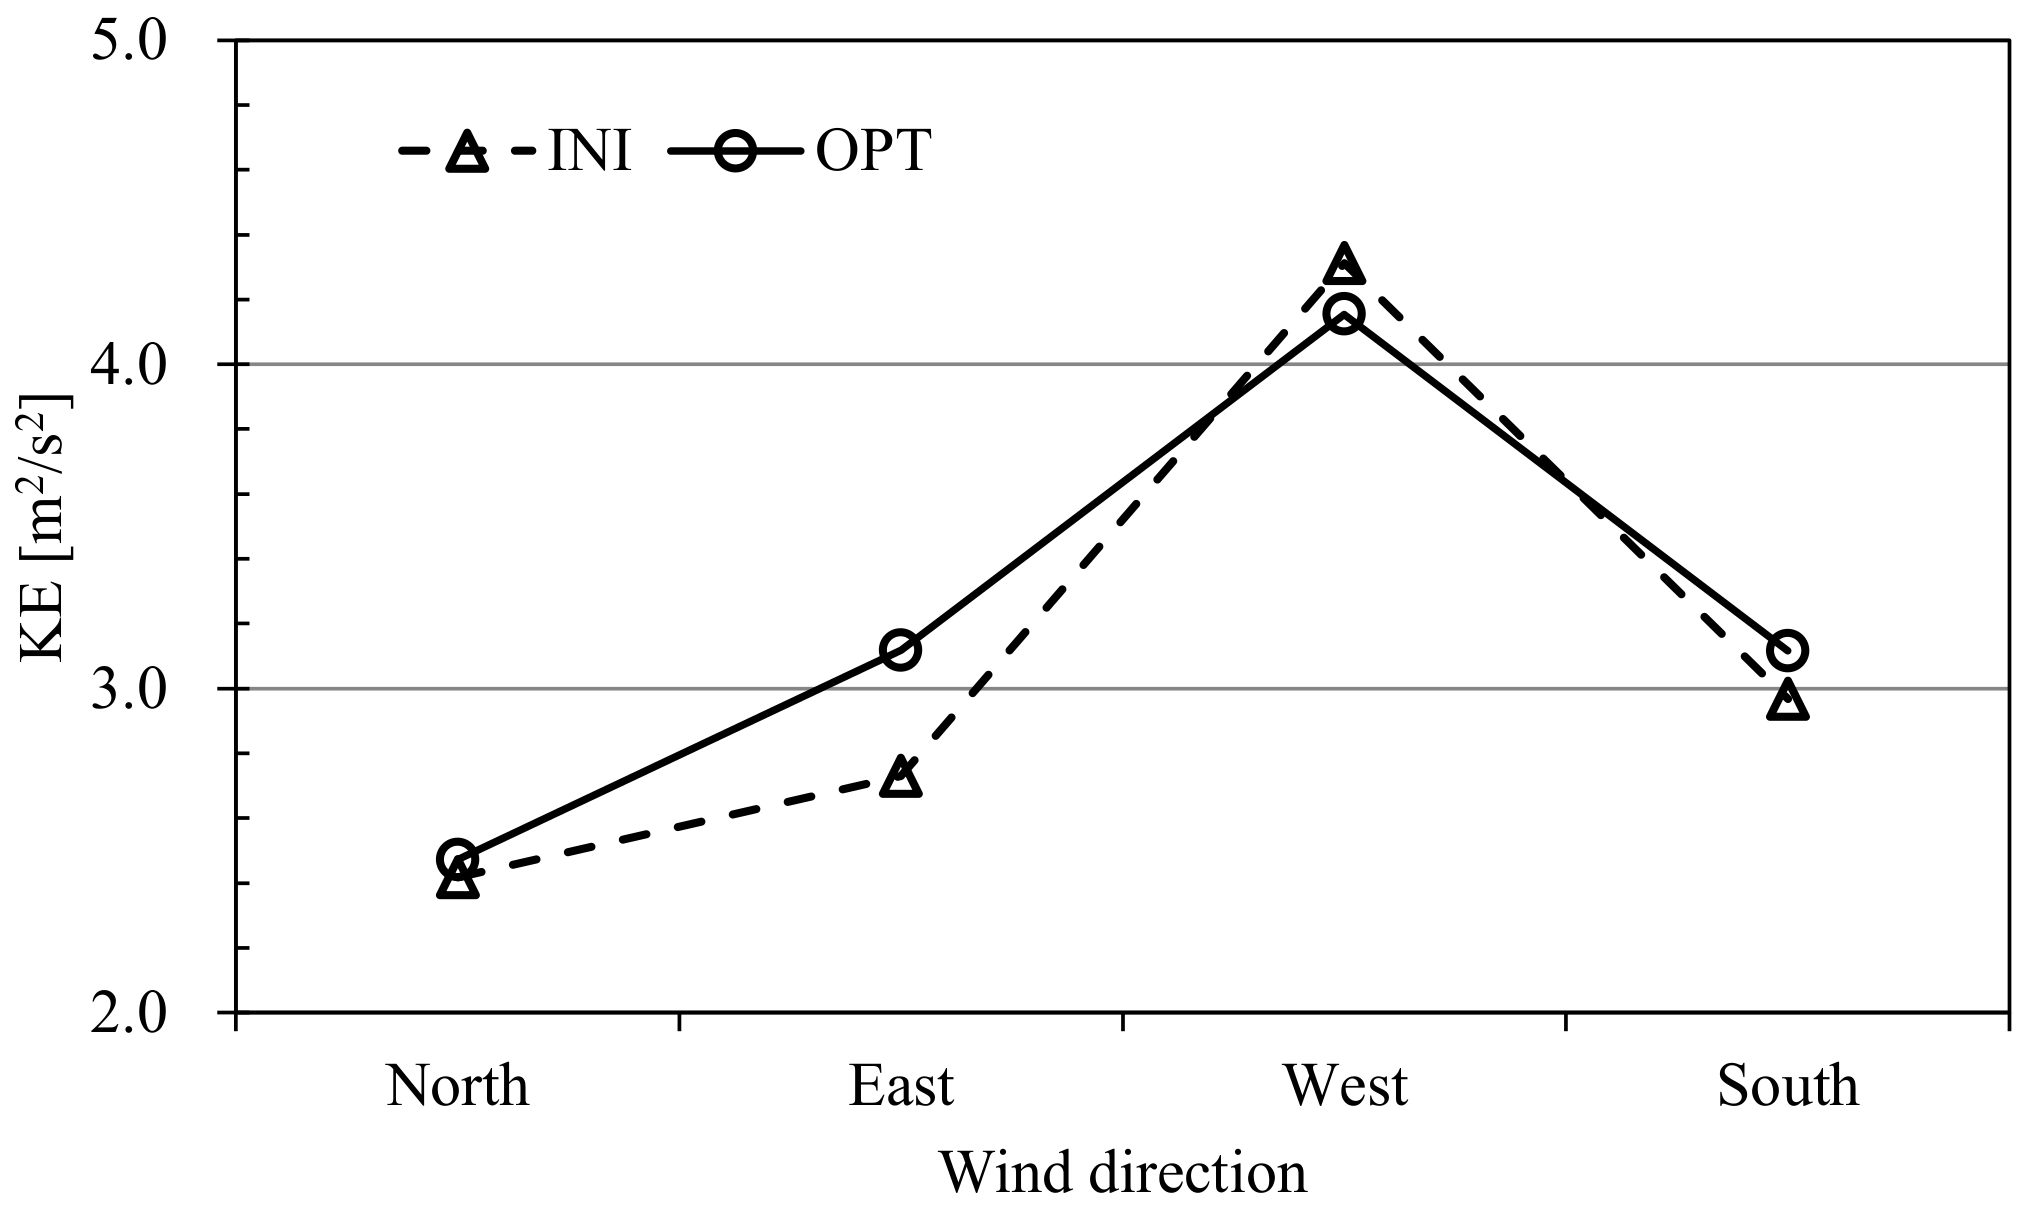
To investigate the changes in ventilation performance with the design evolution, the KE in each wind direction for the initial (INI) and optimized design (OPT) were calculated. We chose the building configuration of the last iteration as the OPT, as shown in Figure 9. The difference in KE between the two cases was as high as 14% with an easterly wind, and even the KE of the INI was larger than that of the OPT with a westerly wind (Figure 10). The overall performance (KEanuual) for the OPT was better than that for the INI because the objective function is weighted with respect to the annual frequencies of wind direction occurrences.
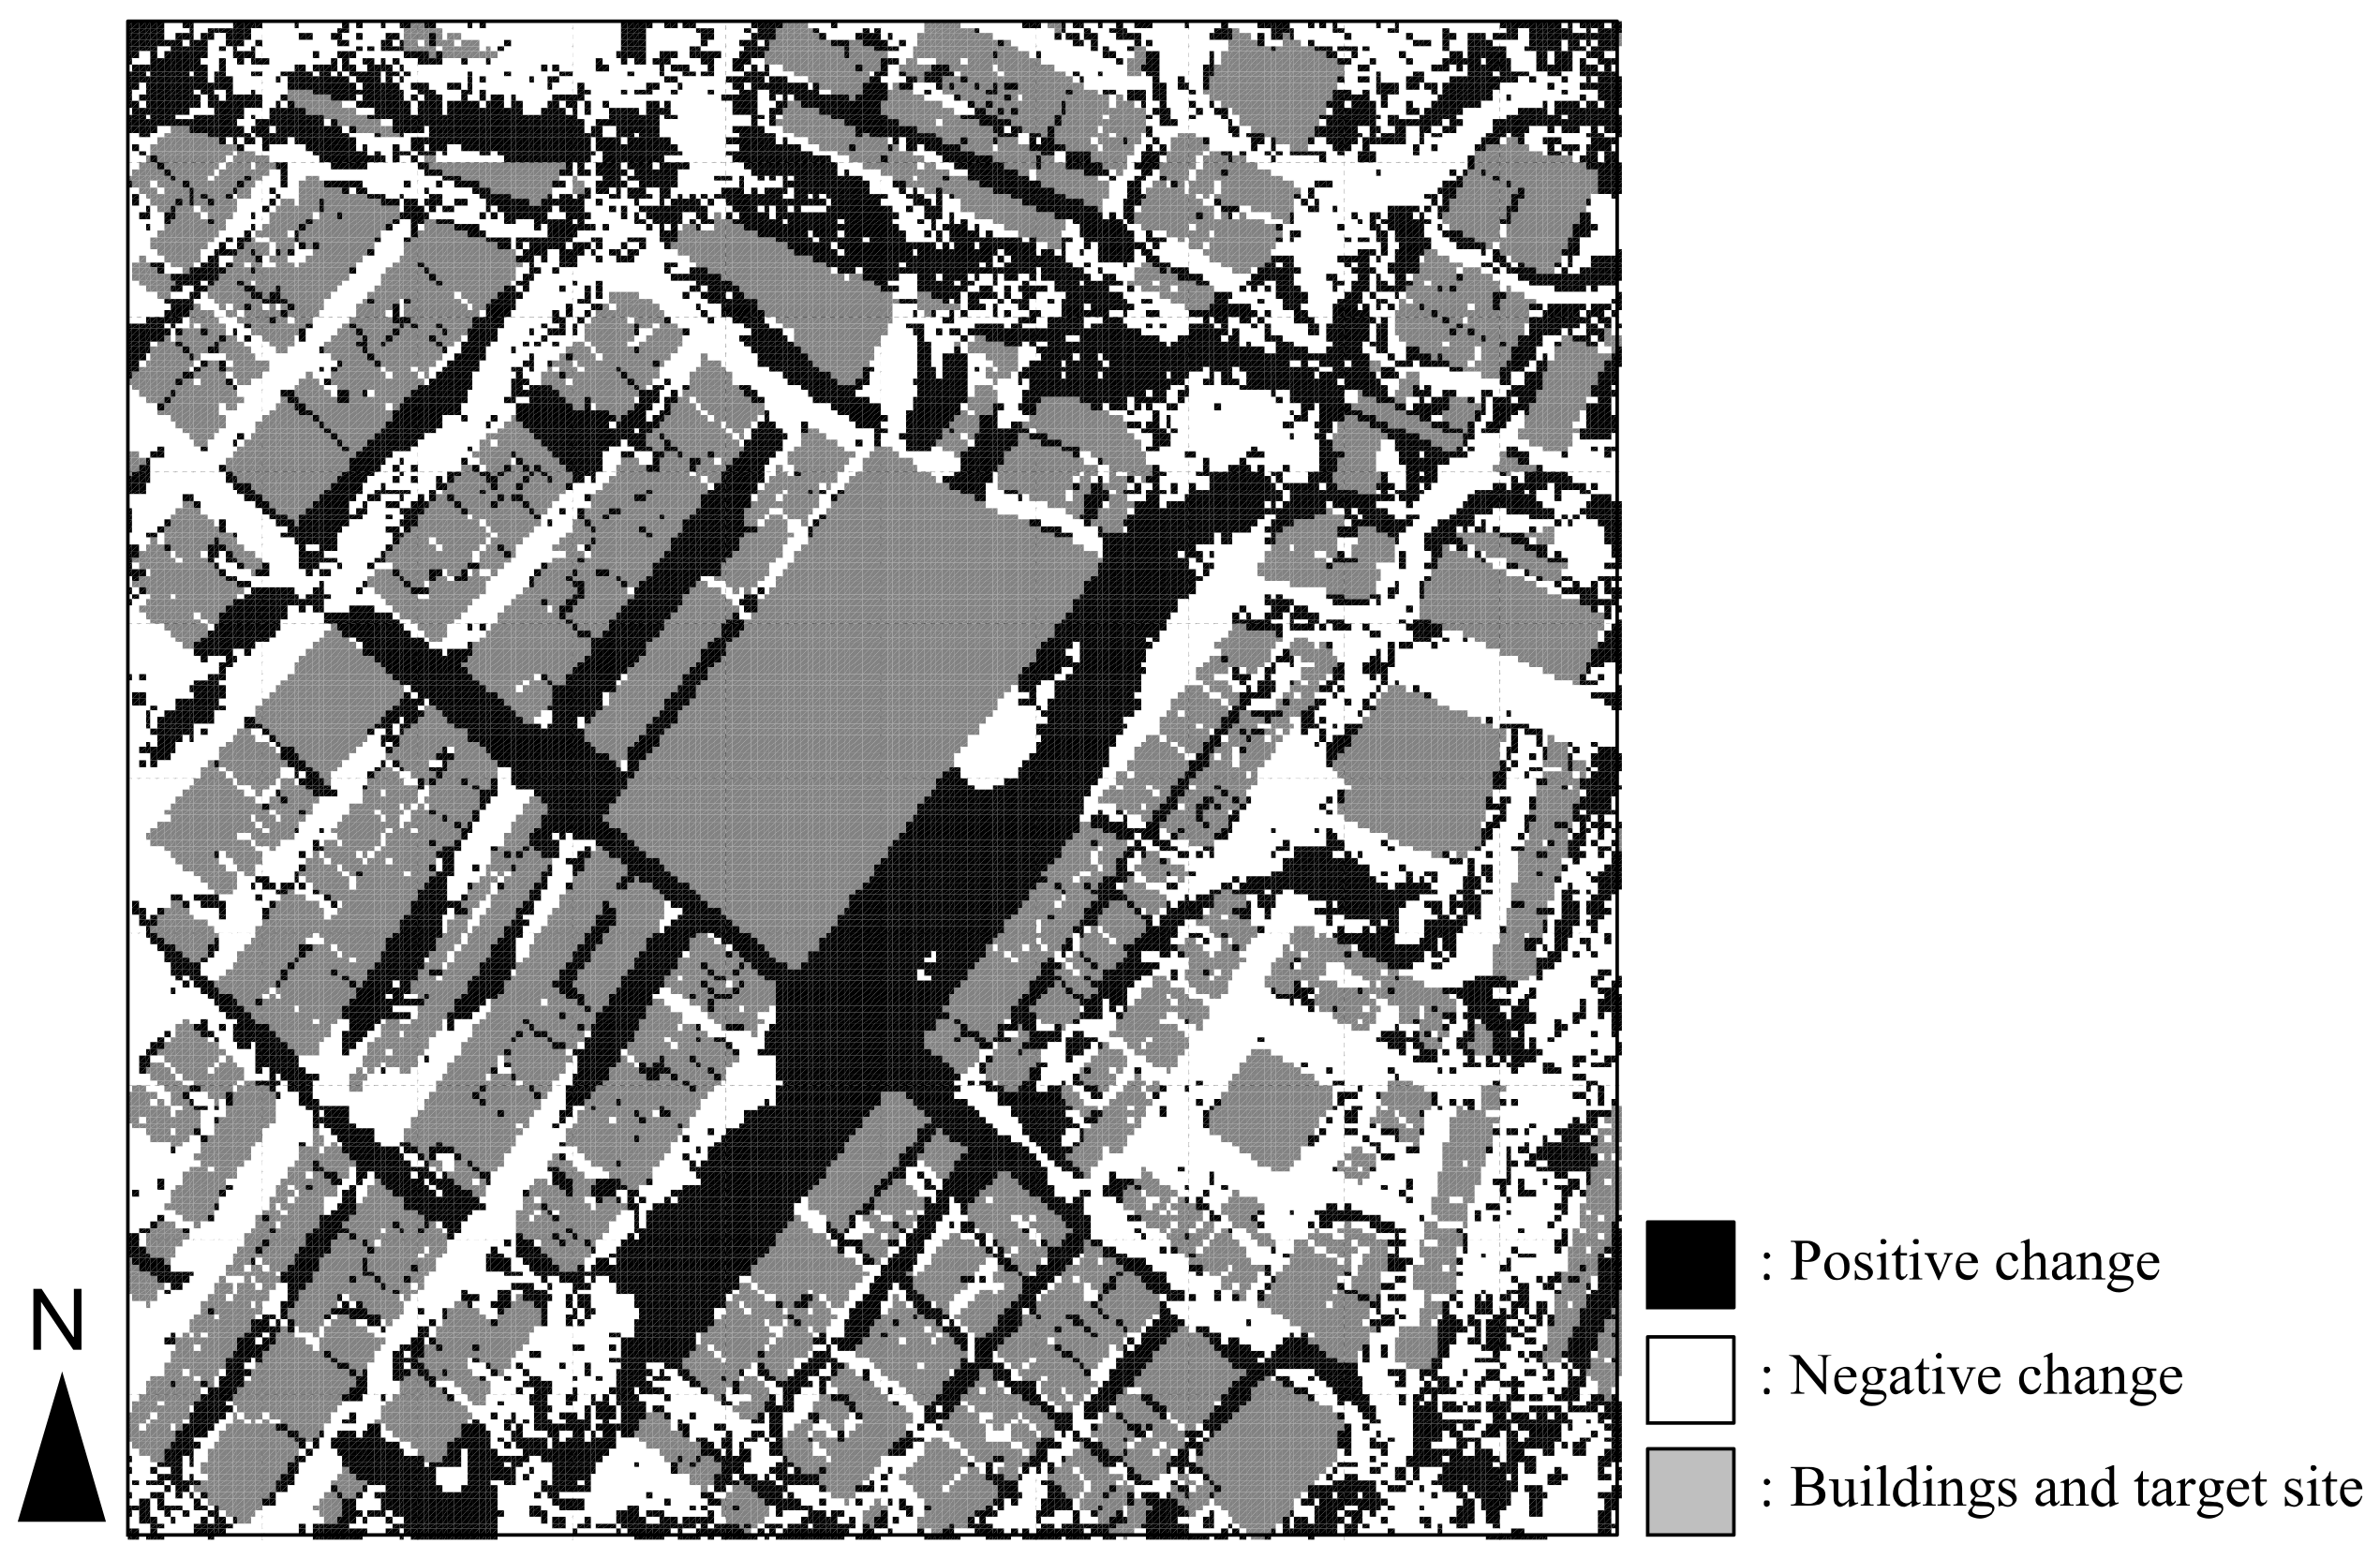
Using KE and KEannual, the superiority of the different design alternatives can be estimated; however, we could not identify the locations of high and low ventilation potential in the target area because they are volume-averaged values for the entire target area (500 m × 500 m × 200 m). Using the kinetic energy before the volume-averaging process, we calculated the annual average kinetic energy for each calculation mesh and compared it for INI and OPT. Figure 11 shows the change in the annual average kinetic energy through design evolution from INI to OPT. In 52% of the region, the annual average kinetic energy increased over the design evolution, and this increase was concentrated around the study site. The performance could have been improved further had the calculation continued for more than 240 iterations. However, the point we wish to emphasize is that the building configuration was transformed into a more suitable design that corresponds to the site conditions using the proposed design method.
6. Discussion
An issue that needs to be addressed is the calculation load. The computer used for all of the optimizations had the following characteristics: a Windows 7 64-bit operating system, an Intel Xeon E5-2690 2.90-GHz CPU, and 192 GB of RAM. The calculation time to complete 240 iterations was approximately seven weeks, which may seem to be long to generate several design alternatives in the early design stage. Furthermore, this time requirement may be considered a bottleneck of the proposed design method. However, the design decision-making process that we wanted to implement in this study is a posteriori preference articulation (exploration → decision), not a progressive preference articulation (decision <-> exploration), as described in Wright et al. [38]. In progressive preference articulation, each new solution requires a repeated simulation; thus, instant feedback from the simulation results is required. However, in a posteriori preference articulation, the decision maker is presented with a set of solutions that result from the exploration and chooses a final design solution from that set. In the proposed design method, the exploration process is based on performance assessment through CFD, and we provide the results to an architect as a set of reference designs in the early design stage. The architect then chooses a final design solution from that set, without feedback. According to Flager and Haymaker [19], in this type of decision-making process, architects and engineers typically spend 3.8 weeks generating options and running analyses and 6.48 weeks representing, documenting, and coordinating existing information. Because the proposed design method performs large portions of these activities, it is considered to be useful in the early design stage, even though seven weeks is still a significant amount of time. Future advances in the computing environment will reduce the computation load.
7. Conclusions
As urban sustainability has attracted increasing attention, improving the environmental performance of building designs has become an increasingly important issue. Consideration of the environmental performance of building designs in the early design stage is important because this stage offers ample opportunities to increase building performance. However, the design option space cannot be explored systematically using the type of conventional trial-and-error design process used in case studies and parametric studies. We have been seeking ways to supplement the conventional method with a method that allows such a systematic search. In this paper, we propose a performance-based design method that uses numerical simulations together with an evolutionary algorithm. The target environmental performance, i.e., the objective function for the evolutionary algorithm, is the ventilation potential at the spatial scale of a parcel encompassing a study site. To estimate this performance, we used CFD simulations coupled to a GA and evolved the design alternatives for the building configuration based on the site conditions. To provide a link between CFD and GA, we used a custom-made parametric design program. Our process was based on the major premise that an architect may not accept an irregularly shaped building of impractical design, regardless of how superior its performance may be. Therefore, we proposed a building configuration representation method with a focus on practicality, which is what makes our work original and distinguishes it from several previous studies. In addition, we assumed a single feedback process in which the calculation results are fed back to an architect. However, this feedback can be repeated several times. Design developments can then be achieved not only for environmental performance but also for aesthetic and functional aspects, depending on the preferences of the architect.
In a case-study application, the proposed design method was demonstrated to be successful in improving the ventilation potential by evolving an initial design into a site-specific building configuration. It should be noted that the environmental performance of buildings depends not only on the urban ventilation potential but also on factors such as the annual energy consumption and lifecycle cost. Many of the previous studies mentioned in this paper have been focused on optimizing the building shape in terms of energy consumption. If the results of those studies are merged with those of this study, consideration of the tradeoffs between various environmental performance characteristics should lead to sustainable designs in the proper sense.
Author Contributions
Conceptualization, J.L. and R.O.; methodology, J.L. and R.O.; software, J.L.; writing—original draft preparation, J.L.; writing—review and editing, J.L. and R.O. All authors have read and agreed to the published version of the manuscript.
Funding
A part of this study was supported by JSPS KAKENHI Grant Number 24226013 and the National Research Foundation of Korea (NRF) grant funded by the Korea government (MSIT) (No. NRF-2020R1F1A1068197).
Institutional Review Board Statement
Not applicable.
Informed Consent Statement
Not applicable.
Data Availability Statement
Data sharing not applicable.
Conflicts of Interest
The authors declare no conflict of interest.
References
- Kusaka, H.; Kimura, F. Thermal Effects of Urban Canyon Structure on the Nocturnal Heat Island: Numerical Experiment Using a Mesoscale Model Coupled with an Urban Canopy Model. J. Appl. Meteorol. 2004, 43, 1899–1910. [Google Scholar] [CrossRef]
- Giridharan, R.; Lau, S.S.Y.; Ganesan, S.; Givoni, B. Urban design factors influencing heat island intensity in high-rise high-density environments of Hong Kong. Build. Environ. 2007, 42, 3669–3684. [Google Scholar] [CrossRef]
- Chen, H.; Ooka, R.; Huang, H.; Tsuchiya, T. Study on mitigation measures for outdoor thermal environment on present urban blocks in Tokyo using coupled simulation. Build. Environ. 2009, 44, 2290–2299. [Google Scholar] [CrossRef]
- Oliveira, S.; Andrade, H.; Vaz, T. The cooling effect of green spaces as a contribution to the mitigation of urban heat: A case study in Lisbon. Build. Environ. 2011, 46, 2186–2194. [Google Scholar] [CrossRef]
- Xu, T.; Sathaye, J.; Akbari, H.; Garg, V.; Tetali, S. Quantifying the direct benefits of cool roofs in an urban setting: Reduced cooling energy use and lowered greenhouse gas emissions. Build. Environ. 2012, 48, 1–6. [Google Scholar] [CrossRef]
- Chen, H.; Ooka, R.; Harayama, K.; Kato, S.; Li, X. Study on outdoor thermal environment of apartment block in Shenzhen, China with coupled simulation of convection, radiation and conduction. Energy Build. 2004, 36, 1247–1258. [Google Scholar] [CrossRef]
- Guo, Y.; Han, J.; Zhao, X.; Dai, X.; Zhang, H. Understanding the Role of Optimized Land Use/Land Cover Components in Mitigating Summertime Intra-Surface Urban Heat Island Effect: A Study on Downtown Shanghai, China. Energies 2020, 13, 1678. [Google Scholar] [CrossRef] [Green Version]
- Liang, Z.; Wang, Y.; Huang, J.; Wei, F.; Wu, S.; Shen, J.; Sun, F.; Li, S. Seasonal and Diurnal Variations in the Relationships between Urban Form and the Urban Heat Island Effect. Energies 2020, 13, 5909. [Google Scholar] [CrossRef]
- Arnfield, A.J. Two decades of urban climate research: A review of turbulence, exchanges of energy and water, and the urban heat island. Int. J. Climatol. 2003, 23, 1–26. [Google Scholar] [CrossRef]
- Oke, T.R. Street design and urban canopy layer climate. Energy Build. 1988, 11, 103–113. [Google Scholar] [CrossRef]
- Malkawi, A.M.; Srinivasan, R.S.; Yi, Y.K.; Choudhary, R. Decision support and design evolution: Integrating genetic algorithms, CFD and visualization. Autom. Constr. 2005, 14, 33–44. [Google Scholar] [CrossRef]
- Wang, W.; Zmeureanu, R.; Rivard, H. Applying multi-objective genetic algorithms in green building design optimization. Build. Environ. 2005, 40, 1512–1525. [Google Scholar] [CrossRef]
- Wang, W.; Rivard, H.; Zmeureanu, R. Floor shape optimization for green building design. Adv. Eng. Inform. 2006, 20, 363–378. [Google Scholar] [CrossRef]
- Tuhus-Dubrow, D.; Krarti, M. Genetic-algorithm based approach to optimize building envelope design for residential buildings. Build. Environ. 2010, 45, 1574–1581. [Google Scholar] [CrossRef]
- Cheng, C.L.; He, K.C.; Yen, C.J. Decision-making and assessment tool for design and construction of high-rise building drainage systems. Autom. Constr. 2008, 17, 897–906. [Google Scholar] [CrossRef]
- Granadeiro, V.; Pina, L.; Duarte, J.P.; Correia, J.R.; Leal, V.M.S. A general indirect representation for optimization of generative design systems by genetic algorithms: Application to a shape grammar-based design system. Autom. Constr. 2013, 35, 374–382. [Google Scholar] [CrossRef]
- Ihm, P.; Krarti, M. Design optimization of energy efficient residential buildings in Tunisia. Build. Environ. 2012, 58, 81–90. [Google Scholar] [CrossRef]
- Griego, D.; Krarti, M.; Hernández-Guerrero, A. Optimization of energy efficiency and thermal comfort measures for residential buildings in Salamanca, Mexico. Energy Build. 2012, 54, 540–549. [Google Scholar] [CrossRef]
- Granadeiro, V.; Duarte, J.P.; Correia, J.R.; Leal, V.M.S. Building envelope shape design in early stages of the design process: Integrating architectural design systems and energy simulation. Autom. Constr. 2013, 32, 196–209. [Google Scholar] [CrossRef]
- Touloupaki, E.; Theodosiou, T. Performance Simulation Integrated in Parametric 3D Modeling as a Method for Early Stage Design Optimization—A Review. Energies 2017, 10, 637. [Google Scholar] [CrossRef] [Green Version]
- Baglivo, C.; Congedo, P.; Di Cataldo, M.; Coluccia, L.; D’Agostino, D. Envelope Design Optimization by Thermal Modelling of a Building in a Warm Climate. Energies 2017, 10, 1808. [Google Scholar] [CrossRef] [Green Version]
- Ferdyn-Grygierek, J.; Grygierek, K. Multi-Variable Optimization of Building Thermal Design Using Genetic Algorithms. Energies 2017, 10, 1570. [Google Scholar] [CrossRef] [Green Version]
- Flager, F.; Haymaker, J. A comparison of multidisciplinary design, analysis and optimization processes in the building construction and aero-space industries. In Proceedings of the International Conference on Information Technology in Construction, Maribor, Slovenia, 26–29 June 2007; pp. 625–630. [Google Scholar]
- Bowcutt, K.; Kuruvila, G.; Follett, W. Progress toward integrated vehicle design of hypersonic. In Proceedings of the International Conferences of the Aeronautical Sciences, Yokohama, Japan, 29 August–3 September 2004. [Google Scholar]
- Tahara, Y.; Tohyama, S.; Katsui, T. CFD-based multi-objective optimization method for ship design. Int. J. Numer. Methods Fluids 2006, 52, 499–527. [Google Scholar] [CrossRef]
- Zubair, M.; Bilal Awan, A.; Al-Ahmadi, A.; Abo-Khalil, A. NPC Based Design Optimization for a Net Zero Office Building in Hot Climates with PV Panels as Shading Device. Energies 2018, 11, 1391. [Google Scholar] [CrossRef] [Green Version]
- Yi, Y.K.; Malkawi, A.M. Optimizing building form for energy performance based on hierarchical geometry relation. Autom. Constr. 2009, 18, 825–833. [Google Scholar] [CrossRef]
- Jin, J.; Cho, H.; Jeong, J. Optimization of freeform building shape using genetic algorithm. In Proceedings of the Asia conference of International Building Performance Simulation Association, Shanghai, China, 27–30 October 2012. [Google Scholar]
- Kim, J.; Yi, Y.; Malkawi, A.M. Building form optimization in early design stage to reduce adverse wind condition-using computational fluid dynamics. In Proceedings of the Conference of International Building Performance Simulation Association, Sydney, Australia, 14–16 November 2011. [Google Scholar]
- Yi, Y.K.; Malkawi, A.M. Site-specific optimal energy form generation based on hierarchical geometry relation. Autom. Constr. 2012, 26, 77–91. [Google Scholar] [CrossRef]
- Gál, T.; Unger, J. Detection of ventilation paths using high-resolution roughness parameter mapping in a large urban area. Build. Environ. 2009, 44, 198–206. [Google Scholar] [CrossRef]
- Bu, Z.; Kato, S.; Ishida, Y.; Huang, H. New criteria for assessing local wind environment at pedestrian level based on exceedance probability analysis. Build. Environ. 2009, 44, 1501–1508. [Google Scholar] [CrossRef]
- Hang, J.; Sandberg, M.; Li, Y. Age of air and air exchange efficiency in idealized city models. Build. Environ. 2009, 44, 1714–1723. [Google Scholar] [CrossRef]
- Huang, Y.; Hu, X.; Zeng, N. Impact of wedge-shaped roofs on airflow and pollutant dispersion inside urban street canyons. Build. Environ. 2009, 44, 2335–2347. [Google Scholar] [CrossRef]
- Letzel, M.O.; Krane, M.; Raasch, S. High resolution urban large-eddy simulation studies from street canyon to neighbourhood scale. Atmos. Environ. 2008, 42, 8770–8784. [Google Scholar] [CrossRef]
- Hefny, M.M.; Ooka, R. CFD analysis of pollutant dispersion around buildings: Effect of cell geometry. Build. Environ. 2009, 44, 1699–1706. [Google Scholar] [CrossRef]
- Tominaga, Y.; Mochida, A.; Yoshie, R.; Kataoka, H.; Nozu, T.; Yoshikawa, M.; Shirasawa, T. AIJ guidelines for practical applications of CFD to pedestrian wind environment around buildings. J. Wind Eng. Ind. Aerodyn. 2008, 96, 1749–1761. [Google Scholar] [CrossRef]
- Luo, Z.; Li, Y. Passive urban ventilation by combined buoyancy-driven slope flow and wall flow: Parametric CFD studies on idealized city models. Atmos. Environ. 2011, 45, 5946–5956. [Google Scholar] [CrossRef]
- Gao, N.P.; Niu, J.L. CFD Study of the Thermal Environment around a Human Body: A Review. Indoor Built Environ. 2005, 14, 5–16. [Google Scholar] [CrossRef]
Figure 1.
Target area of the case study: (a) top view and (b) perspective view.

Figure 2.
Flowchart for the proposed design method.

Figure 3.
Initial building configuration.

Figure 4.
Design variables for configuration parameterization of Building 1.

Figure 5.
Value of the constraint function C1(X,S) for query individuals.

Figure 6.
Wind rose for Tokyo: (a) the percentage of occurrences of wind directions, and (b) the mean velocity for each wind direction.
Figure 6.
Wind rose for Tokyo: (a) the percentage of occurrences of wind directions, and (b) the mean velocity for each wind direction.

Figure 7.
Calculation domain.

Figure 8.
Evolutionary changes in RKEannual.

Figure 9.
Building configuration generated in the last iteration.

Figure 10.
The spatially averaged kinetic energy (KE) in each wind direction for the initial (INI) and optimized design (OPT).
Figure 10.
The spatially averaged kinetic energy (KE) in each wind direction for the initial (INI) and optimized design (OPT).

Figure 11.
Change in annual average kinetic energy through design evolution (1.5 m above ground).


Table 1.
Morphological properties of the target area.
| Properties | Value |
|---|---|
| Total area | 250,000 m2 |
| Number of buildings | 559 |
| Averaged building height | 19.2 m |
| Averaged building plan area fraction | 32.26% |
| Averaged floor area ratio | 342.66% |
| Study site area | 16,712 m2 |
Table 2.
Properties of the building masses.
| Building 1 | Building 2 | Building 3 | |
|---|---|---|---|
| Height | 80 m | 24 m | 12 m |
| Floors | 20 | 6 | 3 |
| Floor height | 4 m | 4 m | 4 m |
| Plan area | 1600 m2 | 3500 m2 | 2700 m2 |
| Total floor area | 32,000 m2 | 21,000 m2 | 8100 m2 |
Table 3.
Wind direction classification.
| Wind Direction | Mean Velocity (m/s) | Time (Hours) | |
|---|---|---|---|
| N | N, NNE, NNW | 2.00 | 3604 |
| E | E, NE, SE, ENE, ESE | 2.24 | 1991 |
| W | W, NW, SW, WNW, WSW | 2.60 | 1728 |
| S | S, SSE, SSW | 2.25 | 1437 |
Table 4.
Calculation conditions.
| Turbulence Model | Standard k–ε Model |
|---|---|
| Difference scheme | Velocity and advective term: secondary upwind Diffusion term: central difference |
| Inlet | |
| Outlet | Pressure outlet |
| Side, top | Free slip |
| Ground, wall | No-slip with zero roughness |
Publisher’s Note: MDPI stays neutral with regard to jurisdictional claims in published maps and institutional affiliations. |
© 2021 by the authors. Licensee MDPI, Basel, Switzerland. This article is an open access article distributed under the terms and conditions of the Creative Commons Attribution (CC BY) license (http://creativecommons.org/licenses/by/4.0/).
Share and Cite
MDPI and ACS Style
Lim, J.; Ooka, R. A CFD-Based Optimization of Building Configuration for Urban Ventilation Potential. Energies 2021, 14, 1447. https://0-doi-org.brum.beds.ac.uk/10.3390/en14051447
AMA Style
Lim J, Ooka R. A CFD-Based Optimization of Building Configuration for Urban Ventilation Potential. Energies. 2021; 14(5):1447. https://0-doi-org.brum.beds.ac.uk/10.3390/en14051447
Chicago/Turabian StyleLim, Jongyeon, and Ryozo Ooka. 2021. "A CFD-Based Optimization of Building Configuration for Urban Ventilation Potential" Energies 14, no. 5: 1447. https://0-doi-org.brum.beds.ac.uk/10.3390/en14051447
Note that from the first issue of 2016, this journal uses article numbers instead of page numbers. See further details here.