1. Introduction
The detrimental impact of exhaust emissions from vehicles [
1,
2,
3] on climate and human health has promoted the development of many types of technologies, such as hybrids. [
4,
5,
6]. Refrigerated commercial vehicles are used extensively on the world’s roads for transporting food, medicine and other pay-loads requiring cooling. The vast majority of current refrigerated commercial vehicles comprise truck-trailer refrigeration units (TRU) that are powered by auxiliary diesel engines. These engines are subject to the NonRoad Mobile Machinery (NRMM) emissions regulations because they can emit noticeably higher amounts of Nitrogen Oxides (NOx) and particulate matter (PM) compared to a truck’s propulsion engine. It has been estimated that replacement of the auxiliary diesel engine with zero-emission engine systems for 13,000 refrigerated trailers (approximately a third of the projected fleet in the UK by 2025) would save, annually, 146 kilotons of carbon dioxide (CO
2), 1.8 kilotons of NOx (equivalent to the emission of 1.2 million Euro 6 diesel cars), and 180 tons of PM emissions (equivalent to the emissions of more than 2.2 million Euro 6 diesel cars) [
7].
Recently, a novel liquid nitrogen (LN
2) engine system, which can provide simultaneous cooling and auxiliary power in refrigerated commercial trucks, has been investigated in detail [
8]. The technology makes a significant departure from previous efforts by adopting the novel use of a heat exchange fluid (HEF) (typically composed of 60% antifreeze by volume and 40% deionised water by volume) which is directly mixed with the gaseous nitrogen (N
2) in the engine cylinder. This approach significantly enhances the engine performance, which is attributed, among other factors, to the heat transferred from the HEF to the expanding N
2 in the engine cylinder. The concept of LN
2/liquid air (LAir) hybrid system per se is not novel, as the first relevant patent is dated back to 1900 by Andersen [
9] who proposed to generate power through both evaporation of LAir and combustion by injecting a controlled amount of liquid oxygen and hydrocarbons. Following Andersen’s patent [
9], various concepts for generating mechanical work were proposed to exploit both thermal and chemical energy of cryogenic liquids, including LN
2, LAir and Liquified Natural Gas (LNG), as reviewed by Knowlen et al. [
10] and Christodoulou et al. [
8]. As they noted, most of the proposed systems rely on an adiabatic expansion process to produce mechanical work, which potentially limits their specific work output. Adopting an isothermal expansion process could, theoretically, double the achievable specific work based on idealised thermodynamic cycles [
10].
In 1997, the University of North Texas demonstrated an LN
2 engine system based on the open Rankine cycle, i.e., similar to a steam engine but using high-pressure N
2 vapour as the working fluid [
11]. While that work proved the concept, the performance was low, with a specific work of up to 40 kJ/kg-LN
2. A major improvement in the specific work of LN
2 engine systems was reported by the Dearman Engine Company (now called Clean Cold Power) and a prototype system (up to 172 kJ/kg) was demonstrated experimentally and reported in the literature [
8]. This improvement was achieved by integrating a dedicated Heat Exchange Fluid (HEF) subsystem to enhance the in-cylinder heat transfer to the cold N
2 and increase the effective expansion ratio. Combining the total cooling power and shaft power the system can generate, the effective specific energy density for the proposed LN
2 system can achieve more than 1 MJ/kg, which makes it viable to replace the diesel auxiliary engine in the TRU unit, but not the main propulsion diesel engine. A similar concept, proposing the direct injection of a heat exchange fluid (mentioned as ‘hydraulic fluid’) along with LN
2 instead of gaseous N
2, was presented by Ordonez et al. [
12]. It was thought that the engine speed would be restricted by the presence of the hydraulic fluid, so the idea was not taken forward by those authors in their further studies. The concept of HEF was taken forward, and later patented, by Dearman as part of a new LN
2/LAir engine system [
13]. Unlike previously published engine studies that relied on bulky air-side heat exchangers to evaporate LN
2 or LAir, in Dearman’s concept [
12] the LN
2 is evaporated by absorption of heat to cover the cooling demand of the TRU. In addition, the system benefits from the presence of HEF supplied directly into the engine cylinder that provides heat to the expanding gaseous N
2 and, therefore, leads to an increase in the expansion work. This allows the development of a compact engine system with a near-isothermal expansion process. The introduced HEF does not only enhance the in-cylinder heat transfer rate, but also increases the effective expansion ratio because it occupies part of the engine clearance volume. As a result, the engine efficiency increases significantly.
The concept of using direct in-cylinder LN
2 and HEF to achieve sufficiently rapid internal evaporation of an LN
2 jet inside the engine cylinder was examined by Rebelo et al. [
14] who showed that the evaporation rate of a 100
diameter LN
2 droplet in different liquids maintained at room-temperature in a typical engine cycle is very limited. The adoption of direct in-cylinder LN
2 injection in piston engines will need submicron size LN
2 droplets, which requires the development of a sophisticated cryogenic fluid atomiser. A practical implementation of a direct LN
2 injection concept would enable a more efficient exploitation of energy released during the LN
2 evaporation process (which is partially wasted in an externally LN
2 evaporated system due to additional pressure loss). However, an external LN
2 evaporation system can cover the cooling needs for a refrigeration unit, while generating additional power by expanding the high pressure gaseous N
2 in a reciprocating engine. Christodoulou et al. [
8] reported a detailed experimental investigation of an externally evaporated LN
2 engine system with an integrated HEF system where LN
2 is fully evaporated externally and then introduced into the engine as a high-pressure superheated N
2 vapour [
8]. Their work clearly showed the beneficial impact of HEF on engine work output and engine efficiency. It proved that the generated indicated power and efficiency is between an adiabatic expansion process and an isothermal expansion process. Furthermore, it proved experimentally that an increase in the HEF temperature can additionally boost the indicated work output but reduces the engine efficiency due to the increased energy input. Throughout their work, the HEF composition was kept constant at 60% of CoolFlow DTX (by volume) and 40% deionised water (by volume). Below, the notation “DTX” is used to represent commercial fluid Coolflow DTX (the trademark belongs to Hydratech Inc).
As HEF plays an important role in boosting LN
2 engine system performance, it would be valuable to know how its compositions and thermophysical properties affect the in-cylinder heat, mass transfer process and engine performance. Considering the main purpose of HEF is to enhance the in-cylinder heat transfer, HEF with high thermal diffusion and heat capacity, while having low toxicity, is desirable for the application. Liquid-gas direct-contact heat and mass transfer processes can be found in numerous industrial applications such as water desalination by freezing, geothermal power energy production, crystallisation, waste heat recovery, energy storage systems, solar power energy and emergency cooling of chemical and nuclear reactors [
14,
15,
16,
17,
18]. Due to vastly different geometries and potentially highly turbulent flow fields (as in the LN
2 engine), numerical models of direct contact heat exchangers in the literature [
19,
20,
21,
22] were applicable only to simplified conditions, and very limited quantitative experimental results were available for their validation [
20]. In addition, most numerical models [
19,
20,
21,
22] have assumed constant fluid properties throughout the flow field, which could lead to large errors, e.g., in cases where the fluid temperature and compositions change significantly [
19].
In summary, the previous study [
8] clearly demonstrated that introduction of HEF into the engine can enhance the engine work output and improve efficiency. However, the effect of varying HEF composition and thermophysical properties on engine performance have neither been investigated experimentally nor theoretically. While it is recognised that quantification of the detailed in-cylinder HEF-N
2 flow process could generate critical insights in understanding engine performance, many significant knowledge gaps existing in modelling the direct-contact heat and mass transfer process could become a long-term task. As the first step to quantify the potential impact, this research is focused on systematic engine tests. The experiments were performed by varying the water content in the HEF, which resulted in three different volume fractions of DTX (60, 40 and 20%) using an LN
2 engine system patented by Dearman [
13], and further developed by the Clean Cold Power UK Ltd., as a prototype for commercial applications in a refrigeration truck. In addition to the study of the influence of HEF composition, the following parameters were systematically and independently varied during the experiments: inlet N
2 pressure and temperature, and HEF temperature and engine speed. Further understanding of the full potential of the engine was achieved by the thermodynamic analysis, which was specifically tailored to the engine system under investigation. The research results support the development of optimised industrial solutions for LN
2 engines as auxiliary power systems.
2. Methodology
2.1. Thermodynamic Analysis of the Engine System
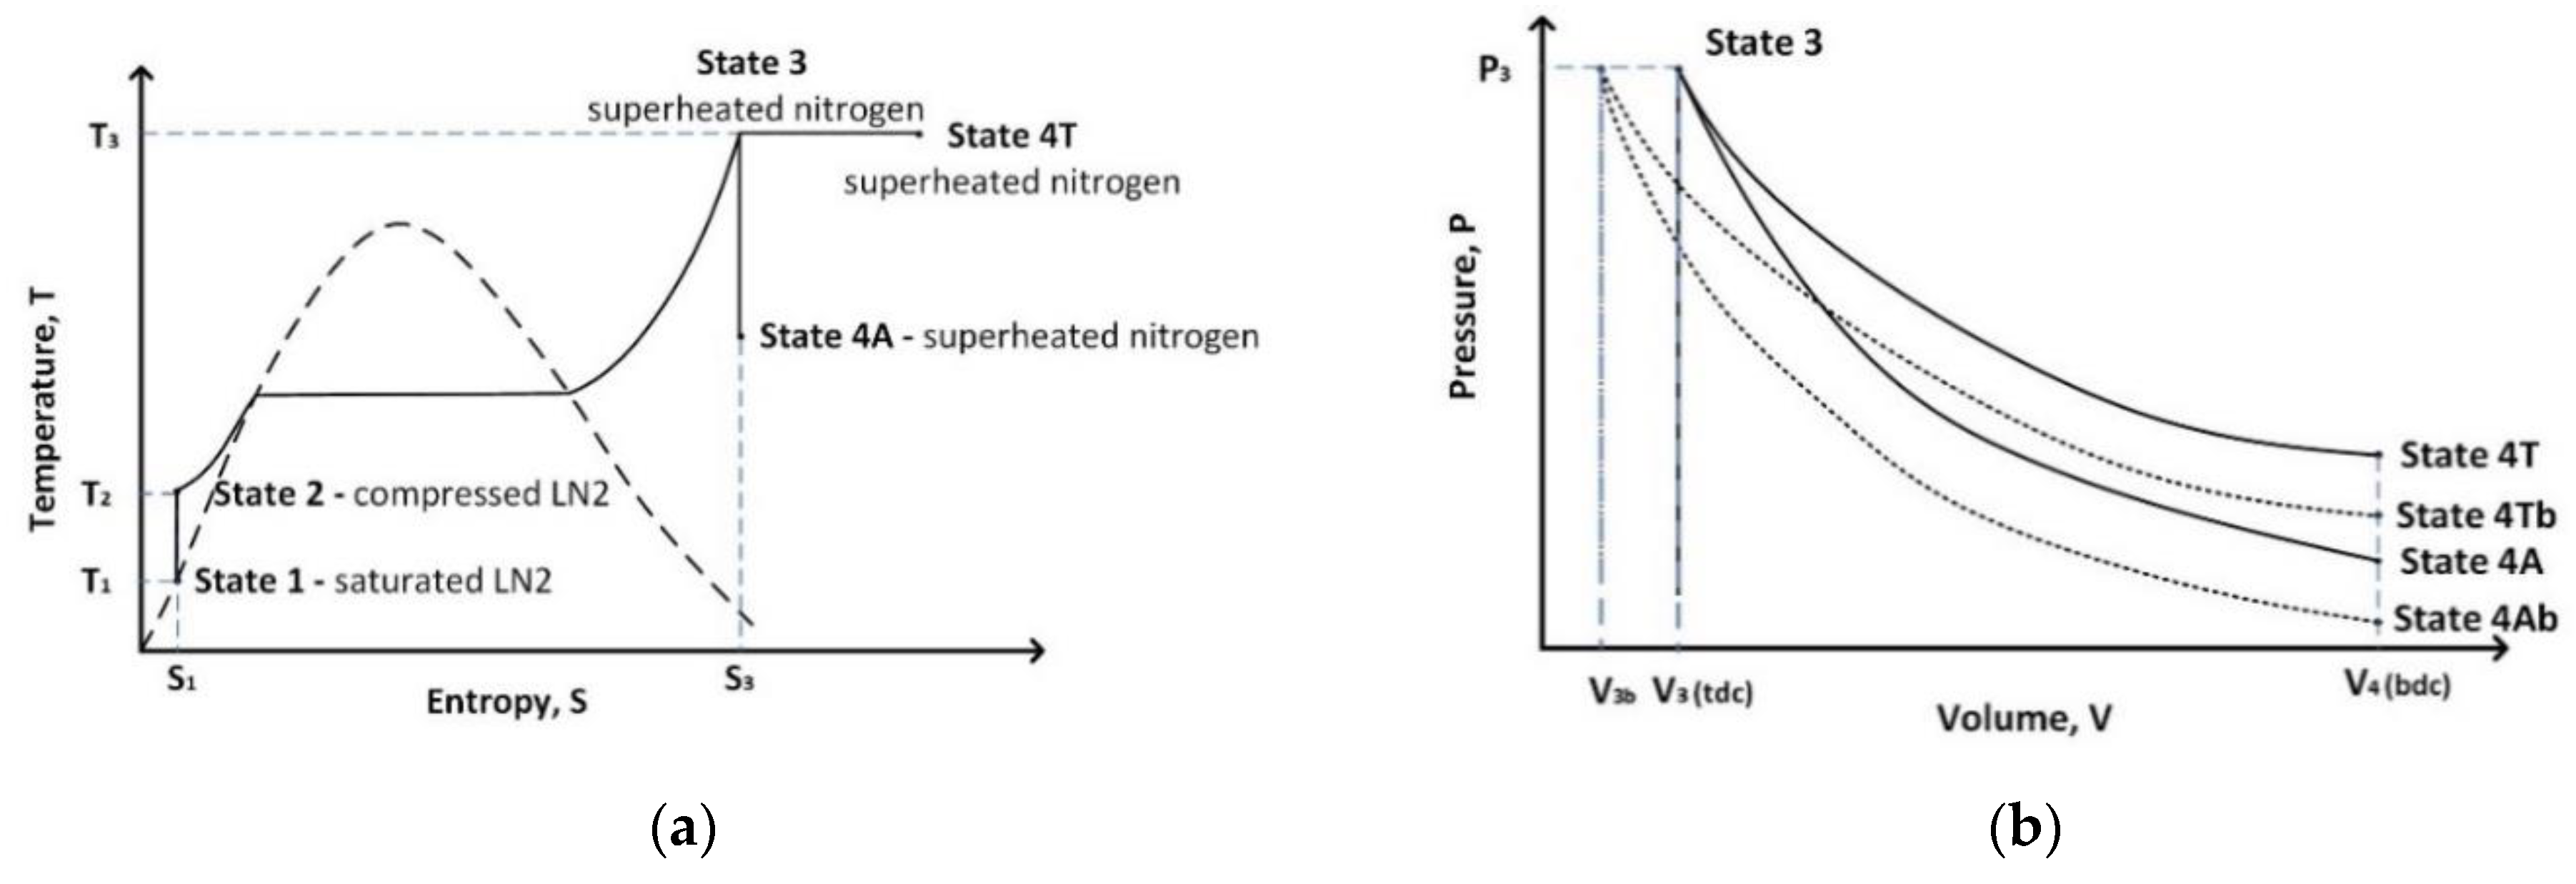
This section summarizes the key feature of the thermodynamic model which is based on the geometry of the tested liquid nitrogen (LN
2) engine. Further details can be found in the previous publication [
8]. The model is based on an idealised open-Rankine cycle (see
Figure 1), which neglects mechanical losses and the detailed valve flow processes.
The thermodynamic cycle starts from a saturated liquid nitrogen at 3 bar (LN
2 storage vessel pressure (state 1 in
Figure 1a) which goes through an isentropic compression process in a cryogenic piston pump to become a compressed liquid at different preset pressures (state 2 in
Figure 1a). The compressed liquid is then heated at constant pressure through a LN
2/HEF heat exchanger to become superheated gaseous nitrogen at two different preset temperatures (state 3 in
Figure 1a). N
2 in state 3 (see
Figure 1a) expands within the clearance volume of the cylinder from near the top dead-centre (TDC) to the exhaust port opening point, to produce work.
Both the adiabatic and isothermal expansion processes are considered in
Figure 1b. When there is no HEF supply, the whole engine clearance volume (46.98 mL) was assumed to equal the nitrogen volume. Using the ideal gas model, the adiabatic expansion work (
) and isothermal expansion work (
) without HEF supply can be calculated by:
where
is the engine clearance volume,
is the N
2 pressure at the engine intake,
is the heat capacity ratio of N
2 and
is the engine compression ratio that is calculated using the engine geometry (see
Table 1).
The amount of heat added during the isothermal expansion work () is the same as the isothermal expansion work produced ().
When HEF is introduced into the cylinder, the effective clearance volume is reduced. Since the exact clearance volume was difficult to measure during the experiment, the effective clearance volume was calculated based on the assumption that the clearance volume was fully occupied by the inflow nitrogen and based on the actual nitrogen mass flow rate measured during the engine tests. The adiabatic expansion work with HEF (
) and the isothermal expansion work with in-cylinder HEF (
) can then be expressed as:
As a result, the overall thermal efficiency for the adiabatic expansion process (
) and with in-cylinder HEF (
) can be derived as follows:
The overall thermal efficiency for the isothermal expansion process (
) and with in-cylinder HEF (
):
In practical applications, it is complicated to measure the amount of heat added during the expansion stroke because the waste heat is used to heat the in-cylinder HEF. Therefore, an effective thermal efficiency is defined below by ignoring the amount of heat added during the expansion stroke to quantify and compare the measured engine performance and that predicted by the thermodynamic analysis:
The thermodynamic properties of nitrogen were found from the NIST database [
23].
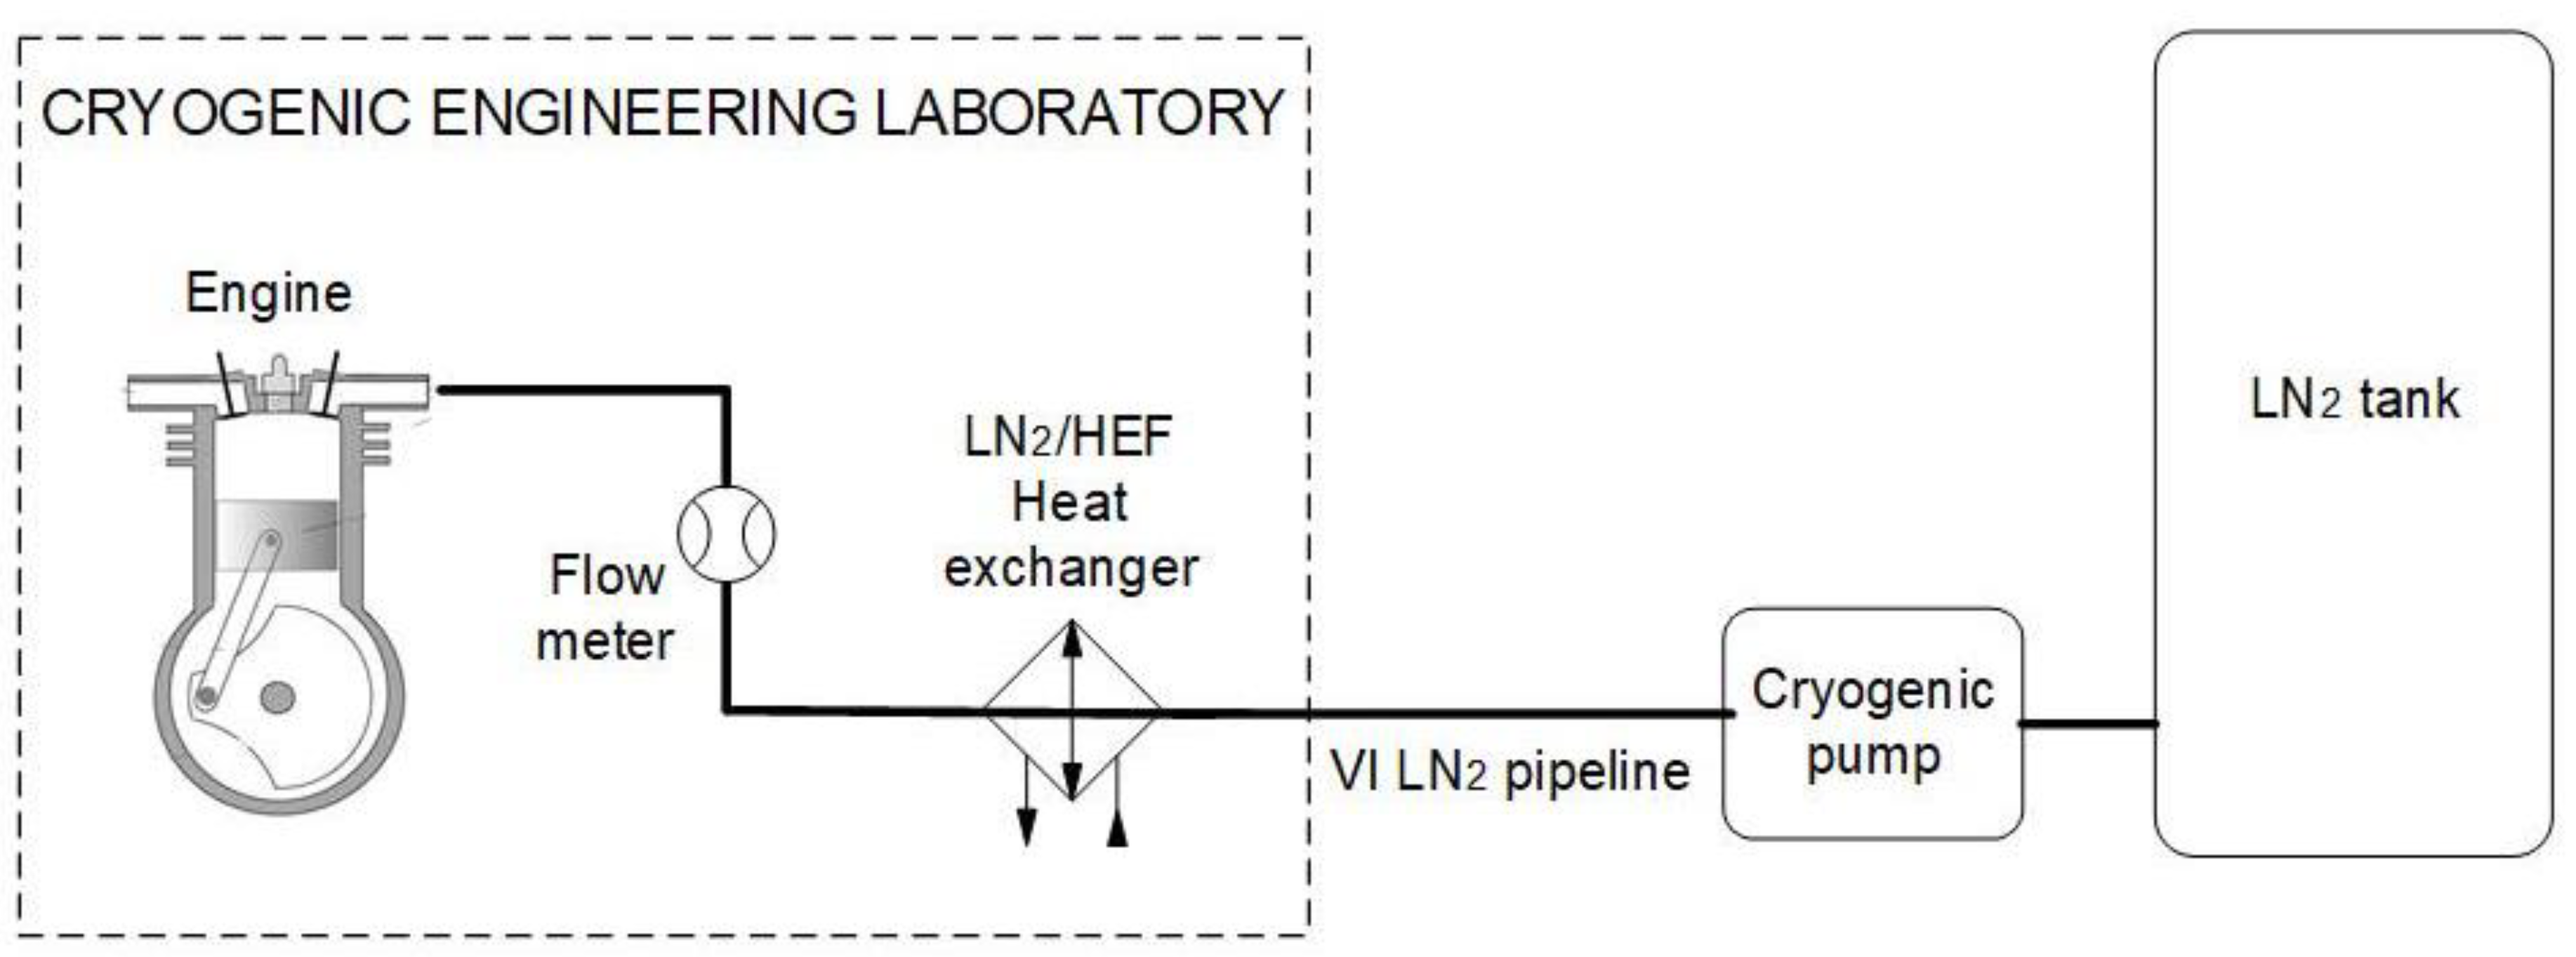
2.2. Experimental Facility
The experiments were performed in a cryogenic engineering laboratory equipped with dedicated ventilation and oxygen depletion monitoring systems. The experimental facility comprised the engine and four peripheral subsystems which were: (i) nitrogen (N
2) storage and supply, (ii) heat exchange fluid (HEF) storage and supply, (iii) engine test bed and (iv) data acquisition (DAQ) and control. The experimental facility was designed and developed by the authors. A brief description of subsystems along with their functions in the engine system is provided below. A more detailed description, along with the individual components comprising each subsystem, can be found in their previous publication [
8].
The LN
2 was stored in a vacuum insulated vessel before being conveyed to a counterflow heat exchanger using a cryogenic pump and a vacuum insulated (VI) pipeline. Heat transfer from HEF in an external heat exchanger resulted in full LN
2 evaporation and gaseous N
2 superheated to a temperature set point. The N
2 flowed through a thermal mass flow meter and into the engine where it expanded to generate the shaft power, as shown in
Figure 2.
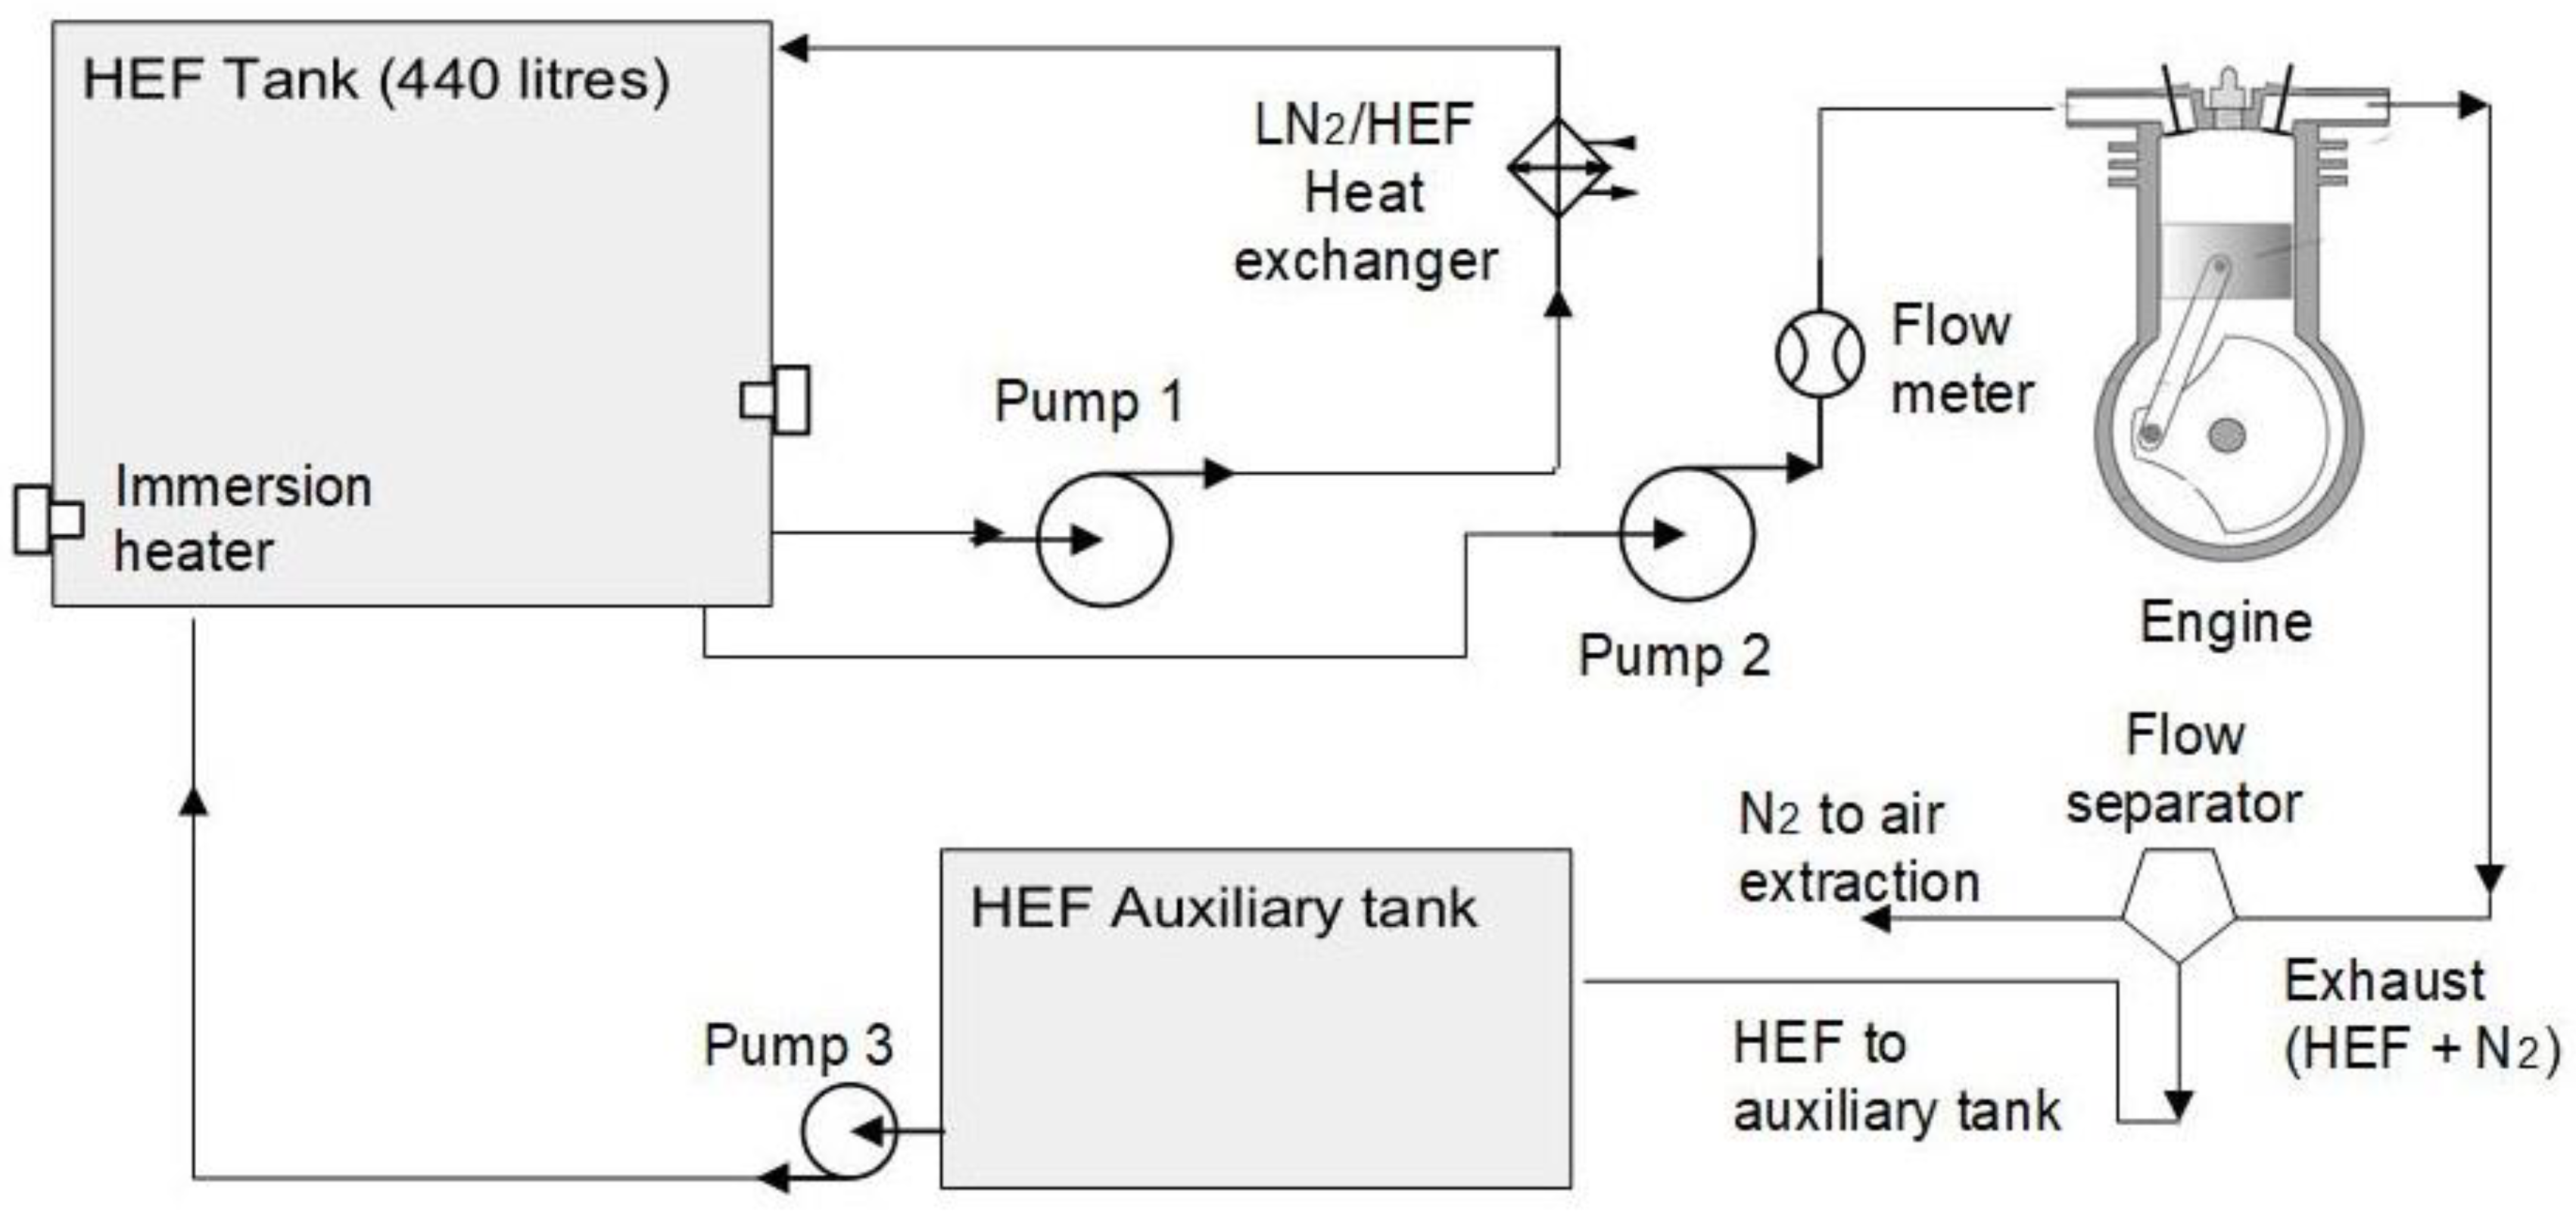
The HEF storage and supply subsystem is shown in
Figure 3. HEF, composed of deionised water and Coolflow DTX was pumped to both the LN
2/HEF heat exchanger and the engine. The HEF heat was used for both controlling the N
2 inlet condition and increasing the engine specific work and efficiency. The in-cylinder mixing of N
2 and HEF, patented by Dearman [
14], is a unique feature of the engine used throughout this research work. Both HEF circuits constituted a closed loop since, upon utilisation of its thermal energy, the HEF was pumped back to the main tank where it was reheated and reused. Downstream of the engine, the multiphase flow of gaseous N
2 and HEF was separated in a commercial flow separator. The reclaimed HEF was then pumped back to the HEF tank (440 L) and the gaseous N
2 exhausted to the atmosphere. In the previous study [
8], the volume fraction of DTX was kept constant at 60%. In the current study, the volume fractions of DTX were varied at 20, 40 and 60% to investigate the impact of HEF composition on the engine performance.
The engine specification is listed in
Table 1 and its operation is explained below.
The test engine was effectively similar a two-stoke poppet valve reciprocating engine. The engine was equipped with two N2 inlet valves, one HEF inlet valve and one exhaust valve. The engine cycle started from the top dead-centre (TDC), where two N2 valves were open, allowing high-pressure N2 to flow and expand into the cylinder. The N2 valves were then closed during the expansion stroke until the bottom dead-centre (BDC). After the BDC, both exhaust and HEF inlet valves were open allowing simultaneous scavenging of HEF/N2 mixture. The exhaust and HEF inlet valves remained open during the return stroke and closed when the piston was near TDC. At the TDC, the N2 valve opened again and the cycle was repeated.
The transient in-cylinder pressure data, crank angle and engine speed were measured using a piezoelectric pressure transducer and a shaft encoder. Various K type thermocouples and thin-film pressure sensors were fitted at different locations, including N2 inlet, HEF inlet, exhaust pipe and heat exchanger, providing temperature and pressure values for the thermodynamic analysis. Engine torque measurements were obtained from both the drive shaft, using a torque flange transducer sensor, and the electric motor, through the variable frequency drive. The 15 kW electric motor of the engine dynamometer was coupled to the engine through a cardan shaft.
The embedded field-programmable gate array (FPGA) controller, with the necessary expansion modules, functioned as the engine control and data acquisition (DAQ) interface between the system hardware and the Graphical User Interface (GUI) developed using graphical programming language LabView (National Instruments Inc, Austin, TX, USA). A dedicated engine E-Stop system was electrically linked, among other system components, to the engine exhaust ventilation and oxygen monitoring system, ensuring safe operation of the test rig.
2.3. Experimental Data Analysis and Uncertainties Calculations
This section details the data analysis methodology, the calculation process of different engine parameters and the uncertainties associated with the measurements. Both the systematic errors from the measurement techniques and the random uncertainties from the cyclic variation are taken into consideration. The methodology detailed below mainly follows the NIST guidelines for uncertainties of measurements [
24].
Variation of a random quantity can be represented by:
where
is the Student’s
t-distribution critical value, which depends on the degree of freedom of the sample variance
and the confidence
;
is the sample standard deviation and
is a sample mean:
where
is a measured quantity and
is the total number of data points in consideration.
The N
2 mass flow rate is calculated as follows:
where
is N
2 mass flow rate (kg/s);
volumetric flow rate obtained from the thermal-mass flow meter Bronkhorst (Ln/min) based on the normal conditions (
and
) and
is N
2 density at normal conditions.
During engine tests, the N
2 flow rate varied in time, mainly because of pressure pulsations caused by the cryogenic LN
2 pump and amount of heat transferred to N
2 in the HEF heat exchanger (random errors). As a result, the uncertainty in the N
2 flow rate consists of three components: accuracy of the flow meter; nonlinearity of the flow meter measurements due to temperature and pressure sensitivity, and accuracy of N
2 density values which are taken from [
23].
where
is the absolute uncertainty in the mass flow rate;
is the absolute uncertainty in the nitrogen density and
is the absolute uncertainty in volumetric flow rates:
where
,
are absolute uncertainties in volumetric flow rates due to temperature and pressure variation and
is the absolute uncertainty in volumetric flow rates based on the manufacturer calibration data.
Brake Specific Nitrogen Consumption (
, kg/(kW·h)) indicates the amount of fuel used against the brake power generated during the N
2 expansion stroke, and was defined in the following way:
where
is the brake power (kW):
where
is the torque (N·m) and
is the engine speed (rpm).
Relative uncertainty in
depends on the uncertainty in the engine speed, the torque produced and the N
2 flow rate:
where
is the absolute uncertainty in engine brake power measurements and can be calculated as:
where
is the absolute uncertainty in engine torque measurements from the calibration certificate and
is the absolute uncertainty in engine speed measurements according to the shaft encoder specification.
The indicated power (
) is considered as a rate of work transfer from the N
2 within the cylinder to the piston and differs from the brake power by the power absorbed in overcoming engine friction and driving engine accessories. It can be calculated as:
where
is the indicated work per cycle, J.
The indicated work per cycle
is obtained by the numerical integration of the measured instantaneous cylinder pressure (
, Pa) and change in volume (
,
):
Uncertainty in will take into account the following sources of uncertainty:
uncertainty in the indicative system (in-cylinder pressure measuring system);
uncertainty in the TDC location measurements;
uncertainty in angle encoder due to eccentric mounting, crankshaft deflection and vibration (misalignment of the angle encoder), and calculated by:
Engine brake thermal efficiency (
) and indicated thermal efficiency
are calculated by:
where
is the specific enthalpy of nitrogen which corresponds to the HEF heat-exchanger inlet temperature and nitrogen inlet manifold pressure (J/kg);
is the specific enthalpy of saturated nitrogen at the LN
2 storage vessel pressure of 3 bar (J/kg) and
is the power consumption of the cryogenic pump:
where
is the engine inlet pressure and
is the LN
2 storage vessel pressure.
This calculation assumes 100% efficiency of the cryogenic pump. The calculated pumping power values represent about 1% of the power generated by the engine, so the uncertainty due to the pump inefficiency or pressure fluctuations has negligible impact on the overall engine efficiency. Therefore, the relative uncertainty in thermal efficiency
was calculated using following equation:
where
is the absolute uncertainty in specific enthalpy of nitrogen which was identified from the book of reference data [
23].
The total uncertainties of determination of engine performance characteristics are presented in
Table 2.
Considering that the main purpose of the current study was to compare the engine performance at different operation conditions, the error bar shown in the plots in
Section 3 only includes the standard deviation of the corresponding data set.
2.4. Methodology of HEF Composition Measurements
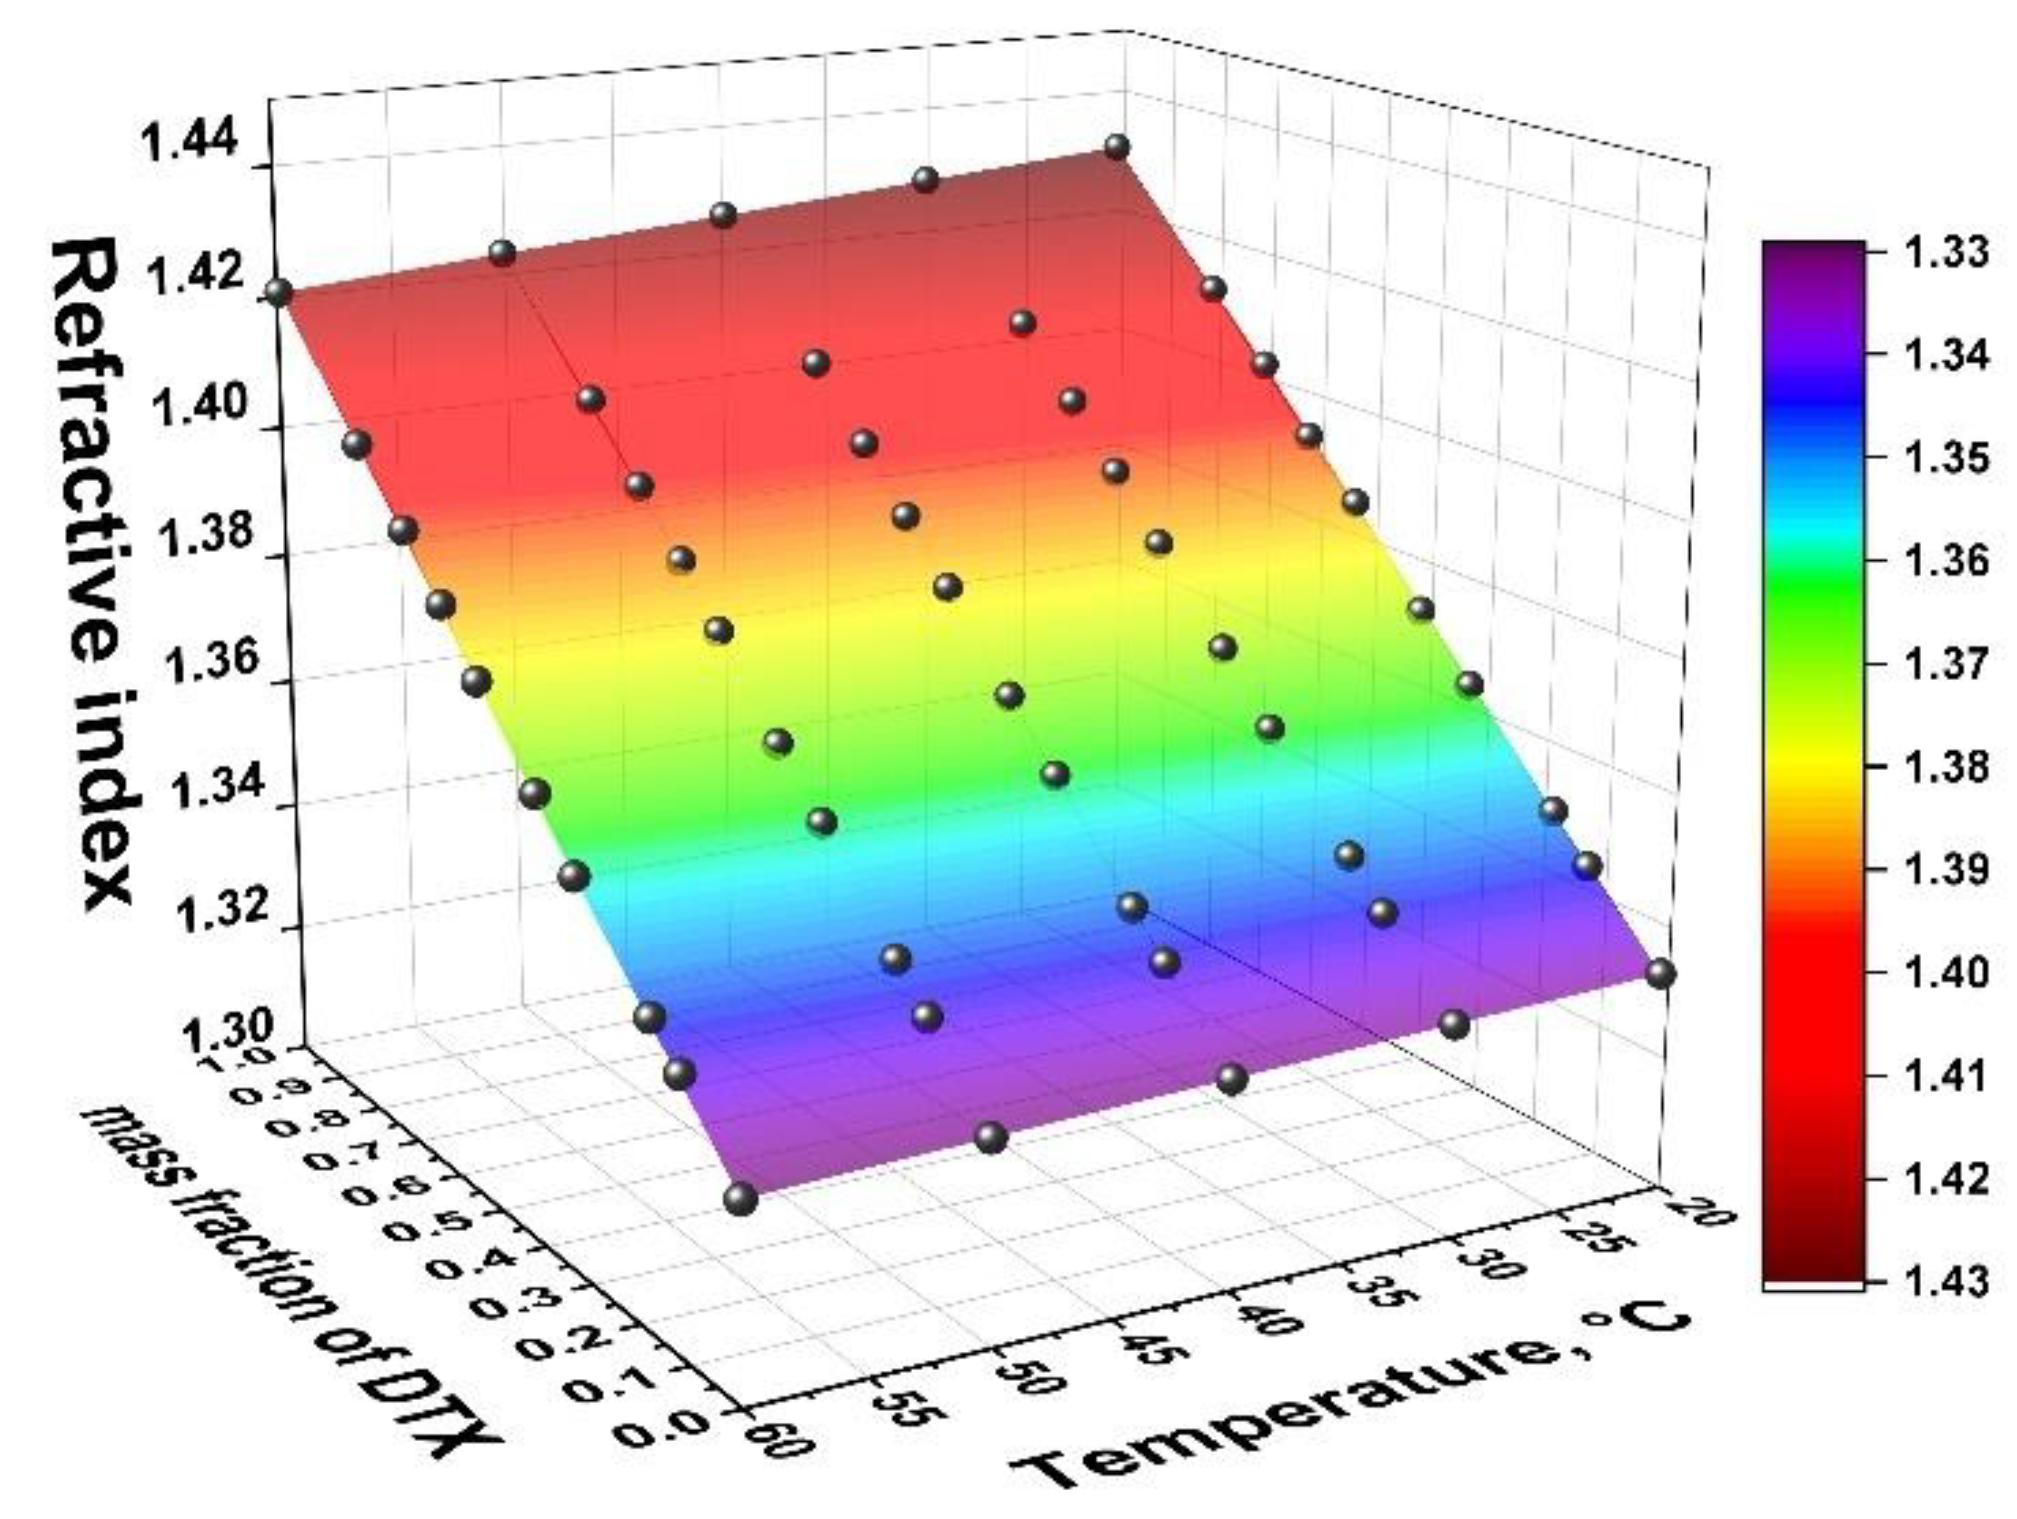
As already mentioned, the HEF is a mixture of DTX and deionised water. Identification of DTX volume fraction in water during the engine tests was enabled through a comparison of refractive indices of HEF samples from the 440 L HEF tank (see
Figure 3) with reference data which were obtained using measurements of refractive index in a full range of mixture compositions within the temperature range from 20 to 60 °C (293.6–333.2 K). The selected temperature range is representative of the capability of the HEF supply subsystem of the engine test facility.
As with many other commercial HTFs, DTX is an ethylene glycol-based fluid which is improved by additives that reduce toxicity. DTX contains the DeToxTM formula which is composed of Potassium 2-Ethylhexanoate (≈4% by mass), Potassium Neodecanoate (≈2%) and Sodium Nitrate (≈1%). In order to simplify the analysis of concentration dependences of HEF, the current study was based on the assumption that DTX is a single component substance. Pure water deionised reagent (grade 3) was supplied by Acros Organics BVBA. Samples of DTX and deionised water were used as supplied by manufacturers without further purification.
The mixture samples were prepared by weighing each component using an electronic balance (Model ARJ, Kern Inc., San Francisco, CA, USA) with 1 mg resolution. Before sample preparation, the pure ingredients were placed in laboratory bottles with narrow necks to prevent evaporation and/or pollution of basic solvents. The mixtures of prescribed mass fraction were prepared directly on a weighing balance by adding ingredients drop by drop with a leak-tight syringe. All the bottles were filled at first with the right amount of the less volatile components. The error in mass fraction was estimated to be around 0.00021.
The refractive index was measured by means of an Abbe refractometer (model Abbe-2WAJ, PCE Instruments) with a resolution of 5 × 10
−4 units of index of refraction
. Both the upper and lower prism boxes of the refractometer incorporated water jackets. This enables the sample to be temperature controlled from a water circulator produced by a thermostatically controlled circulating bath (TECHNE model TE10A,). The bath temperature was monitored to ±0.1 K with a calibrated thermometer. The temperature of the measurement prism of the Abbe-2WAJ refractometer was monitored using a build-in temperature sensor with uncertainty of ±0.1 K. The refractometer was calibrated using a glass test piece of a known refractive index supplied with the instrument. The uncertainty in the refractive index measurements was estimated to be less than ±0.0007. Refractive indices of all investigated pseudo-binary mixtures are shown in
Figure 4.
The validation of the experimental procedure was done by means of a comparison of experimental refractive indices for pure deionised water with reference data from the literature. As seen in
Table 3, the agreement was favourable. Differences between experimental and literature values did not exceed the uncertainty in the refractive index measurements.
The following fitting function was constructed considering
as a function of mass fraction DTX and temperature:
where
is the temperature, K and
is the mass fraction of DTX, kg/kg.
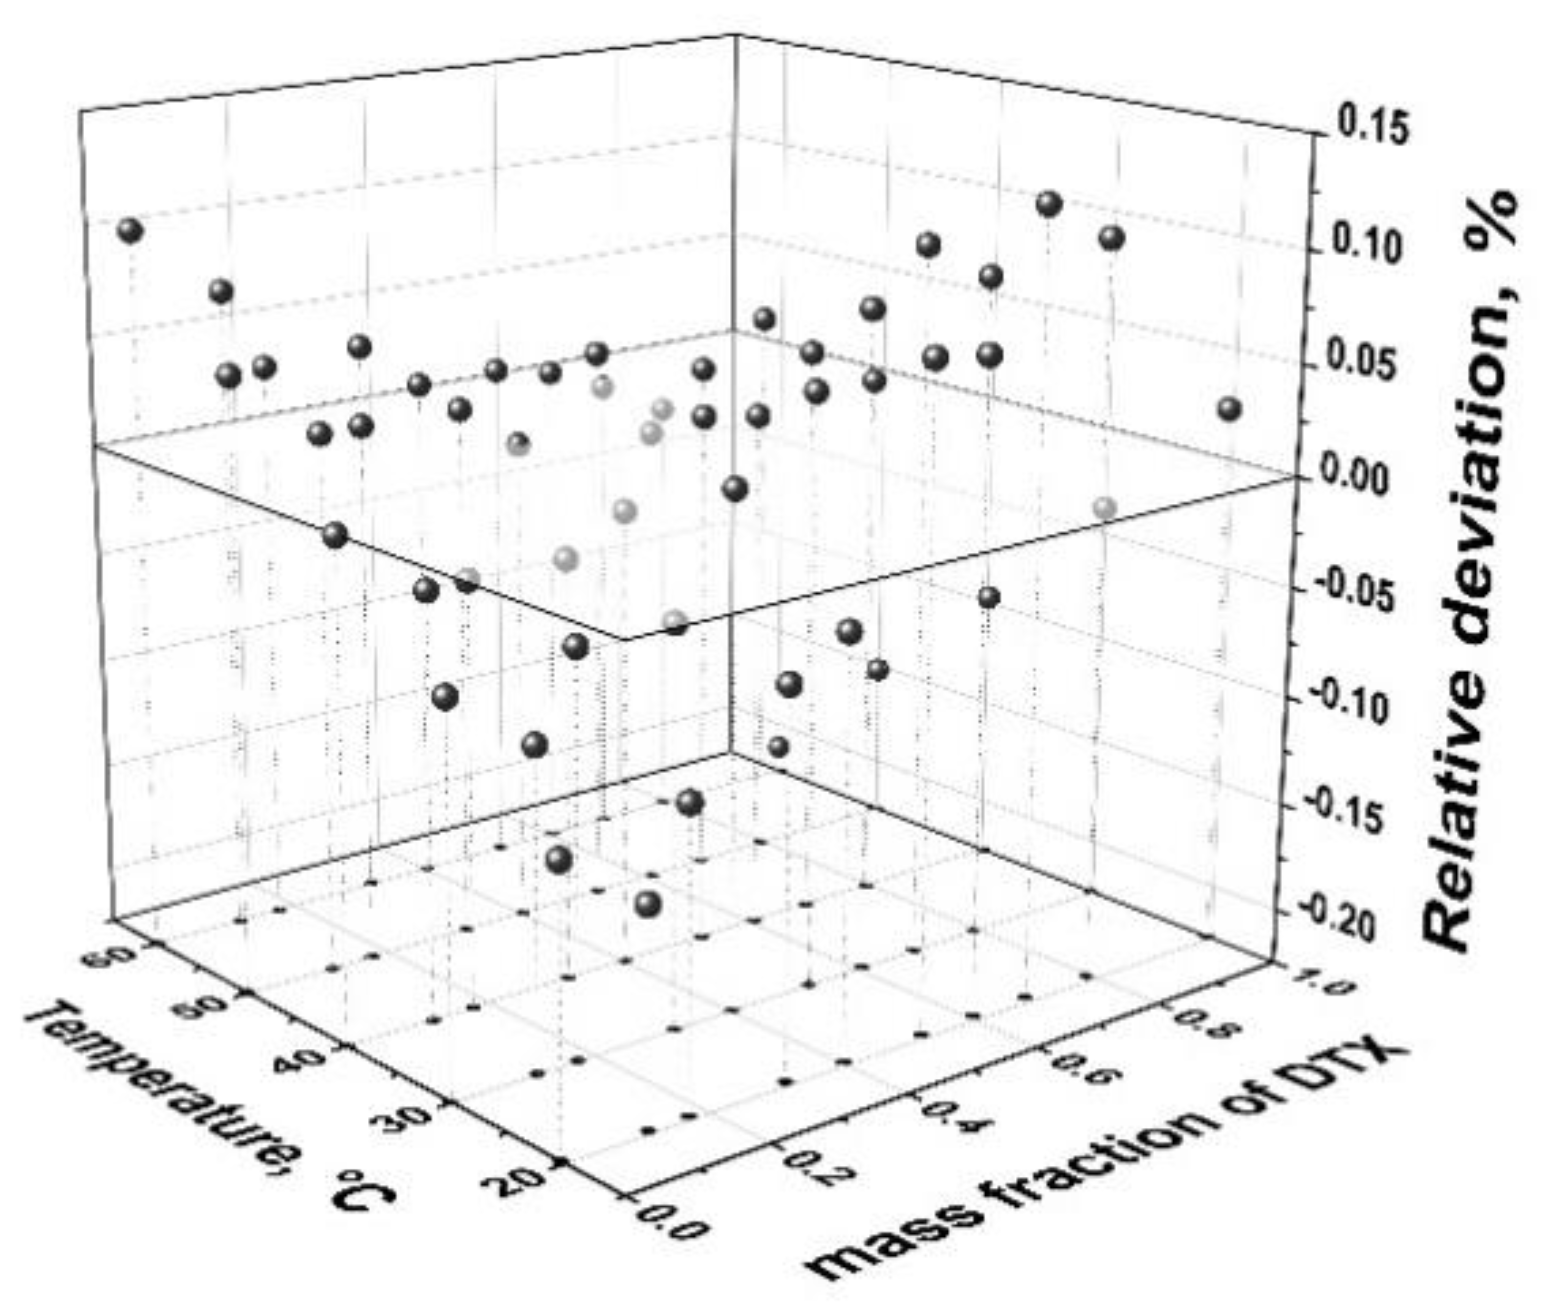
Relative deviations of experimental values of
from Equation (22) are shown in
Figure 5. The following quantities were calculated in order to estimate the ability of Equation (22) to predict values of
for binary mixture of DTX in water.
where
is the absolute average deviation,
is the maximum deviation,
is the number of experimental points,
exp are experimental values of refractive index (see
Table 2) and
calc are calculated values of refractive index (see Equation (22)).
and values based on experimental data and Equation (22) did not exceed 0.051% and 0.21%, respectively.
The mass fraction of DTX can be derived from the Equation (22) in the following way:
Based on density of mixtures of DTX and water, mass fraction can be converted to volume fractions. This study used density data for mixtures of DTX in water, which were provided by Hydratech Inc. The following fitting function was constructed considering
as a function of temperature and volume fraction of DTX:
The volume fractions can then be calculated as:
where
is the volume fraction of DTX, L/L.
and values based on experimental data and Equation (27) did not exceed 0.12% and 0.35%, correspondingly.
3. Results and Discussion
The effect of variation in HEF composition on the engine performance can be investigated by changing the DTX concentration while keeping its temperature unchanged. The engine operation and HEF flow conditions covered during the experiments are summarized in
Table 4. During the experiments, the N
2 inlet pressure fluctuated by up to ±2% from the set value due to pressure pulsations induced by a single piston cryogenic pump.
The thermophysical properties of HEF at different DTX concentrations and temperatures are summarized in
Table 5. The mixture property (
) was calculated assuming ideal simple fluids:
where
is the mole fraction and
is the property of pure mixture components.
The properties of water were taken from the NIST database [
23]. The surface tension values were calculated following the recommendations in literature [
26]. Comparison of antifreeze supplier data (Hydratech Inc., Harvey, LA, USA) on thermophysical properties of mixtures consisting of 40% DTX (by volume) and 60% water (by volume) at the temperature of 30 °C suggested an approximately 6% difference in values.
The thermophysical properties of HEF in
Table 5 can be split into two groups based on their potential impact on engine performance: hydrodynamic properties including density and dynamic viscosity; and the thermal properties including heat capacity, thermal conductivity, thermal diffusivity, and surface tension. The surface tension was included in the thermal properties here because it affects the HEF atomisation process during the expansion stroke and hence the effective heat transfer area. Variation in DTX volume fractions had a less noticeable effect on the mixture density and surface tension compared to its effect on other thermophysical properties (see
Table 5). Therefore, with regards to the thermal effects, it can be concluded that the reduced heat capacity, heat conductivity and thermal diffusivity, when the DTX volume fraction was increased, were the most significant factors leading to reduction in heat transfer from HEF to gaseous nitrogen. Meanwhile, the significant increase in the dynamic viscosity, as the DTX volume fraction increased, was likely to cause larger amounts of HEF trapped inside the cylinder, since the outflow of HEF during the overlap of exhaust and HEF intake valves was more difficult due to increased viscous forces. These hydro and thermal effects can be used for qualitative analysis of variations in the engine performance.
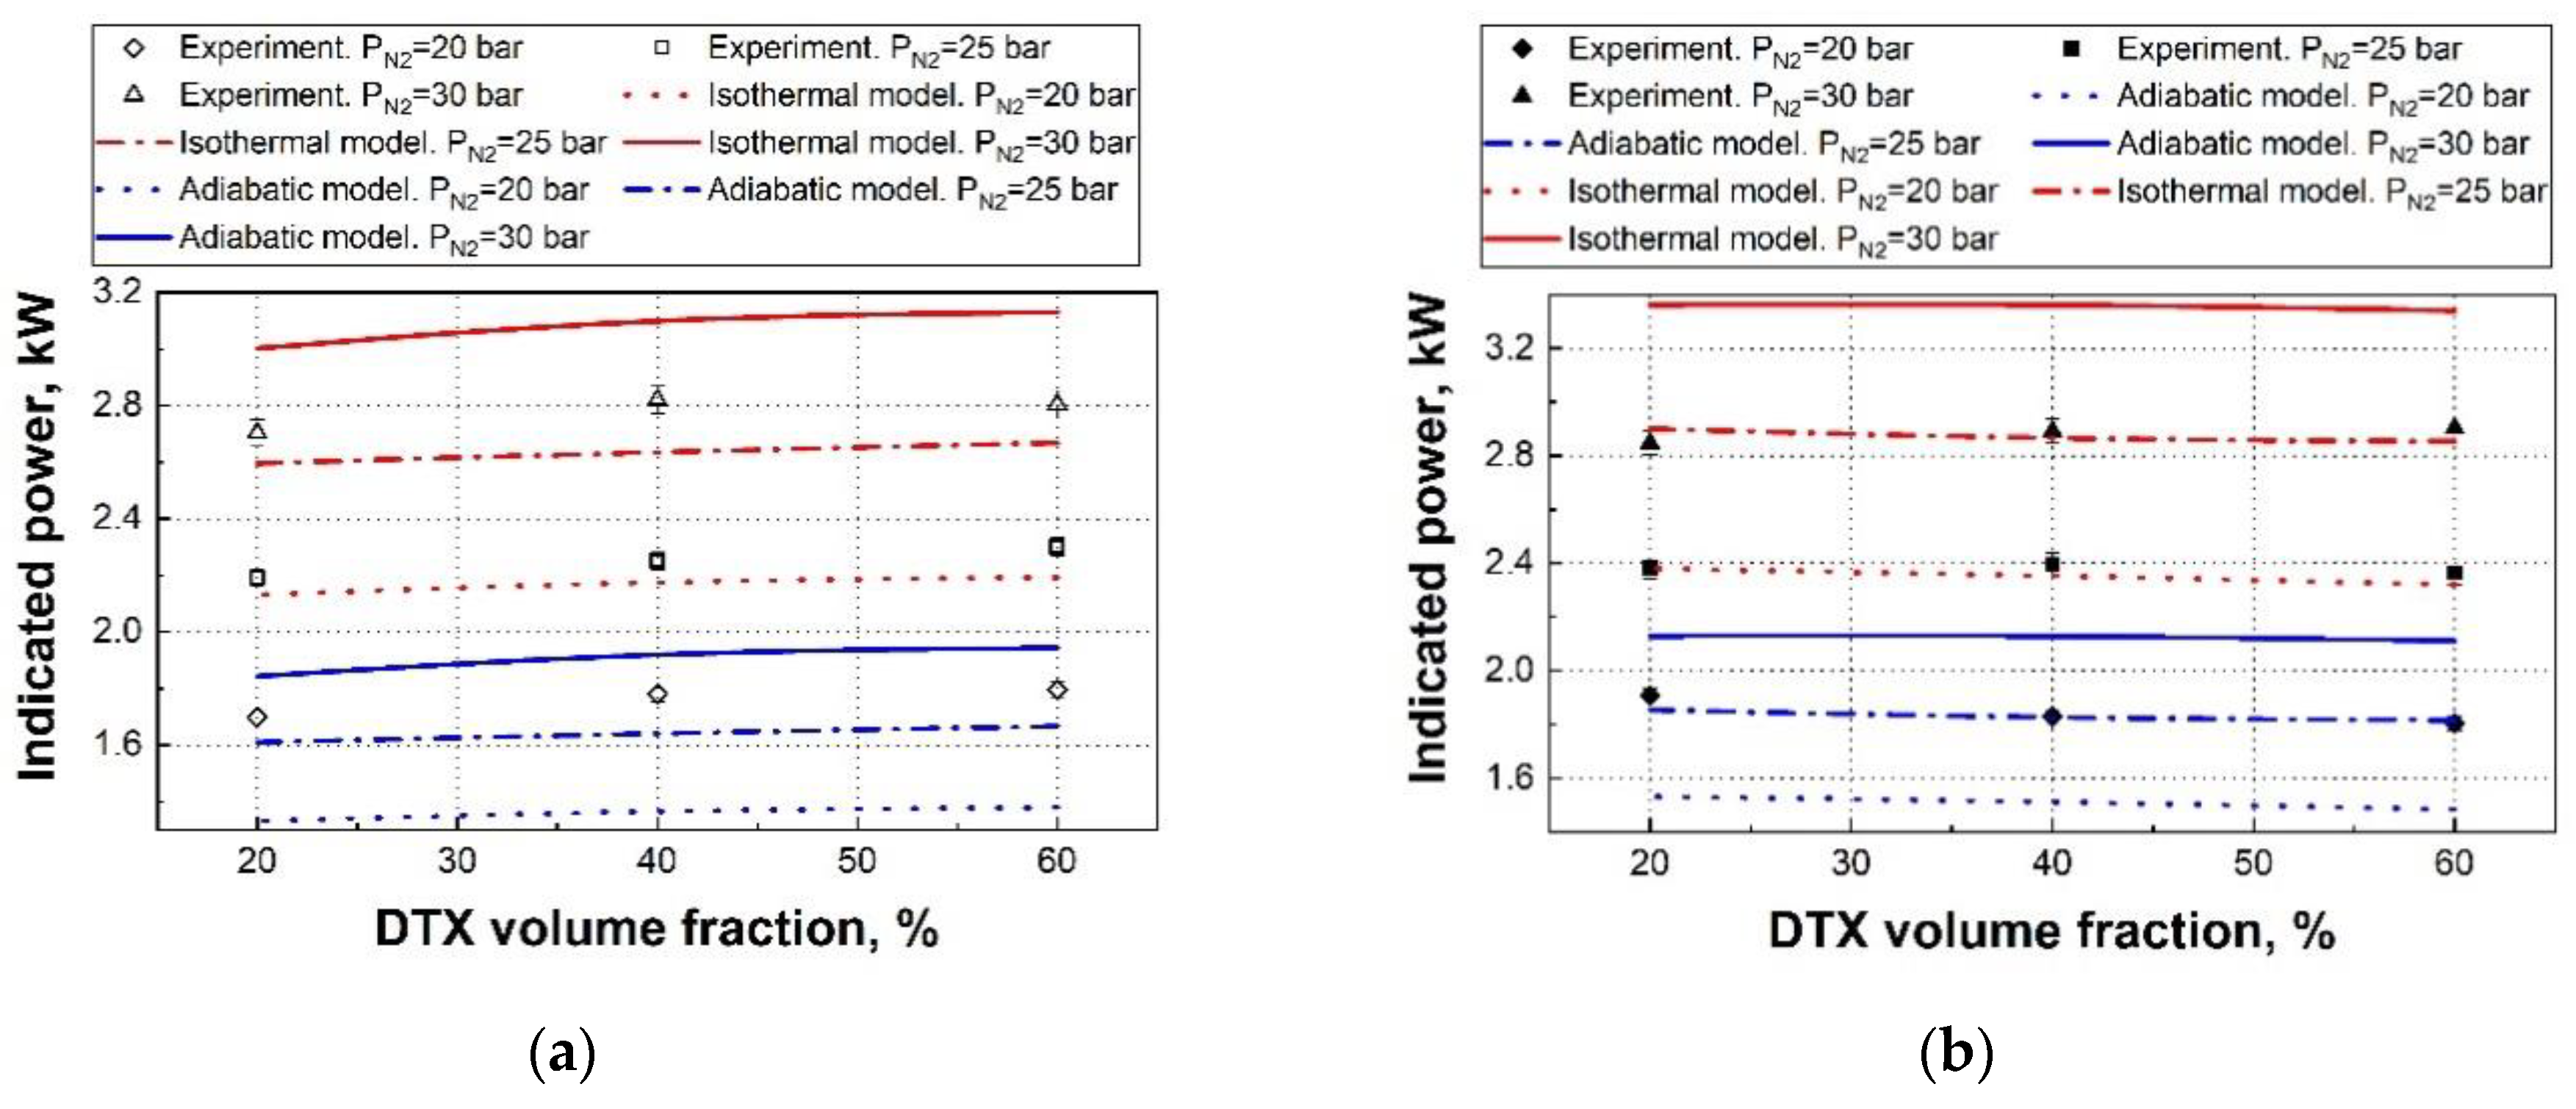
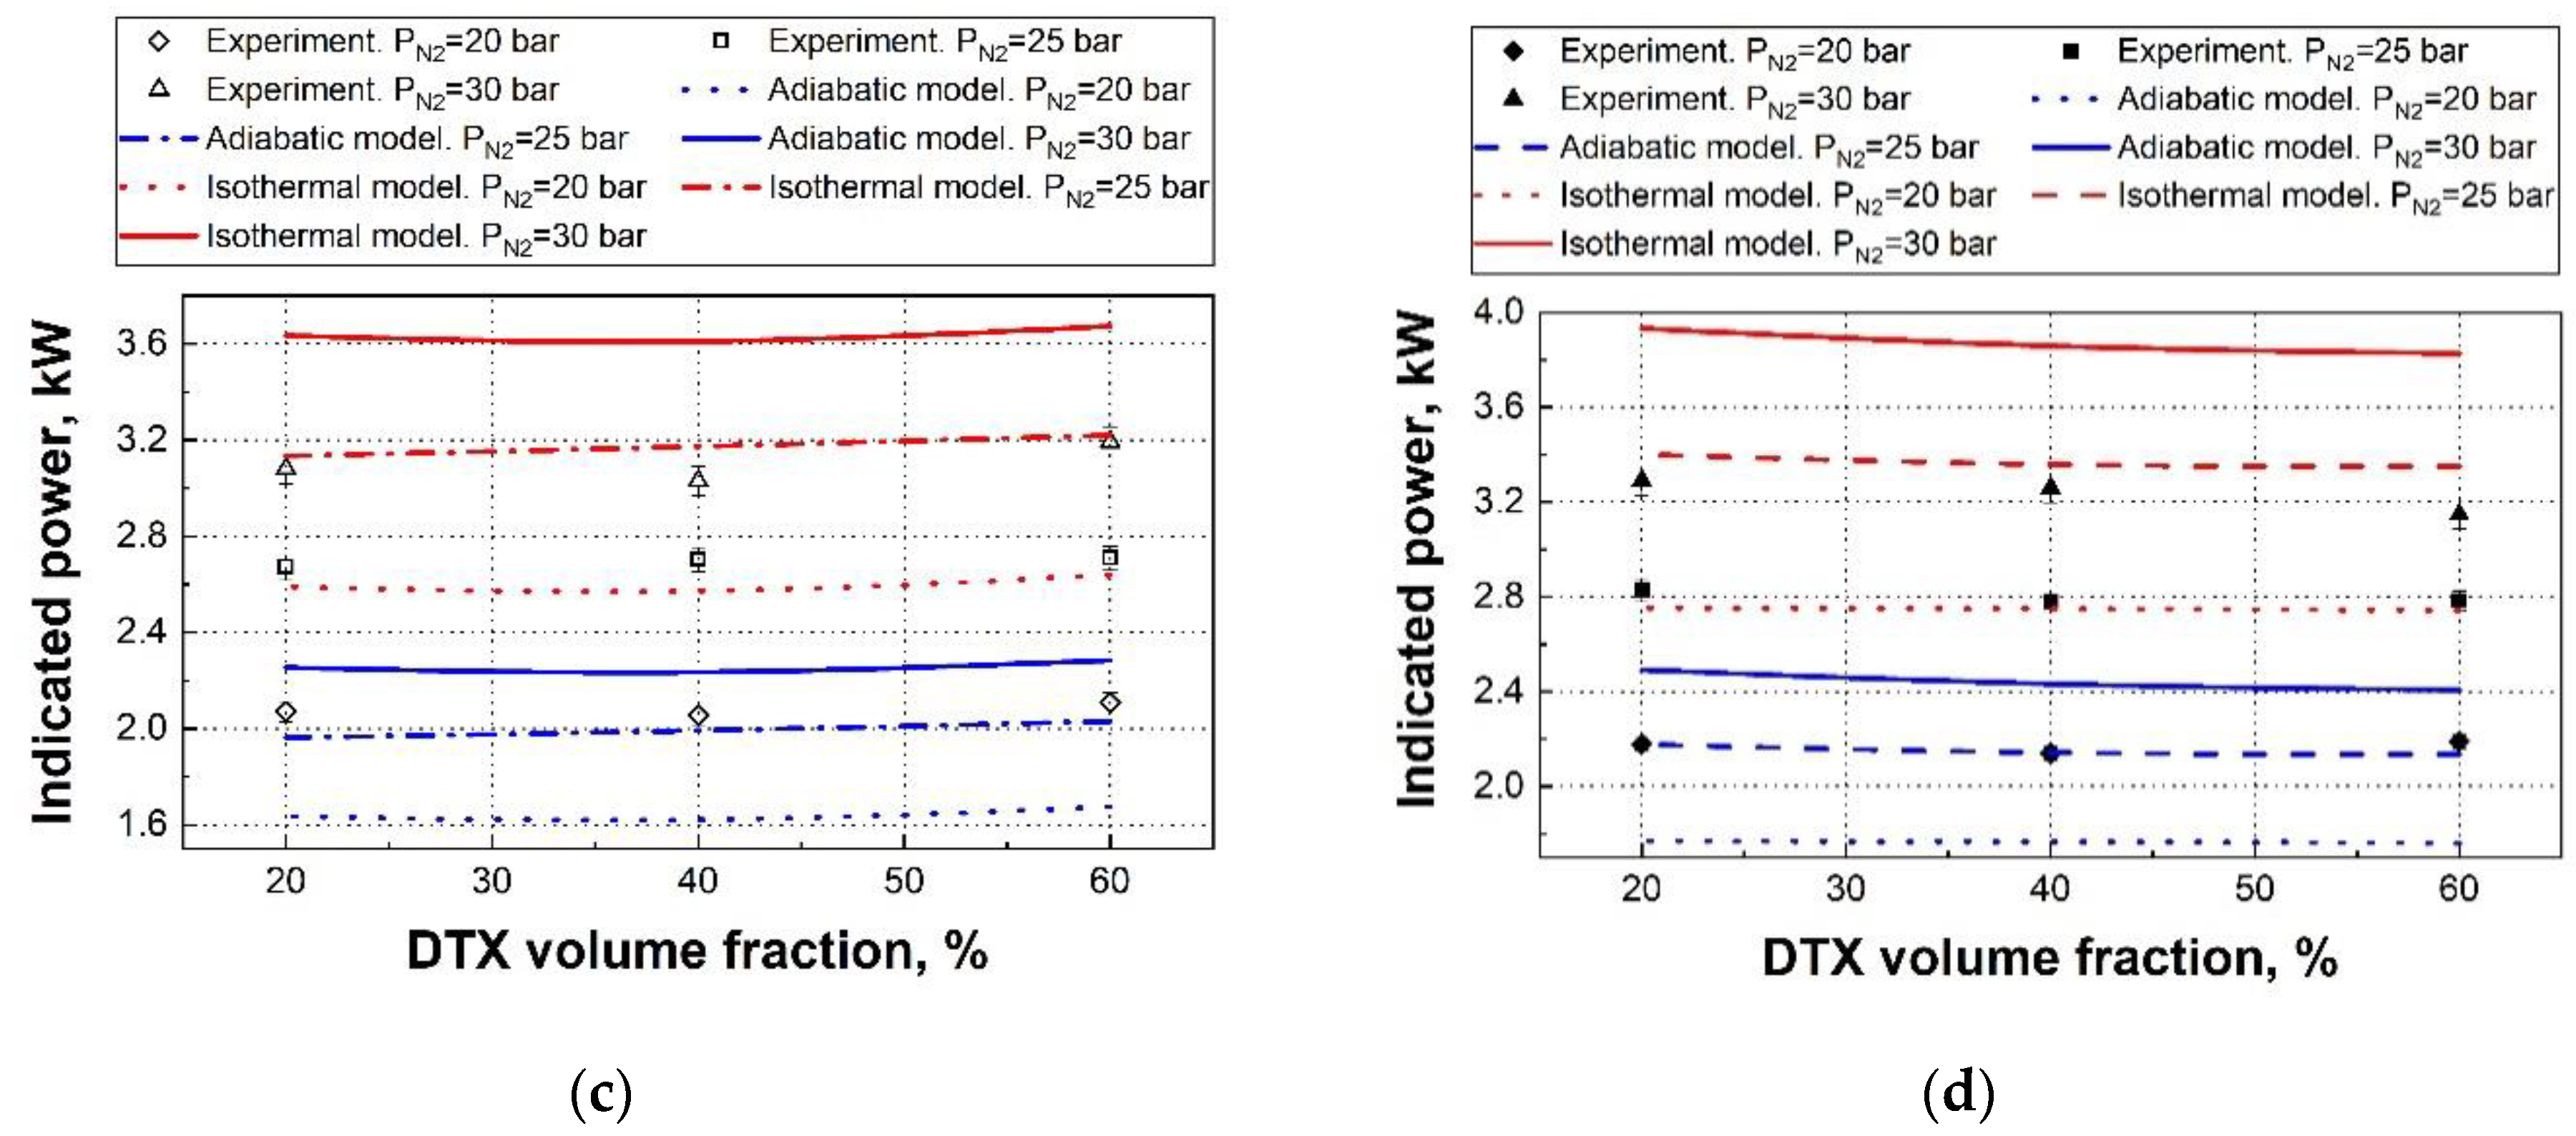
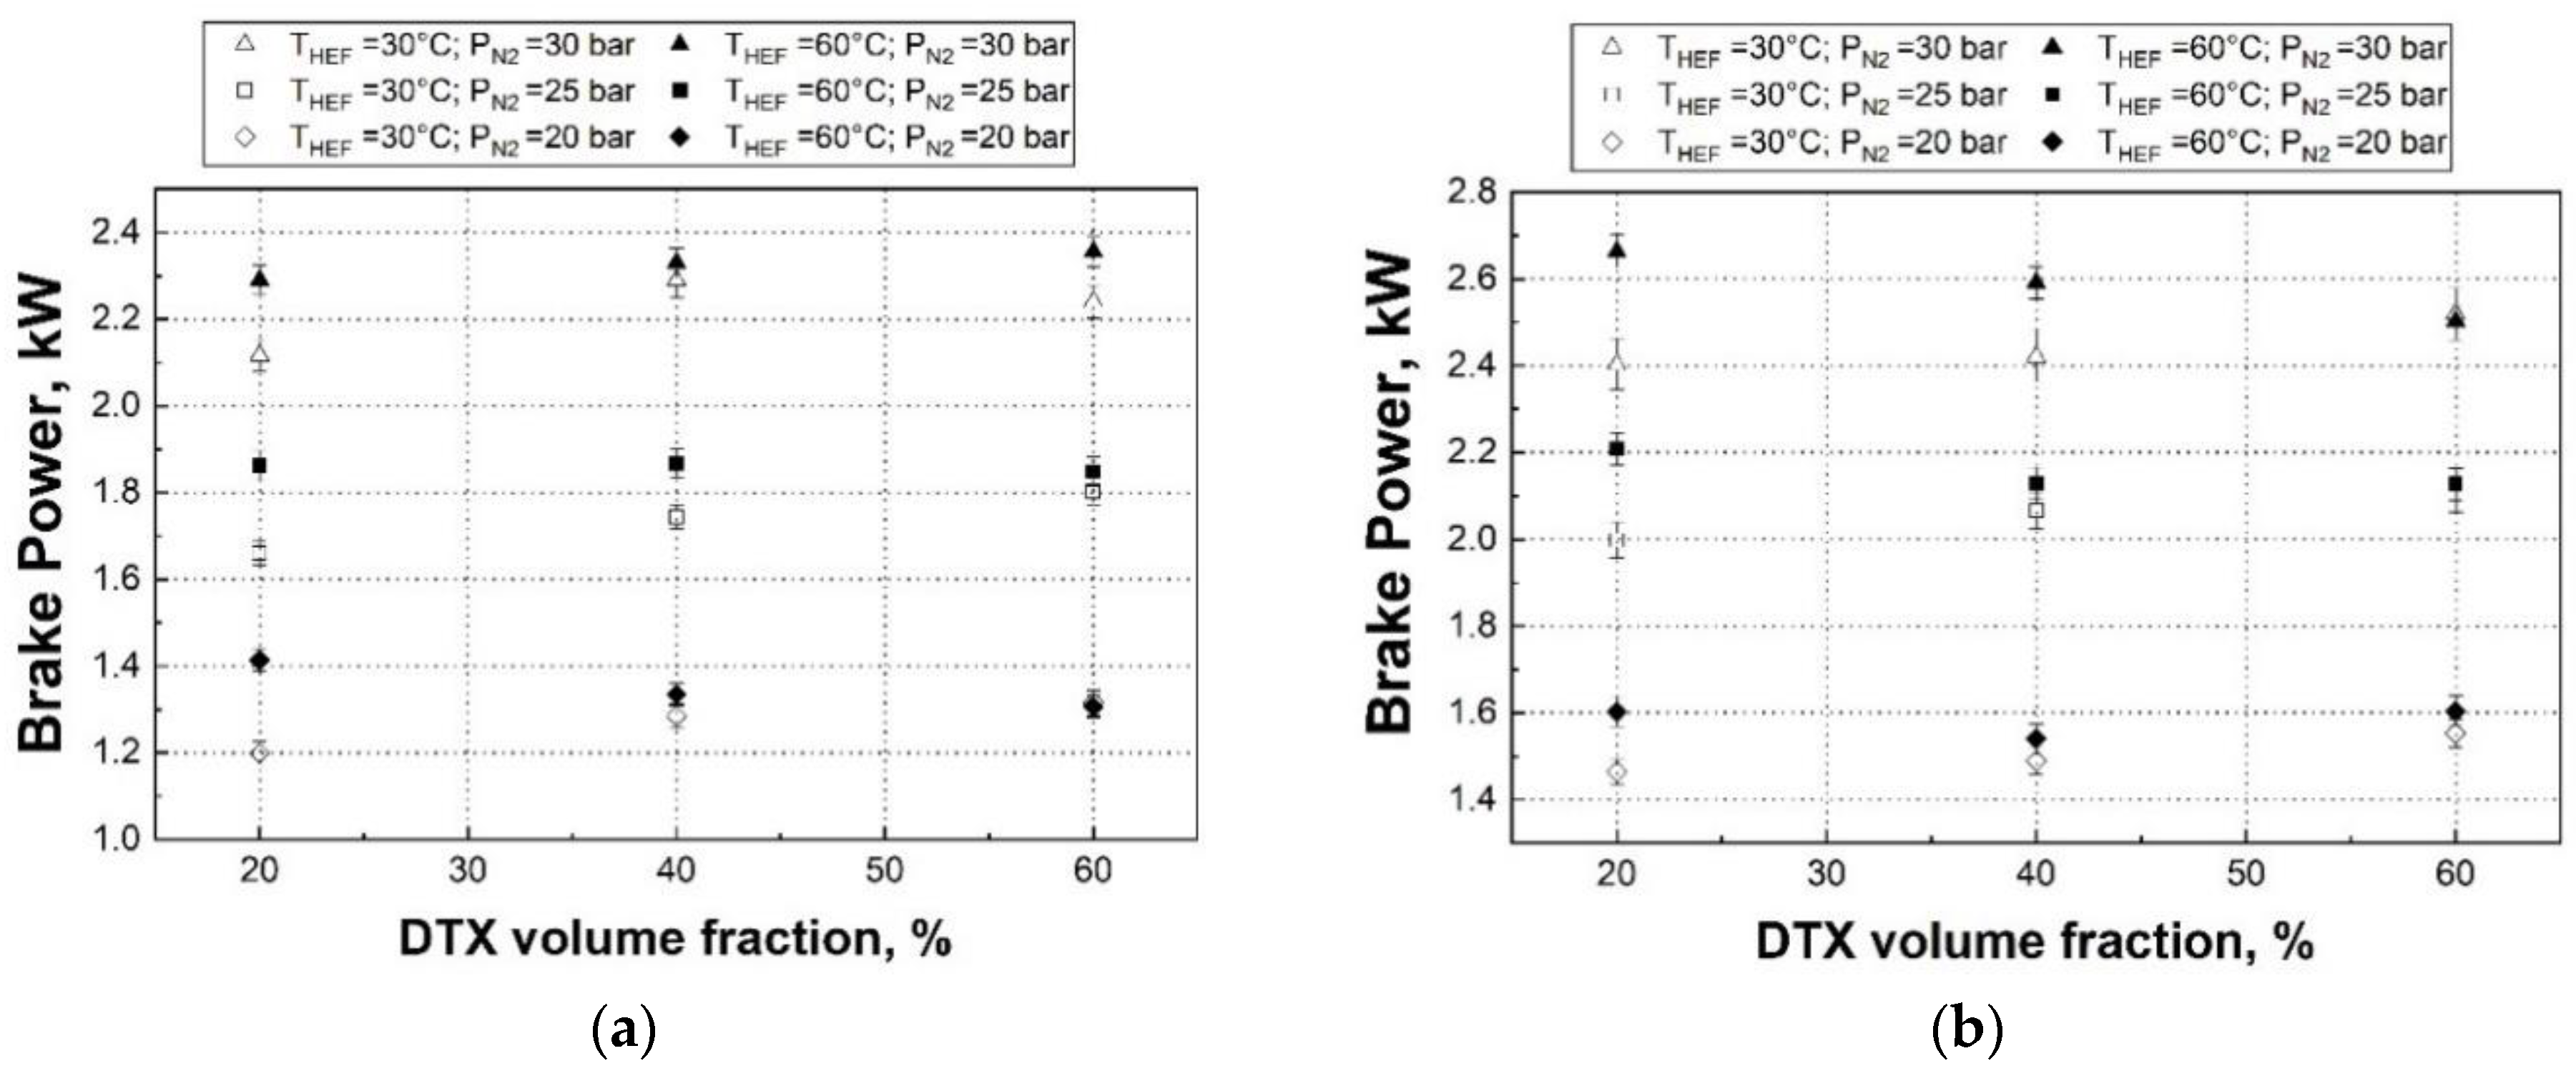
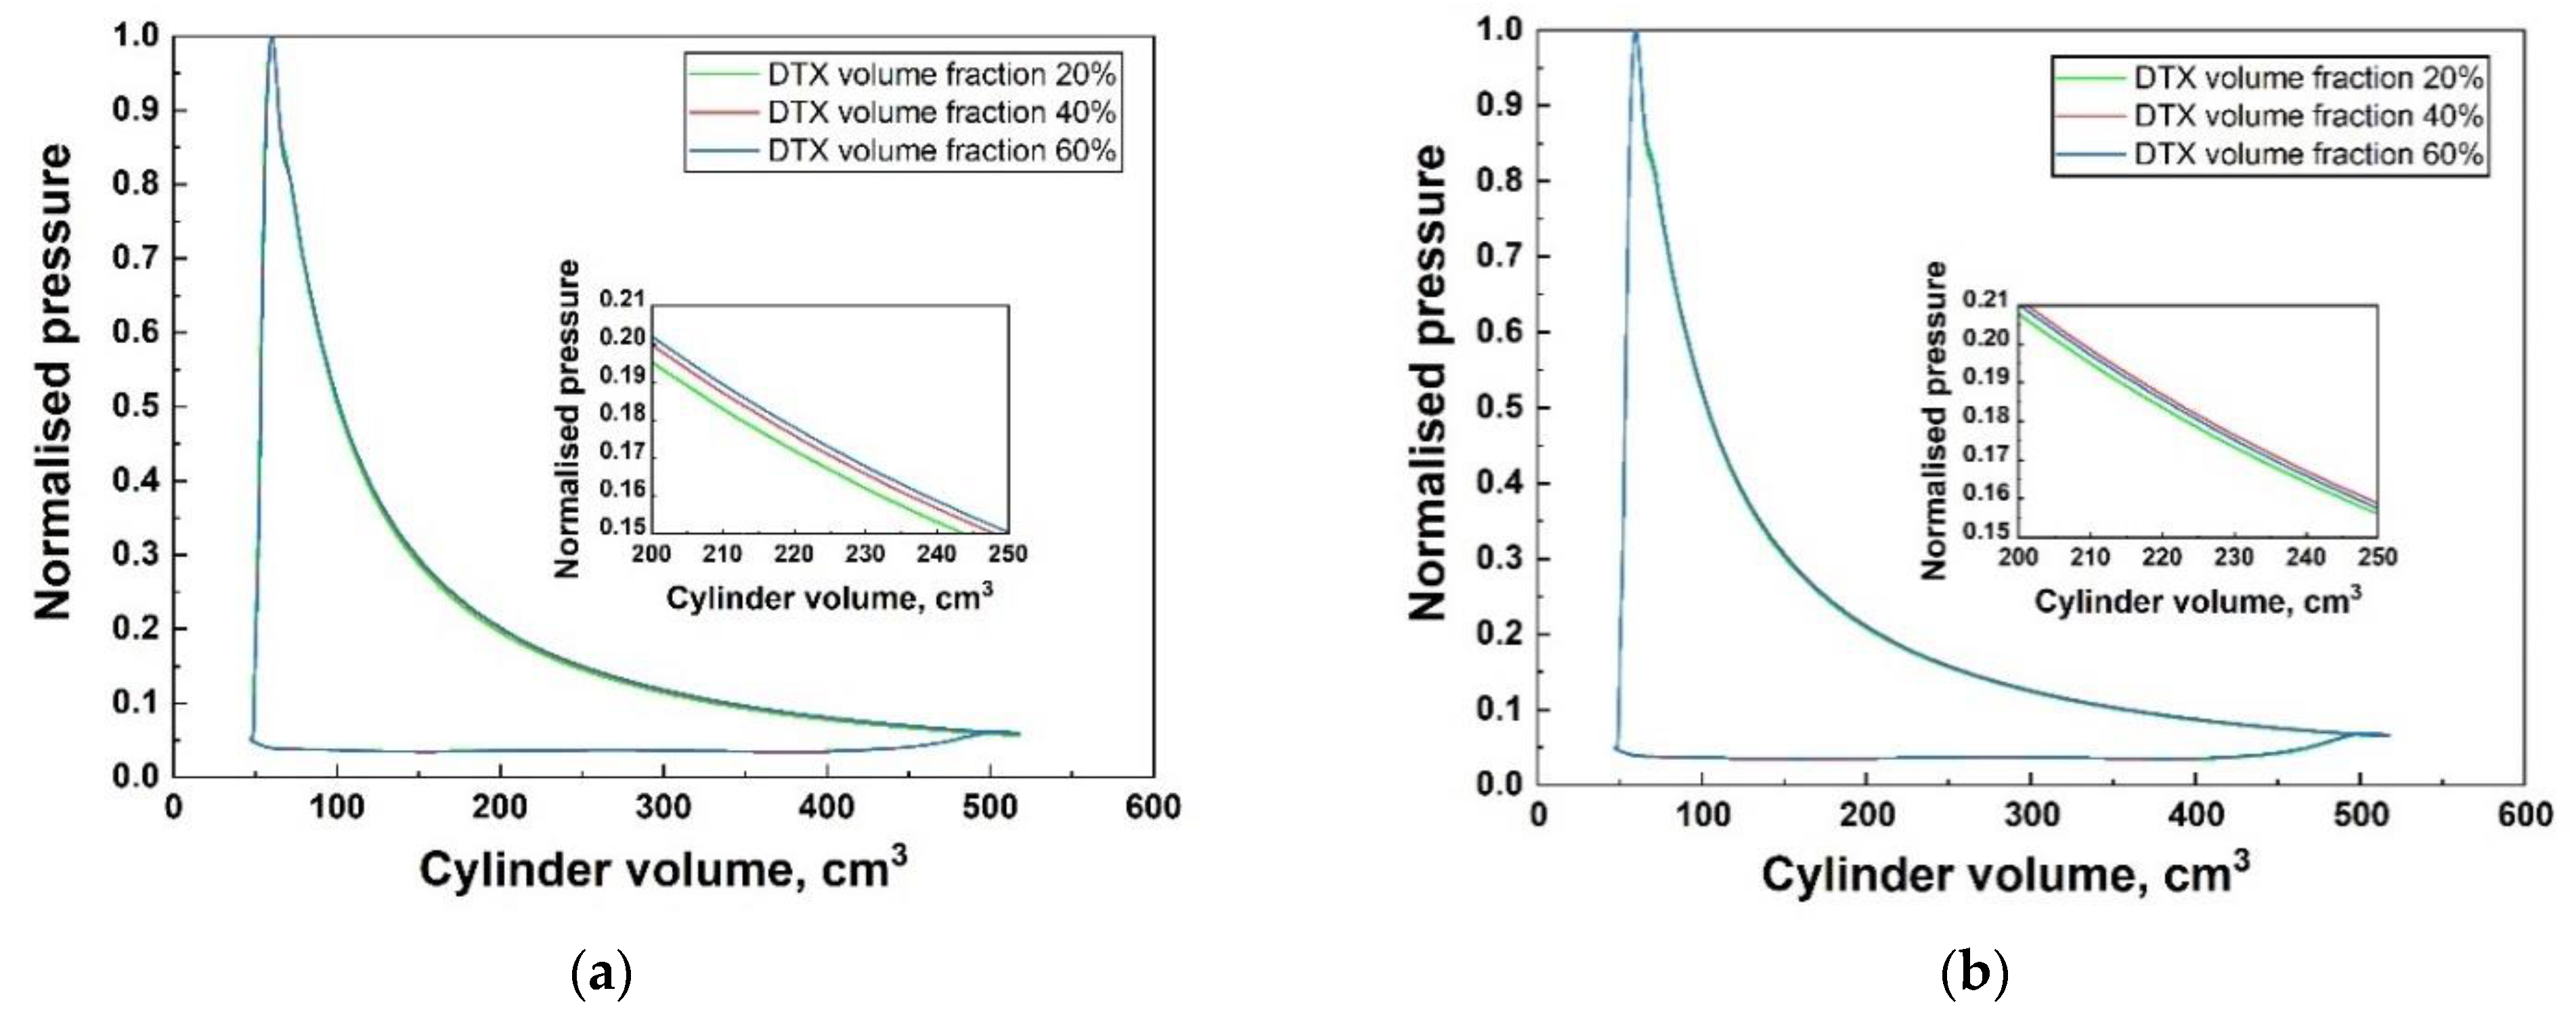
Figure 6 and
Figure 7 show the indicated power and brake power at different operating conditions, respectively. At the HEF temperature of 30 °C, the indicated and brake power showed an increasing trend as DTX fraction increased. At the HEF temperature of 60 °C, these trends were not as consistent compared with similar trends when HEF temperature was 30 °C. However, a consistent power reduction was observed when the DTX volume fraction increased from 20 to 40% at an engine speed of 700 rpm. These observed trends were generally consistent with the normalized pressure-volume diagram using the corresponding cycle maximum pressure (see
Figure 8). For example,
Figure 8a shows that an increase in DTX volume fractions resulted in higher normalised pressure values which had a positive impact on the generated power. In
Figure 8b, there is no clear separation between pressure curves at DTX volume fractions of 40 and 60%, while the DTX volume fraction of 20% appears very close to the other pressure curves. This phenomenon could be used to explain inconsistencies in engine power values when DTX volume fraction was varied at the constant HEF temperature of 60 °C. The direct comparison of the inset diagrams in
Figure 8a,b, shows that within the same cylinder volume window (200–250 cm
3), the normalised pressure values at HEF temperature of 60 °C the (
Figure 8b) were larger compared to HEF temperature of 30 °C (
Figure 8a). This observation can be used to justify the higher indicated and brake power generated when warmer HEF was introduced into the engine, as revealed in
Figure 6 and
Figure 7. Results of the simplified thermodynamic analysis showed that the experimental values of the indicated work were within the borders specified by adiabatic and isothermal cases. Therefore, there is the potential for further improvement of the engine work output by further enhancing in-cylinder heat transfer. Since the power output during the expansion stroke could be affected by both the N
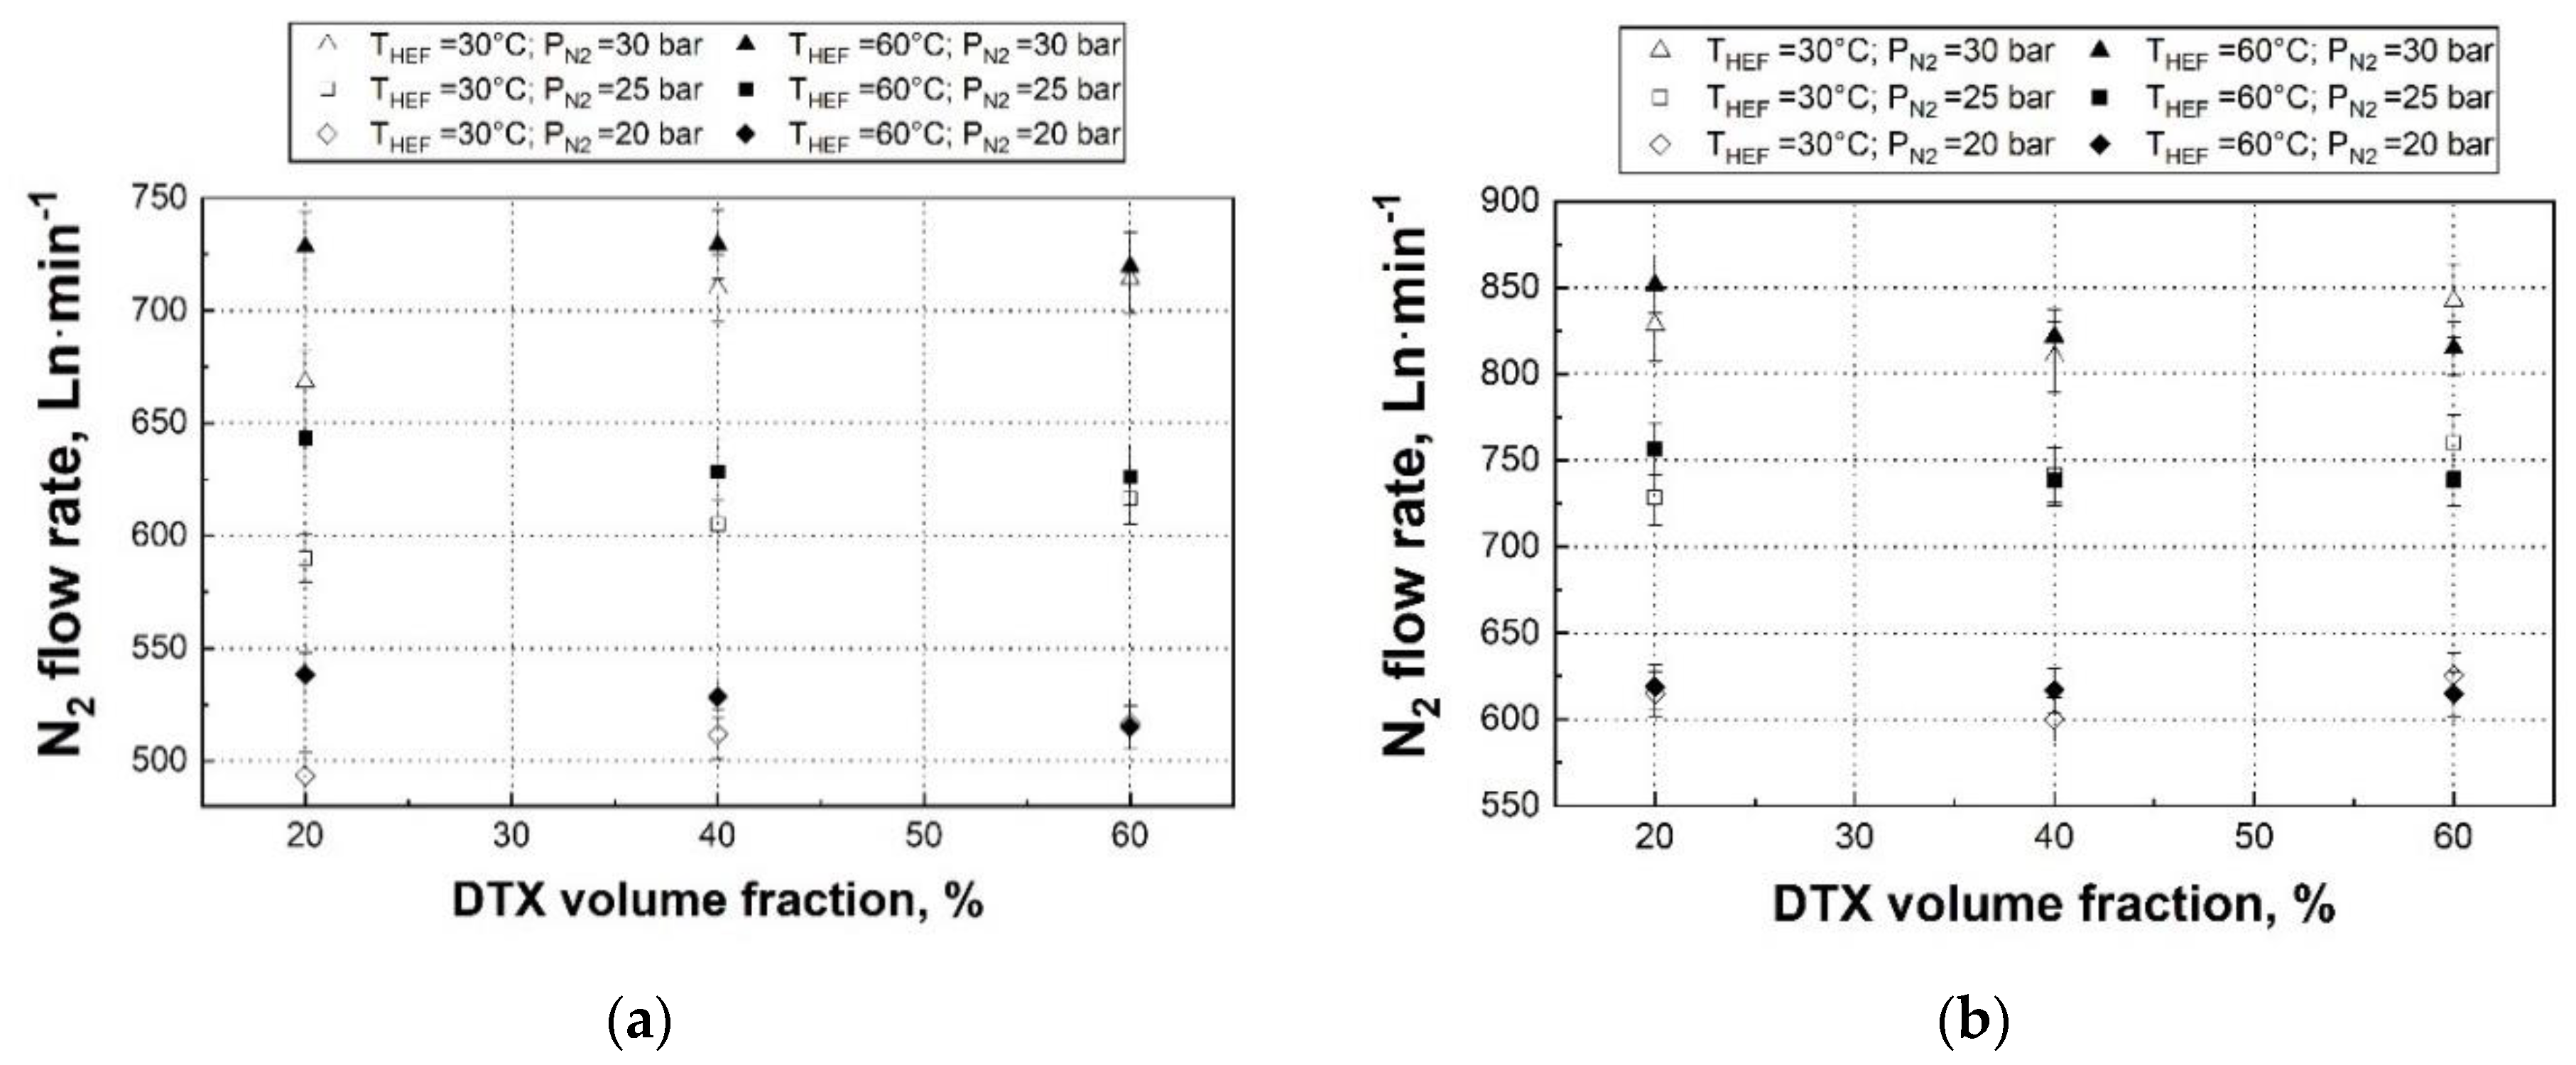
2 flow rate and the in-cylinder heat transfer from the side of HEF, it is useful to compare the nitrogen flow rates at different engine operating conditions, as shown in
Figure 9.
Figure 9 shows that the N
2 consumption rates were generally increased when the DTX volume fraction increased at the HEF temperature of 30 °C. At higher DTX volume fractions and 30 °C HEF temperature, the reduced amount of heat absorbed by gaseous nitrogen inside the cylinder (thermal-effect) increased the intake nitrogen flow rate, while the increased HEF viscosity (hydro-effect) increased the amount of HEF trapped inside the cylinder and, consequently, reduced nitrogen flow rate. The observed increasing trend in N
2 flow rates suggested that the thermal effect caused by variations in DTX concentrations dominated over the hydro effect at the HEF temperature of 30 °C. At the HEF temperature of 60 °C, the small reduction in N
2 flow rates was generally observed in transitions from 20 to 40% in DTX volume fractions. Such a reducing trend was relatively consistent in the corresponding brake power and indicated power values. This observation suggests that, at the HEF temperature of 60 °C, viscous effects were likely to be dominant over thermal effects. However, further investigations of the in-cylinder flow mixing and heat transfer are needed to isolate and quantify the contribution of different effects and fully understand the in-cylinder process. Considering that the observed trends in the indicated and brake powers follow closely the above behaviour of the nitrogen flow rate, changes of in-cylinder heat transfer during the expansion stroke, due to the variations in thermal properties of HEF, were probably secondary.
Figure 6 and
Figure 7 also show that values of both indicated power and brake power increased noticeably when the HEF temperature was raised in all experimental cases, which is consistent with previously published observations [
8]. Such observations took place mostly because of the enhanced in-cylinder heat transfer caused by the increased temperature difference between gaseous nitrogen and HEF.
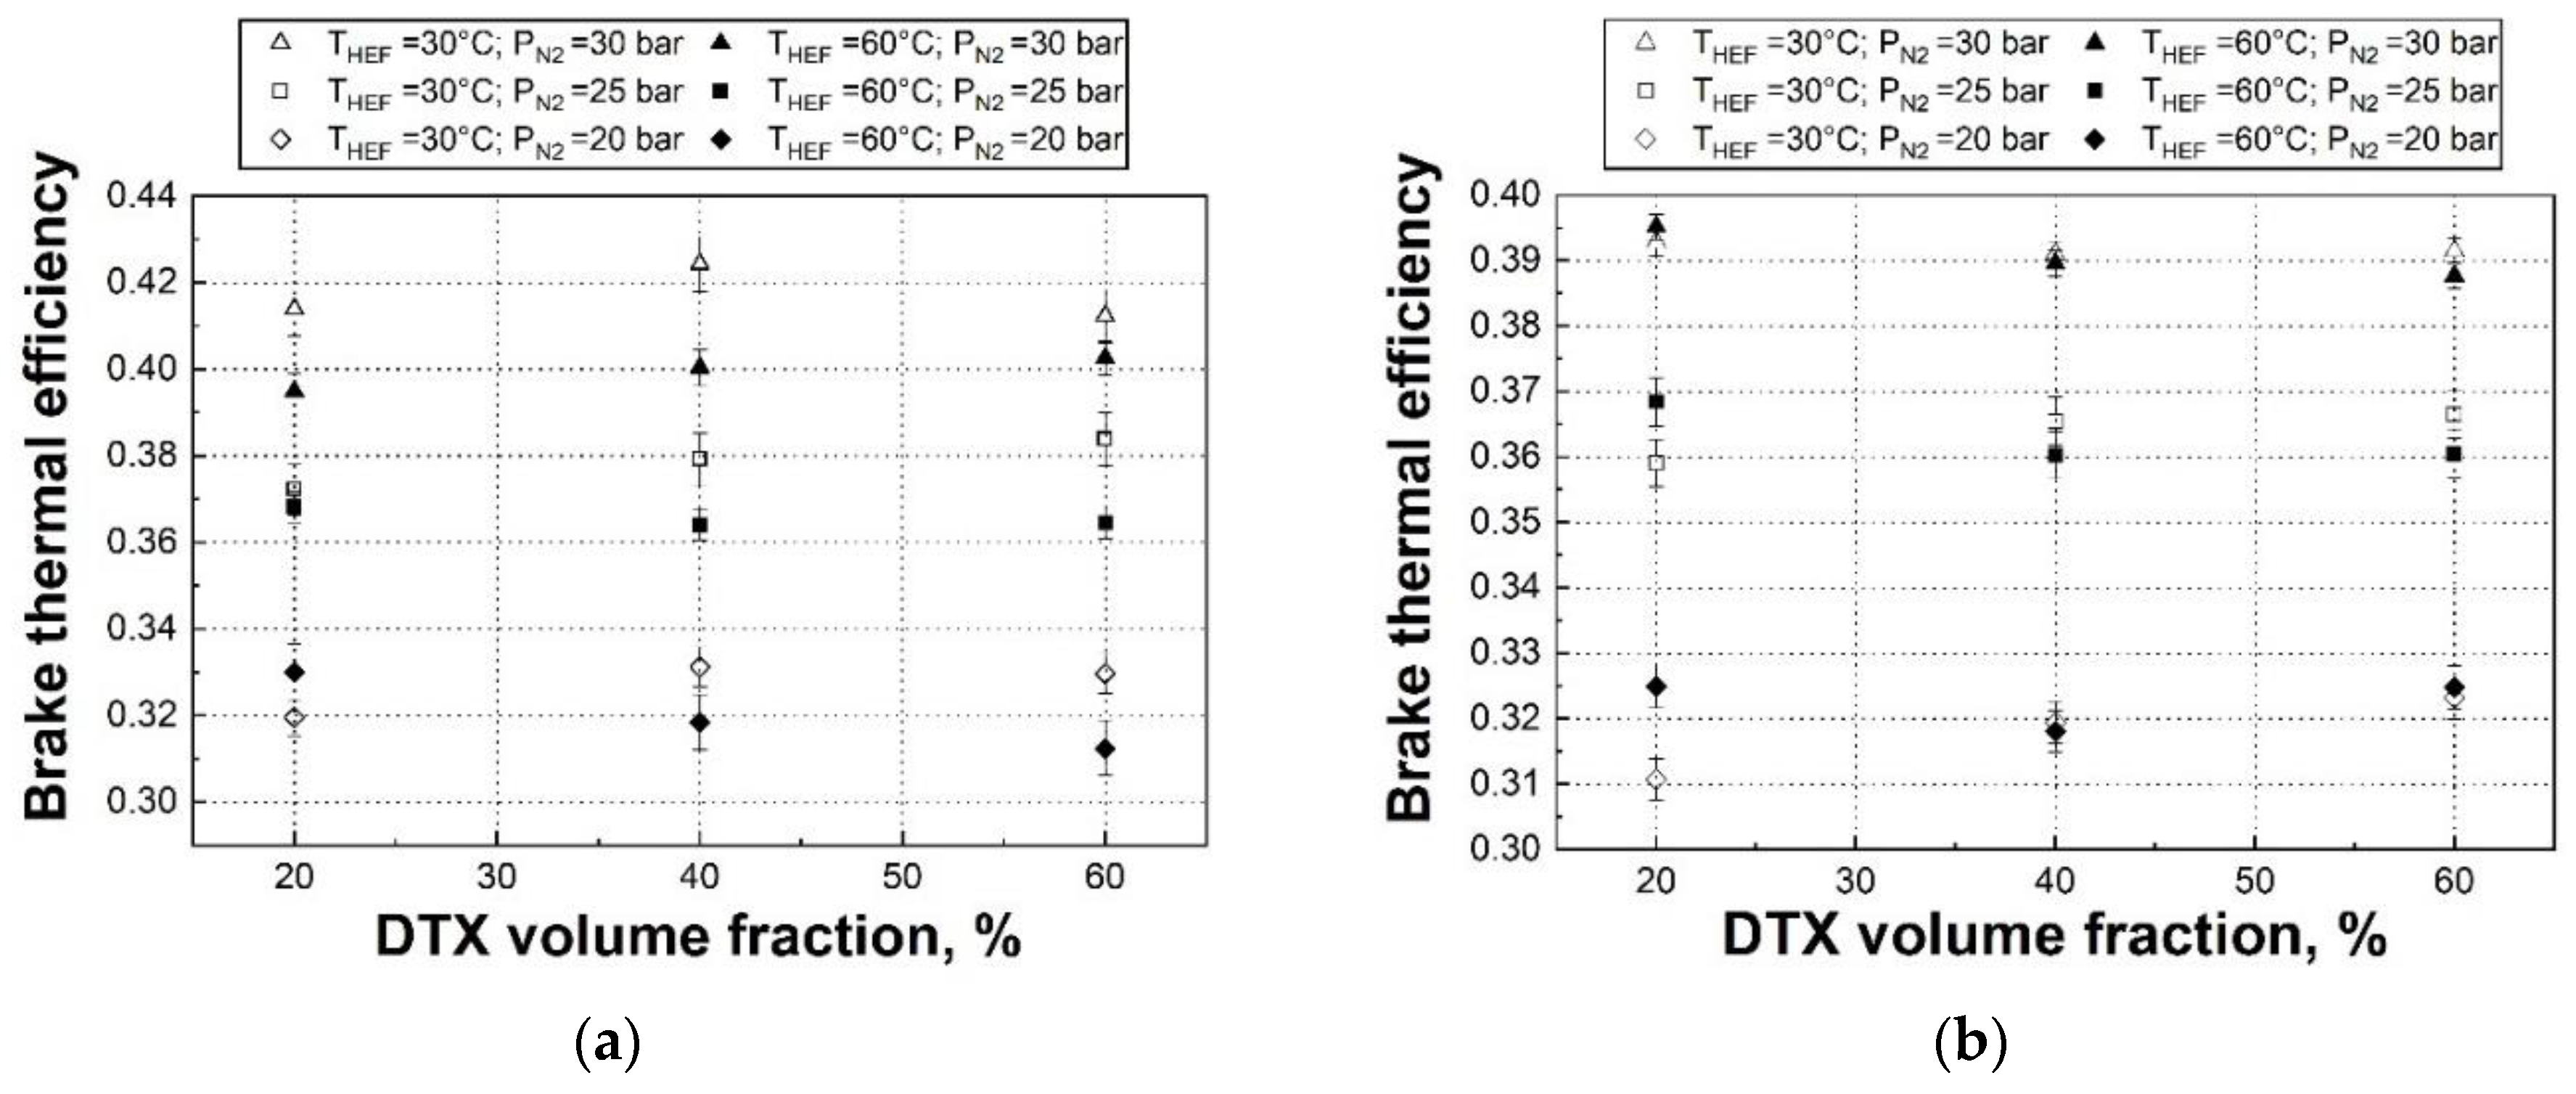
The effect of DTX volume fraction on the indicated and brake thermal efficiency of the engine is plotted in
Figure 10 and
Figure 11. Both the indicated and brake thermal efficiency were found to be insensitive to changes in DTX volume fractions. This could be due to the fact that the work output and nitrogen mass flow rate follow a similar trend, so their ratio tends to smooth out when calculating the efficiency. An increase in HEF temperatures was found to reduce the thermal efficiencies consistently, which could be caused by the increased energy input at higher HEF temperatures.
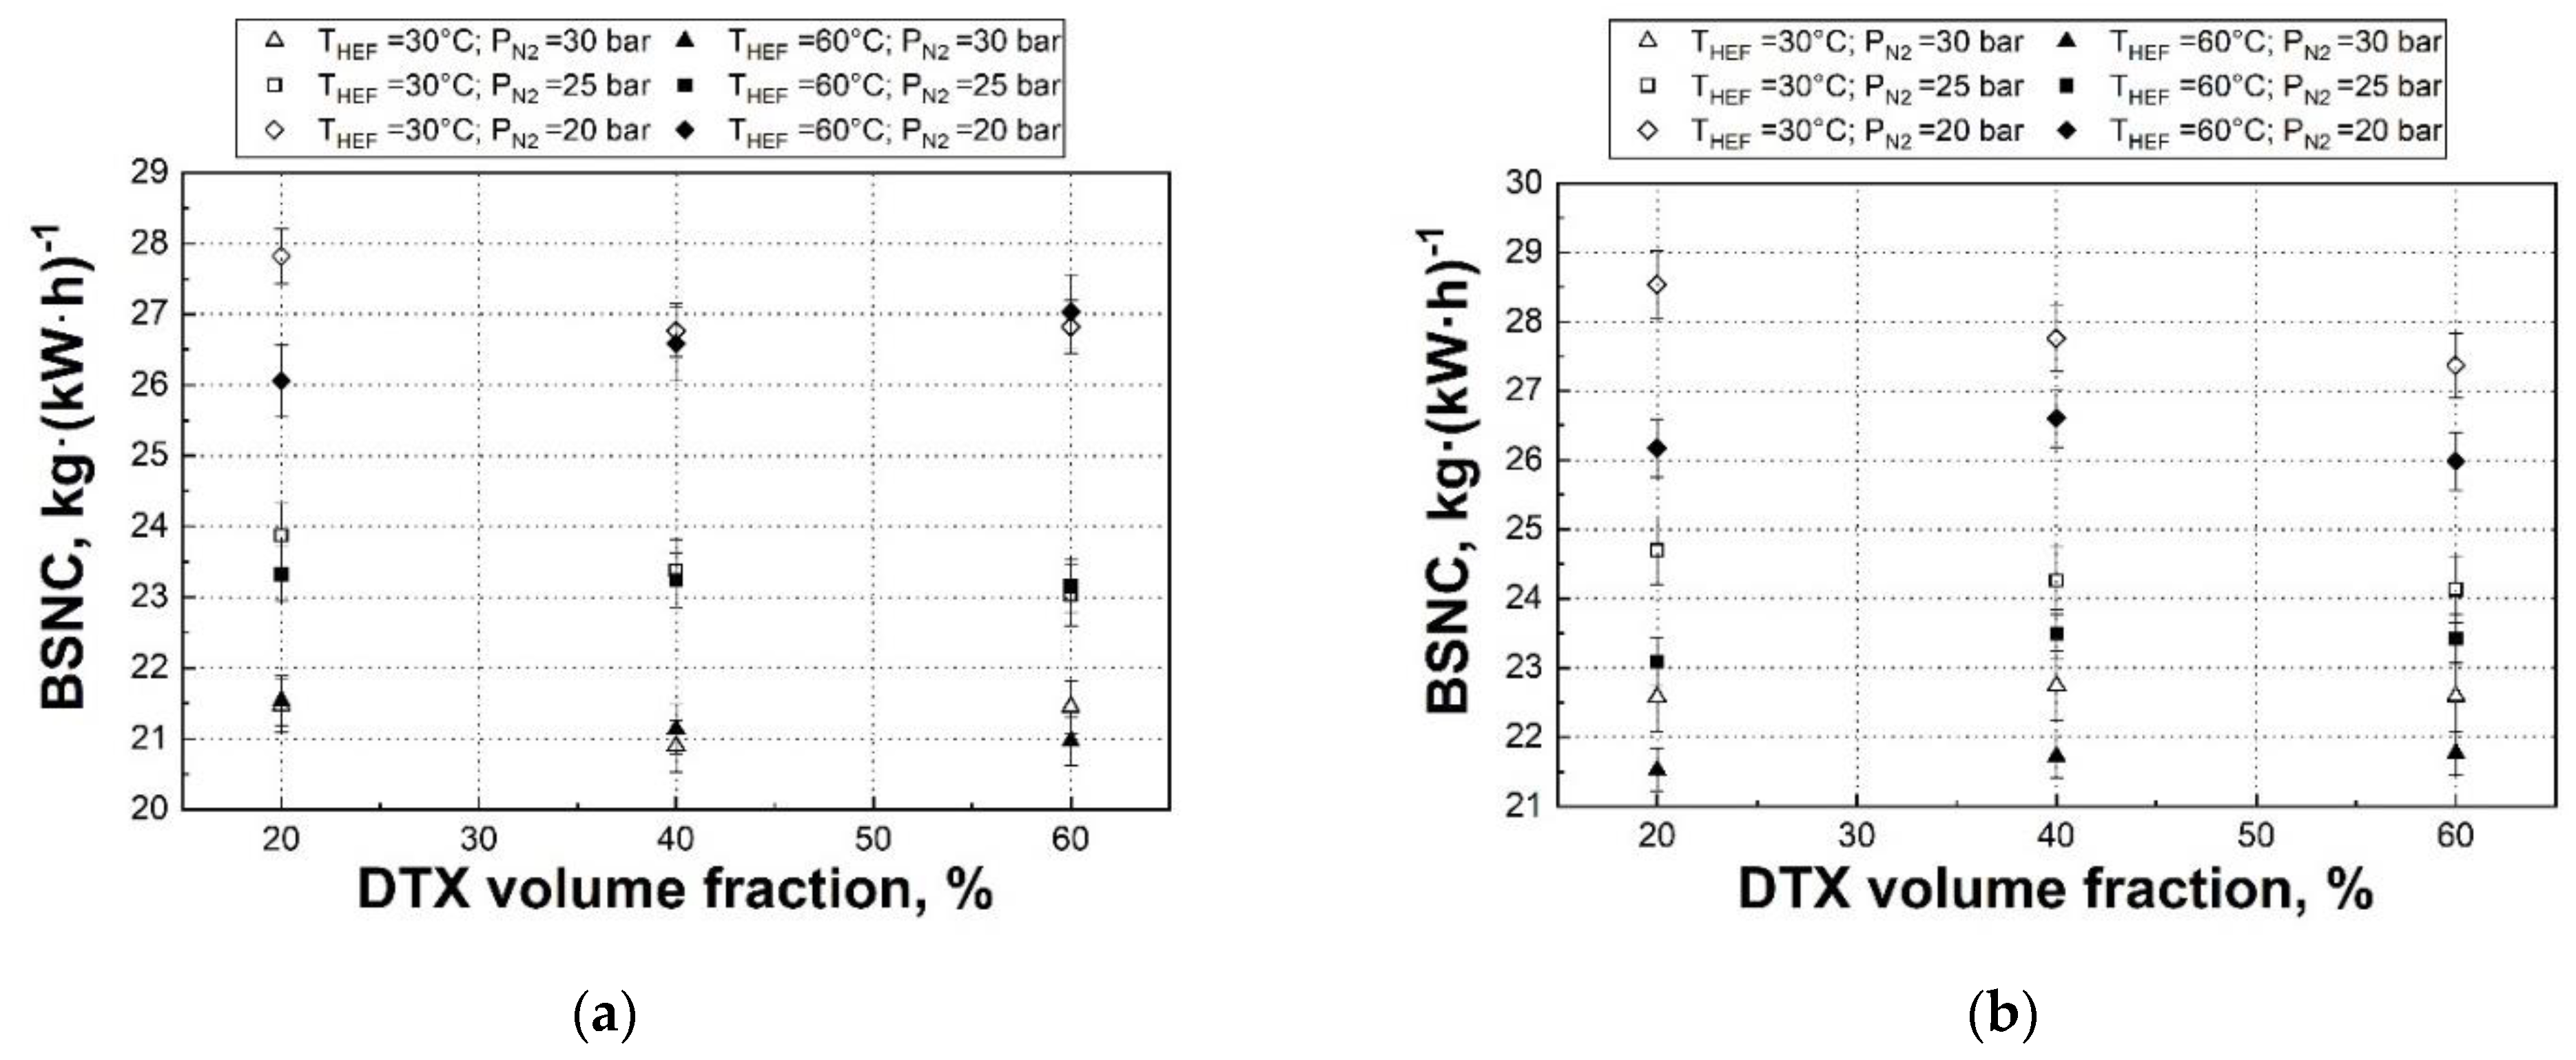
Another useful parameter to quantify nitrogen consumption is the Brake Specific Nitrogen Consumption (
) which is plotted in
Figure 12. Compared to brake power values, an opposite but weaker trend was found in the effect of variations in DTX volume fractions on the BSNC. This suggests that the brake power had a marginally more important role compared to the nitrogen flow rate in calculations of the BSNC. More noticeably, the increase in the HEF temperatures promoted reduction in the BSNC values in general, which is opposite to the trend observed with the thermal efficiencies. This occurred because the increased heat input at higher HEF temperatures was not taken into account in calculations of the BSNC. As a summary, the recommendation for a practical application could be using higher HEF temperatures if the engine power output is prioritized, and using lower HEF temperatures if the thermal efficiency of the engine is targeted.
4. Conclusions
In this paper, a detailed experimental programme has, for the first time, quantified the impact of variations in HEF compositions and temperature on the performance of a HEF-enhanced liquid nitrogen engine system. A thermodynamic model based on an idealised open-Rankine cycle and actual engine geometry is also presented to quantify the theoretical potential of the studied engine system.
Consistent with the results from previous work [
8], an increase in HEF temperature produced additional power and reduced engine nitrogen consumption due to enhanced heat transfer during the expansion stroke. However, the increase in HEF temperature was found to reduce the engine thermal efficiency due to the additional heat supplied to increase HEF temperature. The indicated power and thermal efficiencies obtained from experiments were also found to be higher than theoretical values for an idealised adiabatic expansion process, but lower than theoretical values for an isothermal expansion process. Such phenomena suggest that the engine power output can be further improved if a more effective heat addition process is initiated during the expansion stroke.
Additional observations were generated for the impact of variation in HEF composition on the engine performance. It was found that an increase in volume fractions of DTX generally boosted the engine power outputs and the nitrogen flow rates at an HEF temperature of 30 °C but, at the same time, had negligible impact when the HEF temperature was 60 °C. The analysis also revealed that engine power outputs followed similar trends to nitrogen flow within the same range of HEF compositions. While variations in DTX volume fractions affected noticeably the thermophysical properties of HEF and, therefore, the heat transfer process during the expansion stroke, changes in the nitrogen intake process had a more significant impact on engine performance. At higher DTX volume fractions, the deteriorated HEF thermal properties led to reduced heat transfer to nitrogen during the intake process allowing more nitrogen to flow into the cylinder (thermal effect). At the same time, this effect was offset by the hydrodynamic effect at the HEF temperature of 60 °C: the increased HEF viscosity at higher DTX fractions led to larger amounts of HEF being trapped inside the cylinder and, hence, a smaller amount of nitrogen flowed into the cylinder. The engine efficiency was found to be insensitive to variations in DTX volume fractions.
In summary, the presented work showed that although there was a consistent and noticeable impact of HEF composition on engine performance at 30 °C, HEF temperature, variations in DTX volume fractions at the HEF temperature of 60 °C had an insignificant impact on the most important engine characteristics. It was identified that the effect of variations in HEF composition by changing the DTX concentrations on the engine performance was significantly smaller than the impact of the HEF temperature at similar conditions.


