
Energy Market Prices in Times of COVID-19: The Case of Electricity and Natural Gas in Spain


Basque Centre for Climate Change—BC3, Edificio Sede No. 1, 1st Floor, Basque Country University Science Park, 48940 Leioa, Spain
Energies 2021, 14(6), 1632; https://0-doi-org.brum.beds.ac.uk/10.3390/en14061632
Submission received: 10 February 2021
/
Revised: 9 March 2021
/
Accepted: 11 March 2021
/
Published: 15 March 2021
(This article belongs to the Section F: Electrical Engineering)
Abstract
:The COVID-19 pandemic is having a strong impact on the economies of all countries, negatively affecting almost all sectors. This paper compares Spanish electricity and natural gas prices in the first half-year of 2020 with the prices expected for that period at the end of 2019. The half-year of 2020 selected coincides with the period of greatest impact of COVID-19 on Spanish society. Expected prices and their future probability distributions are calculated using a stochastic model with deterministic and stochastic parts; the stochastic part includes mean-reverting and jumps behaviour. The model is calibrated with 2016–2019 daily spot prices for electricity and with day-ahead prices for natural gas. The results show large monthly differences between the prices expected at the end of the year 2019 and the actual prices for the half-year; in May 2020, wholesale electricity prices are found to be EUR 31.60/MWh lower than expected, i.e., 60% lower. In the case of natural gas, the prices in the same month are EUR 8.96/MWh lower than expected, i.e., 62% lower. The spark spread (SS) is positive but lower than expected and also lower than in the same months of the previous year.
1. Introduction
The COVID-19 pandemic has caused a strong economic impact in all countries. This in turn has strongly affected energy demand and consequently prices. Its effects have been felt in several economic sectors, including construction and industry. COVID-19 is having a great impact on energy systems around the world, decreasing investments and threatening to slow the expansion of key clean energy technologies [1].
According to [2], in the first months of 2020, the world’s natural gas markets have experienced the largest demand negative shock ever recorded in their recent history because of the COVID-19 pandemic and because of mild winter temperatures in the northern hemisphere early in the year.
The timeline of COVID-19 is the following [3]: On 31 December 2019, China reported a cluster of cases of pneumonia where a novel coronavirus was eventually identified. After, on 12 January 2020, China publicly shared the genetic sequence of COVID-19. Additionally, on 11 March 2020, the WHO determined that COVID-19 could be characterized as a pandemic.
The following dates are significant for Spain:
- 13 March 2020: introduction of the “state of alarm”.
- 30 March 2020: tightening of the state of alarm with a ban on all non-essential activities.
- 13 April: return to work for construction and some industrial workers.
Because of this chronology with the initial COVID-19 information reported on 31 December 2019, quotes from earlier dates are used to estimate the prices that would have been expected in the first half of 2020 without COVID-19.
This study seeks to analyse the impact of the COVID-19 crisis on wholesale energy markets in Spain during the first half-year of 2020, covering electricity and natural gas. It sets out to analyse the following points: (a) To what extent has the COVID-19 pandemic affected the wholesale market prices of electricity and natural gas in Spain? (b) When did the markets react by lowering prices? To that end, real and estimated data for the first half of 2020 are compared. Probability distributions for estimations before COVID-19 expansion are based on a stochastic mean-reverting jump diffusion model calibrated with daily quotes from 2016–2019, and using the closing data for 2019 as the starting point of the estimate.
As cited in the report on the sectoral trend in electricity demand from large consumers in Spain [4], electricity consumption in April 2020 was 23.8% lower than in April 2019 in industry, 23.7% lower in services and 13.8% lower in “other consumers”. This is equivalent to an overall drop of 22.8% in the total for large consumers.
Figure 1 shows a sharp drop in electricity production and prices in Spain in the first months of 2020. These 2020 prices are much lower than the prices for 2016–2019.
Figure 2 also shows a sharp drop in natural gas prices in Spain in 2016–2019 and in the first months of 2020. These latest prices are lower than those for 2016–2019.
The COVID-19 pandemic has affected the power plants cost calculated as described by [7], decreasing for natural gas combined cycles. In all cases, the decrease in electricity prices has caused a reduction in income. This net income drop has affected renewable energy plants, where there has been no reduction in costs.
The papers below are some of those that have analysed the stochastic behaviour of electricity and natural gas prices.
A two-factor jump-diffusion model with seasonality for the valuation of electricity futures contracts was proposed by [8]; this model was applicate to the Pennsylvania-New Jersey-Maryland (PJM) US electricity market incorporating a jump risk premium.
The seasonal systematic pattern is of crucial importance in explaining the shape of the futures/forward curve being a simple sinusoidal function adequate for this [9]. This was analysed with Nordic Power Exchange’s spot, futures and forward prices.
The effectiveness of different jump specifications when modelling electricity prices was compared by [10]. They calibrate the models to the daily European Energy Exchange (EEX) market. The authors analyse the impact of the jump components on derivatives pricing.
The electricity prices behaviour in deregulated markets using a general class of models with seasonality, mean reversion, GARCH behaviour and time-dependent jumps is analysed in [11]. They estimate eight different nested models and find strong evidence that electricity equilibrium prices are mean reverting, with volatility clustering (GARCH) and with jumps of time-dependent intensity.
A model of electricity spot prices that combines mean reversion, spikes, negative prices and stochastic volatility can be found in [12], where different mean reversion rates for “normal” and “extreme” (spike) periods are used.
In this paper, a modified version of the stochastic model described in simulating electricity prices with mean-reversion and jump-diffusion [13] is used. This version includes the effects of non-working days.
There are some recent publications about the effects of the COVID-19 pandemic on the energy markets. The papers below are some of those.
A positive effect of the infectious diseases EMVID index on the realized volatility of crude oil prices with highest level of statistical significance [14] has been observed; this was found using a heterogeneous autoregressive realized volatility (HAR-RV) model.
The aggregated electricity demand decreased in Great Britain (GB) during March 2020 due to the mitigation measures including lockdown and work from home (WFH) because of the COVID-19 crisis [15]. Their analysis illustrates a need for faster and more frequent balancing actions because of the increased share of renewable energy. In COVID-19 pandemic time, the electricity demand has dropped sharply during lockdown restrictions decreed by some governments [16]. According to these authors, the share of renewable generation grew causing higher pressure on system operators.
The COVID-19 pandemic has affected renewable energy manufacturing facilities, supply chains and companies delaying the transition to low carbon generation [17]. This author concludes that the governments should provide incentives for investment in renewable energy with the objective of return to its long-term path towards green power generation and utilization.
In Italy, the measures adopted by the Italian government to deal with the COVID-19 emergency in the first months of 2020 have affected to industrial and commercial activities [18] and impacted the Italian electricity system. This study shows that the COVID-19 pandemic caused a reduction in consumption up to 37% year-on-year; wholesale energy prices decreased about 30% in the last weeks of March and in the first week of April due to less use of the most expensive generation technologies.
The stay-at-home advisory issued in response to the COVID-19 pandemic has been affected differently to regional electricity markets such as NYISO, MISO and PJM [19], but in all cases, the electricity generation declined after the stay-at-home advisories. The effect also was different in fuel generation types used.
The COVID-19 pandemic has affected to the energy sector dynamics on the province of Ontario, where the electricity demand in April 2020 amidst pandemic conditions declined by 14%, totalling 1267 GW [20]. In this study, the authors analyse the impact on the days of the week and on hourly seasonality. Additionally, the reduction in GHG emissions is calculated.
A hybrid prediction system is proposed by [21] for prediction of electricity demand during COVID-19 pandemic time, where a support vector machine is used as the prediction model.
The short-run impacts of COVID-19 in the economy were estimated using high-frequency electricity market data from Italy [22].
The severity of the COVID-19 pandemic significantly affected the electricity and the petroleum demand in China, both directly and indirectly [23]. These authors show that the oil industry is more vulnerable compared to the electricity industry. Due to the COVID-19 pandemic, China’s air quality has improved in the short term with a carbon emission reduction [24]; however, there is no evidence that this improvement will continue in the long run.
The volatility in the US stock market is sensitive to COVID-19 news more than economic indicators [25]. Oil and natural gas, restaurants, hotels and lodgings industries have exhibited large increases in risk during pandemic time. Using an auto-regressive distributive lag (ARDL) approach, [26] study the COVID-19 pandemic influence on oil and gas prices for the United States and Japan.
In [27], the author assesses the relative importance of COVID-19 infections and oil price news in influencing oil prices. This work analyses the lessons learnt from the COVID-19 (coronavirus) pandemic that could possibly apply.
The lessons learnt from the COVID-19 crisis that could possibly apply to the energy sector were analysed in [28], distinguishing between short/medium- and medium/long-term options. These authors show that in this period fuel demand fell to unprecedented levels, with oil price at the lowest values recorded for many years, reaching a negative price in the US for the first time in history on 20 April.
In electricity markets dominated by renewables [29], analyses of the economic feasibility of power-to-gas plants are not profitable under the current market conditions.
In [30], an optimization model for the gas–electricity coupled system taking into account the dynamic characteristics of natural gas flow, wind power integration and demand response management was proposed.
The relationship between electricity and natural gas prices in Spanish wholesale markets was analysed in [31]; the authors conclude that natural gas and electricity prices are not only cointegrated but share common long-term dynamics.
An electricity price forecasting (EPF) methods revision can be found in [32].
A valuation of a power plant with multiple turbines with CO2 prices modelled as a mean-reverting stochastic process was performed by [33].
In [34], the authors study the directional predictability between electricity and natural gas prices. The authors find significant nonlinearities in the relationship that characterizes the interconnected gas and electricity markets of both New England and Pennsylvania, New Jersey and Maryland.
The effects of electricity consumption and generation on carbon emissions in 25 African countries were investigated by [35] using various generation sources as hydro, oil, natural gas, coal and renewable electricity.
The economic literature shows that the margin between electricity and natural gas prices including the CO2 cost (the so-called clean spark spread or CSS) is relevant when calculating the expected margin and risk profile of natural gas combined cycle (NGCC) power plants, as in [36,37].
There is extensive literature that study the effects of water availability for electricity generation, changes in demand due to weather and climate change effects on electricity prices. A few are cited below. The use of hydroelectric plants in the generation of electricity depends on the availability of hydraulic resources but also of other aspects as the reservoir operation strategies established by the owners of plants and several other several purposes as irrigation, flooding control and security of supply (SoS) [38]. These authors show that the hydro power plants generate more power during peak hours and less in non-peak ones, thus, also contributing to SoS.
Electricity generators, when using water resources, usually are conservative and try to hedge against risk [39].
Some drives can impact in electricity demand such as electrification, technological improvements and climate change [40]; these authors conduct a study of the relationship between the historic electricity demand in Europe and these drivers, finding that among the weather variables is the temperature that shows the strongest relationship with electricity demand. Different sensitivities of electricity demand to temperature were calculated depending on the country’s latitude and technologies.
The impacts of climate change on hydropower generation in California were studied by [41].
2. Materials and Methods
The daily Spanish electricity spot prices for 1461 days that were extracted from ESIOS (information system of the operator of the Spanish electrical system) for four years (2016 to 2019) are used for calculations. For natural gas, 1461 day-ahead prices from the Iberian gas market (MIBGAS) for the same period were used.
Table 1 shows some basic statistics for electricity and natural gas prices. Both have positive values in excess of kurtosis, i.e., the probability of obtaining an extreme value is higher than a normal distribution that is confirmed by the maximum, minimum and 5% and 95% percentiles. There are fatter tails than in a normal distribution. The mean price is EUR 49.21/MWh for electricity and EUR 19.48/MWh for natural gas.
Electricity prices have seasonality, effects of non-working days, trends, mean reversion, volatility and price spikes. There is a deterministic part and a stochastic part. Initially, the same stochastic model is set for natural gas prices.
This section calibrated a stochastic electricity model under the real-world probability measure P. The real-world probability refers to market-expected probabilities in the real or physical world, as opposed to the risk-neutral probabilities used in quantitative finance for derivatives valuation. These real-world probabilities are used in risk management.
Figure 3 shows the behaviour of daily Spanish electricity and natural gas prices. This Figure shows that there is a Pearson positive correlation between Spanish electricity and natural gas prices; its value is 0.7024. The activity of natural gas combined cycle power plants connects both markets. In some cases, natural gas is also an alternative to electricity.
The natural logarithm of spot prices for each commodity is shown in Equation (1) broken down as the sum of two components. The first part is deterministic, and the second is the stochastic part. The latter is a mean-reverting jump diffusion model. The superscript i is used to distinguish between electricity (E) and natural gas (G).
Equation (2) describes the deterministic part of Equation (1) including annual and semi-annual seasonality. Equation (2) also includes the trend, a constant and a dummy variable for weekends and other non-working days for Spain. We consider only those official non-working days that apply nationwide and not regional non-working days. weekends and on other non-working days and otherwise. Calibrating the first seven parameters with daily electricity and natural gas prices using the least squares method gives the results shown in Table 2. These parameter values of the deterministic daily part are different for electricity and natural gas. Electricity prices show a positive trend over time, but natural gas prices show a slightly negative trend Weekends and other non-working days have a significant negative effect on electricity prices, but almost no effect on natural gas prices.
In Equation (2), the seasonality—because of the impact of the demand of usual weather conditions in each day—is incorporated. Additionally, the trend in prices is incorporated as well as the effect of lower demand in no working days.
All estimated values in Table 2 are statistically significant, except whose estimated values are very close to zero.
Figure 4 shows both the natural logarithm of electricity prices in Spain with their deterministic part and the natural logarithm of electricity prices with the deterministic part removed.
Figure 5 shows both the natural logarithm of natural gas prices in Spain with their deterministic part and the natural logarithm of natural gas prices with the deterministic part removed.
After the deterministic part of electricity and natural gas prices is removed, the calculation continues with their stochastic parts.
Equations (3) and (4) fit the stochastic part of the logarithm of Spanish electricity and natural gas prices. These equations are Ornstein-Uhlenbeck mean reverting with jumps. Equation (5) shows that these stochastic processes are correlated. Note that sometimes both Spain electricity and natural gas prices can move stochastically for similar reasons. Using the natural logarithm of electricity prices with seasonality removed as per Figure 4 and Figure 5, the correlation value is obtained. Note that it is the correlation between the stochastic parts of the logarithm of prices.
In Equations (3) and (4), the current logarithm of the stochastic part of electricity and natural gas prices tends to level in the long term, with a reversion speed of . The volatility of the mean-reverting process is . The third term of Equations (3) and (4) is a Poisson process with a rate of arrival . If there is a jump, its size is normally distributed with mean and volatility . is the increment to a standard Wiener process, and is a Poisson process such that with probability and with probability . and are independent. The parameter is the correlation. It is assumed that and are indeperndents; it is a common simplifying assumption, which is recognized as a limitation of the model.
The first term of Equations (3) and (4) is the deterministic part, while the remaining two terms are the stochastic part.
Note that Equations (3) and (4) can have negative values, as the natural logarithm of some low electricity and natural gas prices can be negative.
The electricity parameter values shown in Table 3 are obtained using maximum likelihood estimation. Appendix A describes the application of this method for Equations (3) and (4). In the case of electricity, there are large jumps with a high mean-reverting speed, the price volatility is high, and in the jump cases, negative values are expected with significant volatility. An initial analysis of natural gas stochastic part prices shows that jumps can be discarded as a relevant variable due to its very small size, which is not significantly different from zero; because of this, Equation (6) has been used instead of Equation (4).
The parameter ρ with a value of 0.6490 is calculated using the residuals of Equations (3) and (4). Note that it is the correlation between the stochastic parts of the logarithm of prices; this gives a slightly different value than the correlation between the prices of Figure 3. Because time is measured in years, there is a probability of a jump in electricity prices on a specific day, being
3. Results and Discussion
3.1. Mone Carlo Simulation of Electricity and Natural Gas Prices
This section describes the Monte Carlo simulation for electricity and natural gas prices under the real-world probability P. A discretized version of Equations (3), (5) and (6) is used to simulate electricity and natural gas prices.
We run 10,000 simulations for the first half of 2020, i.e., 182 days, under the real-world probability. This simulation is based on the fitted model starting from the figures for the end of 2019. First, we simulate the stochastic part of Spanish electricity and natural daily prices, and then, we include the deterministic daily part with seasonality (annual and semi-annual), the trend, weekend and holiday effects and a constant component.
For these simulations, correlated samples for electricity and natural gas prices are calculated using Equation (7), as calculated by [42].
Correlation is simulated by obtaining normal N(0,1) samples (logarithm price of the stochastic part of Spanish electricity prices) and also N(0,1) (logarithm price of the stochastic part of Spanish natural gas prices) using Equation (7), where and are two independent normal N(0,1) samples. The parameter is the correlation calculated with a value of 0.6490. This method generates correlated random samples with a correlation value of 0.6494, very near the parameter value of 0.6490. Figure 6 shows spot electricity prices for 2016–2019 and the daily mean of simulated prices, i.e., each time the daily point is the mean of the 10,000 simulated values.
Figure 6 shows the daily natural logarithm of Spanish electricity prices from 2016 to 2019 and the daily mean of the simulated prices for the first half-year of 2020. In the daily price average, the deterministic part prevails, because the average of the stochastic part is almost zero. In the forecast of electricity prices for the first half-year of 2020 in Figure 6, the impact of non-working days on prices is observed, including the impact of Easter. Additionally, the forecast includes the expected effects of seasonality and trend on electricity prices.
Figure 7 gives Spanish natural gas prices and shows the daily natural logarithm of those prices from 2016 to 2019 and the daily mean of the simulated prices for the first half-year of 2020. Additionally, in the forecast part of this figure, the impact on natural gas prices of non-working days can be observed, including Easter. The forecast includes the expected effects of seasonality and trend on natural gas prices.
As commented, all simulation paths (10,000) are correlated.
The monthly price simulation for the first six months of 2020 is calculated using the 10,000 daily price simulations, that is, 10,000 paths of 182 days each. This is done by adding up the prices for each day of the month in each simulation and dividing by the number of days in that month. Six distributions of 10,000 values for each month are used to calculate the mean and percentiles. These distributions allow us to obtain the expected value for the first half-year of 2020 with data prior to the pandemic and also calculate extreme values above and below the expected value.
Figure 8 shows the histogram values for monthly Spanish electricity and natural gas prices simulated for April. The expected mean values are EUR 49.27/MWh for electricity and EUR 13.84/MWh for natural gas. Note that April in Spain was the 2020 month with the greatest restrictions including the closure of non-essential activities.
Table 4 shows the monthly simulated mean and percentiles for electricity and natural gas. The lowest 10% percentile is EUR 37.75/MWh in April for electricity and EUR 9.85/MWh in May for natural gas. That is, prior to the pandemic beginning, there was a probability of 10% of prices below EUR 37.75/MWh in electricity and below EUR 9.85/MWh in natural gas for the month of April 2020.
The expected mean electricity prices are between EUR 49.27/MWh and EUR 59.63/MWh for this month.
The prices expected at the end of 2019 are significantly higher than the actual monthly prices for the first half of 2020, as shown in Table 5. This table also shows the prices for the equivalent months of 2019.
In the first four months of 2020, actual electricity prices decreased, so the difference between the actual and expected figures increased. Electricity prices in April 2020 were EUR 31.61/MWh less than expected. This trend continued in May 2020 with a difference of EUR 31.60/MWh and in June with EUR 29.01/MWh.
The actual electricity prices for the first half-year of 2020 incorporate weather conditions and water availability, which may be somewhat different from those incorporated in the simulation that assumes only the usual behaviour of weather and water in those dates (seasonality and trend). The forecast is based on data before the COVID-19 pandemic without incorporating the forecast of unusual weather or water conditions for, say, April 2020 with data at the end of 2019. Always, the expected demand effects are indirectly incorporated through their impact on energy prices, as is usual in stochastics mean-reverting jump diffusion models.
To analyse how weather and water conditions have influenced current prices in the first half-year of 2020 is beyond the scope of this paper, with the main impact below the predicted prices being attributed to the pandemic. This is a recognized limitation of the paper.
Table 5 shows, for natural gas, that prices in January 2020 were near to the expected figures, but in the following months, there was a decreasing trend, which significantly widened the difference between expected and real prices. In May 2020, actual prices were 62% lower than expected.
This decrease is mainly caused by the COVID-19 pandemic. Additionally, mild temperatures in the northern hemisphere in the first months of the half-year may have had an additional influence on prices, but the drop in prices continued in the last few months of the half-year of 2020. Electricity prices were the first to drop considerably compared to expectations from January onwards. Natural gas prices dropped over the five first months, with a minimum price of EUR 5.39/MWh in May 2020.
A comparison of actual prices for April 2020 and the distribution shown in Figure 8 reveals that the actual prices are among the most unlikely cases contemplated in the distribution as shown in Table 4 (EUR 37.75/MWh for electricity and EUR 9.85/MWh for natural gas for 10% percentiles).
A comparison of actual monthly prices for 2020 with the prices for the equivalent months of 2019 shows a similar 65% drop in electricity in April 2020 and a greater % decline in natural gas prices in the same month. This latter drop is also due to the trend in historic natural gas prices as observed in Figure 2.
3.2. The Spark Spread (SS)
The spark spread is the margin between electricity and natural gas prices when one MWh of electricity is generated. Equation (8) show the spark spread margin ( per MWh generated at time t of a natural gas combined cycle power plant (NGCC), depending on its efficiency .
where at time t, is the income, that is the electricity price, is the fuel cost (natural gas price), and is the natural gas power plant efficiency. A thermal efficiency of 52.5% is used [43]. Thus, an efficiency rate for the gas plant is selected.
Figure 9 shows the trend in spark spread (SS). The lowest figure for this in the first half-year of 2020 is EUR 3.59/MWh, recorded in April 2020, but in the rest of the months of the first half-year of 2020, it remains high at above EUR 10/MWh. The drop in natural gas prices partially compensates from the fall in electricity prices at power plants during the time of COVID-19.
Historically, from 2016 to 2018, there have been months with lower margins than those obtained in the first half-year of 2020, even reaching negative values; this was because of the higher natural gas prices in this period (see Figure 3).
Table 6 shows an SS margin in the first half-year of 2020, which is positive but lower than expected. The margins (March–June) are also lower than for 2019, especially in April.
3.3. The European Energy Markets Behavior in COVID-19 Times
In this subsection, the European energy markets prices behaviour is analysed during the first months of the pandemic COVID-19.
Figure 10 shows very similar behaviour in electricity prices, as they are affected by similar causes in European countries.
Portugal electricity prices have not been represented in Figure 10, because they are practically identical to those of Spain.
Table 7 shows the monthly electricity price correlation between some European electricity markets. In this table, it can be seen that the correlations have been very close to the value of one in all cases. This has been the case, despite the fact that Spain is considered an island from an electrical point of view due to the scarce international connection it has with France.
Portugal electricity prices have not been represented in Figure 10, because they are practically identical to those of Spain. The Pearson correlation between Spain and Portugal electricity prices in the same period was 0.9999.
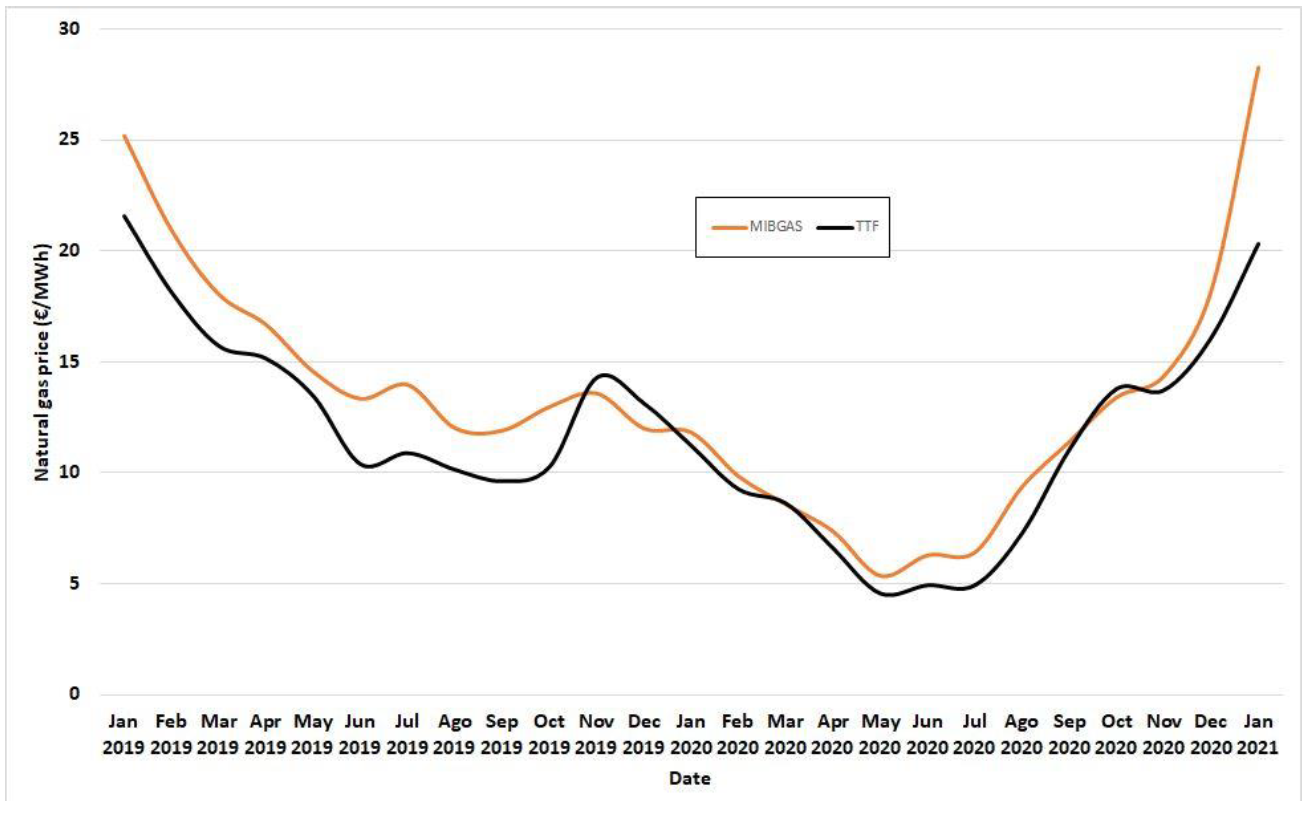
In European natural gas markets, as shown in Figure 11, there has been similar behaviour between the Iberian gas market MIBGAS and the market title transfer facility (TTF) that is a virtual trading point for natural gas in the Netherlands.
For both natural gas markets, the Pearson correlation was 0.956 during the period January 2019 to January 2021. The Iberian natural gas prices have almost always been somewhat above TTF prices during this period.
4. Conclusions
The COVID-19 pandemic crisis has negatively influenced to a greater or lesser extent all the world’s economies and most sectors, including industry, construction and tourism. The energy demand has declined, and consequently, prices fell in the wholesale markets. The consumption of electricity in Spain by large consumers has decreased considerably, with certain non-essential construction and industrial activities being suspended for only 14 days in April 2020. Additionally, less prominent events may also have also affected energy consumption in the first half of 2020, including milder temperatures in the northern hemisphere.
This study presents a model designed to predict the future behaviour of the wholesale electricity and natural gas markets. The model is calibrated with Spanish daily quotes from 2016–2109, and the expected future behaviour is simulated using the end of 2019 as a starting point. These simulations allow us to obtain distributions of expected prices and, consequently, expected values, percentiles and other statistics with data prior to the beginning of the COVID-19 pandemic. The differences between expected prices and actual 2020 prices are a measure of the impact of the COVID-19 crisis on both wholesale markets, with drops of close to EUR 30/MWh (April–June) for electricity and just over EUR 9/MWh (May–June) for the natural gas market. The biggest difference in the wholesale electricity market was found for April (a drop of EUR 31.61/MWh), while the differences in the natural gas market grew in a more staggered way and peaked in May with a drop of EUR 8.96/MWh.
This stochastic diffusion model, with data from other countries and markets, could be used to make similar calculations for other countries using data from their wholesale markets. The same figures can also be used to calculate the spark spread (SS) using an efficiency rate for natural gas combined cycle power plants (NGCC). The spark spread (SS) margin remained above EUR 10/MWh in all the months of the first half-year of 2020 except April. However, the SS was lower than expected and, for March–June, was also lower than for the same months of 2019.
A comparison of real 2020 prices in both wholesale markets with the prices expected at the end of 2019 for the same period shows a huge fall for electricity of EUR 31.61/MWh in April and EUR 31.60 in May (64 and 60% lower, respectively). Similar behaviour is observed in natural gas prices, which were EUR 6.46/MW lower than expected in April, EUR 8.96/MWh lower in May and 8.78 lower in June (47, 62 and 58% lower, respectively). Electricity and natural gas prices both began to drop in January. A comparison with the same months of 2019 shows similar drops (January–May) in electricity prices and further decreases in natural gas prices.
The European electricity and natural gas markets have shown very similar behaviour during the pandemic with very high correlations despite their different geographic location.
Funding
This research is supported by the Basque Government through the BERC 2018–2021 programme and by the Spanish Ministry of Economy and Competitiveness (MINECO) through BC3 María de Maeztu excellence accreditation MDM-2017-0714. Further support is provided by the project MINECO RTI2018-093352-B-I00.
Institutional Review Board Statement
Not applicable.
Informed Consent Statement
Not applicable.
Data Availability Statement
Not applicable.
Conflicts of Interest
The author declares no conflict of interest.
Appendix A
It is possible to represent the density function of given :
In this case, is a day, that is, There is a probability that there will be a jump; then Equation (A2) applies:
There is a probability that there will be no jump, in which case Equation (A3) applies:
The parameters can be calculated by minimising the negative value of the log likelihood function:
subject to:
References
- IEA. The Covid-19 Crisis and Clean Energy Progress. 2020. Available online: https://www.iea.org/reports/the-covid-19-crisis-and-clean-energy-progress (accessed on 30 December 2020).
- IEA. Gas 2020 Analysing the Impact of the Covid-19 Pandemic on Global Natural Gas Markets. 2020. Available online: https://www.iea.org/reports/gas-2020 (accessed on 30 December 2020).
- WHO. WHO Timeline—COVID-19. 2020. Available online: https://www.who.int/news-room/detail/27-04-2020-who-timeline---covid-19 (accessed on 30 December 2020).
- REE. Sectoral Evolution of Electricity Demand in Large Consumers. 2020. Available online: https://www.ree.es/sites/default/files/01_ACTIVIDADES/Documentos/IRE/InfomenIRE_Abr20.pdf (accessed on 30 December 2020).
- ESIOS. 2020. Available online: www.esios.ree.es/es (accessed on 30 December 2020).
- MIBGAS. 2020. Iberian Gas Market. Available online: https://www.mibgas.es/es/file-access (accessed on 30 December 2020).
- Abadie, L.M.; Chamorro, J.M. Levelized cost of electricity: Key drivers and valuation methods. Dyna 2019, 94, 656–661. [Google Scholar] [CrossRef] [Green Version]
- Villaplana, P. Pricing Power Derivatives: A Two-Factor Jump-Diffusion Approach. EFMA 2004 Basel Meetings Paper. 2003. Available online: https://ssrn.com/abstract=493943 or http://0-dx-doi-org.brum.beds.ac.uk/10.2139/ssrn.493943 (accessed on 30 December 2020).
- Lucia, J.J.; Schwartz, E.S. Electricity Prices and Power Derivatives: Evidence from the Nordic Power Exchange. Rev. Deriv. Res. 2002, 5, 5–50. [Google Scholar] [CrossRef]
- Seifert, J.; Uhrig-Homburg, M. Modelling Jumps in Electricity Prices: Theory and Empirical Evidence. Rev. Deriv. Res. 2007, 10, 59–85. [Google Scholar] [CrossRef]
- Escribano, A.; Peña, J.I.; Villaplana, P. Modelling Electricity Prices: International Evidence. Oxf. Bull Econ. Stat. 2011, 73, 622–650. [Google Scholar] [CrossRef] [Green Version]
- Mayer, K.; Schmid, T.; Weber, F. Modeling electricity spot prices: Combining mean reversion, spikes, and stochastic volatility. Eur. J. Financ. 2015, 21, 292–315. [Google Scholar] [CrossRef] [Green Version]
- MathWorks. 2019. Simulating Electricity Prices with Mean-Reversion and Jump-Diffusion. Available online: https://es.mathworks.com/help/fininst/examples/simulating-electricity-prices-with-mean-reversion-and-jump-diffusion.html (accessed on 30 December 2020).
- Bouri, E.; Demirer, R.; Gupta, R.; Pierdzioch, C. Infectious Diseases, Market Uncertainty and Oil Market Volatility. Energies 2020, 13, 4090. [Google Scholar] [CrossRef]
- Kirli, D.; Parzen, M.; Kiprakis, A. Impact of the COVID-19 Lockdown on the Electricity System of Great Britain: A Study on Energy Demand, Generation, Pricing and Grid Stability. Energies 2021, 14, 635. [Google Scholar] [CrossRef]
- Zhong, H.; Tan, Z.; He, Y.; Xie, L.; Kang, C. Implications of COVID-19 for the electricity industry: A comprehensive review. CSEE J. Power Energy Syst. 2020, 6, 489–495. [Google Scholar] [CrossRef]
- Hosseini, S.E. An outlook on the global development of renewable and sustainable energy at the time of COVID-19. Energy Res. Soc. Sci. 2020, 68, 101633. [Google Scholar] [CrossRef]
- Ghiani, E.; Galici, M.; Mureddu, M.; Pilo, F. Impact on Electricity Consumption and Market Pricing of Energy and Ancillary Services during Pandemic of COVID-19 in Italy. Energies 2020, 13, 3357. [Google Scholar] [CrossRef]
- Eryilmaz, D.; Patria, M.; Heilbrun, C. Assessment of the COVID-19 pandemic effect on regional electricity generation mix in NYISO, MISO, and PJM markets. Electr. J. 2020, 33, 106829. [Google Scholar] [CrossRef]
- Abu-Rayash, A.; Dincer, I. Analysis of the electricity demand trends amidst the COVID-19 coronavirus pandemic. Energy Res. Soc. Sci. 2020, 68, 101682. [Google Scholar] [CrossRef]
- Lu, H.; Ma, X.; Ma, M. A hybrid multi-objective optimizer-based model for daily electricity demand prediction considering COVID-19. Energy 2021, 219, 119568. [Google Scholar] [CrossRef]
- Fezzi, C.; Fanghella, V. Real-Time Estimation of the Short-Run Impact of COVID-19 on Economic Activity Using Electricity Market Data. Environ. Resour. Econ. 2020, 76, 885–900. [Google Scholar] [CrossRef] [PubMed]
- Norouzi, N.; Zarazua de Rubens, G.; Choupanpiesheh, S.; Enevoldsen, P. When pandemics impact economies and climate change: Exploring the impacts of COVID-19 on oil and electricity demand in China. Energy Res. Soc. Sci. 2020, 68, 101654. [Google Scholar] [CrossRef] [PubMed]
- Wang, Q.; Su, M. A preliminary assessment of the impact of COVID-19 on environment—A case study of China. Sci. Total Environ. 2020, 728, 138915. [Google Scholar] [CrossRef]
- Baek, S.; Mohanty, S.K.; Glambosky, M. COVID-19 and stock market volatility: An industry level analysis. Financ. Res. Lett. 2020, 37, 101748. [Google Scholar] [CrossRef] [PubMed]
- Nyga-Łukaszewska, H.; Aruga, K. Energy Prices and COVID-Immunity: The Case of Crude Oil and Natural Gas Prices in the US and Japan. Energies 2020, 13, 6300. [Google Scholar] [CrossRef]
- Narayan, P.K. Oil price news and COVID-19—Is there any connection? Energy Res. Lett. 2020, 1, 13176. [Google Scholar] [CrossRef]
- Chiaramontia, D.; Maniatisc, K. Security of supply, strategic storage and Covid19: Which lessons learnt for renewable and recycled carbon fuels, and their future role in decarbonizing transport? Appl. Energy 2020, 271, 115216. [Google Scholar] [CrossRef]
- van Leeuwen, C.; Mulder, M. Power-to-gas in electricity markets dominated by renewables. Appl. Energy 2018, 232, 258–272. [Google Scholar] [CrossRef]
- Zhang, Y.; Zhang, Y.; Huang, Z.; Zheng, F.; Zhou, R.; An, X.; Li, Y. Interval optimization based coordination scheduling of gas–electricity coupled system considering wind power uncertainty, dynamic process of natural gas flow and demand response management. Energy Rep. 2020, 6, 216–227. [Google Scholar] [CrossRef]
- Furió, D.; Población, J. Electricity and Natural Gas Prices Sharing the Long-term Trend: Some Evidence from the Spanish Market. Int. J. Energy Econ. Policy 2018, 8, 173–180. [Google Scholar]
- Nowotarski, J.; Weron, R. Recent advances in electricity price forecasting: A review of probabilistic forecasting. Renew. Sust. Energy Rev. 2018, 81, 1548–1568. [Google Scholar] [CrossRef]
- Elias, R.S.; Wahab, M.I.M.; Fang, L. The spark spread and clean spark spread option based valuation of a power plant with multiple turbines. Energy Econ. 2016, 59, 314–327. [Google Scholar] [CrossRef]
- Uribe, J.M.; Guillen, M.; Mosquera-López, S. Uncovering the nonlinear predictive causality between natural gas and electricity prices. Energy Econ. 2018, 74, 904–916. [Google Scholar] [CrossRef]
- Ehigiamusoe, K.U. A disaggregated approach to analyzing the effect of electricity on carbon emissions: Evidence from African countries. Energy Rep. 2020, 6, 1286–1296. [Google Scholar] [CrossRef]
- Hentschel, J.; Babić, U.; Spliethoff, H. A parametric approach for the valuation of power plant flexibility options. Energy Rep. 2016, 2, 40–47. [Google Scholar] [CrossRef] [Green Version]
- Abadie, L.M. Current expectations and actual values for the clean spark spread: The case of Spain in the Covid-19 crisis. J. Clean Prod. 2021, 285, 124842. [Google Scholar] [CrossRef]
- Abadie, L.M.; Chamorro, J.M.; Huclin, S.; van de Ven, D.-J. On flexible hydropower and security of supply: Spain beyond 2020. Energy 2020, 203, 117869. [Google Scholar] [CrossRef]
- Rodilla, P.; Batlle, C. Security of generation supply in electricity markets. In Regulation of the Power Sector; Perez-Arriaga, I.J., Ed.; Springer: London, UK, 2013. [Google Scholar]
- Cassarino, T.G.; Sharp, E.; Barrett, M. The impact of social and weather drivers on the historical electricity demand in Europe. Appl. Energy 2018, 229, 176–185. [Google Scholar] [CrossRef]
- Tarroja, B.; AghaKouchak, A.; Samuelsen, S. Quantifying climate change impacts on hydropower generation and implications on electric grid greenhouse gas emissions and operation. Energy 2016, 111, 295–305. [Google Scholar] [CrossRef] [Green Version]
- Abadie, L.M.; Chamorro, J.M. Investment in Energy Assets Under Uncertainty: Numerical Methods in Theory and Practice, 1st ed.; Springer: London, UK, 2013; ISBN 978-1-4471-5591-1. [Google Scholar]
- Energy and Society. The Value of Flexibility of Natural Gas Combined Cycles. 2017. Available online: http://www.energiaysociedad.es/manenergia/1-3-el-valor-de-la-flexibilidad-de-los-ciclos-combinados-de-gas-natural/ (accessed on 30 December 2020).
- Elexys. Spot TTF. 2021. Available online: https://my.elexys.be/MarketInformation/SpotTtf.aspx (accessed on 28 February 2021).
Figure 1.
Spanish monthly electricity generation and prices, from January 2016 to June 2020. Source: own work based on ESIOS [5].
Figure 1.
Spanish monthly electricity generation and prices, from January 2016 to June 2020. Source: own work based on ESIOS [5].

Figure 2.
Spanish monthly natural gas prices, from January 2016 to June 2020. Source: own work based on Iberian gas market (MIBGAS) [6].
Figure 2.
Spanish monthly natural gas prices, from January 2016 to June 2020. Source: own work based on Iberian gas market (MIBGAS) [6].

Figure 3.
Spanish daily electricity and natural gas prices from 2016 to 2019.

Figure 4.
Daily natural logarithm of Spanish electricity prices from 2016 to 2019 with their deterministic and stochastic parts.
Figure 4.
Daily natural logarithm of Spanish electricity prices from 2016 to 2019 with their deterministic and stochastic parts.

Figure 5.
Daily natural logarithm of Spanish natural gas prices from 2016 to 2019 with their deterministic and stochastic parts.
Figure 5.
Daily natural logarithm of Spanish natural gas prices from 2016 to 2019 with their deterministic and stochastic parts.

Figure 6.
Daily natural logarithm of Spanish electricity prices from 2016 to 2019 and daily mean of simulated prices for the first half-year of 2020.
Figure 6.
Daily natural logarithm of Spanish electricity prices from 2016 to 2019 and daily mean of simulated prices for the first half-year of 2020.

Figure 7.
Daily natural logarithm of Spanish natural gas prices from 2016 to 2019 and daily mean of simulated prices for the first half-year of 2020.
Figure 7.
Daily natural logarithm of Spanish natural gas prices from 2016 to 2019 and daily mean of simulated prices for the first half-year of 2020.

Figure 8.
Histogram of monthly distributions of Spanish electricity and natural gas prices in April 2020 based on 10,000 simulations.
Figure 8.
Histogram of monthly distributions of Spanish electricity and natural gas prices in April 2020 based on 10,000 simulations.

Figure 9.
Monthly spark spread (SS).

Figure 10.
European electricity prices in COVID-19 time. Source: own work based on ESIOS data [5].
Figure 10.
European electricity prices in COVID-19 time. Source: own work based on ESIOS data [5].

Figure 11.
European natural gas prices in COVID-19 time. Source: own work based on MIBGAS data [6] and Elexys data [44].


Table 1.
Daily basic statistics (2016–2019).
| Prices (EUR/MWh) | Mean | Minimum | Maximum | Standard Deviation | Asymmetry | Excess Kurtosis | Percentile 5% | Percentile 95% |
|---|---|---|---|---|---|---|---|---|
| Electricity Spain | 49.21 | 1.94 | 91.88 | 12.86 | −0.52 | 0.87 | 25.41 | 68.01 |
| Natural Gas Spain | 19.48 | 7.89 | 43.00 | 5.52 | 0.85 | 1.20 | 10.45 | 28.16 |
Table 2.
Daily deterministic parameters.
| Parameter | Electricity (i = E) | Natural Gas (i = G) | ||||||
|---|---|---|---|---|---|---|---|---|
| Estimate | Standard Error | t Statistic | p Value | Estimate | Standard Error | t Statistic | p Value | |
| −0.1288 | 0.0118 | −10.9400 | 0.0000 | −0.0251 | 0.0096 | −2.6160 | 0.0090 | |
| 0.0350 | 0.0116 | 3.0298 | 0.0025 | 0.1425 | 0.0094 | 15.1090 | 0.0000 | |
| −0.0007 | 0.0116 | −0.0577 | 0.9540 | 0.0059 | 0.0095 | 0.6269 | 0.5309 | |
| 0.0662 | 0.0115 | 5.7319 | 0.0000 | 0.0482 | 0.0094 | 5.1150 | 0.0000 | |
| 0.0728 | 0.0072 | 10.0460 | 0.0000 | −0.0211 | 0.0059 | −3.5707 | 0.0004 | |
| −0.1770 | 0.0177 | −9.9897 | 0.0000 | 0.0009 | 0.0145 | 0.0647 | 0.9485 | |
| 3.7569 | 0.0175 | 214.7300 | 0.0000 | 2.9727 | 0.0143 | 208.1300 | 0.0000 | |
Table 3.
Stochastic electricity parameters.
| Parameter | Electricity (i = E) | Natural Gas (i = G) | ||
|---|---|---|---|---|
| Estimate | 95% Confidence Interval | Estimate | 95% Confidence Interval | |
| 4.3161 | 2.2018–6.4304 | −0.1076 | −0.9206–0.7053 | |
| 56.3486 | 46.2128–66.4844 | 4.6273 | 1.4227–7.8319 | |
| −0.1347 | −0.2378–−0.0316 | - | - | |
| 1.8261 | 1.7266–1.9205 | 0.8288 | 0.7997–0.8500 | |
| 0.5462 | 0.4547–0.6244 | - | - | |
| 32.1534 | 23.7531–40.5537 | - | - | |
Table 4.
Mean and percentiles of monthly simulated electricity and natural gas prices.
| Month 2020 | Electricity (i = E) (EUR/MWh) | Natural Gas (i = G) (EUR/MWh) | ||||
|---|---|---|---|---|---|---|
| 10% Percentile | Mean | 90% Percentile | 10% Percentile | Mean | 90% Percentile | |
| January | 43.44 | 56.03 | 69.48 | 10.70 | 12.63 | 14.75 |
| February | 41.52 | 54.61 | 68.69 | 10.37 | 13.80 | 17.59 |
| March | 38.24 | 49.84 | 62.61 | 10.00 | 13.84 | 18.20 |
| April | 37.75 | 49.27 | 61.69 | 9.85 | 13.84 | 18.34 |
| May | 40.46 | 52.85 | 66.18 | 10.12 | 14.35 | 19.22 |
| June | 45.54 | 59.63 | 74.80 | 10.52 | 15.09 | 20.24 |
| January | 43.44 | 56.03 | 69.48 | 10.70 | 12.63 | 14.75 |
Table 5.
Actual prices for first half of 2019 and 2020 and expected prices for first half of 2020.
| Prices (EUR/MWh) | January | February | March | April | May | June | |
|---|---|---|---|---|---|---|---|
| Simulated 2020 | Electricity | 56.03 | 54.61 | 49.84 | 49.27 | 52.85 | 59.63 |
| Natural Gas | 12.63 | 13.80 | 13.84 | 13.84 | 14.35 | 15.09 | |
| Actual 2020 | Electricity | 41.10 | 35.87 | 27.74 | 17.65 | 21.25 | 30.62 |
| Natural Gas | 11.84 | 9.86 | 8.60 | 7.38 | 5.39 | 6.31 | |
| Actual 2020/Simulated | Electricity | −14.92 | −18.74 | −22.10 | −31.61 | −31.60 | −29.01 |
| Natural Gas | −0.79 | −3.94 | −5.24 | −6.46 | −8.96 | −8.78 | |
| % Variation | Electricity | −27% | −34% | −44% | −64% | −60% | −49% |
| Actual 2020/Simulated | Natural Gas | −6% | −29% | −38% | −47% | −62% | −58% |
| Actual 2019 | Electricity | 61.99 | 54.01 | 48.82 | 50.41 | 48.39 | 47.19 |
| Natural Gas | 25.19 | 20.94 | 18.06 | 16.69 | 14.57 | 13.36 | |
| Actual 2020/Actual 2019 | Electricity | −20.89 | −18.14 | −21.08 | −32.76 | −27.14 | −16.57 |
| Natural Gas | −13.35 | −11.08 | −9.46 | −9.31 | −9.18 | −7.05 | |
| % Variation | Electricity | −34% | −34% | −43% | −65% | −56% | −35% |
| Actual 2020/Actual 2019 | Natural Gas | −53% | −53% | −52% | −56% | −63% | −53% |
Table 6.
Actual SS for first half of 2019 and 2020 and expected SS for the first half-year of 2020.
| Prices (EUR/MWh) | January | February | March | April | May | June |
|---|---|---|---|---|---|---|
| Simulated 2020 SS | 31.97 | 28.32 | 23.48 | 22.91 | 25.52 | 21.89 |
| Actual 2020 SS | 18.56 | 17.08 | 11.35 | 3.59 | 11.00 | 18.60 |
| Actual 2019 SS | 14.00 | 14.12 | 14.42 | 18.62 | 20.63 | 21.75 |
| Actual 2020/Simulated | −13.41 | −11.24 | −12.13 | −19.32 | −14.52 | −3.29 |
| % Variation Actual 2020/Simulated | −42% | −40% | −52% | −84% | −57% | −15% |
| Actual 2020/Actual 2019 | 4.56 | 2.96 | −3.07 | −15.03 | −9.63 | −3.15 |
| % Variation Actual 2020/Actual 2019 | 33% | 21% | −21% | −81% | −47% | −14% |
Table 7.
Pearson correlation between European electricity prices (April 2020 to January 2021).
| France | Spain | Italy | Germany | Belgium | Netherlands | |
|---|---|---|---|---|---|---|
| France | 1.000 | - | - | - | - | - |
| Spain | 0.971 | 1.000 | - | - | - | - |
| Italy | 0.980 | 0.944 | 1.000 | - | - | - |
| Germany | 0.996 | 0.971 | 0.980 | 1.000 | - | - |
| Belgium | 0.995 | 0.967 | 0.984 | 0.992 | 1.000 | - |
| Netherlands | 0.984 | 0.949 | 0.991 | 0.987 | 0.992 | 1.000 |
Publisher’s Note: MDPI stays neutral with regard to jurisdictional claims in published maps and institutional affiliations. |
© 2021 by the author. Licensee MDPI, Basel, Switzerland. This article is an open access article distributed under the terms and conditions of the Creative Commons Attribution (CC BY) license (http://creativecommons.org/licenses/by/4.0/).
Share and Cite
MDPI and ACS Style
Abadie, L.M. Energy Market Prices in Times of COVID-19: The Case of Electricity and Natural Gas in Spain. Energies 2021, 14, 1632. https://0-doi-org.brum.beds.ac.uk/10.3390/en14061632
AMA Style
Abadie LM. Energy Market Prices in Times of COVID-19: The Case of Electricity and Natural Gas in Spain. Energies. 2021; 14(6):1632. https://0-doi-org.brum.beds.ac.uk/10.3390/en14061632
Chicago/Turabian StyleAbadie, Luis M. 2021. "Energy Market Prices in Times of COVID-19: The Case of Electricity and Natural Gas in Spain" Energies 14, no. 6: 1632. https://0-doi-org.brum.beds.ac.uk/10.3390/en14061632
Note that from the first issue of 2016, this journal uses article numbers instead of page numbers. See further details here.