
Optimization of 5G Networks for Smart Logistics


Department of Communications Engineering, University of Málaga, 29071 Málaga, Spain
*
Author to whom correspondence should be addressed.
Energies 2021, 14(6), 1758; https://0-doi-org.brum.beds.ac.uk/10.3390/en14061758
Submission received: 15 February 2021
/
Revised: 8 March 2021
/
Accepted: 12 March 2021
/
Published: 22 March 2021
(This article belongs to the Special Issue 5G Wireless Systems for Industry 4.0)
Abstract
:Industry 4.0 is generalizing the use of wireless connectivity in manufacturing and logistics. Specifically, in Smart Logistics, novel Industry 4.0 technologies are used to enable agile supply chains, with reduced management, energy and storage costs. Cellular networks allow connectivity throughout all the scenarios where logistics processes take place, each having their own challenges. This paper explores such scenarios and challenges, and proposes 5G technology as a global unified connectivity solution. Moreover, this paper proposes a system for exploiting the application-specific optimization capabilities of 5G networks to better cater for the needs of Smart Logistics. An application traffic modeling process is proposed, along with a proactive approach to network optimization that can improve the Quality of Service and reduce connectivity costs.
1. Introduction
In the last few years, consumer expectations have changed thanks to the influence that technologies such as the Internet and mobile communications have had over their daily lives. Consumers have gotten used to the immediacy and personalization of the experience offered by such technologies, and these demands have permeated into manufactured goods, such as clothing, electronic gadgets, vehicles, furniture, etc. Novel user expectations also change the way goods are sold and distributed; users are increasingly buying and selling products online in small batches, and expecting shipping delays of a few days or even hours. This forces logistics supply chains to be very flexible and efficient. With increasing costs and a high demand for low-emissions processes, energy is also a challenging factor in logistics [1,2].
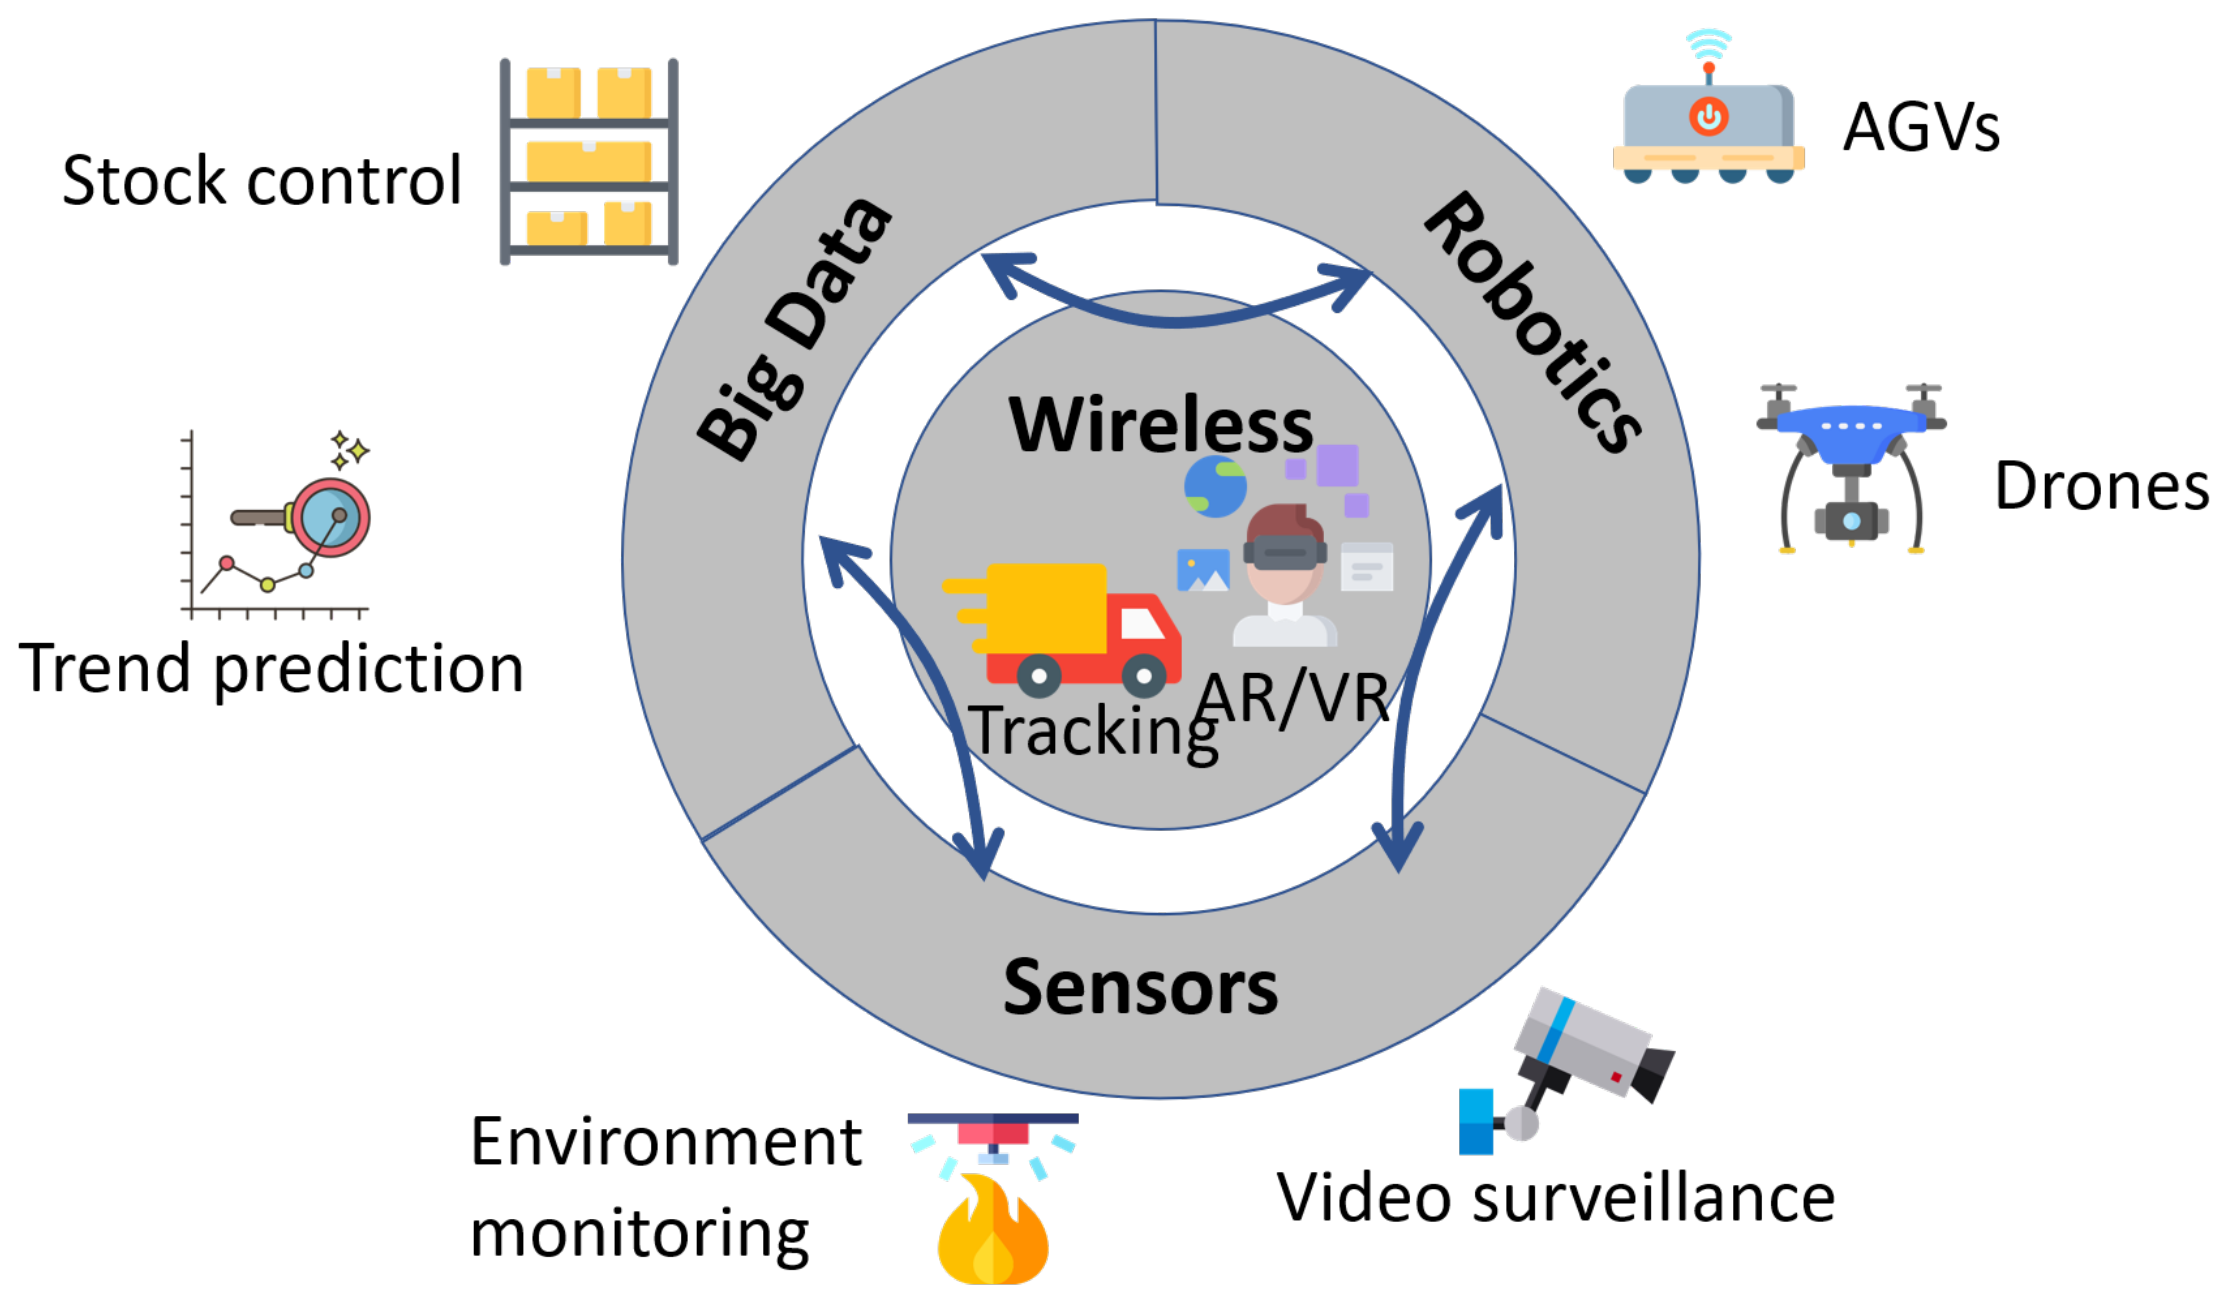
As a result, the whole manufacturing industry, including its logistics, is shifting towards a more flexible and adaptable paradigm, giving place to Industry 4.0 [3]. Industry 4.0 is the fourth industrial revolution, and it originates as a response to the shift in consumer expectations. To improve the flexibility of production and distribution processes, there are four main enabler technologies that are in the core of Industry 4.0:
- Big Data [4,5]: data analytics is a fundamental building block that serves, among other ends, for identifying consumer needs, market trends, or technical issues within the production and logistics machinery. Technologies such as cloud computing [6] reduce costs by outsourcing and optimizing computational resources.
- Wireless connectivity [7,8]: connectivity in industrial and logistics equipment is used for interconnecting machines, coordinating production through Enterprise Resource Planning (ERP) systems, monitoring, etc. Wireless connectivity, as opposed to wired connectivity [9], reduces deployment and reorganization costs, improving flexibility.
- Low cost sensors [10,11]: in the last few years, the drop in the price of connected sensors has enabled the collection of massive data to track products, or monitor processes, machinery, and environmental conditions. These deployments allow for a higher level of detail in the information available on the processes.
- Robotics [12,13]: the development of robots that are increasingly capable and autonomous allows for the automation of tasks that are too repetitive, complex or risky for human operators, improving their work conditions and the economical feasibility of industrial and logistics processes. Robots also lend themselves to quick reprogramming, allowing agile changes in production.
Figure 1 shows the dependencies among the different Industry 4.0 technologies.
In an industry that is highly dependent on data, Machine-Type Communications (MTC) are present in many devices and support a wide range of processes, giving place to the Industrial Internet of Things (IIoT) [14]. The requirements of IIoT technologies in industrial scenarios are very challenging. Some applications have very restrictive latency and reliability requirements, are very bandwidth demanding, are located in disadvantageous locations or have massive spatial densities. As a result, the capabilities of current wireless technologies, such as standard WiFi [15] or LTE [16] are insufficient for these requirements. The development of 5G has taken MTC as one of its main use-cases, taking into account the requirements of different types of applications.
5G is a technology that has mainly been developed around verticals, such as vehicular communications, entertainment or Industry 4.0. Smart-Logistics [17]) are usually considered a part of Industry 4.0; but there are specific differences with the usual Industry 4.0 scenario: the Factory of the Future [18,19]. As compiled in [20], there are several different scenarios in Smart Logistics: freighting, delivery, warehousing, etc. To the best of the authors’ knowledge, there are no studies covering the use of 5G for logistics. In [20], a literature review of IIoT and Smart Logistics is done, showing that there are some open issues with respect to technological limitations of current wireless technologies, and it is concluded that there is a need for development work in 5G to better support Smart Logistics.
The objective of this paper is to respond to this need proposing a management system for 5G networks that can be used more efficiently for an IIoT-enabled supply chain. This system is based on a modeling step that quantifies the requirements of the applications, which must be extracted and taken into account in the optimization of the network. This paper proposes a methodology to extract these requirements and translate them into connectivity requirements, which can be used to adapt and optimize the configuration of the network though the proposed system. At the same time, the limitations of 5G networks must be considered and mitigated in a way such that the requirements of the applications are fulfilled. 5G and Smart Logistics are two very important research lines, both from the academical and from the market point of view. Therefore, this paper studies the particularities of connectivity in Smart Logistics applications and sets the bases of 5G network optimization for this vertical.
The rest of the paper is organized as follows: in Section 2, a review of existing solutions for wireless connectivity in Industry 4.0 is done. In Section 3, the problem of providing connectivity for Smart Logistics is explored. In Section 4, the proposed methodology for application requirement extraction and the system for the management of the network are described in detail. In Section 5, the proposed solution is discussed, weighting its advantages and costs, and comparing it with potential alternatives. Finally, in Section 6, the conclusions are summarized.
2. Related Works
2.1. Wireless Connectivity in Industrial Environments
Industry is a very challenging environment for wireless connectivity. This is mainly due to three factors:
- Harsh environments for radio propagation due to the presence of large metallic machines within crowded spaces in places such as factories or distribution centers.
- High traffic coming from machinery, sensors, etc., which may overload the network and be a source of interference.
- Restrictive requirements from the applications, which increase the requirements for network resources.
Additionally, there are other general requirements that stem from the business logic, such as security, price, etc. that highly impact the design of wireless networks. In the case of logistics, one important aspect is the scope of the network. While Local Area Networks (LANs), which have a scope of up to several hundred meters, are valid for covering factories or distribution centers, to cover a full supply chain, Wide Area Networks (WANs) are required. WANs can cover large territories, cellular networks being the best example.
The most common LAN technology, the IEEE802.11 family [21,22], is used in some industrial deployments. The main advantage for its usage is the low price and high availability of components and the broad available information on its operation. Some protocols based on IEEE802.15.4 have been adopted in industrial networks, such as Zigbee [23], WirelessHART [24], WIA-PA [25], and ISA100.11a [26]. These networks are mainly designed for mesh connectivity of sensors with low data rates and high resiliency. IETF 6LoWPAN [27] is also based on IEEE802.15.4, and optimized for low power devices. All these technologies are LANs. In the WAN field, protocols such as LoRaWAN [28] and SigFox [29] offer connectivity with low bandwidths for power limited devices. Cellular networks, such as GSM/GPRS [30], and LTE [31], have been used in certain applications, such as sensors [32] and robotics [33]. Nevertheless, these cellular technologies were not designed specifically for IIoT. Cellular technologies such as Cat-M1, Nb-IoT, and EC-GSM [34] were designed for these devices, taking into account energy saving considerations and increased reliability and coverage.
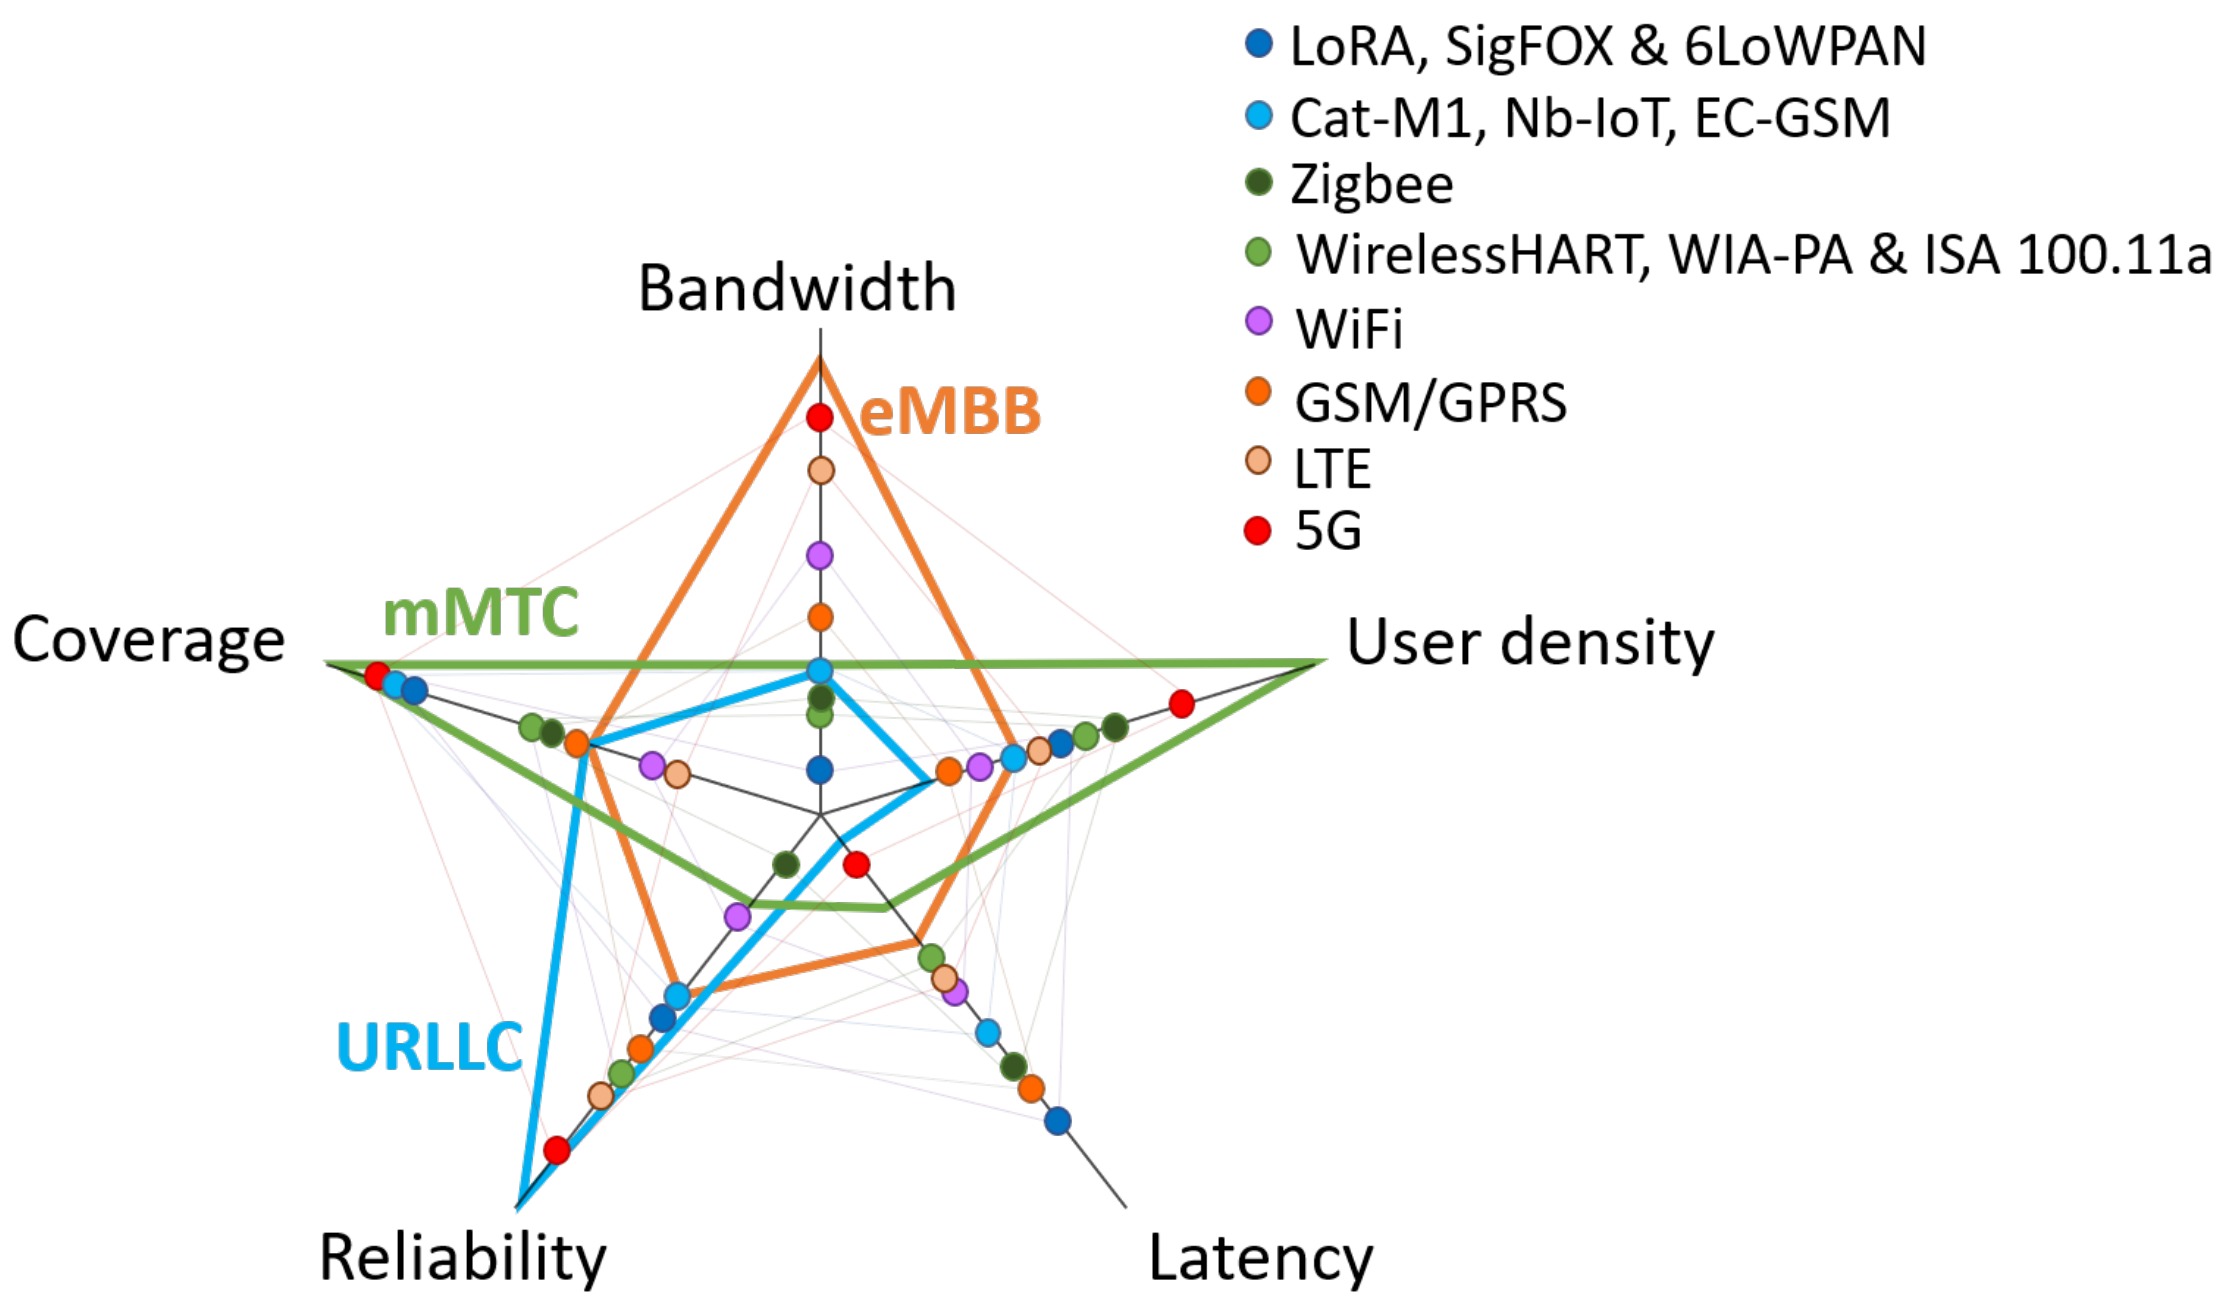
Although all these technologies are used, as summarized in Figure 2, their capabilities are insufficient for some novel Industry 4.0 applications, such as Augmented Reality (AR) [35], Automated Guided Vehicles (AGVs) [36], etc. Technologies that have been designed for low-power IoT, such as LoRA, SigFox, 6LoWPAN, Cat-M1, Nb-IoT and EC-GSM, fulfill the needs of coverage (in difficult places such as underground or inside containers) of some applications, but cannot cope with a high user density. LTE was designed as a broadband access technology, although its highest data rate (100 Mbps in the downlink, 50 Mbps in the uplink) is not high enough for the most extreme industrial applications. No current technology, apart from 5G, can cope with the latency and reliability requirements of certain applications such as closed loop control or safety systems. To support novel, highly demanding applications, research for future 5G technologies has Industry 4.0 as one of the main verticals [37]. Consequently, novel solutions for optimizing the quality of service [38,39] for specific IIoT applications, as well as energy consumption [40] have been published.
2.2. 5G and Machine-Type Communications
There are many applications that rely on wireless connectivity in industry, logistics and all the other possible scenarios, each one of them having specific features (such as traffic arrival rate) and requirements (such as latency). Networks cannot be optimized for each and every possible combination of potential features and requirements. As a consequence, requirements are usually simplified and grouped into three traffic profiles [41] (also represented in Figure 2):
- Enhanced Mobile Broadband (eMBB): Broadband communications, with not very restrictive reliability and latency requirements. This traffic profile represents applications such as internet browsing or the transmission of multimedia content. These are the traditional traffic profiles for end users. In industrial applications, it covers applications such as video surveillance or AR [35].
Given the high criticality of messages in URLLC, novel techniques usually involve an assignation of extra resources. For example, in the new 5G multi-connectivity feature [46], resources from one or more additional gNBs (secondaries) are assigned simultaneously to a single device in addition to its main (primary) gNB, offering a higher redundancy and reducing the probability of packet loss. Multi-connectivity comes at the cost of resources that must be reclaimed from other users in the network. Selecting the secondary gNBs is still an open research issue. To reduce the latency, techniques such as grant-free transmission [47] reduce access times. This technique is efficient under low traffic loads; but it may cause collisions under medium and high loads. To avoid packet loss in collisions, grant-free transmission is combined with transmission repetitions, although collisions nullify the advantage of latency reduction. All of these techniques affect the Radio Access Network (RAN). To complement these techniques, URLLC messages are given a higher priority in the trunk network [48] and higher layer technologies such as Mobile Edge Computing (MEC) [49] are used. In MEC, the remote server “approaches” the final user by running an instance within the gNB using cloud computing techniques, achieving a reduction in network latency by reducing the distance the information must travel.
Multi-connectivity is also used to provide more broadband channels and increase the bandwidth for eMBB applications [50]. MIMO techniques have also been studied [51] for eMBB, achieving the transmission of several spatially multiplexed channels with antenna arrays. Both multi-connectivity and MIMO achieve a higher aggregated data transmission rate, at the cost of a higher energy consumption and a reduction of available resources for other users.
For mMTC, bandwidth reduction is one of the main solutions. It has several advantages; in the first place, it allows a higher number of channels; in the second place, narrowband transmission increases coverage; and, finally, it reduces the energy consumption in the devices. This is the approach used in currently deployed technologies such as Cat-M1, Nb-IoT, and EC-GSM [34]. On the other hand, narrowband carriers have lower data rates. Other approaches to mMTC that have been proposed are based on Non-Orthogonal Multiple Access (NOMA) [52], connectionless access [53] or waveforms that eliminate the need for synchronization [54]. Each of these techniques also has some downsides; for instance, NOMA increases the device complexity and power consumption.
Each of the three described traffic profiles have very distinct requirements and the techniques that optimize the network are different and often incompatible. To some extent, it can be considered that each traffic profile requires a separate network. 5G is the only WAN network that can support all of these profiles by means of Network Slicing (NS) [41,55,56]. NS allows an efficient division of resources among subnetworks with very different configurations that may act as independent networks. NS can be used to provide services to the three traffic profiles without the need of deploying additional resources. NS is dynamic, so there are no static divisions and changes can be done quickly to adapt to changing conditions. With this mechanism, the problem to solve is to decide what amount of each resource should be assigned to each slice. A possible approach to this problem is to use prediction algorithms [57] that allow for knowing in advance how the traffic will be distributed among the three basic profiles. This knowledge must also take into account the specific aspects of the scenario and its challenges and limitations, and currently there are no studies following this line for logistics.
3. Problem Formulation
3.1. Smart Logistics
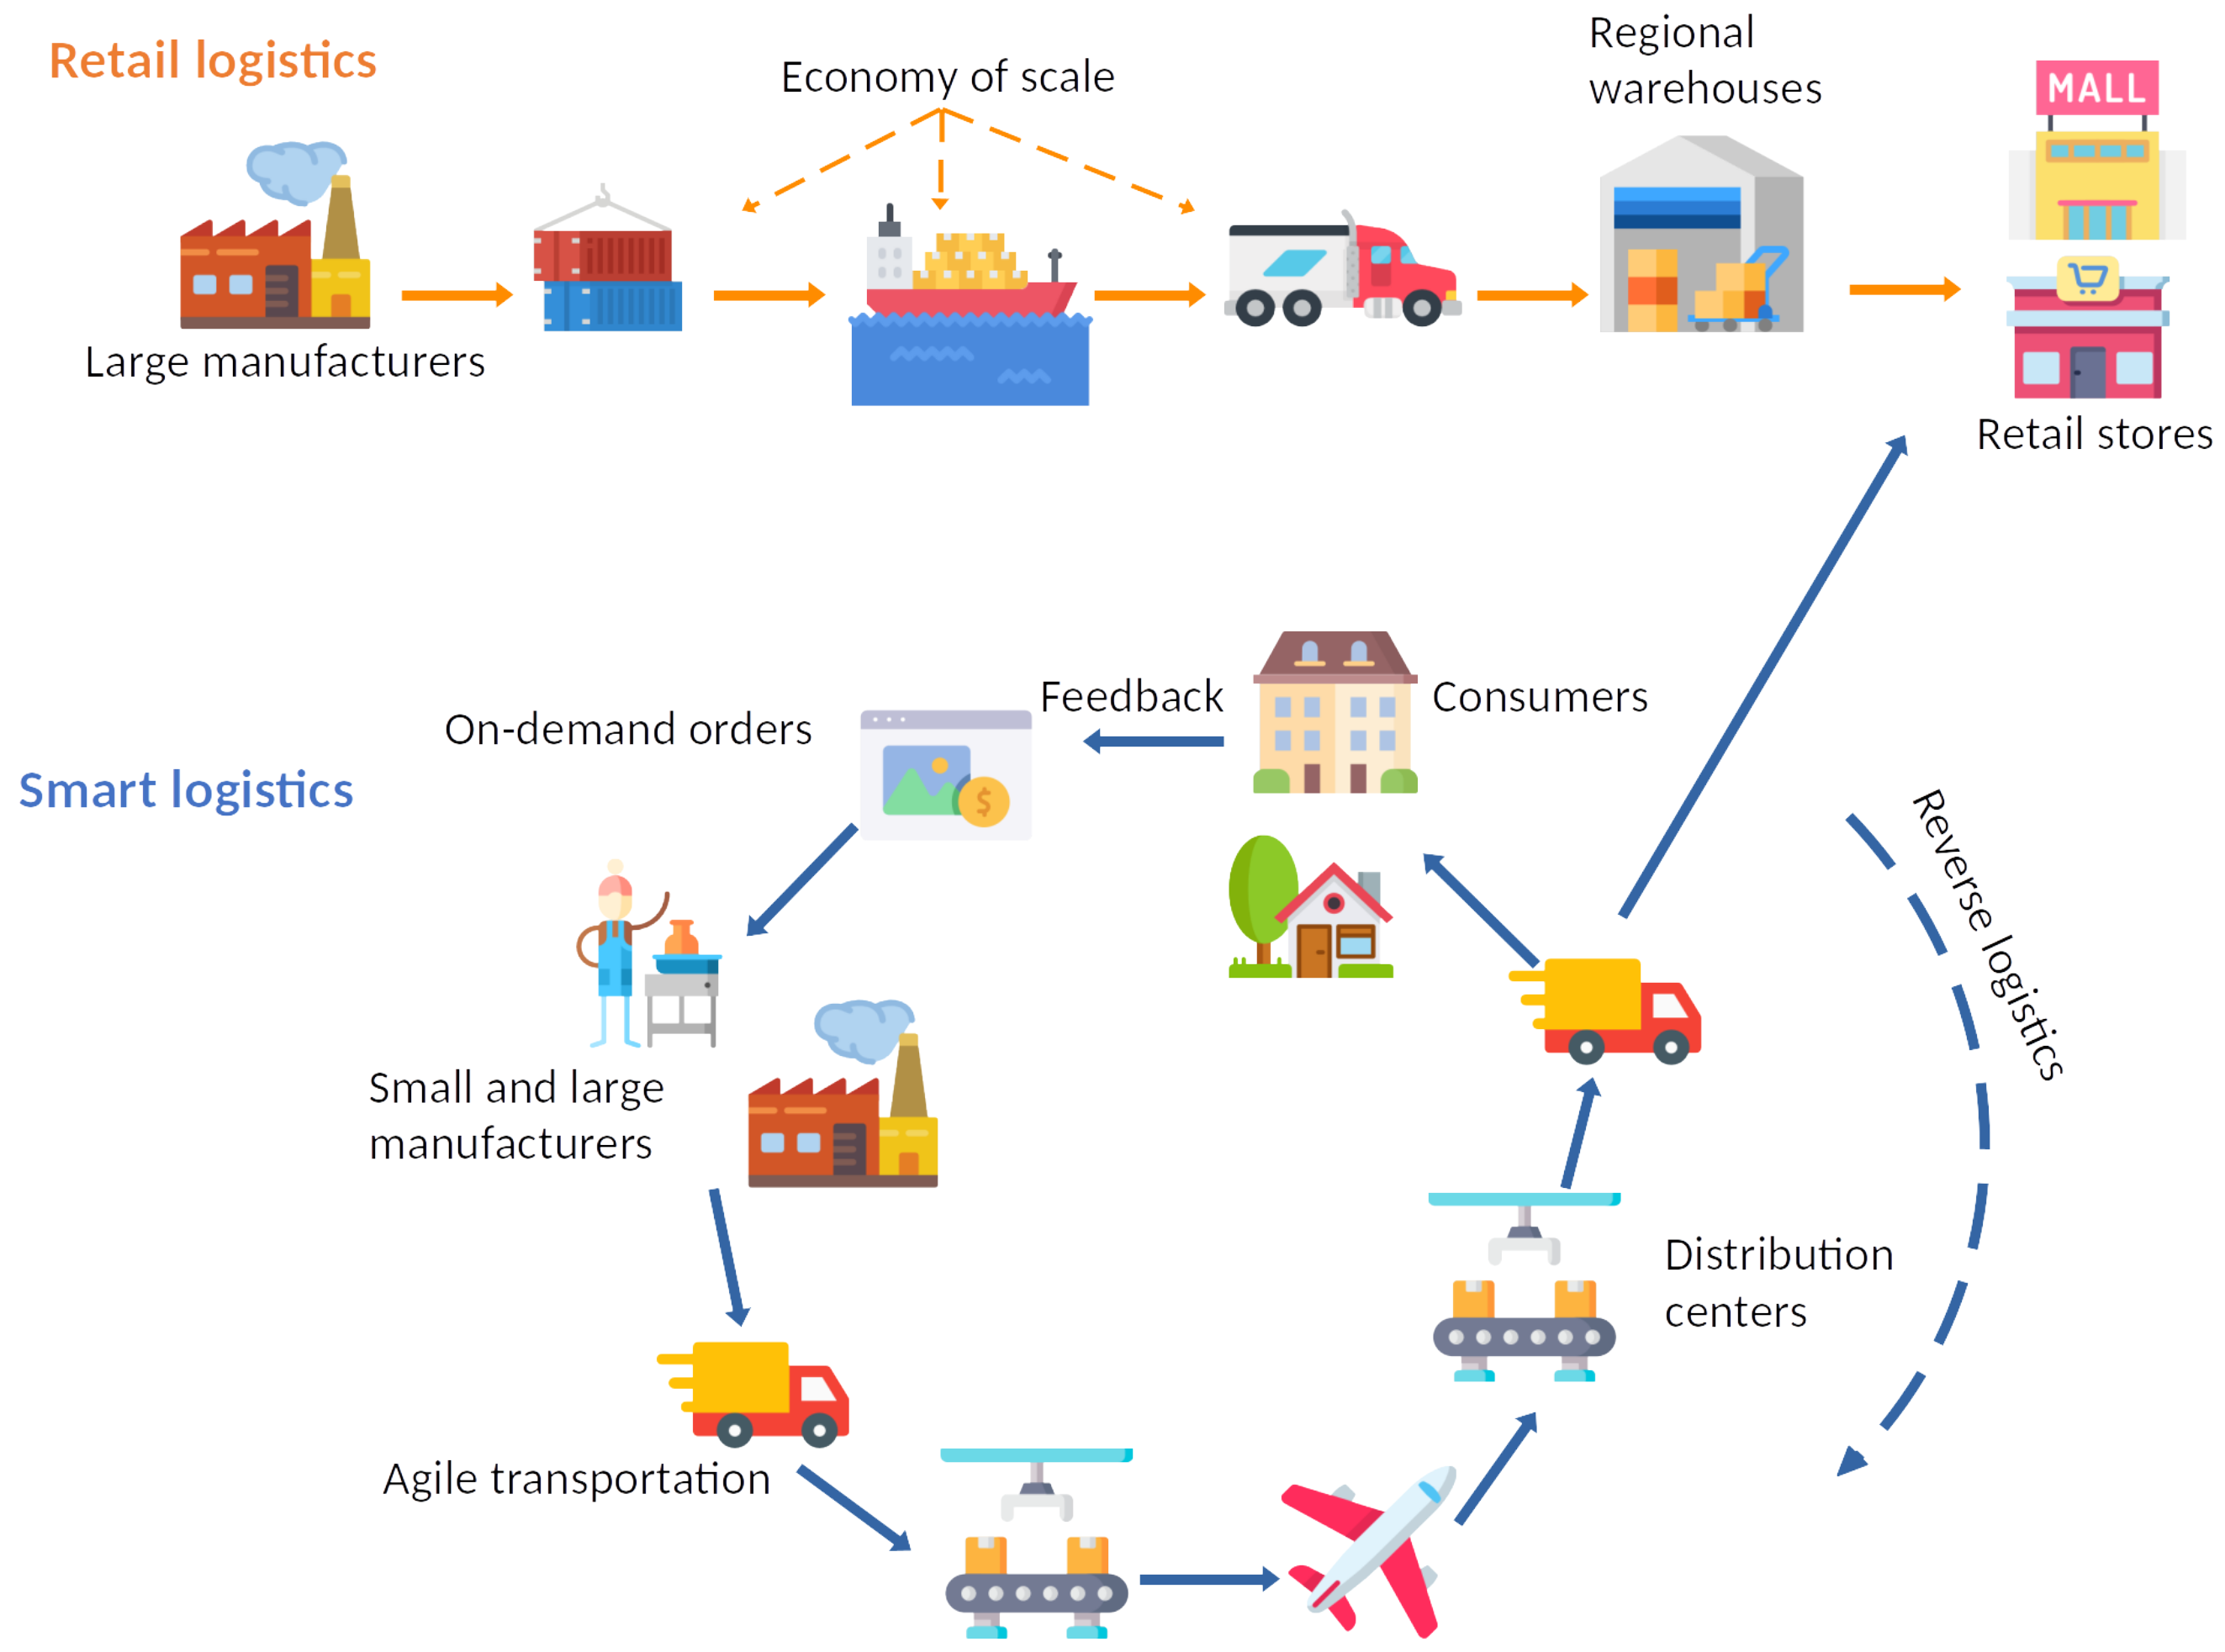
To better understand the communication challenges in logistics, it is important to differentiate how Smart Logistics is evolving and what are its main characteristics. The difference between Smart Logistics and traditional retail logistics is summarized in Figure 3.
One of the basic assumptions of Industry 4.0 is that consumers demand increasingly customized goods [58]. In the line of this customization of demand, users turn up to online stores to find goods from remote locations which are not within reach in nearby retail stores [59]. Consumers of a single product may be distributed very sparsely over the whole world, and sales may occur at irregular intervals. Product sellers, on the other hand, may be large manufacturers or small producers that fabricate and/or ship their products on demand, instead of producing batches at a regular and predictable rate. On top of this, consumers also need to have a reverse logistics in place to return products if needed. Therefore, the most outstanding feature of the online market is the sparsity of the demand and the shipping of goods in space and time.
In conventional retail logistics, on the other hand, production and shipping is done in large batches, transported to regional warehouses, where they are stored until they are delivered to retail stores in smaller batches. Retail stores pull the demand in a more or less predictable way, by observing the rate of sales and projecting the demand in the future [60,61]. This scheme works well for staple products, which do not change over time, have a high and stable demand and their consumers are concentrated in a region. Economy of scale helps in reducing the costs of production, transportation, storage, and sale of these products.
However, this scheme fails for the earlier described customized products, or products that sell slowly. Since their sales are not regular, they cannot be stored in warehouses; on the one hand, if the sale does not occur at a high enough rate their storage would imply high costs [62]; on the other hand, if the demand spikes, the lack of stock may produce a shortage. In addition, processes such as handling, palletizing, transporting, etc. of custom or small run products increases the complexity of the logistics. Another challenge for traditional logistics is the occurrence of eventualities [63,64] that change rapidly the demand of certain products that require changes in the warehouse floor plan or transportation schedule. Therefore, the challenges in current logistics revolve around the transit stock that is moved along the supply chain, its sparsity, its needs, and its trends (including spikes in demands of otherwise stable products [65]). Some factors that greatly influence the transit stock are:
- Market trends: consumption of certain products is subject to market trends that stem from advertising and marketing campaigns. Fashion in clothing industry is a common example, while, more recently, electronic gadgets also produce high sale spikes that stress logistics.
- Events: disasters such as pandemics, heat waves or economical recessions greatly modify consumer priorities, shifting demand towards some specific items or reducing their expenses. Cultural events, such as Olympics or movie releases, may also increase the demand for related products, generate new markets, and revive seasonal trends.
- Discounts: discounts on specific products or seasonal sales also cause peaks of demand that need to be addressed by logistics.
All the challenges shown above put a pressure on supply chains that requires a higher flexibility for an efficient and economically feasible operation. Supply chains must be prepared for quickly changing parameters. In the case of customized, small run products that imply the transport of small batches over large distances, supply chains must be able to act more like postal services rather than traditional retail logistics. Smart Logistics adopts Industry 4.0 principles to add flexibility to easily adapt to changes both at large and small volumes of moving stock. In Smart Logistics, warehouses are switched for distribution centers [66], where small batches of products (or even individual units) are received, stored for very short periods of time (days or hours), and redirected to the next distribution center. Distribution centers, hosting many Industry 4.0 applications, act more like advanced post offices, rather than long-term warehouses.
3.2. Industry 4.0 Applications in Logistics
Distribution centers are the main nodes in the Smart Logistics supply chains, and concentrate most of the decision-making, parcel redirection, registering, etc. In parallel with the flow of products, in Smart Logistics, there is a flow of data that covers operations in the distribution centers, but also manufacturing processes in the producers, sale process on the buyer side, transportation information, etc.
Some Industry 4.0 applications in logistics and their wireless communications implications are:
- Object tracking [43] from fabrication to delivery is done with the use of smart tags. With each parcel having a tag, within a distribution center, this corresponds to an mMTC profile, where a very large number of devices transmit short packets with very loose latency and bandwidth requirements. Smart tags also tend to be in places where coverage is low due to harsh propagation conditions.
- AGVs and drones [36,67] play a major role in moving objects within a distribution center. The objects may be parcels [68], pallets [69], or even tools to assist the workers [70]. These vehicles may also be used for other purposes such as surveillance [71]. These devices combine aspects of eMBB (for video feeds) and URLLC (for collision avoidance or remote driving commands).
- Remote assistance for employees through AR [72], where real-time video is enriched with computer generated images, and with other functions, such as object recognition. It combines the eMBB (for video feeds) and URLLC (for updating virtual objects without causing dizziness) traffic profiles.
- Monitoring and control of machines and robots, such as palletization machines [73]. To ensure accuracy and safety, some messages need URLLC connectivity, while other data sources may adjust more to mMTC, such as non-critical sensors.
- Video surveillance systems to monitor possible intrusions or detect hazards such as fires [74]. While most of the time these systems will produce eMBB traffic, alerts may need URLLC service.
- Ambient sensors [42] to monitor the conditions of the distribution center, transportation containers, etc.
All these applications have traffic that can be classified in one of the three main traffic profiles described in Section 2.2. This may cause conflicting requirements that can be solved through the use of Network Slicing (NS). Since the activity in the different locations of a supply chain (e.g., distribution centers) varies through time in the short term (because of the hour of the day or the influx of parcels) and in the long term (marketing trends or changes in the floor plan), the traffic load that each gNB may also support changes. Not only does the volume of traffic change, but also the proportion of traffic of each kind.
3.3. Communications Scenarios in Logistics
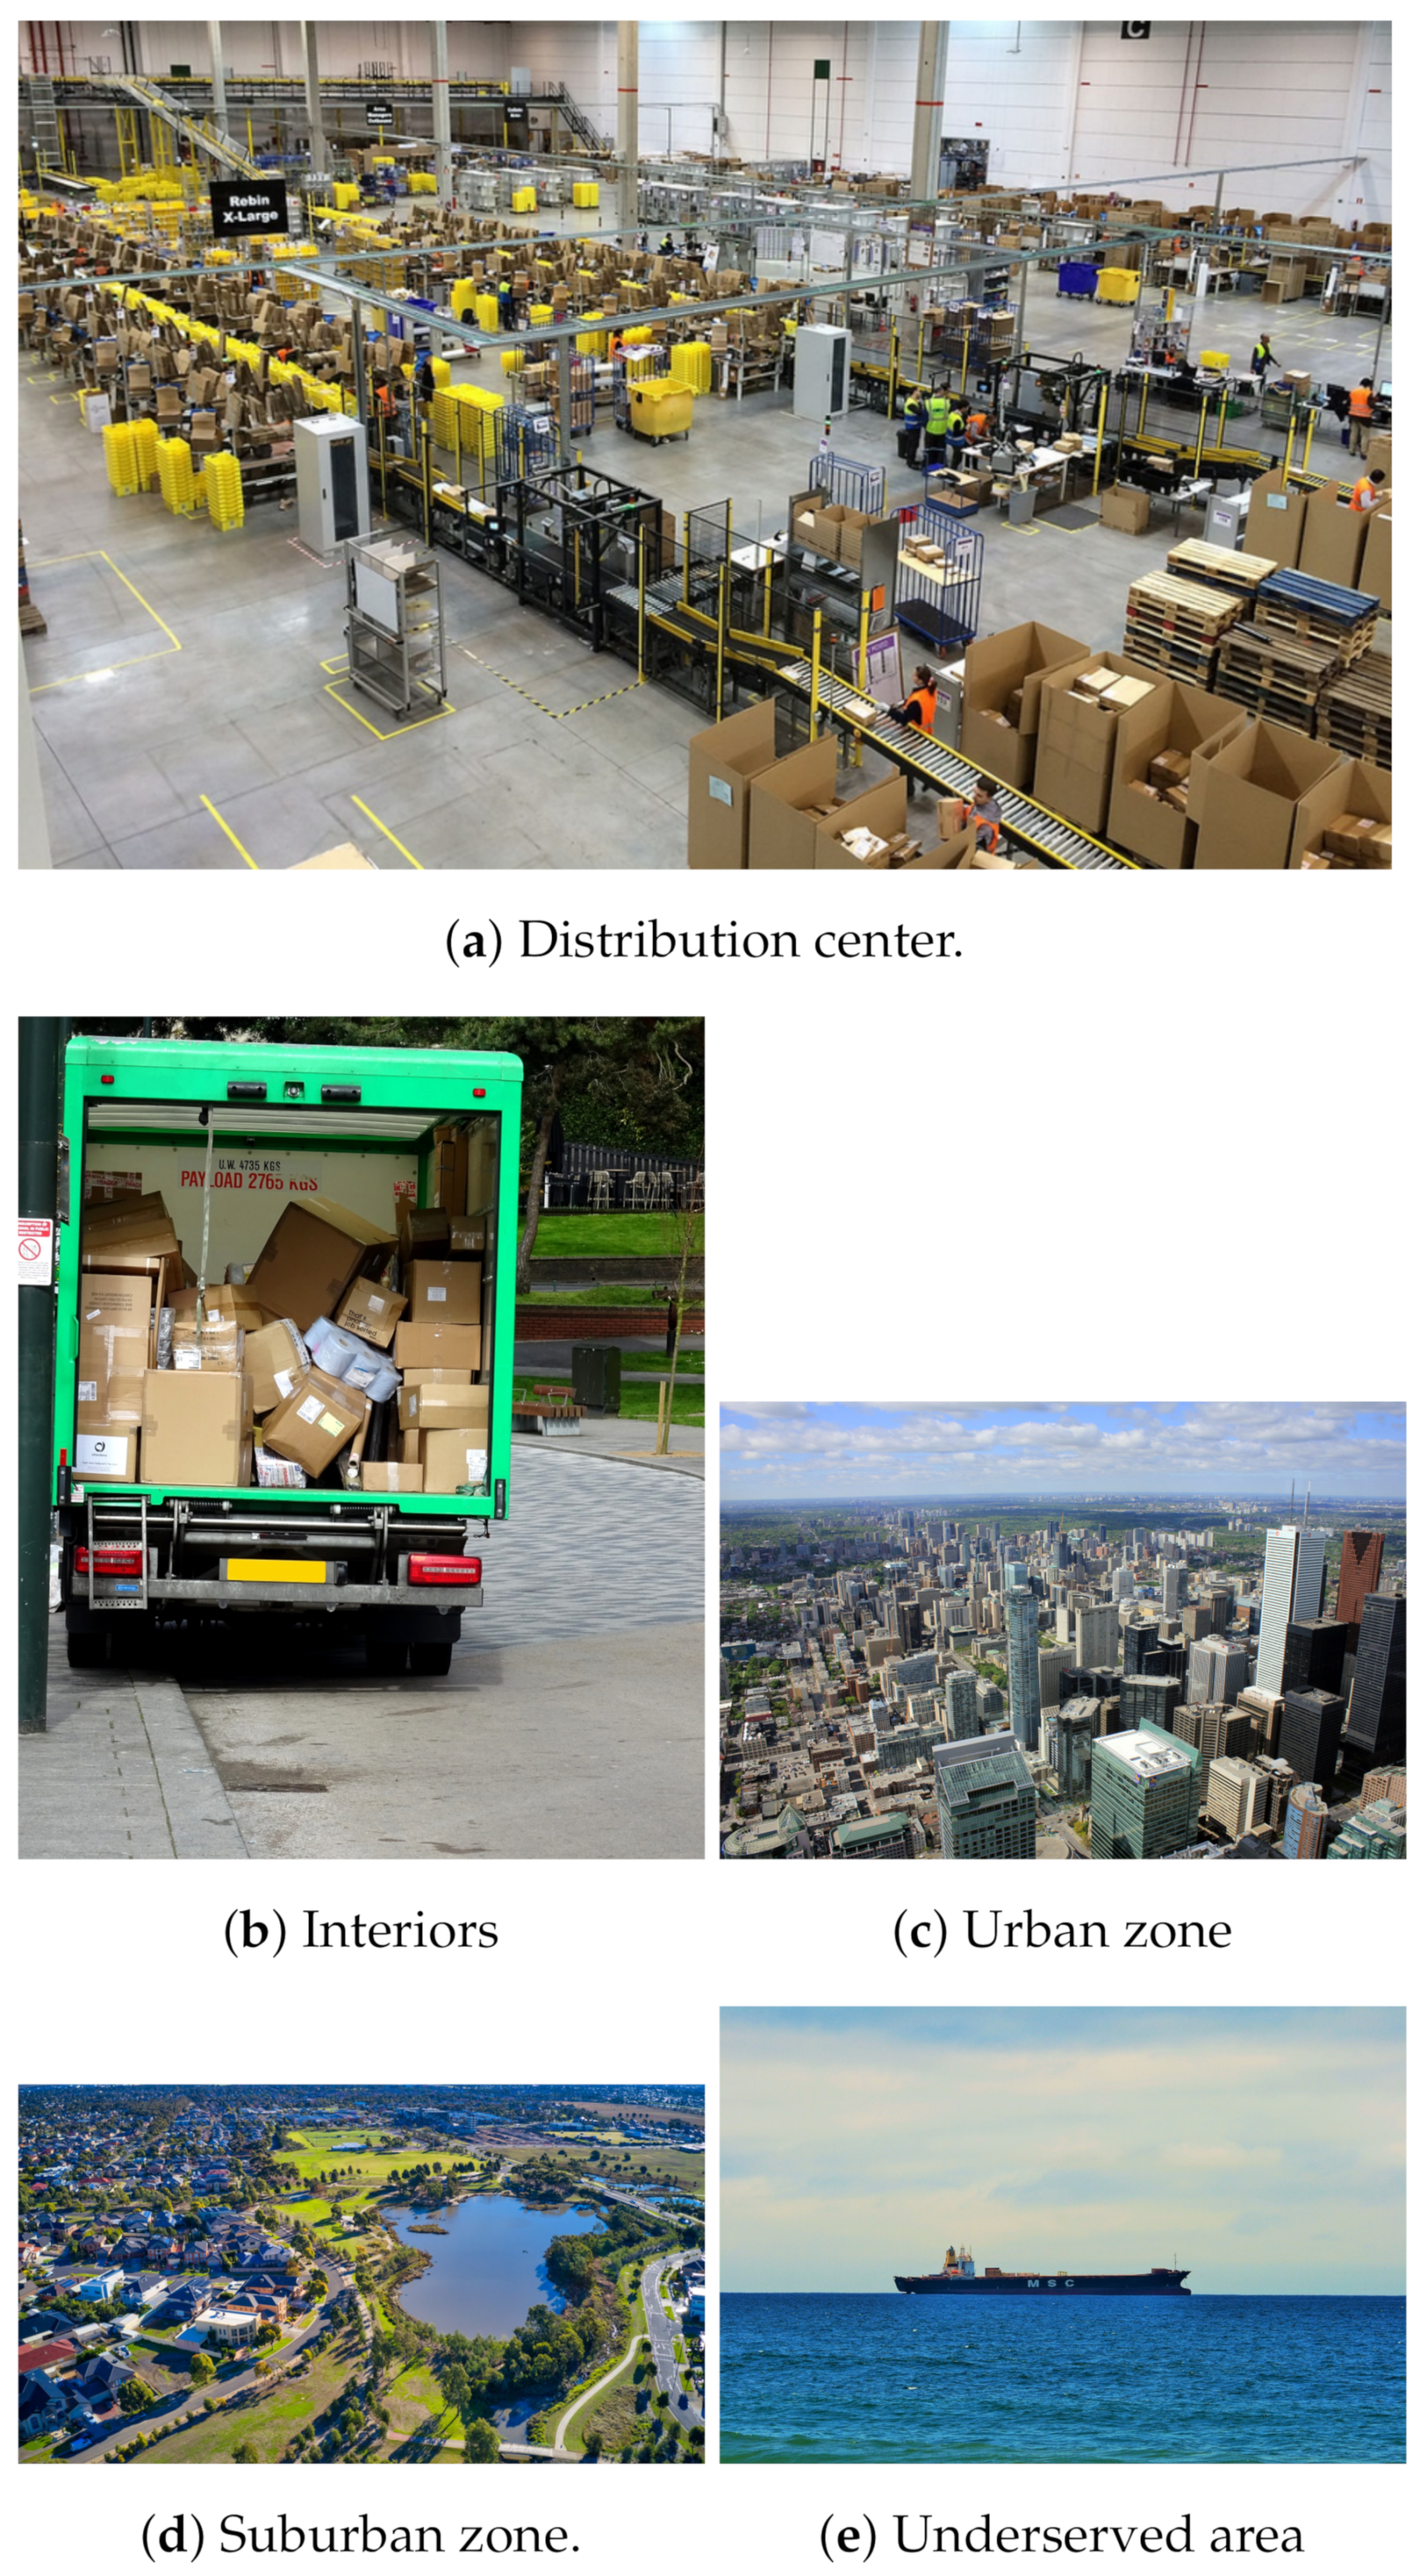
Apart from the applications, the environment where they are used also affects the performance of wireless networks. Due to their nature, logistic processes occur in very diverse environments. The main scenarios, represented in Figure 4, are:
- Distribution centers are the main nodes in the supply chain. Normally, they are contained within large, diaphanous buildings. Inside these buildings, large machines, such as conveyor systems and packing machines (in the foreground in Figure 4a), make up a challenging environment for radio propagation. Large metallic structures cause shadowing and reflections [75]. Another challenge in distribution centers is interference from a high number of wireless devices packed in a small area.
- Interior spaces are very varied in logistics, ranging from the interior of buildings, where delivery is done, to tight spaces such as shipping containers and delivery vehicles (as shown in Figure 4b). The difficulty of communications [76,77] depends on the type of container, the materials, and the location of gNBs and the composition of the surrounding packages. Within some buildings and vehicles, interior cells may improve connectivity.
- Urban areas (Figure 4c) within cities where goods are collected or delivered. The difficulty of propagation depends on factors such as average building height and density [78,79]. The main challenge in urban areas is the background traffic from many other devices, both from MTC and end-user terminals. To compensate this traffic, operators usually have more dense gNB deployments in cities to provide a better service. In areas with tall buildings, as shown in Figure 4c, propagation is more challenging due to urban canyons, and a smarter radio planning is required [80].
- Suburban areas (Figure 4d) [81,82] correspond to either industrial or residential areas. In these areas, propagation is easier due to the lack of tall buildings and the sparsity of connected devices. Cellular networks usually have a lower density of gNBs in these areas, and line-of-site propagation is common.
- Underserved areas, such as roads far from settlements or even high seas (as shown in Figure 4e) or airline corridors, are in locations where there is no commercial terrestrial wireless coverage due to practical or economical reasons. In these cases, the only connectivity available is satellite communications [83].
Apart from the effects on propagation, these scenarios have implications on the kind of network and its ownership. In distribution centers, LANs can be deployed and owned by the logistics operator, while, in exteriors, although LANs can be used (within delivery vehicles, for instance), they still need some kind of WAN backhaul owned by a network operator. Regarding ownership, it has the advantage of data confidentiality, but it comes at the cost of network deployment and maintenance (including security). On the other hand, an operator-managed network has the advantage of a lower cost and a higher flexibility, since resources can be assigned dynamically. Moreover, only a cellular network managed by a licensed operator can act as a WAN and cover the whole territory.
4. Proposed System
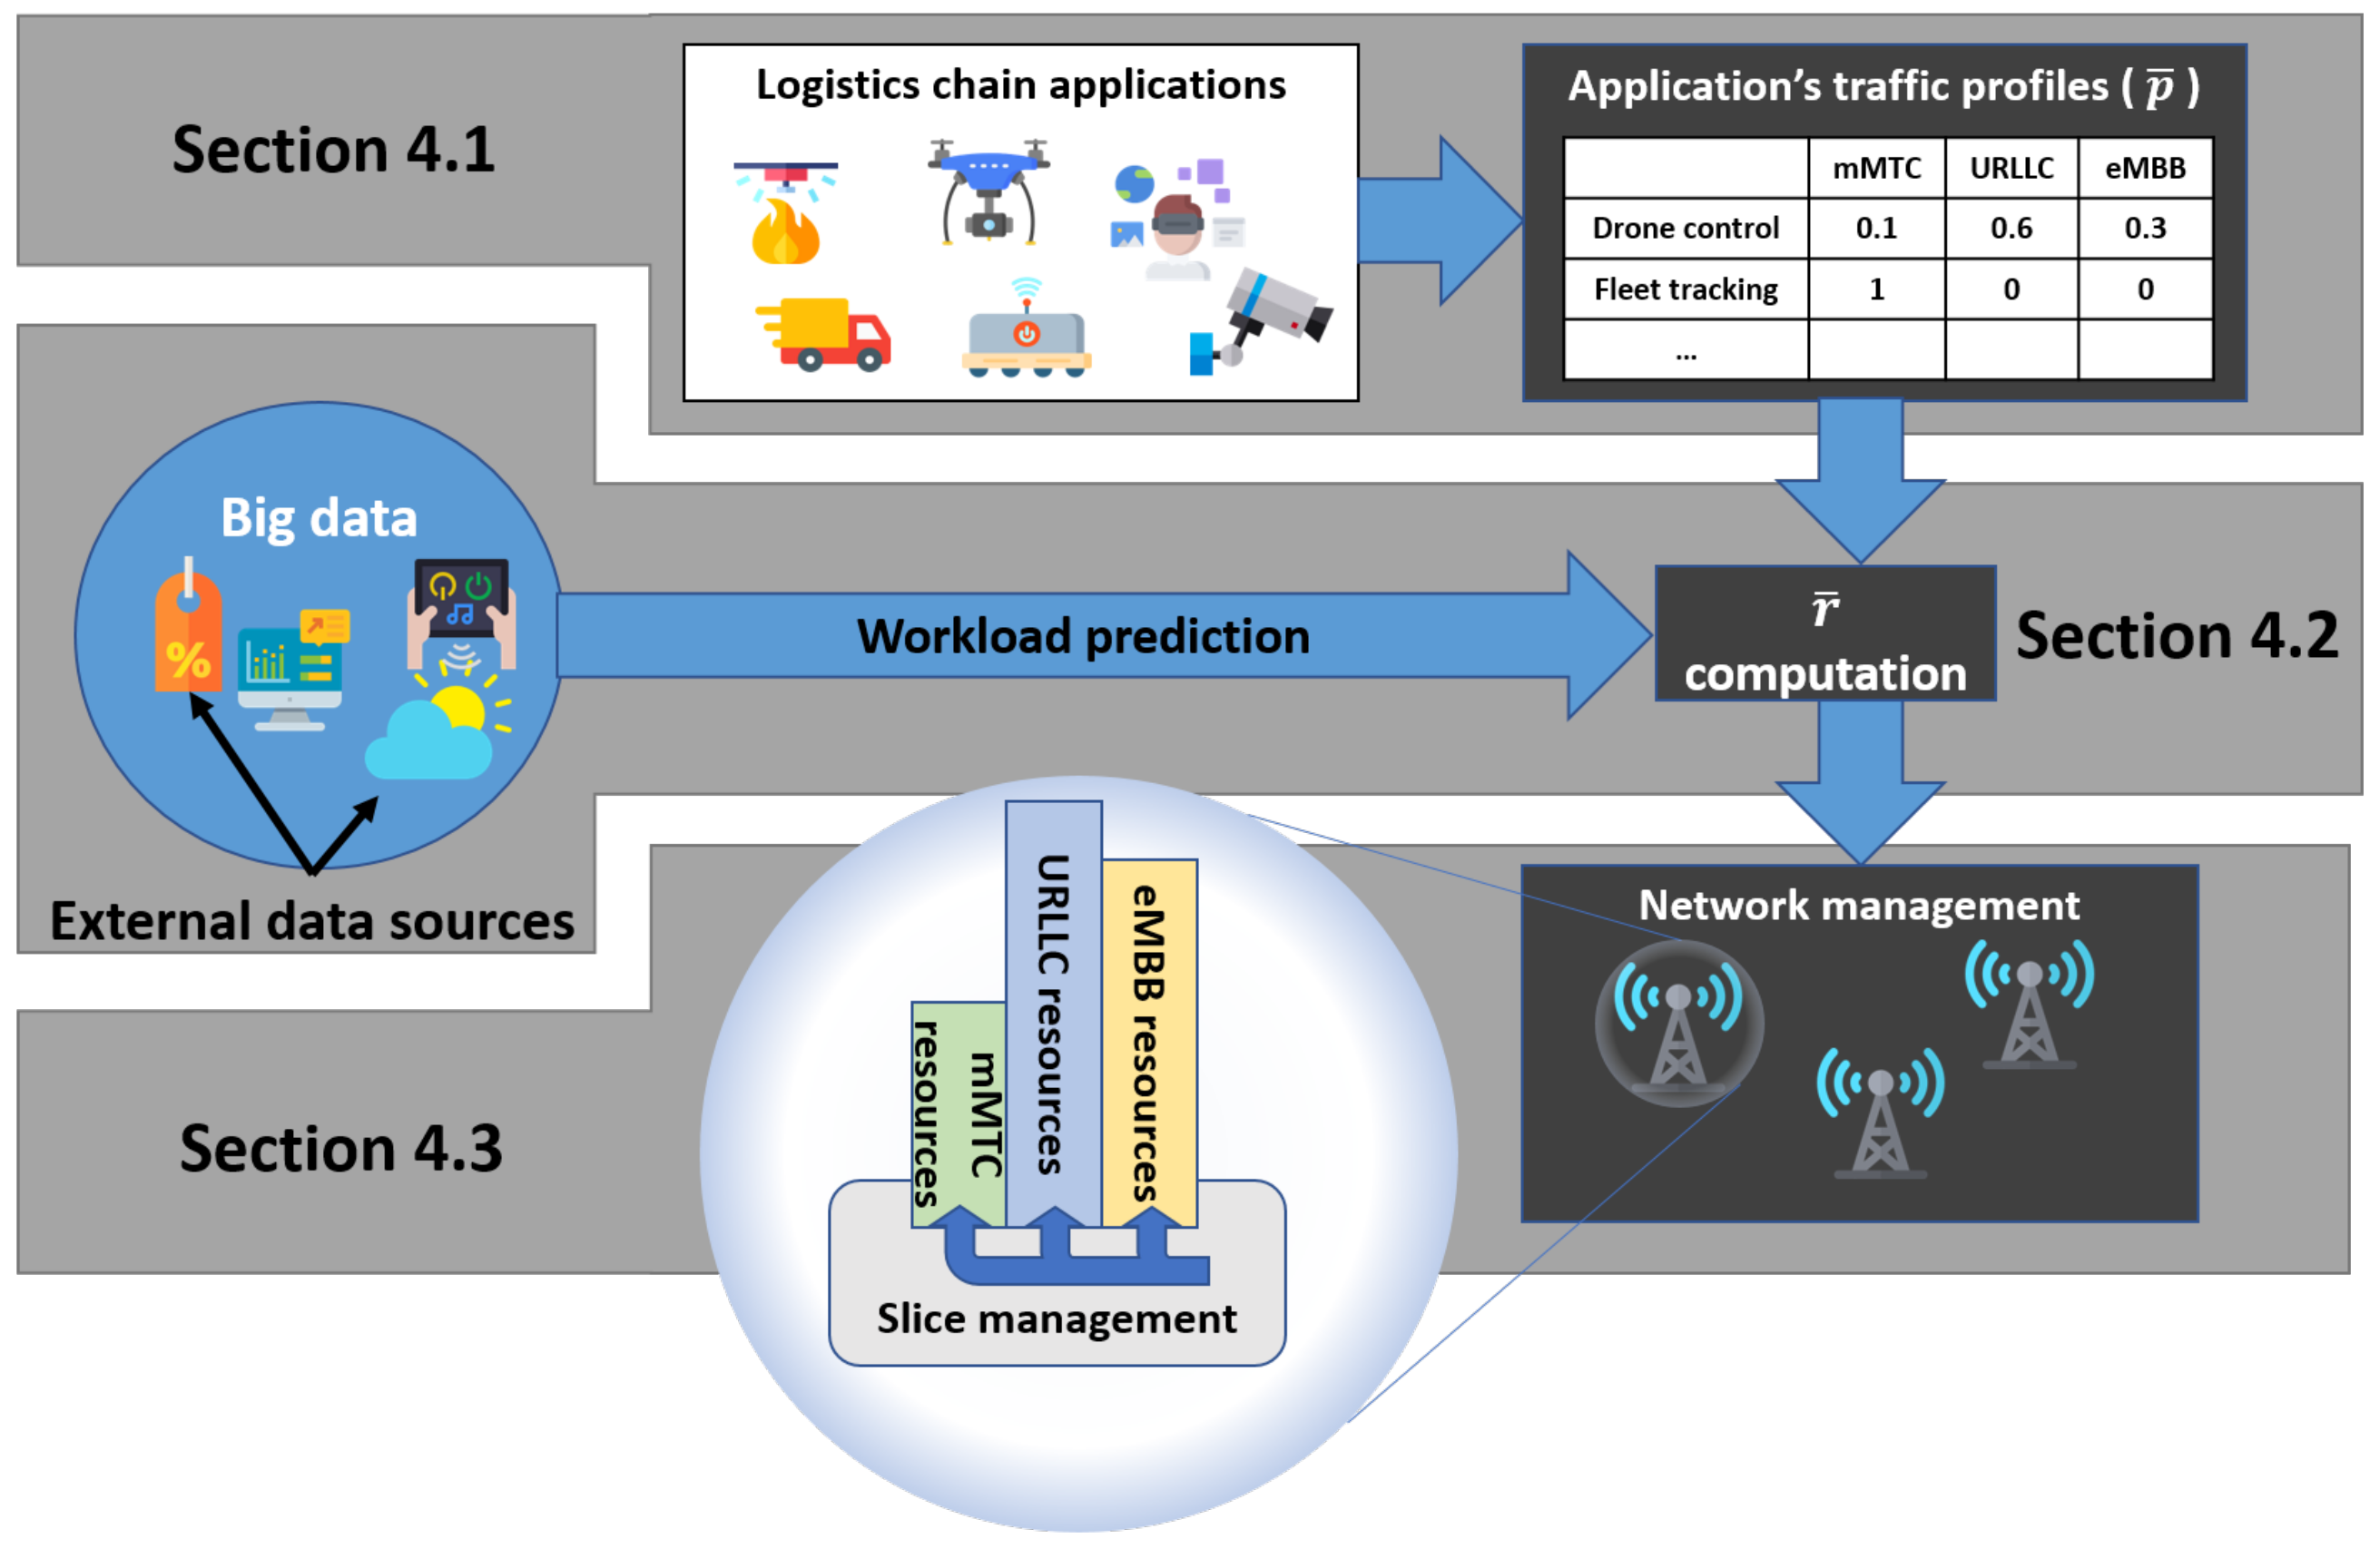
The objective of this system is to optimize the distribution of the available resources into the slices for different kinds of traffic and reach the requirements of the supported Industry 4.0 applications. Figure 5 shows the overall outline of the system, which is explained in detail in this section. As a preliminary step, the applications must be modeled as explained in Section 4.1. Big Data analytics will then be used as described in Section 4.2 to predict the workload and estimate which applications and how many instances will be executed within the service area of a network element. Finally, using the prediction and the application models, the resources in the network will be configured with NS as detailed in Section 4.3.
4.1. Application Requirement Modeling
The first step into adapting the network behavior is to gather information on the requirements and features of the offered traffic. The offered traffic is composed of the data flows of numerous individual applications running within the network area. Therefore, to understand the traffic, two different types of information are required: the traffic profile of each application, and the composition of the set of running instances of applications.
To obtain the traffic profile, each application must first be modeled extracting the following features regarding their end-to-end (E2E) behavior:
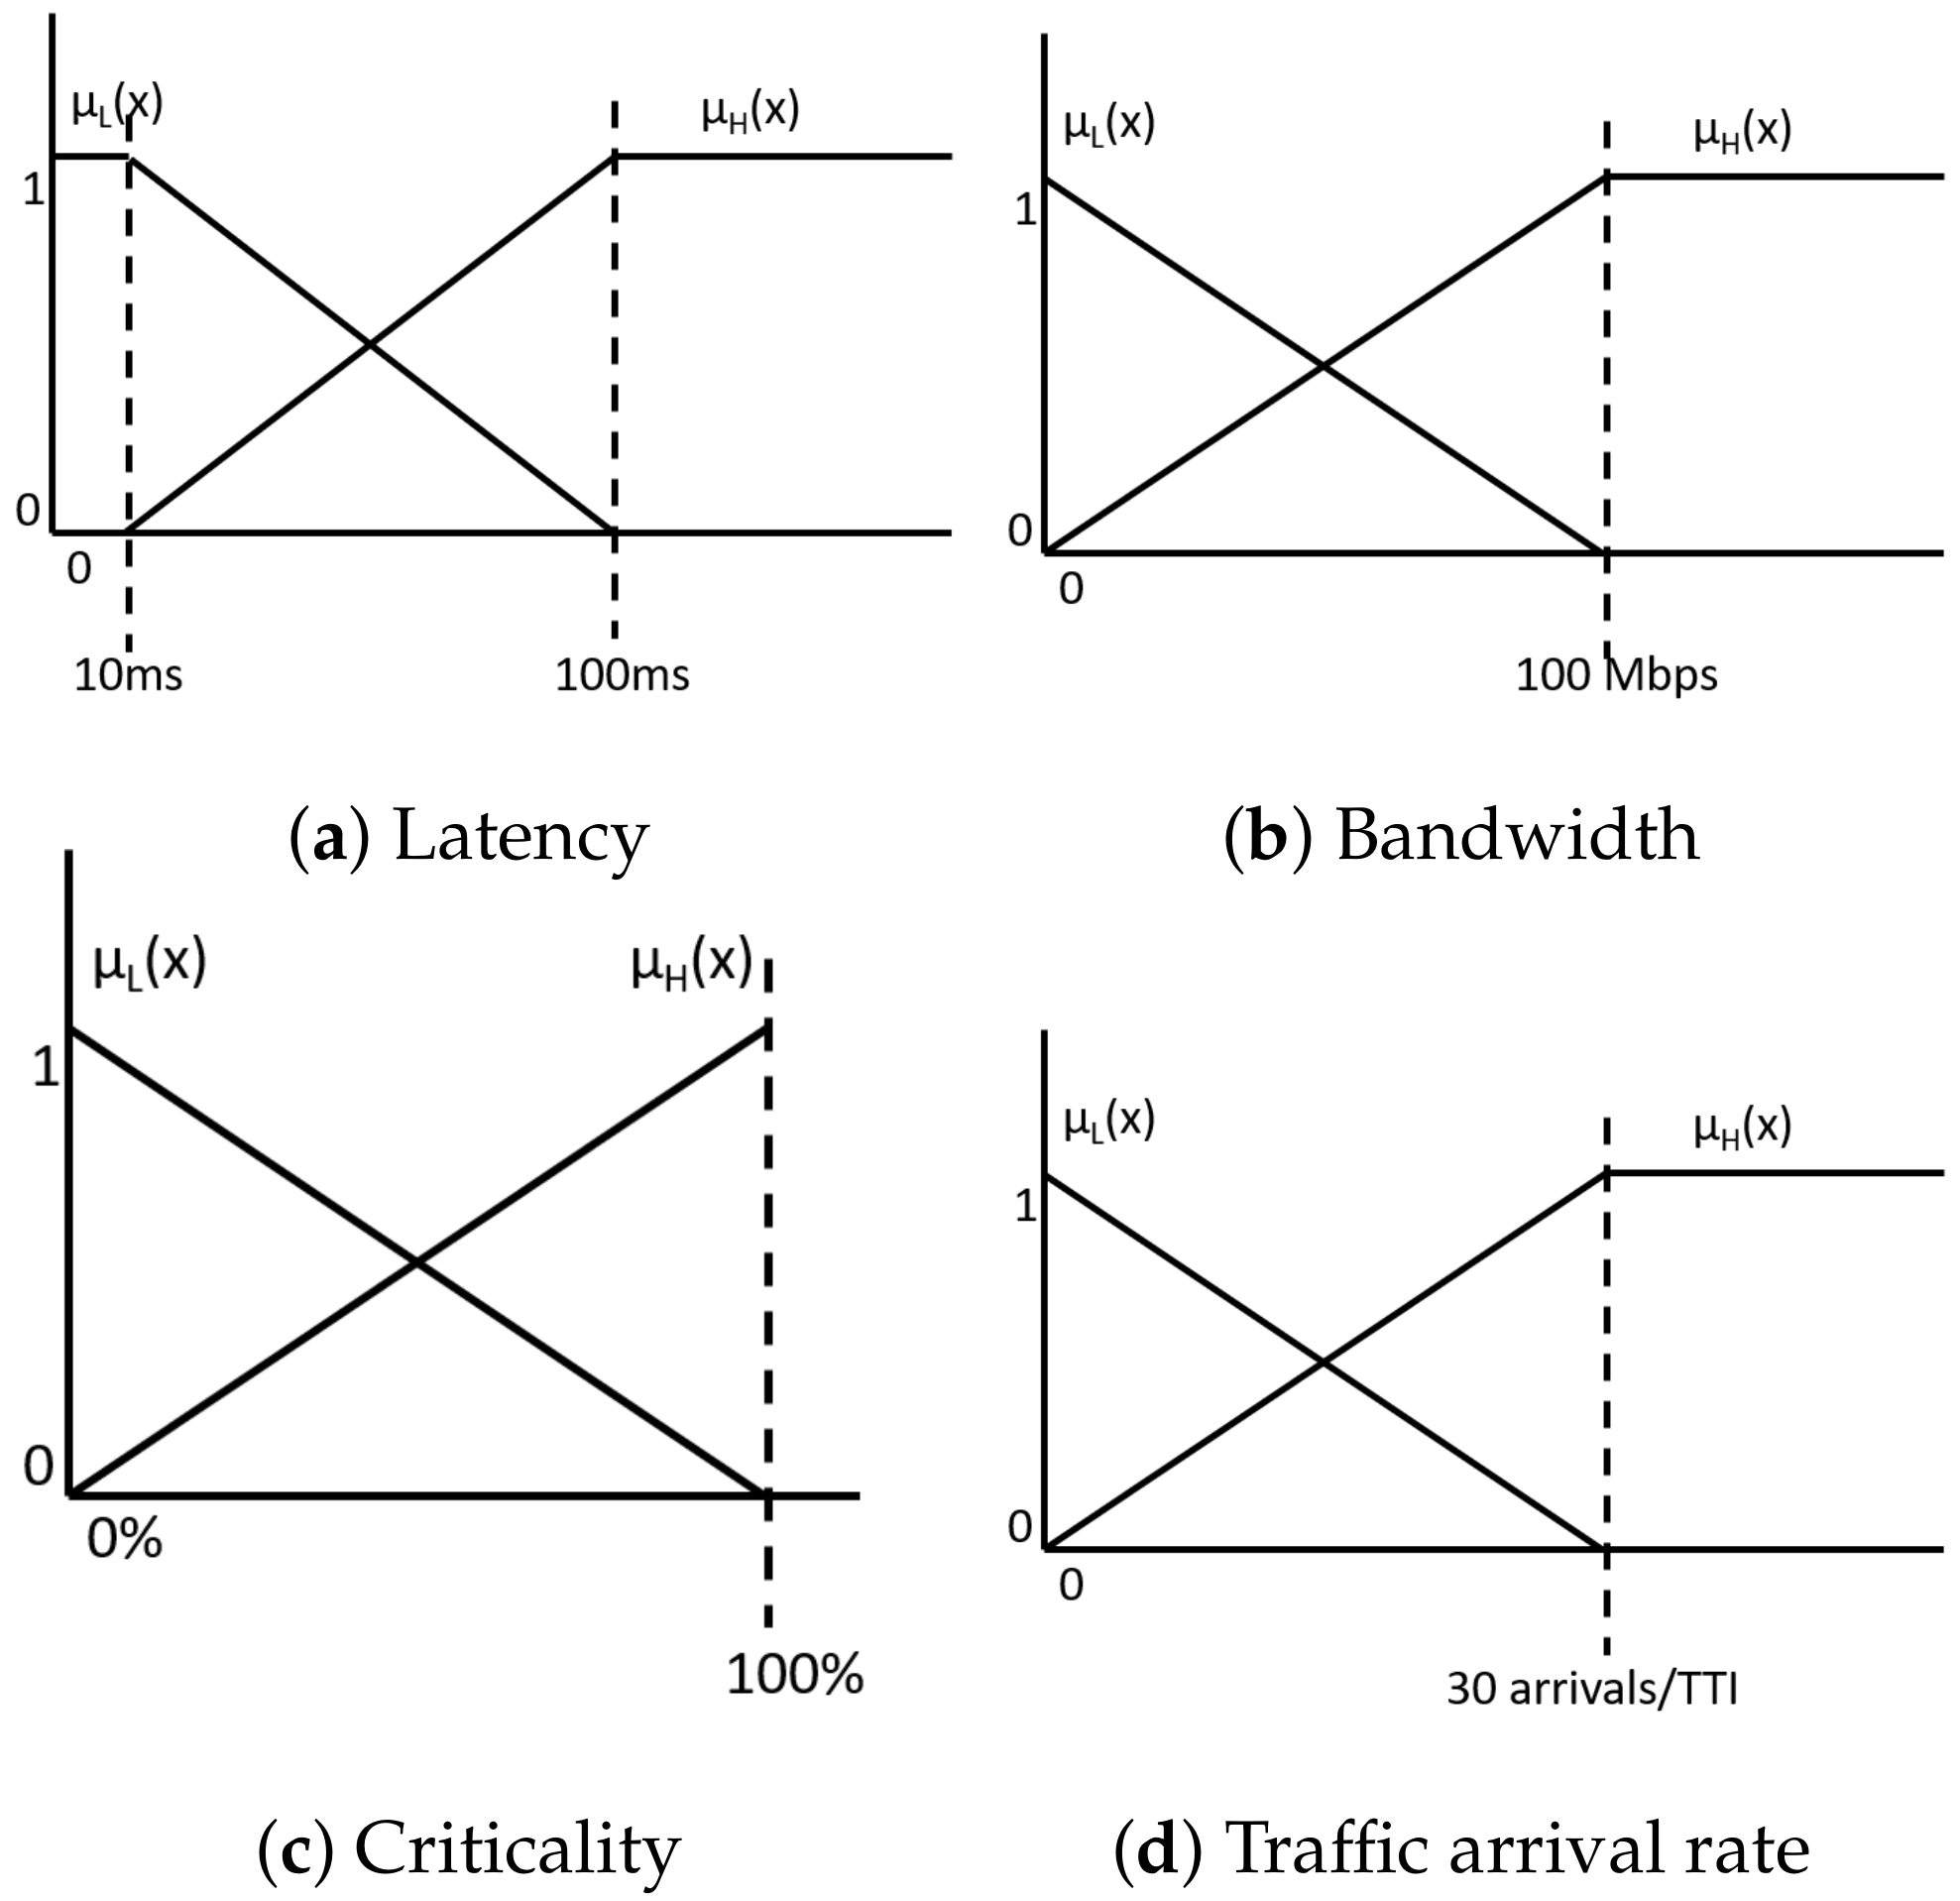
- Required latency: maximum time between the transmission of a message and its reception in the server, measured in milliseconds. Based on [84], it can be considered that latencies below 10 ms are considered low, while latencies above 200 ms are high.
- Required bandwidth: minimum bitrate required for the application. According to [85], a bandwidth of 100 Mbps is considered high.
- Criticality: degree of importance of a message. There is no standard measurement, but it is usually given as a proportion between 0% (non critical) and 100% (critical).
- Traffic arrival rate: the number of connections that each gNB is subject to depends on the number of messages each device transmits and the density of devices deployed in its area of service. The capacity of the system depends on the Transmission Time Interval (TTI), that is, the duration of the physical layer frame. A traffic arrival rate of 30 arrivals per TTI can be considered high [86].
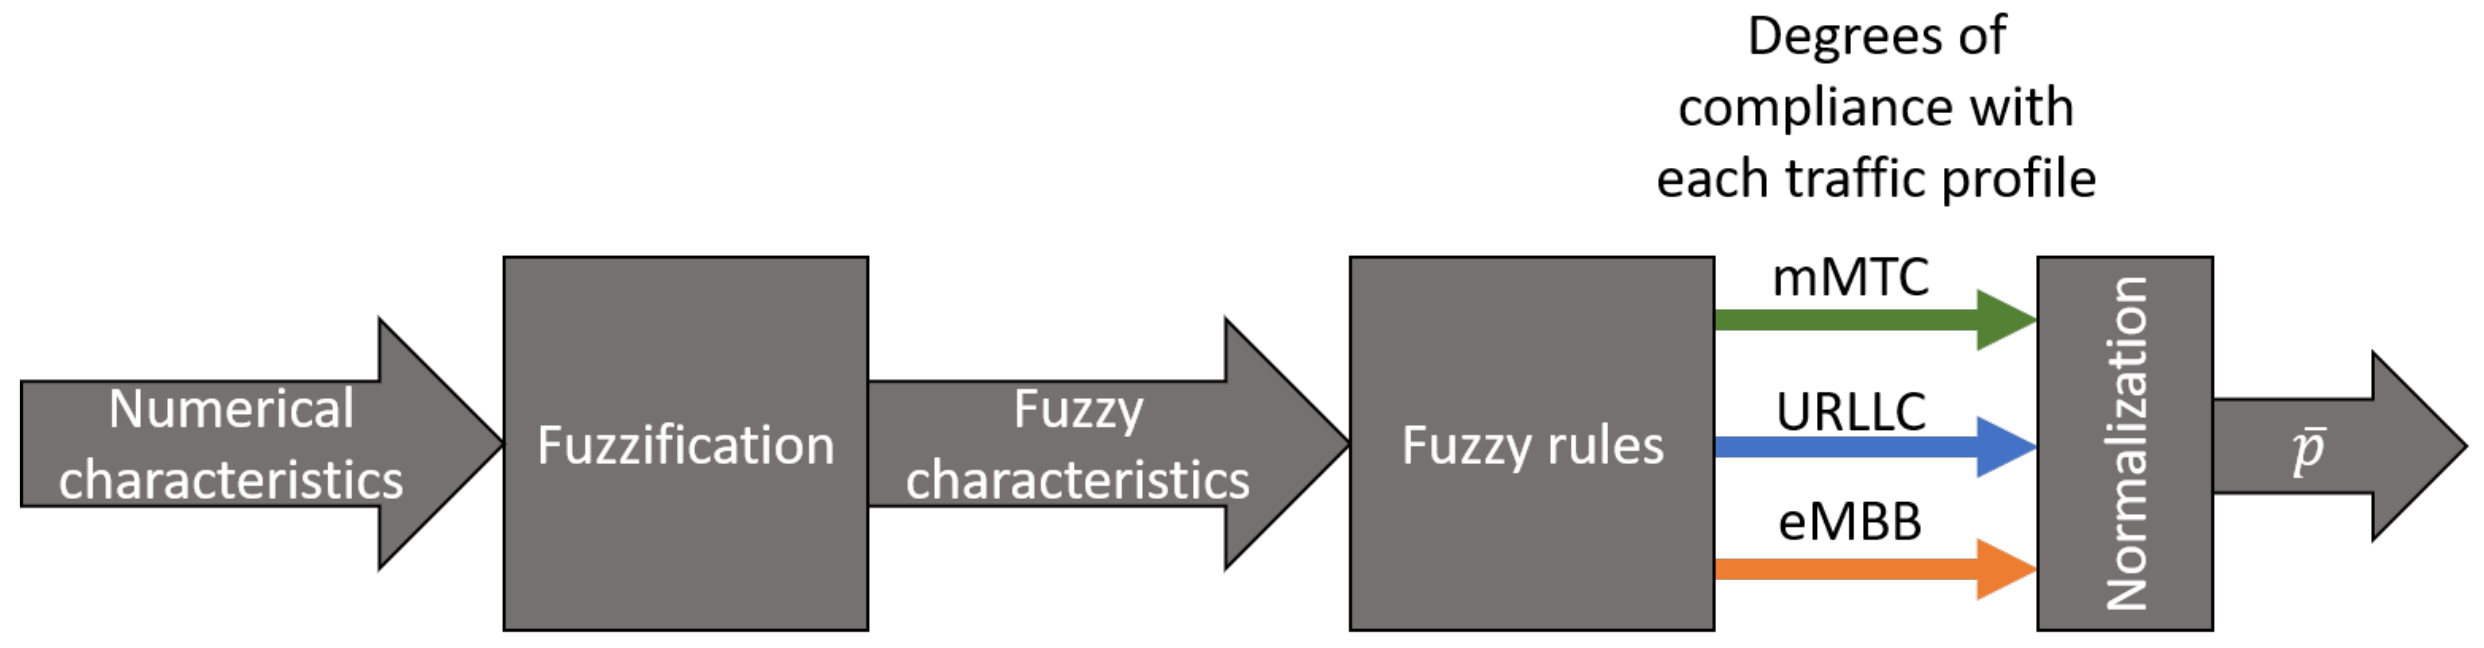
With this information, a vector modeling the application can be defined. This vector contains three components, each indicating how much the application’s traffic behaves like each of the traffic profiles. To calculate each component, a fuzzy logic controller (FLC) [87] (Figure 6) is proposed in this paper, obtaining a rating system that takes as input the values for the previously described parameters and returns a weight for each profile based on some simple heuristic rules.
The first step in Figure 6 (fuzzification) is to translate the input numeric values of the previously described variables into human understandable values (also known as fuzzy sets) such as “high” or “low”. In Fuzzy Logic, this is done with membership functions, which, given a value in the domain of the numeric input, return a value between 0 and 1. The higher the returned value, the higher the membership of that value to a fuzzy set. Figure 7 shows the membership functions for the high and low sets for the latency, bandwidth, criticality, and traffic arrival rate. These membership functions may change as novel applications with different requirements hit the market, and future network generations allow for more capable communications.
The second step in Figure 6 is the application of fuzzy rules. These are heuristic rules in the form of “if …then …” statements. The first part of the statement, the antecedent contains assertions on the fuzzy values of the inputs, such as “Latency is LOW”. These assertions will have a Degree of Activation (DoA) equal to the degree of membership of the input variable to the designated fuzzy set. In the case of “Latency is LOW”, the membership value would be given by , where is the membership function of Latency for the fuzzy set LOW and l is the numerical value of the latency requirement. If there are several assertions joined by an AND operator, the DoA will be the minimum of the membership degrees; but, if they are joined by an OR operator, the DoA will be the maximum of the membership degrees. Table 1 shows the proposed fuzzy rules to assign a weight to each of the profiles given the fuzzy values of latency, bandwidth, criticality, and traffic arrival rate.
The third and final step in Figure 6 is a normalization of the obtained DoAs, such that the total sum equals 1. With this normalization, the obtained vector represents the traffic composition for the application among the eMBB, mMTC and URLLC profiles.
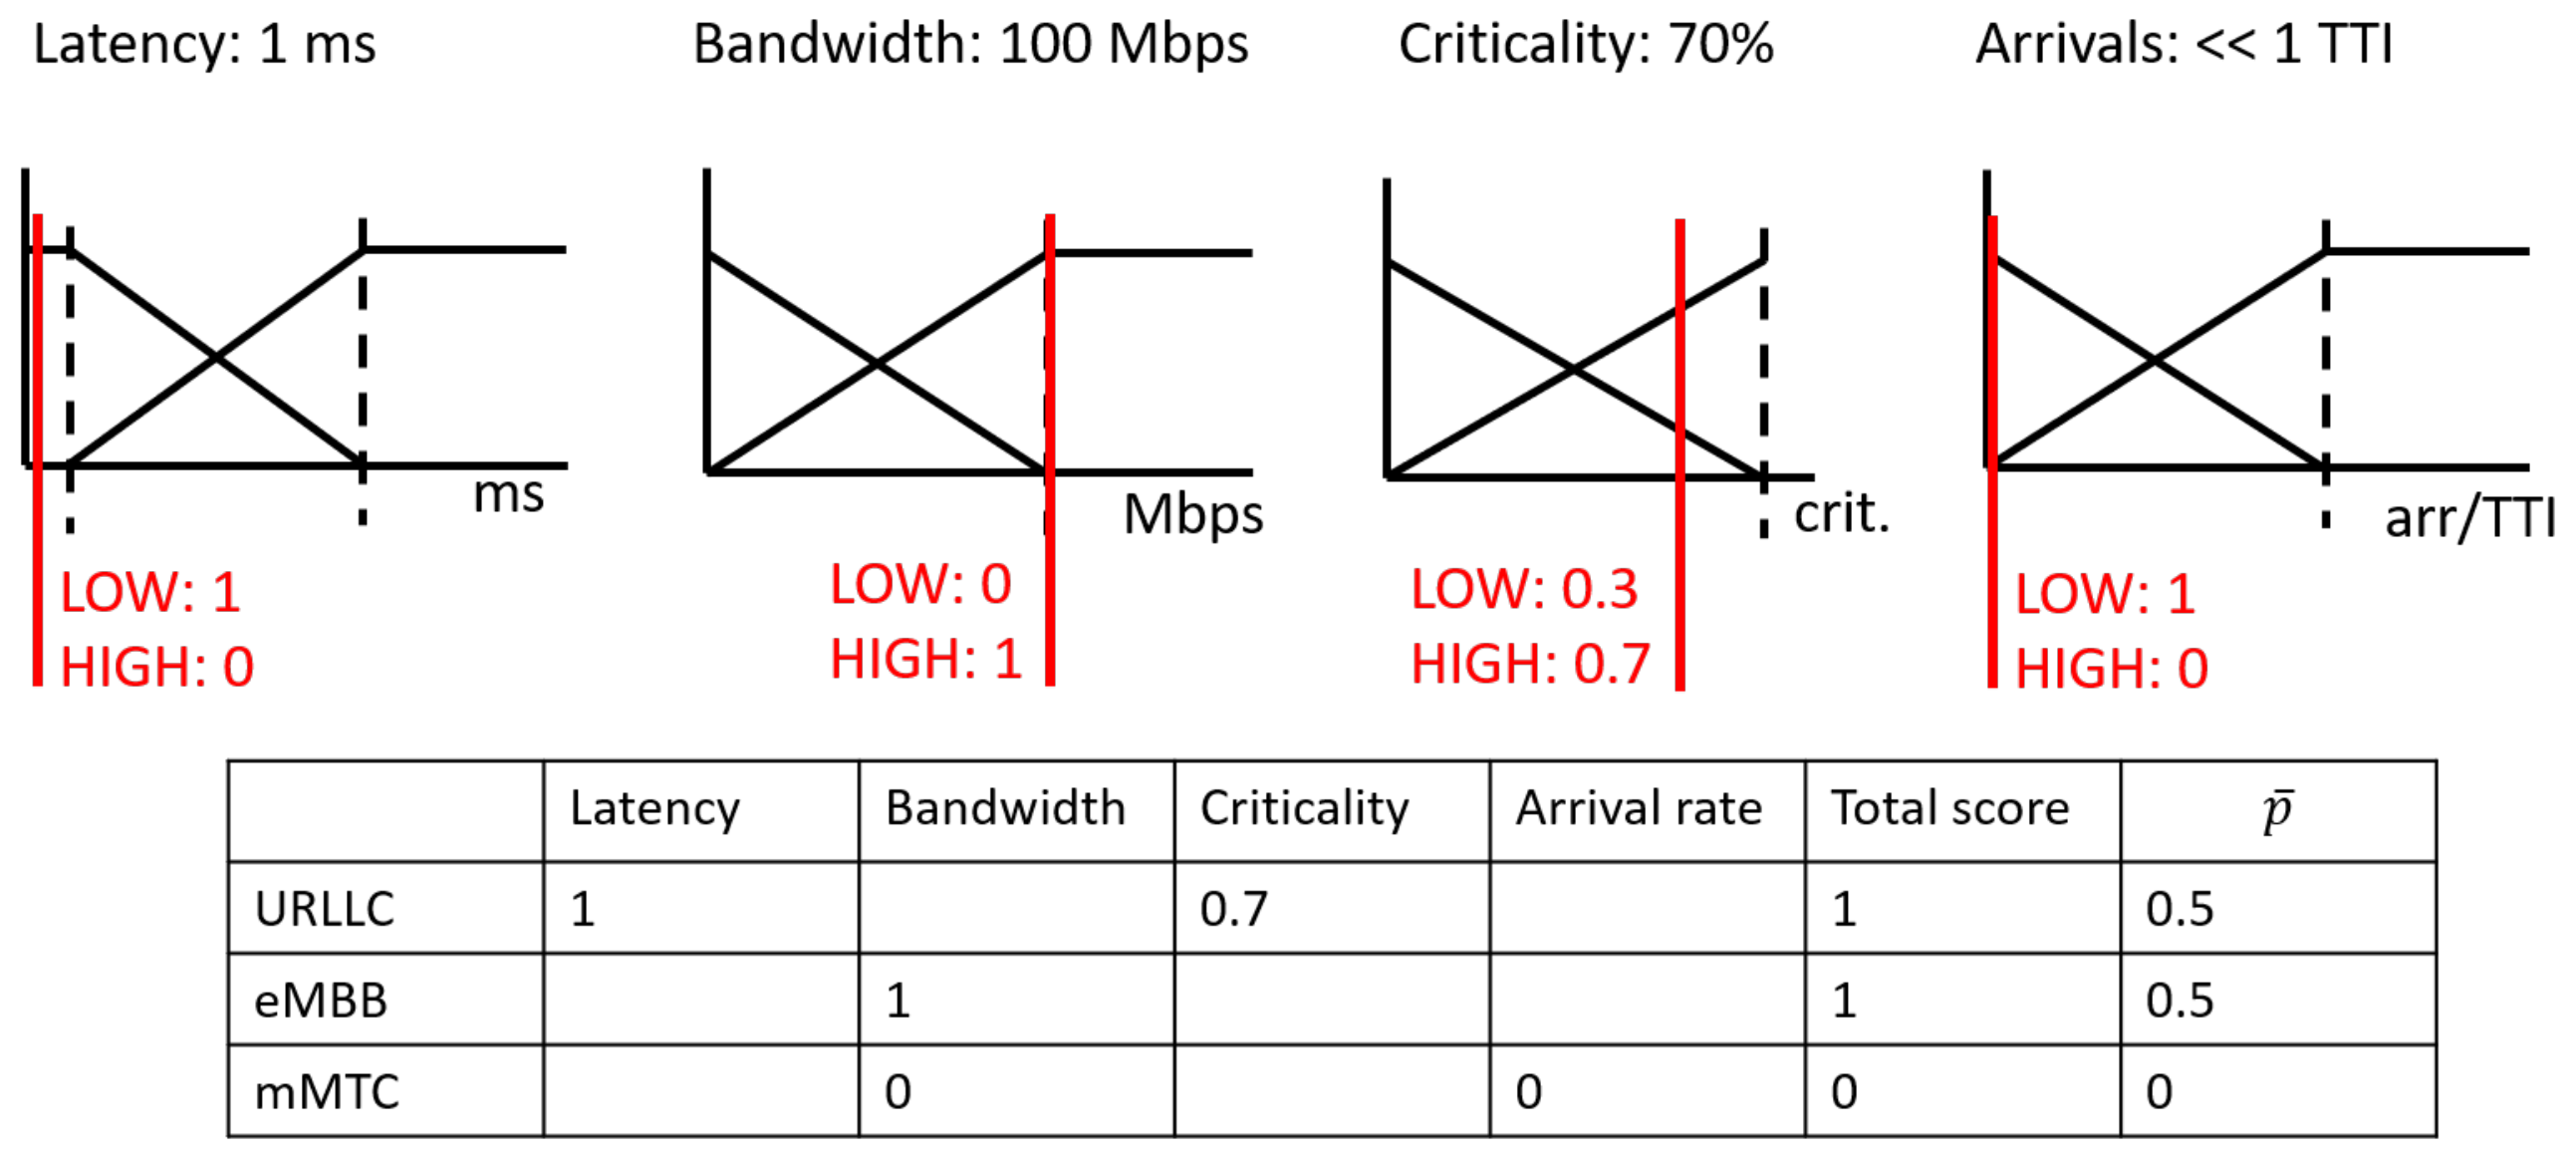
To illustrate the process, Figure 8 shows an example where an AR application is modeled. To avoid dizziness, AR requires that updates are done very fast, implying delays down to 1 ms. To allow high quality video to be transmitted in a very short time, a bandwidth of up to 100 Mbps is required. The criticality of AR is not extreme (i.e., its malfunction is not a hazard to human lives), but still high (70%), since packet losses may cause a very poor user experience. Finally, the traffic arrival rate is low; much lower than one new connection per TTI. When these numbers (represented as red lines in Figure 8) are fed into the membership functions, the values for the HIGH and LOW sets are obtained (represented as the red numbers). These values are then used in the fuzzy rules. In Figure 8, the table shows the degree of truth of each assertion of the rules in Table 1, the total DoA of each rule and the normalized values for the vector.
4.2. Big Data Prediction
Once the traffic of each individual application has been modeled, the number of instances that will be running in each network element must be computed. As shown in Figure 5, this is done in a second step where Big Data analytics from external sources is used to compute a vector that indicates the aggregated proportions of each kind of service.
Big Data analytics are a set of techniques and technologies that enable the extraction of rich information from large and complex data sources. In the case of logistics, there is a data flow that runs in parallel to the flow of the transported products and is associated with each item, means of transport and location along the supply chain. Some examples of data sources along the supply chains are:
- Information on buying trends: there are many external events that may incite the public to buy a specific product. The monitorization of these events may allow for carrying out a prediction of the products that will flow along the supply chain and their quantities.
- Road traffic information: the inflow and outflow of goods in a distribution center depends highly on the traffic that determines the time of arrival of trucks, and affects the schedule of distribution centers.
- Conditions within the distribution center: many parameters that can be measured, such as the temperature and humidity, the amount of stored parcels or the traffic of workers, have a high impact in the overall operation of the center.
To obtain the vector, this paper proposes to use Big Data analytics over the available external data sources to predict which applications, each modeled by a vector, will run within the area of coverage of a certain network element at a time t. Given the set of N predicted applications, each with an associated number of predicted instances m, the vector can be computed as:
In other words, the vector is calculated as the average of all the requirements of all the instances predicted at time t. Therefore, the overall effectiveness of the system relies on a good prediction of the values.
Following with the example of AR, a way of predicting (the number of AR applications running inside the area of service of a gNB at a given time) inside a distribution center is by analyzing the schedule of workers and predicting their needs based on past history.
4.3. Network Slicing
This paper proposes to divide the 5G resources available to a logistics operator into three slices, one for each kind of traffic, and optimize these slices to better fit the requirements of the traffic profile. In traditional NS, a slice is configured on demand; either when the need arises or by manually setting it up when the need is foreseen. The first approach reduces the quality of the service for the application, since there is an initial delay in the setup. The second approach has a high cost both because it is time-consuming and because it is not flexible and adaptable. In this paper, the predictive computation of allows a proactive NS, in order to adapt the network to the traffic without loss of quality of service.
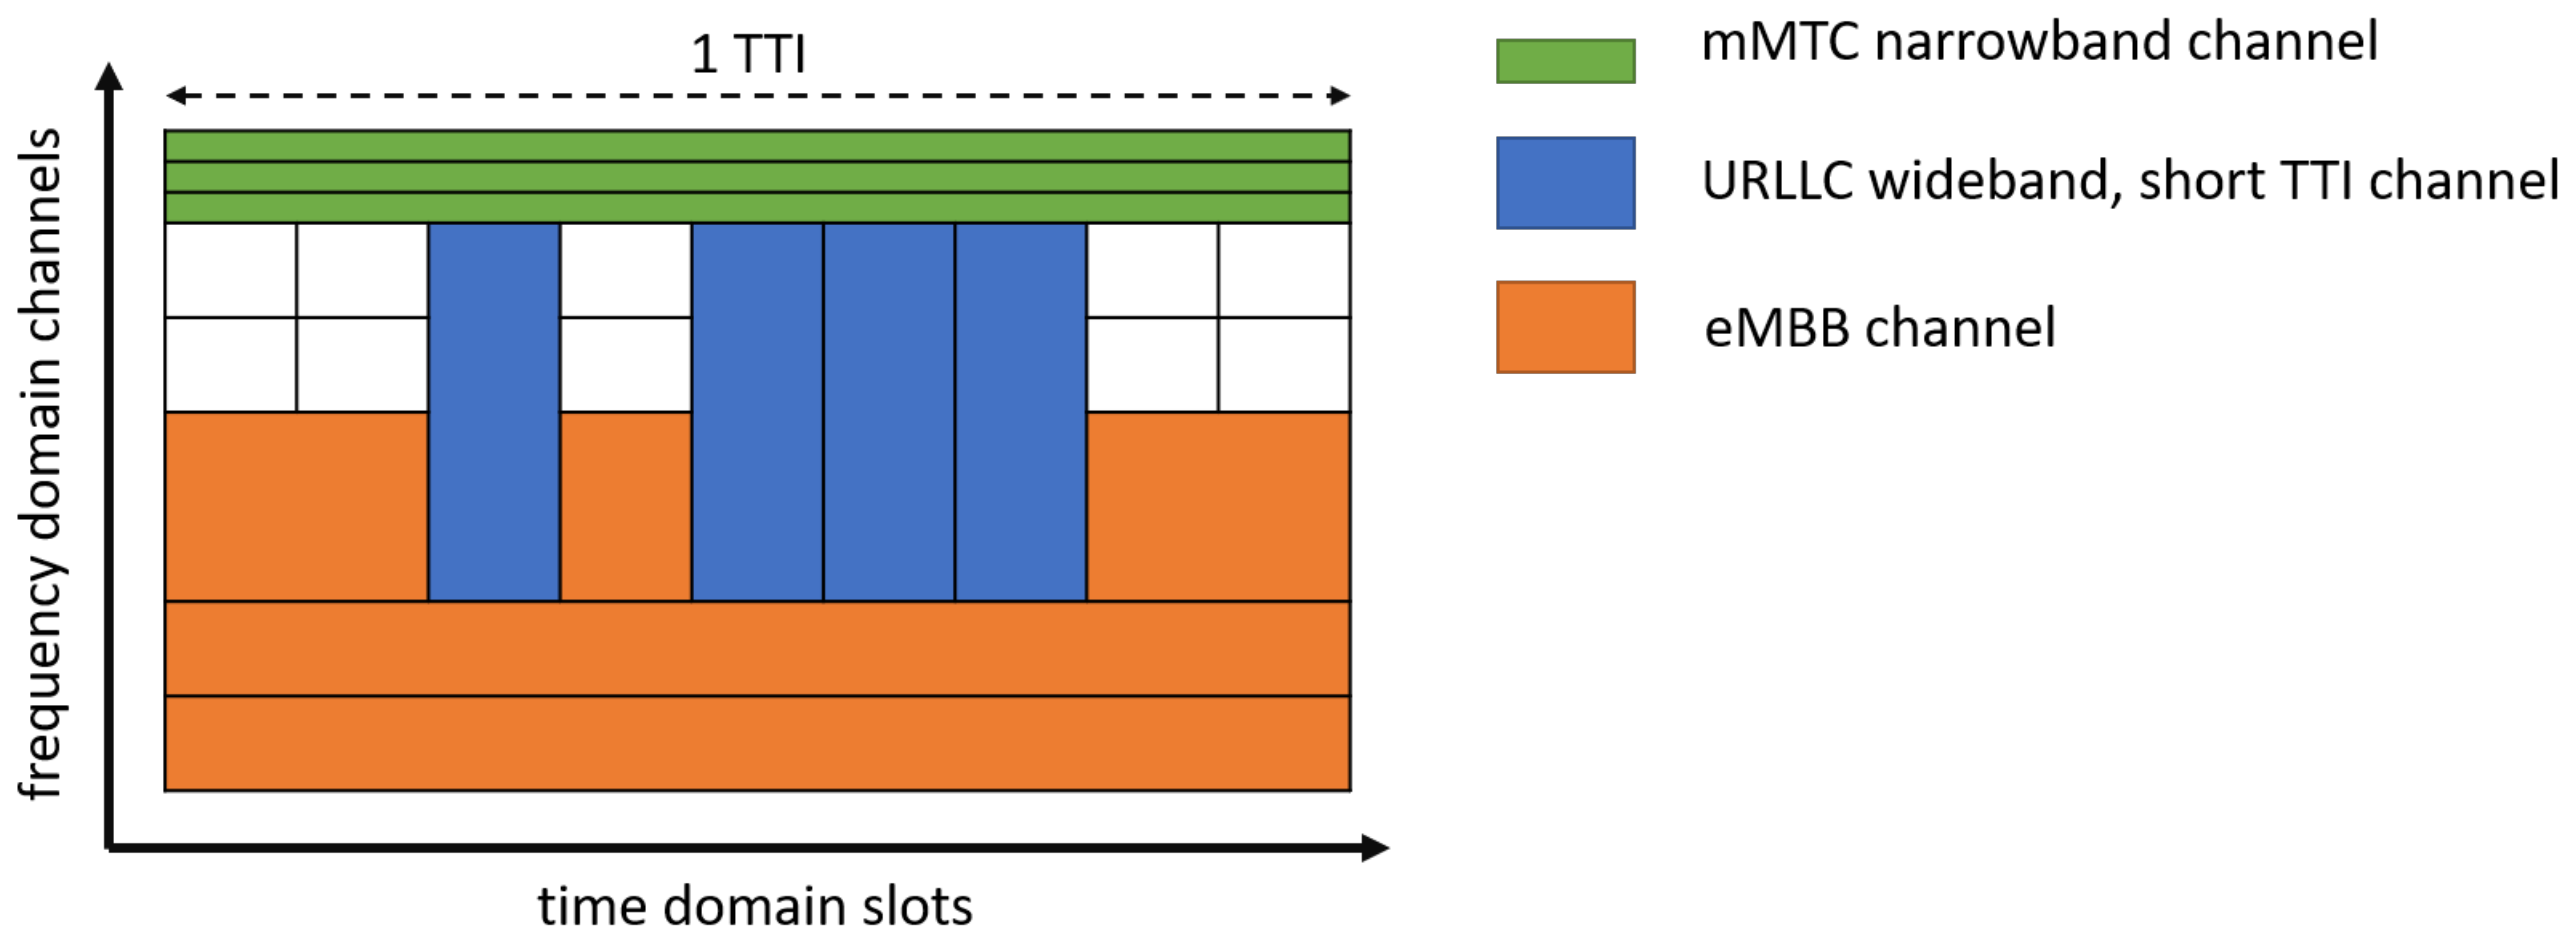
One possible approach for NS in the Radio Access Network, described in [41], is the division of resources in time and frequency. In this scheme (represented in Figure 9), a 5G carrier is divided in frequency into channels and in time into slots, conforming a resource grid that repeats in time. Due to the different properties and requirements of the three basic traffic profiles, resources are assigned differently to each one. Since mMTC channels are narrow-band, several of them can share one channel (as long as they are orthogonal in frequency). URLLC messages, on the other hand, require channels with a short TTI, so several time frames can be allotted in the overall structure. To increase the redundancy and shorten the transmission times, wideband transmission spanning over contiguous frequencies can be used. eMBB transmissions, on the other hand, can be assigned independent frequency resources, and reuse the URLLC resources when these are not used.
This distribution of resources in time and frequency can be particularized for each gNB. For instance, a gNB located in an urban area will have a high presence of eMBB traffic coming from mobile broadband users, video surveillance cameras, etc., as opposed to a gNB located in an industrial area with a higher presence of URLLC applications. This means that the size of the slices will be different in these two gNBs. Furthermore, traffic profiles may vary along the day, as the activity of the users changes; and that will also force a variation in the resource assignment. For instance, in an urban area, at peak traffic hours, a surge in URLLC traffic will be observed, coming from driving security systems and self-driving cars in the future. In the proposed system, for each gNB, the vector will define which proportion of the resource grid must be assigned to each of the three slices.
5. Discussion
5.1. Expected Benefits
The main objective of the proposed system is to achieve an adaptive and predictive NS centered around the needs of logistics, and enable 5G for its use in this vertical. The first and foremost benefit of 5G in logistics is the possibility of outsourcing the communications management (while keeping confidentiality thanks to end-to-end encryption). This will remove the costs of ownership, communications infrastructure equipment and management, security patches, etc., and change them with a lower service cost.
Secondly, 5G is the first “universal” connectivity solution that can (if optimized correctly) cover all the existing traffic profiles. The use of a single technology further simplifies the acquisition and management of radio equipment and reduces costs.
Finally, a well optimized network will cater best for the requirements of certain Industry 4.0 applications. Enabling a stable operation of such services will also allow for optimizing the usage of industrial resources, energy, etc. In the case of logistics, the availability of a network that can offer, for instance, coverage inside of delivery trucks will enable applications such as package tracking in real time without the need for special communication devices within said trucks.
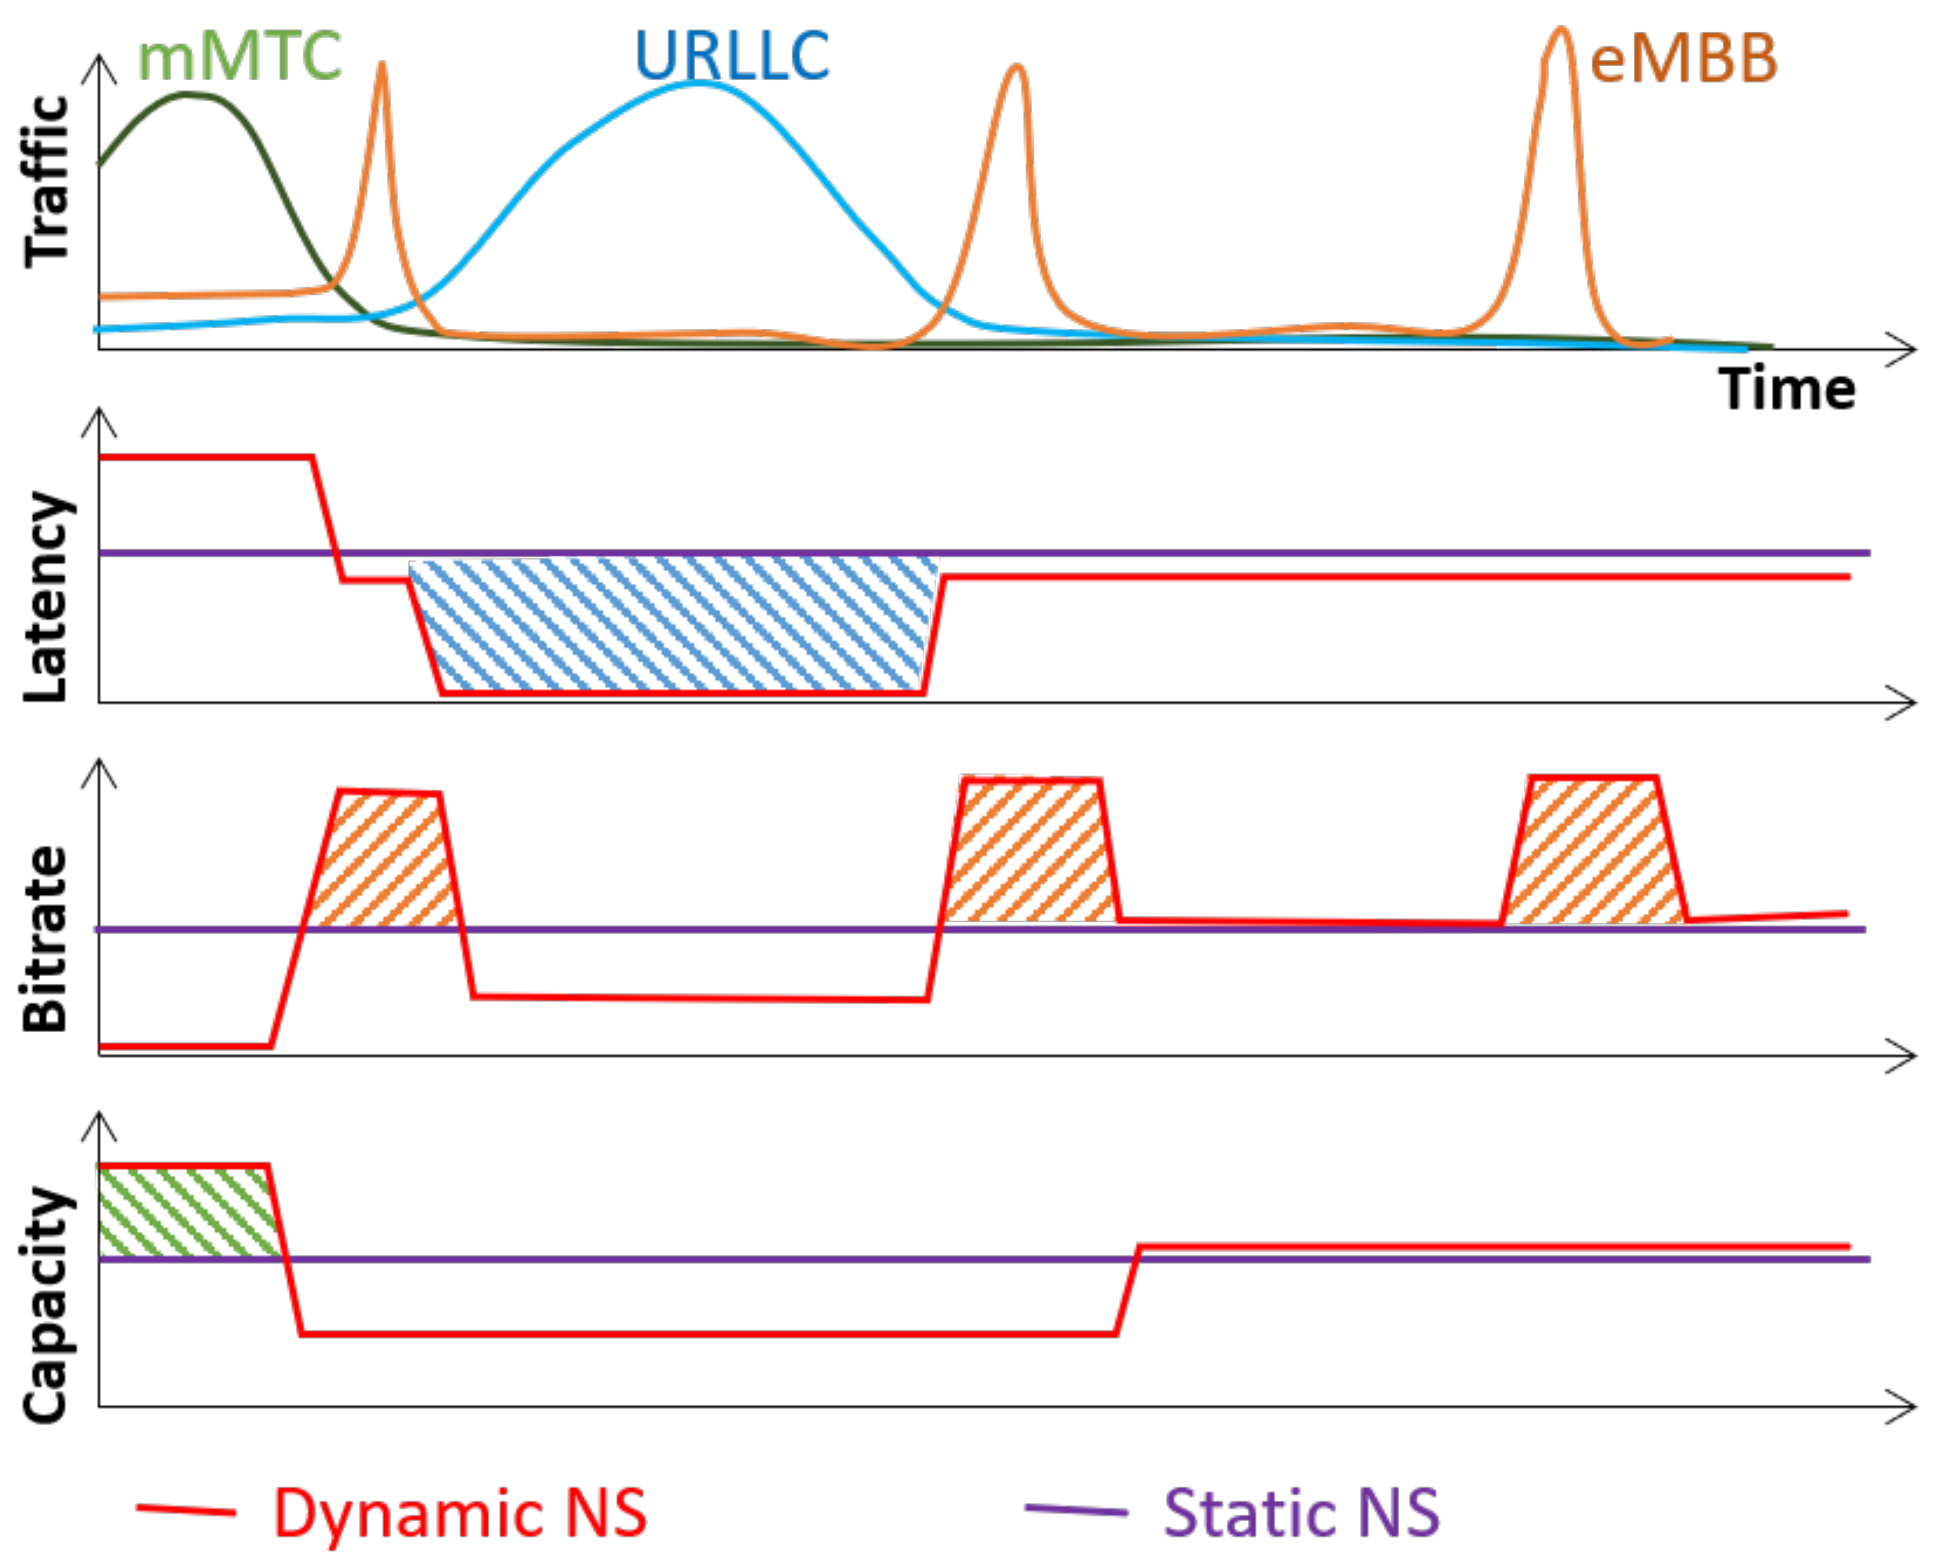
As an example of the optimization achievable with the proposed system, Figure 10 shows the performance gains expected on a gNB with respect to a baseline scenario where slices are assigned a fixed amount of resources. In this example, the first graphic shows the traffic estimated by the Big Data prediction phase described in Section 4.2. The second graphic shows the latency offered by the network over time. The purple line represents the latency of the baseline (no optimization), and the red line represents the latency with optimization. The second and third graphic use the same color conventions for bitrate and capacity.
Over time, four distinct behaviors occur in the first graphic, defining several different time intervals. First, a predominance of mMTC traffic is observed. This may occur, for instance, when a large batch of parcels with smart tags enters in a distribution center. In this moment, the network needs to provide connectivity for a large number of devices, hence a high capacity is required. A balanced division of resources (baseline scenario) may waste resources that could be dedicated to a higher capacity (e.g., larger bandwidth dedicated to mMTC channels) in maintaining resources for URLLC and eMBB. The proposed method, on the other hand, will redirect these resources into mMTC, achieving a higher capacity (with the gains represented with the green shadowed area in the capacity graphic).
After the mMTC period, a brief spike of eMBB traffic is expected; which may come, for instance, from a large worker activity with AR/VR systems. For this spike, the network must provide a high bitrate for a lower number of devices. The proposed method will, therefore, react reducing the resources dedicated to mMTC and redirect them to eMBB, achieving a gain marked in red in the bitrate graphic.
When the eMBB spike passes, a long period with URLLC activity (which may come from the activation of AGVs moving the recently received parcels) occurs. The proposed method again reacts changing the resource distribution and dedicating more to URLLC channels. The latency reduction is represented in a blue shade in the latency graphic. During this period, the bitrate and capacity are not especially high. However, the running applications do not need a high bitrate or capacity, meaning that catering for these indicators would be a waste of resources.
In low traffic conditions, the distribution of resources can return to an equilibrium point that is a compromise between the tree types of traffic. This example shows how the proposed method can modulate the 5G network resources in order to obtain an optimized performance for different types of traffic.
5.2. Costs and Alternatives
The advantages enumerated in the previous section come at a certain cost. The most relevant cost is an increase in the processing power required to operate the network. There are several points along the process where a high processing power is required: the computation of the vectors at each point in the network and at each moment in time, based on Big Data analytics; its application to redistribute the network element resources and finally reconfiguring each slice with the new assigned resources.
There are limitations to the adaptability of the proposed algorithm. First of all, extreme cases where the physical resources are insufficient to respond to the demand will cause performance loss; independently of the application of the method. Secondly, in some cases, predictions may fail; predictive algorithms in Big Data analytics are usually based on prior observations of similar phenomena. If an event has unprecedented effects, there are no mechanisms to predict it beforehand.
Some alternatives to using the proposed method are:
- Usage of other network technologies, such as WiFi for the interior of distribution centers, LoRA/Sigfox for exteriors, etc. Nevertheless, there is no single technology that can replace 5G; thus, potentially, multi-radio devices would be needed, with the increased cost in complexity and energy that they bring.
- Static assignation: this strategy consists of having a fixed resource distribution (as seen in the baseline scenario in the example), with an estimation in sizing that covers most of the needs. This means that the slices need to be oversized to cope with surges in a specific kind of traffic. Therefore, the cost of deployment increases for an equivalent performance.
- Semi-automatic configuration: another strategy would be to set a program for the network slice resource distribution that is dependent of time; that is, scheduling the changes based on a fixed program that does not take into account external factors. This will fail to adapt to irregular (but predictable) changes.
6. Conclusions
In this paper, a review of the role of wireless connectivity in Smart Logistics has been done. The existing wireless technologies were reviewed in Section 2.1, concluding that no single technology could cover all the needs of Smart Logistics, except for 5G. The design of 5G takes into account MTC as one of the main use cases, defining three traffic profiles (eMBB, mMTC and URLLC). Since these profiles have different requirements, the optimization of the network for them will result in conflicting configurations, which are usually harmonized with NS.
This paper proposed a system for proactively using NS to adapt the 5G network elements along a Smart Logistics distribution chain. The system contains three main elements: a traffic modeling method (Section 4.1) using Fuzzy Logic over the requirements of each application, a Big Data prediction module (Section 4.2) to predict the traffic within the area of a network element, and NS (Section 4.3) to divide the resources among the expected traffic profiles.
To better illustrate how this method is applied, an AR application was modeled in Section 4.1, using requirements extracted from the literature. In Section 5.1, an example of the expected benefits of the whole system was shown.
Finally, the limitations of the proposed method were also discussed, concluding that, while the method can optimize a 5G network, it will fail when the traffic of a certain profile is beyond the full capacity of the network. In addition, in cases where unprecedented events occur, the Big Data prediction may fail and thus result in an unoptimized performance.
The description of the system given in this paper is comprehensive and lays the grounds for an easy to implement solution. Therefore, this work will result in several new lines of work. First, real data from Smart Logistics applications will be used to model several applications, such as AR, AGVs, drones, etc. These models will be used as inputs for simulations of a realistic Smart Logistics scenario where the traffic prediction module and Network Slicing will be tested.
Author Contributions
Conceptualization, E.J.K. and R.B.; methodology, E.J.K. and R.B.; investigation, E.J.K.; writing—original draft preparation, E.J.K.; supervision, R.B.; project administration, R.B.; funding acquisition, R.B. All authors have read and agreed to the published version of the manuscript.
Funding
This research was funded by European Union (ERDF) through Junta de Andalucía, in the framework of the Seguridad y fiabilidad en las comunicaciones 5G/IoT para la industria 4.0 (EDEL4.0) project.
Institutional Review Board Statement
Not applicable.
Informed Consent Statement
Not applicable.
Data Availability Statement
Not applicable.
Conflicts of Interest
The authors declare no conflict of interest.
References
- Bag, S.; Yadav, G.; Wood, L.C.; Dhamija, P.; Joshi, S. Industry 4.0 and the circular economy: Resource melioration in logistics. Resour. Policy 2020, 68, 101776. [Google Scholar] [CrossRef]
- Munsamy, M.; Telukdarie, A.; Dhamija, P. Logistics 4.0 Energy Modelling. Int. J. Bus. Anal. IJBAN 2020, 7, 98–121. [Google Scholar] [CrossRef]
- Bundesministerium für Bildung und Forschung (BMBF). Industrie 4.0. Innovationen für die Produktion von Morgen, Germany. 2014. Available online: https://www.bmbf.de/upload_filestore/pub/Industrie_4.0.pdf (accessed on 18 March 2021).
- Lee, J.; Kao, H.A.; Yang, S. Service innovation and smart analytics for Industry 4.0 and Big Data environment. Procedia CIRP 2014, 16, 3–8. [Google Scholar] [CrossRef] [Green Version]
- Chalmeta, R.; Santos-deLeon, N.J. Sustainable supply chain in the era of industry 4.0 and big data: A systematic analysis of literature and research. Sustainability 2020, 12, 4108. [Google Scholar] [CrossRef]
- Hashem, I.A.T.; Yaqoob, I.; Anuar, N.B.; Mokhtar, S.; Gani, A.; Khan, S.U. The rise of “Big Data” on cloud computing: Review and open research issues. Inf. Syst. 2015, 47, 98–115. [Google Scholar] [CrossRef]
- Li, X.; Li, D.; Wan, J.; Vasilakos, A.V.; Lai, C.F.; Wang, S. A review of industrial wireless networks in the context of Industry 4.0. Wirel. Netw. 2017, 23, 23–41. [Google Scholar] [CrossRef]
- Rao, S.K.; Prasad, R. Impact of 5G technologies on industry 4.0. Wirel. Pers. Commun. 2018, 100, 145–159. [Google Scholar] [CrossRef]
- Decotignie, J.D. The many faces of industrial ethernet [past and present]. IEEE Ind. Electron. Mag. 2009, 3, 8–19. [Google Scholar] [CrossRef]
- Lee, J.; Bagheri, B.; Kao, H.A. A cyber-physical systems architecture for Industry 4.0-based manufacturing systems. Manuf. Lett. 2015, 3, 18–23. [Google Scholar] [CrossRef]
- Schütze, A.; Helwig, N.; Schneider, T. Sensors 4.0—Smart sensors and measurement technology enable Industry 4.0. J. Sens. Sens. Syst. 2018, 7, 359–371. [Google Scholar] [CrossRef]
- Bahrin, M.A.K.; Othman, M.F.; Azli, N.N.; Talib, M.F. Industry 4.0: A review on industrial automation and robotic. J. Teknol. 2016, 78, 137–143. [Google Scholar]
- Wen, J.; He, L.; Zhu, F. Swarm robotics control and communications: Imminent challenges for next generation smart logistics. IEEE Commun. Mag. 2018, 56, 102–107. [Google Scholar] [CrossRef]
- Sisinni, E.; Saifullah, A.; Han, S.; Jennehag, U.; Gidlund, M. Industrial internet of things: Challenges, opportunities, and directions. IEEE Trans. Ind. Inform. 2018, 14, 4724–4734. [Google Scholar] [CrossRef]
- Costa, R.; Lau, J.; Portugal, P.; Vasques, F.; Moraes, R. Handling real-time communication in infrastructured IEEE 802.11 wireless networks: The RT-WiFi approach. J. Commun. Netw. 2019, 21, 319–334. [Google Scholar] [CrossRef]
- Maruko, T.; Yasukawa, S.; Matsumoto, A.; Abe, J.; Iwamura, M. Latency Analysis of LTE Networks for Vehicular Communications Based on Experiments and Computer Simulation. In Proceedings of the 2019 IEEE 2nd Connected and Automated Vehicles Symposium (CAVS), Honolulu, HI, USA, 22–23 September 2019; pp. 1–5. [Google Scholar]
- Lee, C.; Lv, Y.; Ng, K.; Ho, W.; Choy, K. Design and application of Internet of things-based warehouse management system for smart logistics. Int. J. Prod. Res. 2018, 56, 2753–2768. [Google Scholar] [CrossRef]
- Wassie, D.A.; Rodriguez, I.; Berardinelli, G.; Tavares, F.M.; Sorensen, T.B.; Mogensen, P. Radio propagation analysis of industrial scenarios within the context of ultra-reliable communication. In Proceedings of the 2018 IEEE 87th Vehicular Technology Conference (VTC Spring), Porto, Portugal, 3–6 June 2018; pp. 1–6. [Google Scholar]
- Montgomery, K.; Montgomery, K.; Candell, R.; Liu, Y.; Hany, M. Wireless User Requirements for the Factory Workcell; US Department of Commerce, National Institute of Standards and Technology: Gaithersburg, MD, USA, 2020.
- Ding, Y.; Jin, M.; Li, S.; Feng, D. Smart logistics based on the internet of things technology: An overview. Int. J. Logist. Res. Appl. 2020, 1–23. [Google Scholar] [CrossRef]
- Adame, T.; Bel, A.; Bellalta, B.; Barcelo, J.; Oliver, M. IEEE 802.11 ah: The WiFi approach for M2M communications. IEEE Wirel. Commun. 2014, 21, 144–152. [Google Scholar] [CrossRef] [Green Version]
- Cena, G.; Seno, L.; Valenzano, A.; Zunino, C. On the performance of IEEE 802.11 e wireless infrastructures for soft-real-time industrial applications. IEEE Trans. Ind. Inform. 2010, 6, 425–437. [Google Scholar] [CrossRef]
- ZigBee Alliance. ZigBee Specification (Document 053474r06, Version 1). 2012. Available online: https://zigbeealliance.org/wp-content/uploads/2019/11/docs-05-3474-21-0csg-zigbee-specification.pdf (accessed on 18 March 2021).
- Song, J.; Han, S.; Mok, A.; Chen, D.; Lucas, M.; Nixon, M.; Pratt, W. WirelessHART: Applying wireless technology in real-time industrial process control. In Proceedings of the 2008 IEEE Real-Time and Embedded Technology and Applications Symposium, St. Louis, MO, USA, 22–24 April 2008; pp. 377–386. [Google Scholar]
- Liang, W.; Zhang, X.; Xiao, Y.; Wang, F.; Zeng, P.; Yu, H. Survey and experiments of WIA-PA specification of industrial wireless network. Wirel. Commun. Mob. Comput. 2011, 11, 1197–1212. [Google Scholar] [CrossRef]
- ISA. 100.11 a-2009: Wireless Systems for Industrial Automation: Process Control and Related Applications, ANSI/ISA. 2009. Available online: https://www.isa.org/products/ansi-isa-100-11a-2011-wireless-systems-for-industr (accessed on 18 March 2021).
- Montenegro, G.; Kushalnagar, N.; Hui, J.; Culler, D. Transmission of IPv6 packets over IEEE 802.15. 4 networks. Internet Propos. Stand. RFC 2007, 4944, 130. [Google Scholar]
- Lora Alliance. LoRaWAN 1.1 Specification. 2017. Available online: https://lora-alliance.org/resource_hub/lorawan-specification-v1-1/ (accessed on 18 March 2021).
- Zuniga, J.C.; Ponsard, B. Sigfox System Description, LPWAN@IETF97. 14 November 2016. Available online: https://datatracker.ietf.org/meeting/97/materials/slides-97-lpwan-25-sigfox-system-description-00.pdf (accessed on 18 March 2021).
- Vejlgaard, B.; Lauridsen, M.; Nguyen, H.; Kovács, I.Z.; Mogensen, P.; Sorensen, M. Coverage and capacity analysis of sigfox, lora, gprs, and nb-iot. In Proceedings of the 2017 IEEE 85th Vehicular Technology Conference (VTC Spring), Sydney, Australia, 4–7 June 2017; pp. 1–5. [Google Scholar]
- Yang, K. Interference management in LTE wireless networks [Industry Perspectives]. IEEE Wirel. Commun. 2012, 19, 8–9. [Google Scholar] [CrossRef]
- Al-Ali, A.; Zualkernan, I.; Aloul, F. A mobile GPRS-sensors array for air pollution monitoring. IEEE Sens. J. 2010, 10, 1666–1671. [Google Scholar] [CrossRef]
- Ma, Y.; Liu, C.H.; Alhussein, M.; Zhang, Y.; Chen, M. LTE-based humanoid robotics system. Microprocess. Microsyst. 2015, 39, 1279–1284. [Google Scholar] [CrossRef]
- Bockelmann, C.; Pratas, N.; Nikopour, H.; Au, K.; Svensson, T.; Stefanovic, C.; Popovski, P.; Dekorsy, A. Massive machine-type communications in 5G: Physical and MAC-layer solutions. IEEE Commun. Mag. 2016, 54, 59–65. [Google Scholar] [CrossRef] [Green Version]
- Elbamby, M.S.; Perfecto, C.; Bennis, M.; Doppler, K. Toward low-latency and ultra-reliable virtual reality. IEEE Netw. 2018, 32, 78–84. [Google Scholar] [CrossRef] [Green Version]
- Kong, L.; Khan, M.K.; Wu, F.; Chen, G.; Zeng, P. Millimeter-wave wireless communications for IoT-cloud supported autonomous vehicles: Overview, design, and challenges. IEEE Commun. Mag. 2017, 55, 62–68. [Google Scholar] [CrossRef]
- Condoluci, M.; Lema, M.A.; Mahmoodi, T.; Dohler, M. 5G IoT industry verticals and network requirements. In Powering the Internet of Things with 5G Networks; IGI Global: Hershey, PA, USA, 2018; pp. 148–175. [Google Scholar]
- Lim, S.G. Construction of 21st Century Visual Algorithm in 5G-based VR/AR/MR/Hologram. J. Korea Multimed. Soc. 2019, 22, 1208–1214. [Google Scholar]
- Gangakhedkar, S.; Cao, H.; Ali, A.R.; Ganesan, K.; Gharba, M.; Eichinger, J. Use cases, requirements and challenges of 5G communication for industrial automation. In Proceedings of the 2018 IEEE International Conference on Communications Workshops (ICC Workshops), Kansas City, MO, USA, 20–24 May 2018; pp. 1–6. [Google Scholar]
- Abrol, A.; Jha, R.K. Power optimization in 5G networks: A step towards GrEEn communication. IEEE Access 2016, 4, 1355–1374. [Google Scholar] [CrossRef]
- Popovski, P.; Trillingsgaard, K.F.; Simeone, O.; Durisi, G. 5G wireless network slicing for eMBB, URLLC, and mMTC: A communication-theoretic view. IEEE Access 2018, 6, 55765–55779. [Google Scholar] [CrossRef]
- Valverde, J.; Rosello, V.; Mujica, G.; Portilla, J.; Uriarte, A.; Riesgo, T. Wireless sensor network for environmental monitoring: Application in a coffee factory. Int. J. Distrib. Sens. Netw. 2011, 8, 638067. [Google Scholar] [CrossRef] [Green Version]
- Gligoric, N.; Krco, S.; Hakola, L.; Vehmas, K.; De, S.; Moessner, K.; Jansson, K.; Polenz, I.; Van Kranenburg, R. Smarttags: IoT product passport for circular economy based on printed sensors and unique item-level identifiers. Sensors 2019, 19, 586. [Google Scholar] [CrossRef] [Green Version]
- Sun, E.; Zhang, X.; Li, Z. The internet of things (IOT) and cloud computing (CC) based tailings dam monitoring and pre-alarm system in mines. Saf. Sci. 2012, 50, 811–815. [Google Scholar] [CrossRef]
- Ploplys, N.J.; Kawka, P.A.; Alleyne, A.G. Closed-loop control over wireless networks. IEEE Control Syst. Mag. 2004, 24, 58–71. [Google Scholar]
- Nielsen, J.J.; Liu, R.; Popovski, P. Ultra-reliable low latency communication using interface diversity. IEEE Trans. Commun. 2017, 66, 1322–1334. [Google Scholar] [CrossRef]
- Jacobsen, T.; Abreu, R.; Berardinelli, G.; Pedersen, K.; Mogensen, P.; Kovács, I.Z.; Madsen, T.K. System level analysis of uplink grant-free transmission for URLLC. In Proceedings of the 2017 IEEE Globecom Workshops (GC Wkshps), Singapore, 4–8 December 2017; pp. 1–6. [Google Scholar]
- Pocovi, G.; Pedersen, K.I.; Mogensen, P. Joint link adaptation and scheduling for 5G ultra-reliable low-latency communications. IEEE Access 2018, 6, 28912–28922. [Google Scholar] [CrossRef]
- Mao, Y.; You, C.; Zhang, J.; Huang, K.; Letaief, K.B. A survey on mobile edge computing: The communication perspective. IEEE Commun. Surv. Tutor. 2017, 19, 2322–2358. [Google Scholar] [CrossRef] [Green Version]
- Prasad, A.; Benjebbour, A.; Bulakci, O.; Pedersen, K.I.; Pratas, N.K.; Mezzavilla, M. Agile radio resource management techniques for 5G new radio. IEEE Commun. Mag. 2017, 55, 62–63. [Google Scholar] [CrossRef]
- Liu, G.; Hou, X.; Jin, J.; Wang, F.; Wang, Q.; Hao, Y.; Huang, Y.; Wang, X.; Xiao, X.; Deng, A. 3D-MIMO with massive antennas paves the way to 5G enhanced mobile broadband: From system design to field trials. IEEE J. Sel. Areas Commun. 2017, 35, 1222–1233. [Google Scholar] [CrossRef]
- Kimy, B.; Lim, S.; Kim, H.; Suh, S.; Kwun, J.; Choi, S.; Lee, C.; Lee, S.; Hong, D. Non-orthogonal multiple access in a downlink multiuser beamforming system. In Proceedings of the MILCOM 2013—2013 IEEE Military Communications Conference, San Diego, CA, USA, 18–20 November 2013; pp. 1278–1283. [Google Scholar]
- Kela, P.; Lundqvist, H.; Costa, M.; Leppänen, K.; Jäntti, R. Connectionless access for massive machine type communications in ultra-dense networks. In Proceedings of the 2017 IEEE International Conference on Communications (ICC), Paris, France, 21–25 May 2017; pp. 1–6. [Google Scholar]
- FANTASTIC-5G. D3.1: Preliminary Results for Multi-Service Support. 2016. Available online: http://fantastic5g.com/wp-content/uploads/2016/06/FANTASTIC-5G_D31.pdf (accessed on 18 March 2021).
- Foukas, X.; Patounas, G.; Elmokashfi, A.; Marina, M.K. Network slicing in 5G: Survey and challenges. IEEE Commun. Mag. 2017, 55, 94–100. [Google Scholar] [CrossRef] [Green Version]
- Da Silva, I.; Mildh, G.; Kaloxylos, A.; Spapis, P.; Buracchini, E.; Trogolo, A.; Zimmermann, G.; Bayer, N. Impact of network slicing on 5G Radio Access Networks. In Proceedings of the 2016 European conference on networks and communications (EuCNC), Athens, Greece, 27–30 June 2016; pp. 153–157. [Google Scholar]
- Sciancalepore, V.; Samdanis, K.; Costa-Perez, X.; Bega, D.; Gramaglia, M.; Banchs, A. Mobile traffic forecasting for maximizing 5G network slicing resource utilization. In Proceedings of the IEEE INFOCOM 2017—IEEE Conference on Computer Communications, Atlanta, GA, USA, 1–4 May 2017; pp. 1–9. [Google Scholar]
- Kumar, A. From mass customization to mass personalization: A strategic transformation. Int. J. Flex. Manuf. Syst. 2007, 19, 533. [Google Scholar] [CrossRef]
- Eurostat. E-Commerce Statistics. 2019. Available online: https://ec.europa.eu/eurostat/web/products-eurostat-news/-/DDN-20200420-2 (accessed on 18 March 2021).
- Barratt, M.; Oke, A. Antecedents of supply chain visibility in retail supply chains: A resource-based theory perspective. J. Oper. Manag. 2007, 25, 1217–1233. [Google Scholar] [CrossRef]
- Waller, M.; Johnson, M.E.; Davis, T. Vendor-managed inventory in the retail supply chain. J. Bus. Logist. 1999, 20, 183–204. [Google Scholar]
- Grzegorz, C. The Nuisance of Slow Moving Products in Electronic Commerce; Professionals Center for Business Research: London, UK, 2016; Volume 3, pp. 11–16. [Google Scholar]
- Oke, A.; Gopalakrishnan, M. Managing disruptions in supply chains: A case study of a retail supply chain. Int. J. Prod. Econ. 2009, 118, 168–174. [Google Scholar] [CrossRef]
- Dasaklis, T.K.; Pappis, C.P.; Rachaniotis, N.P. Epidemics control and logistics operations: A review. Int. J. Prod. Econ. 2012, 139, 393–410. [Google Scholar] [CrossRef]
- Columbus, S. Who Hoards? Honesty-Humility and Behavioural Responses to the 2019/20 Coronavirus Pandemic. 2020. Preprint. Available online: https://psyarxiv.com/8e62v/ (accessed on 18 March 2021).
- Alicke, A.; Rachor, J.; Seyfert, A. Supply Chain 4.0—The Next,-Generation Digital Supply Chain; Supply Chain Management Review; McKinsey & Company: New York, NY, USA, 2016; Available online: https://www.mckinsey.com/business-functions/operations/our-insights/supply-chain-40–the-next-generation-digital-supply-chain (accessed on 18 March 2021).
- Bor-Yaliniz, I.; Salem, M.; Senerath, G.; Yanikomeroglu, H. Is 5G Ready for Drones: A Look into Contemporary and Prospective Wireless Networks from a Standardization Perspective. IEEE Wirel. Commun. 2019, 26, 18–27. [Google Scholar] [CrossRef]
- Murray, C.C.; Chu, A.G. The flying sidekick traveling salesman problem: Optimization of drone-assisted parcel delivery. Transp. Res. Part C Emerg. Technol. 2015, 54, 86–109. [Google Scholar] [CrossRef]
- Ferrara, A.; Gebennini, E.; Grassi, A. Fleet sizing of laser guided vehicles and pallet shuttles in automated warehouses. Int. J. Prod. Econ. 2014, 157, 7–14. [Google Scholar] [CrossRef]
- Martínez-de Dios, J.R.; Torres-González, A.; Paneque, J.L.; Fuego-García, D.; Ramírez, J.R.A.; Ollero, A. Aerial Robot Coworkers for Autonomous Localization of Missing Tools in Manufacturing Plants. In Proceedings of the 2018 International Conference on Unmanned Aircraft Systems (ICUAS), Dallas, TX, USA, 12–15 June 2018; pp. 1063–1069. [Google Scholar]
- Kim, S.J.; Lim, G.J. Drone-aided border surveillance with an electrification line battery charging system. J. Intell. Robot. Syst. 2018, 92, 657–670. [Google Scholar] [CrossRef]
- Loch, F.; Quint, F.; Brishtel, I. Comparing video and augmented reality assistance in manual assembly. In Proceedings of the 2016 12th International Conference on Intelligent Environments (IE), London, UK, 14–16 September 2016; pp. 147–150. [Google Scholar]
- Xu, X.M.; Li, H.; Shuai, X.S. Palletizing Robot. US Patent 8,240,973, 14 August 2012. [Google Scholar]
- Frizzi, S.; Kaabi, R.; Bouchouicha, M.; Ginoux, J.M.; Moreau, E.; Fnaiech, F. Convolutional neural network for video fire and smoke detection. In Proceedings of the IECON 2016—42nd Annual Conference of the IEEE Industrial Electronics Society, Florence, Italy, 23–26 October 2016; pp. 877–882. [Google Scholar]
- Ai, Y.; Cheffena, M.; Li, Q. Radio frequency measurements and capacity analysis for industrial indoor environments. In Proceedings of the 2015 9th European Conference on Antennas and Propagation (EuCAP), Lisbon, Portugal, 12–17 April 2015; pp. 1–5. [Google Scholar]
- Hankins, G.; Vahala, L.; Beggs, J.H. 802.11ab propagation prediction inside a B777. In Proceedings of the IEEE/ACES International Conference on Wireless Communications and Applied Computational Electromagnetics, Honolulu, HI, USA, 3–7 April 2005; pp. 837–840. [Google Scholar]
- Tsuboi, T.; Yamada, J.; Yamauchi, N.; Nakagawa, M.; Maruyama, T. UWB Radio Propagation Inside Vehicle Environments. In Proceedings of the 2007 7th International Conference on ITS Telecommunications, Sophia Antipolis, France, 6–8 June 2007; pp. 1–5. [Google Scholar]
- MacCartney, G.R.; Zhang, J.; Nie, S.; Rappaport, T.S. Path loss models for 5G millimeter wave propagation channels in urban microcells. In Proceedings of the 2013 IEEE Global Communications Conference (GLOBECOM), Atlanta, GA, USA, 9–13 December 2013; pp. 3948–3953. [Google Scholar]
- Sun, S.; Rappaport, T.S.; Rangan, S.; Thomas, T.A.; Ghosh, A.; Kovacs, I.Z.; Rodriguez, I.; Koymen, O.; Partyka, A.; Jarvelainen, J. Propagation path loss models for 5G urban micro-and macro-cellular scenarios. In Proceedings of the 2016 IEEE 83rd Vehicular Technology Conference (VTC Spring), Nanjing, China, 15–18 May 2016; pp. 1–6. [Google Scholar]
- Malila, B.; Falowo, O.; Ventura, N. Millimeter wave small cell backhaul: An analysis of diffraction loss in NLOS links in urban canyons. In Proceedings of the AFRICON 2015, Addis Ababa, Ethiopia, 14–17 September 2015; pp. 1–5. [Google Scholar] [CrossRef]
- Al-Hourani, A.; Gomez, K. Modeling cellular-to-UAV path-loss for suburban environments. IEEE Wirel. Commun. Lett. 2017, 7, 82–85. [Google Scholar] [CrossRef]
- Omar, M.S.; Anjum, M.A.; Hassan, S.A.; Pervaiz, H.; Niv, Q. Performance analysis of hybrid 5G cellular networks exploiting mmWave capabilities in suburban areas. In Proceedings of the 2016 IEEE International Conference on Communications (ICC), Kuala Lumpur, Malaysia, 22–27 May 2016; pp. 1–6. [Google Scholar]
- Höyhtyä, M.; Ojanperä, T.; Mäkelä, J.; Ruponen, S.; Järvensivu, P. Integrated 5G satellite-terrestrial systems: Use cases for road safety and autonomous ships. In Proceedings of the 23rd Ka and Broadband Communications Conference, Trieste, Italy, 16–19 October 2017; pp. 16–19. [Google Scholar]
- ETSI. 5G; Study on Scenarios and Requirements for Next, Generation Access Technologies (3GPP TR 38.913 version 14.2.0 Release 14). 2017. Available online: https://www.etsi.org/deliver/etsi_tr/138900_138999/138913/14.02.00_60/tr_138913v140200p.pdf (accessed on 18 March 2021).
- Mohyeldin, E. Minimum Technical Performance Requirements for IMT-2020 radio interface(s). In Proceedings of the ITU-R Workshop IMT-2020 Terrestrial Radio Interfaces, Munich, Germany, 4 October 2017. [Google Scholar]
- Bockelmann, C.; Pratas, N.K.; Wunder, G.; Saur, S.; Navarro, M.; Gregoratti, D.; Vivier, G.; De Carvalho, E.; Ji, Y.; Stefanović, Č.; et al. Towards Massive Connectivity Support for Scalable mMTC Communications in 5G Networks. IEEE Access 2018, 6, 28969–28992. [Google Scholar] [CrossRef]
- Lee, C.C. Fuzzy logic in control systems: Fuzzy logic controller. I. IEEE Trans. Syst. Man. Cybern. 1990, 20, 404–418. [Google Scholar] [CrossRef] [Green Version]
Figure 1.
Industry 4.0 technologies and their interdependence.

Figure 2.
Approximate comparison of wireless technologies for IIoT.

Figure 3.
Comparison between retail logistics and Smart Logistics.

Figure 4.
Typical environments for logistics..

Figure 5.
Overview of the proposed system.

Figure 6.
Fuzzy logic controller for application modeling.

Figure 7.
Membership functions for the LOW and HIGH fuzzy values.

Figure 8.
Example of the modeling process.

Figure 9.
Network slicing in the RAN.

Figure 10.
Expected gains.


Table 1.
Fuzzy rules.
| Profile | Rule |
|---|---|
| URLLC | Latency is LOW OR Criticality is HIGH |
| eMBB | Bandwidth is HIGH |
| mMTC | Bandwidth is LOW AND Traffic is HIGH |
Publisher’s Note: MDPI stays neutral with regard to jurisdictional claims in published maps and institutional affiliations. |
© 2021 by the authors. Licensee MDPI, Basel, Switzerland. This article is an open access article distributed under the terms and conditions of the Creative Commons Attribution (CC BY) license (http://creativecommons.org/licenses/by/4.0/).
Share and Cite
MDPI and ACS Style
Khatib, E.J.; Barco, R. Optimization of 5G Networks for Smart Logistics. Energies 2021, 14, 1758. https://0-doi-org.brum.beds.ac.uk/10.3390/en14061758
AMA Style
Khatib EJ, Barco R. Optimization of 5G Networks for Smart Logistics. Energies. 2021; 14(6):1758. https://0-doi-org.brum.beds.ac.uk/10.3390/en14061758
Chicago/Turabian StyleKhatib, Emil Jatib, and Raquel Barco. 2021. "Optimization of 5G Networks for Smart Logistics" Energies 14, no. 6: 1758. https://0-doi-org.brum.beds.ac.uk/10.3390/en14061758
Note that from the first issue of 2016, this journal uses article numbers instead of page numbers. See further details here.