
Evaluation of Inoculated Waste Biological Stabilization Degree by Olfactometric Methods


Faculty of Building Services, Hydro and Environmental Engineering, Warsaw University of Technology, 00-653 Warsaw, Poland
Energies 2021, 14(7), 1835; https://0-doi-org.brum.beds.ac.uk/10.3390/en14071835
Submission received: 18 February 2021
/
Revised: 20 March 2021
/
Accepted: 22 March 2021
/
Published: 25 March 2021
(This article belongs to the Special Issue Biowaste Management)
Abstract
:As a result of compounds’ transformation in the waste biostabilization phases, there is an increase in odor nuisance and health problems among people exposed to odorants. Linking the odor concentration to the degree of waste biostabilization may be an important tool for the assessment of individual technological variants of biostabilization. The study aimed to link the odor emissions to the biostabilization degree in individual process variants that differed in the inoculum. The tests were carried out on inoculated windrows on the waste mechanical-bological treatment open site. Odor concentrations were measured during the entire seven-week process of biostabilization (weeks 1–7) and compared with kinetics parameters of organic compounds’ decomposition. The olfactometric tests showed the necessity of using the preparation to reduce the value of odor concentration. Research proved that the decrease of odor concentration values could be useful to indicate the particular phases of biostabilization. Also, the proposed method provides an opportunity to optimize the process concerning the function related to the low degree of odor nuisance of the technologies, including selection of environmentally safe inoculum. This issue has application values that may result in the implementation of new control systems for waste stabilization bioreactors and the evaluation of applied technological solutions.
1. Introduction
Health issues are associated, directly or indirectly, with every step of the handling, treatment, and disposal of waste. The direct impact includes exposure to hazardous substances in the waste or emissions from incinerators and landfill sites, vermin, odors, and noise [1,2]. While municipal solid waste (MSW) disposal is still a crucial issue, the mechanical biological treatment (MBT) plant is an important element of an integrated solid waste management system [3]. Those installations are a cost-effective, appropriate solution used both in developing countries [4], where specific solutions depend primarily on financial constraints, and in developed countries. In Europe, where waste incineration plants are part of municipal waste management programs, MBT installations have an important complementary role, especially when incineration does not meet the guidelines for full treatment or when an indirect strategy is needed [5]. They can reduce the environmental impacts due to leachate and landfill gas emissions, reducing the biodegradable organic content of waste [6]. However, nuisance due to odor generation by waste treatment plants (landfill and composting plants) and animal production operations is one of the major sources of complaints of people living near these facilities [7,8,9]. Sulfur compounds—especially hydrogen sulfide, methanethiol, dimethyl sulfide, and dimethyl disulfide [10]—were the primary odor in the majority of MSW disposal facilities, which presents potential health risks for on-site workers [11,12,13] and inhabitants of nearby settlements. Moderate H2S concentrations can cause severe eye and respiratory irritation, headache, dizziness, nausea, vomiting, staggering, and excitability, while high concentrations can cause shock, convulsions, inability to breathe, rapid unconsciousness, coma, and death. Toxic effects of dimethyl sulfide, dimethyl disulfide, and methyl mercaptan are mainly the same as those of hydrogen sulfide [14]. At lower concentration values numerous complaints about health problems of people living near the source of odorant emissions are reported anyway. They are not connected with a direct threat to health but, first of all, with irritation from the smell nuisance and purely psychological effects [15,16,17]. This is even more important because odorous compounds can spread over long distances. Depending on the weather conditions, the range of the emitter can be as long as a few kilometers but usually the odor nuisance is estimated to be within 500 m of the emitter [18]. Studies on the environmental impact of waste treatment installations should consist of both olfactometric and chromatographic analyses [19,20], taking into account the individual phases of the process related to changes in the composition of the gases and, consequently, the quality and quantity of odorants contained in them.
One of the physical methods of odor treatment is membrane covering. Sun et al. studied the membrane-covered aerobic composting and analyzed NH3 emissions, and the results showed that they decreased by 20–30% [21]. Li et al. proved that, in comparison with the control group, the NH3 and H2S emissions outside the membrane of the membrane-covered group decreased by 58.64% and 38.13%, respectively [22]. Nowadays, instead of membrane covering and adding chemicals to the waste, it is increasingly common, together with biofiltration, to inoculate waste with mixtures of microorganisms and enzymes [23,24,25,26,27,28,29,30]. The advantage of fungi, compared to bacteria, is that they have an aerial mycelium and volatile odor compounds may be more efficiently captured [31]. However, while these methods are costly and often insufficiently effective, published results are still controversial and further studies are needed for a more detailed explanation of the processes [29]. Among inoculants, it is worth mentioning EM (effective microorganisms) biopreparations and their modifications. The EM preparation was created by Teruo Higa, who used naturally occurring microorganisms in the environment, including lactic and photosynthetic lactic acid bacteria, yeasts, radiophytes, and fungi [32]. The species composition of the microorganisms used in these preparations is unknown. Most often it is only reported that they contain 80 species of anaerobic and aerobic microorganisms represented by lactic fermentation bacteria, phototrophic bacteria, radiophilic bacteria, yeasts, and other fungi, but there is no information on the abundance of these microbial groups. Moreover, the studies of Jakubus et al. did not confirm the beneficial effect of EM preparation on the intensification of organic matter mineralization process [33]. In addition, the study of Maroušek et al. showed that when analyzing compost inoculated with seven types of inoculum—mainly a mixture of bacteria, enzymes, and nutrients—only in two cases was the quality of the compost similar to the blank sample (without the addition of inoculum) [34]. However, as mentioned by these authors, the addition of biochar can significantly improve compost quality. Biochar is a carbonaceous product of biowaste pyrolysis, widely recommended for soil conditioning, waste stabilization, and phosphorus sorption in wastewater treatment plants [35] as well as potato biowaste management [36]. In addition, satisfactory results in accelerating the processes of anaerobic fermentation of maize silage were obtained by Maroušek et al., using the high-voltage discharges coupled with water plasma expansion for phytomass disintegration. Authors achieved over 15% increase in cumulative methane production and overall acceleration of fermentation process [37].
In Europe, a set of both anaerobic [38] and aerobic [39,40] tests were proposed to assess the degree of biostabilization. Among them, respiration activity (AT4) [41,42] and anaerobic gas generation potential (treatment fermentation test GB21 or incubation test GS21) [43] are commonly used. The respiration activity test can take up to seven days to complete [44], while decisions to complete the thermophilic phase, when the process is in two stages, must be made in real time [45]. Due to the time-consuming nature of these measurements, it is suggested that AT4 should be replaced by respiratory tests based on the dynamic respiration index (DRI) [20,46,47] or RI (respiratory index), carried out at process temperature for 4 or 24 h [48]. This is all the more reason why there is a high, positive correlation between these indices and AT4 [45,49,50]. The value of linear determination factor r2 between RI and AT4 was 0.997 [51]. Moreover, it is suggested to extend the scope of respiratory testing or even replace it with organic matter fractionation during acid hydrolysis [52,53] and measurements of chemical parameters such as volatile solids’ (VS) content and organic carbon content in waste mass [54,55]. However, the latter parameter cannot be used as an indication of the current availability of biodegradable compounds [56]. The author suggests that it is necessary to supplement the abovementioned scope of research with an analysis of changes in water extractable organic matter (WEOM) content. Among the parameters determined in WEOM, dissolved organic carbon (DOC) content is a reasonable indicator of biostabilization efficiency [57].
Monitoring of the emission of catch compounds is undoubtedly one of the important issues in the process of controlling the biostabilization of municipal waste, taking place in mechanical and biological waste treatment installations. The emission of these compounds, their quantity, and composition are determined primarily by the transformations taking place in the aerobic phases of the waste biodegradation process: mesophilic, thermophilic, cooling and conversion, and maturation. The amount and composition of the emitted odorous substances change because of the waste input stream reaching the parameters of the next phase. These processes can have the effect of increasing the concentration of odor emitted from the windrow. As a result, there is also an increase in odor nuisance and health problems among people exposed to odorants. Due to the above, linking the odor concentration to the degree of waste biostabilization is particularly important. The odor concentration is a parameter determined in a short time in situ, without requiring time-consuming tests.
The study aimed to link the odor emissions to the degree of biological stabilization of waste by examining the relationship between odor concentration and selected parameters of the biodegradation process, loss on ignition, and organic carbon in individual process variants. These variants differed in the type of substances with which waste windrows were inoculated. The partial objective was to select the best one from among them, considering both waste parameters and odor impact (the value of odor concentration in individual phases of the biostabilization process). The criteria for the selection were: the lowest odor concentration values and highest values of decomposition rate.
2. Materials and Methods
2.1. Object Characteristics
Mixed municipal waste received at the plant was shredded in the unloading hall and sieved into the oversize fraction (>80 mm) for energy recovery and the undersize fraction (<80 mm) requiring further processing in biological processes. The <80 mm fraction was used to form single windrows, 52 m long, 8 m wide, and 2.7 to 3.0 m high, containing about 500–550 Mg of waste with an assumed volume weight of 490 kg/m3. (Under operating conditions, this weight is higher.) Windrows, oriented in a north–south axis, were covered with semi-permeable membranes. The waste was aerated using air fed through a system of sealed longitudinal channels laid in the ground (three channels per windrow), which also had a drainage function for the leachate produced in the process of biostabilization. The windrow aeration channel (N/S oriented) was 50 m long and had an inner width of 15 cm. The aeration process was carried out using radial fans with a capacity of 51 m3/min, pressure difference was 3800 Pa, and motor power was 3 kW, with an intensity of 1.5 m3/Mg/h. The aeration time in the first 20 days was 240 min/day and for the remaining time of biostabilization it was 280 min/day. The aeration intensity was 3060 m3/min. The individual aeration cycles consisted of 600 s on, 90 s off break. The biostabilization process was carried out until the respiration activity (AT4) coefficient was below 10 mg O2/g d.m.
Also, the loss of ignition parameter should be below 35% of dry matter, and the organic carbon content should be below 20% of dry matter, which takes from six to nine weeks. During the pouring process, the windrows were inoculated with organic waste stabilizer (OWS) from 0.8 l/Mg to 1.2 l/Mg. In the present study, “standard”, “reference” windrow is understood as windrow with organic waste stabilizer in the amount of 0.8 l/Mg. Such a dose is commonly used in practice. A “reference” windrow was inoculated by OWS for each “experimental” windrow, and those two windrows were deposited simultaneously, based on the similar waste, and deposited and inoculated at about the same time. The tonnage of “reference” windrows was about 500 Mg.
2.2. Characteristics of Substances Added to Waste to Reduce Odor Nuisance
During the analyses, the following preparations were used in the windrows:
- Organic waste stabilizer (OWS): According to the safety data sheet, the composition of the preparation was formed: phototrophic bacteria, lactic acid bacteria mix, yeast, cane molasses, water.
- Phyto-1: pure nettle extract, microelements, minerals, acetic acid, and sugar. According to the safety data sheet, it contained nettle extract, agricultural and vegetable oils from food and animal feed production, acetic acid, molasses, microelements (magnesium (0.03%), sulphur (0.01%), organic matter (5.5%)), total nitrogen (0.31%), total phosphorus (P2O5) (0.02%), and potassium oxide (0.08%).
- Bio-1: preparation containing thermophilic bacteria, yeast, molasses, and water.
- Bio-2: universal microbiological agent based on living probiotic bacteria cultures, which includes living cultures of lactic acid bacteria, radiophilic and phototropic bacteria, yeast, ethanol, natural acetic acid, sugar cane molasses, and clean, unchlorinated water. Another variant was Bio-2 with added plasticizers (Bio-2 plast.).
- Chem-1: a preparation containing quaternary ammonium compounds.
The names of the last four preparations (Phyto-1, Bio-1, Bio-2, and Chem-1) were changed for confidentiality reasons.
2.3. Methodology
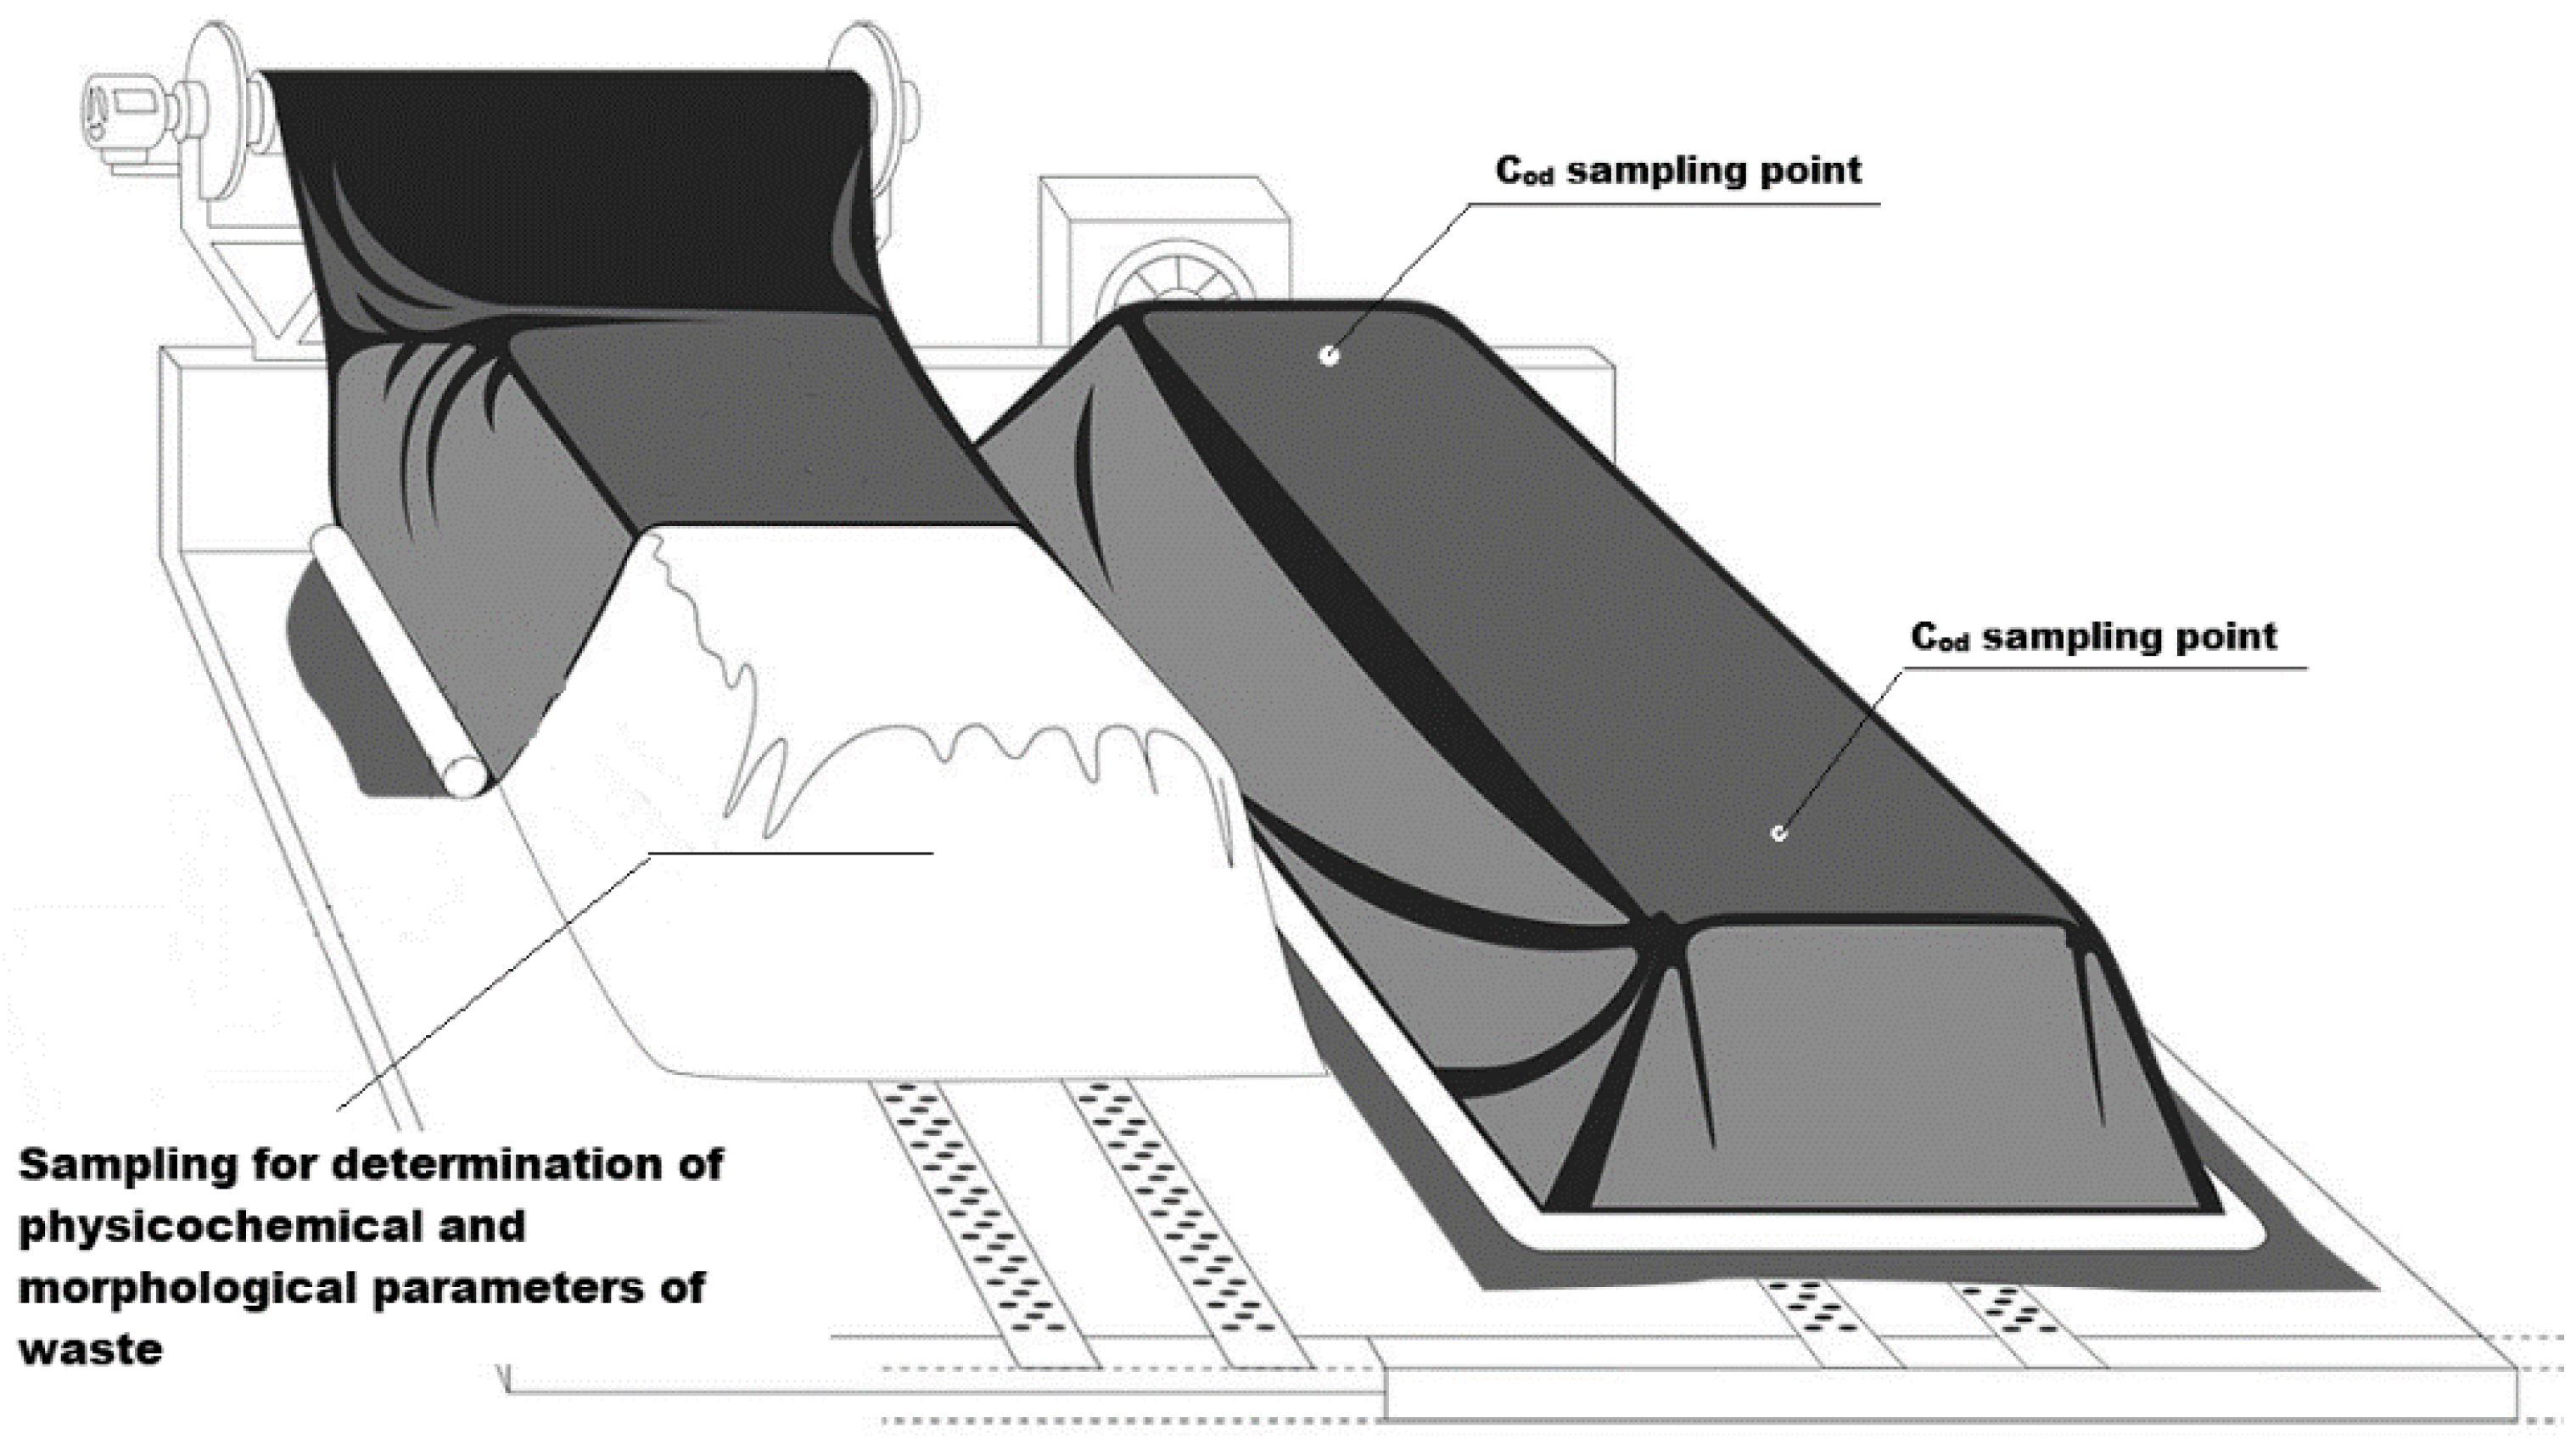
The tests were carried out on windrows located on the open MBT installation site. The time interval between individual series was from one to seven days. The full cycle lasted for seven weeks, from the placement of the windrow and covering it with a geomembrane to the completion of the biostabilization process. Bulk density was determined according to standard PN-EN 1097-3:2000, moisture was determined according to CEN-TS 15414-1:2010, general organic substances were determined according to PN-EN 13137:2004, loss on ignition was determined according to PN-EN 15169:2011+Ap1:2012, and morphological composition was determined according to PN-93/Z-15006, while AT4 was measured according to ÖNORM S 2027 “Evaluation of waste from mechanical-biological treatment—Part 4: Stability parameters—Respiration activity (AT4)”, the method of the determination of oxygen consumption during incubation. Table 1 summarizes the test results of physicochemical parameters and morphological composition of waste deposited in the biostabilization square from 2015 to 2017.
The samples were taken under the vapor-permeable membrane. Sampling from under the membrane was done by inserting an odorless silicone tube directly under the membrane through holes located 40 m away from each other, on the north and south sides of the windrow. Air was pumped through the tube to the olfactometer.
The samples were analyzed with the Scentroid SM-100 (IDES Canada Inc., Whitchurch-Stouffville, ON, Canada) field olfactometer, a dilution instrument to present an odor, at different concentration levels, in a controlled way to the assessor. An odorous air is diluted via a valve system. SM-100 uses compressed air from a cylinder to dilute the test air sample. This cylinder is a high-pressure (31 MPa) carbon fiber container filled with compressed air. The device incorporates a dilution valve adjuster, which has a high accuracy to provide a constant flow of diluted air, to select one of 15 positions that correspond to the dilution ratio of clean air to the test air sample. The range of the device is selected through replaceable plates; a minimum of 2-fold dilution and a maximum of 30,000-fold dilution may be achieved. An active carbon filter additionally provides cylinder air purity [58]. This olfactometer is characterized by much higher accuracy than the commonly used Nasal Ranger field olfactometer and a larger range of determination [59]. The test consists of several times inhaling clean air from the cylinder and then slowly adjusting the dilution valve to increase the concentration of tested air until the odor becomes detectable. The values obtained from the adjustment knob corresponded to the odor concentrations of the polluted air. Before each test, a Sniffin’ Sticks test (SST) according to standard ISO 13301:2002 was performed to assess the olfactory performance of the tester. Four olfactometric measurements were taken at each point. Each time the ZITE ratio values defined in PN-EN 13725—individual estimation of dilution up to the sensing threshold—were calculated. The value of olfactory concentration was calculated as a geometric mean from the set of results of individual measurements. Figure 1 contains the scheme of covered windrows with sampling points.
2.4. Financial Assessment
The current price of SM-100 olfactometer is about $4000. When odor tests will be conducted by several trained employees of the plant (for example, four), a certain number of individual olfactometers can be purchased. Alternatively, if the measurements are not conducted at the same time, in parallel, the same olfactometer can be used, but then replaceable masks must be used. Their price is insignificant in relation to the cost of the device. As mentioned, panelists will be required to undergo a comprehensive sniff test prior to each survey to see if they are suitable to perform the measurements that day. In this case, the SST test, also used in this study, can be used. The Screening SST-12 test (12 sticks) costs approximately $400.
3. Results
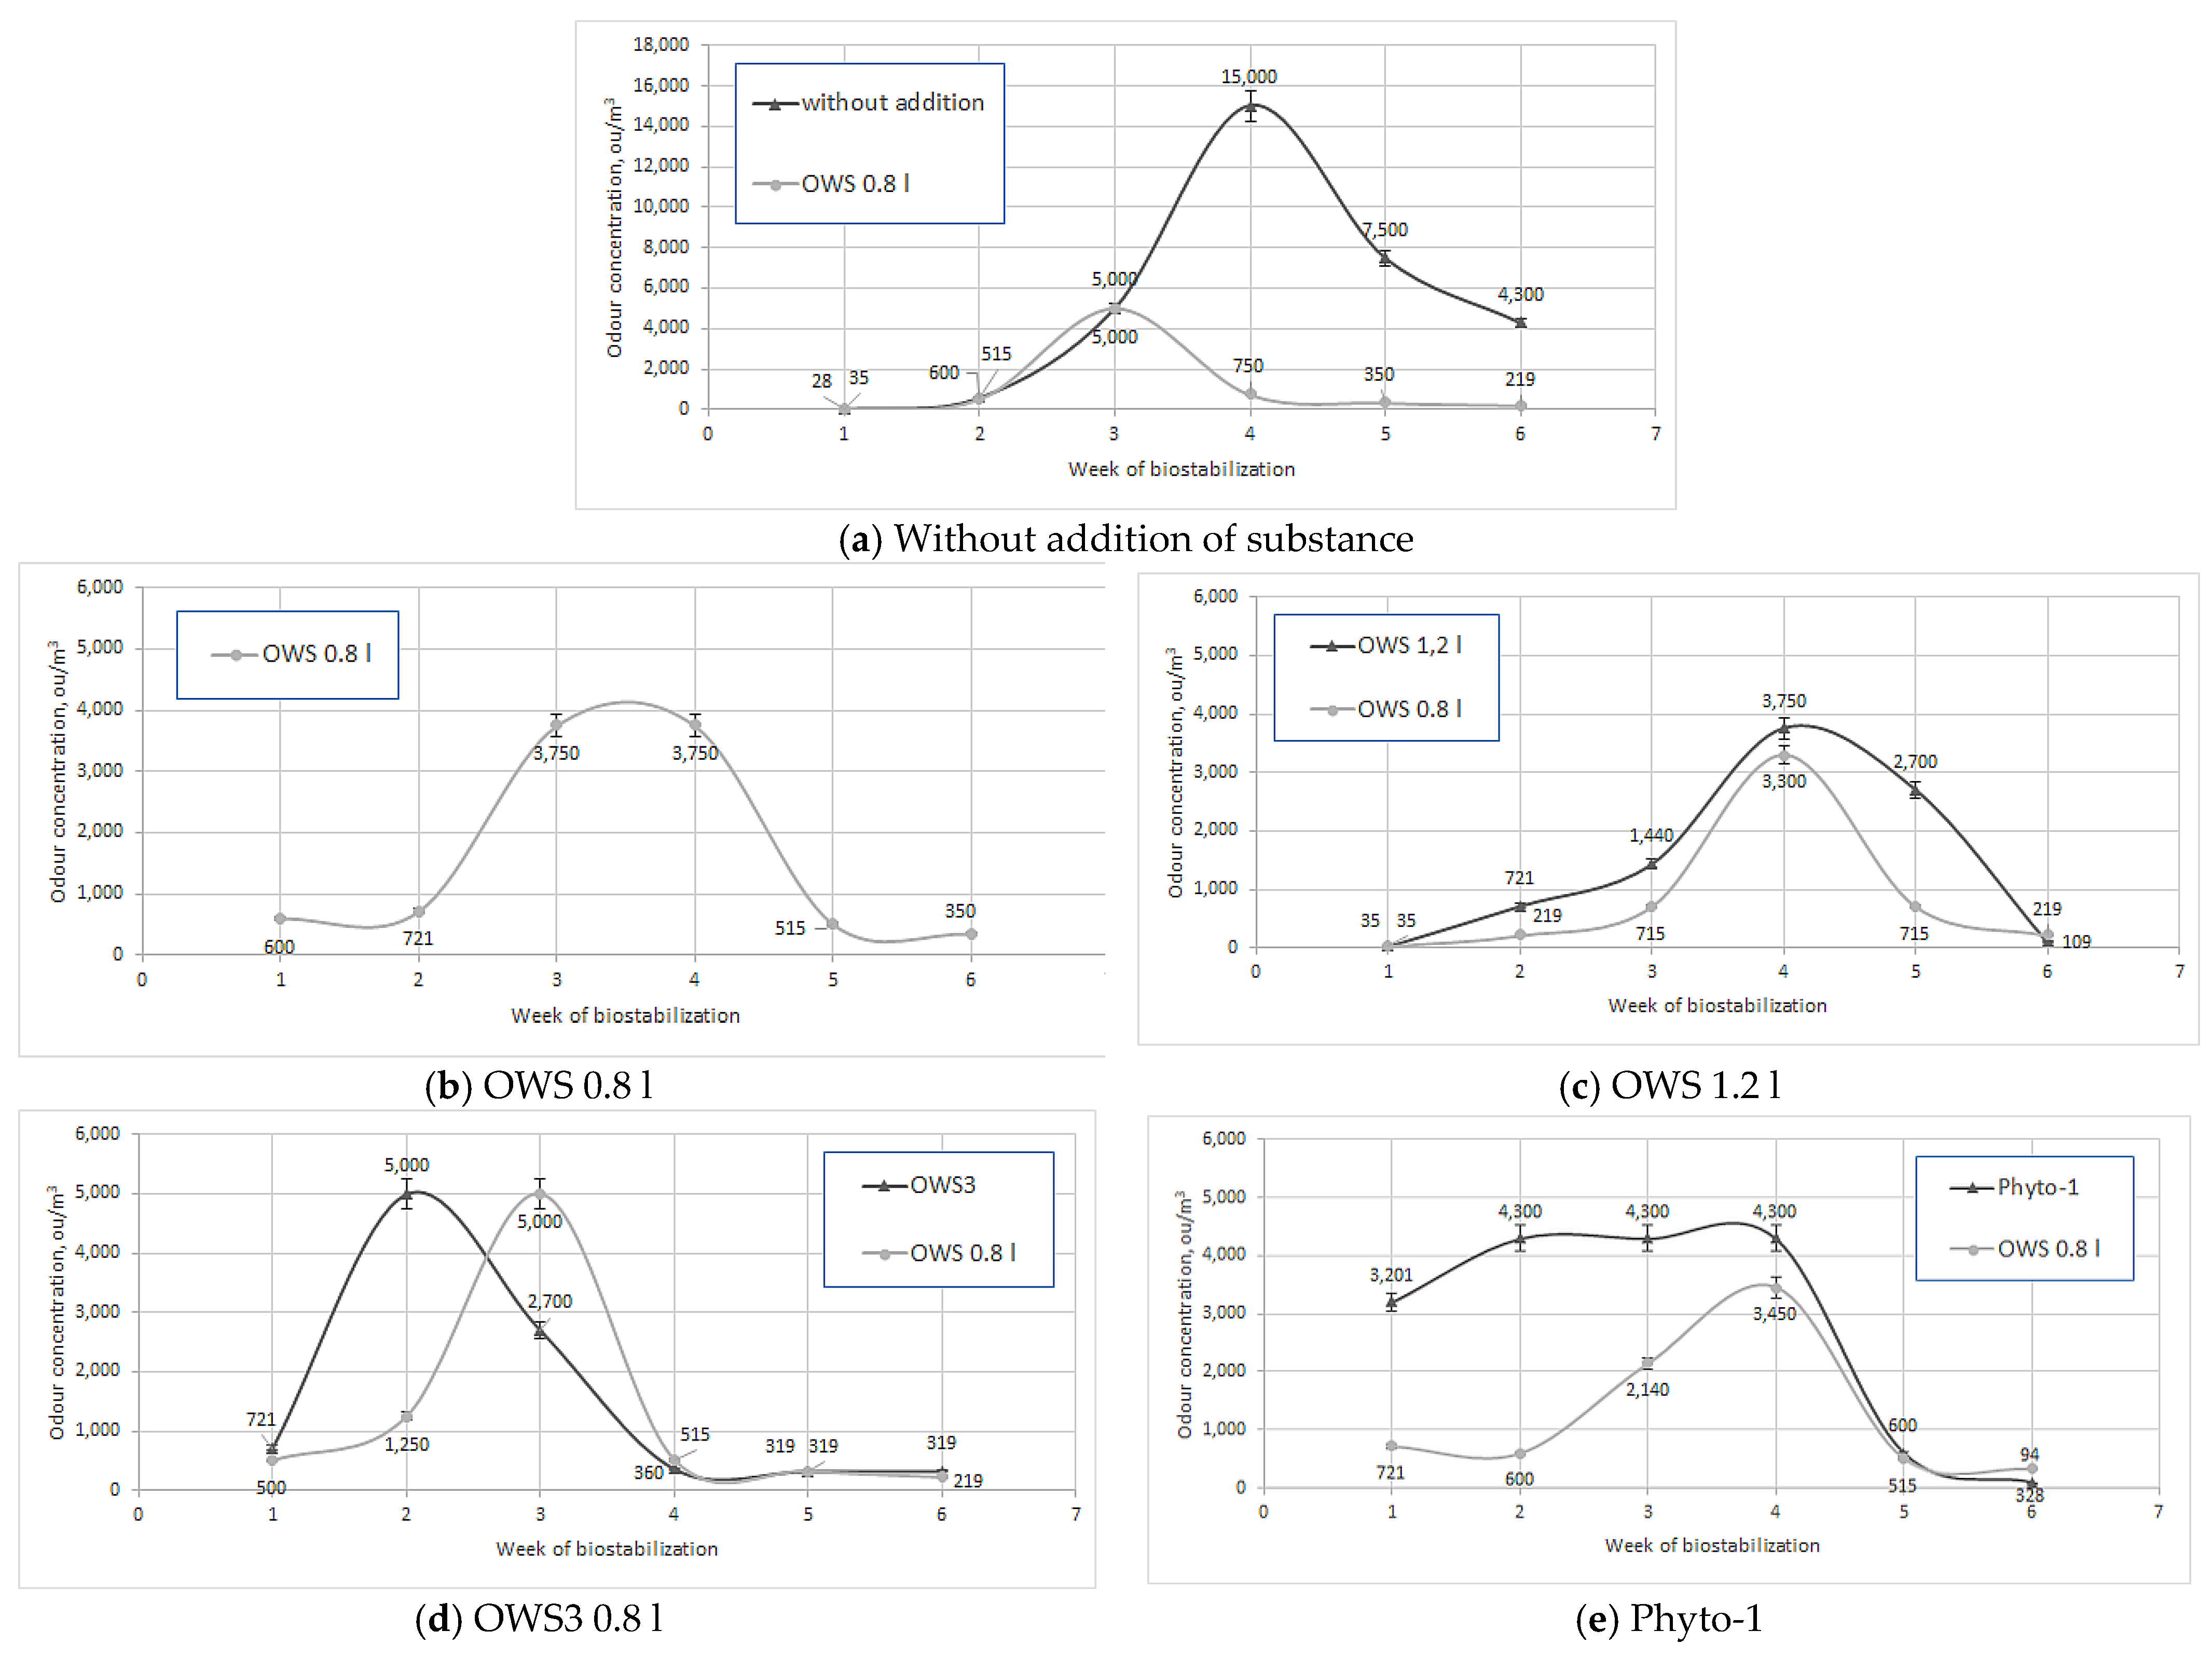
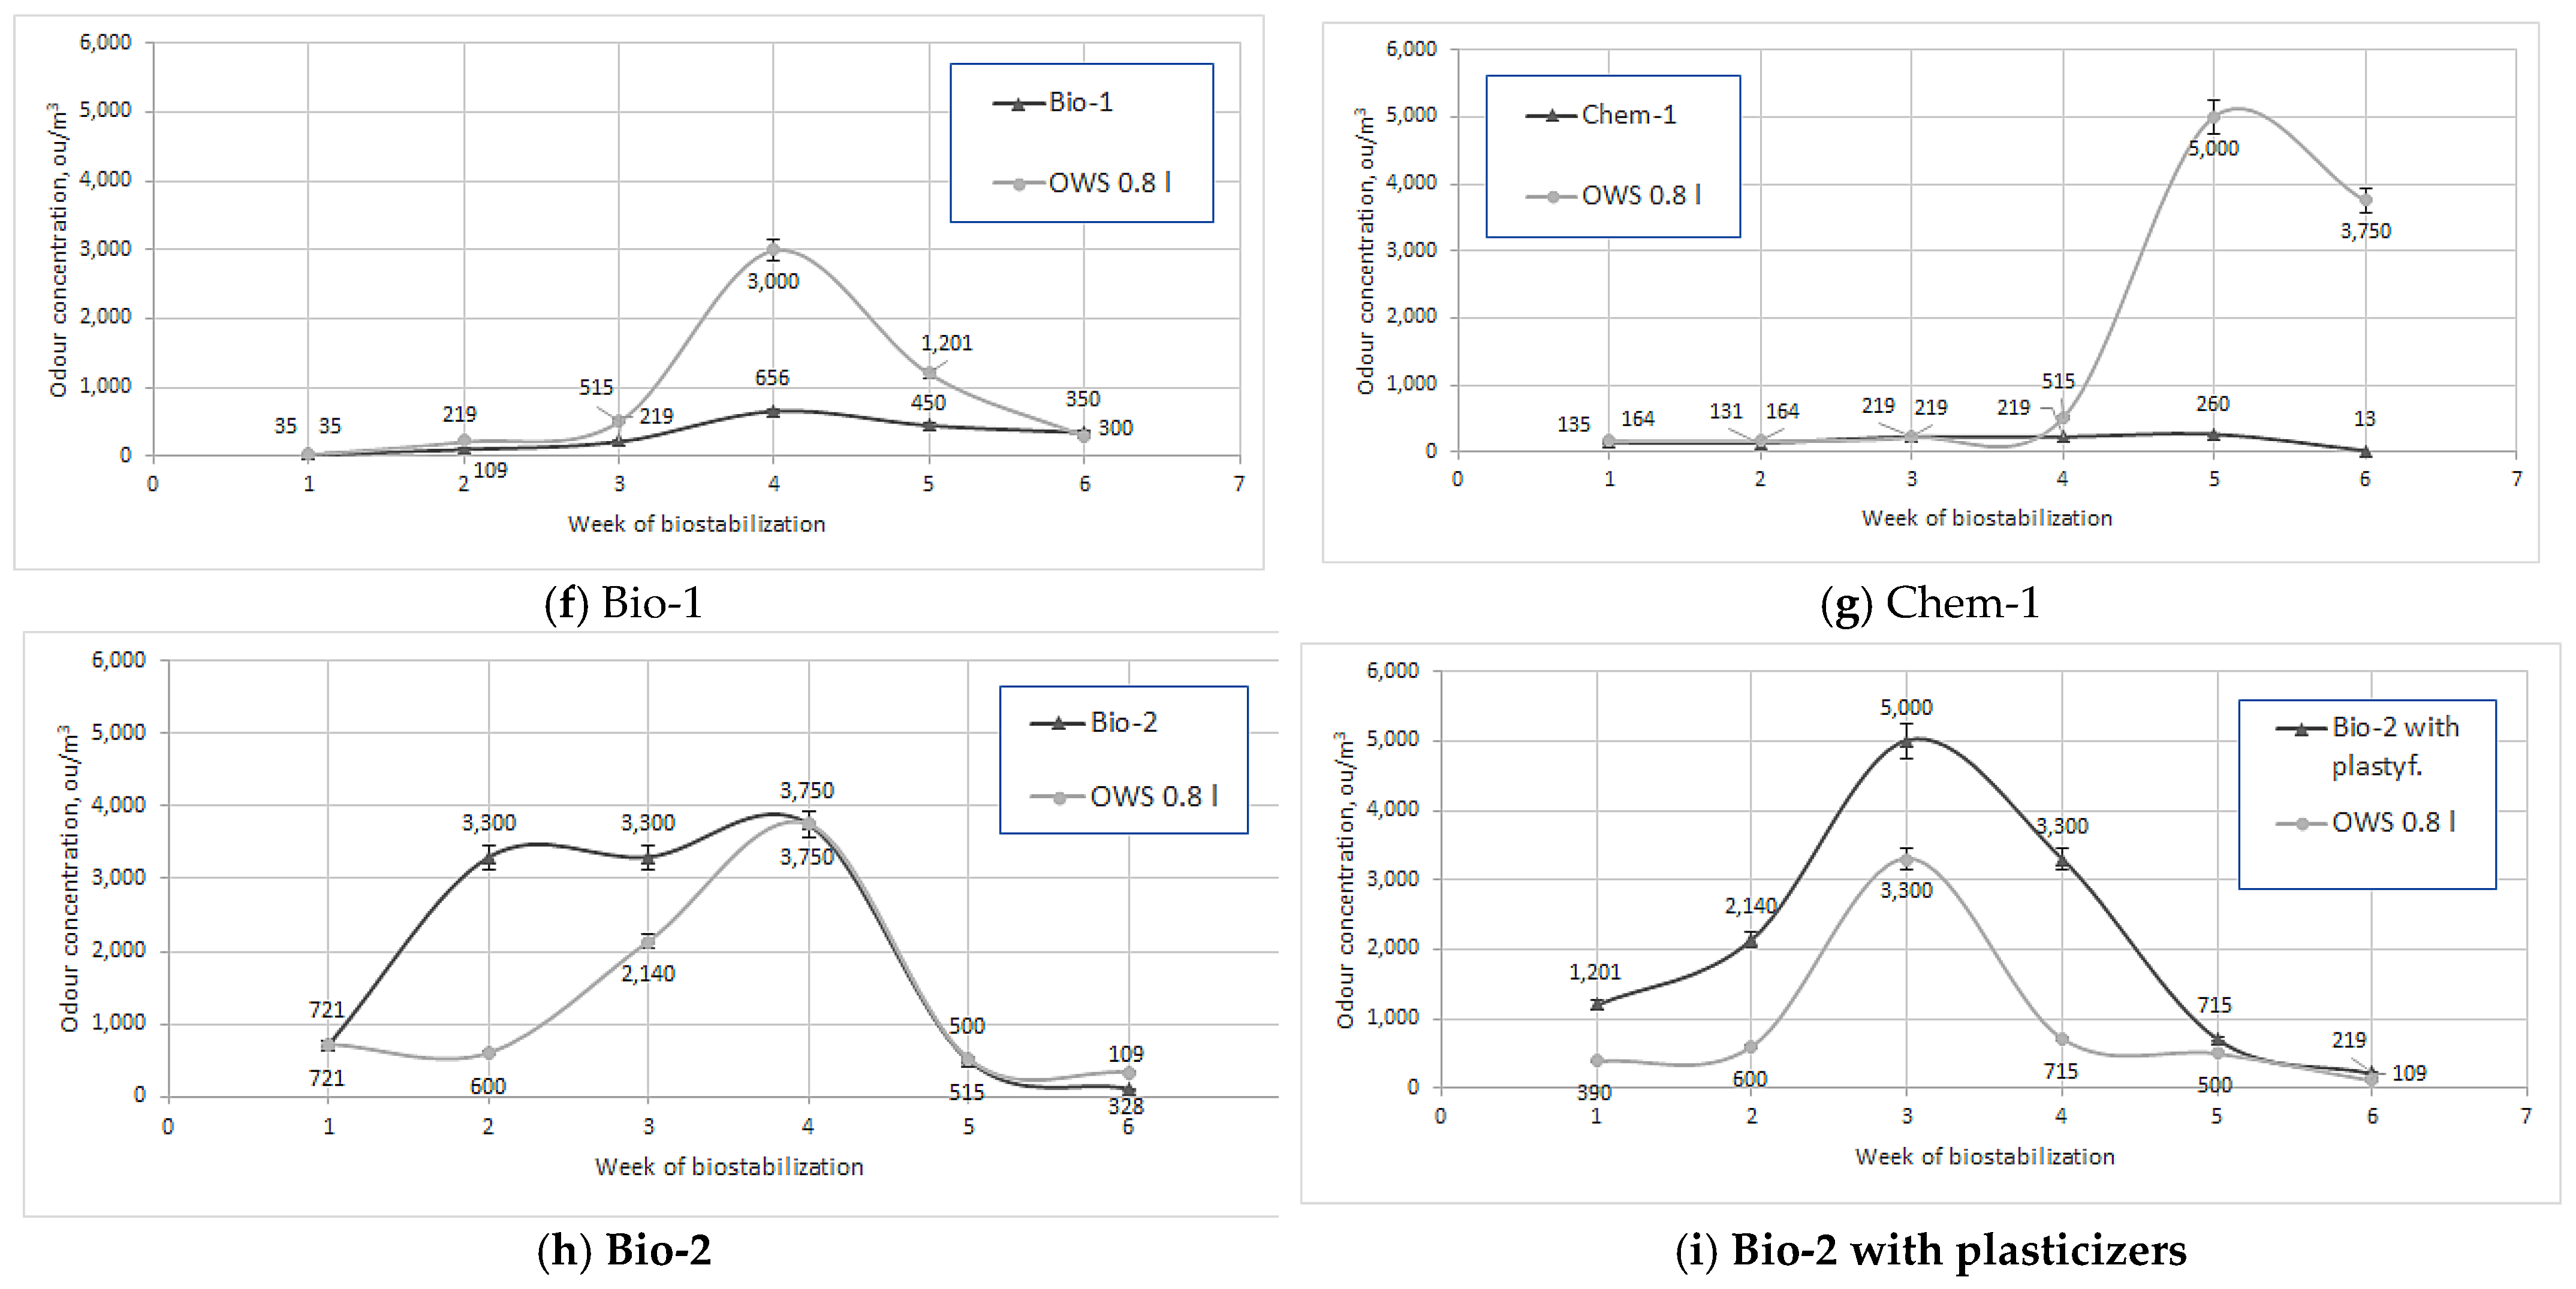
To verify whether the choice of location of the air samples taken from under the membrane could influence the results obtained, a comparison was made between the results of the samples taken from the southern and northern side of the windrow. According to the Mann–Whitney test results, at a significance level of p = 0.992, the null hypothesis of the statistically significant difference between odor concentrations determined at both parts of the windrow was rejected. Eight different variants of the biostabilization process were studied. Table 2 contains a summary of the physicochemical and morphological parameters of the waste deposited in the studied windrows, while Figure 2 shows the dependence of odor concentration on the week of biostabilization in the variants under consideration.
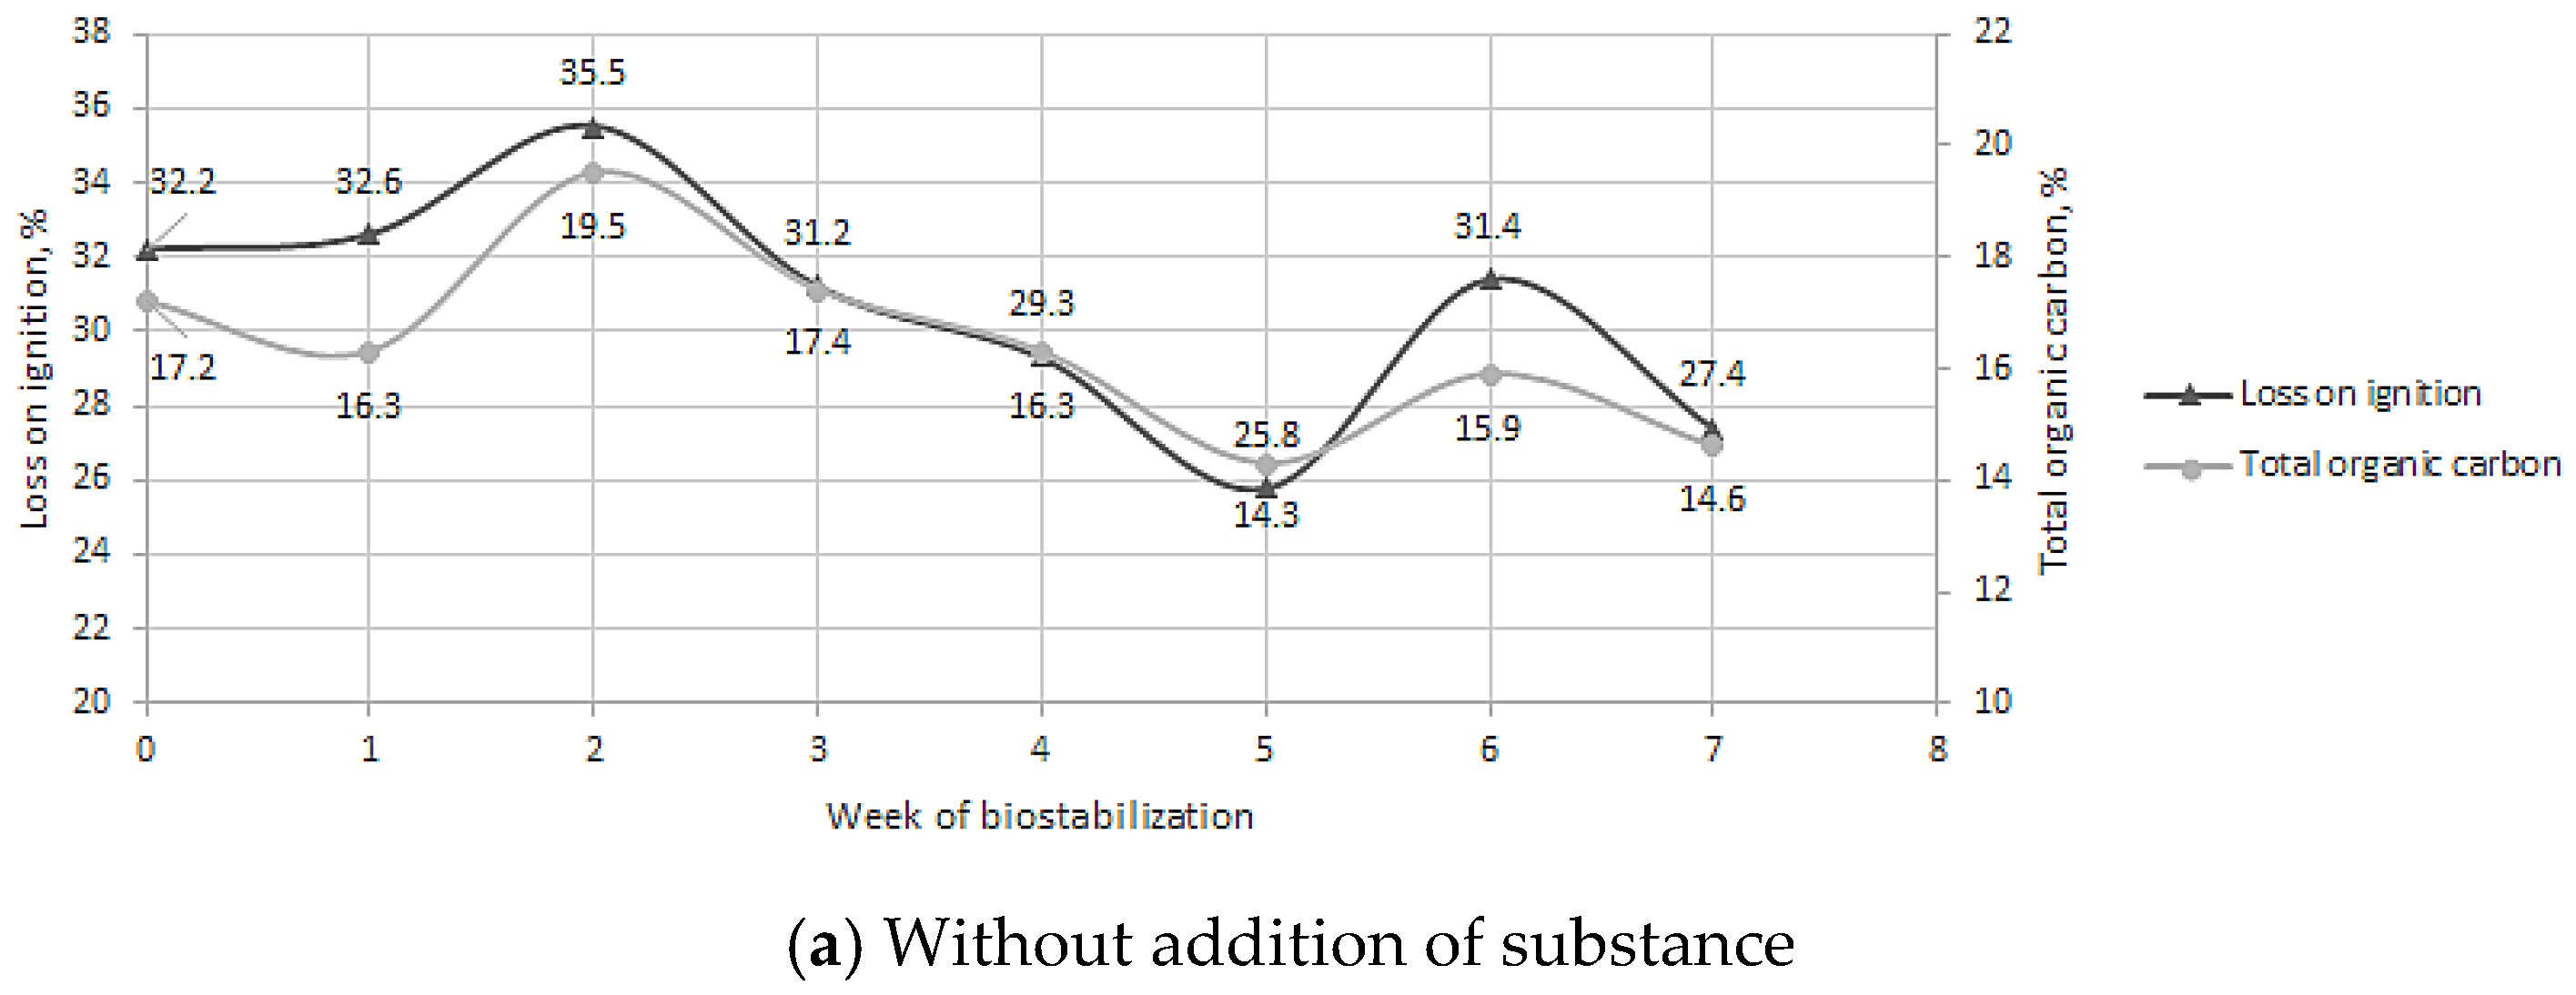
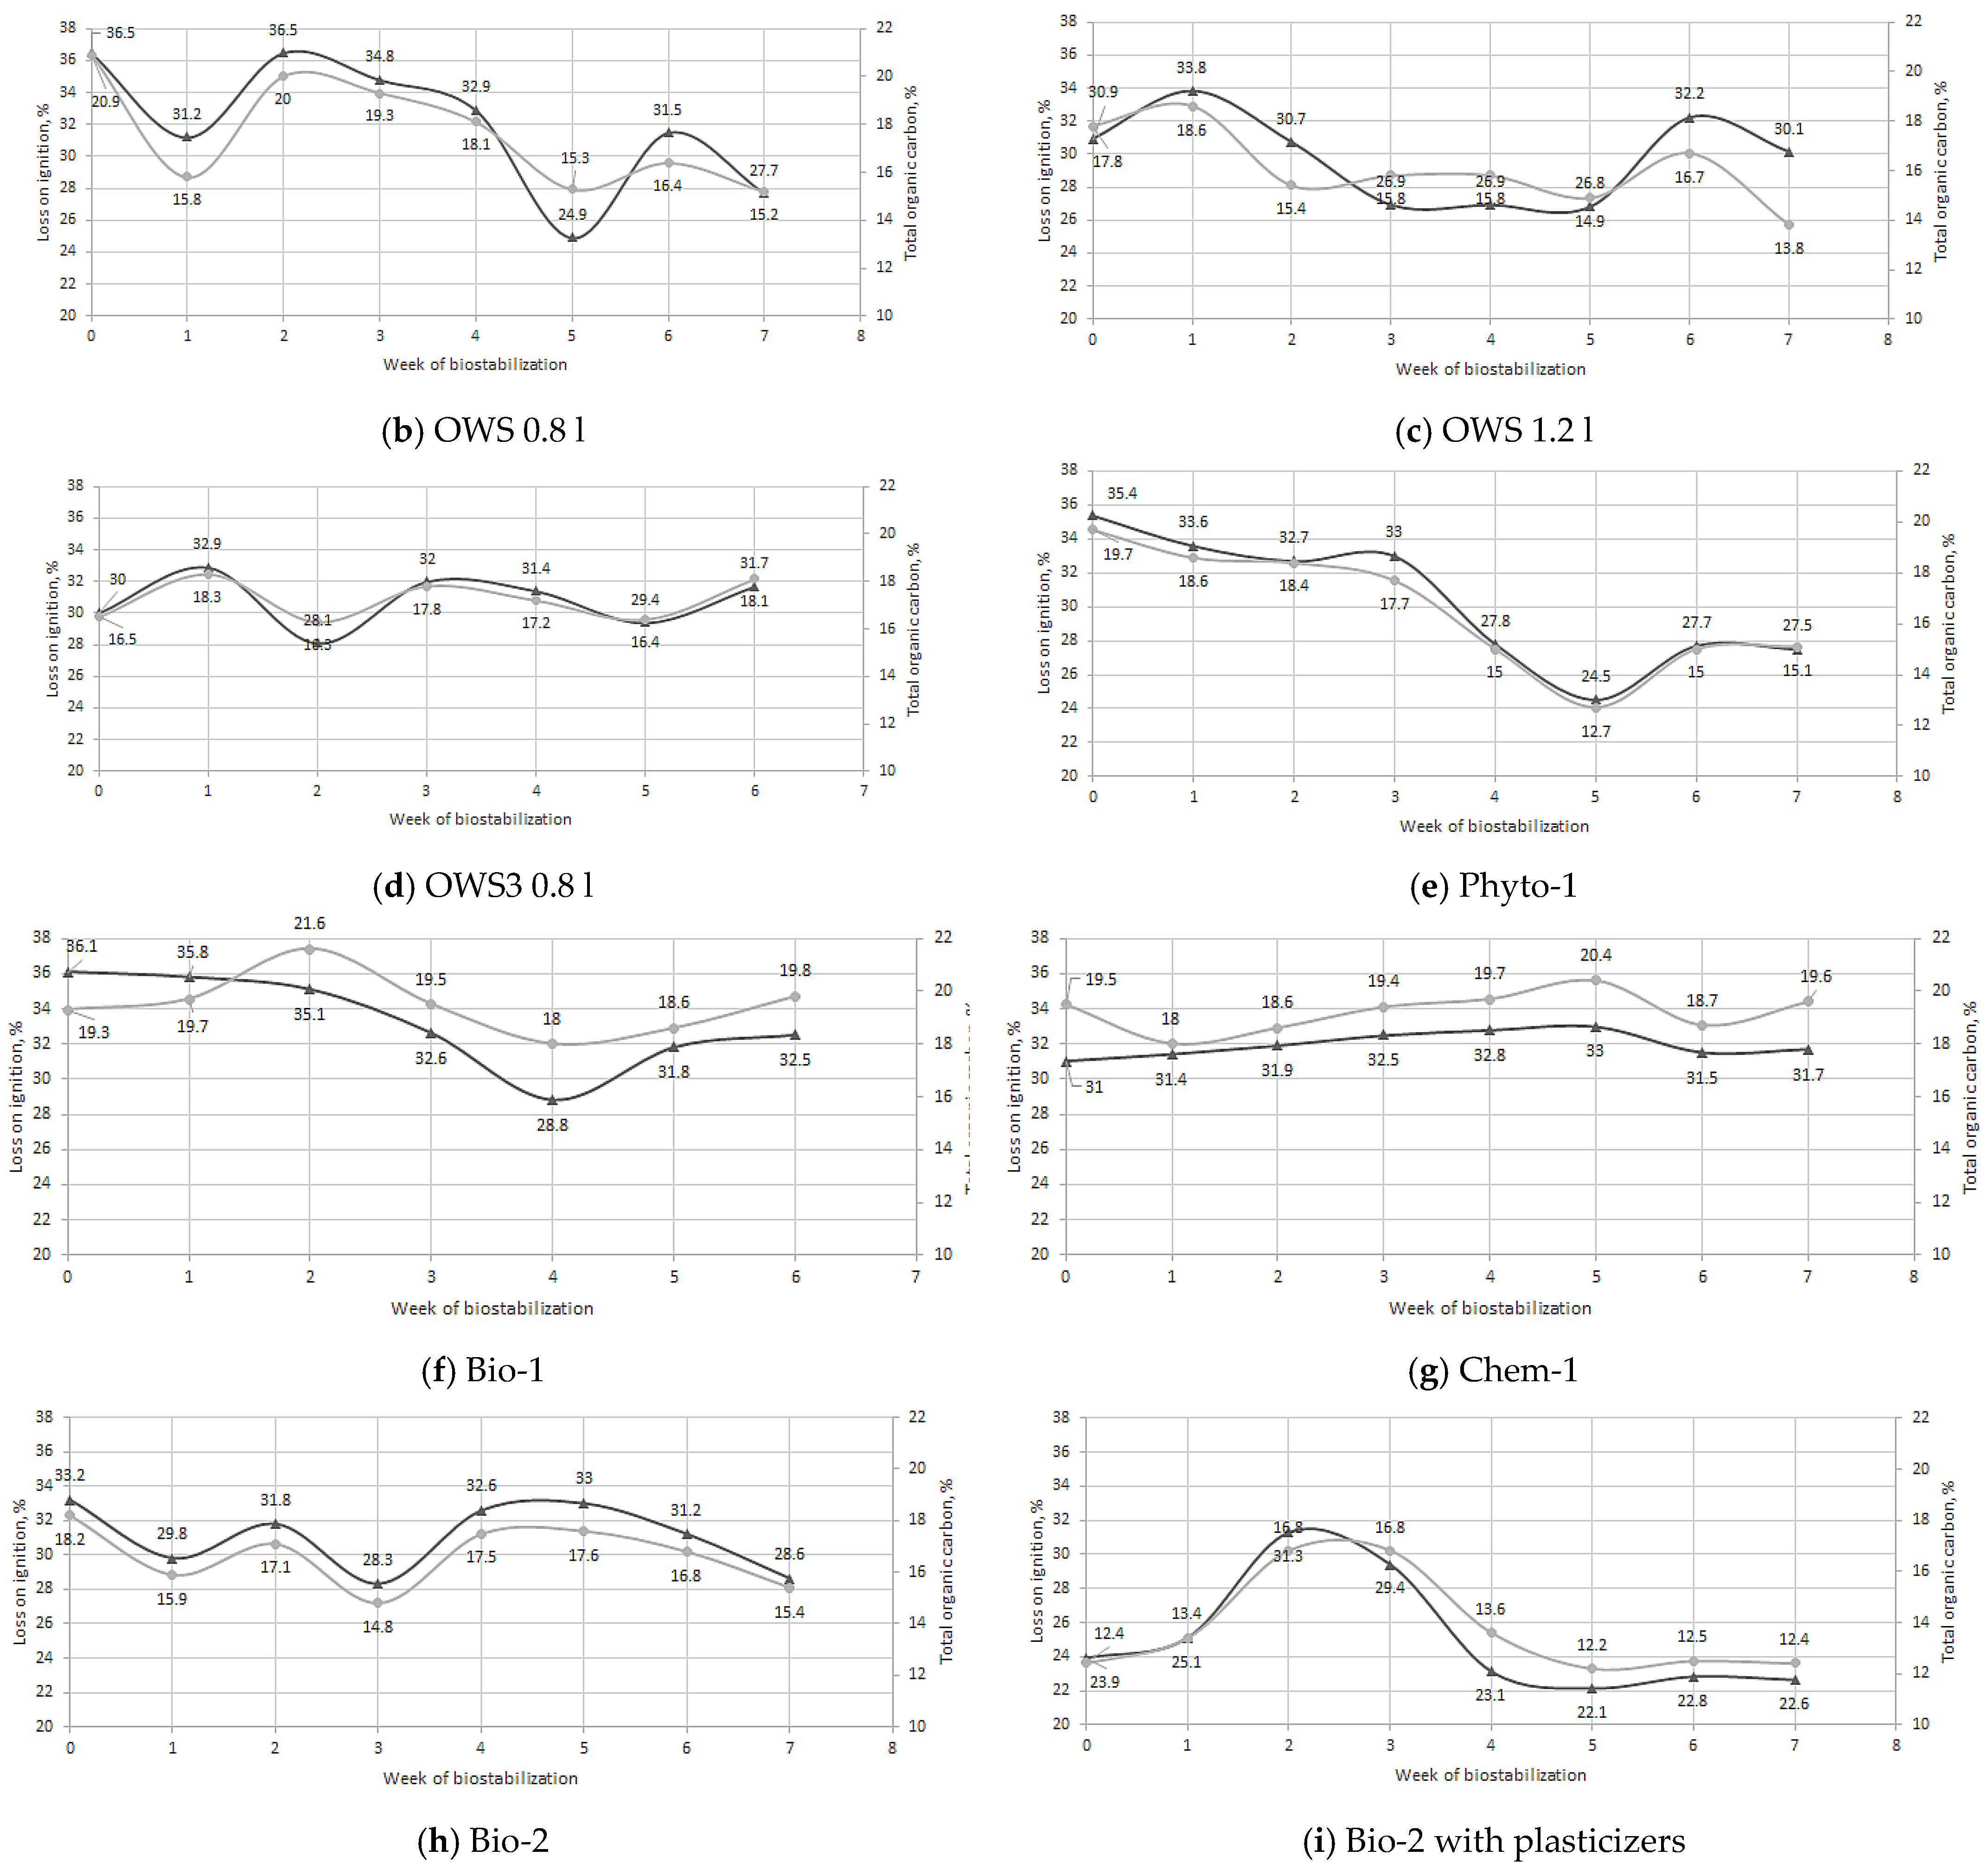
The highest odor concentration values were recorded, in most cases, during the third or fourth week of the process. For OWS3 0.8 L, odor concentration maximum occurred at the second week, while for Chem 1, it occurred at the fifth week. During the first weeks of waste stabilization with Chem-1, odor concentrations remained at 135–219 ou/m3. In the fifth week, the concentration increased to 5000 ou/m3 and there was a rapid intensification of the processes and emission of odorogenous compounds. This was because the inoculation, which was a mixture of nitrogenous compounds, slowed down the biodegradation processes of the waste in the test pile. For the windrows inoculated with Bio-2 and Bio-2 with plasticizers, the maximum odor concentration was observed at the fourth and third weeks, respectively: It was 3750 ou/m3 and 5000 ou/m3. The addition of plasticizers caused a significant intensification of odorogenous emissions already in the first weeks of biostabilization. Additionally, the odor in this pile was very pungent: Acetone was smelled in the pile for six weeks. Figure 3 shows the dependence of loss on ignition and total organic carbon on the week of biostabilization.
In most cases, the loss on ignition values ranged from 27.5% to 36.5%, while total organic carbon ranged from 14.6% to 21.6%. In the case of Bio-2 with plasticizers’ inoculation, the values were slightly lower, ranging from 22.6% to 31.3% (loss on ignition) and 12.4% to 16.8% (total organic carbon). In most cases the trend was downward and significant fluctuations, apart from the variability resulting from the biostabilization phase, could have been due to the heterogeneity of sampling matrix.
Stegenta et al. (2016) demonstrated that the model that best describes oxygen consumption from the biological decomposition of waste organic matter by microorganisms is a first-order model, while the kinetics of decomposition of organic compounds is described by the Formula (1) [60]:
where:
C = C0 · e−kr·t
- C is the content of organic compounds in the dry mass of the sample at time t, %;
- C0 is the initial content of organic compounds in the dry mass of the sample, %;
- kr is the constant of organic compound decomposition rate of the first-order model, days−1; and
- t is time, days.
According to the first-order model, the values of constants of the rate of decomposition of organic compounds (kr) and the rate of decomposition of organic carbon content (kOWO) were determined. On their basis, the time of half-life of organic compounds and organic carbon was determined as in Formula (2):
ti0.5 = ln2/ki
Correlation coefficients between loss on ignition and organic carbon content and between odor concentration and the abovementioned parameters of windrow biostabilization degree were also determined.
Table 3 contains the values of the constants of organic compounds’ decomposition rate (according to the loss on ignition) and the constants of organic carbon decomposition rate (according to the total organic carbon content) test variants: no preparation addition and different types of preparations. Moreover, it also contains the values of the half-life of the abovementioned parameters and the values of Spearman’s correlation coefficients between them and odor concentration.
4. Discussion
The use of the developed methodology for the assessment of individual technological variants of the biostabilization process allowed me to choose the most effective method, considering both the degree of biological stabilization of waste and the minimization of odor nuisance.
The decrease of odor concentration values, after reaching the maximum, may indicate the end of the thermophilic phase and the transition to the psychrophilic phase called the cooling phase (low-temperature biostabilization). During this phase, the degradation of compounds that are difficult to decompose is followed by further mineralization of organic matter. The emission of odorous volatile compounds during biostabilization is significantly influenced by the process temperature, one of the indicators of the biodegradation degree. The vapor pressure of saturation of biomass compounds depends exponentially on the temperature value. According to Kucic, ammonium concentration grows between the second and third weeks, increasing odor concentration [61]. This explains the increase in this parameter in those weeks in the present study. In the thermophilic phase, there is easier evaporation, an increase of odorous compounds in concentration in the emitted gases, and an increase in the rate of the degradation processes. This can lead to an oxygen deficit, activation of facultatively anaerobic microorganisms, and a change in the direction of transformations. Easily volatile compounds are then formed, aldehydes and other carbonyl compounds, causing increased odor nuisance.
Microbial inoculation on the wastes results in a significant reduction in the operation time (due to microbial action) of the degradation process [62], which was shown in the present study, according to the changes of odor concentration values. A very significant difference was observed between the odor concentration values obtained during biostabilization of the windrows without the addition of inoculum and with the addition of a mixture of phototrophic bacteria, lactic acid bacteria, and yeast (OWS). In the first three weeks, the odor concentration was at a similar level. In the fourth week, it started to decrease in the OWS-inoculated windrow, while it increased rapidly in the non-inoculated one. The maximum concentration in the uninoculated windrow was as high as 15,000 ou/m3 and began to decline in the fifth week, reaching 4300 ou/m3 in the sixth week. In this OWS-inoculated windrow, the odor concentration was only 750 ou/m3 at the end of the fourth week and 269 ou/m3 at the end of the sixth week. It confirmed the findings that enhanced enzymatic activity accounted for the accelerated composting by these effective microbes [63] and effectively reduced the odorous emissions, mainly volatile organic compounds (VOCs) [62,64,65].
According to Haug (2018), the value of the reaction rate constant of the composting process ranged from 0.002 d−1 to 0.15 d−1 [66]. In this evaluation of individual process variants, the values of the constant rate of decomposition of organic compounds ranged from −0.0004 d−1 to 0.006 d−1, while the values of the constant rate of decomposition of organic carbon content ranged from −0.0009 d−1 to 0.007 d−1. In three of the variants under consideration, the values of the organic compounds’ degradation rate constant were lower than the range given by Haug (2018): OWS grafting 1.2 l/Mg (kr = 0.001 d−1), Bio-2 grafting (kr = 0.001 d−1), and Chem-1 grafting (kr = −0.0009 d−1). The values of the organic carbon content distribution rate constant were lower than the abovementioned range in three variants: Bio-1 grafting (kr = 0.001 d−1), Bio-2 grafting (kr = 0.001 d−1), and Chem-1 grafting (kr = −0.0009 d−1).
The emission of odorous compounds depends on the kinetics of oxygen consumption by microorganisms and the decomposition of organic compounds in individual phases of biostabilization. Stegenta et al. carried out a study to check the extent to which the two mathematical models fit into the oxygen consumption curve for waste samples at different stages of the biostabilization process and to propose a model with higher usability [60]. The studies were carried out on a technical scale, under the operating conditions of the biostabilization plant, where OWS bacterial biopreparation was used. The tests were carried out in two variants: with the use of waste batches vaccinated with biopreparation and non-vaccinated waste. The biostabilization process was conducted for seven weeks. The initial organic matter content in the reactors was about 75%. During the next weeks of the biostabilization process, a gradual decrease in the content of the biodegradable fraction was observed. In the reactor not vaccinated with the biopreparation, the final content of the biodegradable fraction was at the level of 60%, while in the vaccinated reactor it was 65%. In these studies, the effect of vaccinating the waste with biopreparation on increasing the respiratory activity of microorganisms was observed as well as kinetic parameters describing oxygen consumption during the first three weeks of the process. Observed in the fifth week in the unvaccinated waste and the fourth week in the waste vaccinated with biopreparation was a renewed increase in the rate of oxygen consumption that could result from an increase in the availability of organic matter from materials that are difficult to decompose, such as cellulose, which was not available in the first phase of the process. In the later stages of the process, the need for oxygen was gradually reduced. This is due to a decrease in the content of available organic matter and a higher proportion of mineral fraction and, consequently, lower activity of microorganisms [60,67].
In the present study, the correlation between organic matter content and organic carbon concentration was, in most cases, strong (in seven out of nine cases the value of the correlation coefficient ranged from 0.80 to 0.99), while in two cases—Bio-1 and Chem-1—the value of the correlation coefficient was 0.61 and 0.65, respectively. The value of the correlation coefficient between the abovementioned parameters and odor concentration was variable, ranging from −0.97 (Bio-1) to 0.87 (Chem-1). The highest values of decomposition rate constants were obtained for Phyto-1 (kr = 0.006 d−1, kOWO = 0.007 d−1). The corresponding values of half-life of decomposition were tr0.5 = 108 d and tOWO0.5 = 97 d. Therefore, considering the basic parameters showing the degree of biostabilization, it seems that the Phyto-1 preparation had the most beneficial effect on the process of waste aerobic biostabilization. However, the olfactometric examination of the windrow vaccinated with this preparation indicated a potential significant odor nuisance for at least four weeks. Already in the first week, an odor concentration under the membrane of 1201 ou/m3 was recorded (in the ‘reference’ windrow 721 ou/m3), while from weeks 2 to 4 the odor concentration was 4300 ou/m3 and in the ‘reference’ windrow it was between 600 ou/m3 and 3750 ou/m3. Significant reduction of the odor concentration emitted from the windrow vaccinated with Phyto-1 preparation occurred only after week 4: On the 37th day of the process, the odor concentration value of 515 ou/m3 (“reference” windrow—600 ou/m3) was recorded.
On the other hand, the lowest odor concentration values emitted from the windrow were recorded in the case of waste vaccinated with Chem-1 preparation. During the whole process, lasting 43 days, results ranging from 13 ou/m3 (odor concentration on the last day of biostabilization) to 260 ou/m3 (36th day of biostabilization) were recorded. However, the results of tests on the concentration of organic compounds and organic carbon, as well as on the kinetics of the decomposition reaction, allowed concluding that the biostabilization process did not occur correctly in this case. Constant decomposition of the abovementioned compounds was negative.
A similar situation was observed in the case of Bio-1. Although the results of olfactometric tests were much lower than in the case of the “reference” windrow, odor concentration from 35 ou/m3 to 350 ou/m3 (the “reference” windrow was characterized by values from 35 ou/m3 to 3000 ou/m3), the organic carbon decomposition constant was only 0.001 d−1 and the half-life of decomposition was 607 d. The low speed of decomposition processes resulted in low emissions and, thus, in low nuisance. It should be stressed, however, that this concerns the overall kinetics of the process and not instantaneous measurements.
5. Summary and Conclusions
The paper attempted to relate the odor concentration to the degree of biological stabilization of waste inoculated with different types of inoculum. This issue has application values that may result in the implementation of new control systems for waste stabilization bioreactors as well as the evaluation of applied technological solutions, including the inoculation of windrows. Existing control systems use feedback between temperature measurements and fan settings, while to determine the degree of stabilization, a sample must be taken and analyzed off-line during several days. An important factor is to keep the environmental impact low, which classical methods of assessing the degree of biostabilization do not take into account. The proposed method provides an opportunity to optimize the process concerning the objective function related to the low degree of odor nuisance of the technologies used, including the selection of environmentally safe inoculum of the windrows. In addition, because of the simplicity and short measurement time, especially compared to the lengthy chemical determinations used nowadays, technologists can respond more quickly to any anomalies that occur during the biostabilization process. As a result, it is possible to initiate actions to prevent the spread of odorants in the air and, consequently, avoid their impact on the health of workers and residents of surrounding habitats.
The olfactometric tests showed the necessity of using the preparation to reduce the value of odor concentration. However, to choose the most effective preparation, it is necessary to consider not only the chemical parameters showing the degree of biostabilization but also the concentration of odor emitted from the windrows in the subsequent stages of this process. Only such a comprehensive analysis can lead to the selection of the optimal variant.
To sum up, the odor concentration is an important indicator of the maturity of waste subjected to biostabilization. In turn, olfactometric testing (with particular emphasis on in situ testing) is an appropriate, adequate technique for the monitoring of compost windrows and windrows of biostabilized waste and for verifying the degree of biostabilization of the final product, a technique which, in addition to the standard methods commonly used (AT4 determination, organic carbon content, organic matter content, etc.) can be useful in determining the degree of waste biostabilization.
Funding
This research was funded by Dean of Faculty of Building Services, Hydro and Environmental Engineering. The publishing of the article was financed by Warsaw University of Technology project, IDUB Open Science.
Conflicts of Interest
The authors declare no conflict of interest.
References
- Finnveden, G.; Johansson, J.; Lind, P.; Moberg, Å. Life Cycle Assessment of Energy from Solid Waste—Part 1: General Methodology and Results. J. Clean. Prod. 2005, 13, 213–229. [Google Scholar] [CrossRef]
- Fernández, Y.; Río, J.; Rodríguez-Iglesias, J.; Castrillón, E.; Marañón, L. Life cycle assessment of different municipal solid waste management options: A case study of Asturias (Spain). J. Clean. Prod. 2014, 81, 178–189. [Google Scholar] [CrossRef] [Green Version]
- Russo, S.; Verda, V. Exergoeconomic analysis of a Mechanical Biological Treatment plant in an Integrated Solid Waste Management system including uncertaintie. Energy 2020, 198, 117325. [Google Scholar] [CrossRef]
- Trois, C.; Griffith, M.; Brummack, J.; Mollekopf, N. Introducing mechanical biological waste treatment in South Africa: A comparative study. Waste Manag. 2007, 27, 1706–1714. [Google Scholar] [CrossRef] [PubMed]
- De Gioannis, G.; Muntoni, A.; Cappai, G.; Milia, S. Landfill gas generation after mechanical biological treatment of municipal solid waste. Estimation of gas generation rate constants. Waste Manag. 2009, 29, 1026–1034. [Google Scholar] [CrossRef]
- Trulli, E.; Ferronato, N.; Torretta, V.; Piscitelli, M.; Masi, S.; Mancini, I. Sustainable mechanical biological treatment of solid waste in urbanized areas with low recycling rates. Waste Manag. 2017, 71, 556–564. [Google Scholar] [CrossRef] [PubMed]
- Keck, M.; Mager, K.; Weber, K.; Keller, M.; Frei, M.; Steiner, B.; Schrade, S. Odour impact from farms with animal husbandry and biogas facilities. Sci. Total Environ. 2018, 645, 1432–1443. [Google Scholar] [CrossRef] [PubMed]
- Rincón, C.A.; De Guardia, A.; Couvert, A.; Le Roux, S.; Soutrel, I.; Daumoin, M.; Benoist, J.C. Chemical and odor characterization of gas emissions released during composting of solid wastes and digestates. J. Environ. Manag. 2018, 233, 39–53. [Google Scholar] [CrossRef] [PubMed]
- Conti, C.; Guarino, M.; Bacenetti, J. Measurements techniques and models to assess odor annoyance: A review. Environ. Int. 2019, 134, 105261. [Google Scholar] [CrossRef] [PubMed]
- Rincón Mejía, C.; De Guardia, A.; Couvert, A.; Wolbert, D.; Le Roux, S.; Soutrel, I.; Nunes, G. Odor concentration (OC) prediction based on odor activity values (OAVs) during composting of solid wastes and digestates. Atmos. Environ. 2018, 201, 1–12. [Google Scholar] [CrossRef]
- Cheng, Z.; Sun, Z.; Zhu, S.; Lou, Z.; Zhu, N.; Feng, L. The identification and health risk assessment of odor emissions from waste landfilling and composting. Sci. Total Environ. 2019, 649, 1038–1044. [Google Scholar] [CrossRef]
- Yao, X.-Z.; Ma, R.-C.; Li, H.-J.; Wang, C.; Zhang, C.; Yin, S.-S.; Wu, D.; He, X.-Y.; Wang, J.; Zhan, L.-T.; et al. Assessment of the major odor contributors and health risks of volatile compounds in three disposal technologies for municipal solid waste. Waste Manag. 2019, 91, 128–138. [Google Scholar] [CrossRef]
- Han, Z.; Qi, F.; Li, R.; Wang, H.; Sun, D. Health impact of odor from on-situ sewage sludge aerobic composting throughout different seasons and during anaerobic digestion with hydrolysis pretreatment. Chemosphere 2020, 249, 126077. [Google Scholar] [CrossRef] [PubMed]
- Ljunggren, G.; Norberg, B.O. On the Effect and Toxicity of Dimethyl Sulfide, Dimethyl Disulfide and Methyl Mercaptan. Acta Physiol. Scand. 1943, 5, 248–255. [Google Scholar] [CrossRef]
- Steinheider, B.; Both, R.; Winneke, G. Field studies on environmental odors inducing annoyance as well as gastric and general health-related symptoms. J. Psychophysiol. 1998, 12, 64–79. [Google Scholar]
- Luginaah, I.N.; Taylor, S.M.; Elliott, S.J.; Eyles, J.D. Community reappraisal of the perceived health effects of a petroleum refinery. Soc. Sci. Med. 2002, 55, 47–61. [Google Scholar] [CrossRef]
- Sucker, K.; Both, R.; Winneke, G. Review of adverse health effects of odours in field studies. Water Sci. Technol. 2009, 59, 1281. [Google Scholar] [CrossRef] [PubMed]
- Héroux, M.; Pagé, T.; Gélinas, C.; Guy, C. Evaluating odour impacts from a landfilling and composting site: Involving citizens in the monitoring. Water Sci. Technol. 2004, 50, 131–137. [Google Scholar] [CrossRef]
- Sironi, S.; Capelli, L.; Céntola, P.; Del Rosso, R. Development of a system for the continuous monitoring of odours from a composting plant: Focus on training, data processing and results validation methods. Sensors Actuators B Chem. 2007, 124, 336–346. [Google Scholar] [CrossRef]
- Scaglia, B.; Orzi, V.; Artola, A.; Font, X.; Davoli, E.; Sanchez, A.; Adani, F. Odours and volatile organic compounds emitted from municipal solid waste at different stage of decomposition and relationship with biological stability. Bioresour. Technol. 2011, 102, 4638–4645. [Google Scholar] [CrossRef] [Green Version]
- Sun, X.; Ma, S.; Han, L.; Li, R.; Schlick, U.; Chen, P.; Huang, G. The effect of a semi-permeable membrane-covered composting system on greenhouse gas and ammonia emissions in the Tibetan Plateau. J. Clean. Prod. 2018, 204, 778–787. [Google Scholar] [CrossRef]
- Li, Y.; Liu, Y.; Yong, X.; Wu, X.; Jia, H.; Wong, J.W.; Wu, H.; Zhou, J. Odor emission and microbial community succession during biogas residue composting covered with a molecular membrane. Bioresour. Technol. 2020, 297, 122518. [Google Scholar] [CrossRef] [PubMed]
- Chastain, J.P. Evaluation of Biosafe® as an additive to reduce odor from swine manure. In Proceedings of the 2000 ASAE Annual International Meeting, Milwaukee, WI, USA, 9–12 July 2000; pp. 1–14. [Google Scholar]
- Jacobs, J.; Sauer, N.; Gilbert, E.J. An Industry Guide for the Prevention and Control of Odours at Biowaste Processing Facilities; The Composting Association: Wellingborough, UK, 2007. [Google Scholar]
- Huang, D.-L.; Zeng, G.-M.; Feng, C.-L.; Hu, S.; Jiang, X.-Y.; Tang, L.; Su, F.-F.; Zhang, Y.; Zeng, W.; Liu, H.-L. Degradation of Lead-Contaminated Lignocellulosic Waste by Phanerochaete chrysosporium and the Reduction of Lead Toxicity. Environ. Sci. Technol. 2008, 42, 4946–4951. [Google Scholar] [CrossRef] [PubMed]
- Vargas García, M.; Suárez-Estrella, F.; López, M.; Moreno, J. Microbial population dynamics and enzyme activities in composting processes with different starting materials. Waste Manag. 2010, 30, 771–778. [Google Scholar] [CrossRef] [PubMed]
- Echeverria, M.C.; Cardelli, R.; Bedini, S.; Colombini, A.; Incrocci, L.; Castagna, A.; Agnolucci, M.; Cristani, C.; Ranieri, A.; Saviozzi, A.; et al. Microbially-enhanced composting of wet olive husks. Bioresour. Technol. 2011, 104, 509–517. [Google Scholar] [CrossRef] [PubMed]
- Hachicha, R.; Rekik, O.; Hachicha, S.; Ferchichi, M.; Woodward, S.; Moncef, N.; Cegarra, J.; Mechichi, T. Co-composting of spent coffee ground with olive mill wastewater sludge and poultry manure and effect of Trametes versicolor inoculation on the compost maturity. Chemosphere 2012, 88, 677–682. [Google Scholar] [CrossRef]
- Voběrková, S.; Vaverková, M.D.; Burešová, A.; Adamcová, D.; Vršanská, M.; Kynický, J.; Brtnický, M.; Adam, V. Effect of inoculation with white-rot fungi and fungal consortium on the composting efficiency of municipal solid waste. Waste Manag. 2017, 61, 157–164. [Google Scholar] [CrossRef] [PubMed]
- Yuan, J.; Zhang, D.; Ma, R.; Wang, G.; Li, Y.; Li, S.; Tang, H.; Zhang, B.; Li, D.; Li, G. Effects of inoculation amount and application method on the biodrying performance of municipal solid waste and the odor emissions produced. Waste Manag. 2019, 93, 91–99. [Google Scholar] [CrossRef]
- Gospodarek, M.; Rybarczyk, P.; Brillowska-Dąbrowska, A.; Gȩbicki, J. The use of various species of fungi in biofiltration of air contaminated with odorous volatile organic compounds. In E3S Web Conferences, Proceedings of the 11th Conference on Interdisciplinary Problems in Environmental Protection and Engineering EKO-DOK, Polanica-Zdroj, Poland, 8–10 April 2019; E3S Web Conferences: Les Ulis, France, 2019; Volume 100. [Google Scholar]
- Mochalski, P.; Wzorek, B.; Śliwka, I.; Amann, A. Suitability of different polymer bags for storage of volatile sulphur compounds relevant to breath analysis. J. Chromatogr. B Anal. Technol. Biomed. Life Sci. 2009, 877, 189–196. [Google Scholar] [CrossRef]
- Jakubus, M.; Gajewski, P.; Kaczmarek, Z.; Mocek, A.; Wła, I.I. Impact of addition of organic additives and EM-a preparation on physical, chemical and structural state of the arable-humus soil horizon. Part II. Chemical properties. J. Res. Appl. Agric. Eng. 2013, 58, 220–225. [Google Scholar]
- Maroušek, J.; Hašková, S.; Zeman, R.; Žák, J.; Vaníčková, R.; Maroušková, A.; Váchal, J.; Myšková, K. Polemics on Ethical Aspects in the Compost Business. Sci. Eng. Ethics 2016, 22, 581–590. [Google Scholar] [CrossRef]
- Maroušek, J.; Kolář, L.; Strunecký, O.; Kopecký, M.; Bartoš, P.; Maroušková, A.; Cudlínová, E.; Konvalina, P.; Šoch, M.; Moudry, J., Jr.; et al. Modified biochars present an economic challenge to phosphate management in wastewater treatment plants. J. Clean. Prod. 2020, 272, 123015. [Google Scholar] [CrossRef]
- Maroušek, J.; Rowland, Z.; Valášková, K.; Král, P. Techno-economic assessment of potato waste management in developing economies. Clean Technol. Environ. Policy 2020, 22, 937–944. [Google Scholar] [CrossRef]
- Maroušek, J.; Kwan, J.T.H. Use of pressure manifestations following the water plasma expansion for phytomass disintegration. Water Sci. Technol. 2013, 67, 1695–1700. [Google Scholar] [CrossRef]
- Lesteur, M.; Bellon-Maurel, V.; Gonzalez, C.; Latrille, E.; Roger, J.; Junqua, G.; Steyer, J. Alternative methods for determining anaerobic biodegradability: A review. Process Biochem. 2010, 45, 431–440. [Google Scholar] [CrossRef]
- Ponsá, S.; Gea, T.; Alerm, L.; Cerezo, J.; Sánchez, A. Comparison of aerobic and anaerobic stability indices through a MSW biological treatment process. Waste Manag. 2008, 28, 2735–2742. [Google Scholar] [CrossRef] [PubMed] [Green Version]
- Sri Shalini, S.; Karthikeyan, O.P.; Joseph, K. Biological stability of municipal solid waste from simulated landfills under tropical environment. Bioresour. Technol. 2010, 101, 845–852. [Google Scholar] [CrossRef] [PubMed]
- Marhuenda-Egea, F.C.; Martinez-Sabater, E.; Jordá, J.; Moral, R.; Bustamante, M.; Paredes, C.; Pérez-Murcia, M. Dissolved organic matter fractions formed during composting of winery and distillery residues: Evaluation of the process by fluorescence excitation–emission matrix. Chemosphere 2007, 68, 301–309. [Google Scholar] [CrossRef] [PubMed]
- Barrena, R.; D’Imporzano, G.; Ponsá, S.; Gea, T.; Artola, A.; Vázquez, F.; Sánchez, A.; Adani, F. In search of a reliable technique for the determination of the biological stability of the organic matter in the mechanical–biological treated waste. J. Hazard. Mater. 2009, 162, 1065–1072. [Google Scholar] [CrossRef] [PubMed] [Green Version]
- Cossu, R.; Raga, R. Test methods for assessing the biological stability of biodegradable waste. Waste Manag. 2008, 28, 381–388. [Google Scholar] [CrossRef]
- Kilian, E.; Macedowska-Capiga, A. Parametr AT4 jako wskaźnik stopnia stabilizacji odpadów po mechaniczno-biologicznym przetworzeniu. Prace Inst. Ceram. Mater. Bud. 2011, R. 4, 88–94. [Google Scholar]
- Sidełko, R.; Siebielska, I.; Szymański, K.; Skubała, A.; Kołacz, N. Ocena stabilności kompostu w czasie rzeczywistym. Inżynieria Ochr. Sr. 2014, T. 17, 221–230. [Google Scholar]
- Salati, S.; Scaglia, B.; Di Gregorio, A.; Carrera, A.; Adani, F. The use of the dynamic respiration index to predict the potential MSW-leachate impacts after short term mechanical biological treatment. Bioresour. Technol. 2013, 128, 351–358. [Google Scholar] [CrossRef] [PubMed]
- Di Maria, F.; Micale, C. What is the acceptable margin of error for the oxygen uptake method in evaluating the reactivity of organic waste? Waste Manag. 2014, 34, 1356–1361. [Google Scholar] [CrossRef]
- Bożym, M. Wykorzystywanie testów do oceny stopnia stabilizacji odpadów. Prace Inst. Ceram. Mater. Bud. 2011, R. 4, 79–88. [Google Scholar]
- Ponsá, S.; Gea, T.; Sánchez, A. The effect of storage and mechanical pretreatment on the biological stability of municipal solid wastes. Waste Manag. 2010, 30, 441–445. [Google Scholar] [CrossRef] [PubMed] [Green Version]
- Sidełko, R.; Siebielska, I.; Janowska, B.; Skubała, A. Assessment of biological stability of organic waste processed under aerobic conditions. J. Clean. Prod. 2017, 164, 1563–1570. [Google Scholar] [CrossRef]
- Sánchez Arias, V.; Fernández, F.J.; Rodríguez, L.; Villaseñor, J. Respiration indices and stability measurements of compost through electrolytic respirometry. J. Environ. Manag. 2012, 95, S134–S138. [Google Scholar] [CrossRef]
- Kužel, S.; Peterka, J.; Štindl, P.; Plát, V. Agrochemical value of organic matter of fermenter wastes in biogas production. Plant Soil Environ. 2008, 54, 321–328. [Google Scholar]
- Kolář, L.; Maršálek, M.; Frelich, J.; Kužel, S.; Smetana, P.; Zedníková, J.; Švecová, M. Changes in methane release from organic matter passing through the digestive tract of horses. Czech J. Anim. Sci. 2009, 54, 112–120. [Google Scholar] [CrossRef] [Green Version]
- Norbu, T.; Visvanathan, C.; Basnayake, B. Pretreatment of municipal solid waste prior to landfilling. Waste Manag. 2005, 25, 997–1003. [Google Scholar] [CrossRef]
- Sugni, M.; Calvaterra, E.; Adani, F. Biostabilization-biodrying of municipal solid waste by inverting air-flow. Bioresour. Technol. 2005, 96, 1331–1337. [Google Scholar] [CrossRef]
- Shao, Z.; He, P.; Zhang, D.; Shao, L. Characterization of water-extractable organic matter during the biostabilization of municipal solid waste. J. Hazard. Mater. 2009, 164, 1191–1197. [Google Scholar] [CrossRef] [PubMed]
- Zmora-Nahum, S.; Markovitch, O.; Tarchitzky, J.; Chen, Y. Dissolved organic carbon (DOC) as a parameter of compost maturity. Soil Biol. Biochem. 2005, 37, 2109–2116. [Google Scholar] [CrossRef]
- Szyłak-Szydłowski, M. Comparison of two types of field olfactometers for assessing odours in laboratory and field tests. Chem. Eng. Trans. 2014, 40, 67–72. [Google Scholar]
- Szyłak-Szydłowski, M. Odour Samples Degradation during Detention in Tedlar® Bags. Water Air Soil Pollut. 2015, 226, 227. [Google Scholar] [CrossRef] [PubMed] [Green Version]
- Stegenta, S.; Kałdun, B.; Białowiec, A. Dobór modelu i wyznaczanie parametrów kinetycznych aktywności oddechowej odpadów w trakcie procesu tlenowej biostabilizacji frakcji podsitowej odpadów komunalnych. Rocznik Ochrony Środowiska 2016, 18, 800–814. [Google Scholar]
- Kučić, D.; Briski, F. Emission of Gases During Composting of Solid Waste. Kem. Ind. 2017, 66, 467–474. [Google Scholar] [CrossRef] [Green Version]
- Rastogi, M.; Nandal, M.; Khosla, B. Microbes as vital additives for solid waste composting. Heliyon 2020, 6, e03343. [Google Scholar] [CrossRef]
- Mat Saad, N.F.; Ma’min, N.; Zain, S.; Basri, N.; Zaini, N. Composting of Mixed Yard and Food Wastes with Effective Microbes. J. Teknol. 2013, 65, 89–95. [Google Scholar] [CrossRef] [Green Version]
- Jusoh, M.; Manaf, L.; Latiff, P. Composting of Rice straw with Effective Microorganisms (EM) and its Influence on Compost Quality. Iran. J. Environ. Health Sci. Eng. 2013, 10, 17. [Google Scholar] [CrossRef] [PubMed] [Green Version]
- Maulini-Duran, C.; Artola, A.; Font, X.; Sánchez, A. Gaseous emissions in municipal wastes composting: Effect of the bulking agent. Bioresour. Technol. 2014, 172, 260–268. [Google Scholar] [CrossRef] [PubMed] [Green Version]
- Haug, R. The Practical Handbook of Compost Engineering; Routledge: Oxfordshire, UK, 2018. [Google Scholar]
- Aspray, T.J.; Dimambro, M.E.; Wallace, P.; Howell, G.; Frederickson, J. Static, dynamic and inoculum augmented respiration based test assessment for determining in-vessel compost stability. Waste Manag. 2015, 42, 3–9. [Google Scholar] [CrossRef] [PubMed]
Figure 1.
Scheme of covered windrows with sampling points (based on: https://www.gore.com/resources/principle-of-organic-waste-treatment-gore-cover, accessed on 16 February 2021).
Figure 1.
Scheme of covered windrows with sampling points (based on: https://www.gore.com/resources/principle-of-organic-waste-treatment-gore-cover, accessed on 16 February 2021).

Figure 2.
The dependence of odor concentration on the week of biostabilization in the variants under consideration.
Figure 2.
The dependence of odor concentration on the week of biostabilization in the variants under consideration.


Figure 3.
The dependence of loss on ignition and total organic carbon on the week of biostabilization.
Figure 3.
The dependence of loss on ignition and total organic carbon on the week of biostabilization.


Table 1.
Physicochemical parameters and morphological composition of waste deposited on the biostabilization square in 2015–2017.
Table 1.
Physicochemical parameters and morphological composition of waste deposited on the biostabilization square in 2015–2017.
| Parameter | Unit | Min. | 1st Quartile | Mean | Median | 3rd Quartile | Max. | Standard Deviation |
|---|---|---|---|---|---|---|---|---|
| Bulk density | kg/m3 | 357.7 | 466.7 | 503.9 | 500.0 | 537.5 | 662.5 | 57.2 |
| Moisture | % | 35.0 | 42.0 | 44.1 | 44.0 | 46.0 | 54.0 | 57.2 |
| General org. substance | % d.m. | 24.6 | 33.5 | 36.6 | 36.3 | 39.5 | 48.4 | 4.3 |
| <10 mm | % | 21.1 | 49.6 | 53.3 | 54.5 | 58.0 | 71.9 | 7.0 |
| Food waste | 6.0 | 10.6 | 13.1 | 12.5 | 15.3 | 30.5 | 3.7 | |
| Paper | 5.5 | 10.5 | 12.3 | 12.0 | 13.9 | 23.9 | 2.6 | |
| Plastics | 1.8 | 3.7 | 4.6 | 4.5 | 5.3 | 8.7 | 1.2 | |
| Textiles | 0.0 | 0.1 | 0.4 | 0.3 | 0.5 | 2.0 | 0.4 | |
| Wood | 0.0 | 0.4 | 0.8 | 0.6 | 1.0 | 3.1 | 0.5 | |
| Organic residue | 0.0 | 1.0 | 2.7 | 1.7 | 3.0 | 15.3 | 2.7 | |
| Glass | 1.5 | 5.2 | 6.5 | 6.2 | 7.5 | 14.8 | 1.9 | |
| Metal | 0.0 | 1.1 | 1.7 | 1.5 | 2.0 | 9.7 | 1.1 | |
| Mineral residue | 0.1 | 1.9 | 3.2 | 3.0 | 4.1 | 12.7 | 1.9 | |
| Others | 0.0 | 0.5 | 1.5 | 1.1 | 2.1 | 8.5 | 1.3 |
Table 2.
Summary of physicochemical and morphological parameters of waste deposited in the examined windrows—evaluation of individual variants.
Table 2.
Summary of physicochemical and morphological parameters of waste deposited in the examined windrows—evaluation of individual variants.
| Parameter | Unit | Without Addition | OWS 0.8 l/Mg | OWS 1.2 l/Mg | OWS3 | Phyto-1 | Bio-1 | Bio-2 | Bio-2 Plast. | Chem-1 |
|---|---|---|---|---|---|---|---|---|---|---|
| Bulk density | kg/m3 | 496 | 508 | 550 | 417 | 517 | 467 | 558 | 512 | 496 |
| Moisture | % | 32.2 | 36.5 | 58.4 | 30.0 | 45.2 | 36.1 | 44.5 | 39.0 | 31.0 |
| General org. substance | % d.m. | 17.2 | 20.9 | 30.9 | 16.5 | 35.4 | 19.3 | 33.2 | 23.9 | 19.5 |
| <10 mm | % | 61.7 | 57.3 | 57.2 | 60.1 | 49.8 | 50.0 | 46.8 | 55.3 | 54.4 |
| Food waste | 10.4 | 9.2 | 9.6 | 7.4 | 11.0 | 11.7 | 12.7 | 13.0 | 17.3 | |
| Paper | 10.2 | 14.7 | 14.4 | 7.8 | 11.2 | 17.2 | 12.8 | 13.1 | 11.0 | |
| Plastics | 3.9 | 4.5 | 5.2 | 3.7 | 3.8 | 6.5 | 4.7 | 4.1 | 5.0 | |
| Textiles | 0.1 | 0.5 | 0.4 | 0.3 | 0.6 | 0.2 | 0.9 | 0.2 | 0.2 | |
| Wood | 1.0 | 0.7 | 0.6 | 0.6 | 2.7 | 0.5 | 3.1 | 1.1 | 0.4 | |
| Organic residue | 1.9 | 1.3 | 0.8 | 10.7 | 1.6 | 3.0 | 2.6 | 1.1 | 1.0 | |
| Glass | 7.4 | 6.5 | 7.0 | 5.4 | 8.7 | 5.1 | 7.1 | 5.7 | 5.4 | |
| Metal | 0.7 | 1.0 | 2.2 | 0.9 | 1.7 | 1.5 | 1.6 | 2.3 | 1.7 | |
| Mineral residue | 2.5 | 4.1 | 2.4 | 1.8 | 4.7 | 3.5 | 5.1 | 3.7 | 2.8 | |
| Others | 0.2 | 0.2 | 0.2 | 1.3 | 4.2 | 0.8 | 2.6 | 0.4 | 0.8 |
Table 3.
Parameters of the kinetics of the decomposition of organic compounds and organic carbon with correlation coefficients between the concentration of organic substances, organic carbon, and odor.
Table 3.
Parameters of the kinetics of the decomposition of organic compounds and organic carbon with correlation coefficients between the concentration of organic substances, organic carbon, and odor.
| Variant | Parameters of Reaction’s Kinetics | Correlation Coefficients | |||||
|---|---|---|---|---|---|---|---|
| Org. Compounds Decomposition. | Organic Carbon Decomposition | ||||||
| kr, d−1 | tr0.5, d−1 | kOWO, d−1 | tOWO0.5, d−1 | Org. Subst.—Org. Carbon | Org. Subst.—Cod | Org. Carbon—Cod. | |
| Without addition of substance | 0.004 | 173 | 0.004 | 180 | 0.91 | −0.65 | −0.41 |
| OWS 0.8 l/Mg | 0.005 | 131 | 0.005 | 139 | 0.92 | 0.40 | 0.52 |
| OWS 1.2 l/Mg | 0.001 | 485 | 0.004 | 167 | 0.80 | −0.86 | −0.61 |
| OWS3 | 0.005 | 128 | 0.006 | 110 | 0.96 | −0.57 | −0.42 |
| Phyto-1 | 0.006 | 108 | 0.007 | 97 | 0.99 | 0.69 | 0.68 |
| Bio-1. | 0.004 | 180 | 0.001 | 607 | 0.65 | −0.97 | −0.78 |
| Bio-2 | 0.001 | 693 | 0.001 | 607 | 0.99 | −0.10 | −0.12 |
| Bio-2 plast. | 0.004 | 187 | 0.003 | 270 | 0.96 | 0.55 | 0.73 |
| Chem-1 | −0.0004 | - | −0.0009 | - | 0.61 | 0.87 | 0.73 |
Publisher’s Note: MDPI stays neutral with regard to jurisdictional claims in published maps and institutional affiliations. |
© 2021 by the author. Licensee MDPI, Basel, Switzerland. This article is an open access article distributed under the terms and conditions of the Creative Commons Attribution (CC BY) license (http://creativecommons.org/licenses/by/4.0/).
Share and Cite
MDPI and ACS Style
Szyłak-Szydłowski, M. Evaluation of Inoculated Waste Biological Stabilization Degree by Olfactometric Methods. Energies 2021, 14, 1835. https://0-doi-org.brum.beds.ac.uk/10.3390/en14071835
AMA Style
Szyłak-Szydłowski M. Evaluation of Inoculated Waste Biological Stabilization Degree by Olfactometric Methods. Energies. 2021; 14(7):1835. https://0-doi-org.brum.beds.ac.uk/10.3390/en14071835
Chicago/Turabian StyleSzyłak-Szydłowski, Mirosław. 2021. "Evaluation of Inoculated Waste Biological Stabilization Degree by Olfactometric Methods" Energies 14, no. 7: 1835. https://0-doi-org.brum.beds.ac.uk/10.3390/en14071835
Note that from the first issue of 2016, this journal uses article numbers instead of page numbers. See further details here.