2. Building Integrated Photovoltaic Thermal System—Summary of Related Works
In comparison with solar thermal collectors and photovoltaic systems, integrated systems employ both technologies in the same system, generating both thermal energy and electricity. Many classifications can be adopted in order to better characterize these kinds of systems due to their complexity and multi-use functions. For example, a very simple classification is presented by [
13], where the authors synthetically present a classification based on the integration, operation mode, application and type of approach for BIPVT systems. In this work and according to with integration type, the PV can be considered as a stand-alone element (PVT), as an integrated structural element in building façade and roof (BIPV), as technical devices added to the building (BAPV) and sometimes as an “add-on” component when a PV panel can be used as an external component, for example as a shading device. When the BIPV can also produce thermal energy for water or air heating, as previously mentioned, it can be considered a BIPVT.
A brief summary of some studies is presented in
Table 1, including some examples of these kinds of systems according to system type, integration solution, the approach adopted, application objective and study objective.
In [
14], an extensive review on PV/T systems is presented, being of particular interest to works concerning the design of innovative energy façade elements due to the novelty of the systems presented. The study reviews the structure guidelines and working instruments of the PV/T façade systems, execution, control procedures and building applications. They highlight the use of electrochromic coatings as the most used smart coating for thermal applications in PV systems and also highlight that concerning PV shading, the external shading is the most utilized due to its low initial costs. The authors also state that algae growth façades and folding façades (complex geometry) shading systems are as yet rising solutions, with high initial investment costs and requiring professional installers. They are, indeed, a promising arrangement because of their multi-purpose capabilities. Dynamic shading systems were found to reduce structure cooling power utilization by 12% to 50%. In [
15], a survey of a significant number of shading systems on the main façades facing south or north (depending on the hemisphere, referred to as Sun-oriented façades) is presented, considering studies that have been published after 2010, segmenting the study into opaque and translucid elements.
In a most recent study of [
16], the state of the art Sun-oriented control systems for façades are introduced, with a comparative assessment of Sun-powered control systems and with guidelines for the improvement of new ones. It incorporates multifunctional frameworks and modelling with BIPV and thermal energy generation. Complementarily, in [
9], the authors survey BIPV and BIPVT advancements, and an energy and exergy examination of BIPV and BIPVT systems is likewise discussed. This work reviews the ongoing innovation advancements around the world. In [
17], the state of the art of double-skin BIPV façades is developed with a focus on their thermal analysis. In [
18], an in-depth review is provided considering the concept, classification and assessment of emerging active building-integrated solar thermal/PV technologies.
In [
19], the authors proposed a modular adaptive solar façade, in order to couple the element with the very dynamic environment surrounding the building boundaries. The energy behaviour and aesthetic expression of the façade can be managed to provide high spatio-temporal resolution responses. The design process and operational plan are described, along with simulation results of the thermal behaviour and power production/consumption. In [
20], the authors elaborated on the energy performance of a ventilated photovoltaic façade under varied ventilation modes and controlling modes for different climacteric conditions, aiming to improve the energy conversion efficiency.
In [
21], a prototype of a BIPVT was constructed based on thermal and electrical energy, aiming to achieve visual comfort and shading control through the system application. In this article, the prototype was evaluated under various conditions to characterize its performance. In [
22], a study on energy evaluation of a photovoltaic wall with the use of either natural convection incited or fan-helped ventilation system was presented. A vertical photovoltaic Sun-oriented wall was introduced on the façade of a pre-assembled outside test room. The prototype development was manufactured with two economically accessible photovoltaic modules, an air cavity and an insulated back layer.
In [
23], the authors propose a modular hybrid photovoltaic/solar thermal façade technology that uses integrated collector and storage solar technology. In light of a patented solar thermal diode concept and shaped into a flat modular profile incorporating PV cells/module, the proposed system aims to heat the indoor environment, provide hot water and also generate electricity. In [
24], the authors proposed an arrangement of a building-integrated photovoltaic, thermoelectric wall solution. It is examined using a numerical model comprising of a PV framework and thermoelectric brilliant wall element. The thermal and electrical components of the system under cooling prevailing atmospheres was numerically researched utilizing an iterative system model. The presentation of the system is optimized by a near investigation with a traditional solid wall.
In [
25], the study investigates the outcomes of a solar transparent photovoltaic window, focusing on angles of incidence, thermal gains using direct solar gains and energy generation. In [
26], the proposed BIPVT system prototype is composed of air collectors connected to an air handling unit to manage the airflow. The solution works based on two applications, namely heating and cooling needs.
In [
27], a BIPVT system is analysed. There is a focus on the improvement of the articulation between electrical and thermal efficiencies and heat transfer through the structure. These articulations between thermal and electrical efficiencies are substantially crucial for various climatic conditions and diverse façade BI-SES designs. The system modules have been intensely studied for their energy, exergy and operational attributes with and without associated air pipe. In [
28], a BIPVT system has been analysed for residential applications, assessing active and passive operational applications. In [
29], they built up an incorporated model for evaluating the techno-financial execution of the BIPVT on façades, with an emphasis on energy demand and supply.
The authors of [
29,
30] presents a novel solution where a BIPVT is combined with a phase change material as a solution for thermal energy storage combined with air cavity ventilation. The results are presented in terms of numerical analysis and experimental one and also an economic analysis where the solution is compared with other BIPV solutions and traditional building components. In [
31], a solution of a combined BIPV with water storage is presented experimentally for thermal performance assessment of the system.
The BIPVT proposed in this study goes somehow beyond state of the art and the representative studies presented in
Table 1. The proposed BIPVT system was integrated since the early stages of a designed building project as a building structure element. Since the construction stage, the monitoring system was integrated, permitting continuous monitoring, comparing with most of the experimental studies, which refer to laboratory prototypes tested in laboratory conditions and not in a real environment. Moreover, the BIPVT proposed is designed to work in any kind of climatic condition as a cooling or heating passive solution, compared with the majority of the BIPV solution that is specifically designed for heating or cooling. It worth also mentioning the importance of integration of this solution in the façade of an office building located in the mild Mediterranean climate towards the assessment of its NZEB performance.
4. Results and Discussion
Employing experimental analysis, it is possible to observe and register real parameters and characteristics of the weather, BIPVT system, and test room in the study that will evaluate the façade components’ performance. In [
41], there is an extensive review for the energy assessment through experimental analysis—in which it is highlighted that the accuracy and long-time period of data are essential to bringing reliability to the study.
The experimental analysis is segmented into two main parts: (i) weather-related—outdoors ambient temperature (), direct normal solar radiation (), diffuse horizontal solar radiation () and global horizontal solar radiation () and test room temperature ()—the main boundary conditions of the system; (ii) BIPVT variables—PV module temperature (); outlet/inlet temperature gradient (ΔT); air cavity temperature (); conductive heat flux of the wall (). The experimental analysis results are used in the third part of the work to calculate the system’s performance and set the relationship between variables. The performance is calculated based on the thermal efficiency () of the BIPVT system, as well as the dimensionless analysis.
Table 4 presents the temporal scale in which the experimental campaign and analysis were developed.
4.1. Weather Data and Room Temperature
The weather data was collected from the LNEG weather station to capture the most accurate values to represent the boundary conditions of the BIPVT system. The output of this phase was also used both for the control algorithms and for developing the weather files used in computational modelling of an associated study developed in [
10].
During the year 2018, nearly 8328 valid hours of data were registered, with 432 missing hours due to recording failures or equipment maintenance. The major recording failures concerning weather data of 2018 occurred in March and April (failure of the data logger), May (equipment failure), July and August (external calibration of the equipment), and December (power loss).
Figure 4 presents: (a) the ambient temperature and (b) ambient temperature in terms of frequency of occurrence. The annual temperatures are most concentrated between 10 °C and 21 °C but still accounts for many hours above 21 °C, whereas fewer hours a below 10 °C. The
also hits extreme peaks of near 45 °C. Between June/2018 and October/2018, the temperature values were within this interval for a considerable number of hours. The annual temperatures hit a peak in August (44.03 °C), and its lowest in February (2.95 °C). The average yearly temperature was 16.43 °C.
The values for the annual solar radiation profile are provided in
Appendix A.
Figure A1 presents the values of global horizontal radiation. The
hit the highest values between July and August.
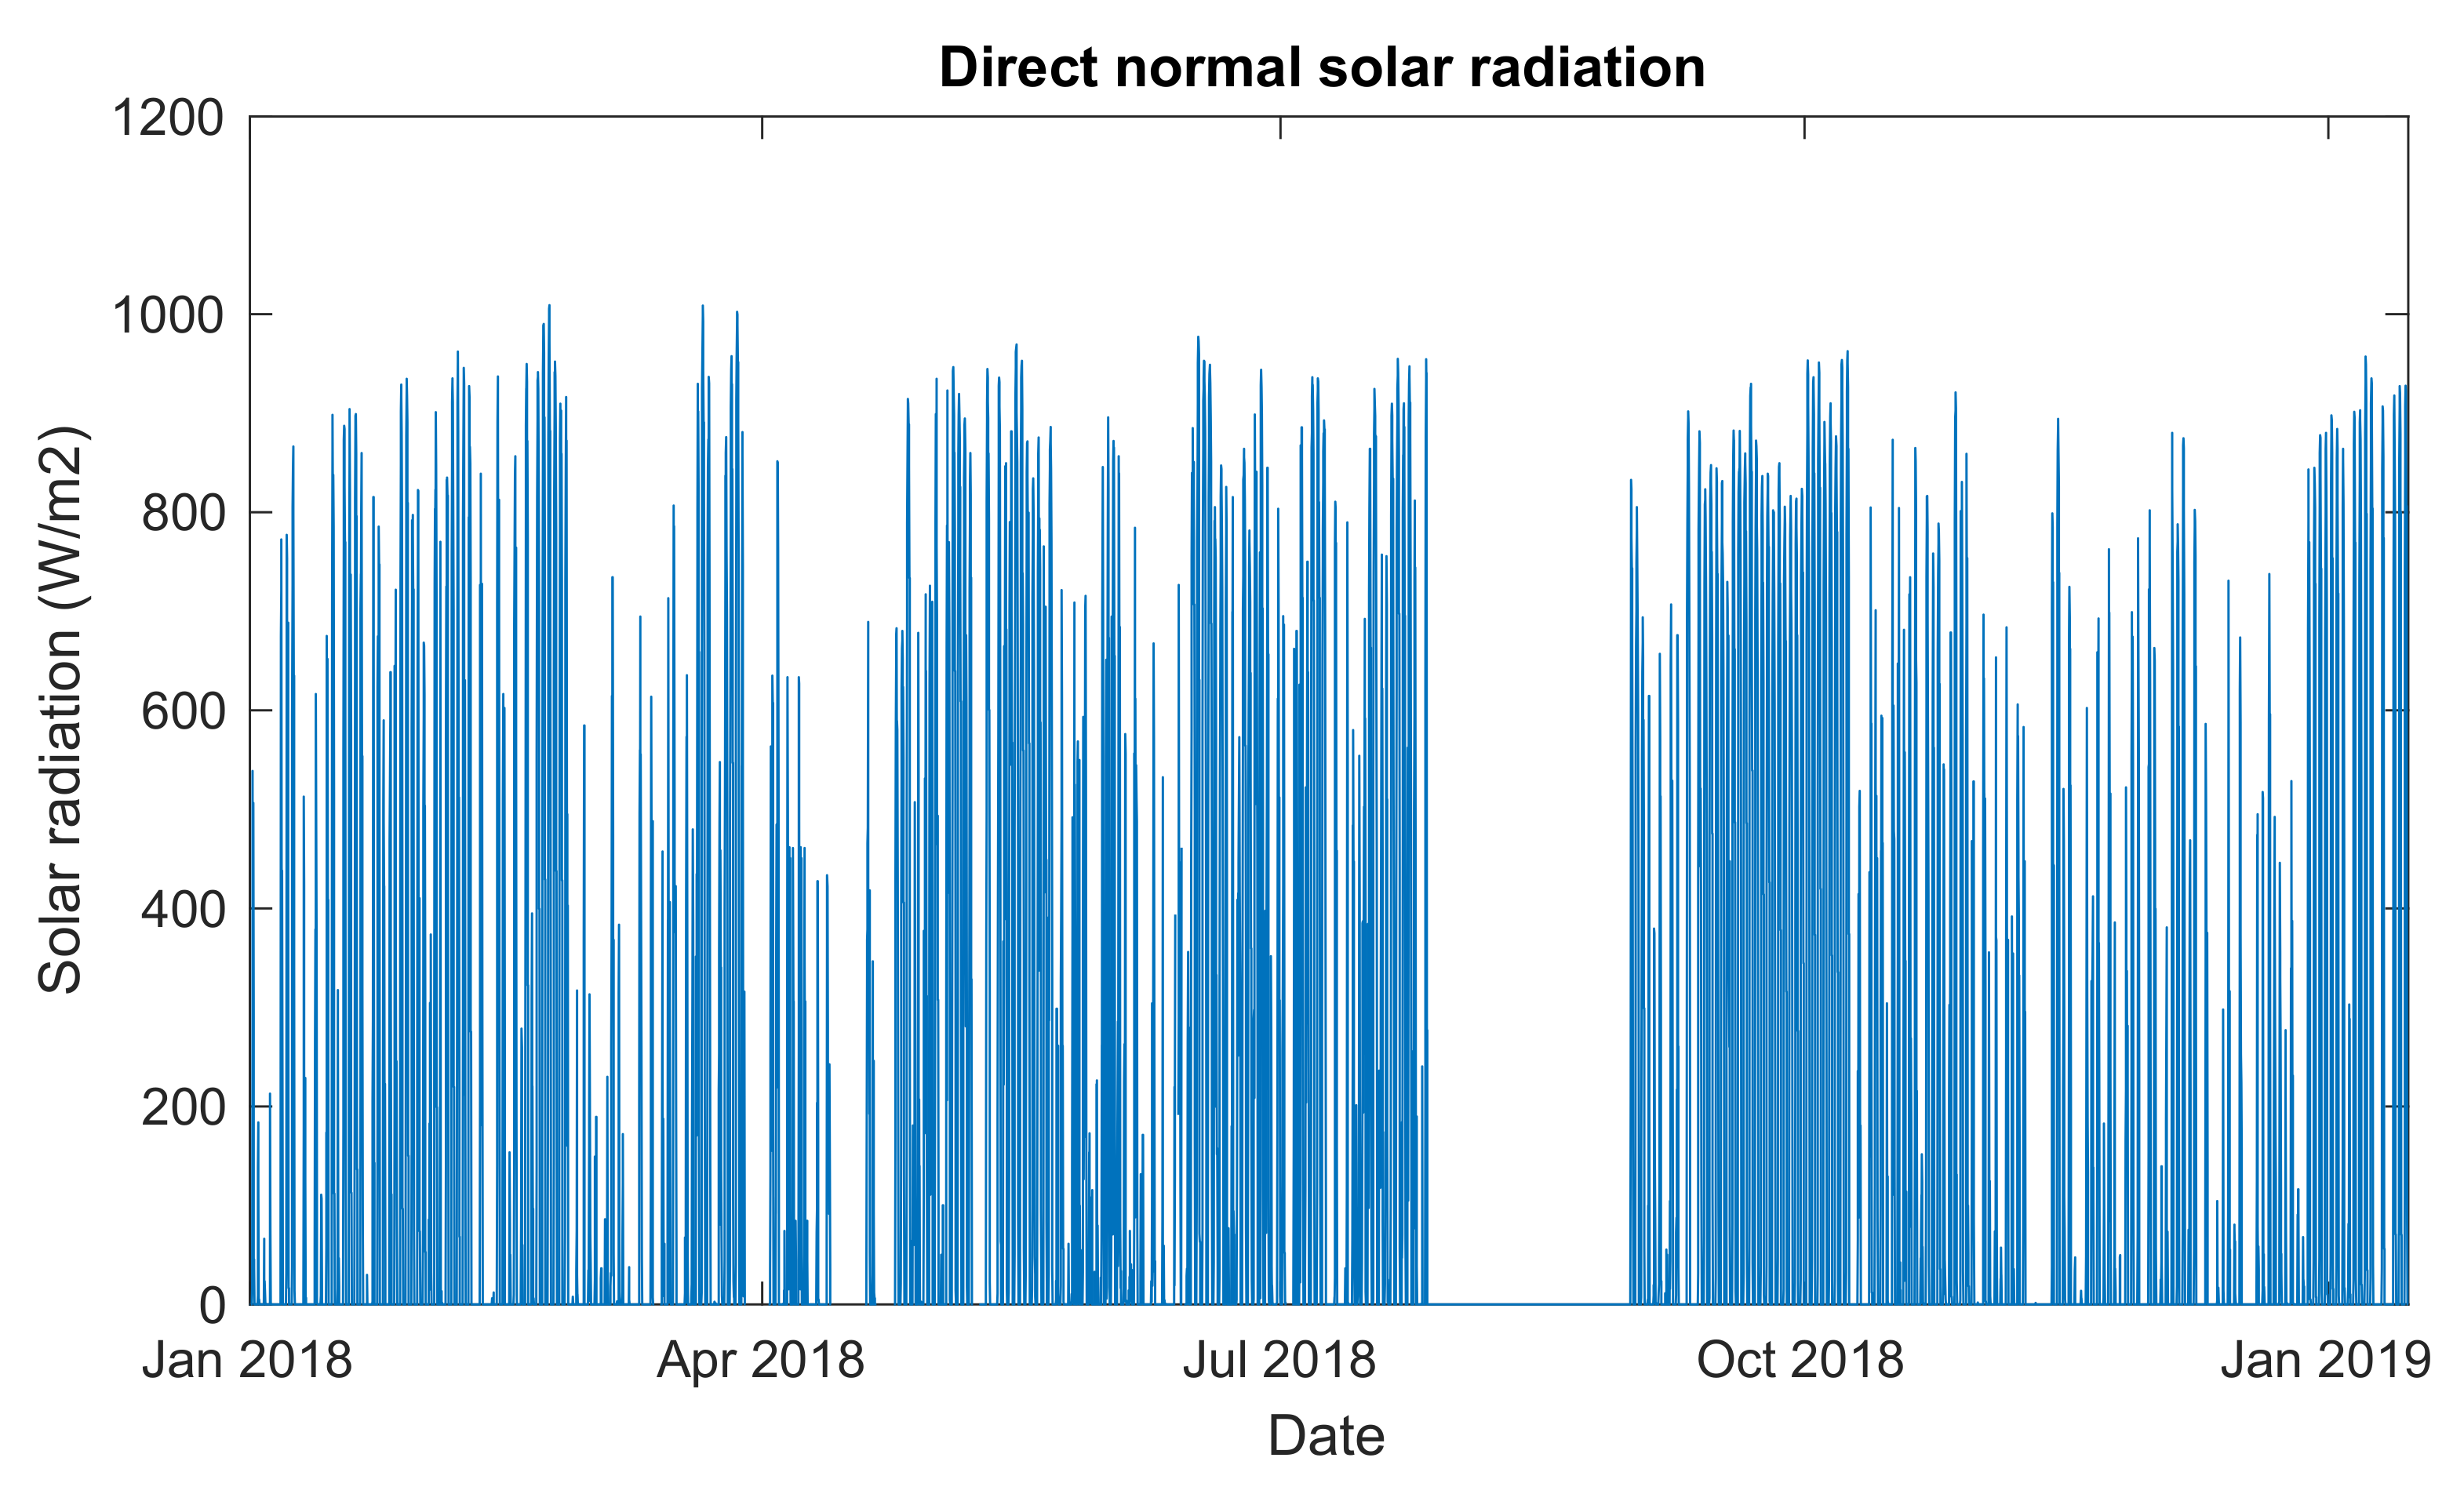
Figure A2 presents the direct normal solar radiation values, and
Figure A3 presents the values of the diffuse horizontal solar radiation. However, due to system maintenance, there is a lack of registers on some days of these months. In January and February, the highest value is near 600 W/m
2. The BIPVT system has better production of heat/electricity when the
is incident directly on the south-oriented façade. During the winter, the solar angle propitiates this production once the sun is lower in the sky than in the summer.
Overall, the year 2018 was a year with high-temperature peaks during a few days of the summer period. Low temperatures (below a considered ) have a significant occurrence, showing that there are plenty of hours during the year in which BIPVT elements would be useful for heating the space while reducing energy consumption through the use of other equipment for the same purpose.
The indoor temperature (
was also recorded. For the year 2018 and the first days of 2019, the
is fully presented to have a picture of whole year temperature fluctuations, as in
Figure 5, and specific periods of winter and summer are presented in
Appendix B, in
Figure A4a and
Figure A4b, respectively. Due to the passive solutions integrated into the design of the Solar XXI building, that as explained, is already a net-zero energy building, it is possible to see that the most of annual hours are within the comfort zone, having the most critical periods in January/2018 and February/2018 due to energy needs for heating, and in August/2018 and September/2018 due to energy needs for cooling. The registered
are mostly within
and it is possible to see that the lower temperatures, as expected, happen at night when the room is not receiving solar gains and is losing heat to the exterior.
4.2. BIPVT System Yearly/Seasonal Behaviour
4.2.1. Photovoltaic Module Temperature
A PV module exposed to solar radiation has its temperature usually above the ambient temperature, being dependent on the solar radiation intensity, ambient temperature, wind velocity, and the technology and structure used to compose this module. In this thesis’s scope, factors as wind velocity and the impact of technology, material, and structure are not analysed. Complementary analysis of the effects of different factors on the
may be found in [
42,
43], where there is a framework presented in how the wind effect may be included in the PV module temperature and is significantly useful for studies in which the PV module temperature are derived from calculations. This sub-section aims to evaluate the
purely by directly measuring the temperature in its interior surface
, that is the surface directly in contact with the adjacent air cavity and use the obtained values for the further theoretical calculation of the PV module
.
The yearly obtained values for the
(
Figure 6), and in detail, the temperature fluctuations in February and July are shown in
Appendix B (
Figure A5a,b), shows a considerable superficial temperature amplitude in the PV module, concerning its inner surface. Overall, during the year 2018, the maximum values can overcome 60 °C, while the minimums can be as low as 0 °C. It shows that the PV module, as is known, is a significant source of heat to interior air cavities when is exposed to direct solar radiation to generate heat to the room through convection and work as a heat recovery system. The high temperatures may, however, decrease the electrical efficiency of the photovoltaic generation—despite the present study focusing mainly on the potential of the systems to reduce the nominal energy needs for heating to achieve the comfort of the occupants of the adjacent thermal zone, for which the high temperatures of the PV module accomplish the purpose.
In a short amount of time as a day, the temperatures show variations from near 60 °C to near 5 °C, showing the effect of the direct solar radiation in heating the module. It is possible to note that the peaks in colder months are higher than the peaks in warmer months, despite warmer months present lower temperature amplitude during the day. It is due to the solar angle in relation to the south façade.
From the experimental values of , it is possible to conclude that the obtained values are higher than the during the Sun exposure hours, being this an excellent passive source of heat for the adjacent air cavity, in which the circulating air will heat the thermal zone. The variation on the , as in February, is very abrupt—having in about one-third of the daily hours a temperature over 30 °C. However, to serve as a heat source, it is enough that the panel hits a higher temperature than the air cavity temperature. The profile, in BIPVT systems, is adequate to the operation of the heat recovery system in usual working hours, as was the case of Solar XXI Building. On the other hand, during the warmer months, it is indicated to allow external air circulation, avoiding the air cavity’s overheat and increasing the of the system by reducing the , once the system will not be operating to heating the test room.
4.2.2. Air Cavity Temperature
As previously mentioned, the
directly affects the
, once it is the primary source of heat during the Sun exposure hours. It considers the
for the BIPVT system as a point temperature obtained for the half-height of the air cavity, where only one sensor is available. However, it is essential to highlight that the temperature within the air cavity is not homogeneous—and to complement the study in terms of sensor availability limitations, as was shown in [
10], in which it was demonstrated that the temperature gradient varies in both the horizontal and vertical directions. The
and
within the air cavity, present a gradient value, which is shown in the next subsection. The
is impacted not only by the
, but also by the interior wall temperature (the boundary between the system and the thermal zone), by the possible openings or leakage surfaces that allow the air mixing between the air from outdoor and/or air from indoors, and by the thermal bridges existent in the system.
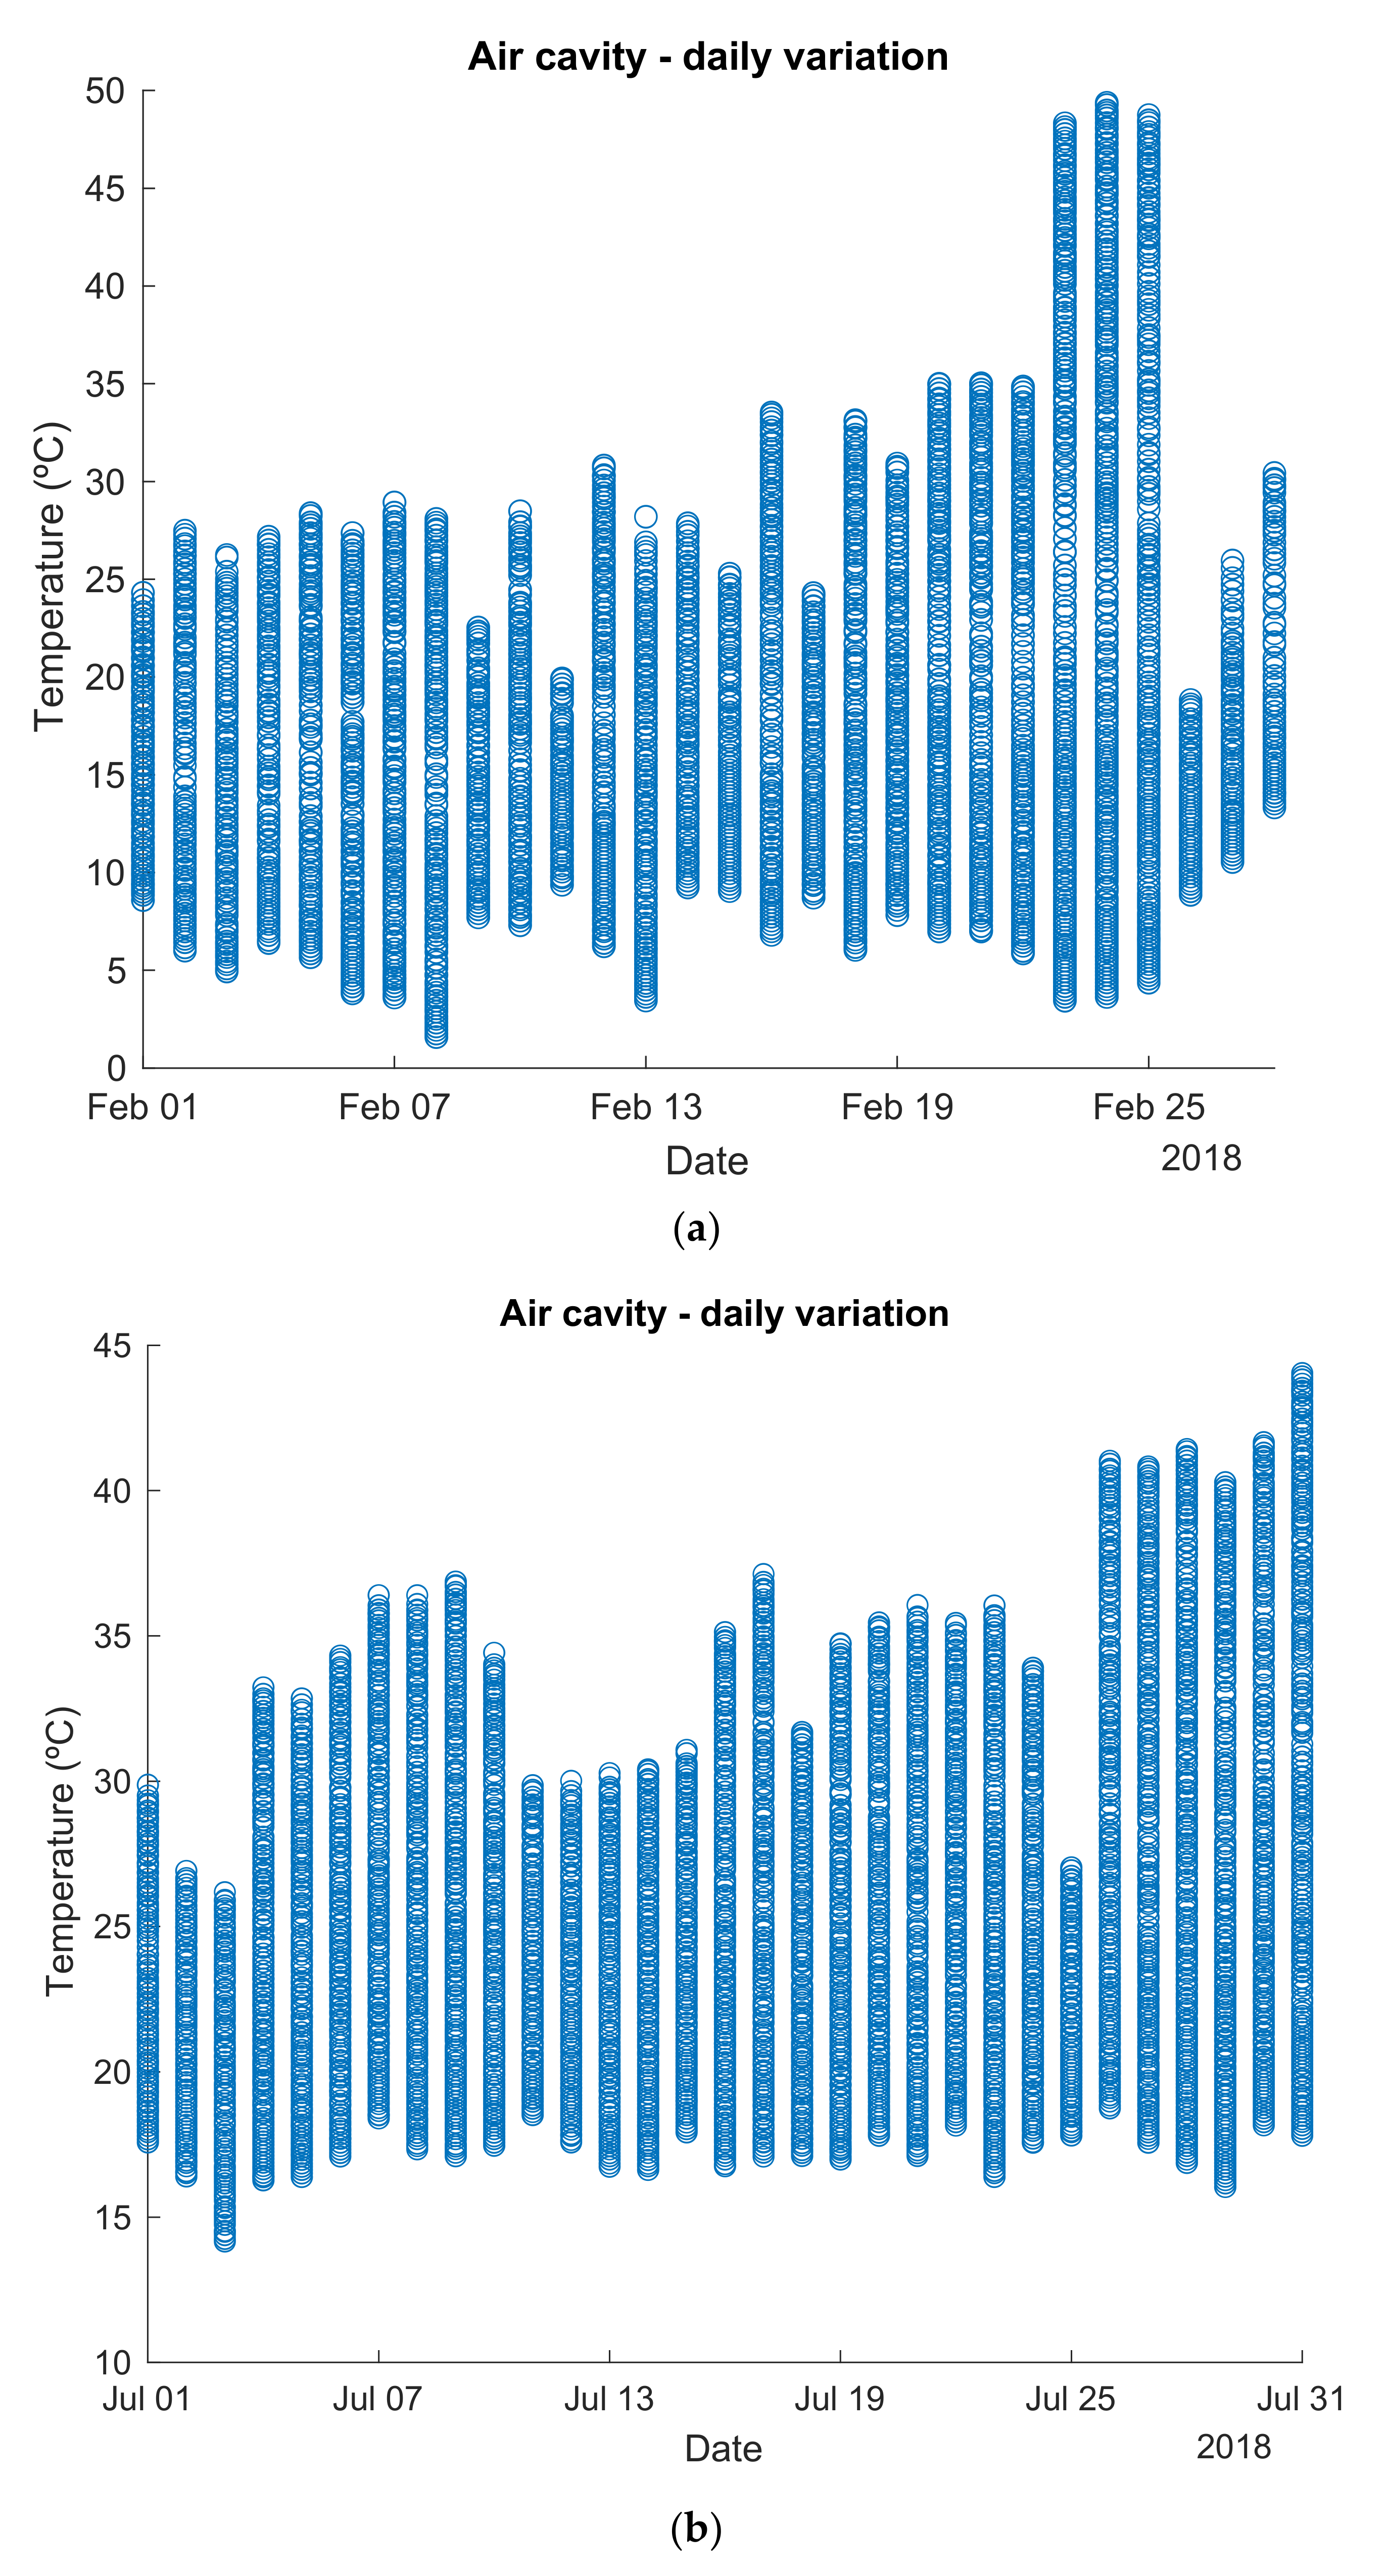
Given these considerations, the experimental results of the BIPVT air cavity temperature are shown in
Figure 7, and details in
Appendix B,
Figure A6a,b. During the year 2018, the maximum
(middle height of the system) are near 35 °C, while the minimum
hits 1.47 °C. The amplitude of the temperatures is lower during June/2018 and July/2018, with an increased minimum temperature when compared to the winter months. In August/2018, the
hits its maximum registered, with 56.57 °C. The annual average temperature of the air cavity is 19.13 °C.
There are considerable daily fluctuations on the BIPVT
, due to the PV module’s thermal resistance that separates this air cavity from the outdoors. It is possible to see that during the summer, the daily BIPVT
amplitude is lower than in the winter, also reflecting in smaller Δ
T (presented in the next sub-section), which is also influenced by the room temperature and would be later reflected in efficiency reduction, since the efficiency calculation formula is based on the temperature gradient for the convective heat flux. In February, during all the registered days, the
was, for hours with higher Sun exposure, higher than the minimum established
(20 °C), meaning that the system would be useful for heating the adjacent thermal zone and contributing to raising its temperature by the convection generated due to the Δ
T within the air cavity. The obtained results for the
are consistent with other BIPVT system prototypes previously evaluated the Solar XXI façade [
44] from previous years. However, this work presents a significant improvement in terms of number of data samples acquired, being more representative in terms of periods of analysis.
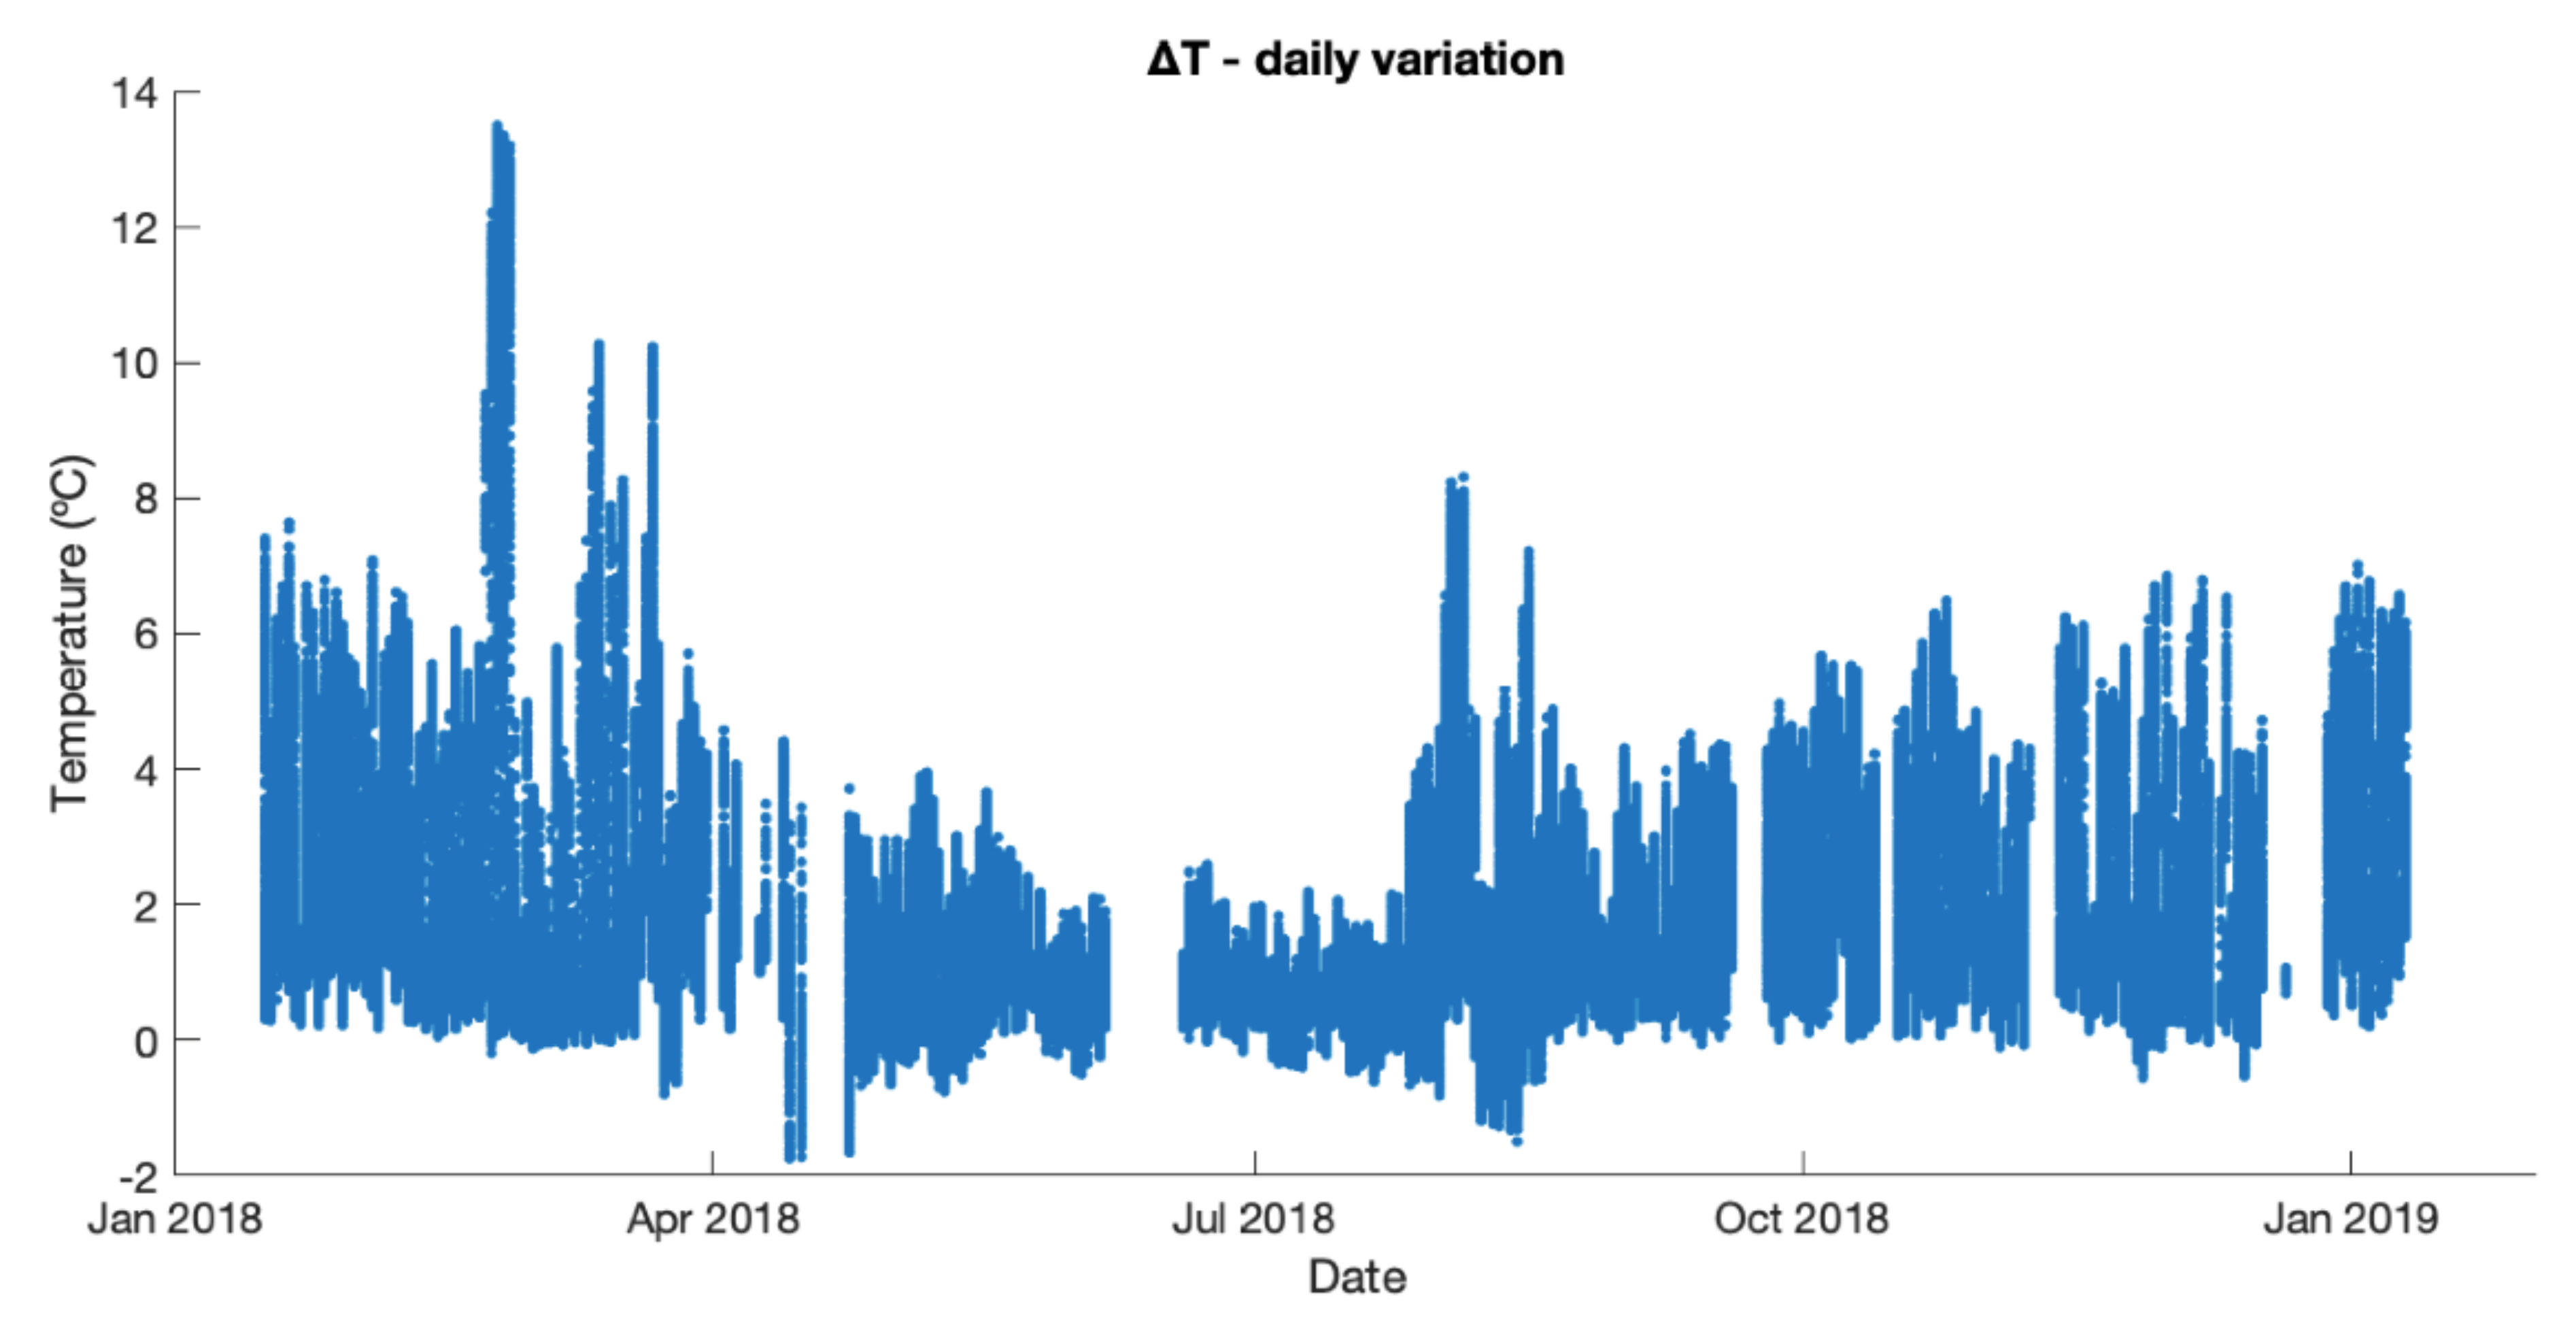
4.2.3. Outlet/Inlet Temperature Gradient
As previously mentioned, being is the primary source of heat to the air cavity, within the air cavity, a ΔT is generated due to convection. This ΔT refers to the temperature difference between the and the of the BIPVT system at a given moment and is responsible for the convective heat flux generated by the system when calculating its further .
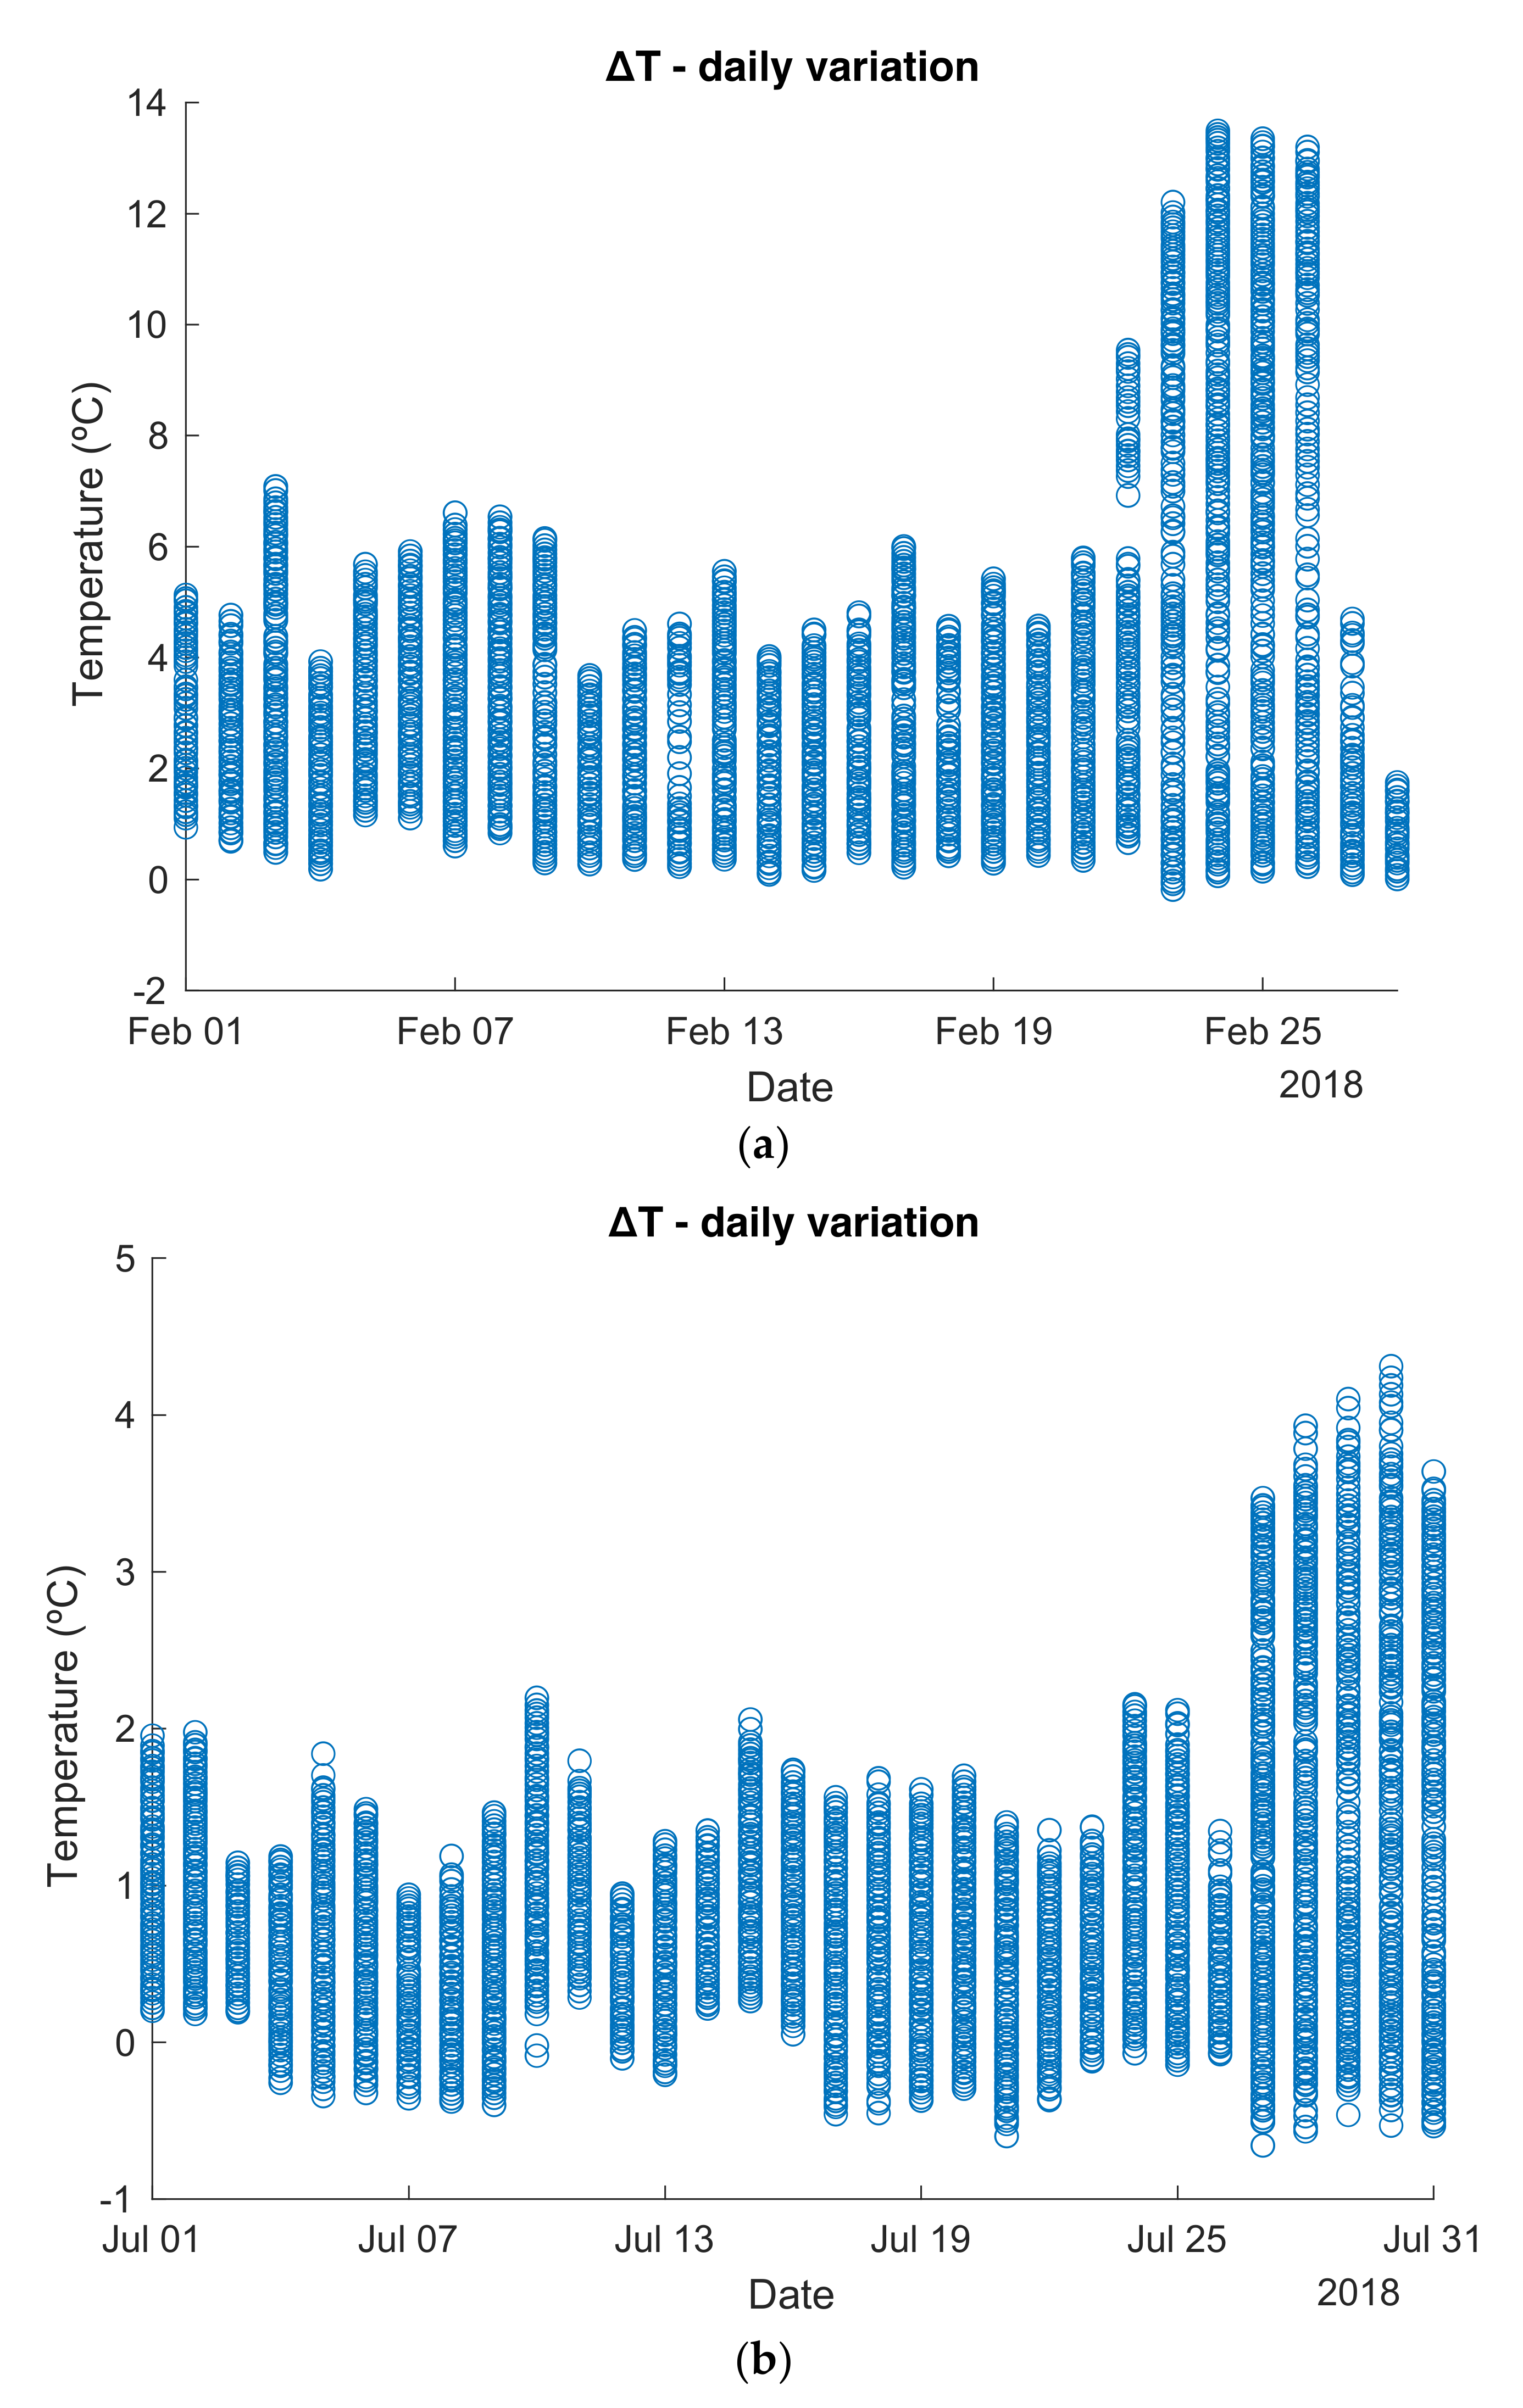
In
Figure 8, the Δ
T between the outlet and inlet registers (
−
) of the temperature sensors is calculated and shown. During the winter months, the Δ
T is more elevated due to the lower
in comparison to summer months, and to the higher values of
due to the solar angle in winter. These values could reach 14 °C in some peaks for the monitored period, although in general, they reached near 6 °C. Despite being a low-temperature gradient value, 6 °C is enough for the system to actuate as a heat recovery source if the thermal zone temperature is lower than the air cavity temperature.
In the summertime, the Δ
T assume values as low as 1 °C, being possible to see even a few periods in which the
are higher than the
. As is possible to see in the detail in
Appendix B (
Figure A7a,b), the amplitude is higher during February in an order varying from 4 °C to 13 °C. This factor will also be reflected in the thermal performance of the system under real-condition testing. As expected, during most of the year, the
is higher than
. The Δ
T in a system impacts the airflow velocity once the heat source will generate a vertical upwards airflow within the air cavity due to buoyancy forces resulting from density differences due to temperature variations, as was possible to see in the associated study [
10].
4.3. Thermal Behaviour—Yearly/Seasonal Analysis
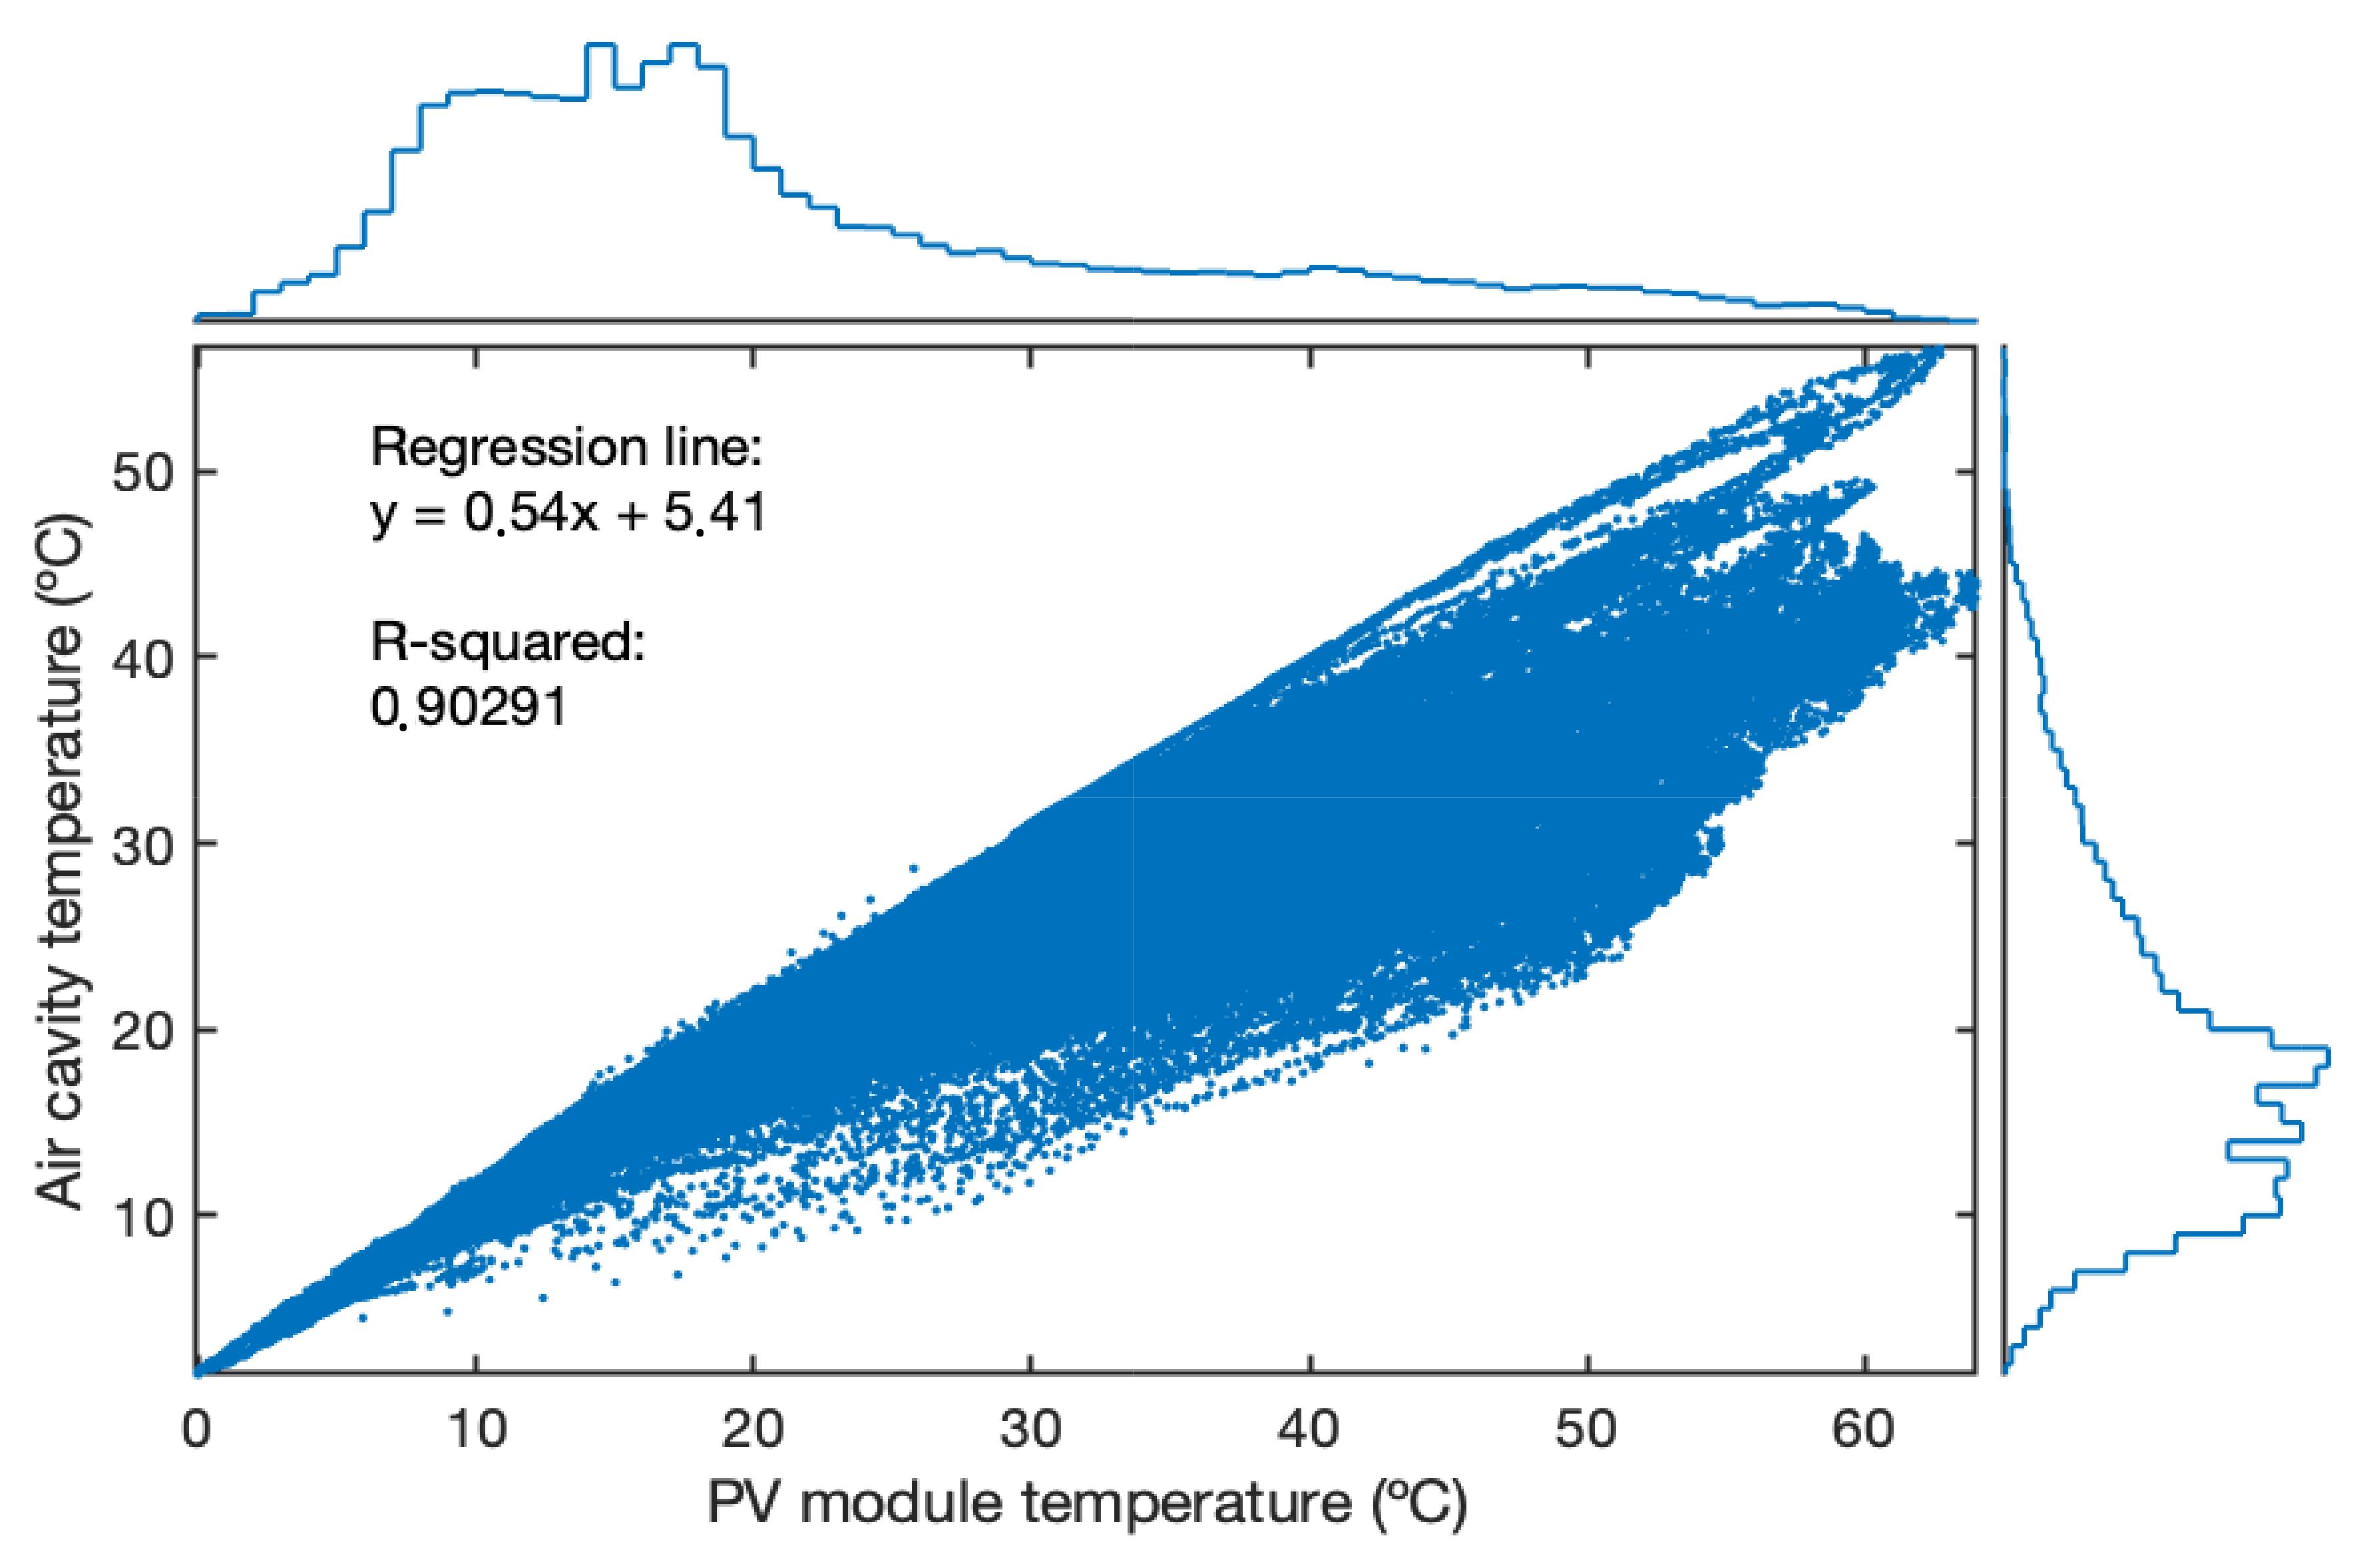
The relationship between the BIPVT system measured variables is also essential, in particular between and . It is recognised that the is not dependent only on , having the and also impact the temperature of the air cavity. However, the The solar radiation exposure and the PV module are the primary heat source of the system under operating hours. For this reason, this relationship is assessed here.
Figure 9 shows the results for the relationship between the annual
and
in a scatter plot, where it is possible to see that there is a positive correlation between these two variables. As the
increases, the number of possible values for the
do also increase, meaning that for a certain
, a broader range of
values exist. The lower the
, the more concentrated are the possible values for the
.
In some cases, the can be slightly higher than the , due to the thermal gains in the room, thermal inertia of the interior wall and possible position of the vents. The best-fit trendline representing this relationship is characterised as the approximation of this relationship ( and ) demonstrated by the equation graph.
The R
2 value refers to the goodness of fit and is a fraction between 0.0 and 1.0. The higher the R
2 value, the more accurate the prediction of the relationship may be considered. However, it is necessary to recognise that the R
2 has its limitations, once cannot be used to determine if there is any kind of bias in the acquired data under analysis. In the scope of this study, it only aims to provide preliminary insights into the relationship. It demonstrated that the relationship is broader during winter (with less confidence), while is more straightforward during the summer (with more confidence), increasing the predictability accuracy, as in
Figure 10a,b. The night periods have considerable impact on the results of the best-fit line, as during the night the temperature is very similar to the air cavity temperature, and as so may be considered a bias in the relationship results, once the hours in which the PV module is cold due to the lack of solar availability are almost half of the day.
Considering the different temperature sensors present inside the system (air cavity, PV module, inlet, outlet) and outdoors, there are outlier temperatures, higher than the statistical maximum of the year under the register. During the year, 50% of the is between 13 °C and 24 °C, while 50% of annual are between 14 °C and 28 °C. Annual temperatures of the outlet are slightly higher than the inlet, confirming that the existent alongside the air cavity, reflecting the impact of ΔT on the of the system.
As a conclusion for this relationship, there is a relationship between both temperatures, but it is also necessary to recognise that is not a single-valued function of , because the performance of the BIPVT system is affected by many other factors. The relationship between the variables could be improved by creating a broader set of variables (as adding ambient temperature as well), and also the co-relation analysis would be benefited to associate delay periods to each measured variable, as a couple of hours to days before the period in question, as is usual in forecasting models. The data acquired by this study may certainly be used to train forecasting models and increase the accuracy of the relationships, despite this not being the object of this work.
4.4. Thermal Behaviour—Daily Analysis
This subsection also presents the details of a daily analysis, considering a winter day in which it is pertinent to the BIPVT system’s operation and right sun-exposure weather conditions. The daily analysis of the registered values and calculations for the heat recovery BIPVT system is done considering 11 January 2019. The interior vents of the system were opened at 10:45 h and closed at 15:15 h.
Figure 11a presents the registered values for the 24 h of the day, along with the direct normal solar radiation at the weather station (b). It is possible to see the effect of the vents’ opening on the temperature of the air cavity, being responsible for a decrease of nearly 9 °C at the moments that followed 10:45 h (from 40 °C to 31 °C).
The PV module hit approximately 55 °C, slightly decreasing the temperature parabola with the opening of the vents. The system temperature achieved a difference of almost 20 °C from the
, due to the solar gains on the PV modules, the thermal inertia of the interior wall and
. It is also possible to note the interior walls’ excellent insulation when analysing the values from the heat flux sensor, which slightly vary from 5 W/m
2 to 48 W/m
2. On the other hand, the heat flux through the PV module achieved 210 W/m
2 at noon. During the vents opening hours, it is possible to see the detailed profile in
Figure 11. For the period under investigation, the registered air velocity in the inlet was 0.01m/s (manually measured with an anemometer sensor, punctually during few minutes in the operation hours). It is essential to highlight that the air velocity in the inlet, for the BIPVT system, was not measured constantly due to the lack of a permanent sensor, and intrinsically vary during the day and the year due to many factors impacting on the air movement. It was assumed as presented in [
10].
Due to the thermal inertia, it is possible to see that the system still slightly increases the temperature even with the decrease of the incident solar radiation. The is lower than the in the order of 2 °C, due to the air mixing in the outlet, between the system air at a given temperature and the room air at another given temperature. Also, a difference of almost 10 °C was registered between the and . The energy performance and efficiencies will be discussed in another section. Besides the measured variables presented here and the impact of the vents opening on the system thermal behaviour, other variables that are not under control and monitoring may be impacting the system, such as the wind speed.
4.5. Efficiency of the System
Generally, in most of the studies referred to in
Section 2, the system’s characterisation was made through the use of building performance indicators or construction performance indicators, employing energy needs analysis to reach thermal comfort or by the study of the system efficiency. However, efficiencies and dimensionless analysis also characterise the system’s heat transfer and performance, as presented by [
45,
46]. This study aims to determine the thermal efficiency of the system and also calculates the theoretical electrical efficiency in function of the module temperature.
The calculation of the thermal
(1) and the electrical
(2) efficiencies is presented below [
47]. The thermal efficiency convective heat flux (
) (3) component is calculated based on the obtained results for the inlet (
) and outlet (
) air cavity temperatures and the mass flow rate that depends on the air flow velocity through the air cavity [
10]:
In an air-based thermal system, the (3) plays an essential role in the , once the aim of the system is heating the adjacent thermal zone based on the ΔT gradient generated within the air cavity. The calculation of the systems’ energy thermal efficiencies took into consideration the , that was calculated based on the results obtained by the experimental campaign, and the , directly obtained by the measurement campaigns.
The system’s thermal efficiency for heating purposes was calculated and presented in
Figure 12, considering the same opening hours. The slight increase in the efficiency is due to the decrease of the incident solar radiation in the vertical surface (
) (wall in which the BIPVT is installed), obtained by the second pyranometer, installed in this vertical surface. The
is nearly 4%. The uncertainty must be taken into consideration in regards to the calculation of the thermal efficiency. As in
Table 2, the main uncertainties associated with thermal efficiencies calculated are the ones related to the sensor responsible for measuring the incident solar radiation in the vertical surface (possible error lower than 0.2%), and mostly the air cavity temperature sensor (possible error between 0.03 °C and 0.07 °C) and the air velocity sensor (possible error of 0.1 m/s), that directly affects the convective heat flux values. Considering the obtained value for 11:30 h, as presented in
Figure 12, the related uncertainty could cause the value to vary in the order of nearly 0.5%.
The theoretical electrical efficiency of the modules is calculated by Equation (2) and also shown in
Figure 12, taking into consideration a PV module normal operation condition temperature of 20 °C. It reaches 15.1% at 12:30 h. The theoretical power output (calculated based on the available area of PV modules, incident solar radiation, and theoretical efficiency determined in
Figure 12) for the BIPVT system is also presented in
Figure 12, and varies from 0.618 kW at 11:30 h, when the solar radiation assumes higher values, to 0.523 kW at 12:30 h, when the solar radiation is lower considering the presented period. The obtained solar power output is satisfactory given the building energy demand related to the nZEB concept.
The reduced thermal efficiency values may happen due to different causes. The BIPVT systems have a temperature gradient on the PV module itself, that although not being reported here given the fact that this study had only one surface temperature sensor (
Figure 6) for the module, it is reported in [
48]. This superficial temperature gradient in the modules is translated to the interior cavity, in the case of a BIPVT system, causing different conductive heat fluxes along the PV modules surface, with impacts on the air cavity temperature vertical profile. Also, when the vents are opened, there is a backflow on the outlet vent, in which point the thermal zone air mixes with the air cavity air at that height, contributing to reducing the outlet temperature in the operating hours of the BIPVT system with the purpose of thermal recovery—and this effect may be found in the computational fluid dynamics study developed by the authors in [
10,
49]. Considering that the thermal performance of the Solar XXI building is high, the thermal zones do not reach considerable low values, as is possible to see in
Figure 5, which implicates in a higher temperature of inlet, reducing the component of temperature gradient of the convective heat flux (3). Also, the
component of the equation is fairly low, as the system has natural ventilation. As was shown in the numerical part of the study published in [
10], higher air changes from the room to the air cavity results in better performance, indicating that the use of forced ventilation could improve the thermal efficiency. In addition, Portugal is a country with mild temperatures during the year, which means that the temperatures are not very high or very low for an extended period during the year. The case study building is also considerably efficient in thermal aspects.
Dimensionless thermal behaviour through a ventilated façade element may be based on the relationship between dimensionless height (
H*) (4) and dimensionless temperature (
) (5), as is presented in
Figure 13.
5. Conclusions
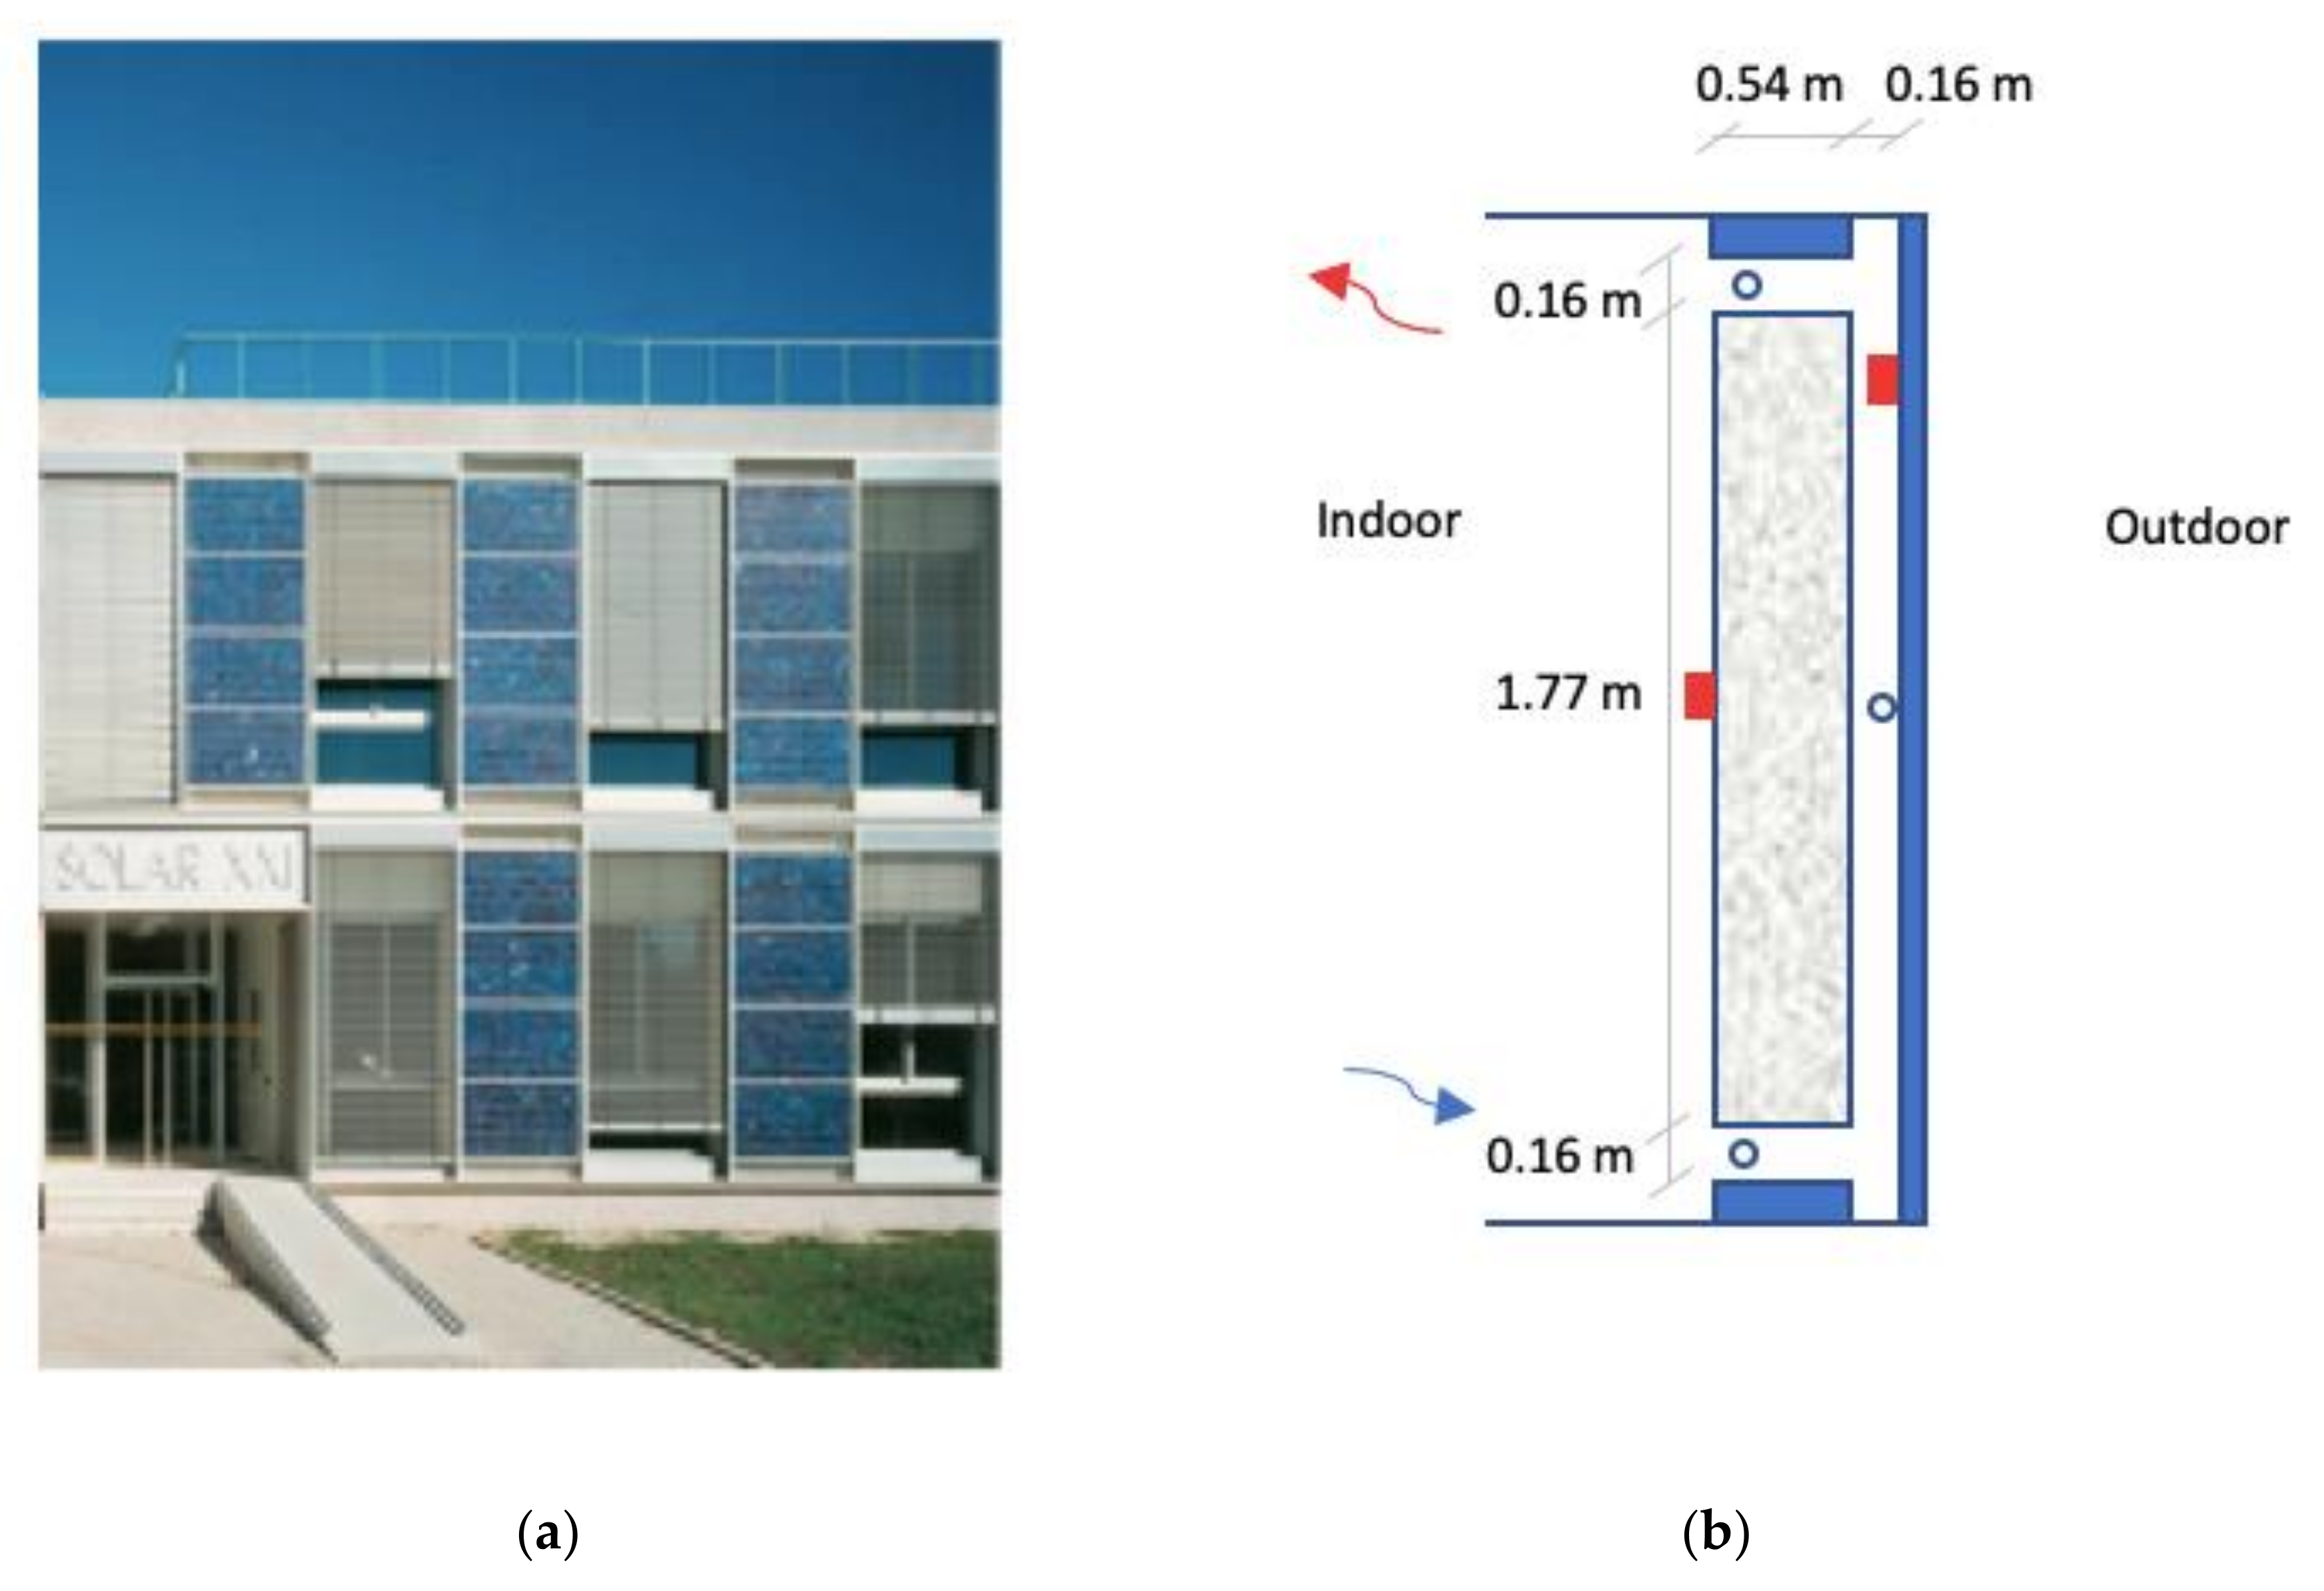
The building in which the case study is based is the Solar XXI building from the National Laboratory for Energy and Geology (LNEG, Lisbon, Portugal), which is recognised for having implemented a wide range of strategies to reduce the cooling and heating loads through solar control strategies and passive systems as buried pipes. The main building façade is composed of BIPVT systems that aim to generate electrical energy and act as a heat recovery system. These systems consist of 76 photovoltaic multi-crystalline silicon modules in the whole building and have an area of about 96 m2 and 12 kW peak power installed.
In the present study, the experimental analysis was developed to obtain a detailed characterisation in real use conditions of a building integrated photovoltaic thermal system (BIPVT) installed in the façade of Solar XXI building from the National Laboratory for Energy and Geology (Lisbon, Portugal). The novelty of the work focus on the presentation of an extensive experimental campaign for the Portuguese climate, with the system being installed in a living lab facility in which many parameters are measured in a continuous basis. The publication of this results is important not only to serve as basis for the characterization of these systems in the mild Mediterranean climate, but also in the nZEB context. Three main aspects were studied: the weather parameters, the BIPVT parameters, and the room parameters.
The weather parameters were observed and registered during the whole year of 2018 and the first semester of 2019. The campaign was based on the register of ambient temperature, global horizontal radiation, diffuse horizontal radiation and normal direct radiation components. The indoor room temperatures also monitored during the whole period of analysis to calculate the efficiencies and determine the boundary conditions to be used in the numerical analysis and model validation. It was concluded that the building already has an efficient thermal performance once the Solar XXI was projected to meet NZEB requirements. For so, the needs for cooling and heating are also reduced compared to the traditional constructive solutions being used in Portugal.
It presented the data concerning the , inlet and in the air cavity, , and heat flux through the interior wall. The system presented a thermal efficiency of between 3.3% and 4% for heating purposes during the day studied in detail. However, it is necessary to highlight that these efficiencies are values that represent the behaviour of the system for the boundary conditions existent in the period considered for the calculation. In other words, the results may vary according to factors like solar radiation availability and Ti, and also indicates that forced ventilation may be considerably useful in similar situations to improve the efficiency results—remembering that in this study only natural ventilation was used. The theoretical calculated electrical efficiency obtained reached 15.1%. The calculation of efficiencies was purely based on these experimental campaign results. The system under study brings clear benefits to the buildings, mainly due to the electricity generated by the PV modules, and it was shown that it is also useful to contribute to heat the adjacent thermal zone in which it is installed.
The work was extensive in terms of the monitoring period and the number of variables analysed, and these data will serve in the future not only to validate computational models in terms of dynamic simulations, but also to train machine learning models and introduce the use of model-based predictive control to control the operation of the vents in a smart manner. Moreover, the presentation of such experimental campaigns may in the future contribute to the decision-making process in the point of view of architecture and engineering.


 ,
, 


