
Enhancing the Specific Power of a PEM Fuel Cell Powered UAV with a Novel Bean-Shaped Flow Field


1
Institute of Energy and Process Systems Engineering, Technische Universität Braunschweig, 38106 Braunschweig, Germany
2
Cluster of Excellence SE2A—Sustainable and Energy-Efficient Aviation, Technische Universität Braunschweig, 38106 Braunschweig, Germany
3
Department of Mechanical Engineering, Faculty of Engineering, University of Isfahan, Isfahan, Iran
*
Author to whom correspondence should be addressed.
Energies 2021, 14(9), 2494; https://0-doi-org.brum.beds.ac.uk/10.3390/en14092494
Submission received: 7 March 2021
/
Revised: 5 April 2021
/
Accepted: 16 April 2021
/
Published: 27 April 2021
(This article belongs to the Special Issue Design, Modeling, and Optimization of Novel Fuel Cell Systems)
Abstract
:One of the marketing challenges of unmanned aerial vehicles (UAVs) for various applications is enhancing flight durability. Due to the superior characteristics of proton exchange membrane fuel cells (PEMFCs), they have the potential to reach a longer flight time and higher payload. In this regard, a numerical assessment of a UAV air-cooled PEMFC is carried out using a three-dimensional (3-D), multiphase, and non-isothermal model on three flow fields, i.e., unblocked bean-shaped, blocked bean-shaped, and parallel. Then, the results of single-cell modeling are generalized to the PEMFC stack to provide the power of 2.5 kW for a UAV. The obtained results indicate that the strategy of rising air stoichiometry for cooling performs well in the unblocked bean-shaped design, and the maximum temperature along the channel length reaches 331.5 K at the air stoichiometric of 30. Further, it is found that the best performance of a 2.5 kW PEMFC stack is attained by the bean-shaped design without blockage, of which its volume and mass power density are 1.1 kW L−1 and 0.2 kW kg−1, respectively. It is 9.4% lighter and 6.9% more compact than the parallel flow field. Therefore, the unblocked bean-shaped design can be a good option for aerial applications.
1. Introduction
Unmanned aerial vehicles (UAVs) have attracted much attention for applications such as mapping at spatial and temporal scales, supporting disaster management, precise agriculture and monitoring forest changes, wildlife observation, wireless coverage, public security, land administration, etc. [1]. UAVs are capable of performing some dangerous or challenging tasks with high mobility, protection, and low cost. Nevertheless, it is essential to select a suitable energy source with an optimized energy management system to operate UAVs efficiently [2].
Utilizing lithium-ion batteries in UAVs can supply the required energy for only a limited flight time due to their low energy density. Lithium-ion batteries’ energy density is 260 Wh kg−1, while the energy density of fuel cells is more than 800 Wh kg−1 [3]. In addition to a comparably smaller size, the lack of a need to recharge and continuous operation with instant refuel capability are other advantages of polymer exchange membrane fuel cells (PEMFCs) [4]. Due to the outstanding features of PEMFCs, they are a more promising solution for increasing the flight time capability of UAVs [5,6]. However, considerable developments in their technology and power density are required to make them ideal for aviation applications [7,8]. Fuel cell heat management is one of the suggested approaches to enhance the efficiency and specific power of fuel cells while ensuring reliable and flexible operation. Existing commercial fuel cells with an output power of more than 100 W require a cooling system [9].
Liquid coolant is widely employed as a coolant in fuel cell systems and needs more power to circulate, as it has more viscosity and density than air [10]. The air-cooled technique is more desired for UAVs and has potential in general aviation applications because of its simple structure and relatively low weight [9]. However, the specific power of air-cooling is less than liquid-cooling systems, and researchers’ efforts are directed at improving air-cooled systems’ power density. Reducing bipolar plates’ (BPs) weight structure and improving the heat and mass transfer at the same time is one way of increasing the power density of a PEMFC [11]. BPs are a fundamental part of the PEMFC that comprises about 60–80% of the fuel cell weight and 30–50% of the stack manufacturing cost [12]. For this purpose, the fuel cell stack’s weight and cost can be significantly reduced by improving BP configuration and the embedded flow field within BPs and using lightweight materials.
The parallel, serpentine, and pin-shaped flow patterns are the most common flow channels in PEMFCs that have been developed so far. A simple machining process and low pressure drop are the superior characteristics of the parallel flow channel. The benefit of the serpentine flow design is uniform reactants distribution; however, the pressure drop is high within this type of flow channel [13]. The main features of pin-type flow fields are penetrating more flow in porous regions, harvesting additional by-products through creating a positive pressure gradient, and improving fuel cell performance. However, the maldistribution of reactant flow is the main issue of pin-type flow fields [14]. In the following, we will review various flow fields in PEMFCs, and the use of PEMFCs for aircraft propulsion.
Heidary et al. [15] designed the parallel flow pattern with blockage as a non-isothermal, multiphase, and three-dimensional (3-D) model to enhance PEMFC performance. They found that the maximum gross power was increased by 7%, and the pressure drop was reduced by 1.6 kPa using staggered blockages. In further research, Atyabi and Afshari [16] employed the honeycomb flow channel at the PEMFC cathode side. Their results revealed the distribution of air and temperature was uniform due to the formation of parallel and serpentine paths in the cathode gas channel. Lee et al. [17] proposed a new flow channel in the cathode side for a passive air-cooled PEMFC. In the considered structure, the designed cathode channel was diffuser-shaped, like a nozzle, such that the cross-sectional area became gradually larger from the inlet to the outlet of the channel length. This configuration facilitated thermal management through the cathode channel while minimizing water removal, i.e., higher water concentration was obtained on the cathode side. They concluded that the relative humidity in the parallel flow field reduced from 35% to 16.56%, while the relative humidity in the novel cathode flow pattern slightly decreased from 35% to 27.92% in the downstream direction. In another study, Ying et al. [18] studied the effect of various channel sizes on air-breathing PEMFC performance. Their obtained results indicated that concentration over-potentials had a critical influence on the natural convection cooling in comparison with the forced convection cooling, especially in channels with a smaller width. Matian et al. [19] experimentally and numerically compared three configurations of a cooling plate in a PEMFC. Their results indicated that a higher pressure drop was observed within the channel with a greater height, which caused a 10% increase in the parasitic load.
Additionally, several research groups have put effort into using fuel cells as aircraft propulsion. In 2005, AeroVironment developed the first fuel cell aircraft in the world, which used liquefied hydrogen as fuel. Another group in 2006 presented the design of the PEMFC as a power source of a small UAV and utilized the compressed hydrogen for fuel storage [20]. Before the flight test, wind tunnel tests were carried out under real flight conditions. They demonstrated that the PEMFC aircraft flew for two hours without causing any problems with system performance. The Boeing Company successfully carried out flight tests for the first manned PEMFC aircraft in 2008. They employed PEMFCs and lithium-ion batteries as the power source for aircraft. They demonstrated that fuel cell aircraft could successfully work in the temperature range of 3 °C to 25 °C [7]. Lapeña-Rey et al. [21] developed an electric UAV which was powered by combined energy sources, i.e., a 200 W PEMFC system and high specific energy lithium polymer batteries (Zippy 5000 mAh 6S 20C). Their test results demonstrated that the feasible flight time was 4 h using integrated power sources. Herwerth et al. [22] applied a PEMFC in a small UAV to show the capabilities of the endurance of PEMFC for flight. They employed the air-cooled PEMFC for thermal management and applied self-humidification at an operating temperature of 60 °C.
Based on the research background, most studies on aircraft propulsion have been performed as experimental methodologies, and the numerical modeling of PEMFC-driven aircraft has not been investigated so far. The goal of this paper is to increase the power density of air-cooled PEMFC in the propulsion system to reduce its weight and enhance the system efficiency using numerical modeling. Through improving the design and the embedded flow field inside BPs, the weight and volume of the PEMFC stack can be potentially reduced. Although the effect of various flow patterns on water management and PEMFC performance have been examined in the literature, their simultaneous effects on weight and volume reduction have not been studied so far. Due to the importance of PEMFC stack weight and size in aviation applications, we numerically compare three flow fields, i.e., parallel, bean-shaped with blockages, and bean-shaped without obstacles, in terms of power density using a three-dimensional (3-D), multiphase, and non-isothermal model. Several goals have been pursued in this paper, which include a proper cooling of the fuel cell using an air-cooled strategy, uniform distribution of temperature, oxygen, and electrical current density, and reaching the maximum amount of mass and volume power density.
2. Model Description
Figure 1 demonstrates a schematic view of a PEMFC-driven UAV. Since the air stoichiometry is high, the required air for cooling and cathode side is provided simultaneously. The high-pressure hydrogen is stored in the tank and transfers to the anode side of PEMFC after reducing its pressure. The humidifier is removed at the anode side of the fuel cell, because the considered membrane thickness (Nafion® 212) is thin, and the impact of the electro-osmotic drag against back diffusion is negligible. Unreacted hydrogen fuel is recirculated by a hydrogen pump to the anode side inlet. Additionally, the purge valve precisely controls the operational performance of PEMFC while the stack voltage drops quicker than the estimated voltage.
3. Mathematic Formulation
3.1. Assumption
Computational fluid dynamic (CFD) simulation provides conditions for the accurate study of fuel cell behavior. The problem-solving strategy using CFD simulation includes the following steps: determination of domain structure (physical modeling), discretization of the computational domain and governing equations, specifying the numerical solution approach, extraction of results, and verification of results with available experimental measurements. In this research, non-isothermal, 3D, and two-phase models are applied to the PEMFC simulation. Given the complexity of fuel cell governing equations, the following simplified assumptions are considered,
- (a)
- PEMFC operates at steady-state conditions.
- (b)
- The inlet gas flow is assumed incompressible.
- (c)
- The mixture of reactants gases is estimated as an ideal gas.
- (d)
- The flow is supposed to be laminar due to the low fluid velocity inside the flow channels.
- (e)
- The CLs and membrane are uniform, isotropic, and homogeneous.
- (f)
- Phase change only takes place in CLs and GDLs.
- (g)
- The membrane is assumed impermeable against the gas phase.
- (h)
- The electrical contact resistance is only taken into account at the GDLs/BPs interface.
3.2. Governing Equation
The governing equations for PEMFC modeling include mass, species, momentum, energy, and charge equations associated with electrochemical reactions, which are summarized herein.
Equation (1) expresses the mass conservation equation under steady-state conditions.
where , , and , are porosity, velocity vector, and density, respectively.
Equation (2) indicates the momentum conservation equation under steady-state conditions [23].
where , , and are viscosity, pressure, and momentum source term. The momentum source term is zero in the gas channel regions because of a very high diffusion rate within the channel and a high permeability coefficient. This term can be described as below for other porous regions [24].
where is the permeability coefficient of porous media.
The species conservation equation has the form below:
where is species concentration and is an effective diffusion coefficient, which can be obtained by Equation (5) [25]
where
is the pore-blocking saturation exponent, s is water saturation, and is the reference diffusion coefficient of kth species. The source term of spices equation in the membrane region has the following form.
where I and F are current and Faraday constant. is the coefficient of the electro-osmotic drag. It results in the pulling of water molecules, along with protons, to the cathode side, which can be determined by Equation (7) [26]
The following are equations to calculate species source terms in CLs [27].
where and are the local current density of anode and cathode sides, which can be represented as follows [28]:
where r is pore blockage in the current collector area, R is the universal gas constant, is reference current density, T is temperature, is specific active surface, is charge transfer coefficient, and is concentration dependence.
The energy conservation equation within the fuel cell can be stated as [29]:
where is an effective thermal conductivity, which represents effective properties in the porous media, and can be calculated using Equation (14) [26].
is the source term of energy. This term is due to the irreversibility of electrochemical reactions, phase-change heat, and ohmic heating, which can be expressed as:
where is over-potential, is evaporation coefficient, is membrane conductivity, is electrical conductivity, is the surface area of phase-change per unit volume, is maximum water mass ratio in dry air, is the ratio of water in dry air, and is evaporation heat.
Based on charge equations, we can calculate delivered protons through the membrane and transmitted electrons through current collectors, GDLs, and CLs. The following equations represent the charge equation for electrons at the anode and cathode electrodes [30].
where and are the electrical potential of electrodes and the electrical transfer current, respectively.
The charge equation for delivering protons at the membrane/CLs interface can be defined as [31]:
where is membrane ionic potential and is membrane proton conductivity, which can be written by Equation (22) [16].
where is membrane water content and depends on water activity (a), which can be estimated using the empirical relation as [32]:
where is water vapor pressure and is the pressure of water saturation, which depends on temperature [33].
When the PEMFC works at low temperatures (below 100 °C), a part of the produced water at the cathode side converts to liquid water. It can block the porous regions of GDL and prevent reactants gas transfer to the CL, which can deteriorate PEMFC performance. Hence, the investigation of a two-phase model within the fuel cell is essential.
The model of transport and formation of liquid water in the GDLs and CLs regions has the form below [31].
where subscript l indicates liquid water, and is condensation rate in the GDLs and CLs, which can be represented as below [24]:
where is the constant condensation coefficient of water. If the velocities of gas and liquid inside gas channels are supposed as equal, the capillary diffusion within porous regions can be expressed as [31]:
where is capillary pressure, which can be obtained based on Leveret’s function as [34]:
where is the contact angle, and is the surface tension.
The contact resistance between GDLs and BPs is the resistance against the current transfer from BPs to GDLs. The amount of contact resistance between the BP/GDL interface is calculated based on experimental Equation (30) [35].
where is assembly pressure, is the contact surface between the GDL and BP, and is the assembly surface.
The maximum fuel cell voltage is obtained when the fuel cell operates under reversible thermodynamic conditions. The actual voltage of a PEMFC is less than the theoretical voltage due to reaction drops. Therefore, the cell’s operating voltage can be expressed as a deviation from the ideal voltage, where the irreversible voltage subtracts from the reversible voltage at a specific current density. Reversible voltage can be described using Nernst potential as [29]:
where is the open-circuit voltage and H is enthalpy. The voltage at the anode side and cathode side can be attained as below [26]:
3.3. Boundary Condition
To find unknown parameters of velocity, pressure, the potential of electrodes, temperature, and species concentration, a set of equations, i.e., mass, species, momentum, and energy, along with potential equations, should be solved. For this purpose, we need to specify appropriate boundary conditions to simulate the computational domain. Since the modeling is conducted based on a single-domain method, boundary conditions should only be identified on external surfaces of the computational domain, and there is no need to adjust them in the interface of various zones of the PEMFC. Elimination of internal boundary conditions causes an increase in the model’s precision, reducing computational error, and facilitating the computation method. However, utilizing the single-domain method prolongs the computing time. The performed boundary conditions can divide into four categories; inlet, outlet, symmetry, and wall boundary conditions, which are explained herein. At the entrance of both cathode and anode channels, the mass flow inlet boundary condition is employed, and these inlet mass flow rates have the following forms:
where is the stoichiometric ratio, M is molecular weight, and x is the molar fraction. At the inlet of the channels, the partial water vapor pressure is equal to the saturation pressure at the inlet reactants’ humidification temperature. Therefore, the water molar fraction at the inlet of channels is given by Equation (37).
where RH is relative humidity. The molar fraction of the inlet hydrogen and oxygen can be described by Equations (38) and (39), respectively.
The outlet pressure boundary condition is given in the channels’ outlet. On the walls, for velocity, the non-slip boundary condition and zero flux conditions for other variables are considered except for the outlet and inlet of the anode and cathode channels. The inlets of the anode and the cathode sides are adjusted counter-current because of thin membrane thickness and removing humidification at the anode side. When air flows along the cathode channel, water concentration at the cathode side is more than the anode side due to water production. On the other hand, the electro-osmotic drag is more at the entrance of the anode side than the channel outlet due to the high availability of hydrogen and further proton transfer to the cathode side. For this reason, the inlet and outlet sides of the anode and the cathode are adjusted in a counter-current configuration to compensate membrane dryness at the entrance of the anode side by water back diffusion from the cathode side. The high back diffusion mechanism is essential to keep high proton conductivity in the membrane. The symmetric boundary condition is utilized in bean-shaped flow field along the flow channel for one-half of the PEMFC. Finally, a boundary condition for the current collector is introduced, which determines the electrical potential equation. The current collector contains the anode and cathode terminals, the electrical potential at the anode terminal is adjusted to zero, and the electrical voltage at the cathode terminal is adjusted to the operating voltage. The considered boundary conditions in both cathode and anode sides of PEMFC are listed in Table A1.
3.4. Solution Procedure
The finite volume approach is utilized to solve PEMFC’s governing equations with defined boundary conditions using the ANSYS FLUENT fuel cell module. In this module, the equations of potential, electrochemical, and membrane water transfer are added to the Fluent software using User Defined Functions (UDF). It facilitates the prediction of source terms and electrochemical reactions within the PEMFC. The module also incorporates all fuel cell components, including BPs, GDLs, CLs, flow channels, and the membrane, which can be introduced into the software to solve equations. In this program, pressure and velocity fields attain using the SIMPLE algorithm, and a repetition process employs to solve the equations set. This procedure continues to converge the results with an accuracy of 10−6. Their conjunction is the main reason to choose the iterative method to solve equations. For two reasons, the conservation equations of PEMFC are strongly linked to each other. The first reason is that the chemical and physical features of the materials vary and depend on the transfer parameters. The second reason is that conservation equations are coupled to each other using the Butler–Volmer equation. For instance, the Butler–Volmer equation is a function of hydrogen and oxygen concentrations; on the other hand, the species concentrations can be identified using the species equation. The Butler–Volmer equation enters as a source term into the species equation and calculates oxygen and hydrogen consumption rates.
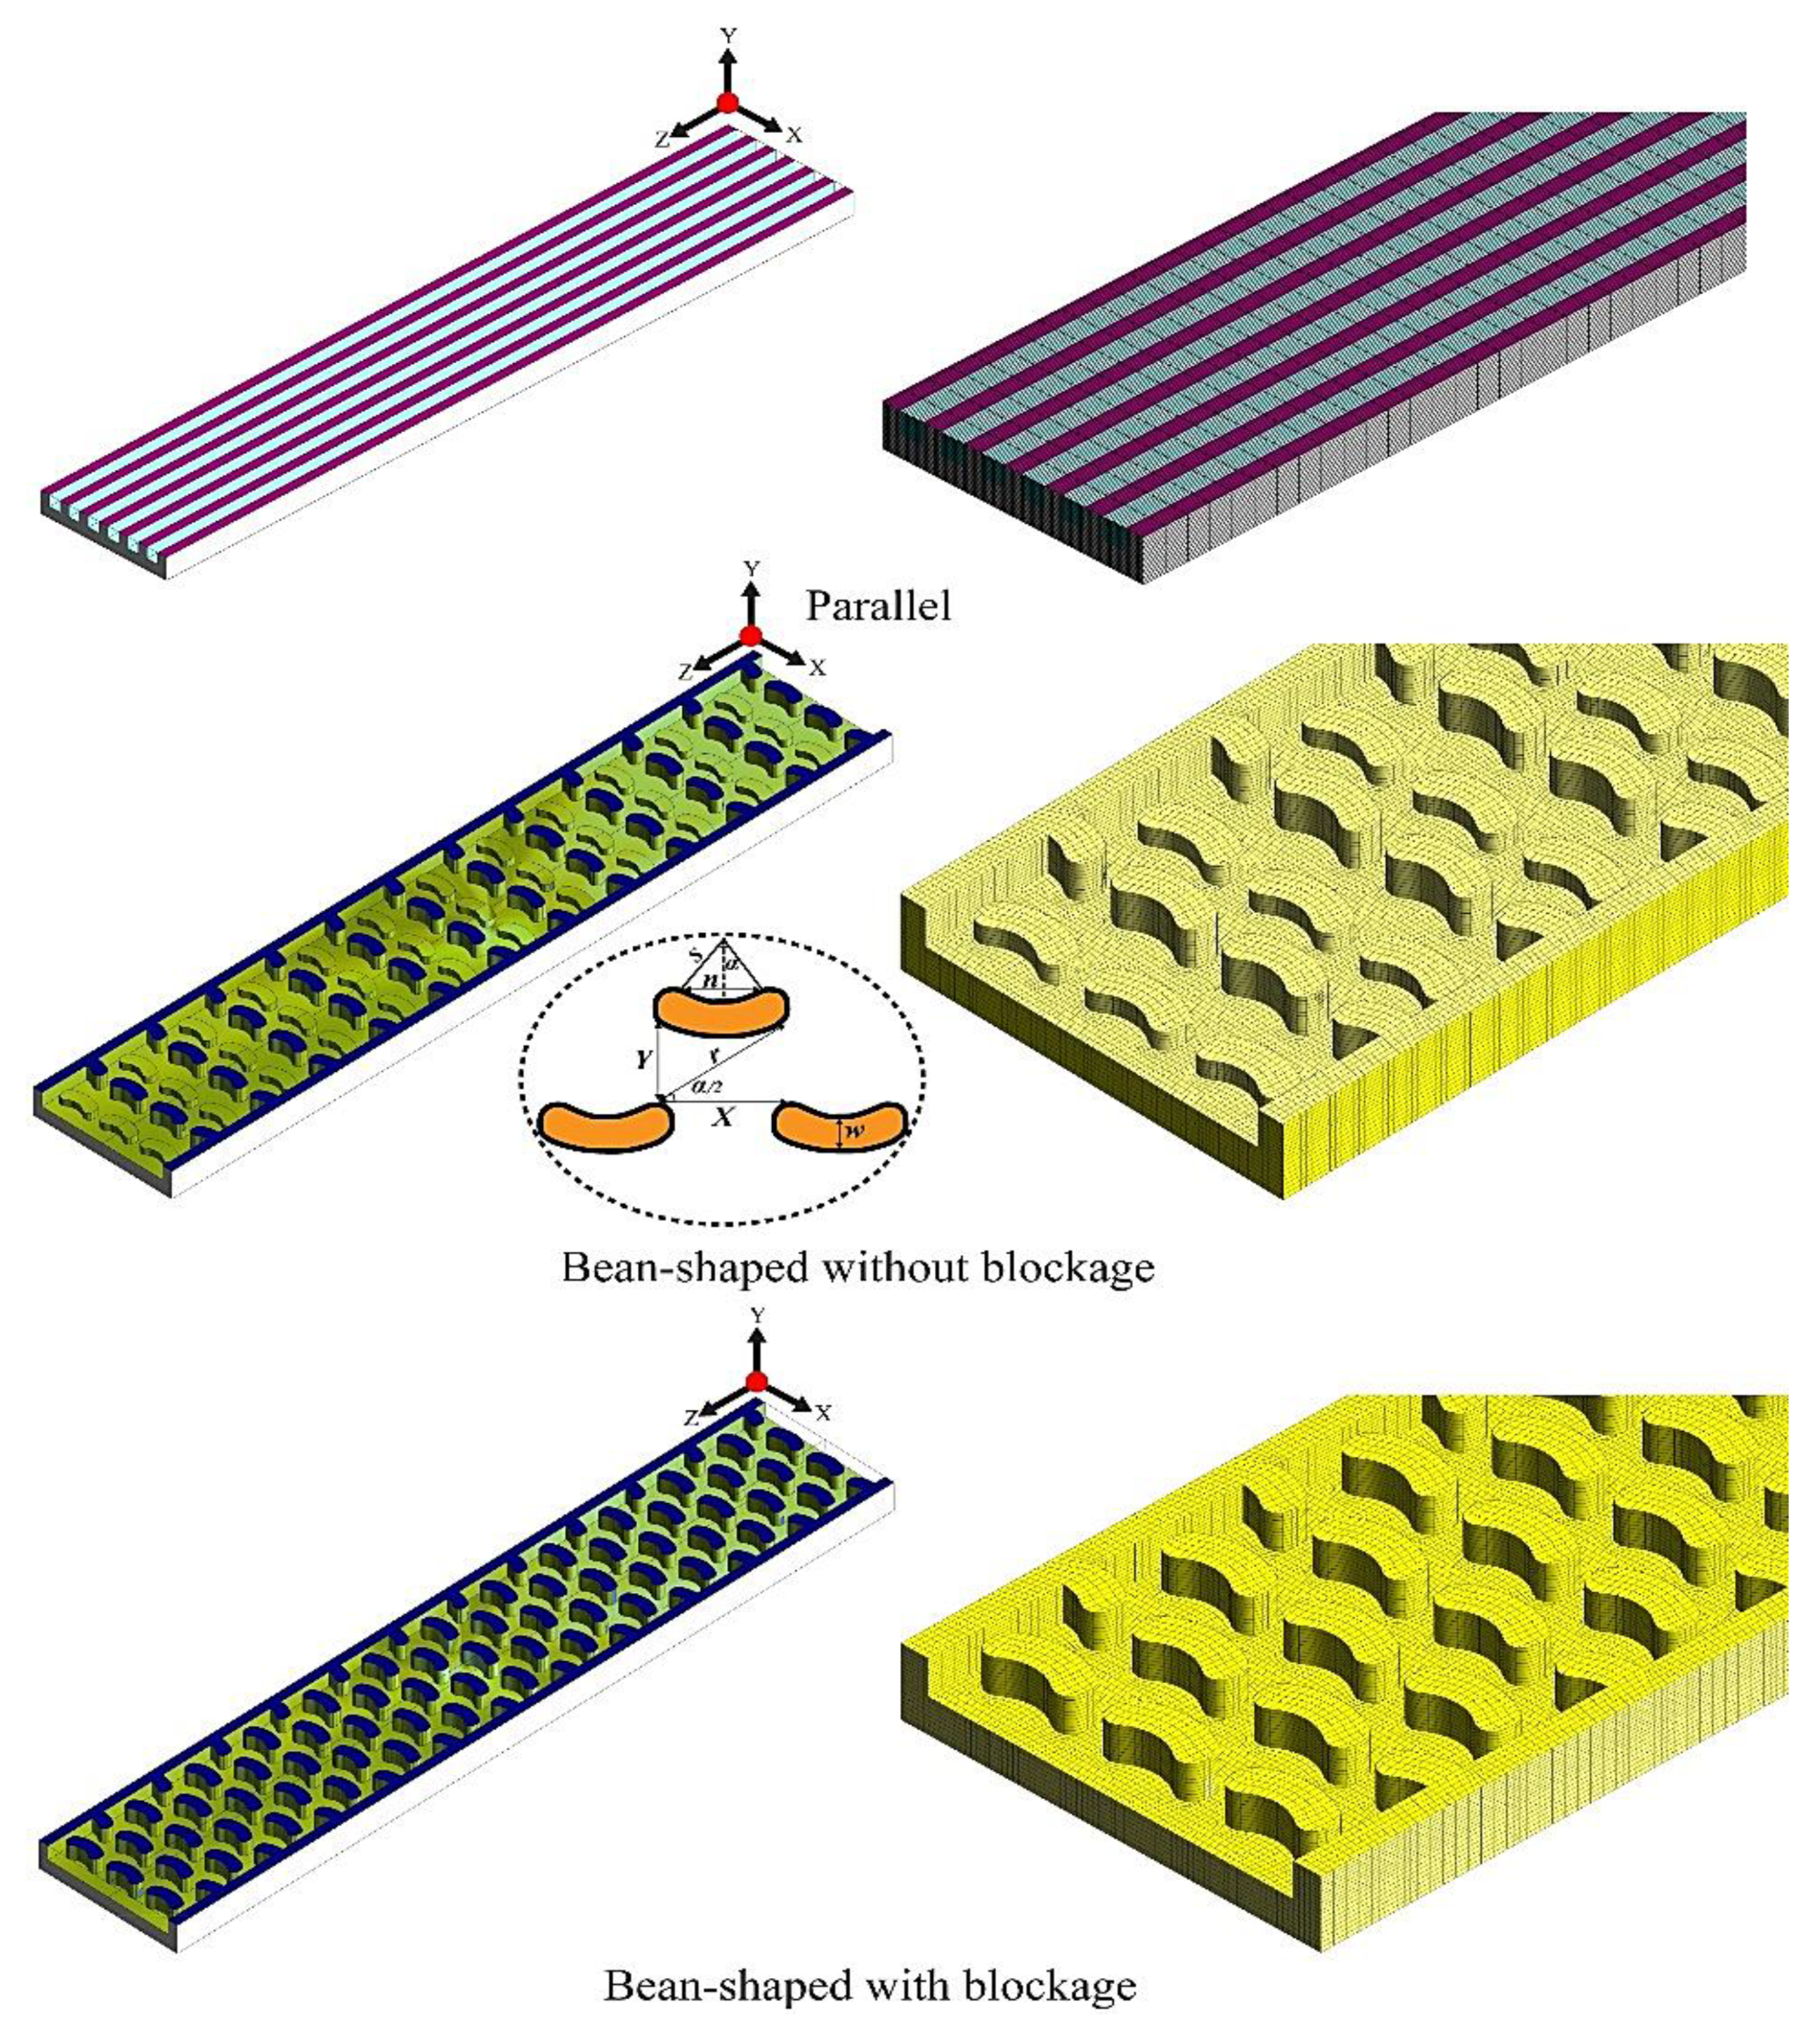
Figure 2 illustrates the geometry and computational cells of three flow patterns, including parallel, blocked bean-shaped, and unblocked bean-type. In the bean-shaped flow fields, pins are arranged in a consistent arrangement. This structure makes it possible to form parallel and spiral paths in the gas flow channels and achieve a more uniform flow distribution. In the bean-shaped flow field without blocking, the pins are placed, staggered, up to half of the channel height. However, in the blocked bean-shaped pattern, the height of pins and the channel is the same and pins are completely attached to the channel wall. This arrangement is employed for both cathode and anode sides. The geometrical features of flow patterns, along with physical and electrochemical properties, are presented in Table A2.
Optimal meshes have a substantial impact on reducing computational cost and accuracy of results. Meshes with a small computational cell number decrease the solution accuracy. Theoretically, an increase in the number of computational cells makes the solution of governing equations more accurate; however, an excessive rise in the number of cells increases the computational cost, and enters the truncation error in the computational domain. The number of elements in the GDLs, CLs, and membrane is considered more than other zones to improve computational accuracy because the electrochemical reactions occur in these regions. The numerical solution results perform after a grid-independent study on the PEMFC model. We used a personal computer with Intel(R) Core (TM) i7-6700 CPU @3.40 GHz 32 GB RAM to run the simulation. To make sure the results of the numerical modeling are independent of the computational grid size, about 593,920, 983,010, and 983,010 are considered for parallel, unblocked bean-shaped, blocked bean-type, respectively. The number of elements in different zones of the PEMFC is presented in Table A3.
4. Results and Discussion
To verify the numerical results of the PEMFC model, a polarization curve of a single-cell PEMFC is compared to experimental measurements of Mazumder et al. [36], as exhibited in Figure 3a. Identical operating and geometrical conditions are performed for comparison, which includes the operating temperature of 50 °C, the membrane thickness of 0.23 mm, the working pressure of 1 atm, the GDL thickness of 0.254 mm, and the active area of 1.08 cm2. As is evident from this figure, the numerical results are comparable to the experimental measurements in these conditions, which are in good agreement. The maximum observed deviation between our modeling and experimental data is less than 4%. Hereupon, the numerical modeling can be utilized for a better understanding of complex electrochemical phenomena in the PEMFC. We also performed another comparison between our modeling and numerical study of Heidary et al. [15]. In this comparison, we simulated PEMFC with a pin flow field and reached a good agreement between the two models, as shown in Figure 3b.
It is essential to note that we select a voltage of 0.60 V as a corresponding point, which has a medium current density, and it is placed around the maximum power point of the PEMFC. Due to the higher diffusivity of hydrogen than air, the uniform reactant distribution at the cathode side is more critical than the anode side. Additionally, proper water management at the cathode side affects concentration drops and heat generation. Hence, the cathode side assessment is substantial for the appropriate design of the PEMFC, which will be discussed in the following.
Figure 4 exhibits the streamlines at the cathode channel for the mentioned flow fields. It is found that the bean-shaped model without blockage has a better uniform reactant distribution than the other two models. In the blockage model, the height of pins is the same as channel height, which prevents passing the flow through pins. This fact forces the stream to cross around pins as a spiral flow. So, the vortices formation occurs behind the bean barriers.
Figure 5 demonstrates the velocity contours of various flow fields at the cathode stoichiometry of 20 (ξcat = 20) and 30 (ξcat = 30). By raising the cathode stoichiometric ratio from 20 to 30, the maximum velocity within cathode channels increases from 10.6, 31.5, and 30 m s−1 to 15, 49.1, and 45.5 m s−1 for parallel, unblocked bean-type, and blocked bean-shaped models, respectively. The particular arrangement of pins in the bean-type model without blockage causes a further increase in the flow velocity. In this flow field, the maximum velocity is observed in areas between two pins which are located adjacent to each other. These regions operate like a nozzle, which accelerates velocity as the path becomes narrower. However, the lowest velocity is identified behind pins. The flow has a high inertia force in these regions, and this can contribute to water aggregation. Subsequently, oxygen accessibility and the electrochemical reaction rate decrease in these areas. Moreover, gas mixture density reduces along the channel length due to oxygen consumption and conversion into water vapor. Since the density of water vapor is less than oxygen, a higher velocity is observed at the end of the channel at a constant mass flow rate.
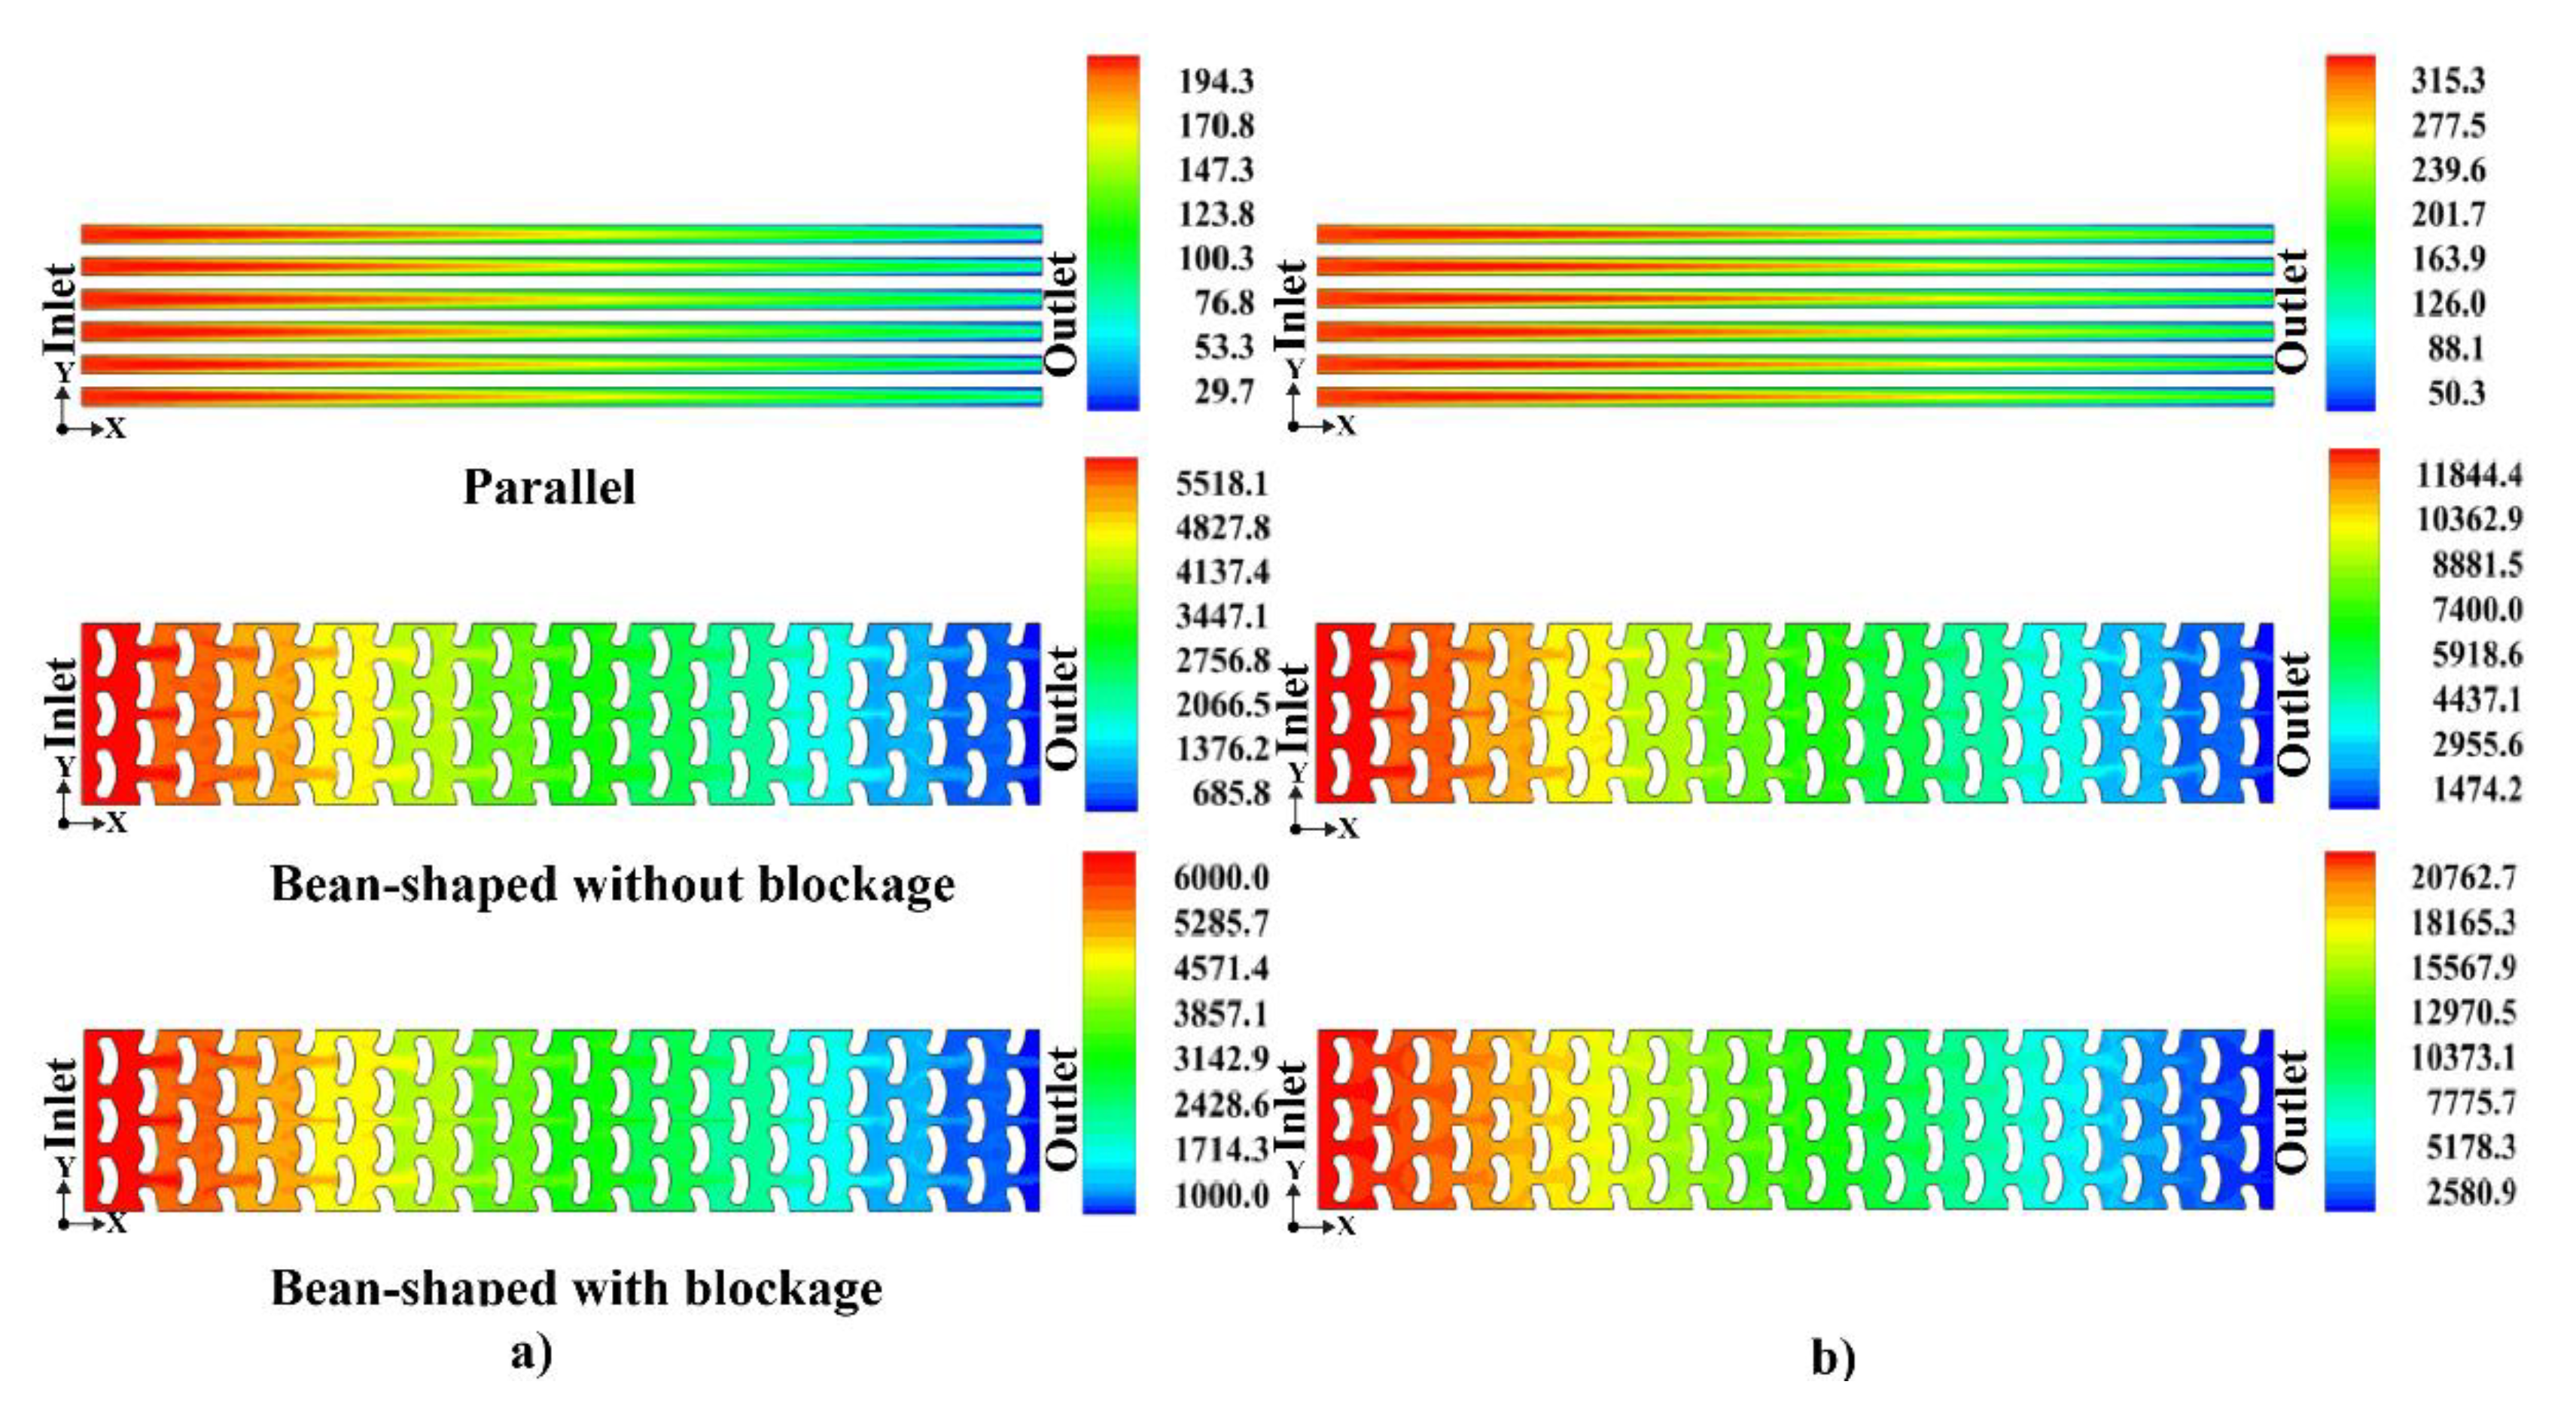
Figure 6 demonstrates the pressure contour of different flow fields along the cathode channel length for the stoichiometry of 20 and 30. The total pressure is the sum of two terms, i.e., dynamic pressure and static pressure. The static pressure term has a decreasing trend along the channel length because a part of the total energy of inlet gases is wasted to overcome losses, which arise from channel wall friction and the formation of small vortices behind the bean-shaped blockage. The gas mixture velocity along with the channel length increases, and gas mixture density decreases. Based on the Bernoulli equation, the dynamic pressure term increases along the channel length; however, the portion of static pressure is greater than the dynamic pressure. Thus, it can be concluded that the total pressure decreases along the channel length. The highest amount of pressure drop is observed for the blocked pin-type at the cathode stoichiometric of 30. Because vortices created behind pins act as flow passing through pins, this increases the pressure drop in these areas and has a negative effect on fuel cell power output. The maximum amount of pressure drop at the cathode stoichiometric 30 for parallel, unblocking pin-type, and blocking pin-shaped models is 315.3 Pa, 11,844.4 Pa, and 20,762.7 Pa, respectively. This indicates that the unblocking pin-shaped pressure drop is nearly half of the blocking bean-shaped flow field. Thus, this type of flow field has the potential to be used for PEMFC cooling with less pressure drop than the blocking-pin model at the stoichiometric of 30, but at a lower cathode stoichiometric (ξcat = 20), these two models do not differ significantly in terms of pressure drop.
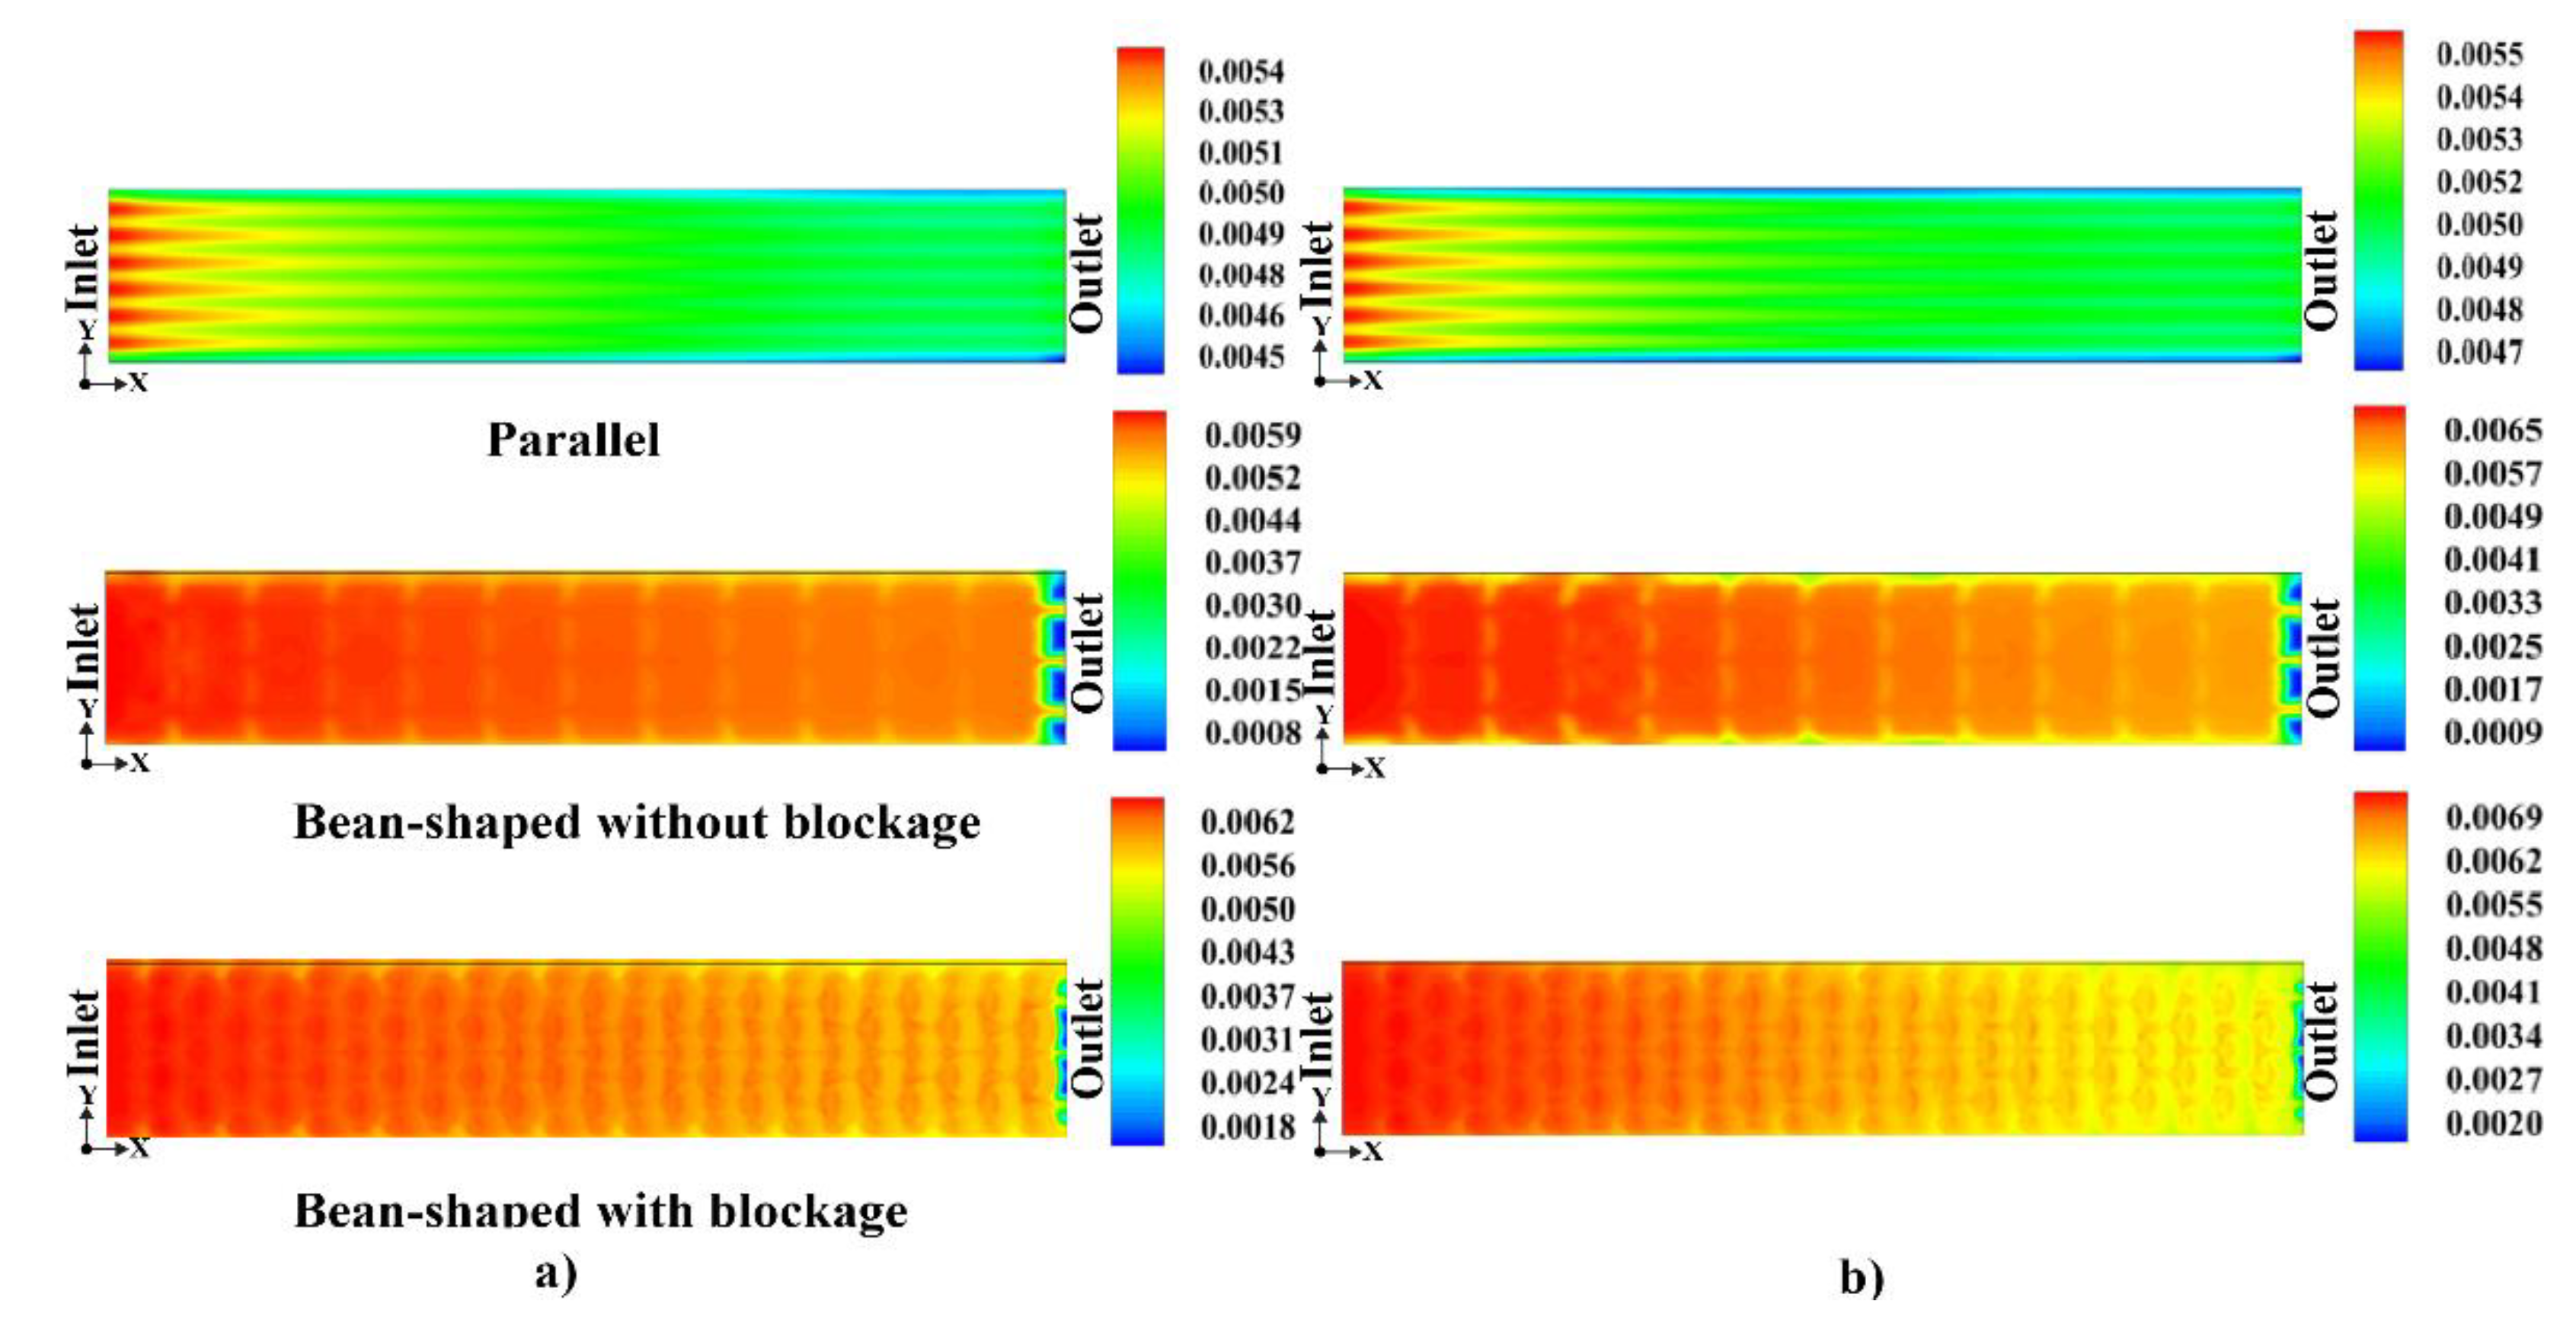
Figure 7 exhibits the distribution of oxygen concentration for the considered flow fields at the cathode GDL/CL interface. The comparison results show that bean-types have a higher oxygen concentration than the parallel flow channel due to more penetrating reactants into GDL. In bean-shaped flow channels, as air collides with pins, it deviates toward the GDL and diffuses into it. As a result, the reactants’ accessibility to the active surface area increases. The maximum oxygen diffusion into the cathode GDL at the cathode stoichiometric of 30 in the unblocking pin-type, blocking bean-type, and parallel models is 0.0065, 0.0069, and 0.0055, respectively. As oxygen availability within the CL increases, the electrochemical reaction rate and water production is raised, which leads to improving fuel cell performance. Oxygen concentration is high at the entrance of the cathode channel, and it gradually reduces along the channel length within electrochemical reactions due to oxygen consumption. In areas below the channel’s shoulder, less oxygen diffuses from the channel to the GDL due to more water accumulation. Since ribs are the interface of BP and GDL, the accumulation of water impedes the transmission of electrical current in these areas and reduces cell performance.
Figure 8 indicates water concentration distribution for the examined flow patterns at the cathode GDL/CL interface. The water concentration distribution has a similar trend to oxygen concentration; since oxygen is depleted along the channel length, water production decreases. The unblocking bean model has the highest amount of water production in comparison with other designs. In the stagnant areas of the PEMFC, both oxygen and water concentration are low, and the rate of electrochemical reactions decreases. In the parallel model, these areas can be observed at the side areas of the channel.
A fuel cell needs a cooling system when it operates at a low stoichiometric ratio. For a small-sized fuel cell, the cooling target can only be achieved by raising the cathode stoichiometry ratio without requiring the cooling loop. In this regard, the cathode stoichiometry of 20 and 30 are utilized in this study. Figure 9 shows a comparison between the considered flow fields in terms of the temperature distribution in the middle of the cathode channel depth. As can be seen, the temperature along the flow channel rises due to heat transfer mechanisms, Joule heating, and the irreversibility heat. Lower temperature views are seen in bean-shaped models than the parallel design. This is because the convection heat transfer coefficient raises as velocity increases, and the heat transfer in the pin vicinity improves. The highest temperature with the amount of 370 K is observed in the parallel flow field at the cathode stoichiometry of 20, which is above the desired temperature. According to the experimental work of Heras et al. [36], the optimum temperature of the fuel cell depends on the current, which can be calculated as below.
Based on Equation (40), the optimum temperature of PEMFC is 336 K at the current of 70 A. Among the examined flow fields, the optimal performance of air-cooled is related to the unblocking bean-type at the stoichiometric of 20. The hottest point in unblocking bean-type reaches 337 K at the stoichiometry of 20, which is close to the desired temperature of 336 K. It should be mentioned that all three models are almost similarly performing well in terms of thermal management at the cathode stoichiometry of 30.
The temperature distribution in the interface of GDL/CL on the cathode side is illustrated in Figure 10. As depicted in the figure, using bean-type models leads to more favorable cooling than the parallel design. Pins, which are half of the channel height in the unblocked bean-shape, play the role of the fin. In other words, pins that are up to the middle of the channel height and are not in contact with the GDL have a cooling role as air flows through them. This causes the conduction heat transfer to increase; consequently, the temperature further drops in these regions. Further, increasing velocity in pin-type models improves the PEMFC cooling due to the improvement of the heat convection mechanism.
Figure 11 displays the current density distribution at the interface of the cathode GDL/CL. Under rib areas in the parallel flow field and regions under bean-pins, the current density is lower than other regions because of the water accumulation under ribs and contact resistance between BP and GDL interface. Ribs are the interface of BP and GDL, and the electrical current flows in these places. The more accumulated water under rib areas, the harder transferring the electrical current becomes. A high amount of current density is observed for the margins of the cell due to the lake of the accumulated water in these areas. It can be inferred that the distribution of current density in the parallel model is more influenced by concentration losses, which arise from insufficient access of reactant to the reaction surface. The current density decreases in the middle of the unblocking bean-type due to the lack of direct contact of pins with the GDL. As depicted in Figure 11, the maximum current density of blockage and non-blockage pin-design at the cathode stoichiometry of 20 are 5.9 A cm−2 and 4 A cm−2, respectively. Although the rate of electrochemical reaction and the extraction of the current density increases at a higher stoichiometry ratio, increasing the cathode stoichiometry ratio of more than 20 doses not affect the electrochemical reaction rate. A higher cathode stoichiometric ratio than 20 can only facilitate fuel cell cooling, as illustrated in Figure 9.
Figure 12 illustrates the polarization curves of three considered flow fields at the cathode stoichiometric ratios of 20 and 30. As can be seen, the worst performance is attained in the blocking pin-shaped model due to lower output power in comparison to other flow fields. There is not much difference between the bean-shaped design without blocking and parallel model under medium current densities. The unblocked bean-type design shows a better performance than parallel channels at high current densities where the concentration losses are the main reason for the voltage drop. This better performance can be attributed to the better mass transfer phenomena and the distribution of the proper reactants on the catalyst surface. The influence of oxygen consumption is more pronounced at high current densities because oxygen demand is high in this range; hence, the curves for considered models are significantly different at high current densities. Oxygen depletion before reaching to entire catalyst surface is the reason for limiting the current density at the blocking bean-shaped. The current density at the voltage of 0.6 V and cathode stoichiometric of 20 is 0.913 A cm−2, 0.974 A cm−2, and 0.683 A cm−2, for parallel, unblocking, and blocking pin-type models, respectively. The fuel cell performance improves at a higher stoichiometry because of more oxygen access to the reaction surface, which results in raising the electrochemical reaction rate and generating more current. However, at a higher stoichiometric ratio (more than 20), there is no noticeable difference in system performance. The current density of parallel, unblocking, and blocking pin-type patterns is 0.940 A cm−2, 0.998 A cm−2, and 0.693 A cm−2, respectively, at the voltage of 0.6 V and cathode stoichiometric of 30.
Figure 13 indicates the power density curve for three flow fields. The highest power density for the blocking, unblocking bean-types, and parallel design are 0.564 W cm−2, 0.599 W cm−2, and 0.416 W cm−2 at the operating voltage of 0.6 and cathode stoichiometric of 30. By increasing the cathode stoichiometry from 20 to 30, the maximum power density increases by almost 2.91%, 2.56%, and 1.46% for parallel, unblocking pin-type, and blocking pin-shaped models, respectively.
Previous research has shown that less than 3 kW power is needed for UAV applications, which can be supplied using a PEMFC stack [37]. Recently, UK-based Intelligent Energy launched a UAV powered by a 2.4 kW fuel cell stack. They mentioned that more flight time (2 h, i.e., more than five times) was achieved using fuel cells over batteries (25 min). The company utilized a 2.4 kW fuel cell stack for the UAV with 11 L hydrogen, which was stored in the high-pressure hydrogen tank [37]. In the present study, the target is providing the power of 2.5 kW for a UAV using the PEMFC stack. Based on the presented numerical results, the mass and volume characteristics of a single fuel cell for different flow fields are shown in Table 1.
Asghari et al. [38] reported that the optimum endplate thickness of the PEMFC stack with an output power of 5 kW is 35 mm. The mass and volume of endplates were achieved at 1.89 kg and 0.7 L, respectively, based on the active area of 100 cm2 and using aluminum as the endplate’s material. We use the properties of mentioned endplates in the fuel cell stack design. Given that the active area in numerical modeling is considered small due to computational constraints and is different from their examined active area, we get larger the scale of the PEMFC stack for the design of the PEMFC stack. Accordingly, the characteristics of the PEMFC stack, including the number of cells, volume, mass, and parasitic power consumption due to pressure drop in cathode channels, are stated in Table 2. It is worth noting that the maximum output power is obtained around an operating voltage of 0.60 V. The unblocking bean-type generates more power than other models and needs fewer cells number for producing an output power of 2.5 kW. The number of required cells to generate the net power of 2.5 kW for the parallel, unblocking, and blocking pin-shaped models is 60, 55, and 80, respectively. Therefore, unblocking bean-shaped has a significant influence on the reduction of PEMFC weight and volume. The power consumption to overcome the pressure drop along the cathode gas channel is calculated by the following equation:
The power consumption of regenerative compressor for providing the required air and dominating pressure drop within cathode channels is 0.84 W, 29.8 W, and 69.9 W for parallel, unblocking bean-shaped, blocking bean-shaped, respectively. The PEMFC stack operating voltages for parallel, unblocking, and blocking pin models are 36 V, 33 V, and 48 V, respectively. Based on the operating voltage (33–48 V) of the fuel cell stack for different flow fields and pressure drop along the cathode channels, we select a spark-free regenerative compressor (VRB8-25) from VAIREX company with a proper pressure ratio to supply the required air [39]. This regenerative compressor has a weight of 2 kg, and its operating voltage is in the range of 24–48 V, which is within the operating voltage range of the fuel cell, and we do not need to use a converter [39].
Figure 14 represents a comparison between three flow fields in terms of mass and volume power density. The maximum amount of volume power density, i.e., 1.1 kW L−1, is related to the bean-shaped without blocking, and the minimum amount of power density is allocated to bean-type with blocking. In terms of mass power density, the maximum value of 0.2 kW kg−1 corresponds to the unblocked bean flow field.
In summary, it can be concluded that the PEMFC stack with the unblocked bean-type has the best performance in terms of temperature distribution and mass power density. This novel flow pattern is suggested for aerial applications that aim to reduce weight and attain optimal heat management.
5. Conclusions
Energy density is the critical factor affecting the endurance of UAVs’ flight time. Currently, lithium-ion batteries are used as an energy source for UAVs and have a small energy density, which causes short flight times. It is necessary to increase the flight time of UAVs using alternative power sources such as fuel cells. In recent years, PEMFCs have been considered, and they have the potential to be used as a power source of UAVs, but there should be improvements in their power density. The weight and volume of the fuel cell stack can be significantly reduced by improving the configuration and the embedded flow field within BPs. As such, the proper design of PEMFC flow fields contributes substantially to increasing power density and UAV flight times. In this regard, a comprehensive study is carried out on the three flow fields, i.e., parallel, bean-shaped without blocking, and bean-shaped with blocking, for aerial applications in terms of mass and volume power density. Another goal of this study was to examine the cooling performance of the considered flow fields to maintain optimum operating temperature during PEMFC operation. The key findings of this paper are summarized below:
- The specific arrangement of pins in the unblocking bean-type allows flow velocity to increase further. The highest velocity is found in this flow field in areas between two pins, where they act as a nozzle and increase velocity as the path becomes narrow.
- For blockage pin-type, the highest amount of pressure drop is observed for a cathode stoichiometric of 30 and is nearly 20,762.7 Pa due to creating vortices behind pins. However, there is not a notable difference between bean-type models in terms of pressure drop in a lower cathode stoichiometric (ξcat = 20).
- In pin-type models, oxygen penetration into the GDL is more than a parallel design due to the specific arrangement of pins. When air collides with beans, it diverts and diffuses to the GDL. This increases the accessibility of the reactants to the active surface area.
- In bean-shaped models, a slight difference in temperature is seen in the space between two pins because the coefficient of convection heat transfer raises as velocity increases in these areas, which can facilitate heat management.
- Pins that are placed until the middle of the channel’s depth play the role of a fin in the unblocked bean-shape. This leads to enhancing heat conduction and improving the PEMFC cooling using a further drop in temperature. The hottest point in the bean-shape without blocking in the stoichiometry of 20 is 337.9 K, which is close to the optimal temperature of 336 K. With increasing stoichiometry from 20 to 30, the maximum temperature for parallel, unblocking, and blocking pin-type models reduce from 370, 337.9, and 341.6 to 344.6, 331.5, and 332.3, respectively. By using an unblocked bean-shape in a stoichiometry of 20, we achieve optimal cooling and do not need to increase cathode stoichiometry for the cooling target. For other flow fields, we need to increase the cathode stoichiometry to reach the desired temperature.
- The current density distribution becomes more uniform as the cathode stoichiometry increases. That causes the electrochemical reaction rate and the electrical current density to increase. As the reactant diffuses into active surface areas, and the electrochemical reaction occurs, the current density reduces along the active surface area due to oxygen consumption. Nonetheless, there is no considerable difference in system performance at a higher stoichiometric ratio (more than 20).
- The highest amount of power density is achieved in the bean-type without blockage at a specific voltage of 0.60, which is about 6.2% and 43.9% higher than the parallel and blocking bean-type, respectively. Therefore, the unblocked bean-shape produces more power for a given active area and requires fewer cells to generate power. For the parallel, blocking, and unblocking pin models, the number of needed cells to generate net power of 2.5 kW is 60, 80, and 55, respectively.
- Among different investigated flow fields, the bean-shape without blockage is an ideal flow field in the PEMFC for aerial applications with the maximum amount of volume power density, i.e.,1.1 kW L−1, and maximum mass power density of 0.2 kW kg−1. The Mass of the 2.5 kW PEMFC stack is equal to 13.8, 17.5, and 12.5 with parallel, blocking, and unblocking pin-type models, respectively.
Author Contributions
S.T. and S.A.A. are responsible for the simulation of the fuel cell. S.T. and S.A.A. discussed the results and S.T. wrote the whole manuscript. X.G. supervised the project. All authors have read and agreed to the published version of the manuscript.
Funding
This research was funded by the Deutsche Forschungsgemeinschaft (DFG, German Research Foundation) under Germany’s Excellence Strategy-EXC 2163/1- Sustainable and Energy Efficient Aviation-Project-ID 390881007.
Data Availability Statement
The data that support the findings of this study are available on request from the corresponding author, [initials]. The data that support the findings of this study are available on request from the corresponding author, Xin Gao.
Acknowledgments
We would like to acknowledge the funding by the Deutsche Forschungsgemeinschaft (DFG, German Research Foundation) under Germany’s Excellence Strategy-EXC 2163/1-Sustainable and Energy Efficient Aviation-Project-ID 390881007.
Conflicts of Interest
The authors declare no conflict of interest.
Appendix A

Table A1.
Considered boundary condition in the numerical modeling of PEMFC.
| Parameter | Value |
|---|---|
| Anode stoichiometry/Cathode stoichiometry | 1.1/20 and 30 |
| Mole fraction of , | 1/0.073/0.17 |
| Cathode relative humidity, % [40,41,42,43] | 100 |
| Anode relative humidity, % [43] | 0 |
| Working pressure, P, atm | 1 |
| Working temperature, T, K | 313.2 |
Table A2.
Dimensions and physical features of the PEMFC.
| Parameter | Parallel | Bean-Shaped without Blockage | Bean-Shaped with Blockage | |
|---|---|---|---|---|
| Length, mm | 63.4 | 63.4 | 63.4 | |
| The thickness of BPs, mm | 1 | 1 | 1 | |
| The thickness of GDLs, CLs, mm [44] | 0.2, 0.015 | 0.2, 0.015 | 0.2, 0.015 | |
| The thickness of the membrane, mm [45] | 0.0508 | 0.0508 | 0.0508 | |
| Bean-shaped pins | X, mm | - | 1.21 | 1.21 |
| Y, mm | - | 1.58 | 1.58 | |
| r, mm | - | 2 | 2 | |
| n, mm | - | 1.21 | 1.21 | |
| s, mm | - | 1 | 1 | |
| w, mm | - | 0.5 | 0.5 | |
| α, ° | - | 37.5° | 37.5° | |
| Physical and Operating Conditions | ||||
| , A m−2 | 1.0 × 10⁴ | |||
| , A m−2 [35] | 4700 | |||
| , A m−2 [16] | 6.0 | |||
| , kmol m−3 [16] | 0.0564 | |||
| , kmol m−3 [35] | 3.39 × 10⁻³ | |||
| [35] | 0.5 | |||
| [16] | 1.0 | |||
| [46] | 0.5 | |||
| [46] | 0.5 | |||
| , m2 s−1 [47] | 11 × 10−5 | |||
| , m2 s−1 [47] | 3.2 × 10⁻⁵ | |||
| , m2 s−1 [47] | 7.35 × 10⁻⁵ | |||
| [47] | 2.5 | |||
| Pore blockage for transfer current, r [47] | 2.5 | |||
| s−1 [16] | 100 | |||
| The density of BPs, GDLs, CLs, membrane, kg.m−3 | 8000, 383, 4397.5, 1970 | |||
| Specific heat at a constant pressure of BPs, GDLs, CLs, membrane, J kg−1K−1 | 530, 568, 710, 1650 | |||
| Thermal conductivity of BPs, GDLs, CLs, membrane, W m−1K−1 | 17, 0.5, 8, 0.95 | |||
| The electrical conductivity of BPs, GDLs, CLs, membrane, Ohm−1m−1 [16] | 120, 1000, 1000, 1 × 10⁻¹⁶ | |||
| Membrane equivalent weight, kg kmol−1 | 1100 | |||
| of CLs, m−1 [47] | 1.9 × 10¹⁰ | |||
| The porosity of GDLs, CLs, membrane [47] | 0.8, 0.7, 0.5 | |||
| The viscous resistance of GDLs, CLs, membrane, m−1 [47] | 1.43 × 10¹⁰, 9.8 × 10¹¹, 2.11 × 10⁸ | |||
| [48] | ||||
| , MPa [35] | 4.5 | |||
| , cm2, parallel, without blockage, with blockage | 7.35, 7.758, 7.758 | |||
| , cm2, parallel, without blockage, with blockage | 3.82, 1.085, 1.621 | |||
Table A3.
The elements number for various PEMFC regions.
| Zone | Parallel | Unblocked Bean-Shaped | Blocked Bean-Type |
|---|---|---|---|
| Cathode current collector | 110,080 | 146,574 | 152,334 |
| Anode current collector | 110,080 | 152,334 | 152,334 |
| Cathode channel | 38,400 | 106,200 | 100,440 |
| Anode channel | 38,400 | 100,440 | 100,440 |
| GDLs | 74,240 | 112,344 | 112,344 |
| CLs | 37,120 | 84,258 | 84,258 |
| Membrane | 74,240 | 84,258 | 84,258 |
| All | 593,920 | 983,010 | 983,010 |
References
- Okonkwo, P.; Smith, H. Review of evolving trends in blended wing body aircraft design. Prog. Aerosp. Sci. 2016, 82, 1–23. [Google Scholar] [CrossRef]
- Boukoberine, M.N.; Zhou, Z.; Benbouzid, M. A critical review on unmanned aerial vehicles power supply and energy management: Solutions, strategies, and prospects. Appl. Energy 2019, 255, 113823. [Google Scholar] [CrossRef]
- Moffitt, B.A.; Bradley, T.H.; Parekh, D.E.; Mavris, D. Design and performance validation of a fuel cell unmanned aerial vehicle. In Proceedings of the 44th AIAA Aerospace Sciences Meeting and Exhibit, Reno, NV, USA, 9–12 January 2006; Volume 13, pp. 9877–9896. [Google Scholar] [CrossRef] [Green Version]
- Pei, P.; Chen, H. Main factors affecting the lifetime of Proton Exchange Membrane fuel cells in vehicle applications: A review. Appl. Energy 2014, 125, 60–75. [Google Scholar] [CrossRef]
- González-Espasandín, Ó.; Leo, T.J.; Navarro-Arévalo, E. Fuel cells: A real option for unmanned aerial vehicles propulsion. Sci. World J. 2014, 2014, 497642. [Google Scholar] [CrossRef] [PubMed] [Green Version]
- Howe, K.S. Design Improvements of Micro-Tubular Solid Oxide Fuel Cells for Unmanned Aircraft Applications. Ph.D. Thesis, University of Birmingham, Birmingham, UK, 2013. [Google Scholar]
- Lapeña-Rey, N.; Mosquera, J.; Bataller, E.; Ortí, F. First fuel-cell manned aircraft. J. Aircr. 2010, 47, 1825–1835. [Google Scholar] [CrossRef]
- Zhu, L.; Wang, S.; Sui, P.-C.; Gao, X. Multiscale modeling of an angled gas diffusion layer for polymer electrolyte membrane fuel cells: Performance enhancing for aviation applications. Int. J. Hydrog. Energy 2021, 1–13. [Google Scholar]
- Dudek, M.; Tomczyk, P.; Wygonik, P.; Korkosz, M.; Bogusz, P.; Lis, B. Hybrid fuel cell-battery system as a main power unit for small Unmanned Aerial Vehicles (UAV). Int. J. Electrochem. Sci. 2013, 8, 8442–8463. [Google Scholar]
- Sasmito, A.P.; Birgersson, E.; Mujumdar, A.S. Numerical evaluation of various thermal management strategies for polymer electrolyte fuel cell stacks. Int. J. Hydrog. Energy 2011, 36, 12991–13007. [Google Scholar] [CrossRef]
- Mohammad, A.; Asiri, A.M. Organic-Inorganic Composite Polymer Electrolyte Membranes: Preparation, Properties, and Fuel Cell Applications; Springer: Berlin/Heidelberg, Germany, 2017; ISBN 3319527398. [Google Scholar] [CrossRef]
- Neto, D.M.; Oliveira, M.C.; Alves, J.L.; Menezes, L.F. Numerical study on the formability of metallic bipolar plates for proton exchange membrane (PEM) fuel cells. Metals 2019, 9, 810. [Google Scholar] [CrossRef] [Green Version]
- Awin, Y.; Dukhan, N. Experimental performance assessment of metal-foam flow fields for proton exchange membrane fuel cells. Appl. Energy 2019, 252, 113458. [Google Scholar] [CrossRef]
- Dabiri, S.; Hashemi, M.; Rahimi, M.; Bahiraei, M.; Khodabandeh, E. Design of an innovative distributor to improve flow uniformity using cylindrical obstacles in header of a fuel cell. Energy 2018, 152, 719–731. [Google Scholar] [CrossRef]
- Heidary, H.; Kermani, M.J.; Prasad, A.K.; Advani, S.G.; Dabir, B. Numerical modelling of in-line and staggered blockages in parallel flowfield channels of PEM fuel cells. Int. J. Hydrog. Energy 2017, 42, 2265–2277. [Google Scholar] [CrossRef]
- Atyabi, S.A.; Afshari, E. Three-dimensional multiphase model of proton exchange membrane fuel cell with Honeycomb flow field at the cathode side. J. Clean. Prod. 2019, 214, 738–748. [Google Scholar] [CrossRef]
- Lee, J.; Gundu, M.H.; Lee, N.; Lim, K.; Lee, S.W.; Jang, S.S.; Kim, J.Y.; Ju, H. Innovative cathode flow-field design for passive air-cooled polymer electrolyte membrane (PEM) fuel cell stacks. Int. J. Hydrog. Energy 2019, 45, 11704–11713. [Google Scholar] [CrossRef]
- Ying, W.; Ke, J.; Lee, W.-Y.; Yang, T.-H.; Kim, C.-S. Effects of cathode channel configurations on the performance of an air-breathing PEMFC. Int. J. Hydrog. Energy 2005, 30, 1351–1361. [Google Scholar] [CrossRef]
- Matian, M.; Marquis, A.; Brandon, N. Model based design and test of cooling plates for an air-cooled polymer electrolyte fuel cell stack. Int. J. Hydrog. Energy 2011, 36, 6051–6066. [Google Scholar] [CrossRef]
- Kim, T.; Kwon, S. Design and development of a fuel cell-powered small unmanned aircraft. Int. J. Hydrog. Energy 2012, 37, 615–622. [Google Scholar] [CrossRef]
- Lapeña-Rey, N.; Blanco, J.A.; Ferreyra, E.; Lemus, J.L.; Pereira, S.; Serrot, E. A fuel cell powered unmanned aerial vehicle for low altitude surveillance missions. Int. J. Hydrog. Energy 2017, 42, 6926–6940. [Google Scholar] [CrossRef]
- Herwerth, C.; Chiang, C.; Ko, A.; Matsuyama, S.; Choi, S.B.; Mirmirani, M.; Gamble, D.; Paul, R.; Sanchez, V.; Arena, A.; et al. Development of a small long endurance hybrid PEM fuel cell powered UAV. SAE Tech. Pap. 2007. [Google Scholar] [CrossRef]
- Movahedi, M.; Ramiar, A.; Ranjber, A.A. 3D numerical investigation of clamping pressure effect on the performance of proton exchange membrane fuel cell with interdigitated flow field. Energy 2018, 142, 617–632. [Google Scholar] [CrossRef]
- Yin, C.; Gao, Y.; Li, T.; Xie, G.; Li, K.; Tang, H. Study of internal multi-parameter distributions of proton exchange membrane fuel cell with segmented cell device and coupled three-dimensional model. Renew. Energy 2020, 147, 650–662. [Google Scholar] [CrossRef]
- Yan, X.; Lin, C.; Zheng, Z.; Chen, J.; Wei, G.; Zhang, J. Effect of clamping pressure on liquid-cooled PEMFC stack performance considering inhomogeneous gas diffusion layer compression. Appl. Energy 2019, 15, 114073. [Google Scholar] [CrossRef]
- Atyabi, S.A.; Afshari, E. A numerical multiphase CFD simulation for PEMFC with parallel sinusoidal flow fields. J. Therm. Anal. Calorim. 2019, 135, 1823–1833. [Google Scholar] [CrossRef]
- Lim, B.H.; Majlan, E.H.; Daud, W.R.W.; Rosli, M.I.; Husaini, T. Three-dimensional study of stack on the performance of the proton exchange membrane fuel cell. Energy 2019, 169, 338–343. [Google Scholar] [CrossRef]
- Satjaritanun, P.; Hirano, S.; Zenyuk, I.V.; Shimpalee, S. Numerical Study of Electrochemical Kinetics and Mass Transport inside Nano-Structural Catalyst Layer of PEMFC Using Lattice Boltzmann Agglomeration Method. J. Electrochem. Soc. 2020, 167, 013516. [Google Scholar] [CrossRef]
- Afshari, E.; Mosharaf-Dehkordi, M.; Rajabian, H. An investigation of the PEM fuel cells performance with partially restricted cathode flow channels and metal foam as a flow distributor. Energy 2017, 118, 705–715. [Google Scholar] [CrossRef]
- Abdollahzadeh, M.; Ribeirinha, P.; Boaventura, M.; Mendes, A. Three-dimensional modeling of PEMFC with contaminated anode fuel. Energy 2018, 152, 939–959. [Google Scholar] [CrossRef]
- Shen, J.; Tu, Z.; Chan, S.H. Performance enhancement in a proton exchange membrane fuel cell with a novel 3D flow field. Appl. Therm. Eng. 2020, 164, 114464. [Google Scholar] [CrossRef]
- Hosseini, M.; Afrouzi, H.H.; Arasteh, H.; Toghraie, D. Energy analysis of a proton exchange membrane fuel cell (PEMFC) with an open-ended anode using agglomerate model: A CFD study. Energy 2019, 188, 116090. [Google Scholar] [CrossRef]
- Perng, S.W.; Wu, H.W.; Shih, G.J. Effect of prominent gas diffusion layer (GDL) on non-isothermal transport characteristics and cell performance of a proton exchange membrane fuel cell (PEMFC). Energy 2015, 88, 126–138. [Google Scholar] [CrossRef]
- Wang, B.; Wu, K.; Xi, F.; Xuan, J.; Xie, X.; Wang, X.; Jiao, K. Numerical analysis of operating conditions effects on PEMFC with anode recirculation. Energy 2019, 173, 844–856. [Google Scholar] [CrossRef]
- Atyabi, S.A.; Afshari, E.; Wongwises, S.; Yan, W.M.; Hadjadj, A.; Shadloo, M.S. Effects of assembly pressure on PEM fuel cell performance by taking into accounts electrical and thermal contact resistances. Energy 2019, 179, 490–501. [Google Scholar] [CrossRef]
- Mazumder, S.; Cole, J.V. Rigorous 3-D Mathematical Modeling of PEM Fuel Cells. J. Electrochem. Soc. 2003, 150, A1510. [Google Scholar] [CrossRef]
- Ballard turnkey fuel cell solutions to power commercial UAVs. Fuel Cells Bull. 2020, 2019, 6.
- Asghari, S.; Shahsamandi, M.H.; Ashraf Khorasani, M.R. Design and manufacturing of end plates of a 5 kW PEM fuel cell. Int. J. Hydrog. Energy 2010, 35, 9291–9297. [Google Scholar] [CrossRef]
- VAIREX Air Systems—Cathode Air Supply for Fuel Cells. Available online: https://www.vairex.com (accessed on 27 April 2021).
- Barelli, L.; Bidini, G.; Gallorini, F.; Ottaviano, A. Analysis of the operating conditions influence on PEM fuel cell performances by means of a novel semi-empirical model. Int. J. Hydrog. Energy 2011, 36, 10434–10442. [Google Scholar] [CrossRef]
- Jeon, D.H.; Kim, K.N.; Baek, S.M.; Nam, J.H. The effect of relative humidity of the cathode on the performance and the uniformity of PEM fuel cells. Int. J. Hydrog. Energy 2011, 36, 12499–12511. [Google Scholar] [CrossRef]
- Yin, Y.; Wang, X.; Shangguan, X.; Zhang, J.; Qin, Y. Numerical investigation on the characteristics of mass transport and performance of PEMFC with baffle plates installed in the flow channel. Int. J. Hydrog. Energy 2018, 43, 8048–8062. [Google Scholar] [CrossRef]
- Jannelli, E.; Minutillo, M.; Perna, A. Experimental characterization and numerical modeling of PEMFC stacks designed for different application fields. Fuel Cells 2011, 11, 838–849. [Google Scholar] [CrossRef]
- Toghyani, S.; Moradi Nafchi, F.; Afshari, E.; Hasanpour, K.; Baniasadi, E.; Atyabi, S.A. Thermal and electrochemical performance analysis of a proton exchange membrane fuel cell under assembly pressure on gas diffusion layer. Int. J. Hydrog. Energy 2018, 43, 4534–4545. [Google Scholar] [CrossRef]
- Fan, L.; Niu, Z.; Zhang, G.; Jiao, K. Optimization design of the cathode flow channel for proton exchange membrane fuel cells. Energy Convers. Manag. 2018, 171, 1813–1821. [Google Scholar] [CrossRef]
- Chippar, P.; Ju, H. Numerical modeling and investigation of gas crossover effects in high temperature proton exchange membrane (PEM) fuel cells. Int. J. Hydrog. Energy 2013, 38, 7704–7714. [Google Scholar] [CrossRef]
- Morin, A.; Xu, F.; Gebel, G.; Diat, O. Influence of PEMFC gas flow configuration on performance and water distribution studied by SANS: Evidence of the effect of gravity. Int. J. Hydrog. Energy 2011, 36, 3096–3109. [Google Scholar] [CrossRef]
- Chen, L.; He, Y.-L.; Tao, W.-Q. Effects of surface microstructures of gas diffusion layer on water droplet dynamic behaviors in a micro gas channel of proton exchange membrane fuel cells. Int. J. Heat Mass Transf. 2013, 60, 252–262. [Google Scholar] [CrossRef]
Figure 1.
Schematic view of the air-cooled PEMFC in a UAV application.

Figure 2.
Geometry and mesh for the examined flow fields.

Figure 3.
(a)Verifying of the numerical modeling with (a) experimental measurement of Mazumder et al. [35] and (b) numerical data of Heidary et al. [14] in terms of the polarization curve.

Figure 4.
Streamlines of the examined flow fields at the cathode flow channel.

Figure 5.
Velocity (m s−1) distribution for various flow patterns in the cathode channel (a) ξcat = 20, (b) ξcat = 30.
Figure 5.
Velocity (m s−1) distribution for various flow patterns in the cathode channel (a) ξcat = 20, (b) ξcat = 30.

Figure 6.
Pressure contour (Pa) for different flow patterns along the cathode flow channel (a) ξcat = 20, (b) ξcat = 30.
Figure 6.
Pressure contour (Pa) for different flow patterns along the cathode flow channel (a) ξcat = 20, (b) ξcat = 30.

Figure 7.
Oxygen concentration (mol l−3) distribution for three flow patterns at the cathode GDL/CL interface (a) ξcat = 20, (b) ξcat = 30.
Figure 7.
Oxygen concentration (mol l−3) distribution for three flow patterns at the cathode GDL/CL interface (a) ξcat = 20, (b) ξcat = 30.

Figure 8.
Water concentration (mol l−3) distribution for three flow patterns at the cathode GDL/CL interface (a) ξcat = 20, (b) ξcat = 30.
Figure 8.
Water concentration (mol l−3) distribution for three flow patterns at the cathode GDL/CL interface (a) ξcat = 20, (b) ξcat = 30.

Figure 9.
Temperature (K) distribution for various flow patterns in the middle of cathode channel depth (a) ξcat = 20, (b) ξcat = 30.
Figure 9.
Temperature (K) distribution for various flow patterns in the middle of cathode channel depth (a) ξcat = 20, (b) ξcat = 30.

Figure 10.
Temperature (K) distribution for various flow patterns at the cathode GDL/CL interface (a) ξcat = 20, (b) ξcat = 30.
Figure 10.
Temperature (K) distribution for various flow patterns at the cathode GDL/CL interface (a) ξcat = 20, (b) ξcat = 30.

Figure 11.
Current density (A cm−2) distribution for the examined flow patterns at the cathode GDL/CL interface (a) ξcat = 20, (b) ξcat = 30.
Figure 11.
Current density (A cm−2) distribution for the examined flow patterns at the cathode GDL/CL interface (a) ξcat = 20, (b) ξcat = 30.

Figure 12.
Polarization curve of the examined flow patterns at the cathode stoichiometric of 20 and 30.
Figure 12.
Polarization curve of the examined flow patterns at the cathode stoichiometric of 20 and 30.

Figure 13.
The power density of different flow pattern in the PEMFC.

Figure 14.
Comparison of various flow fields in terms of mass and volume power density.

Table 1.
Mass and volume of different zones of the single cell of PEMFC for different flow fields.
| Zone | Parallel | Bean-Shaped without Blockage | Bean-Shaped with Blockage | |||
|---|---|---|---|---|---|---|
| Mass [gr] | Volume [L] | Mass [gr] | Volume [L] | Mass [gr] | Volume [L] | |
| Cathode BP | 87.2 | 0.0109 | 82.4 | 0.0108 | 86.4 | 0.0108 |
| Anode BP | 87.2 | 0.0109 | 86.4 | 0.0103 | 86.4 | 0.0108 |
| Cathode GDL | 0.563 | 0.00147 | 0.594 | 0.00155 | 0.594 | 0.00155 |
| Anode GDL | 0.563 | 0.00147 | 0.594 | 0.00155 | 0.594 | 0.00155 |
| Cathode CL | 0.485 | 0.00011 | 0.51 | 0.000116 | 0.51 | 0.000116 |
| Anode CL | 0.485 | 0.00011 | 0.51 | 0.000116 | 0.51 | 0.000116 |
| Membrane | 0.723 | 0.000367 | 0.776 | 0.000394 | 0.776 | 0.000394 |
| Total | 177.2 | 0.02532 | 171.8 | 0.02482 | 175.8 | 0.02533 |
Table 2.
Characteristic of the 2.5 kW PEMFC stack for different flow fields.
| Flow Fields | Number of Cells | Active Area (cm2) | Volume (L) | Mass (kg) | Pressure Drop (Pa) | Consumed Power (W) |
|---|---|---|---|---|---|---|
| Parallel | 60 | 73.54 | 2.44 | 13.8 | 285 | 0.84 |
| Unblocking bean-shaped | 55 | 77.58 | 2.27 | 12.5 | 13,254 | 29.8 |
| Blocking bean-shaped | 80 | 77.58 | 3.00 | 17.5 | 23,241 | 69.9 |
Publisher’s Note: MDPI stays neutral with regard to jurisdictional claims in published maps and institutional affiliations. |
© 2021 by the authors. Licensee MDPI, Basel, Switzerland. This article is an open access article distributed under the terms and conditions of the Creative Commons Attribution (CC BY) license (https://creativecommons.org/licenses/by/4.0/).
Share and Cite
MDPI and ACS Style
Toghyani, S.; Atyabi, S.A.; Gao, X. Enhancing the Specific Power of a PEM Fuel Cell Powered UAV with a Novel Bean-Shaped Flow Field. Energies 2021, 14, 2494. https://0-doi-org.brum.beds.ac.uk/10.3390/en14092494
AMA Style
Toghyani S, Atyabi SA, Gao X. Enhancing the Specific Power of a PEM Fuel Cell Powered UAV with a Novel Bean-Shaped Flow Field. Energies. 2021; 14(9):2494. https://0-doi-org.brum.beds.ac.uk/10.3390/en14092494
Chicago/Turabian StyleToghyani, Somayeh, Seyed Ali Atyabi, and Xin Gao. 2021. "Enhancing the Specific Power of a PEM Fuel Cell Powered UAV with a Novel Bean-Shaped Flow Field" Energies 14, no. 9: 2494. https://0-doi-org.brum.beds.ac.uk/10.3390/en14092494
Note that from the first issue of 2016, this journal uses article numbers instead of page numbers. See further details here.