
Design of a Stationary Energy Recovery System in Rail Transport


Engineering Department, Università Degli Studi della Campania “Luigi Vanvitelli”, 81031 Aversa, Italy
*
Author to whom correspondence should be addressed.
Energies 2021, 14(9), 2560; https://0-doi-org.brum.beds.ac.uk/10.3390/en14092560
Submission received: 31 March 2021
/
Revised: 22 April 2021
/
Accepted: 28 April 2021
/
Published: 29 April 2021
(This article belongs to the Special Issue Application of Digital Signal Processing Methods to Electric Power Systems)
Abstract
:Although rail is one of the most sustainable transport systems, there is still room to reduce its energy demand. In particular, during the braking of DC powered trains, a significant amount of energy is wasted. The recent developments in energy storage system technologies, combined with the widely used technique of regenerative braking, can considerably increase energy saving. This paper explores this theme, quantifying the amount of braking energy that can be potentially recovered in a real case study, starting from the experimental data measured on-board train. A simplified numerical model of the recovery process has been implemented. Adopting it, the energy that can be saved, with one or two energy storage systems, has been quantified for each possible position along the track. The procedure allows to determine the optimal position. Further findings about the impact of voltage level on the efficiency of the recovery process have been reported. The optimal level of voltage has been determined, also considering the additional losses in the catenary, both during the traction and braking phase of the train. Moreover, it allows dimensioning of stationary storage systems considering two different energy management strategies and their impact on the peak of stored energy. The proposed approach will be presented with reference to the concrete case of a specific route on the Italian rail network, analyzing a train in normal commuter service and the obtained results will be discussed. In the best situation, about the 73% of the braking energy can be recovered.
1. Introduction
The modern railway system is widely recognized as one of the most sustainable modes of transport. However, there is still an operating margin to improve energy efficiency and further increase its environmental benefits. The monitoring activity performed within the European project 16ENG04 MyRailS [1] has provided interesting data on the wasted energy of railway and metro traction units. From the energy analysis performed on experimental data recorded during the monitoring of different railway traction-units in commercial service, it results that a value ranging from few percentage points up to 50% of the traction energy is dissipated, and it can reach several hundreds of kilowatts per hour for a single journey. Of course, these shares vary remarkably with line characteristics, towed mass and supply voltage amplitude; the recovery of such amount of energy could improve efficiency of the electric transport reducing overall CO2 emissions. To this aim, several complementary strategies that improve the energy management can be employed: timetable optimization, reversible substations or ESSs [2,3,4]. All these energy recovery strategies are based on the regenerative braking. The inherent capacity of the electric motors to act as generator during the braking phase of the train is already widespread. In AC railway, the intrinsically bidirectional operation mode of the power supply system allows for easier reuse of this energy without any additional costs. On the other hand, about 44% of the railway networks are supplied in DC [5], where the braking energy can be reused only by other trains within the same network that need energy at the same time, since the traditional supply substations are unidirectional. In fact, they are equipped with diode rectifiers to transfer the power from the main AC grid to the overhead contact line [6], which carries the power to the trains through the pantograph [7]. In this condition, it is evident that this possibility of recovery is strongly influenced by the dynamic conditions of the line. In particular, if there is no other train in traction, in the same moment and thus able to absorb, this energy must be dissipated on-board train. This can significantly limit the amount of recoverable energy.
To overcome the described limitations, line receptivity can be considerably improved installing reversible substations that allow for return of the regenerated energy to the main grid. This option requires significant investments to modify the traditional substations substituting the already present converters with modern bidirectional ones and, on the other hand, can produce undesired disturbances to the AC grid [8,9]. A possible alternative to take fully advantage of the regenerative braking is to accumulate the excess part of the braking energy in on-board ESSs and reuse it when the train is in traction phase. Nevertheless, this approach has a first disadvantage: all vehicles must be equipped with their own ESS. However, this is not easily applicable to the vehicles already in service and of course impacts significantly on the costs. A further drawback in the adoption of on-board ESSs entails higher traction energy consumptions due to the increase in vehicle mass [10,11]. An alternative to overcome the restrictions in terms of weight and volume is to install stationary ESSs nearby the substations. Stationary ESSs can recover the energy generated from several trains on the line and release it as soon as needed [12,13,14,15]. This solution works without any modification to the vehicles already in service. The main drawback of the stationary ESSs is that the relative distance between train and ESS limits the amount of the recoverable energy (this is due to resistive losses in the catenary and limitation in voltage increasing during energy injection as it will be better explained in the following) so effectiveness of the energy recovery depends on the ESS location along the line. It is, therefore, important to try to determine the best position that maximizes the recovery.
In the literature, several articles address the maximizing of energy recovery introducing a stationary ESS: for instance, in [16] is described a study that estimates the energy that can be potentially recovered into the primary grid installing stationary ESSs, investigating different types of braking (mixed electrical and mechanical or totally electrical). In [17], a newly proposed topology based on a bypass DC loop connected in parallel with the original catenary circuit is proposed to improve the utilization rate of the ESSs. In [18] is developed a control algorithm to manage the energy accumulated in ABS (Auxiliary Battery Substations) installed in traditional 3 kV DC railway networks to face the peak current absorbed by the trains in traction phase. In [19] is proposed a computational model developed to evaluate the energy savings and the stabilizing effect of the overhead line voltage due to ESS. In [20] is proposed a method for choosing the optimal siting and sizing of stationary supercapacitors based on particle swarm algorithm. However, to the best of authors’ knowledge, few articles explore this theme starting from measurements collected on-site. With this aim, the paper presents a procedure that performs a complete design of the ESS to maximize the energy recovery selecting the best storage position and selecting also the voltage level that represents the best tradeoff between line losses and braking energy recovery. Moreover, the procedure considers different energy management strategies in order to determine the required size of the ESSs.
The procedure will be presented with reference to a specific case of study considering a E464 train, owned by Trenitalia, in commercial service on the line Bologna–Rimini. The procedure is based on measurements performed on-board train of the actual energy flows associated with train position used in combination with a simplified model of the considered line. In the following, Section 2 (The Measurement System) describes the on-board train measurement system and the monitored quantities, whereas Section 3 (Methodology Description and Experimental Results) shows the application of the method. Finally, Section 4 (Conclusions) draws the conclusions.
2. The Measurement System
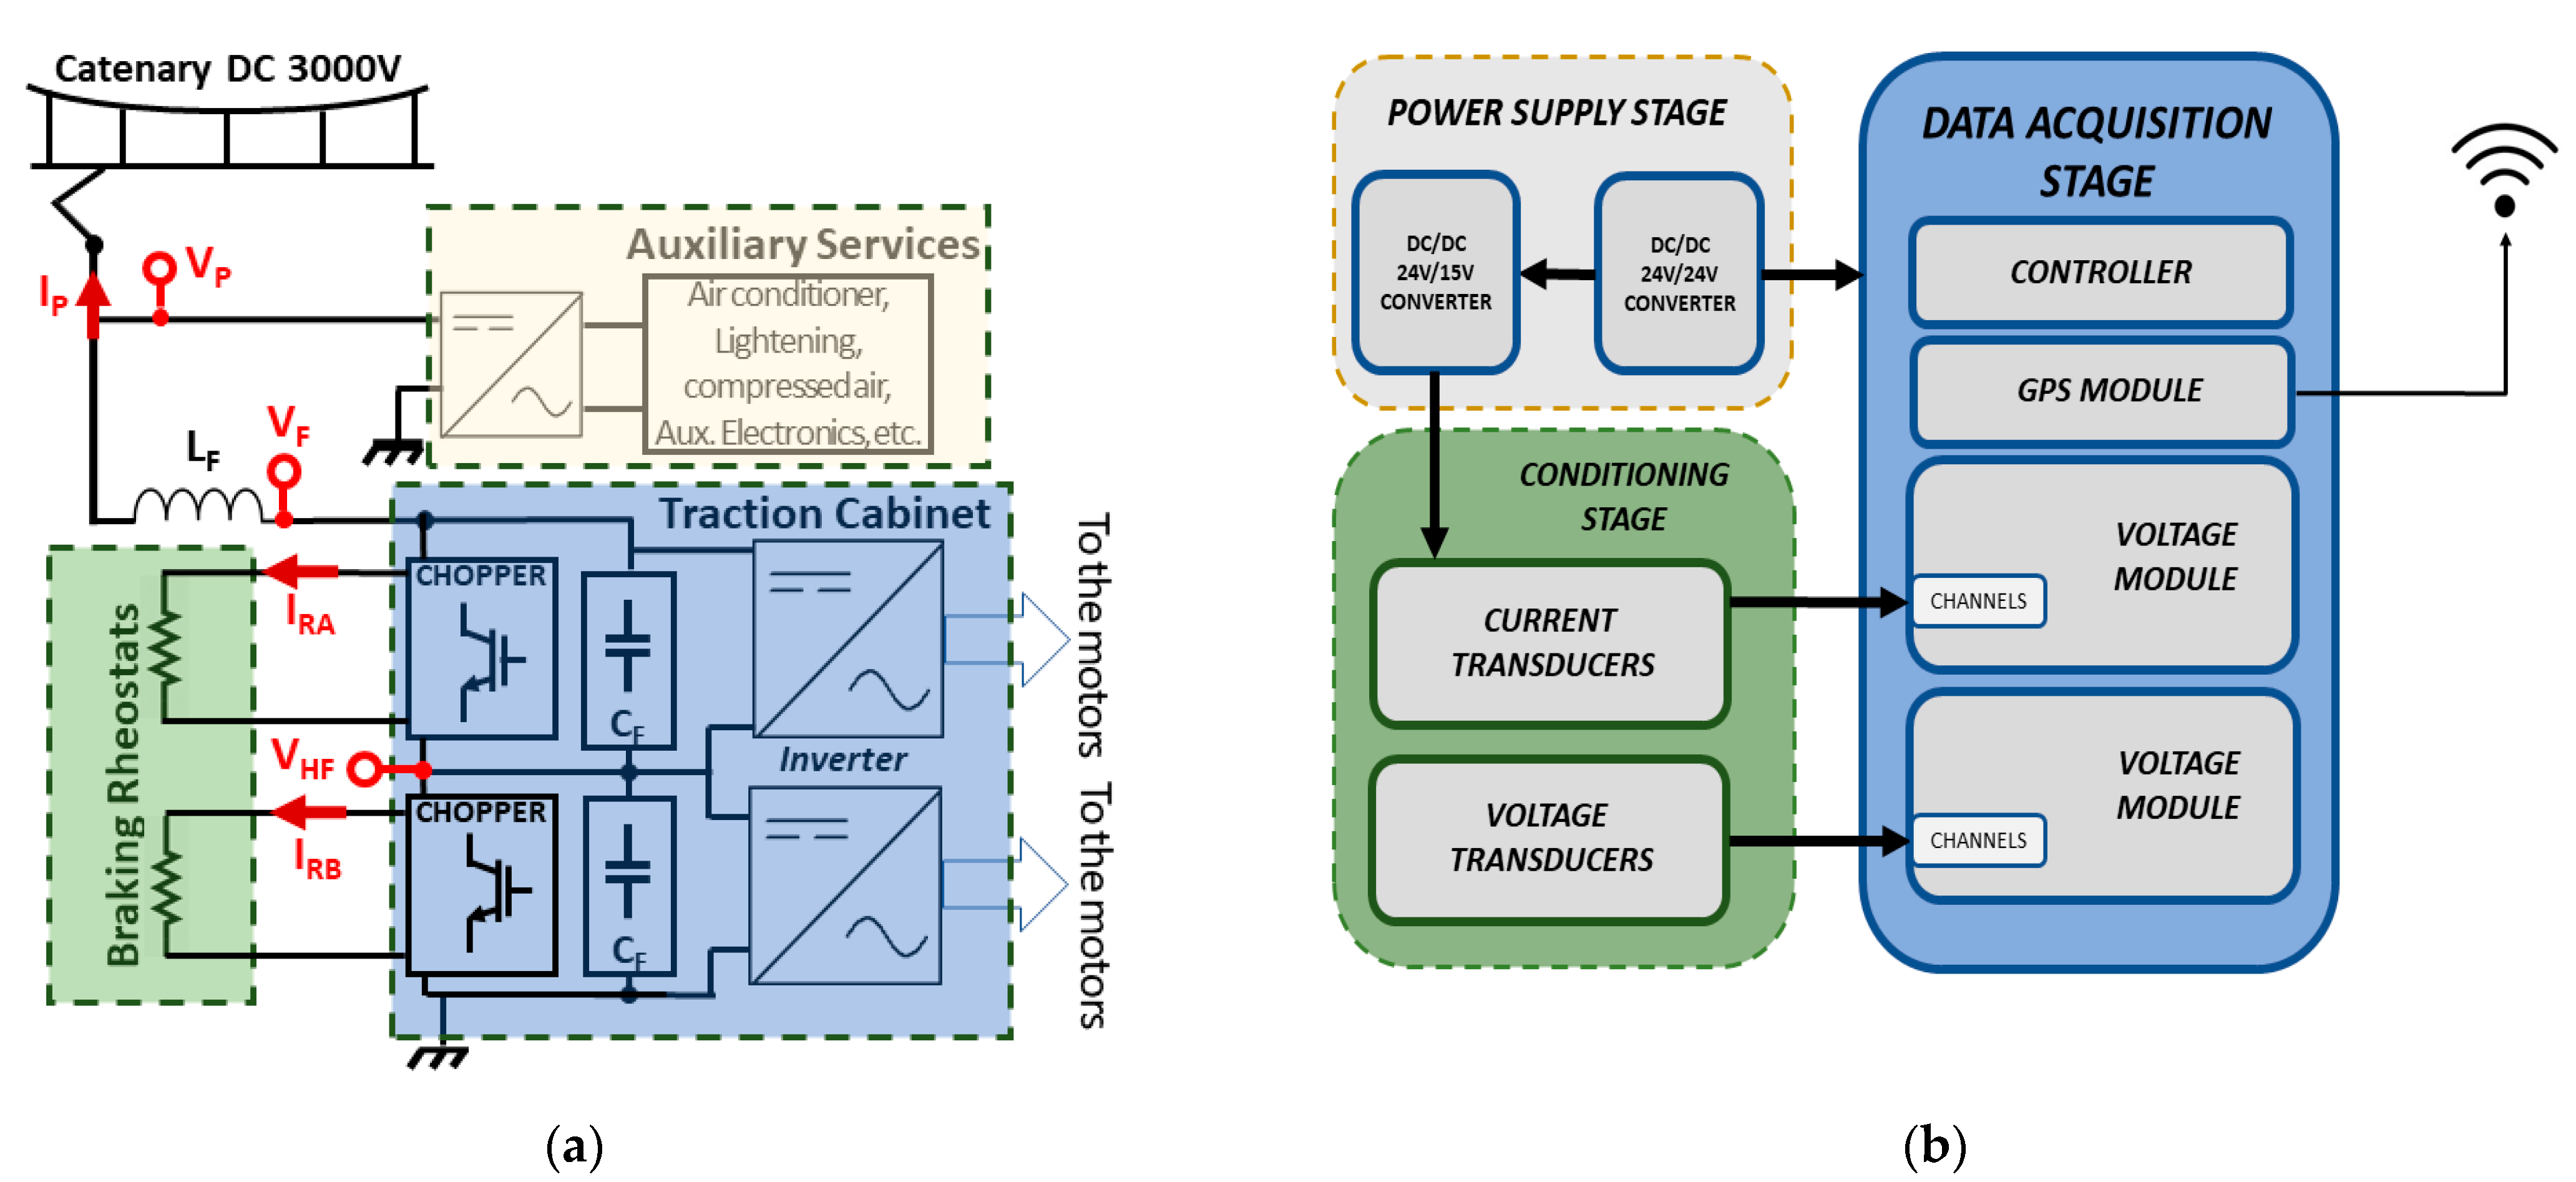
The data used for this research have been recorded during an extensive measurement campaign conducted on board the train E464 operating on the Italian rail network. The measurement campaign lasted about 3 months with over 1 terabyte of data recorded and it is a part of the activities within the European project 16ENG04 MyRailS [1]. Figure 1a provides a schematic of the E464 locomotive traction unit and the monitored quantities. Voltage (VP) and Current (IP) at the pantograph have been measured to quantify the energy absorbed by the train during traction (IP < 0) and the energy sent back to the catenary during braking (IP > 0). Instead, the supply voltage and the currents in both rheostats (IRA and IRB) have been measured to estimate the energy wasted on-board train. Note that the voltage drop across the resistors has been indirectly determined by the voltage after the inductance (VF) and the one between the two series-connected capacitances (VHF half filter). The block diagram of the proposed measurement system is shown in Figure 1b. The system used for the on-site measurements is based on the National Instruments Compact Rio 9034. A GPS Module that produces a 1 Pulse Per Second (PPS) signal from the GPS timing receiver with an accuracy of 100 ns and accomplishes the task of keeping the system synchronized to absolute time. The module also provides information about latitude and longitude of the train, useful to correlate the real-time measurements to the position of the train. In order to build up a complete measurement system, proper signal conditioning has been designed. Voltage and current transducers, suitable to adapt signals amplitude to the digital conversion stage, have been selected since the nominal voltage and current levels of the monitored quantities are considerably higher than the input range of the voltage modules. For currents, open loop Hall effect transducers were employed. In particular, LEM HOP 800-sb transducers, that feature a measuring range of ±1600 A, are suitable to acquire the current in the rheostats and the current absorbed by the auxiliary systems. For the pantograph and the traction current instead, LEM HOP 2000 transducers, that features a measuring range of ±3000 A, have been used. The transducers have an openable magnetic core, that allows the installation without modifying the already present electrical wiring.
Both transducer models feature a flat frequency response from DC to 10 kHz and a rated accuracy lower than 2%. Resistive-capacitive voltage dividers were used to acquire the voltages VP, VF and VHF. In particular, three Ultravolt compensated dividers have been employed. These transducers feature a primary voltage of 40 kV, a nominal transducer ratio of 1000/1 and provide a bandwidth from DC to 10 MHz. The acquisition stage has been implemented with the cRIO 9034 that is equipped with an embedded controller with 1.91 GHz real-time processor, 2 GB RAM DDR3 and houses two 4-channel NI 9223 voltage modules. The voltage modules feature 4 differential input channels, 16-bit resolution and an operating range of ± 10 V. The data acquisition has been performed at 50 kHz that allows a continuous monitoring of the signals without leading rapidly to an unmanageable amount of data and, at the same time, allows to analyze typical fast transient phenomena that can occur on-board train.
3. Methodology Description and Experimental Results
As mentioned before, this paragraph presents the design of a stationary ESS selecting the position that maximizes the recovery of the braking energy, basing on the energy flows quantified from the data acquired with the described on-board measurement system. To describe the methodology, we will focus the attention on a specific route, but similar results can be obtained with other routes. The study has been carried on the Rimini–Bologna route that covers a distance of 115 km and lasts one hour and a half in all. The values reported in the following refer to a round trip performed on 1 January 2021 by a E464 loco with seven carriages towed (weight 316 ton). The amount of energy absorbed by the train traveling the route was considerable (3.4 MWh) while, during the braking stages, the amount of energy injected back to the catenary does not overcome 19 kWh overall, against a total amount of dissipated energy of 418 kWh (that is 12% of traction energy). In other words, less than 5% of the braking energy is recovered. This is a particular condition that is probably caused by the low number of trains due to the travel restrictions in force during the pandemic. Regardless, it is an interesting case study to consider for our purposes.
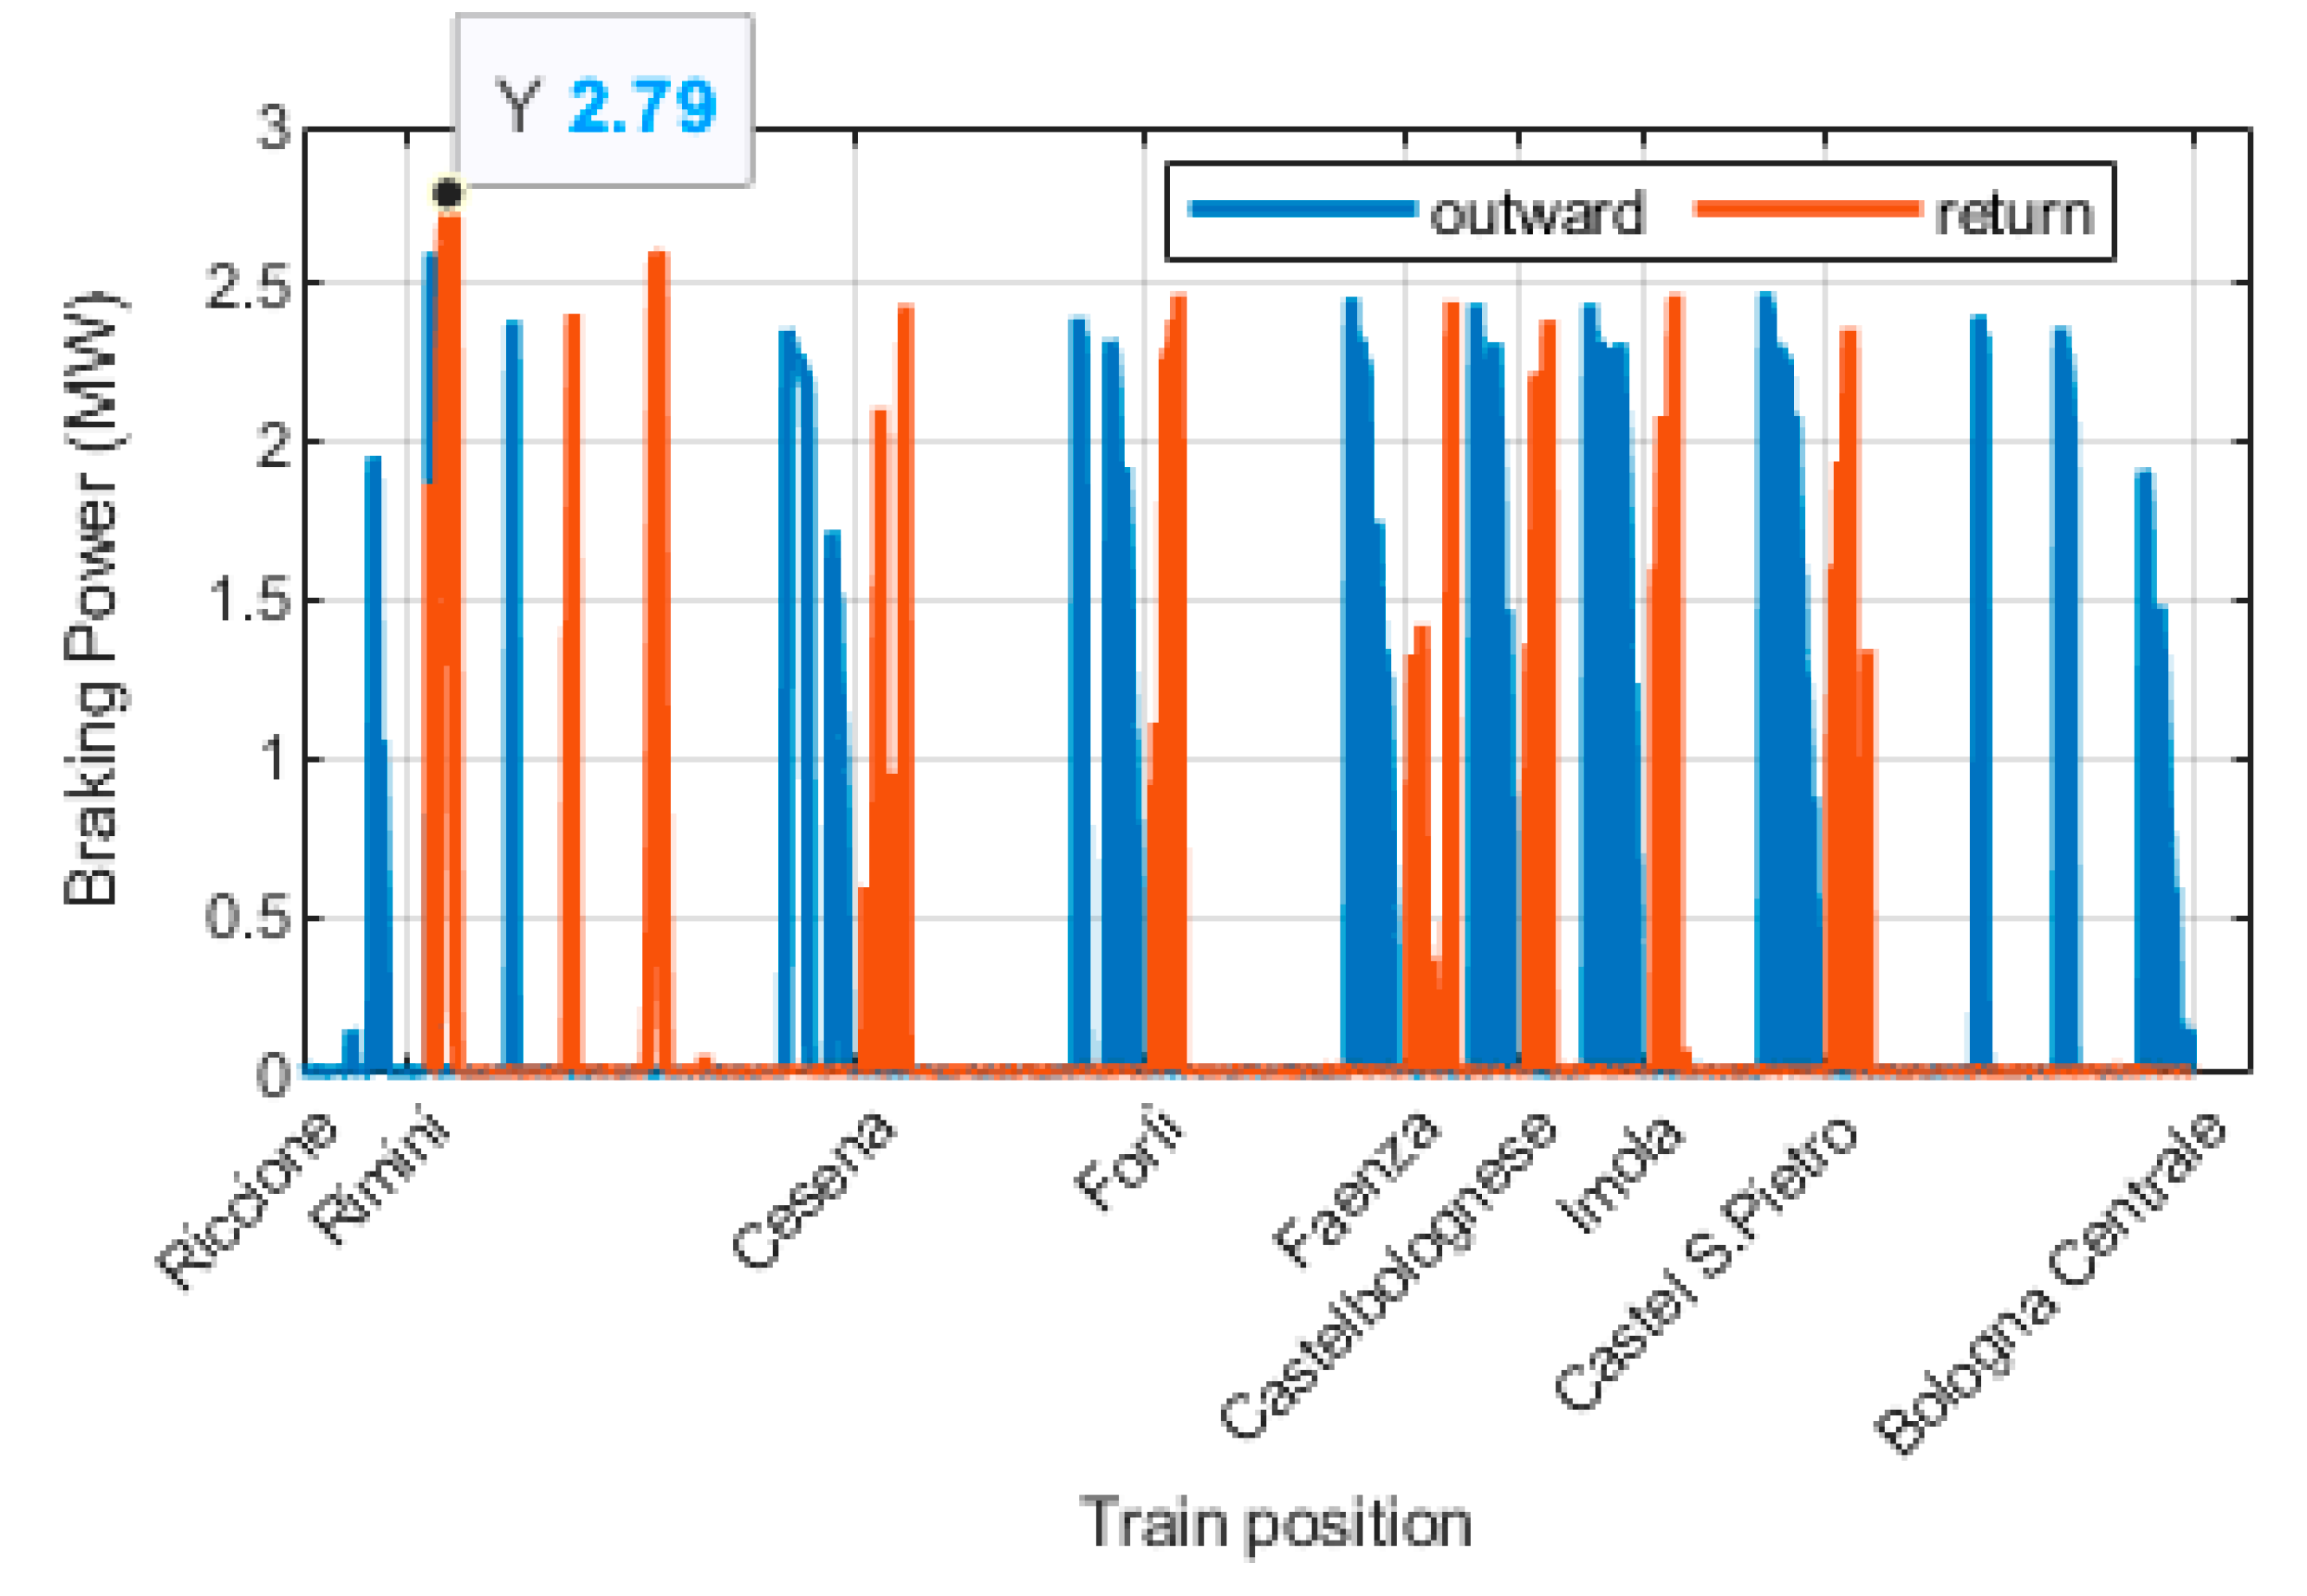
The continuous monitoring of the energy flows at the pantograph and those in the rheostats, together with the position of the train, allows to know the energy generated and absorbed by the train in any position. Figure 2 reports the values per second of the power regenerated by the train during the route from Riccione to Bologna (blue line) and those related to the return trip from Bologna to Riccione (red line). The peak level of the braking power recorded along the monitored route is of about 2.8 MW.
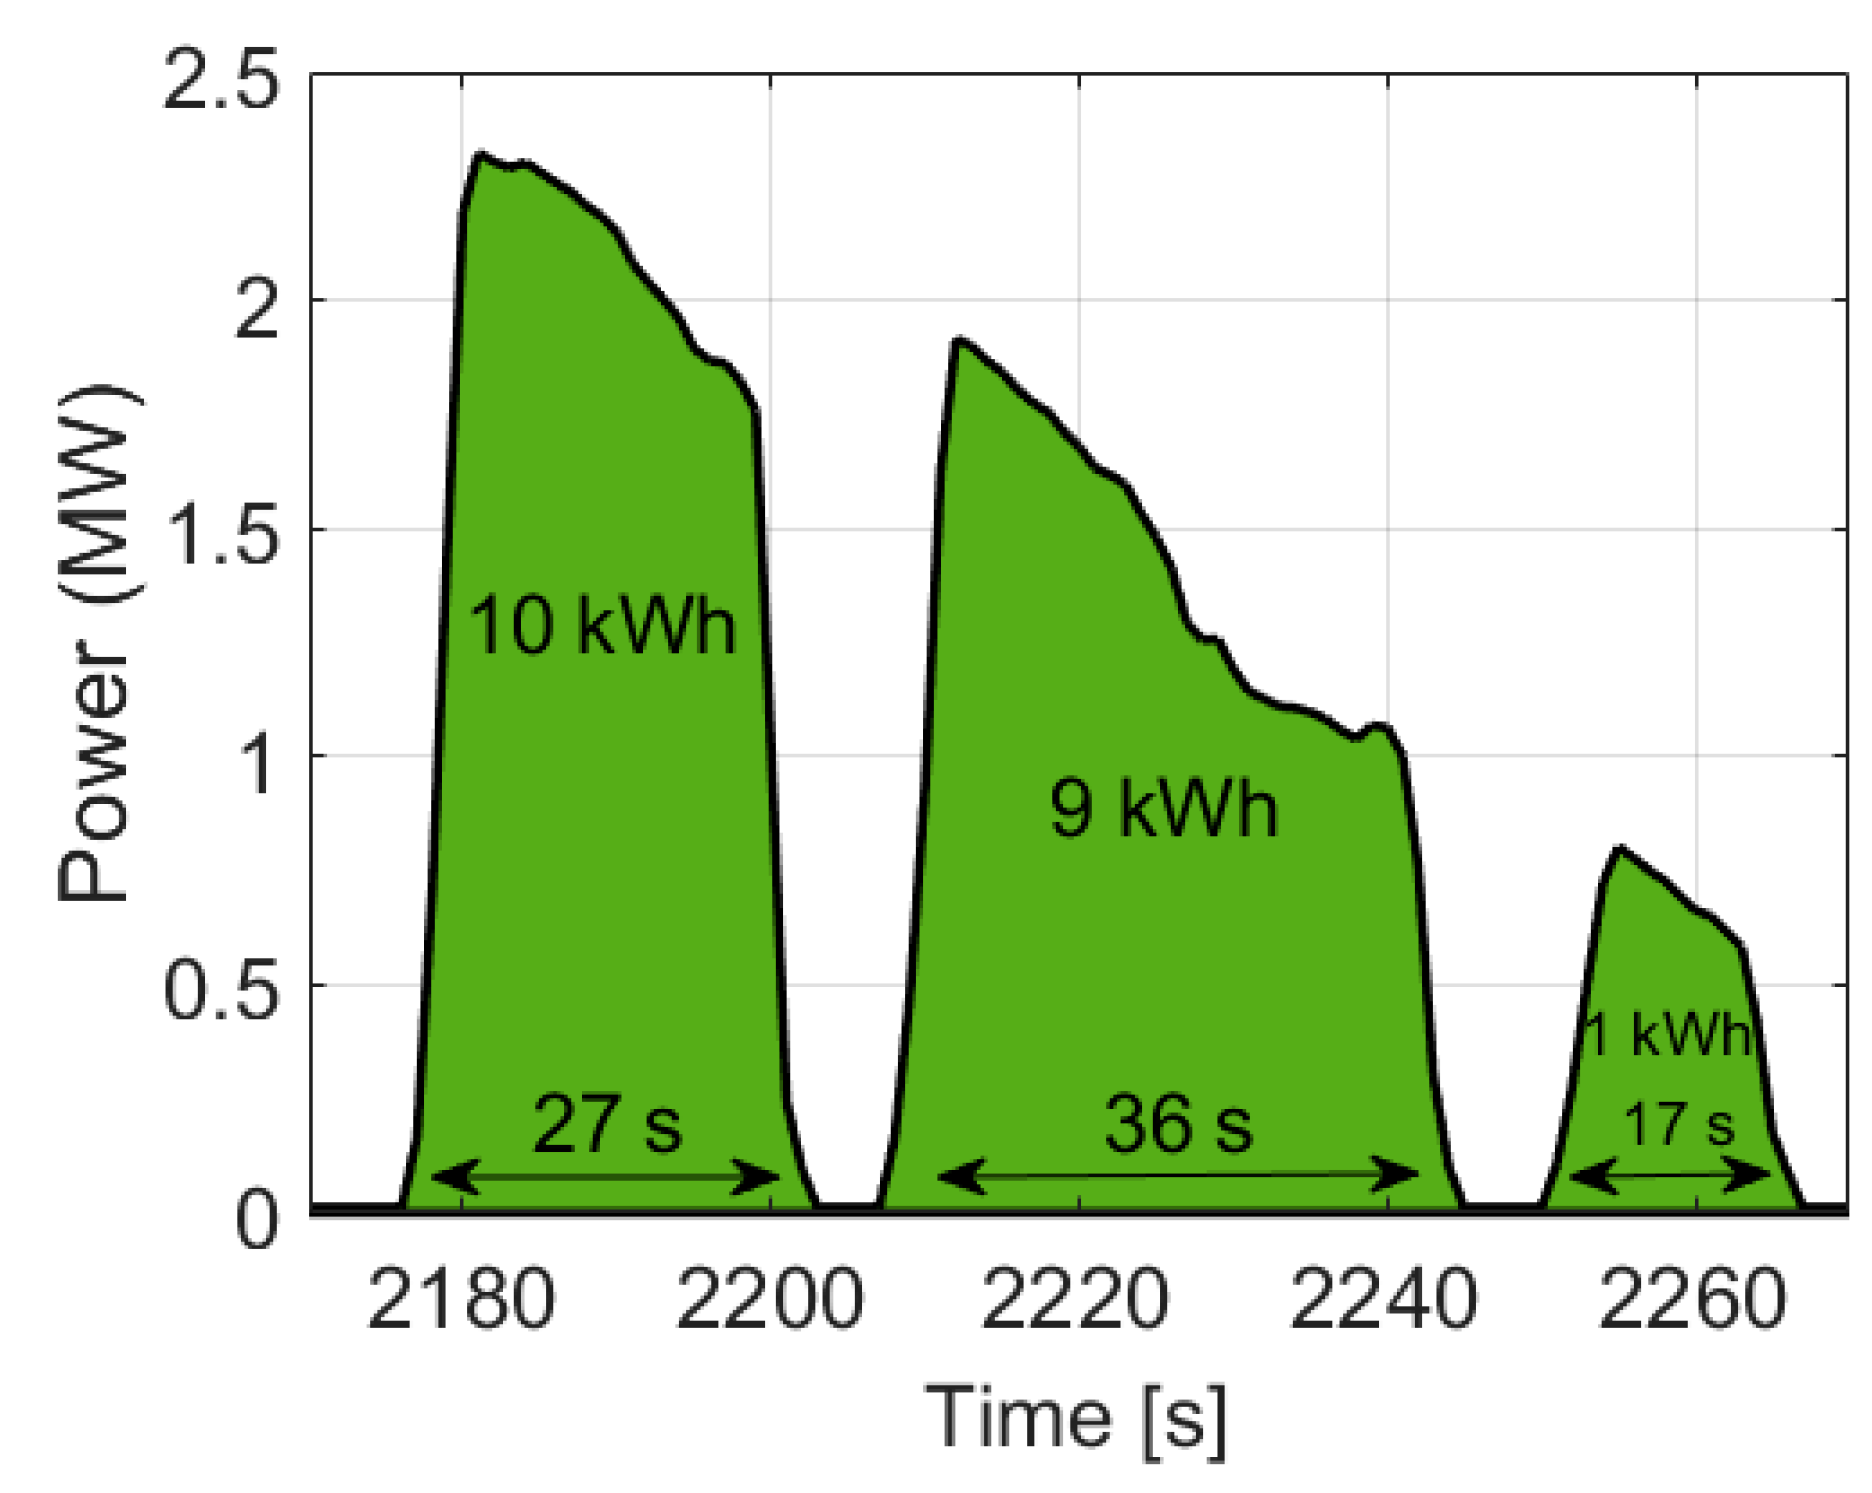
As it can be noted, in both cases most of the braking events occur when the train approaches the next station. Moreover, the braking effort is quite similar if we compare the two trips but, during the return, the braking events are displaced on the right with respect to the stations because of the opposite direction of the train. It can be worth focusing on a single typical braking event to quantify the energy fluxes and the peak levels of power that have to be managed. In Figure 3 is reported a braking event occurred traveling outward, just before approaching the substation of Forlì. During the braking, the train generates a peak power of about 2.4 MW and the amount of energy related to each pulse of power has order of magnitude of few tens of kilowatt. Therefore, to fully exploit the braking energy, fast energy ESSs are required [21].
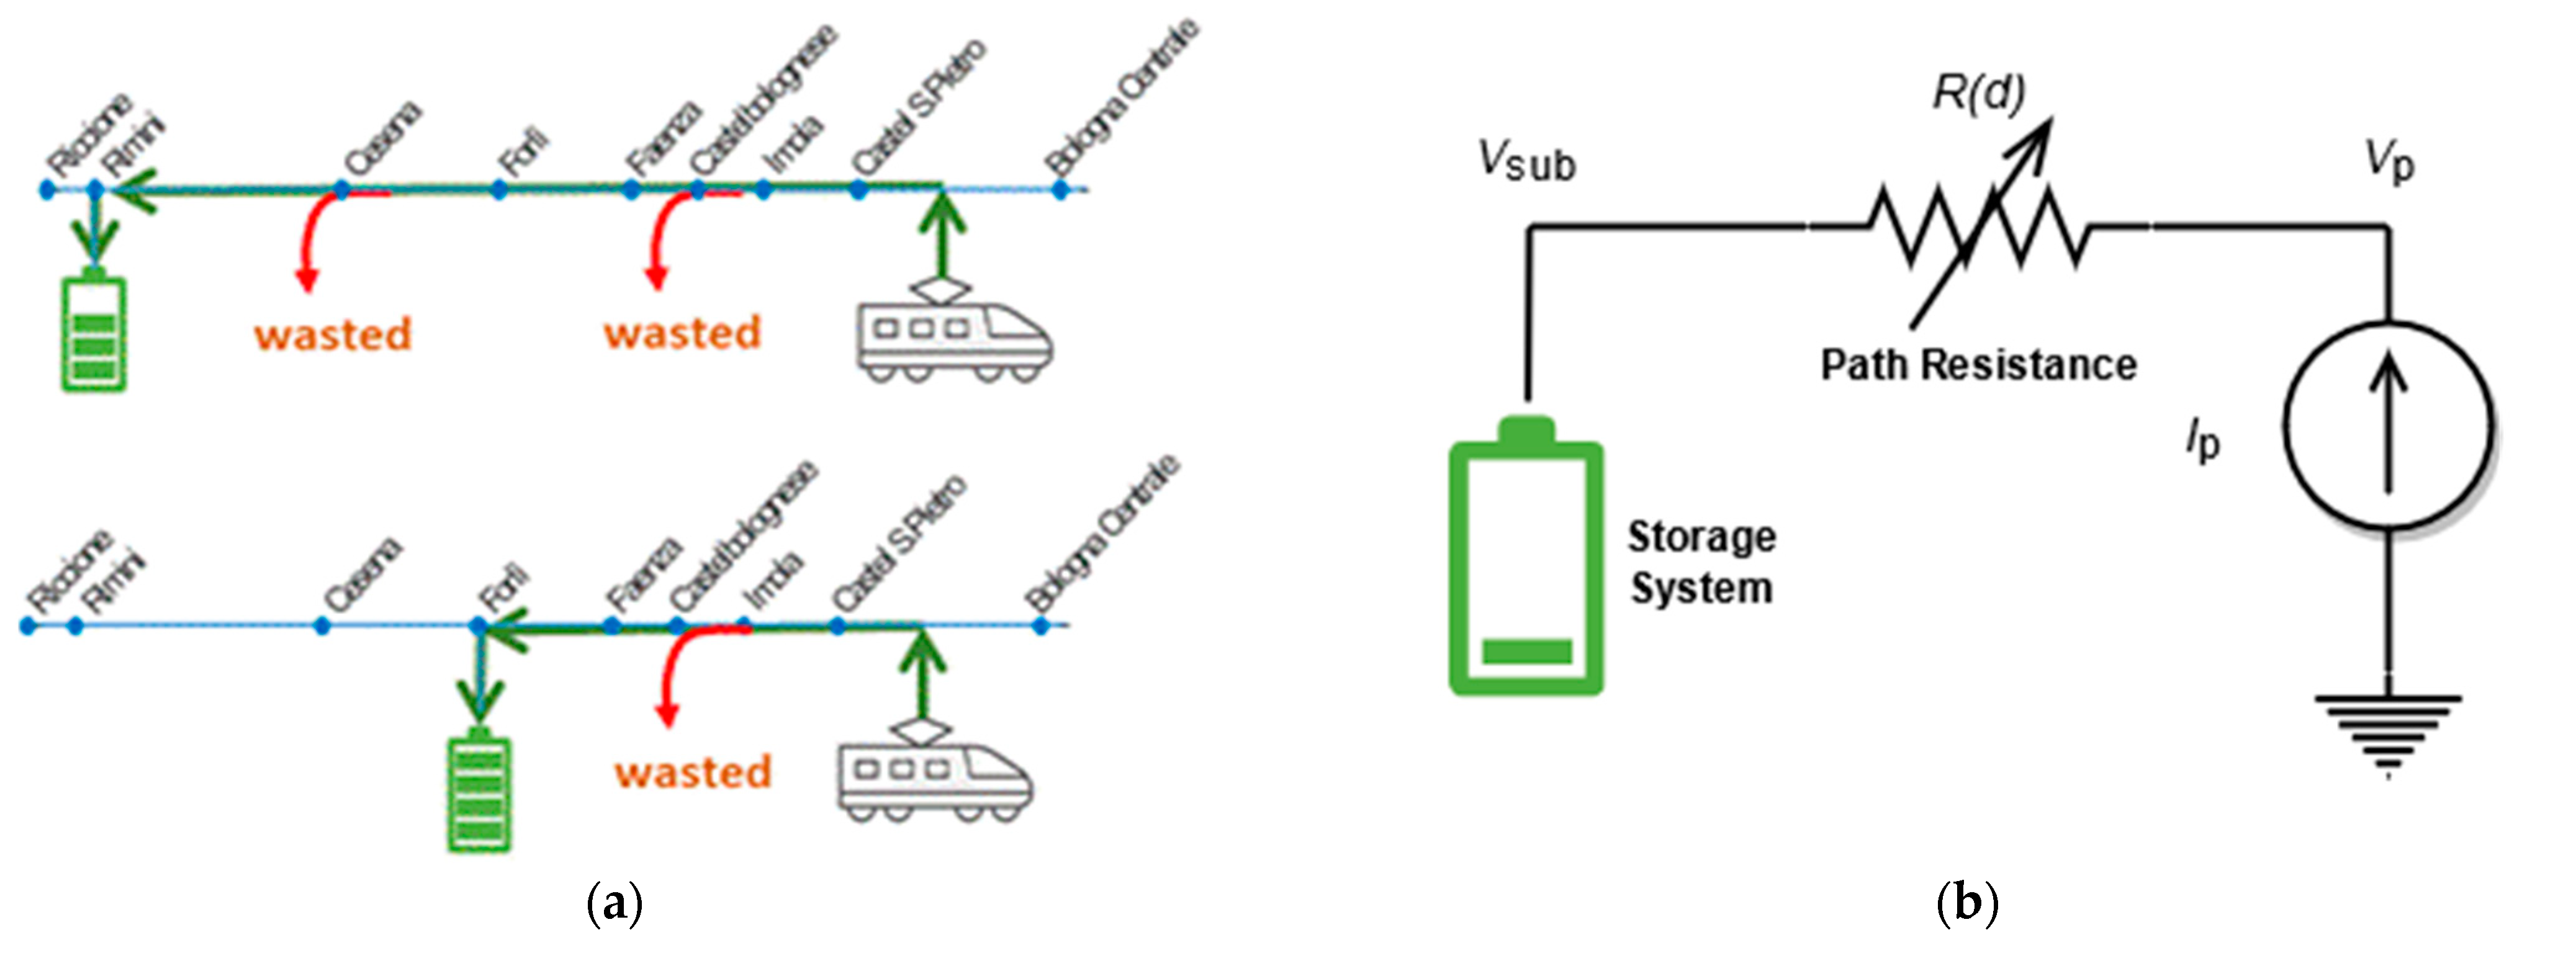
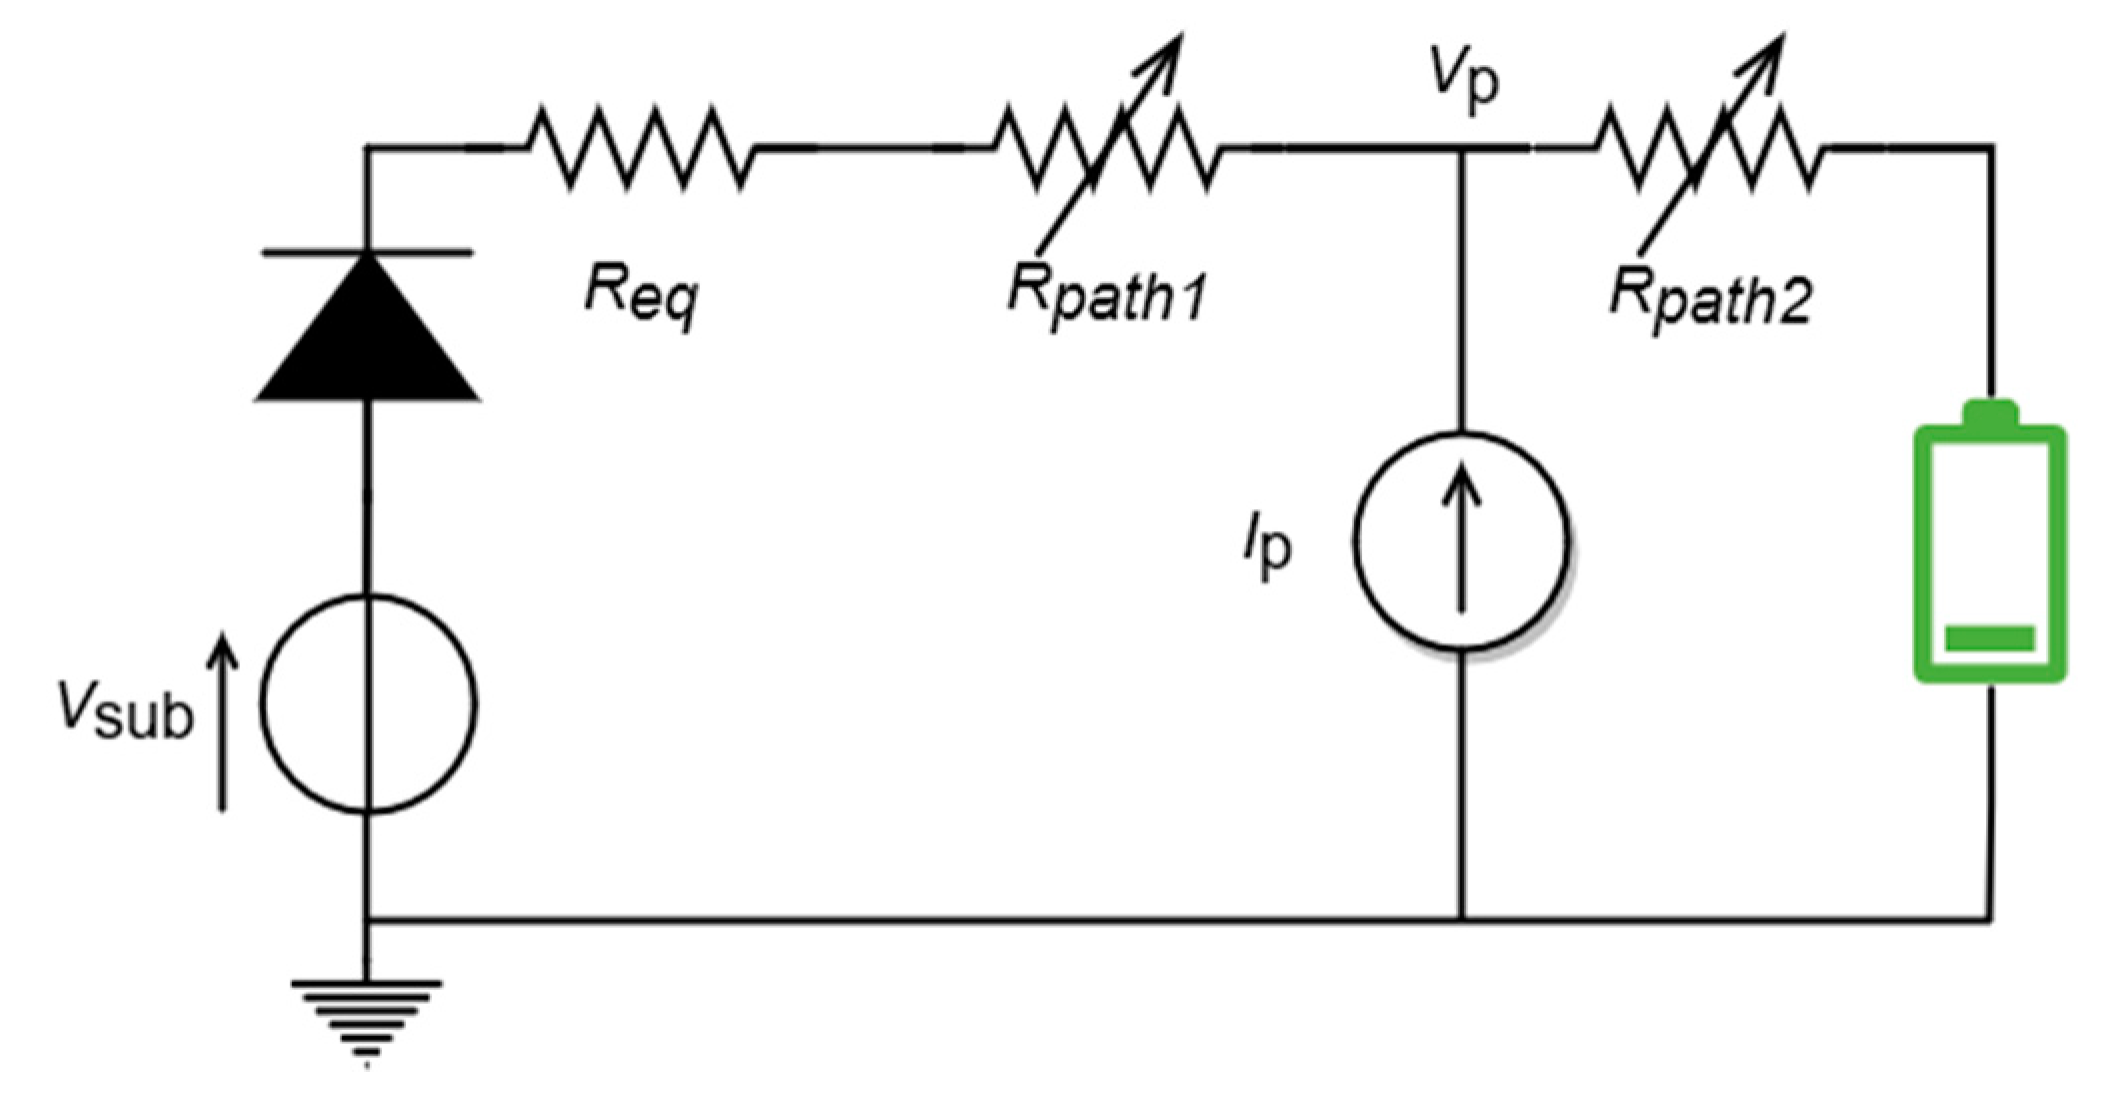
Although the technology to employ is not object of this research activity, an appropriate choice to manage this kind of power fluxes is the Li-ion capacitor [22]. This technology has a higher power density as compared to the standard lithium-ion batteries and energy density greater than standard electrostatic double-layer capacitors [22,23,24]. As previously mentioned, the ESS position can strongly influence the amount of recovered energy (Figure 4a). In fact, the energy recovery process during the braking can be modeled as in Figure 4b, where the train is modeled as a current generator that injects power to the line, the ESS is modeled as a current sink and R(d) models the railway track between the position of loco () and the position of ESS () and thus it is a function of the relative distance d (. This model can be analytically expressed as follows:
where, represents the operating voltage of the substation in which the ESS is located, is the braking power generated by the motor that is split into , the part injected and , the part dissipated, and is the stored power.
The parameter has been included in the model to take into account the efficiency of the Storage Management System (SMS). The only input of this model is the braking power () that can be evaluated for each second and for each position of the train from experimental measured data adopting the following Equation (2):
with the symbolism used in Figure 1a.
It is worthwhile noting that the values averaged over a second of the measured quantities reported in (2), denoted by the overbar, are obviously different from the corresponding values reported in (1) as the introduction of the ESS modifies the working conditions and so these new values have to be calculated as a solution of equation system (1).
It must be underlined that not all the braking power can be injected in the line. In fact, the control system self-limits the amount of current injected when it detects that the line is not able to receive it. In more detail, when the train tries to send energy to the catenary, the voltage at the pantograph increases. However, if the voltage overcomes a predefined threshold (3800 V in the considered system), the on-board train control system starts the dissipation in the rheostats to reduce the current injected in the supply line and, in times, to limit the voltage increment within the maximum range allowable (3900 V maximum [25]). In particular, the current must satisfy the constraint (3) and thus the power must satisfy the constraint (4):
Once the maximum value for is reached, any additional braking power is dissipated on board (Pdis) on the breaking rheostats. Therefore, can be calculated as follows:
It is apparent that the value of R(d) can heavily influence the share of Pbr that can be injected. The value of the resistance R(d) can be obtained multiplying the line kilometric resistance, r, by the distance between train and ESS:
where r is given by the sum of resistive parameters due to the contact line (rc) and the resistance of the track (rt), that can be evaluated using the following equations:
where Sc is the cross section of the line, the resistivity of the copper and m the mass per m of the track [26]. The values of and , calculated with parameters provided by the system operator for the considered track, are, respectively and .
Starting from the quantities measured at different time instants, it is possible to know for each train position the values of . The value of is considered a constant system parameter and then also and can be calculated. Therefore, it is possible to solve the system in (1) under the constraints (3) and (4) obtaining new values for , , that would occur in presence of a stationary ESS, and also , that is the estimated storage needing. The obtained results depend on the position of the ESS ().Therefore, repeating the analysis for all the possible positions allows to determine the one that maximizes the stored energy. For the SMS a complete charge/discharge cycle efficiency of 95% was considered.
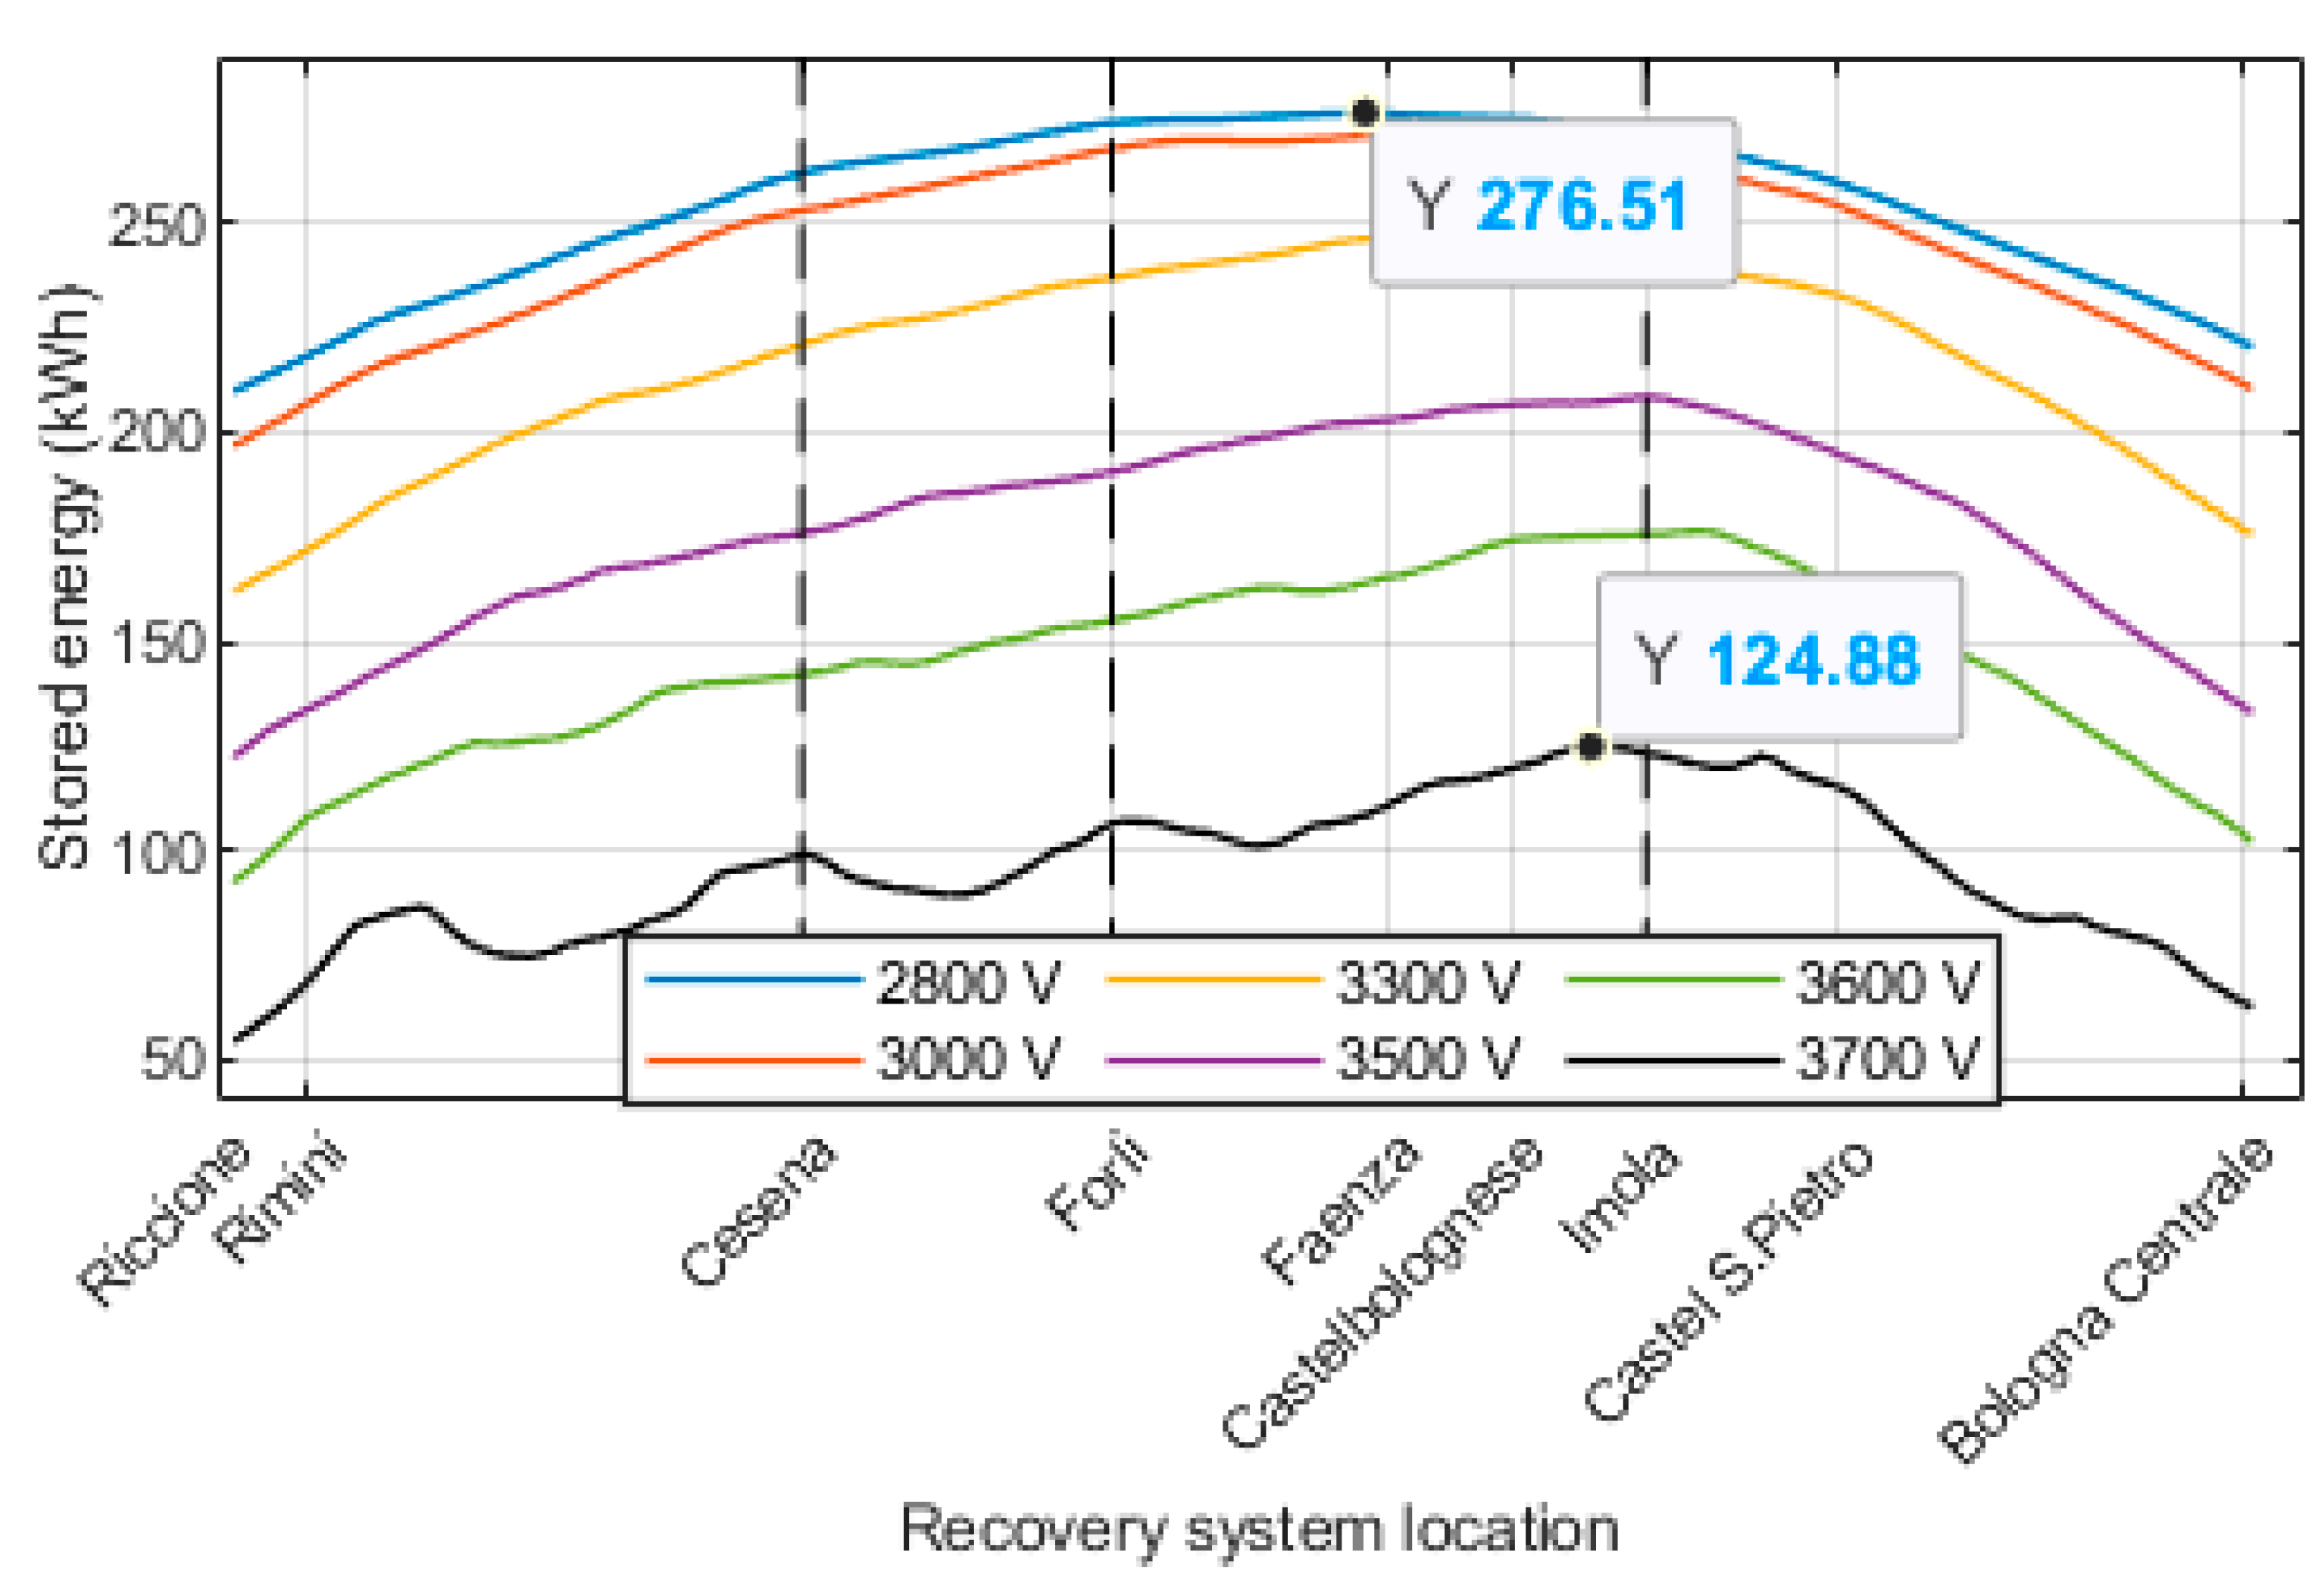
In the analysis conducted, the possible recovery by other trains is not considered, so the braking energy can be recovered only by ESS. This simplifying hypothesis represents a worst-case scenario from both point of view, ESS sizing and line losses. As a first step, the analysis has been conducted considering that Vsub = 3700 V, that is, the average value of the line voltage level obtained from the measurements; therefore, this is the case obtainable by simply adding an ESS to the existing infrastructure, without any other modification. This case is represented with a black line in Figure 5; the plot shows the total amount of stored energy (obtained integrating PS) during the analyzed round trip, versus the position of the ESS on the line. It can be noted that the position of the ESS that maximizes the energy recovery is close to Imola with a maximum of recoverable energy of about 125 kWh. Therefore, the addition of a stationary ESS, under the current operating conditions of the line (actual voltage level), allows a recovery of the 35% of braking energy (increases the energy savings of the 30% compared to the measured value). Observing the simplified model of Figure 4b, it is apparent that the substation voltage level limits the amount of energy recovered: since there is the Vp limitation above described, the maximum current injected is limited by the voltage drop on the , thus a greater value of Vsub entails a lower amount of power injected in the system.
Despite the nominal value of the considered traction system being 3000 V, it is common practice for rail system operators to adopt a significantly higher voltage (3700 V in the actual case) because an increase in voltage level allows the same power transfer with a lower absorbed current during traction stage of trains and, consequently, lower losses on the line. Regardless, it is evident that this kind of practice heavily impacts on the amount of recovered energy (see (4)): a voltage reduction should be considered as tradeoff between the additional losses and the energy surplus that can be potentially recovered.
For this reason, to evaluate how the reduction of the line voltage affects the recovered energy, the numerical analysis was repeated varying the voltage level Vsub in a range from the actual voltage (3700 V) to 2800 V. From the system (1), establishing a different supply voltage Vsub and considering as input of the model the measured value of the braking power Pbra, the values of Vp, Ip and, consequently, of Pinj and Ps, for the new supply voltage considered can be estimated, obtaining the other curves in Figure 5. Note that at lower voltage levels, the recovered energy increases as expected and the variation of recovered energy decreases with the position. Reducing voltage level in the substation and thus on the line, the maximum recovered energy increases, reaching about 276 kWh (see blue line), so it is more than doubled and the position of the ESS that maximizes the recoverable energy moves towards Faenza. As in Faenza there is not a supply substation, this location is not suitable. In fact, the ESS is assumed to be located only in correspondence of an electrical substation, in order to reduce installation and maintenance effort, and not along the intermediate sections between two substations.
For this reason, in the following analyses we considered the ESS located in the substation of Forlì.
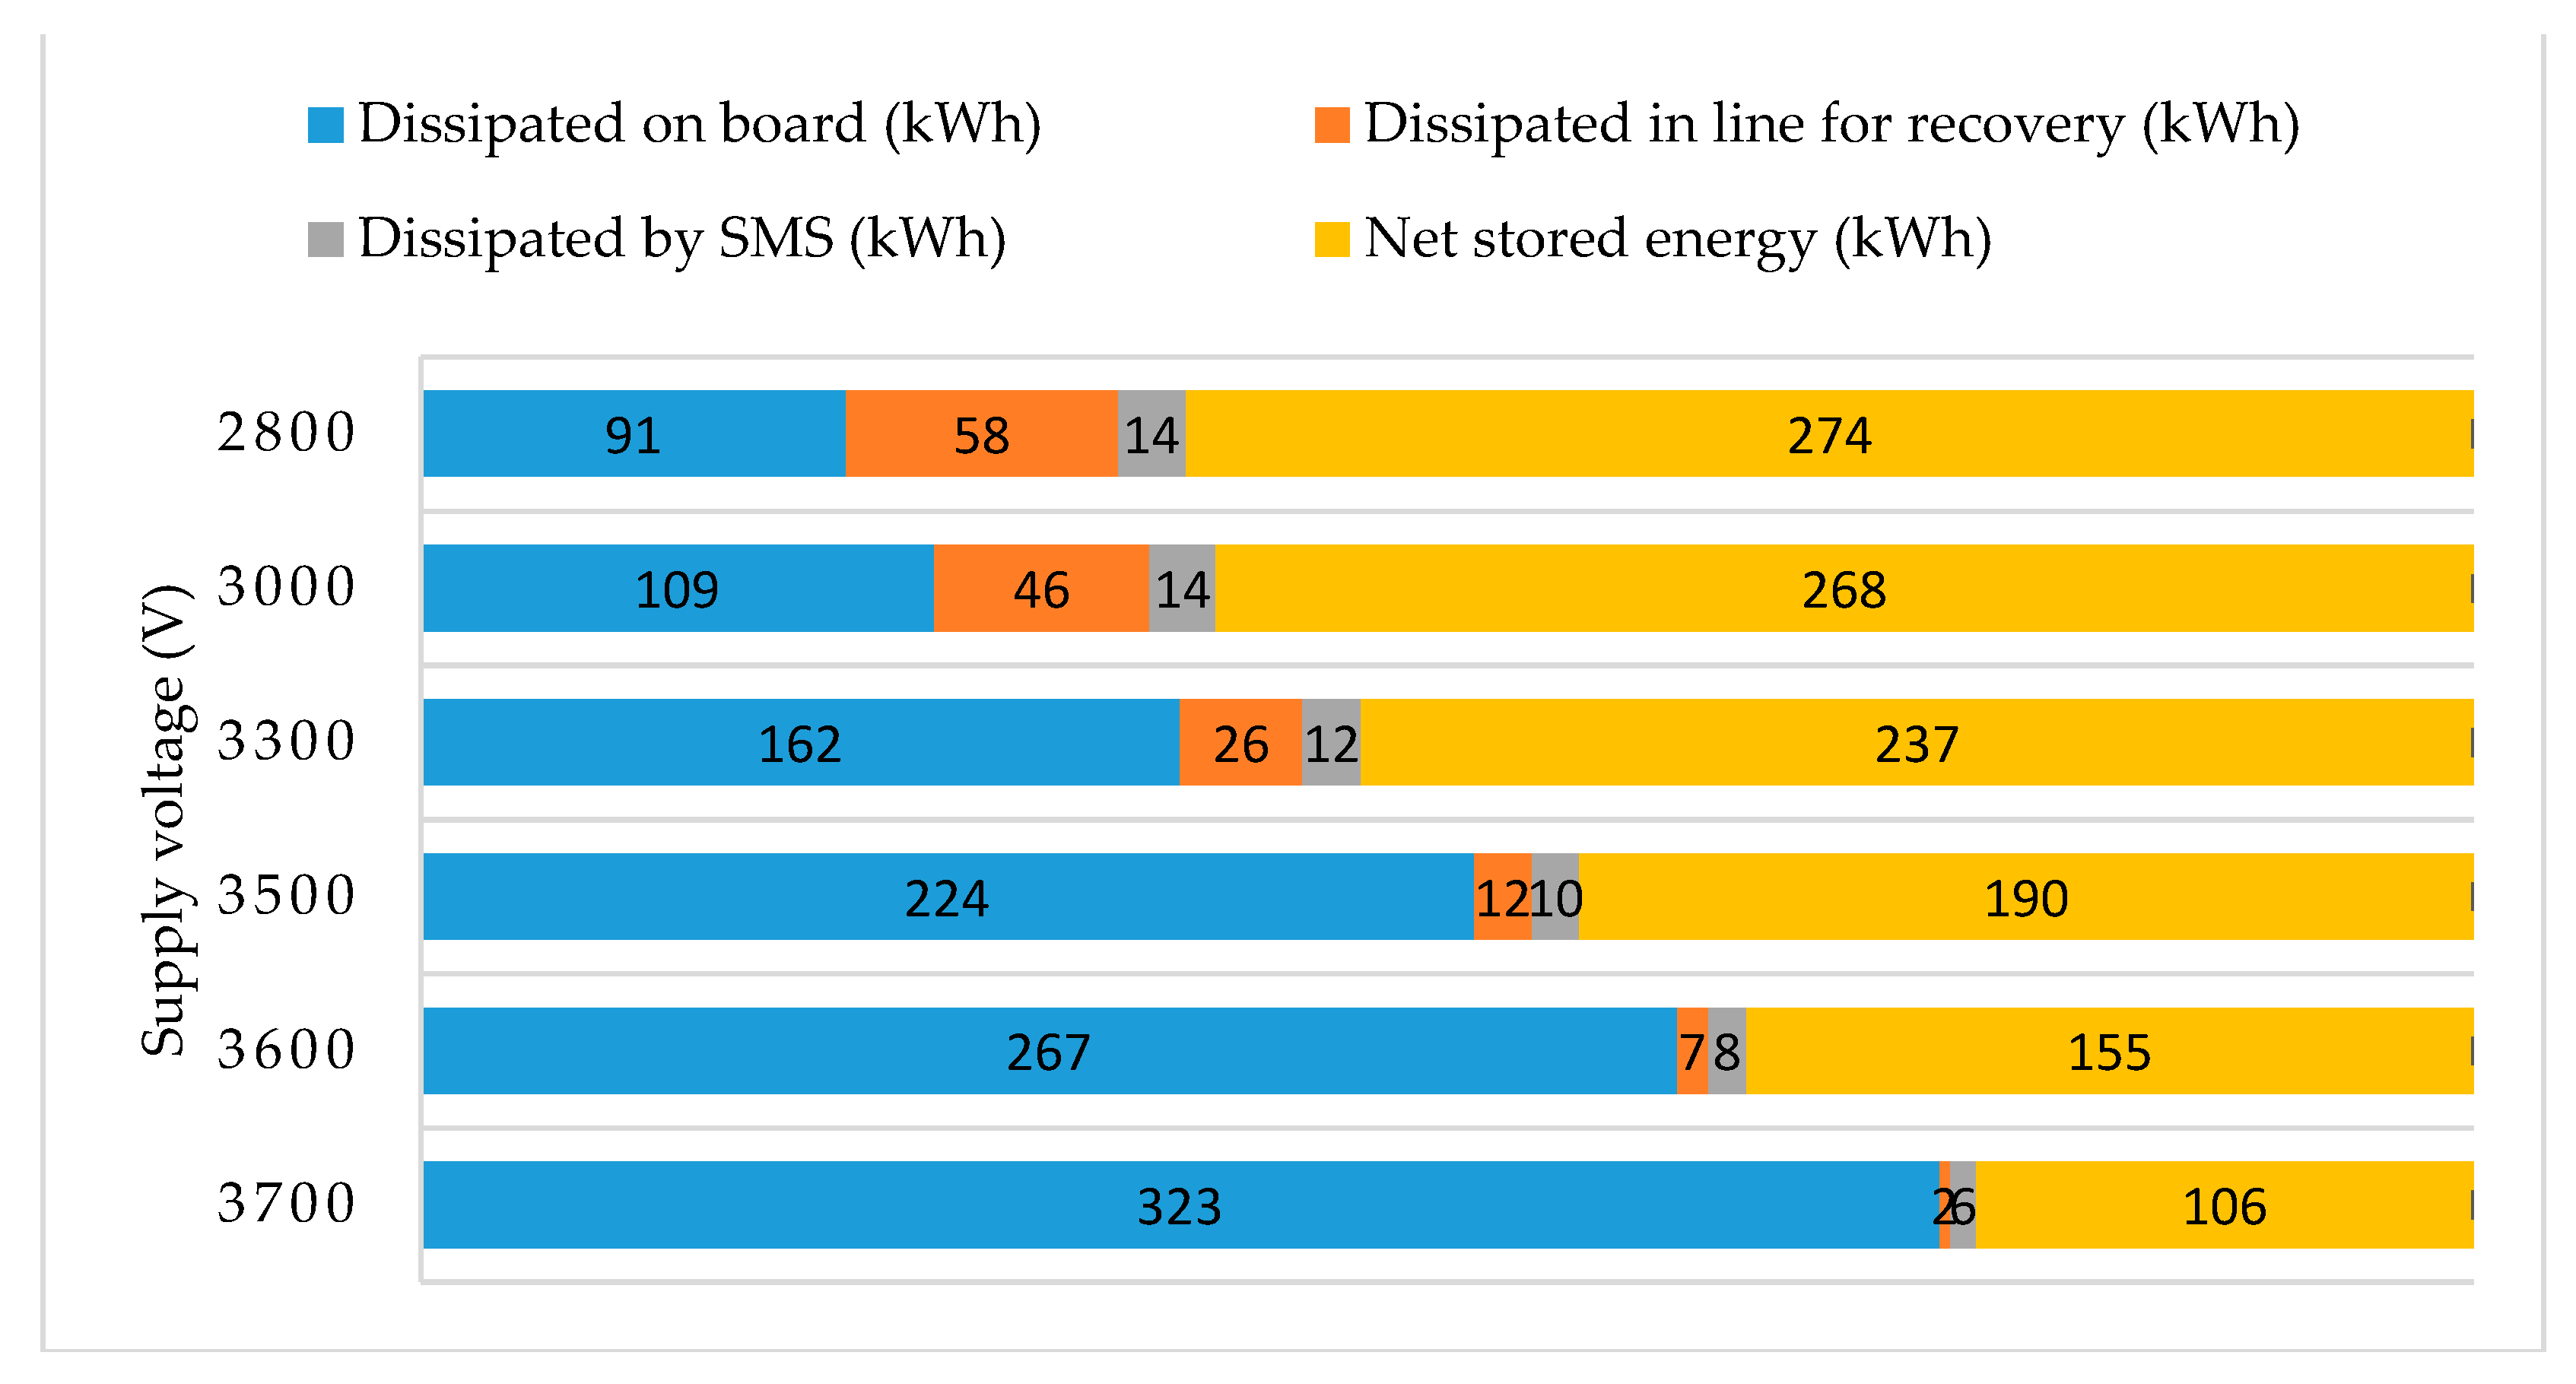
Figure 6 provides the results of a detailed energy analysis with the ESS located in Forlì, reporting separately both the energy losses in the overhead contact line during recovery and the losses of SMS. In particular, at a line voltage of 3700 V (1st bar), the total amount of recovered energy is 114 kWh, but the energy dissipated in the line on the recovery path is 2 kWh and 6 kWh are dissipated for the losses of the SMS, so the energy actually stored in the system is 106 kWh. The effect of voltage reduction acts both increasing considerably the recovered energy, but also slightly increasing the dissipation losses for the recovery (the train is able to inject more energy in the line and can recover energy at greater distances, but this implies additional losses).
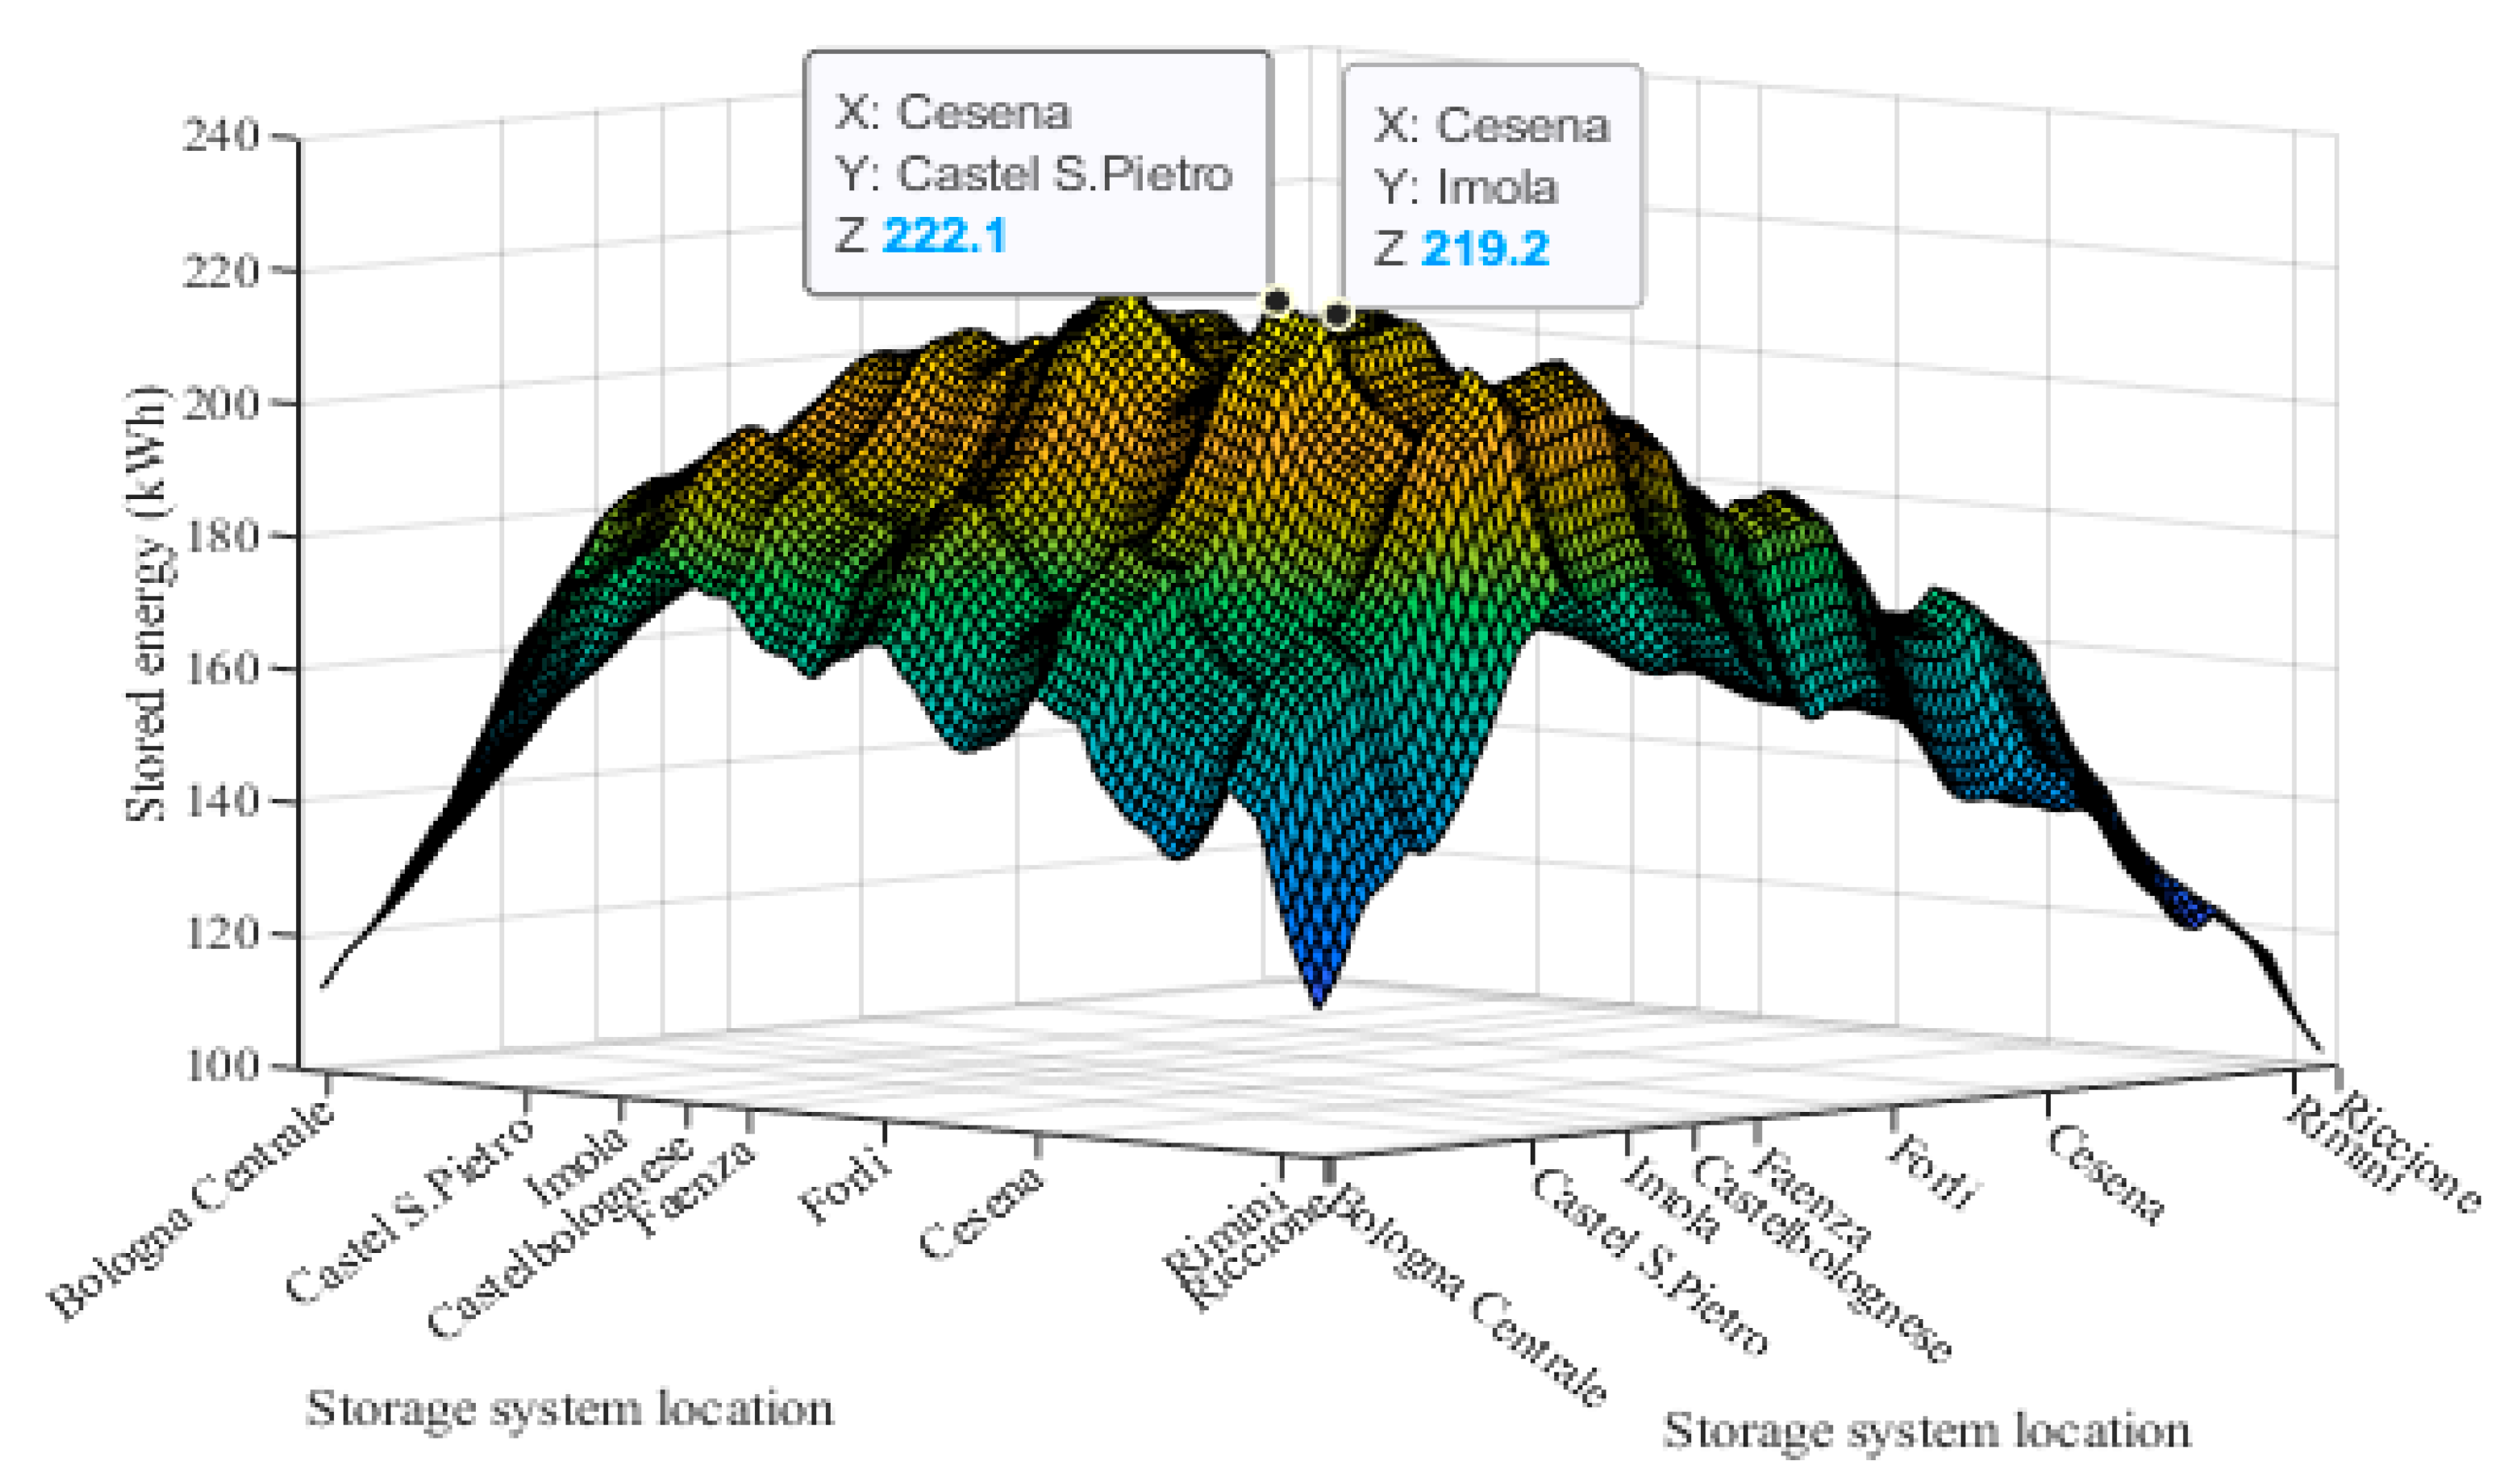
The optimization algorithm acts in a similar way, varying voltage level and considering all possible combinations of the positions of the two storage devices. In Figure 7 is reported the total amount of energy that can be recovered versus the positions of the two energy ESSs on the line at 3700 V.
The positions that maximize the energy recovery are in correspondence of Cesena and Castel S. Pietro with 222.1 kWh, but this configuration would require an additional electrical substation that is not currently present in Castel S. Pietro.
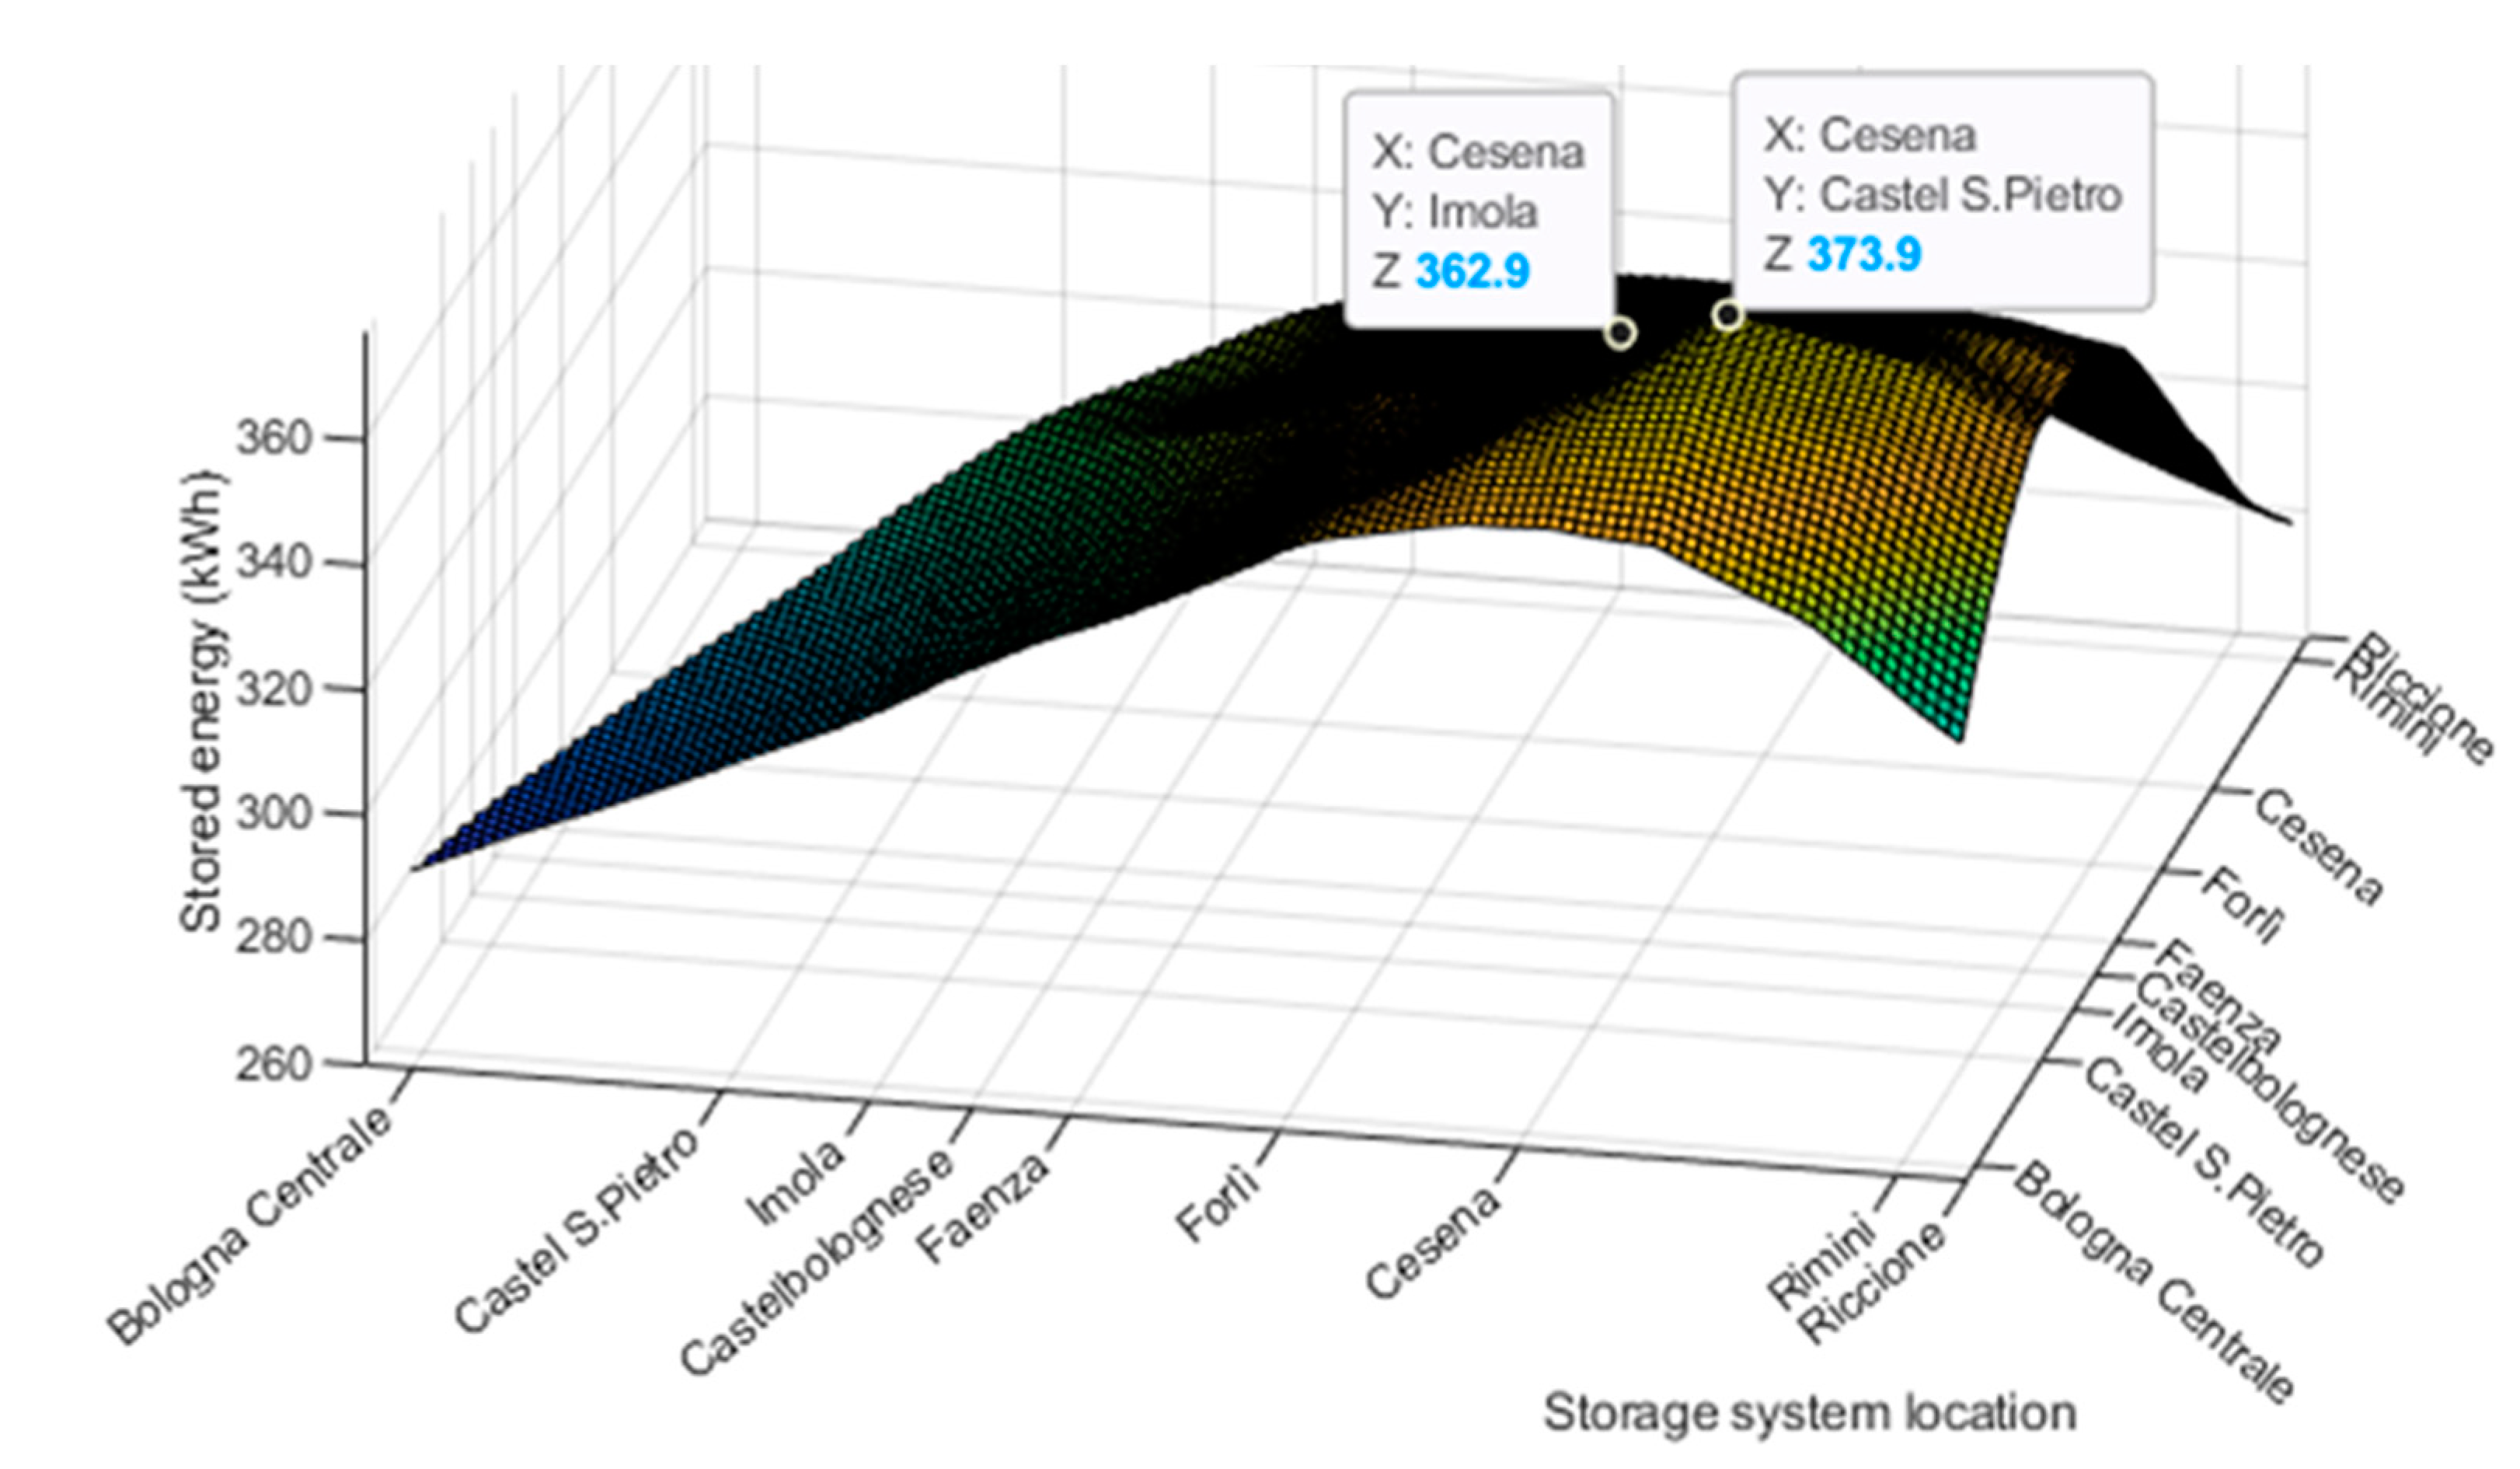
Possible alternative positions with nearly the same amount of recovered energy (219.2 kWh) are Cesena and Imola where there are two supply substations in order to minimize the installation costs. With two ESSs, the net stored energy is nearly doubled (204 kWh) compared to the case with one (106 kWh) in the same supply conditions (see Figure 5). Similarly to what has been done for one ESS, the analysis has been performed varying Vsub, obtaining the surface in Figure 8 for a supply voltage level of 3300 V.
It was observed that 3300 V is a good compromise and, as it will be clarified with the energy analyses in the following, a further voltage reduction does not introduce substantial improvements in terms of energy savings.
Additionally, in this case, the results lead to a best ESS collocation in the substations of Cesena and Imola with about 362 kWh of recovered energy. Comparing Figure 7 with Figure 8, it can be noted that reducing the voltage level the variation of the recovered energy decreases with the position, as already seen before in the case of one ESS.
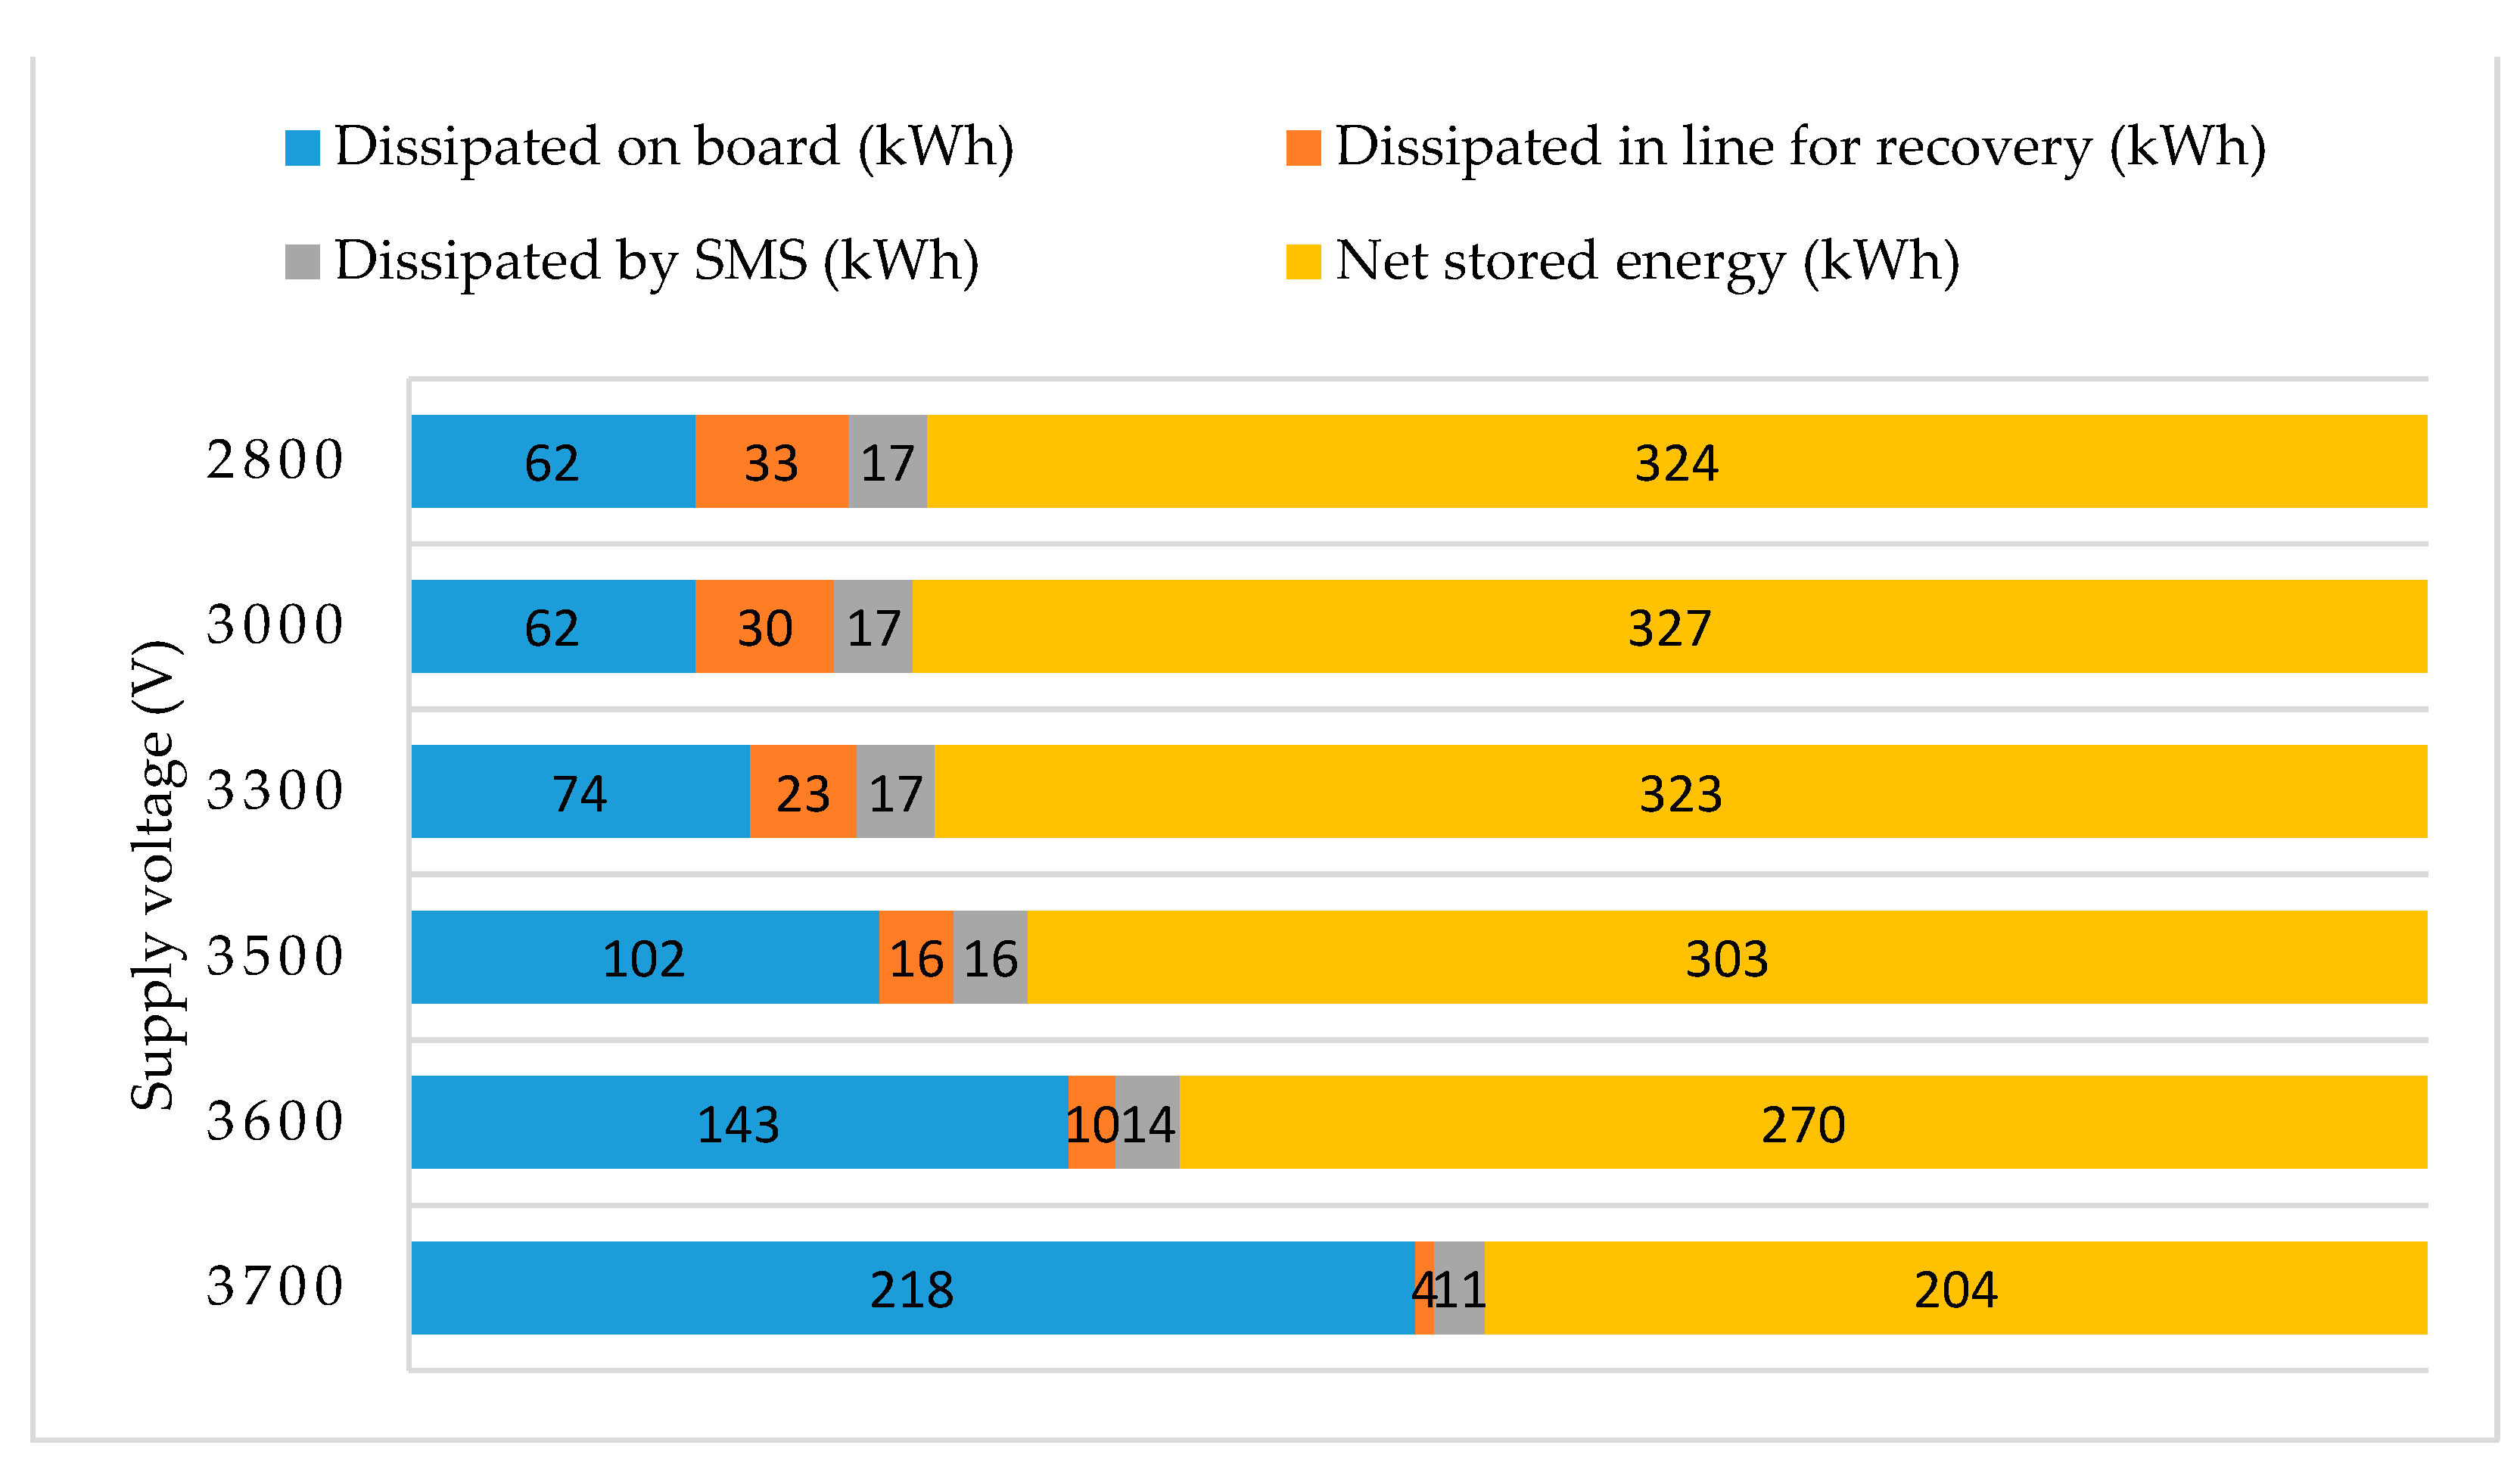
Figure 9 provides the stored energy shares and the losses during the braking phase for a configuration of the line with two operating ESSs, installed in Cesena and Imola, respectively. Note that as mentioned before, reducing voltage under 3300 does not give substantial improvements, because the increment in recovery is almost completely canceled by the increase in losses (the total dissipated on the line and by the SMS).
Regardless, to complete the energy balance and to correctly evaluate the actual convenience of a voltage reduction, as previously motivated, the additional losses during traction phase have to be evaluated. To this aim, the model has been modified, adding a simplified substation model as shown in Figure 10, in order to take into account the traction phase. It is based on a series connection of a voltage source with a diode and a resistor of , that is the equivalent source resistance (Req) provided in the EN 50641 standard [27].
The net balance is positive and with a voltage reduction of about 25% (2800 V), the net stored energy was incremented of about 160% (274 kWh). With a voltage level of 2800 V, the on-board dissipation drops to 91 kWh (21% of the braking energy), but 72 kWh (16.5% of the braking energy) is still dissipated by line and SMS in total. To reduce such amount of energy waste or to obtain the same recovery requirements with a higher voltage level, it is possible to consider the installation of two energy storage devices. The model reported in Figure 10 schematizes a single substation, anyway under the hypothesis of same Vsub for all the substations, the model can be extended simply accounting the comprehensive resistive path as the parallel connection of the resistive paths related to each substation. Without the adoption of a ESS, the losses estimated with this model of the line, due to the measured traction current, resulted in 56 kWh.
To analyze the energy dissipation introducing a ESS, it is important to define the strategy adopted to manage the stored energy. In fact, the ESS is charged during the braking phases while delivers energy in the following traction stage. Two different simplified control strategies for the discharging process of the system are considered in the following: the first strategy is based on the assumption that, when the ESS is charged, it operates in concurrence with all the other substations to supply the train, while, according to the second strategy, the ESS is used as priority source so that only when it is fully discharged, other sources supply the train.
As for dissipation, Table 1 reports a comprehensive analysis of the losses during traction, taking into account the different discharge strategies and the adoption of one or two ESSs. The first column reports values very close to the one estimated during traction without ESS, so the simple introduction of these devices has a minor impact on losses. On the contrary, it can be noted that the voltage reduction has a more remarkable impact, in fact the losses reach a value of 133 kWh for 2800 V of supply voltage in case of energy ESS not prioritized. Regardless, the increase is more pronounced with prioritization. Moreover, as it can be noted from the last two rows in Table 1, the adoption of two ESSs limits the increase in losses for lower voltage levels. To compare the improvement in energy savings, taking into account both storage and losses, in Table 2 the saved energies for the whole system are reported, net of the 56 kWh that would have been dissipated anyway without ESS. For higher voltage values, the adoption of two ESSs triples (3700 V) or doubles (3600 V) the net amount of energy saved. Beyond a certain level of reduction, the increment in energy recovery was cancelled by additional losses and, therefore, there are no benefits from further reductions. The optimum levels are indicated in Table 2 in bold type. They are 3000 V for a single ESS both in case of prioritized ESS and concurrent system. Instead, in case of two ESSs operating on the line, the voltage level that maximizes the net saved energy is 3300 V.
The uncertainty on the measured quantity Pbra has lower influence on the system with respect to the variability of R(d). In fact, R(d) computed as in (6), takes into account resistance of rail, catenary, contact, etc., all parameters that can greatly vary with wear, environmental factor and/or specific implementation characteristics. To evaluate the sensitivity of the model to the variability of input parameters a traditional worst-case tolerance analysis has been performed considering all possible permutations for both Pbra and R. The individual variables are placed at their tolerance limits in order to make the measurement as large or as small as possible. The worst-case model does not consider the distribution of the individual variables, but rather that those variables do not exceed their respective limits. To establish the interval of tolerance for Pbra, the uncertainties on voltage and current have been propagated on the braking power for each position of the train, then tolerance on Pbra has been determined multiplying the propagated uncertainty by thus assuming a uniform distribution. For what regard kilometric resistance, a 10% of tolerance has been considered [26]. In Table 1 and Table 2 has been reported the tolerance as result of the difference between the maximum and the minimum obtained on the multiple executions. After choosing the optimum voltage level, last crucial aspect in the ESS design is to determine its optimal sizing [28]. An accurate knowledge of the power fluxes is fundamental to carry out a fine-tuned analysis for dimensioning the ESS: oversizing could lead to an unnecessary volume and costs increase, while an undersized ESS can considerably increase the energy dissipated in the rheostats on-board trains and, consequently, limit the energy recovered.
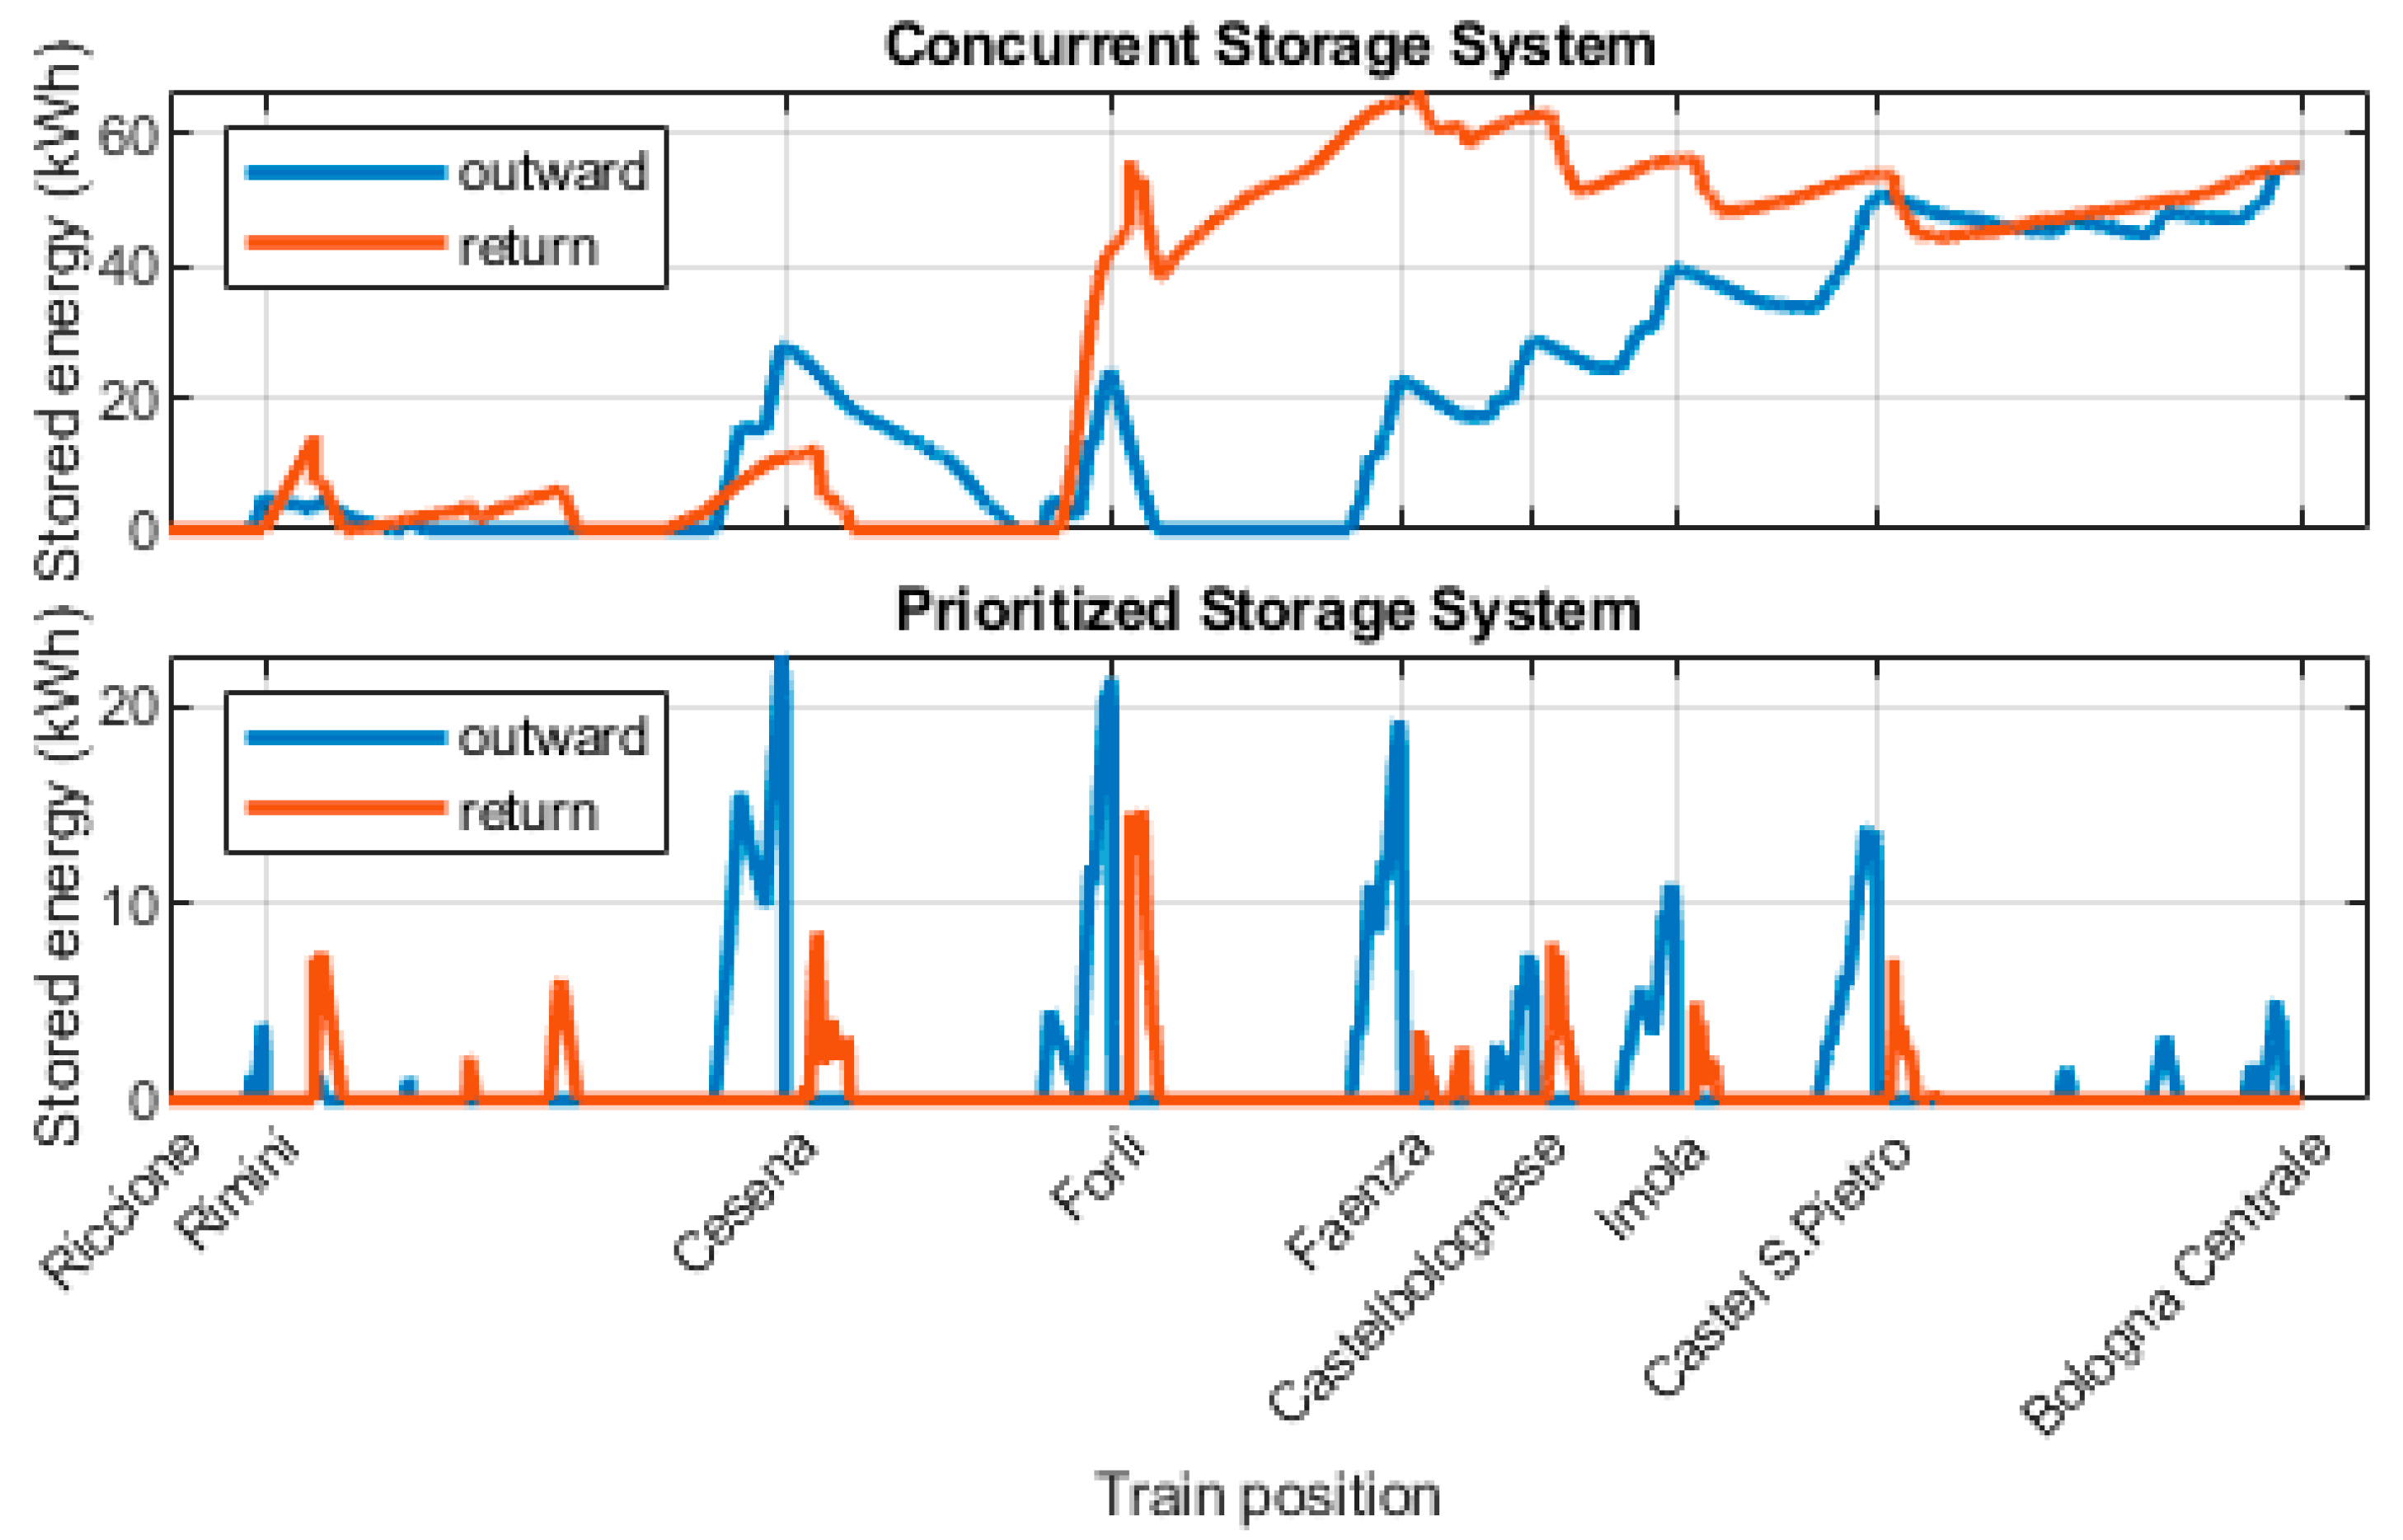
The sizing method must take into account that the ESS is charged during the braking phases while delivers energy when there are trains in traction on the line, so not all the net saved energy must be contemporarily stored. Moreover, the size depends also on the strategy adopted to manage the stored energy. Figure 11 reports the level of stored energy adopting the different strategies versus time with one ESS and a substation voltage level of 3300 V. In the upper chart in Figure 11, if the ESS operates in concurrence with the other supply systems on the line, it reaches a peak value of stored energy of 67 kWh and its likelihood of discharging is limited, because it is in competition with other energy sources. Instead, if the energy in the ESS is delivered with a higher priority with respect to the other supply systems (lower chart in Figure 11), the peak value of energy stored during the round trip is 22.6 kWh. In fact, a prioritized usage of the ESS facilitates its charge and discharge cycles.
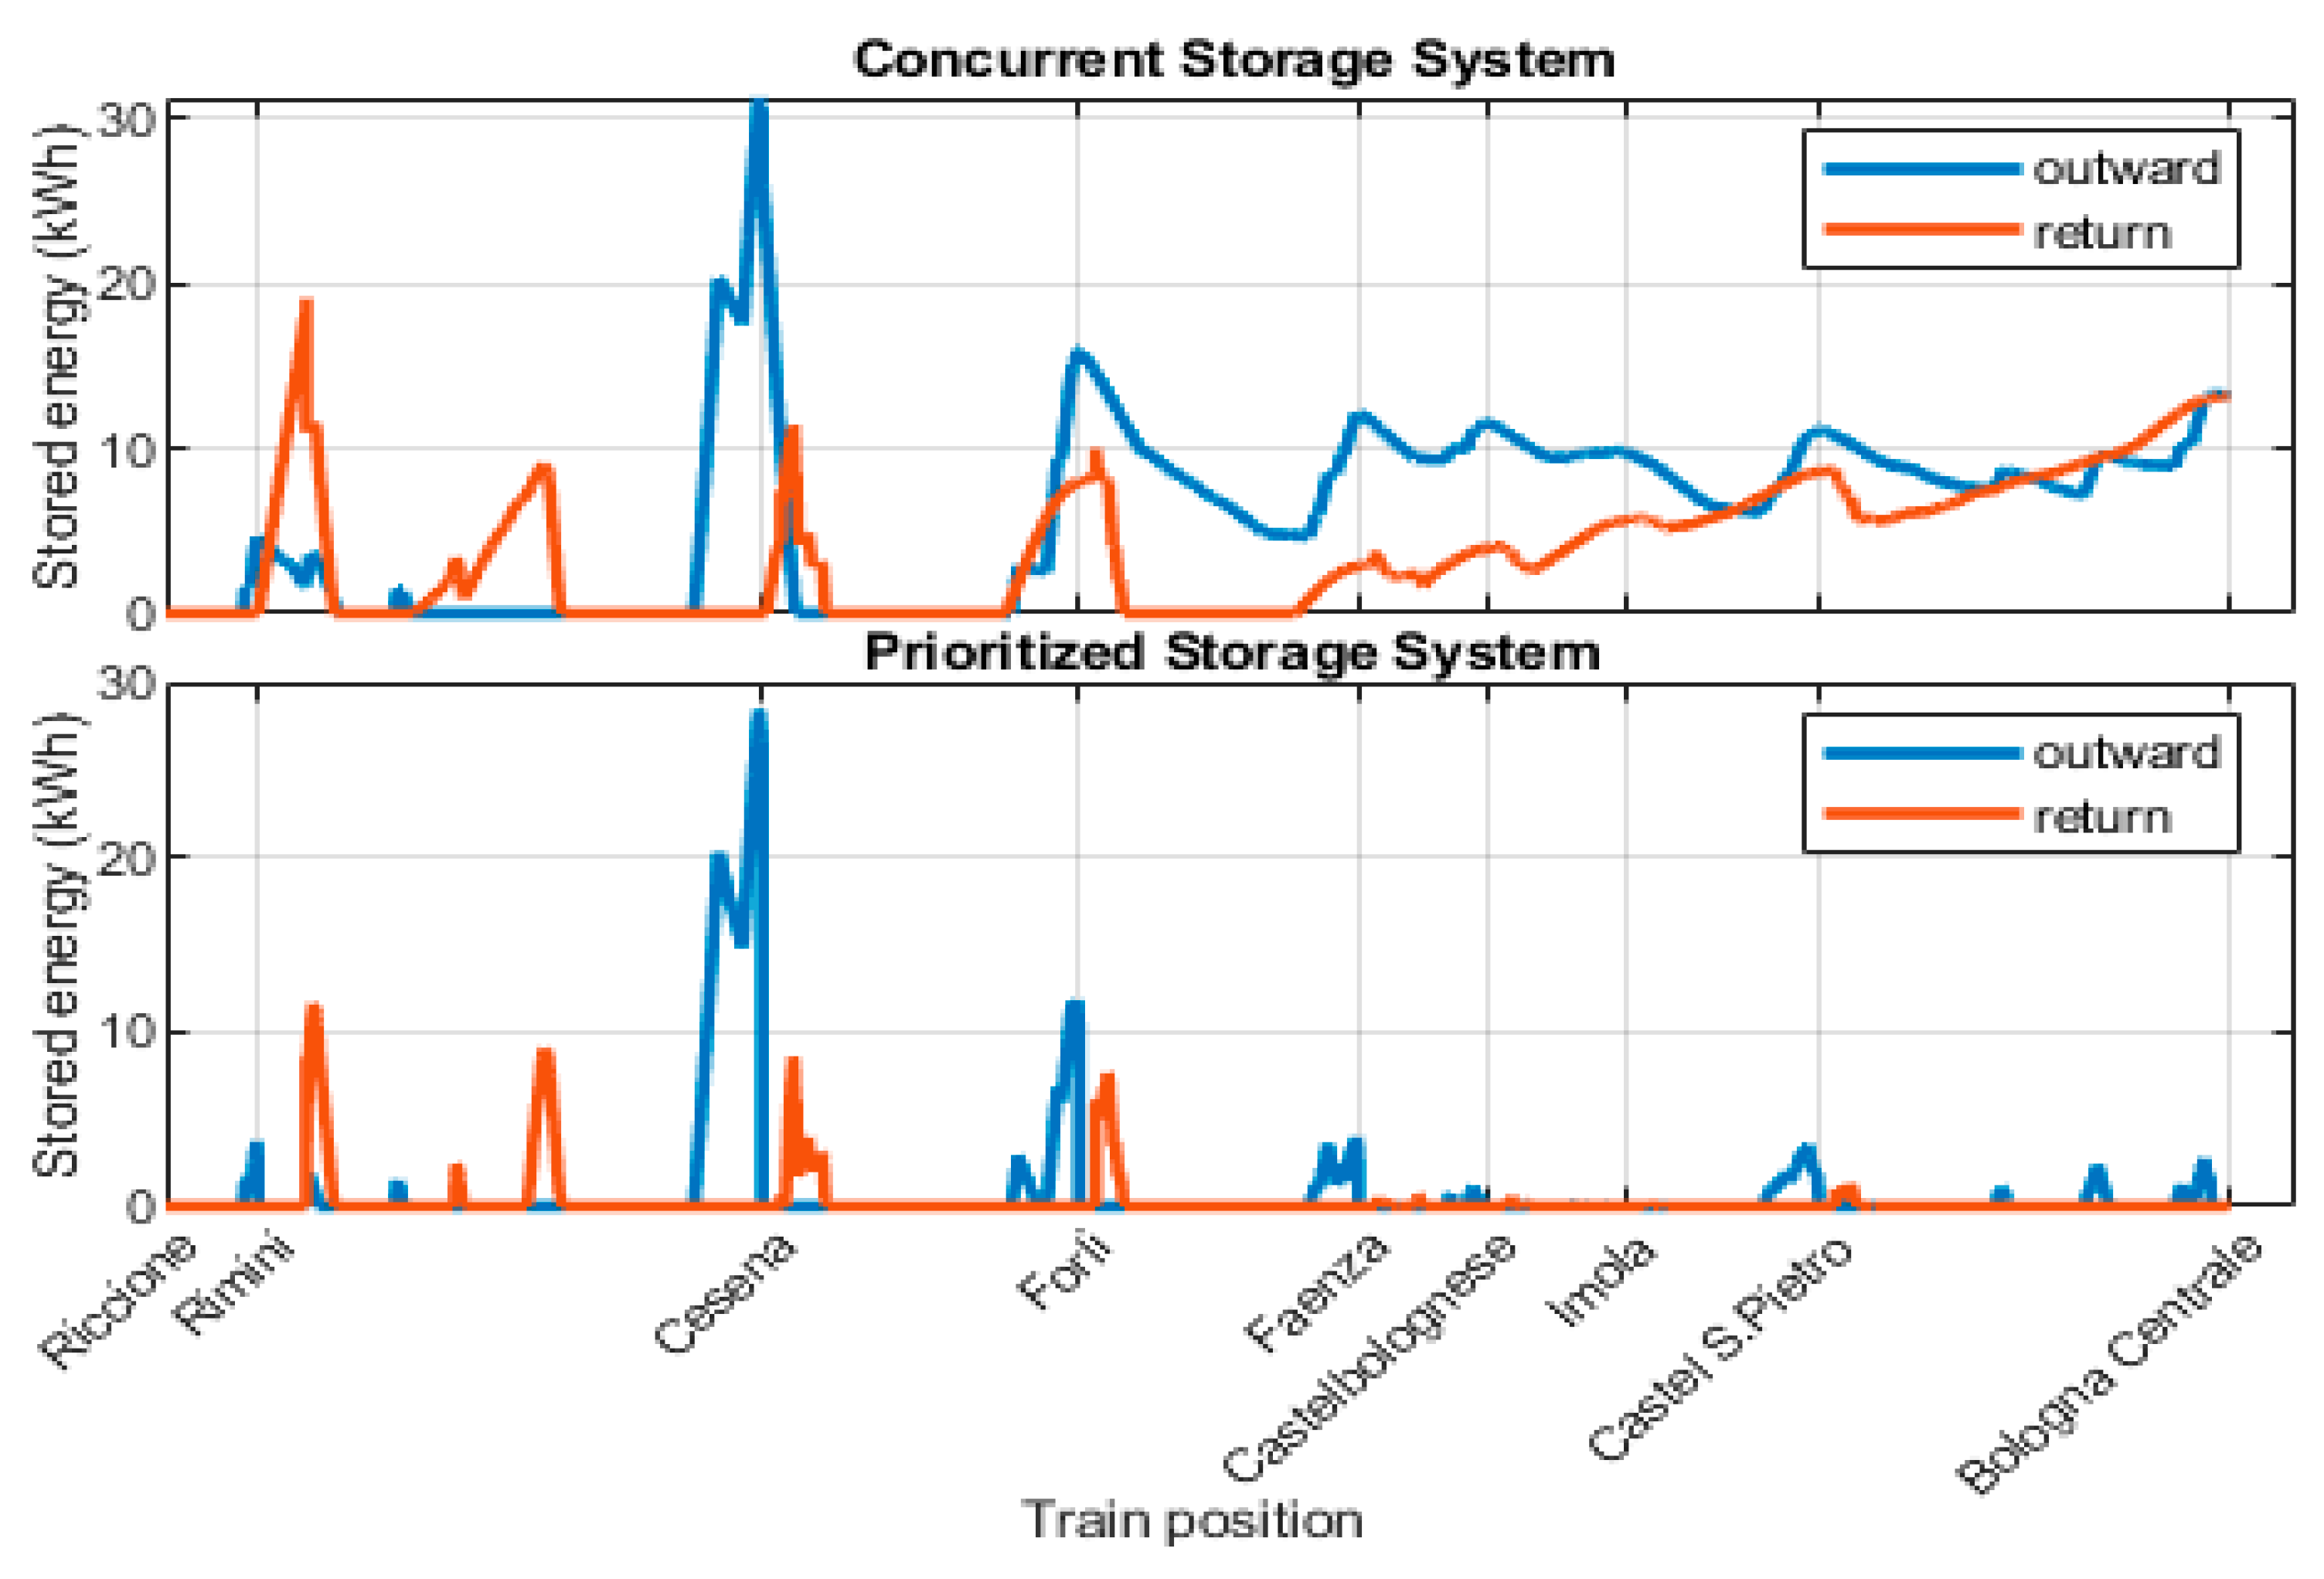
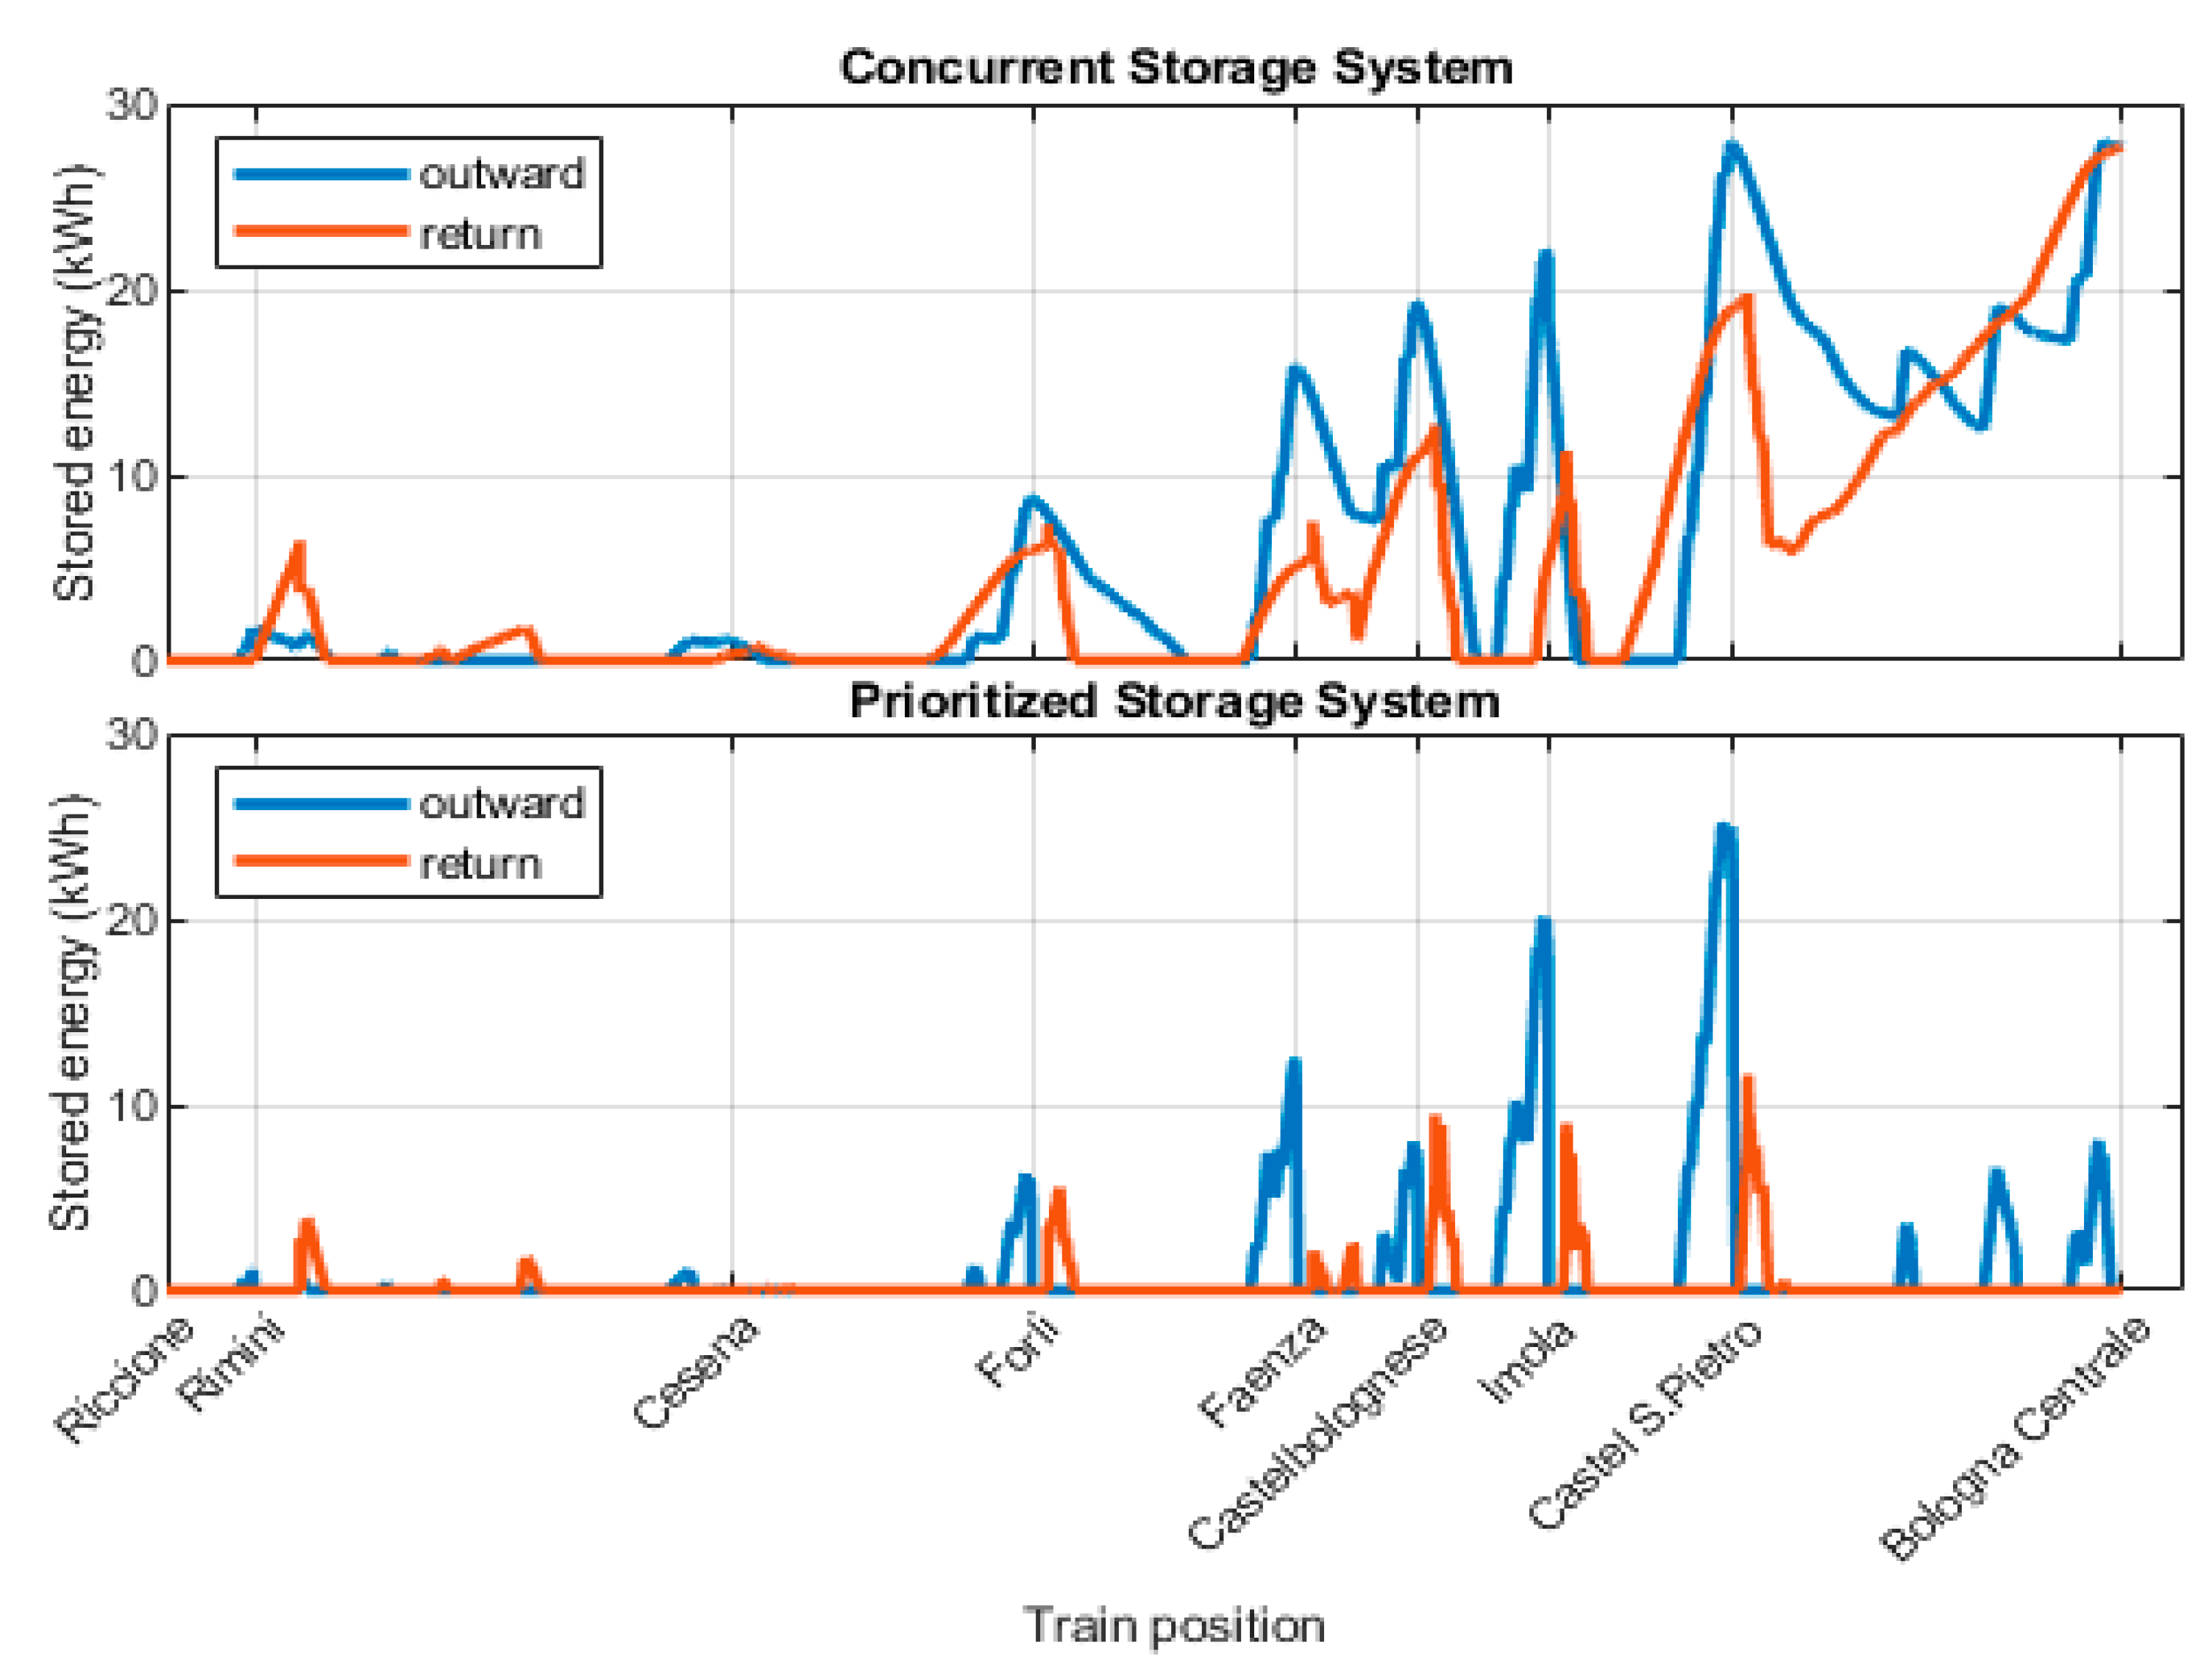
The same analysis has been carried out also in case of two ESSs. In Figure 12 and Figure 13 are separately provided the values of energy accumulated in the two ESSs during the round trip. As it can be noted, in case of concurrent strategy (see upper charts), both the ESSs have to manage a lower amount of energy on average, and the peak values reached are of 31.2 kWh and 27.9 kWh, respectively.
Conversely, with a prioritized control strategy (lower charts), the peak levels reached in case of two ESSs (28.4 kWh and 25.2 kWh) are comparable with the case of one ESS, but with a much lower average stored energy. In order to recover the maximum amount of energy, the ESS size has to be close to the maximum value obtained during the time.
It is be worth noting that, for this specific application, the employment of two ESSs allows for the installation of systems with reduced size compared to the case with one ESS. For the prioritized management, the comparison between the case with two ESSs and that with one, can be misleading. In fact, it seems that in the case with two ESSs, it needs greater peak energies but the total recovery is considerably higher; therefore, they are not directly comparable. However, economic considerations can lead also to the adoption of systems with size enough to cover the peak level only with a certain probability (e.g. 95% percentiles). This aspect is not explored because it is outside the scope of this paper. Detailed analyses on the cost model for different energy storage technologies can be found in [29].
4. Conclusions
This paper discusses a methodology based on experimental data measured on-board train quantifying the amount of energy that can be recovered adopting ESSs located in supply substations along a well-defined railway line. The procedure allows to determine the optimal position of one or two ESSs varying the operating voltage of the line. The only addition of a stationary ESS, keeping the current working conditions of the line, allows a recovery of the 35% of braking energy (compared to the 5% without ESS). To further increase the amount of recovered energy, an optimal value for supply voltage, as tradeoff between the losses in the catenary and the energy surplus that can be potentially recovered, was proposed. In case of two ESSs, the optimal voltage level is very close to the actual level of the line. Finally, the optimal sizing of the ESS was calculated taking into account the charging and discharging cycles during the time. The results show that, in the considered case study, the employment of one more ESSs (two instead of one) allows for an increase in the energy recovery by 38% with a lower total installed capacity 59 vs. 67 kWh (see case of concurrent strategy at 3300 V in Table 2). Moreover, the results show that the optimal sizing heavily depends on the control strategy used to manage the stored energy. A prioritized strategy highly reduces the size of ESS with a limited increase in the losses.
Author Contributions
All authors contributed in the same way to the research activity. All authors have read and agreed to the published version of the manuscript.
Funding
This research was funded by EMPIR program co-financed by the participating countries and the European Union’s Horizons 2020 research and innovation program, project name MyRailS, grant number 16ENG04.
Institutional Review Board Statement
Not applicable.
Informed Consent Statement
Not applicable.
Data Availability Statement
The data presented in this study are available on request from the corresponding author.
Acknowledgments
The authors wish to thank Domenico Giordano and Davide Signorino of INRIM for their precious contribution in the collection of experimental data.
Conflicts of Interest
The authors declare no conflict of interest.
Nomenclature
| ESS | Energy Storage System |
| VP | Pantograph voltage |
| IP | Pantograph current |
| IRA | Current in the first rheostat |
| IRB | Current in the second rheostat |
| VF | Voltage after the filter inductance |
| VHF | Half filter voltage |
| R | Resistance between train and ESS |
| d | Distance between train and ESS |
| xtrain | Position of the train |
| xsub | Position of the ESS |
| Pinj | Power injected by the train |
| Pbr | Braking power |
| Pdis | Power dissipated on-board train |
| Vsub | Supply voltage of the substation |
| Ps | Stored power |
| SMS | Storage Management System |
| µ | SMS efficiency |
| Vmax | Maximum value of the voltage at the pantograph |
| Ip,max | Maximum value of the pantograph current |
| Pinj,max | Maximum value of the injected power |
| r | Line kilometric resistance |
| rc | Contact line resistance |
| rt | Track resistance |
| Sc | Cross section of the line |
| Resistivity of the copper | |
| m | mass per m of the track |
| Req | Equivalent source resistance of the substation model |
References
- Cascetta, F.; Cipolletta, G.; Delle Femine, A.; Gallo, D.; Giordano, D.; Signorino, D. Measuring the impact of reversible substations on energy efficiency in rail Transp. In Proceedings of the 24th IMEKO TC4 International Symposium, Palermo, Italy, 14–16 September 2020. [Google Scholar]
- Su, S.; Wang, X.; Cao, Y.; Yin, J. An Energy-Efficient Train Operation Approach by Integrating the Metro Timetabling and Eco-Driving. IEEE Trans. Intell. Transp. Syst. 2020, 21, 4252–4268. [Google Scholar] [CrossRef]
- Dominguez, M.; Fernández-Cardador, A.; Cucala, A.P.; Pecharroman, R.R. Energy Savings in Metropolitan Railway Substations Through Regenerative Energy Recovery and Optimal Design of ATO Speed Profiles. IEEE Trans. Autom. Sci. Eng. 2012, 9, 496–504. [Google Scholar] [CrossRef]
- Popescu, M.; Bitoleanu, A. A Review of the Energy Efficiency Improvement in DC Railway Systems. Energies 2019, 12, 1092. [Google Scholar] [CrossRef] [Green Version]
- Oura, Y.; Mochinaga, Y.; Nagasawa, H. Railway electric power feeding systems. Jpn. Railway Transp. Rev. 1998, 16, 48–58. [Google Scholar]
- Kleftakis, V.A.; Hatziargyriou, N.D. Optimal control of reversible substations and wayside storage devices for voltage stabilization and energy savings in metro railway networks. IEEE Trans. Transp. Electrif. 2019, 5, 515–523. [Google Scholar] [CrossRef]
- Song, Y.; Wang, Z.; Liu, Z.; Wang, R. A spatial coupling model to study dynamic performance of pantograph-catenary with vehicle-track excitation. Mech. Syst. Signal Process. 2021, 151, 107336. [Google Scholar] [CrossRef]
- Cipolletta, G.; Delle Femine, A.; Gallo, D.; Landi, C.; Luiso, M.; Gallo, A.; Pastena, L.; Balic, F.; Fernández, J.Q.; Giordano, D.; et al. Monitoring a DC Train Supplied by a Reversible Substation. In Proceedings of the 2020 IEEE International Instrumentation and Measurement Technology Conference (I2MTC), Dubrovnik, Croatia, 25–28 May 2020. [Google Scholar]
- Wang, H.; Zhu, G.; Fu, X.; Ma, S.; Wang, H. Waveform control method for mitigating harmonics of inverter systems with nonlinear load. In Proceedings of the IECON 2015—41st Annual Conference of the IEEE Industrial Electronics Society, Yokohama, Japan, 9–12 November 2015. [Google Scholar]
- Ogura, K.; Nishimura, K.; Oku, Y. A Bidirectional DC-DC Converter for Battery Electric Light Rail Vehicle and Its Test Run Results. In Proceedings of the IEEE 13th International Conference on Power Electronics and Drive Systems (PEDS), Toulouse, France, 9–12 July 2019. [Google Scholar]
- Wu, C.; Lu, S.; Xue, F.; Jiang, L.; Chen, M. Optimal Sizing of Onboard Energy Storage Devices for Electrified Railway Systems. IEEE Trans. Transp. Electrif. 2020, 6, 1301–1311. [Google Scholar] [CrossRef]
- Khodaparastan, M.; Dutta, O.; Saleh, M.; Mohamed, A.A. Modeling and simulation of DC electric rail transit systems with wayside energy storage. IEEE Trans. Veh. Technol. 2019, 68, 2218–2228. [Google Scholar] [CrossRef]
- 1887–2017—IEEE Guide for Wayside Energy Storage Systems for DC Traction Applications; IEEE: Piscataway, NJ, USA, 2017; pp. 1–50. [CrossRef]
- Kobayashi, H.; Kondo, K.; Iannuzzi, D. A Theoretical Analysis on Dynamic and Static Characteristics of Control Strategies for Wayside Energy Storage System in DC-electrified Railway. In Proceedings of the 2018 IEEE International Conference on Electrical Systems for Aircraft, Railway, Ship Propulsion and Road Vehicles & International Transportation Electrification Conference, Nottingham, UK, 7–9 November 2018. [Google Scholar]
- Roch-Dupré, D.; Gonsalves, T.; Cucala, A.P.; Pecharromán, R.R.; López-López, Á.J.; Fernández-Cardador, A. Determining the optimum installation of energy storage systems in railway electrical infrastructures by means of swarm and evolutionary optimization algorithms. Int. J. Electr. Power Energy Syst. 2021, 124, 106295. [Google Scholar] [CrossRef]
- Spalvieri, C.; Rossetta, I.; Lamedica, R.; Ruvio, A.; Papalini, A. Train braking impact on energy recovery: The case of the 3 kV d.c. railway line Roma-Napoli via Formia. In Proceedings of the 2019 AEIT International Annual Conference (AEIT), Florence, Italy, 18–20 September 2019. [Google Scholar]
- Shen, X.; Wei, H.; Lie, T.T. Management and Utilization of Urban Rail Transit Regenerative Braking Energy based on the Bypass DC Loop. IEEE Trans. Transp. Electrif. 2020. [Google Scholar] [CrossRef]
- Calderaro, V.; Galdi, V.; Graber, G.; Piccolo, A.; Capasso, A.; Lamedica, R.; Ruvio, A. Energy management of Auxiliary Battery Substation supporting high-speed train on 3 kV DC systems. In Proceedings of the 2015 International Conference on Renewable Energy Research and Applications (ICRERA), Palermo, Italy, 22–25 November 2015. [Google Scholar]
- Wu, T.; Liu, W.; Zhang, J.; Li, Y.; Li, T.; He, B. Analysis of Wayside Energy Storage System in DC Traction Power Supply System. In Proceedings of the 2019 IEEE Vehicle Power and Propulsion Conference (VPPC), Hanoi, Vietnam, 14–17 October 2019. [Google Scholar]
- Calderaro, V.; Galdi, V.; Graber, G.; Piccolo, A. Optimal siting and sizing of stationary supercapacitors in a metro network using PSO. In Proceedings of the 2015 IEEE International Conference on Industrial Technology (ICIT), Seville, Spain, 17–19 March 2015. [Google Scholar]
- Torres, J.; Moreno-Torres, P.; Navarro, G.; Blanco, M.; Lafoz, M. Fast Energy Storage Systems Comparison in Terms of Energy Efficiency for a Specific Application. IEEE Access 2018, 6, 40656–40672. [Google Scholar] [CrossRef]
- Ciccarelli, F.; Del Pizzo, A.; Iannuzzi, D. Improvement of energy efficiency in light railway vehicles based on power management control of wayside lithium-ion capacitor storage. IEEE Trans. Power Electr. 2014, 29, 275–286. [Google Scholar] [CrossRef]
- Li, Z.; Hoshina, S.; Satake, N.; Nogi, M. Development of DC/DC Converter for Battery Energy Storage Supporting Railway DC Feeder Systems. IEEE Trans. Ind. Appl. 2016, 52, 4218–4224. [Google Scholar] [CrossRef]
- Cui, G.; Luo, L.; Liang, C.; Hu, S.; Li, Y.; Cao, Y.; Xie, B.; Xu, J.; Zhang, Z.; Liu, Y.; et al. Supercapacitor Integrated Railway Static Power Conditioner for Regenerative Braking Energy Recycling and Power Quality Improvement of High-Speed Railway System. IEEE Trans. Transp. Electrif. 2019, 5, 702–714. [Google Scholar] [CrossRef]
- CEI EN 50163:2006+A1:2008. Railway Applications—Supply Voltages of Traction Systems; Comitato Elettrotecnico Italiano, (CEI): Geneve, Switzerland, 2006. [Google Scholar]
- Brenna, M.; Foiadelli, F.; Zaninelli, D. Electrical Railway Transportation Systems; Wiley-IEEE Press: Munich, Germany, 2018. [Google Scholar]
- BS EN 50641:2020. Railway Applications. Fixed Installations. Requirements for the Validation of Simulation Tools Used for the Design of Electric Traction Power Supply Systems; British Standards Institution (BSI): Stevenage, UK, 2020. [Google Scholar]
- de la Torre, S.; Sánchez-Racero, A.J.; Aguado, J.A.; Reyes, M.; Martínez, O. Optimal Sizing of Energy Storage for Regenerative Braking in Electric Railway Systems. IEEE Trans. Power Syst. 2015, 30, 1492–1500. [Google Scholar] [CrossRef]
- Mostafa, M.H.; Aleem, S.H.A.; Ali, S.G.; Ali, Z.M.; Abdelaziz, A.Y. Techno-economic assessment of energy storage systems using annualized life cycle cost of storage (LCCOS) and levelized cost of energy (LCOE) metrics. J. Energy Storage 2020, 29, 101345. [Google Scholar] [CrossRef]
Figure 1.
(a) Electrical scheme of E464 locomotive; (b) Simplified representation of the on-board train measurement system.
Figure 1.
(a) Electrical scheme of E464 locomotive; (b) Simplified representation of the on-board train measurement system.

Figure 2.
Braking power along the line Bologna–Rimini.

Figure 3.
Power fluxes during a braking event.

Figure 4.
(a) Schematic representation of the line with a simplified representation of the regenerative braking; (b) Simplified model of the line with a stationary ESS.
Figure 4.
(a) Schematic representation of the line with a simplified representation of the regenerative braking; (b) Simplified model of the line with a stationary ESS.

Figure 5.
Stored energy vs. ESS location for different value of substation voltage.

Figure 6.
Energy analysis with a stationary ESS in Forlì on varying the supply line voltage.

Figure 7.
Recovered energy on varying the location of the two ESSs with the actual supply voltage level.
Figure 7.
Recovered energy on varying the location of the two ESSs with the actual supply voltage level.

Figure 8.
Recovered energy on varying the location of the two ESSs with 3300 V as supply voltage level.
Figure 8.
Recovered energy on varying the location of the two ESSs with 3300 V as supply voltage level.

Figure 9.
Energy analysis with two stationary ESSs in Cesena and Imola on varying the supply line voltage.
Figure 9.
Energy analysis with two stationary ESSs in Cesena and Imola on varying the supply line voltage.

Figure 10.
Schematic of the train running between the substation and the ESS.

Figure 11.
Level of energy in the ESS during the round trip on the line Bologna–Rimini.

Figure 12.
Energy stored in the ESS in the substation of Cesena during the round trip.

Figure 13.
Amount of energy in the ESS in the substation of Imola during the round trip.


Table 1.
Energy dissipated on the line in traction.
| Substation Voltage (V) | 3700 | 3600 | 3500 | 3300 | 3000 | 2800 |
|---|---|---|---|---|---|---|
| 1 ESS not prioritized (kWh) | 53 ± 3 | 55 ± 3 | 58 ± 3 | 64 ± 3 | 77 ± 4 | 90 ± 5 |
| 1 ESS prioritized (kWh) | 57 ± 3 | 63 ± 3 | 71 ± 3 | 85 ± 4 | 112 ± 5 | 133 ± 5 |
| 2 ESSs not prioritized (kWh) | 52 ± 3 | 53 ± 3 | 56 ± 3 | 62 ± 3 | 77 ± 4 | 89 ± 5 |
| 2 ESSs prioritized (kWh) | 56 ± 3 | 63 ± 2 | 69 ± 3 | 80 ± 4 | 99 ± 5 | 114 ± 5 |
Table 2.
Net amount of saved energy for the whole system.
| Substation Voltage (V) | 3700 | 3600 | 3500 | 3300 | 3000 | 2800 |
|---|---|---|---|---|---|---|
| 1 ESS not prioritized (kWh) | 109 ± 6 | 156 ± 7 | 188 ± 8 | 229 ± 9 | 247 ± 9 | 240 ± 9 |
| 1 ESS prioritized (kWh) | 105 ± 6 | 148 ± 7 | 175 ± 8 | 208 ± 9 | 212 ± 10 | 197 ± 10 |
| 2 ESSs not prioritized (kWh) | 208 ± 7 | 272 ± 8 | 303 ± 7 | 316 ± 6 | 306 ± 5 | 291 ± 6 |
| 2 ESSs prioritized (kWh) | 204 ± 7 | 262 ± 8 | 290 ± 7 | 299 ± 6 | 284 ± 6 | 266 ± 7 |
Publisher’s Note: MDPI stays neutral with regard to jurisdictional claims in published maps and institutional affiliations. |
© 2021 by the authors. Licensee MDPI, Basel, Switzerland. This article is an open access article distributed under the terms and conditions of the Creative Commons Attribution (CC BY) license (https://creativecommons.org/licenses/by/4.0/).
Share and Cite
MDPI and ACS Style
Cipolletta, G.; Delle Femine, A.; Gallo, D.; Luiso, M.; Landi, C. Design of a Stationary Energy Recovery System in Rail Transport. Energies 2021, 14, 2560. https://0-doi-org.brum.beds.ac.uk/10.3390/en14092560
AMA Style
Cipolletta G, Delle Femine A, Gallo D, Luiso M, Landi C. Design of a Stationary Energy Recovery System in Rail Transport. Energies. 2021; 14(9):2560. https://0-doi-org.brum.beds.ac.uk/10.3390/en14092560
Chicago/Turabian StyleCipolletta, Giuliano, Antonio Delle Femine, Daniele Gallo, Mario Luiso, and Carmine Landi. 2021. "Design of a Stationary Energy Recovery System in Rail Transport" Energies 14, no. 9: 2560. https://0-doi-org.brum.beds.ac.uk/10.3390/en14092560
Note that from the first issue of 2016, this journal uses article numbers instead of page numbers. See further details here.