
Assessment of the Radiotoxicity of Spent Nuclear Fuel from a Fleet of PWR Reactors


Faculty of Energy and Fuels, AGH University of Science and Technology, al. Mickiewicza 30, 30-059 Krakow, Poland
Energies 2021, 14(11), 3094; https://0-doi-org.brum.beds.ac.uk/10.3390/en14113094
Submission received: 22 April 2021
/
Revised: 16 May 2021
/
Accepted: 24 May 2021
/
Published: 26 May 2021
(This article belongs to the Special Issue Computer Simulation of Hybrid Energy System)
Abstract
:The paper presents the methodology for the estimation of the long-term actinides radiotoxicity and isotopic composition of spent nuclear fuel from a fleet of Pressurized Water Reactors (PWR). The methodology was developed using three independent numerical tools: the Spent Fuel Isotopic Composition database, the Nuclear Fuel Cycle Simulation System and the Monte Carlo Continuous Energy Burnup Code. The validation of spent fuel isotopic compositions obtained in the numerical modeling was performed using the available experimental data. A nuclear power embarking country benchmark was implemented for the verification and testing of the methodology. The obtained radiotoxicity reaches the reference levels at about 1.3 × 10⁵ years, which is common for the PWR spent nuclear fuel. The presented methodology may be incorporated into a more versatile numerical tool for the modeling of hybrid energy systems.
1. Introduction
The numerical modeling of a power system with nuclear power plants demands the inclusion of available tools to calculate the isotopic compositions and then the radiotoxicity of spent nuclear fuel from all power reactors. Information about the composition of spent fuel, and thus its radiotoxicity, is crucial for the design of the back-end fuel cycle and its infrastructure, e.g., the transport capabilities and mid- and long-term disposal options [1,2]. These kind of calculations may be performed using advanced numerical tools which require data related to the design envelope and operational history of each power reactor. These data are used as the input parameters for the creation of complex 3D numerical models and further computation using high-performance computers [3,4]. Therefore, prediction of the radiotoxicity of spent nuclear fuel during the operation and after the shutdown of all nuclear power reactors in a power system is quite challenging, especially considering the demand for a large collection of necessary data and expertise.
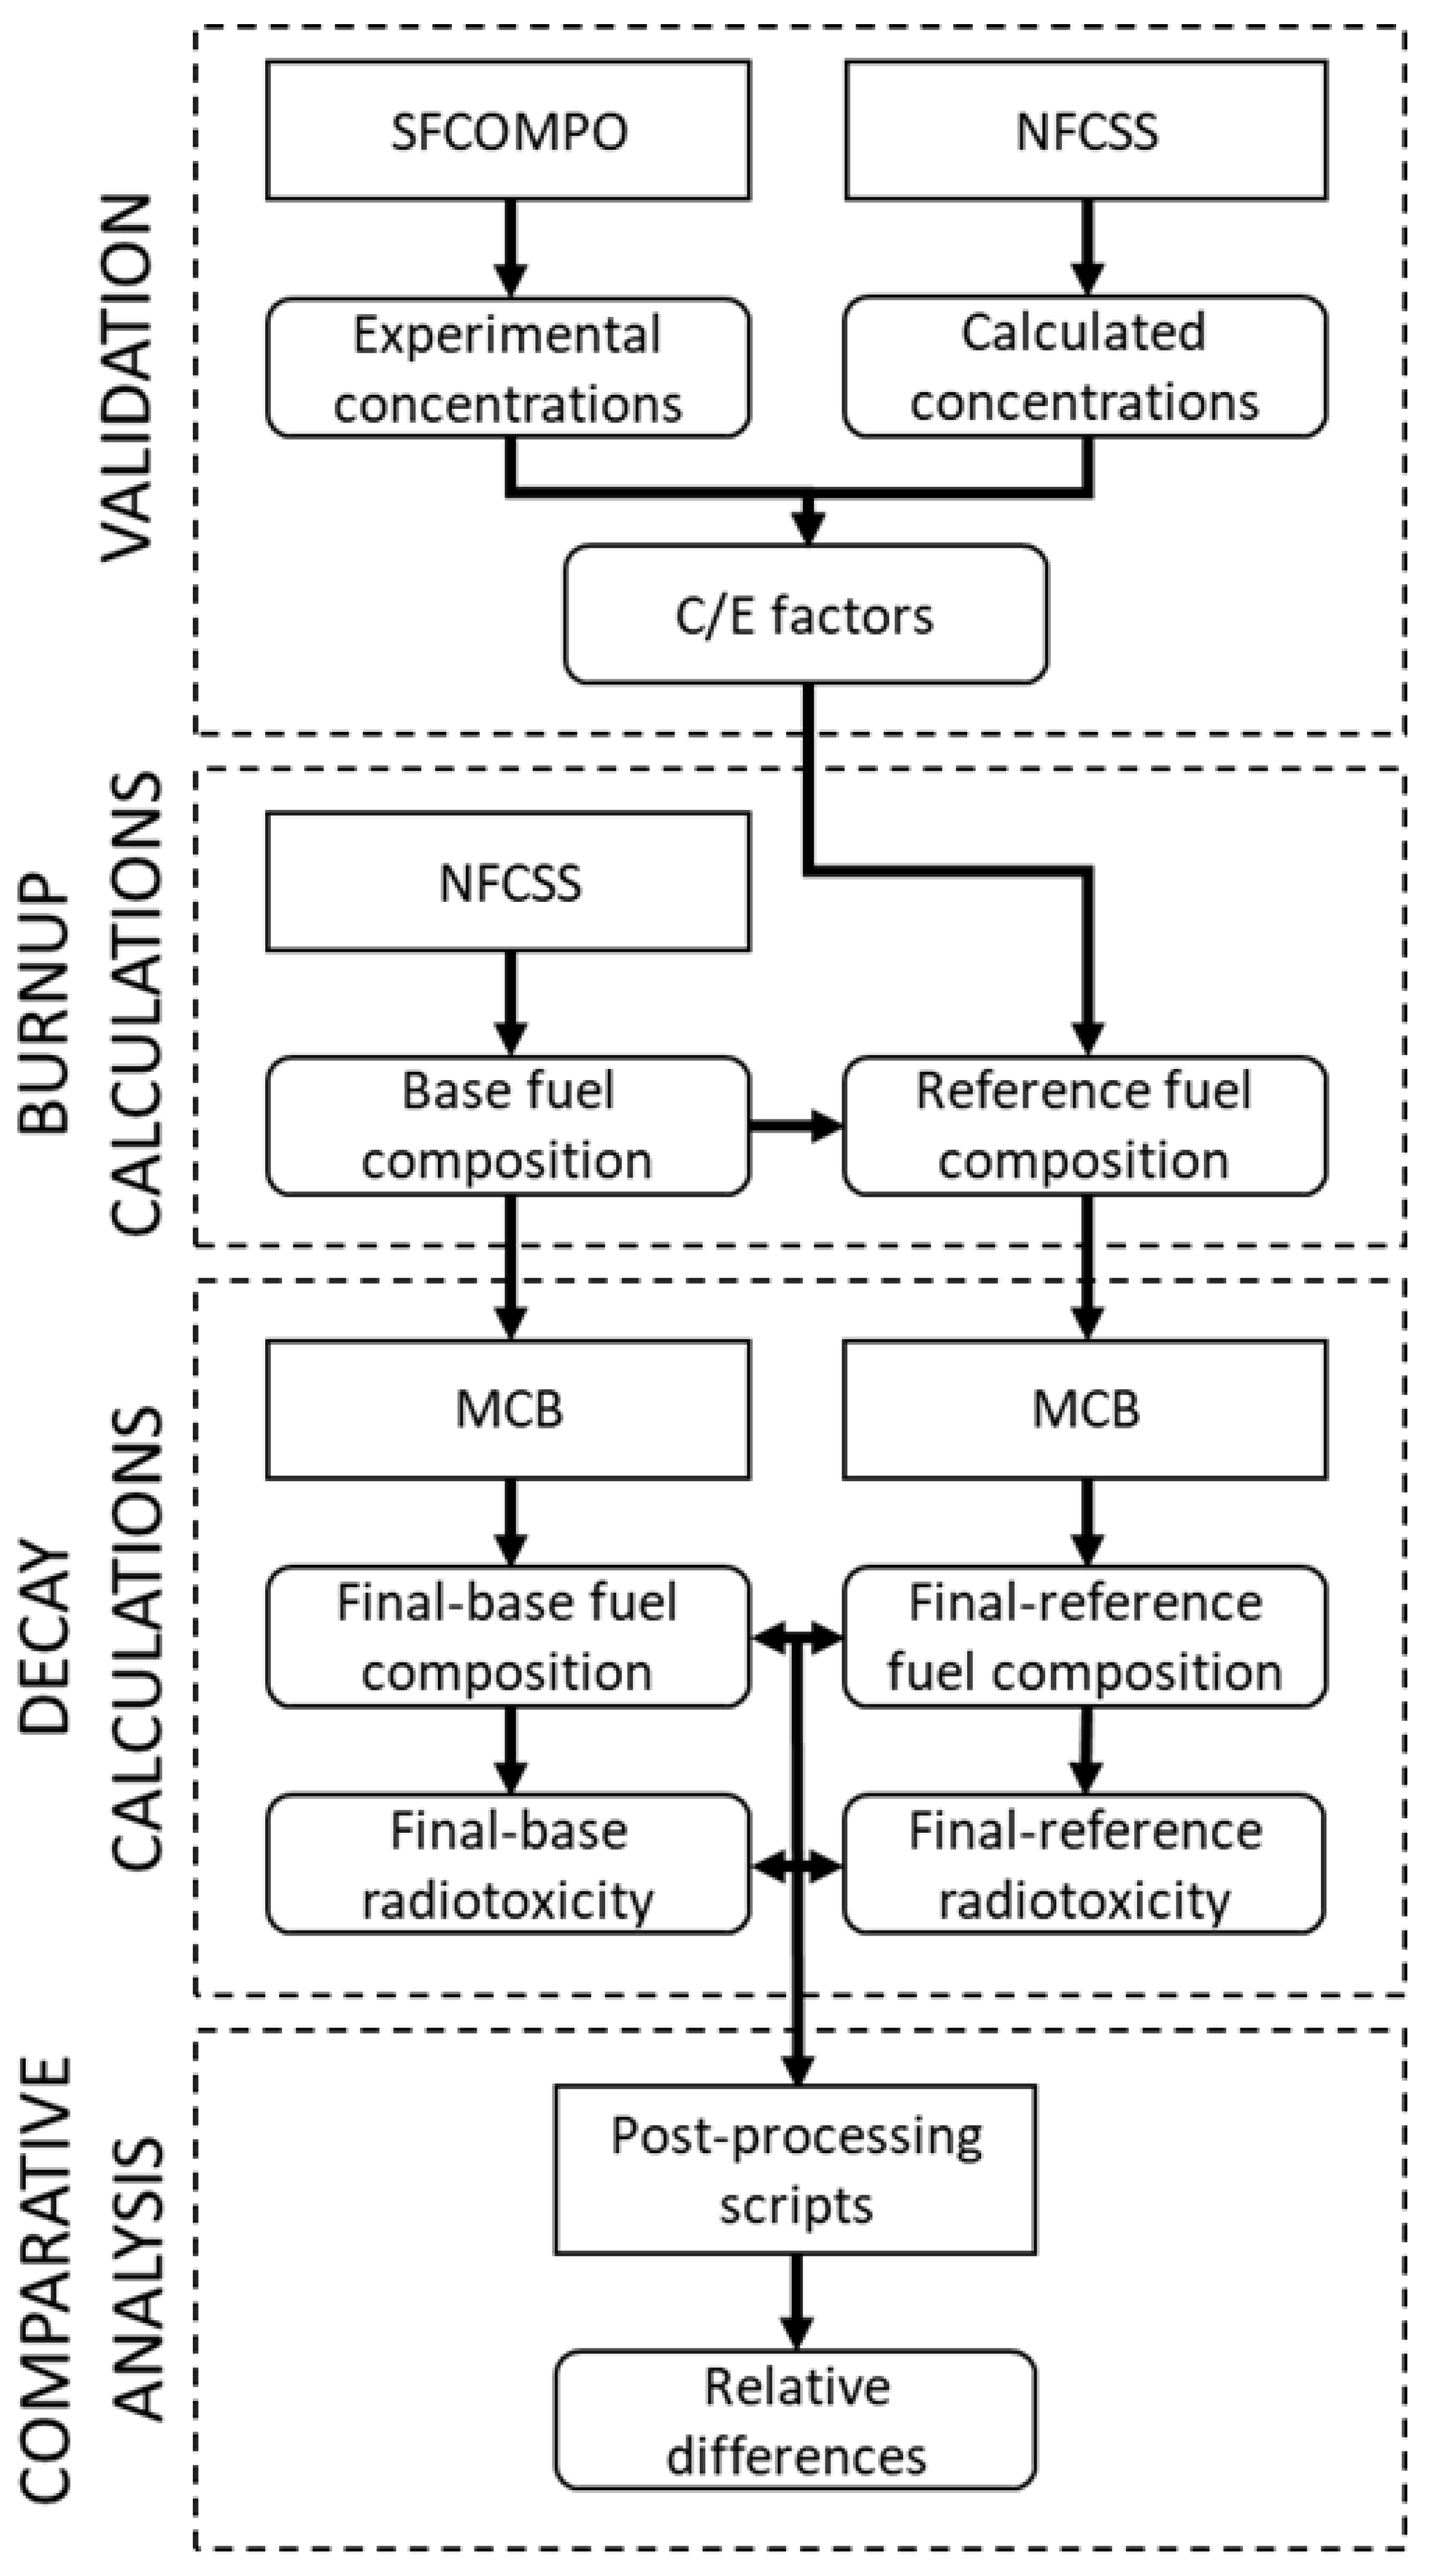
In the paper, a new methodology for the estimation of the long-term radiotoxicity of actinides in spent nuclear fuel is shown. The methodology provides a numerical set-up developed using three numerical tools. The key numerical tool is the Nuclear Fuel Cycle Simulation System (NFCSS) developed by the International Atomic Energy Agency (IAEA) [5]. NFCSS is a scenario-based code which allows for the numerical modeling of a nuclear power implementation scenario. The code contains the burnup module, which allows for calculations of spent fuel composition from various types of nuclear reactors and fuels. In the study, additional validation of the code was performed using the characteristics of the fuel samples available in the Spent Fuel Isotopic Composition database (SFCOMPO) operated by the Nuclear Energy Agency (NEA) [6]. Nowadays, the SFCOMPO is the most reliable database comprising the characteristics of spent nuclear fuel samples. It mainly contains the isotopic compositions of samples for given enrichment and burnup, obtained in the destructive assay. The evolution of the isotopic concentrations of the chosen actinides, as well as the radiotoxicity over one million years, were calculated using the Monte Carlo Continuous Energy Burnup Code (MCB) capable of decay calculations [7]. Figure 1 shows the schematic diagram of the developed methodology. The methodology was tested using a scenario for a nuclear power embarking country which plans to add about 9 GWel capacity using Pressurized Water Reactors (PWR). The input parameters for the scenario were based on the AP1000 reactor [8,9].
The methodology provides a numerical setup allowing for fast estimation of the final isotopic compositions and radiotoxicities of the legacy spent nuclear fuel after the closure of the nuclear power program. However, the results may be affected by an error related to the simplified approach in the numerical modeling of the reactor physics, which affects the final composition of spent nuclear fuel and thus its radiotoxicity. The aim of the paper is to present the developed methodology and to assess its reliability for possible usage as a nuclear power plant modeling component for advanced numerical tools for the modeling of hybrid power systems.
Section two focuses on the numerical tools used in the presented methodology. In section three, the developed benchmark for the methodology testing is described. The results of the numerical modeling are presented in section four. The outcome of the study is discussed and summarized in section five. Section six concludes the study.
2. Method
2.1. SFCOMPO
The Spent Fuel Isotopic Composition (SFCOMPO) database was used as the source of measured isotopic concentrations for the validation of the results obtained in the numerical simulations by means of the NFCSS system [10]. The SFCOMPO is managed by the Organization for Economic Cooperation and Development, Nuclear Energy Agency (OECD, NEA). The data incorporated in the SFCOMPO were strictly reviewed, qualified and standardized by the NEA Expert Group on Assay Data of Spent Nuclear Fuel (EGADSNF). Therefore, the database is nowadays the most reliable and comprehensive source of destructive assay data (radiochemical measurement) for the validation of numerical tools for nuclear inventory calculations. The database contains not only the measured isotopic concentrations but also the irradiation histories, as well as design data of fuel assemblies, fuel rods and fuel samples. This allows for a detailed reconstruction of the irradiation conditions for advanced physical codes for inventory calculations. The data are also suitable as an input for the validation of scenario-based codes like the NFCSS. The database contains 750 fuel samples obtained from 296 fuel rods embedded in 116 fuel assemblies and irradiated in 44 power reactors, which gives 24,000 measurement entries altogether. It is worth mentioning that the database is equipped with advanced plotting and visualization capabilities, which significantly facilitates the use of the available data.
2.2. NFCSS
The Nuclear Fuel Cycle Simulation System (NFCSS) is a numerical tool for the modeling of uranium and thorium fuel cycles for thermal and fast nuclear reactors [11]. The system has been developed and managed by the International Atomic Energy Agency since 1990. The tool allows for scenario-based nuclear fuel cycle numerical modeling for a defined fleet of various nuclear reactors. Therefore, it can be used for the fuel demand estimation for the planned nuclear power capacity of a nuclear power embarking country. In addition, the tool provides a module for the calculations of the isotopic compositions of spent nuclear fuel. This way, the mass of spent fuel and actinide content for a given reactor fleet may be calculated. It is important for the planning and designing of the back-end fuel cycle strategy, e.g., the storage capacity of the final spent fuel geological repository. The NFCSS is available online as part of the IAEA NUCLEUS system [5]. The user has to provide the input parameters for the material flow as well as for the designed nuclear power capacity. The first group mainly contains the initial fuel composition, burnup and enrichment in 235U. The second group of parameters contains numbers, types and power of nuclear reactors, the year of their connection to the grid and the year of their permanent shutdown. In the study, the NFCSS system was applied as the main simulation tool to obtain the final isotopic compositions of the total spent nuclear fuel after the designed operation period of the whole reactor fleet. The obtained concentrations of actinides are the input parameters for the modeling of the long-term mass and radiotoxicity evolutions using the MCB code. The benchmarking study and partial validation on the fuel inventory obtained using the NFCSS was performed by the IAEA using three independent scenario-based numerical codes and measurement data from the fuel samples irradiated in BWR and PWR reactors [12]. An additional validation study was performed by the author for the high-burnup uranium PWR fuel samples available in the SFCOMPO. Therefore, the assessment of the NFCSS for the modeling of fuel inventory was enhanced by new data and recommendations.
2.3. MCB
The Monte Carlo Continuous Energy Burnup Code (MCB) is a general-purpose numerical tool for the modeling of radiation transport and isotopic changes in the matter under the neutron field [7]. The code has been developed at the AGH University’s Department of Energy and Fuels, Krakow, Poland. The code is capable of numerical modeling of radiation transport in a detailed 3D geometry and material composition of the investigated critical or subcritical nuclear system, e.g., the core of the nuclear reactor, subcritical assembly with the neutron source or accelerator-driven system. The code has functionalities to reconstruct the heterogeneity of the reactor core at all possible levels—from fuel pellet to the reactor vessel, including the modeling of double heterogeneity of nuclear fuels, e.g., TRi-structural ISOtropic (TRISO) fuel for Very-High-Temperature Reactor (VHTR) [13]. The code can use arbitrary nuclear data libraries in the Evaluated Nuclear Data File format (ENDF) for neutron transport calculations. It is also equipped with a set of nuclear data libraries for the modeling of isotopic changes in the matter under the neutron field, e.g., fission product yields, branching ratios to metastable isotopes, dose data, (n,2n) reaction cross-sections and decay schemes for about 2400 isotopes. The MCB uses the Transmutation Trajectory Analysis (TTA) method for the solution of Bateman equations governing the isotopic changes in the matter due to the fuel burnup. From the mathematical point of view, the TTA is the linear chain method with the inclusion of the mathematical apparatus for the modeling of circular pathways in the transmutation and decay system [14,15]. The MCB has also incorporated modules for thermo-hydraulics, neutron transport and burnup coupling. In the presented paper, the MCB code was used for the calculations of ingestion radiotoxicities of spent nuclear fuel for the isotopic composition obtained in the NFCSS modeling. The results of decay calculations for all investigated isotopes were automatically transferred to the output file in a dedicated format, which significantly facilitates further post-processing.
3. Benchmark
The developed methodology was tested using the nuclear power implementation scenario for a newcomer country. The scenario is based on the available information for Poland, which plans to add about 9 GWel nuclear capacity to its power system in the next two decades. In Poland, about 70% of electricity is produced in coal-fired power stations, out of which about 50% is produced in hard-coal power stations and 20% in lignite-fired power stations. The remaining 30% corresponds to natural gas (about 10%) and renewable energy sources (about 20%). The Polish installed capacity equals about 47 GWel [16]. The need for additional energy sources is mainly caused by the decarbonization policy of the European Commission, the main assumption of which is the phasing out of the coal-fired power system and, thus, the reduction of greenhouse gas emissions. Additionally, the Polish mining industry is technologically and economically ineffective, which results in large governmental financial support for mining companies and high coal prices. The economics of the mining industry and coal-fired power stations is also strongly affected by the requirements of the EU Emission Trading System [17]. Therefore, a decision on the nuclear power implementation was taken by the Polish political decision-makers.
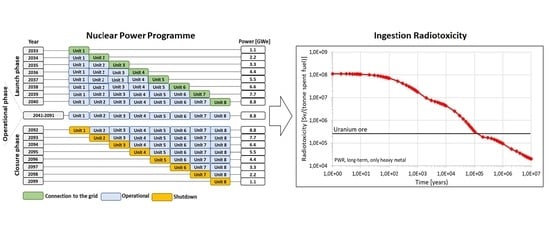
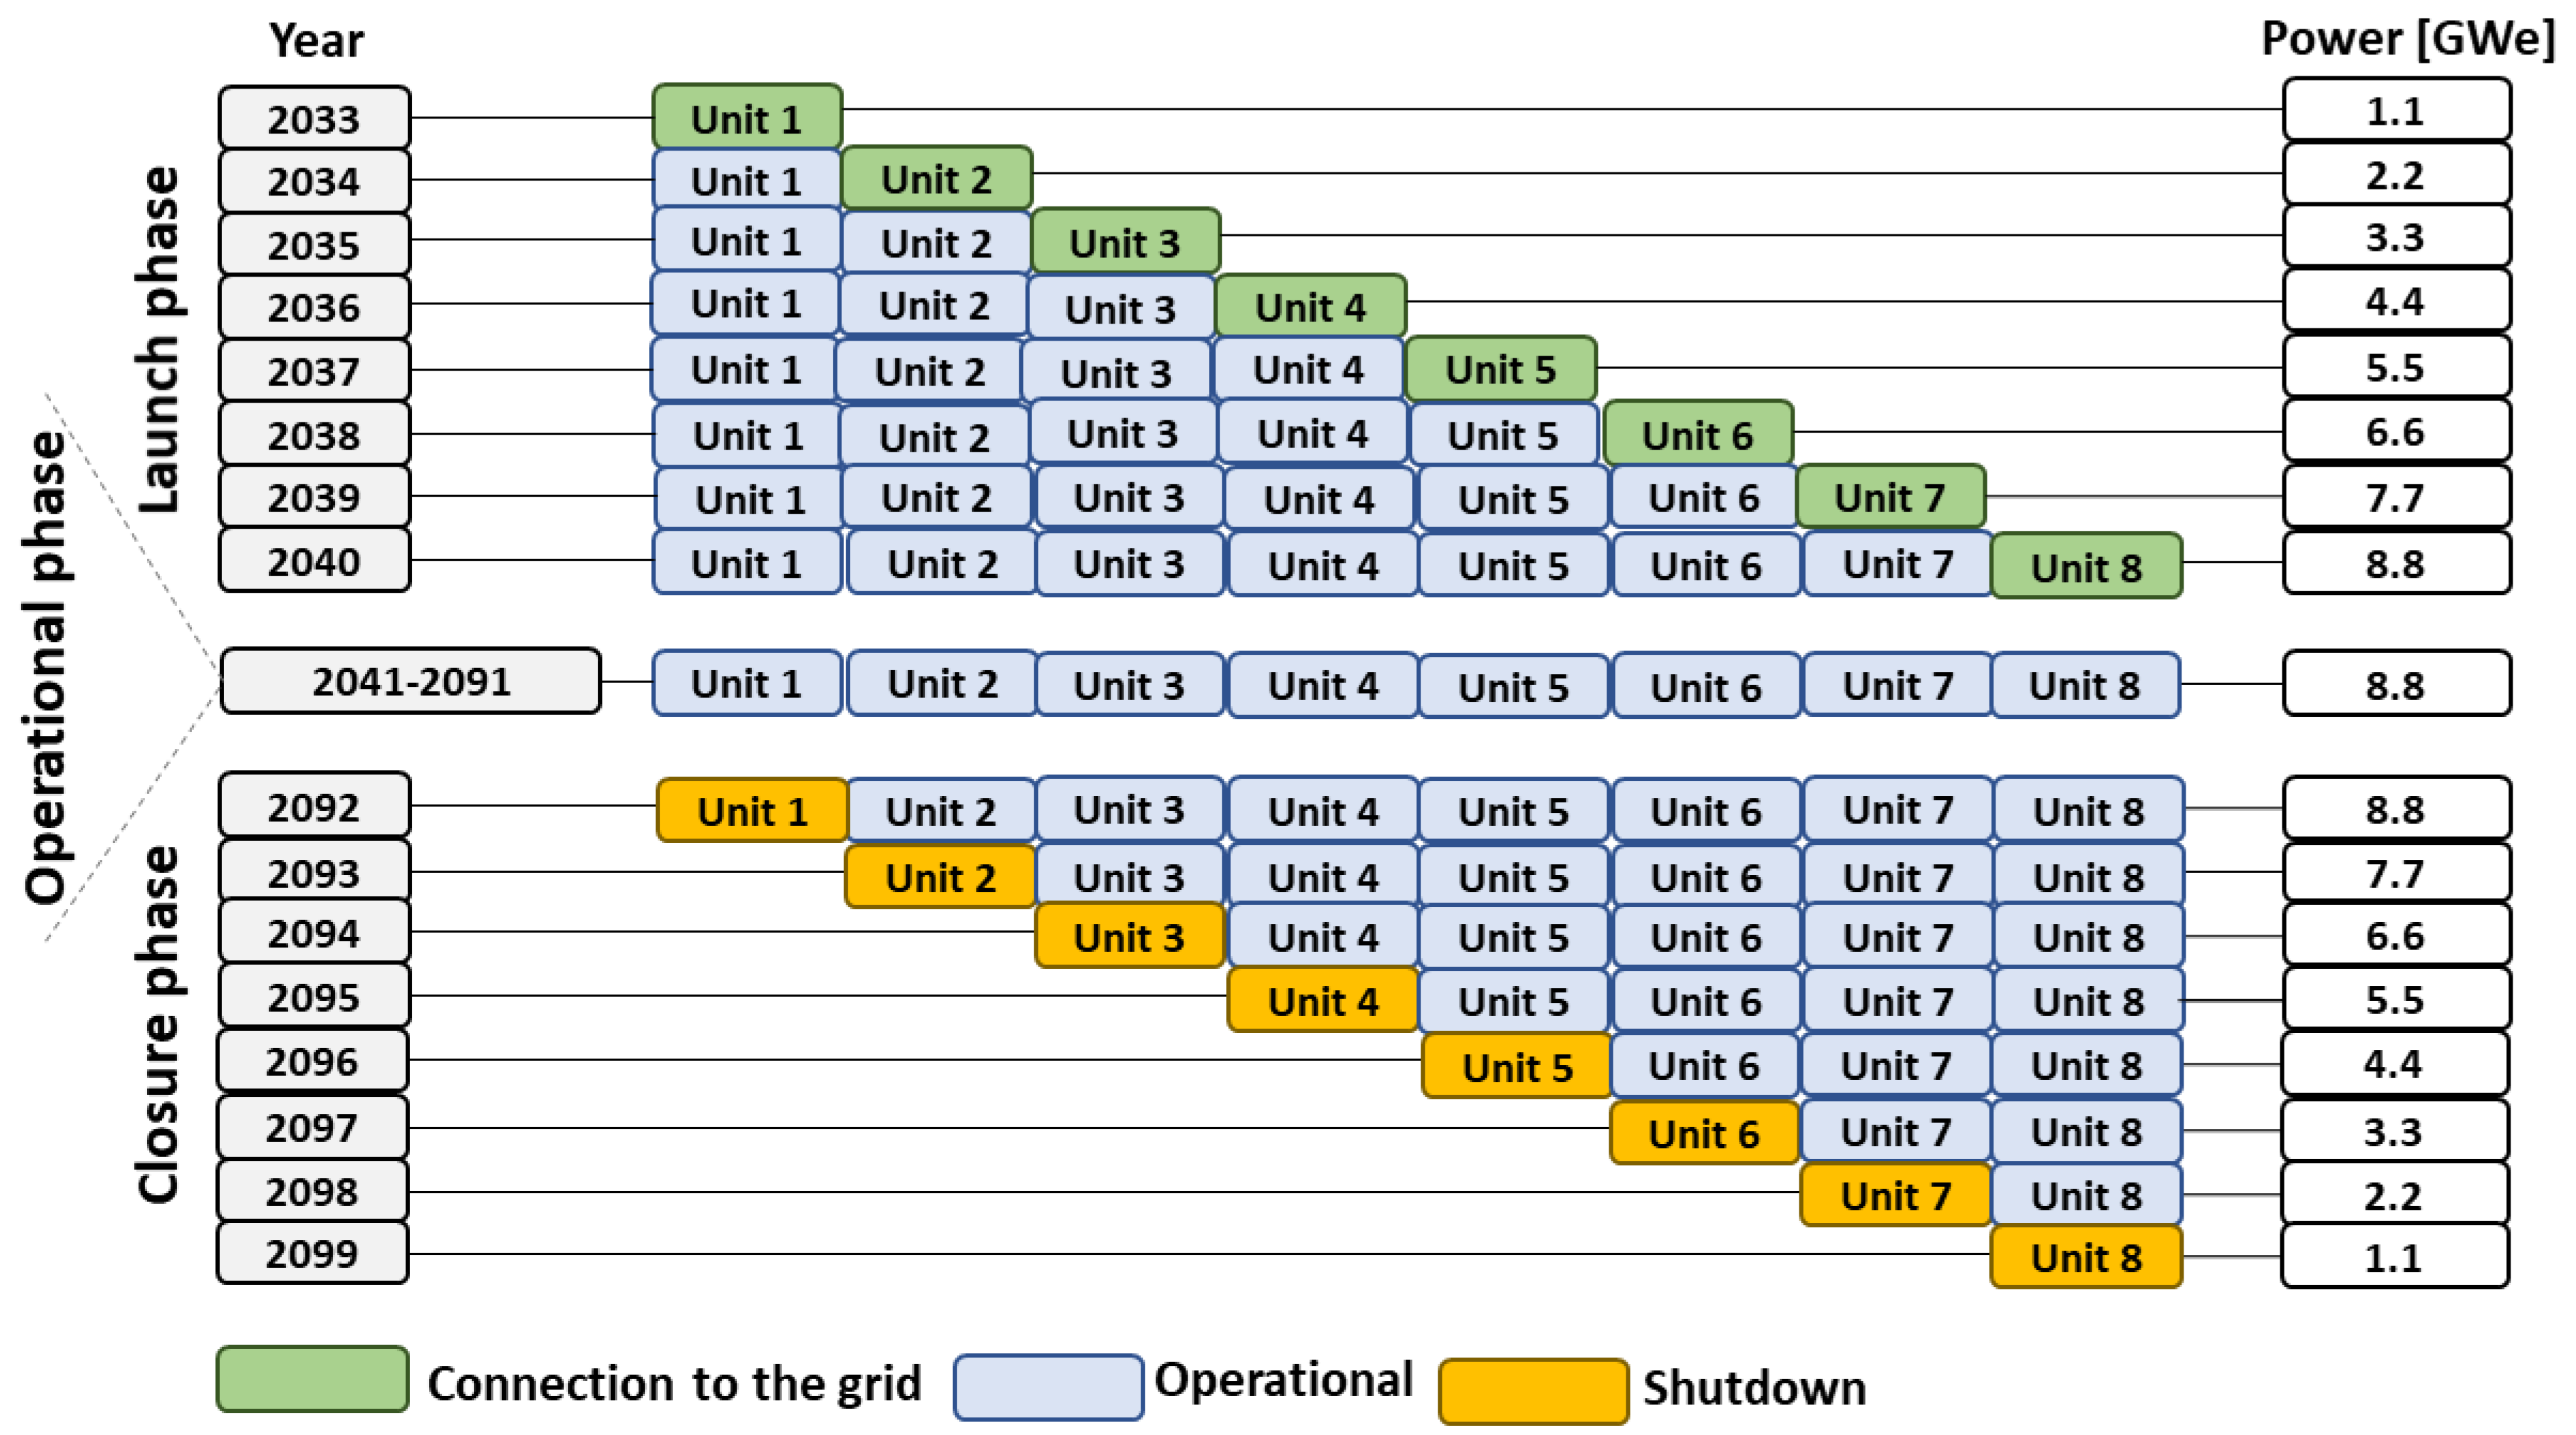
A detailed timeline for new connections to the grid of each reactor is unknown at the moment. The chosen technology is the PWR reactor, but the supplier and the reactor type are not defined. In the benchmark, the AP1000 reactor with a net power output of 1.1 GWel was assumed as the most probable nuclear system for Poland. The thermal power of the reactor is 3.4 GWth, which gives an efficiency of 32%. To reach the capacity of about 9 GWel, eight reactors should be connected to the grid, which gives a total capacity of 8.8 GWel. In the scenario, the first connection to the grid is assumed for the year 2033 and the last one—for the year 2040. This way, one reactor is connected in each consecutive year, see Figure 2. The starting date of the first reactor, 2033, was assumed considering the average time (12.5 years) of the nuclear power program implementation for newcomer countries based on the IAEA milestone approach [18]. However, the starting date can be arbitrary, unless the consecutive reactors are connected to the grid year after year. The operational time of 60 years is assumed for each unit, with the load factor of 93% according to the technical specification of AP1000, presented in Table 1 [19]. The decommissioning begins in 2092 with the shutdown of the oldest unit. The following seven units are shut down by 2099, one unit per year. In the scenario, an open fuel cycle with an option of spent fuel final disposal in a deep geological repository is considered. However, in future studies, the alternative option of a closed fuel cycle with fuel reprocessing is foreseen [20]. The effects related to the delays in the construction, as well as a shorter lifetime due to unexpected events, are not considered. In reality, the following scenario seems optimistic but it is sufficient for modeling and testing purposes.
4. Results
4.1. Validation
The validation of the burnup module implemented in the NFCSS system was performed using measurement data from the SFCOMPO databases. The measured isotopic compositions for eight fuel samples irradiated in five PWR reactors were chosen, see Table 2. Different origins of the samples and various procedures for the destructive assay ensure the independence of the obtained measurement results. The average burnup for the NFCSS modeling for AP1000 equals 60 GWd/t and the average enrichment is 4.8%. Fuel samples for such parameters are not available. Therefore, fuel samples for the parameters as close as possible to the average parameters were chosen. The detailed characteristics of the fuel samples are available in the open-access SFCOMPO database [6].
Table 3 and Table 4 present the isotopic compositions and measurement uncertainties for the available isotopes for all eight fuel samples. In the analysis, fourteen actinides with a significant contribution to the mass and radiotoxicity of spent nuclear fuel were considered. The burnup module of the NFCSS is capable of calculating the considered actinides and lumped fission products. This limitation is a trade-off imposed by the user-friendly and not-complex character of scenario-based tools for nuclear fuel cycle modeling. The significance of the actinides for the burnup credit, radiological safety and waste management, according to the NEA methodology, is presented in Table 5 [21]. The results of the validation are presented in Table 6 in the form of the C/E (Calculated-to-Experimental) factors. In general, the results are satisfying, considering the characteristics and purpose of the NFCSS system. As an indicator of the general difference between the measured and calculated isotopic compositions, the average (C/E)AV factor was introduced.
For major actinides (isotopes of uranium and plutonium), the deviation in (C/E)AV from the unity equals maximally 20% for 241Pu. For some isotopes, clear trends in the samples’ C/E factors are observable, e.g., the underestimation of 236U and 242Pu. However, for the remaining major actinides, identification of trends using individual C/E factors could not be performed. The C/E factors show various behaviors depending on the sample and isotope. Considering minor actinides (isotopes of neptunium, americium and curium), the results are similar—the maximal difference in (C/E)AV equals 22% for 237Np, except for 241Am and 242Cm, for which the results seem to have highly deviated. Some trends are also identified, e.g., the overestimation of 237Np.
In the case of 241Am, a large underestimation for five fuel samples (1,2,3,7,8) was observed, while, for the remaining samples (4,5,6), the results were acceptable. The measured concentrations of 241Am for samples 1,2,3,7,8 are an order of magnitude higher than for samples 4,5,6. Considering similar burnups and enrichments for all samples, the difference in computed concentrations of 241Am may point to too low a calculated production of 241Am from its precursor 241Pu, for which the C/E factors are overestimated.
The C/E factors for 242Cm for three samples (1,2,3) are strongly overestimated, which may have a double origin. 242Cm has a short half-life time of 160 days, therefore, any delay in the destructive assay influences its concentration. The exact time of the destructive examination after samples’ discharge from the reactor core is not reported. Additionally, the obtained numerical results are much higher than the measurements, which supports this hypothesis. Moreover, the main source of 242Cm is beta decay of 242Am, which is not calculated due to its short half-life time of 16 h. The neutron capture on 241Am may lead to the formation of either 242Am or 242mAm, and thus the overestimation of the production of 242Am from 241Am may also affect the concentration of 242Cm.
It is important to highlight the fact that the measurement uncertainties for both isotopes (241Am and 242Cm) are high, which points also to measurement difficulties during the destructive assay. Additionally, the numerical source of the discrepancies related to the burnup module implemented in the NFCSS is less probable, because the results obtained for the remaining three samples (4,5,6) are satisfying. Moreover, the samples obtained from the Japanese reactors (samples 4,5,6) are treated as reference measurements for the validation of burnup computer codes (especially the samples from the Takahama reactor), which further points to some measurement inaccuracy for 241Am and 242Cm.
Generally, the obtained C/E factors are in the range of the author’s expectations considering the numerical tool applied. A more precise validation would be possible using advanced numerical tools for the three-dimensional modeling of the neutron transport and burnup in the reactor core [3,4]. However, more advanced modeling is not always desirable in the computation of the whole power system, where the nuclear component is considered just as a single module of a more comprehensive numerical tool. In addition, this approach is not always possible because of the limited access to data related to the core design and operational history.
4.2. Scenario-Based Modeling
In the numerical simulations using the NFCSS, the average parameters for nuclear fuel are applied. The fuel burnup equals 60 GWd/t and the enrichment in 235U is 4.8%. The mass of heavy metal in the initial core is 86 tonnes. The new fuel batches of 1/3 of the core have the same isotopic composition and mass (28.7 tonnes) over the reactor lifetime for all reactors in the system. However, the average enrichment of 3.6% was applied for the initial core.
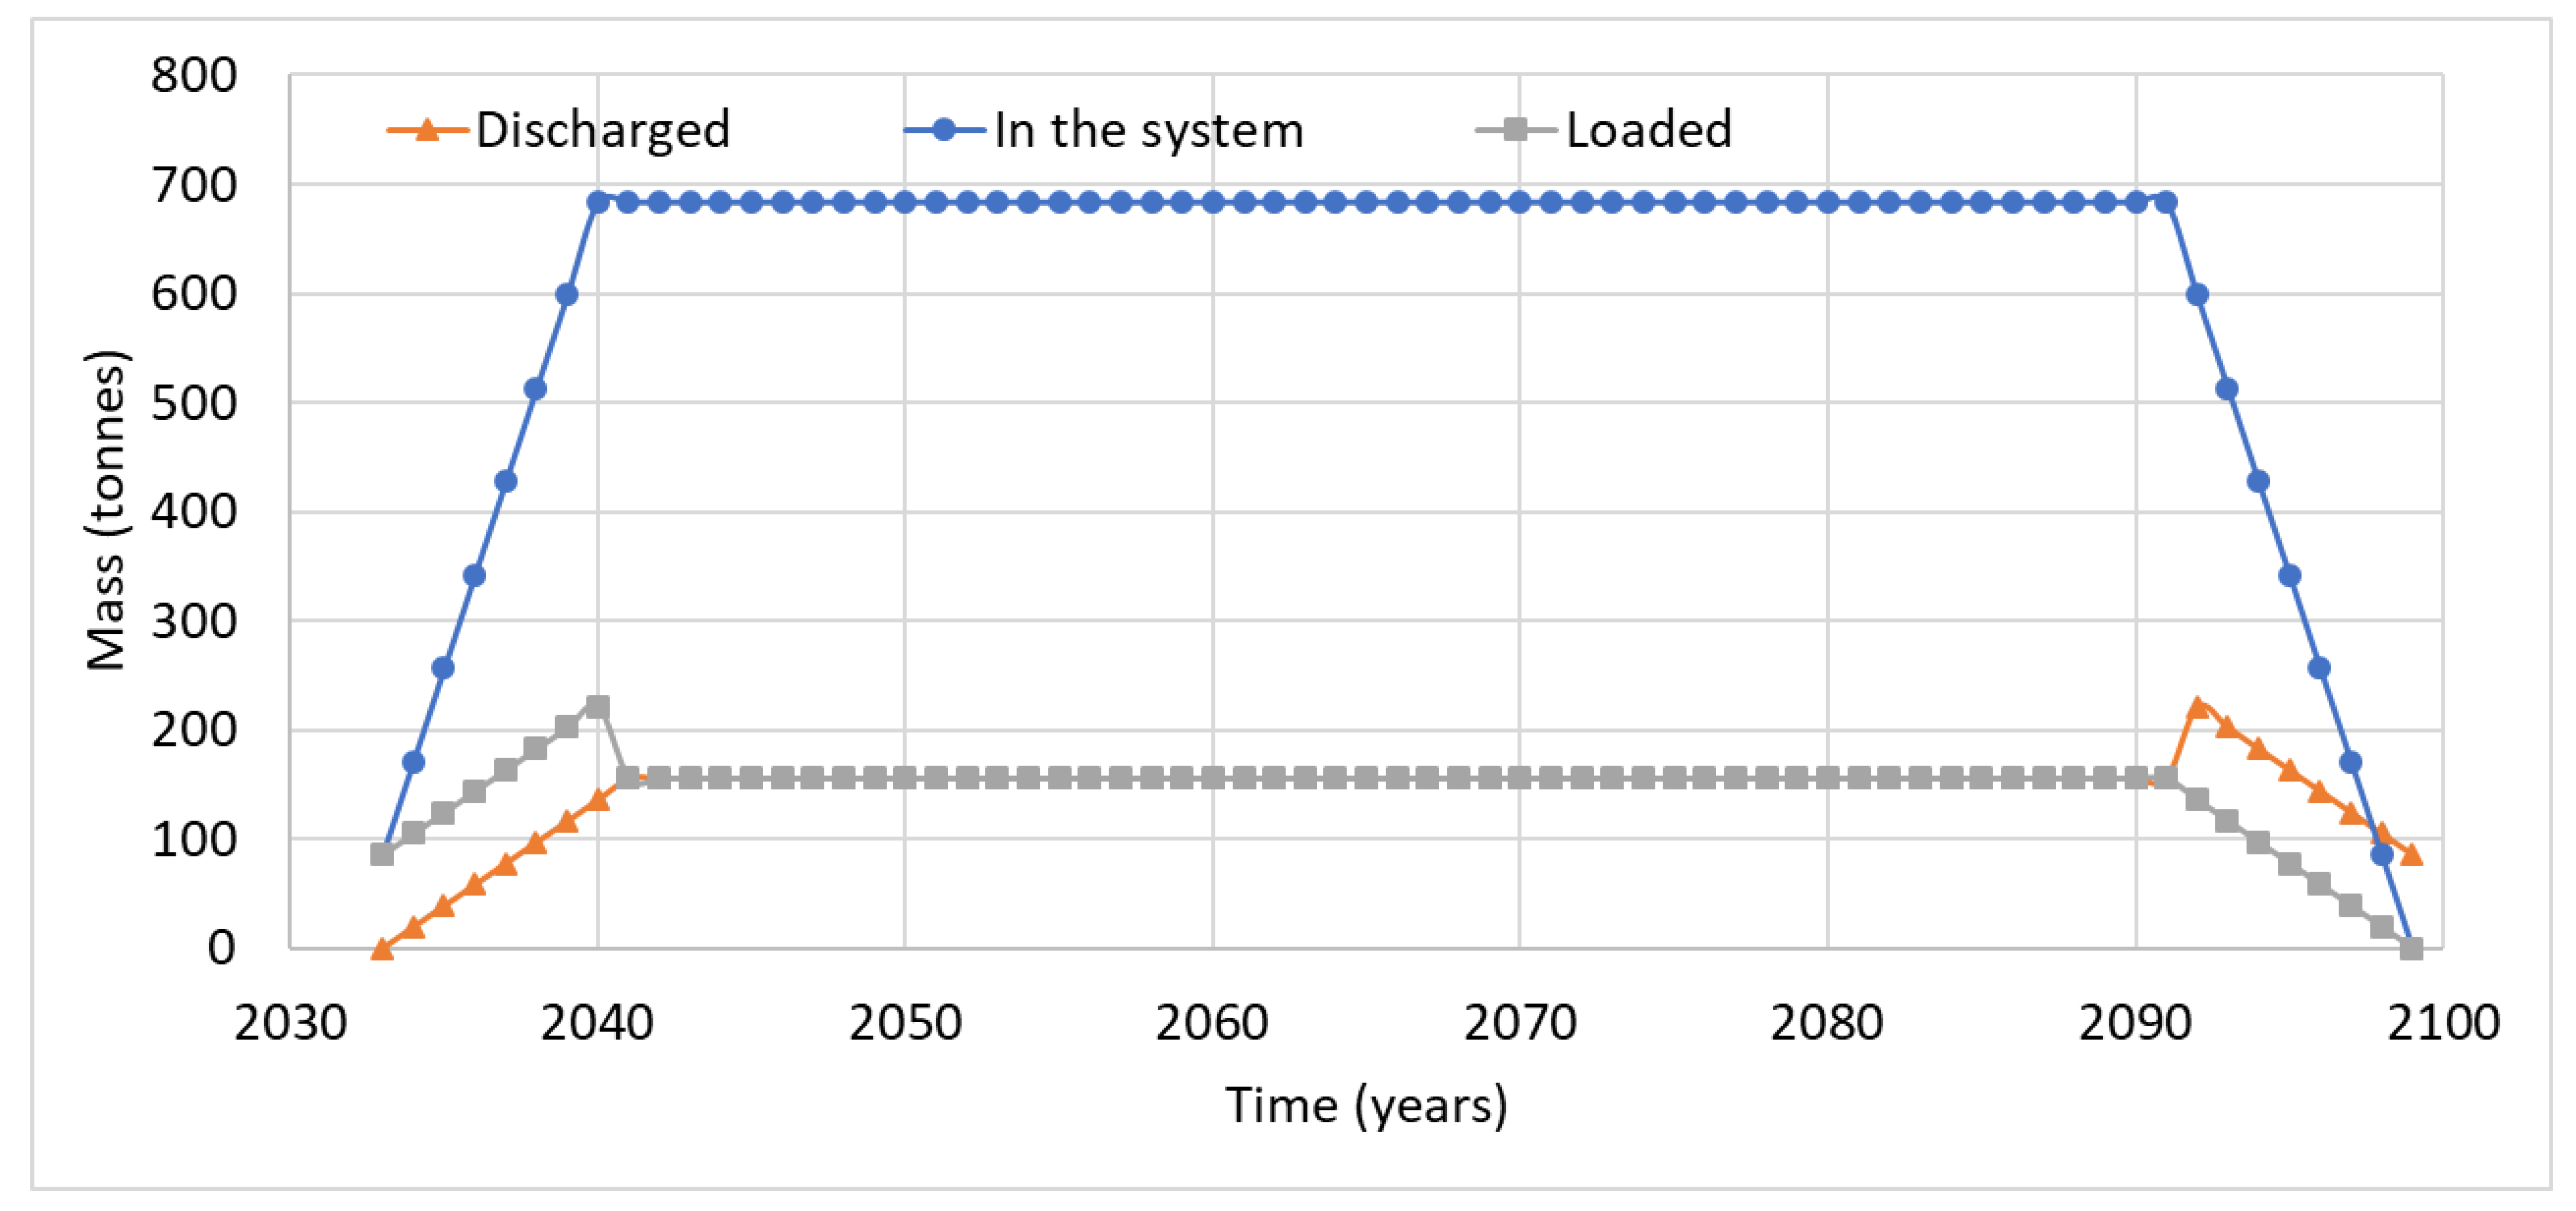
Figure 3 presents the mass of the nuclear fuel in the whole system during the operational phase, the mass of spent fuel discharged from the reactor cores and the mass of the fuel loaded into the reactor cores, on a yearly basis. The mass of fresh fuel contains heavy metal only, while the mass of spent fuel contains heavy and fission products (about 6%). In the launch phase (2033 to 2040), the mass of fresh fuel loaded into the reactors is higher than the mass of discharged fuel because of new connections to the grid. The difference equals 86 tonnes, which corresponds to one full reactor load. It is worth noting that in 2040, the mass of the nuclear fuel utilized in the reactors (loaded in the cores) reaches the constant value of 684 tonnes. In the operational phase (2041–2090), the mass of fresh fuel (155 tonnes) equals the mass of discharged fuel, which means that the whole system has reached the equilibrium state. In the closure phase (2092–2099), the mass of discharged fuel is higher by 86 tonnes than the mass of loaded fuel, which is related to the shutdown of the reactors. Within this meaning, the closure phase is the reflection of the launch phase. The mass of the whole spent nuclear fuel after the shutdown of the last reactor in 2099 equals 9708 tonnes, which gives 9106 tonnes of heavy metal and 602 tonnes of fission products.
4.3. Radiotoxicity
The MCB code was used to calculate the time-evolutions of the radiotoxicity and isotopic concentrations of spent nuclear fuel from the fleet of PWR reactors. The input parameters for the MCB modeling are isotopic compositions obtained in the NFCSS burnup calculations. The compositions include the decay of actinides during the cooling time after the discharge of each fuel batch from the reactor core till 2099. Table 7 shows the final concentrations and masses of the investigated actinides after the closure of the last PWR unit in 2099. The base fuel composition is the composition obtained without correction using (C/E)AV factors, while the reference fuel composition contains correction using (C/E)AV factors (e.g., 8% underestimation in 235U) obtained in validation of the NFCSS system. The purpose of this approach was to indicate possible differences between the isotopic concentrations and thus radiotoxicities obtained in the direct numerical modeling and in those based on the code validation. In addition, the approach was introduced to facilitate interpretation of obtained results and detection of potential discrepancies by users of the NFCSS system. The correction was not applied to 241Am and 242Cm because of their uncertain concentrations indicated in the validation study. The radiotoxicity of the fission products, which decreases to acceptable levels after about 300 years, was not considered.
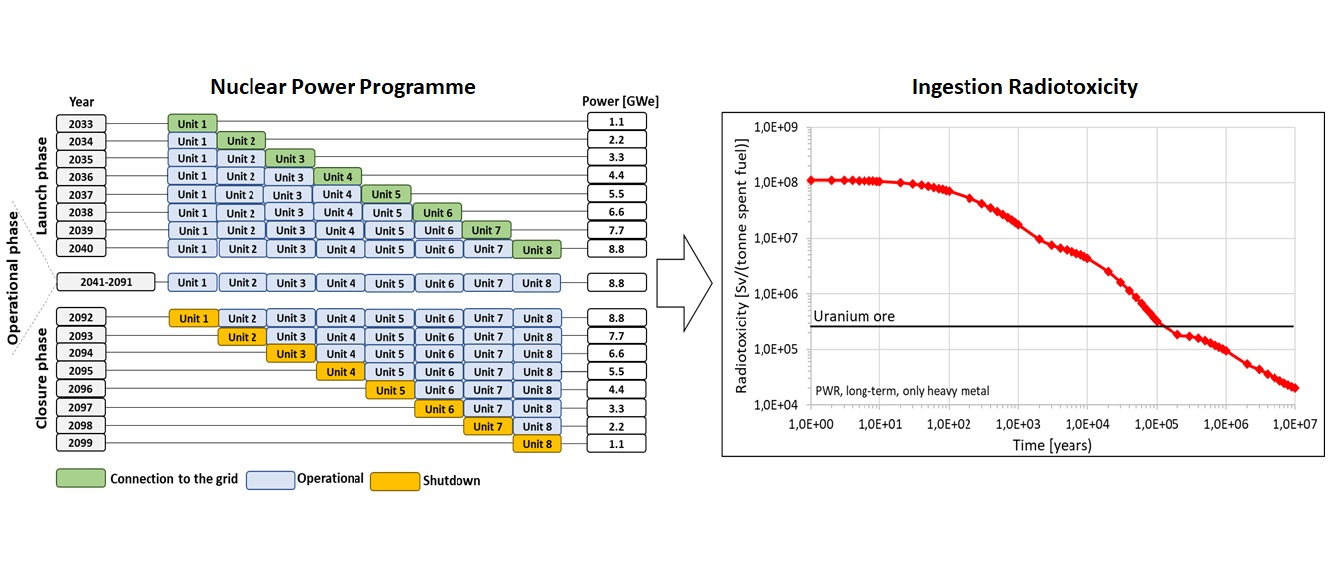
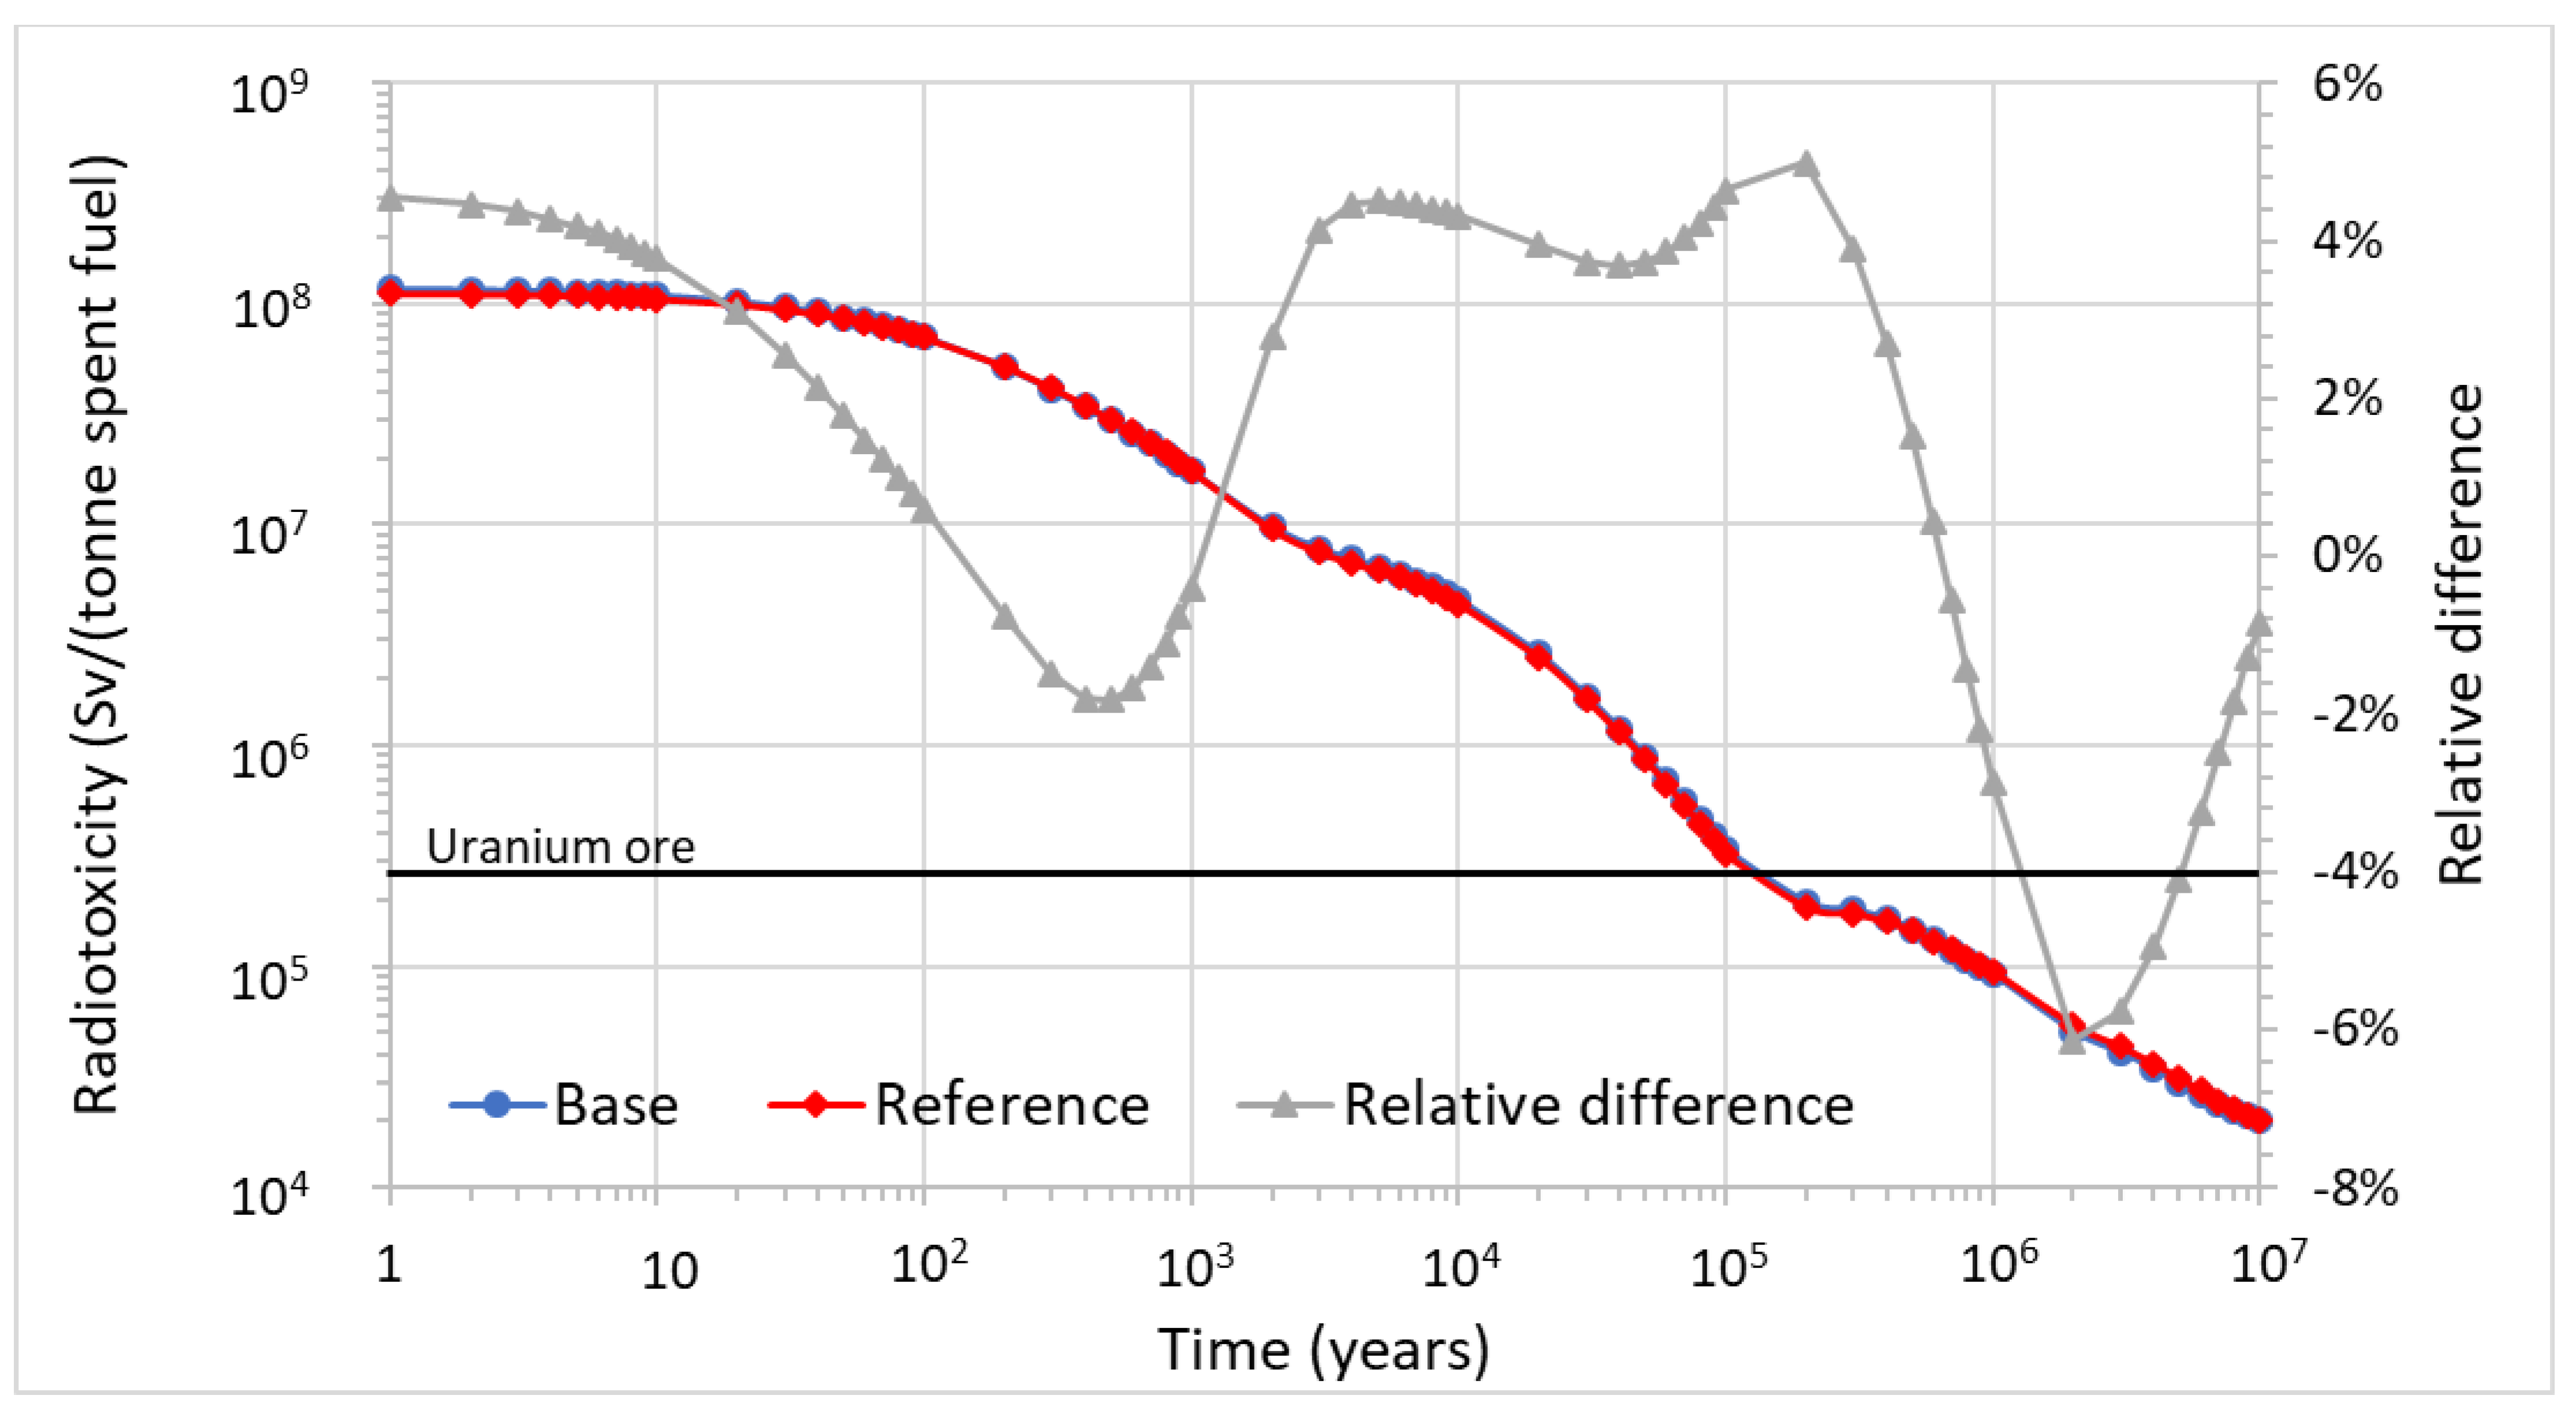
Figure 4 shows the evolutions of the radiotoxicity for base and reference spent fuel composition, till 107 years. The relative difference ((base composition—reference composition)/reference composition)) was introduced to show the differences in the evolutions of radiotoxicity and isotopic concentrations over the considered time period, between both compositions. The reference ingestion radiotoxicity of uranium ore, in equilibrium with its daughter products, was calculated using ICRP72 effective dose coefficients [22]. These coefficients are also used by the MCB code for calculations of the spent fuel ingestion radiotoxicity. Usually, it is assumed that the reference level of ingestion radiotoxicity equals 2.41×10⁵ Sv, which corresponds to 7.83 tonnes of uranium ore [23]. This amount is necessary for the production of 1 tonne of uranium enriched to 4.2%, considering a tails assay of 0.2%. However, in the presented study the enrichment equals 4.8% and thus for production of 1 tonne of enriched uranium, about 9 tonnes of uranium ore are needed. This results in the uranium ore reference ingestion radiotoxicity of 2.77 × 10⁵ Sv.
The level of the uranium ore radiotoxicity for the base fuel composition is reached at about 1.4 × 10⁵ years and, for the reference fuel composition, at about 1.3 × 10⁵ years. The difference is caused by the various isotopic concentrations of the spent nuclear fuel. The main isotopes influencing the long-term radiotoxicity are 242Pu and 239Pu. The concentrations of both isotopes are higher for the base fuel composition, see Table 7. The relative difference evolves between 5% to −6% in the considered decay time. Its behavior is driven by the various concentrations of isotopes and thus different decay rates and production of decay products. For instance, the fall at about 4×10² years is caused by the higher concentrations of 241Pu, 241Am 242mAm, 244Cm for reference fuel concentration and thus their higher contribution to the total ingestion radiotoxicity. Similarly, the fall at about 106 years originates from the higher concentrations of 233U and 237Np also for reference fuel composition. Generally, the obtained evolution of the ingestion radiotoxicity and time points for its achievement compile with the results achieved by other scientific groups [23,24,25,26]. The reference level of ingestion radiotoxicity is reached at 2 × 10⁵ years, regardless of the unit of radiotoxicity presentation. This proves the reliability of the developed methodology.
4.4. Isotopic Concentrations
Figure 5, Figure 6, Figure 7 and Figure 8 show the evolutions of the investigated actinides during 107 years of decay and the relative differences in their evolutions.
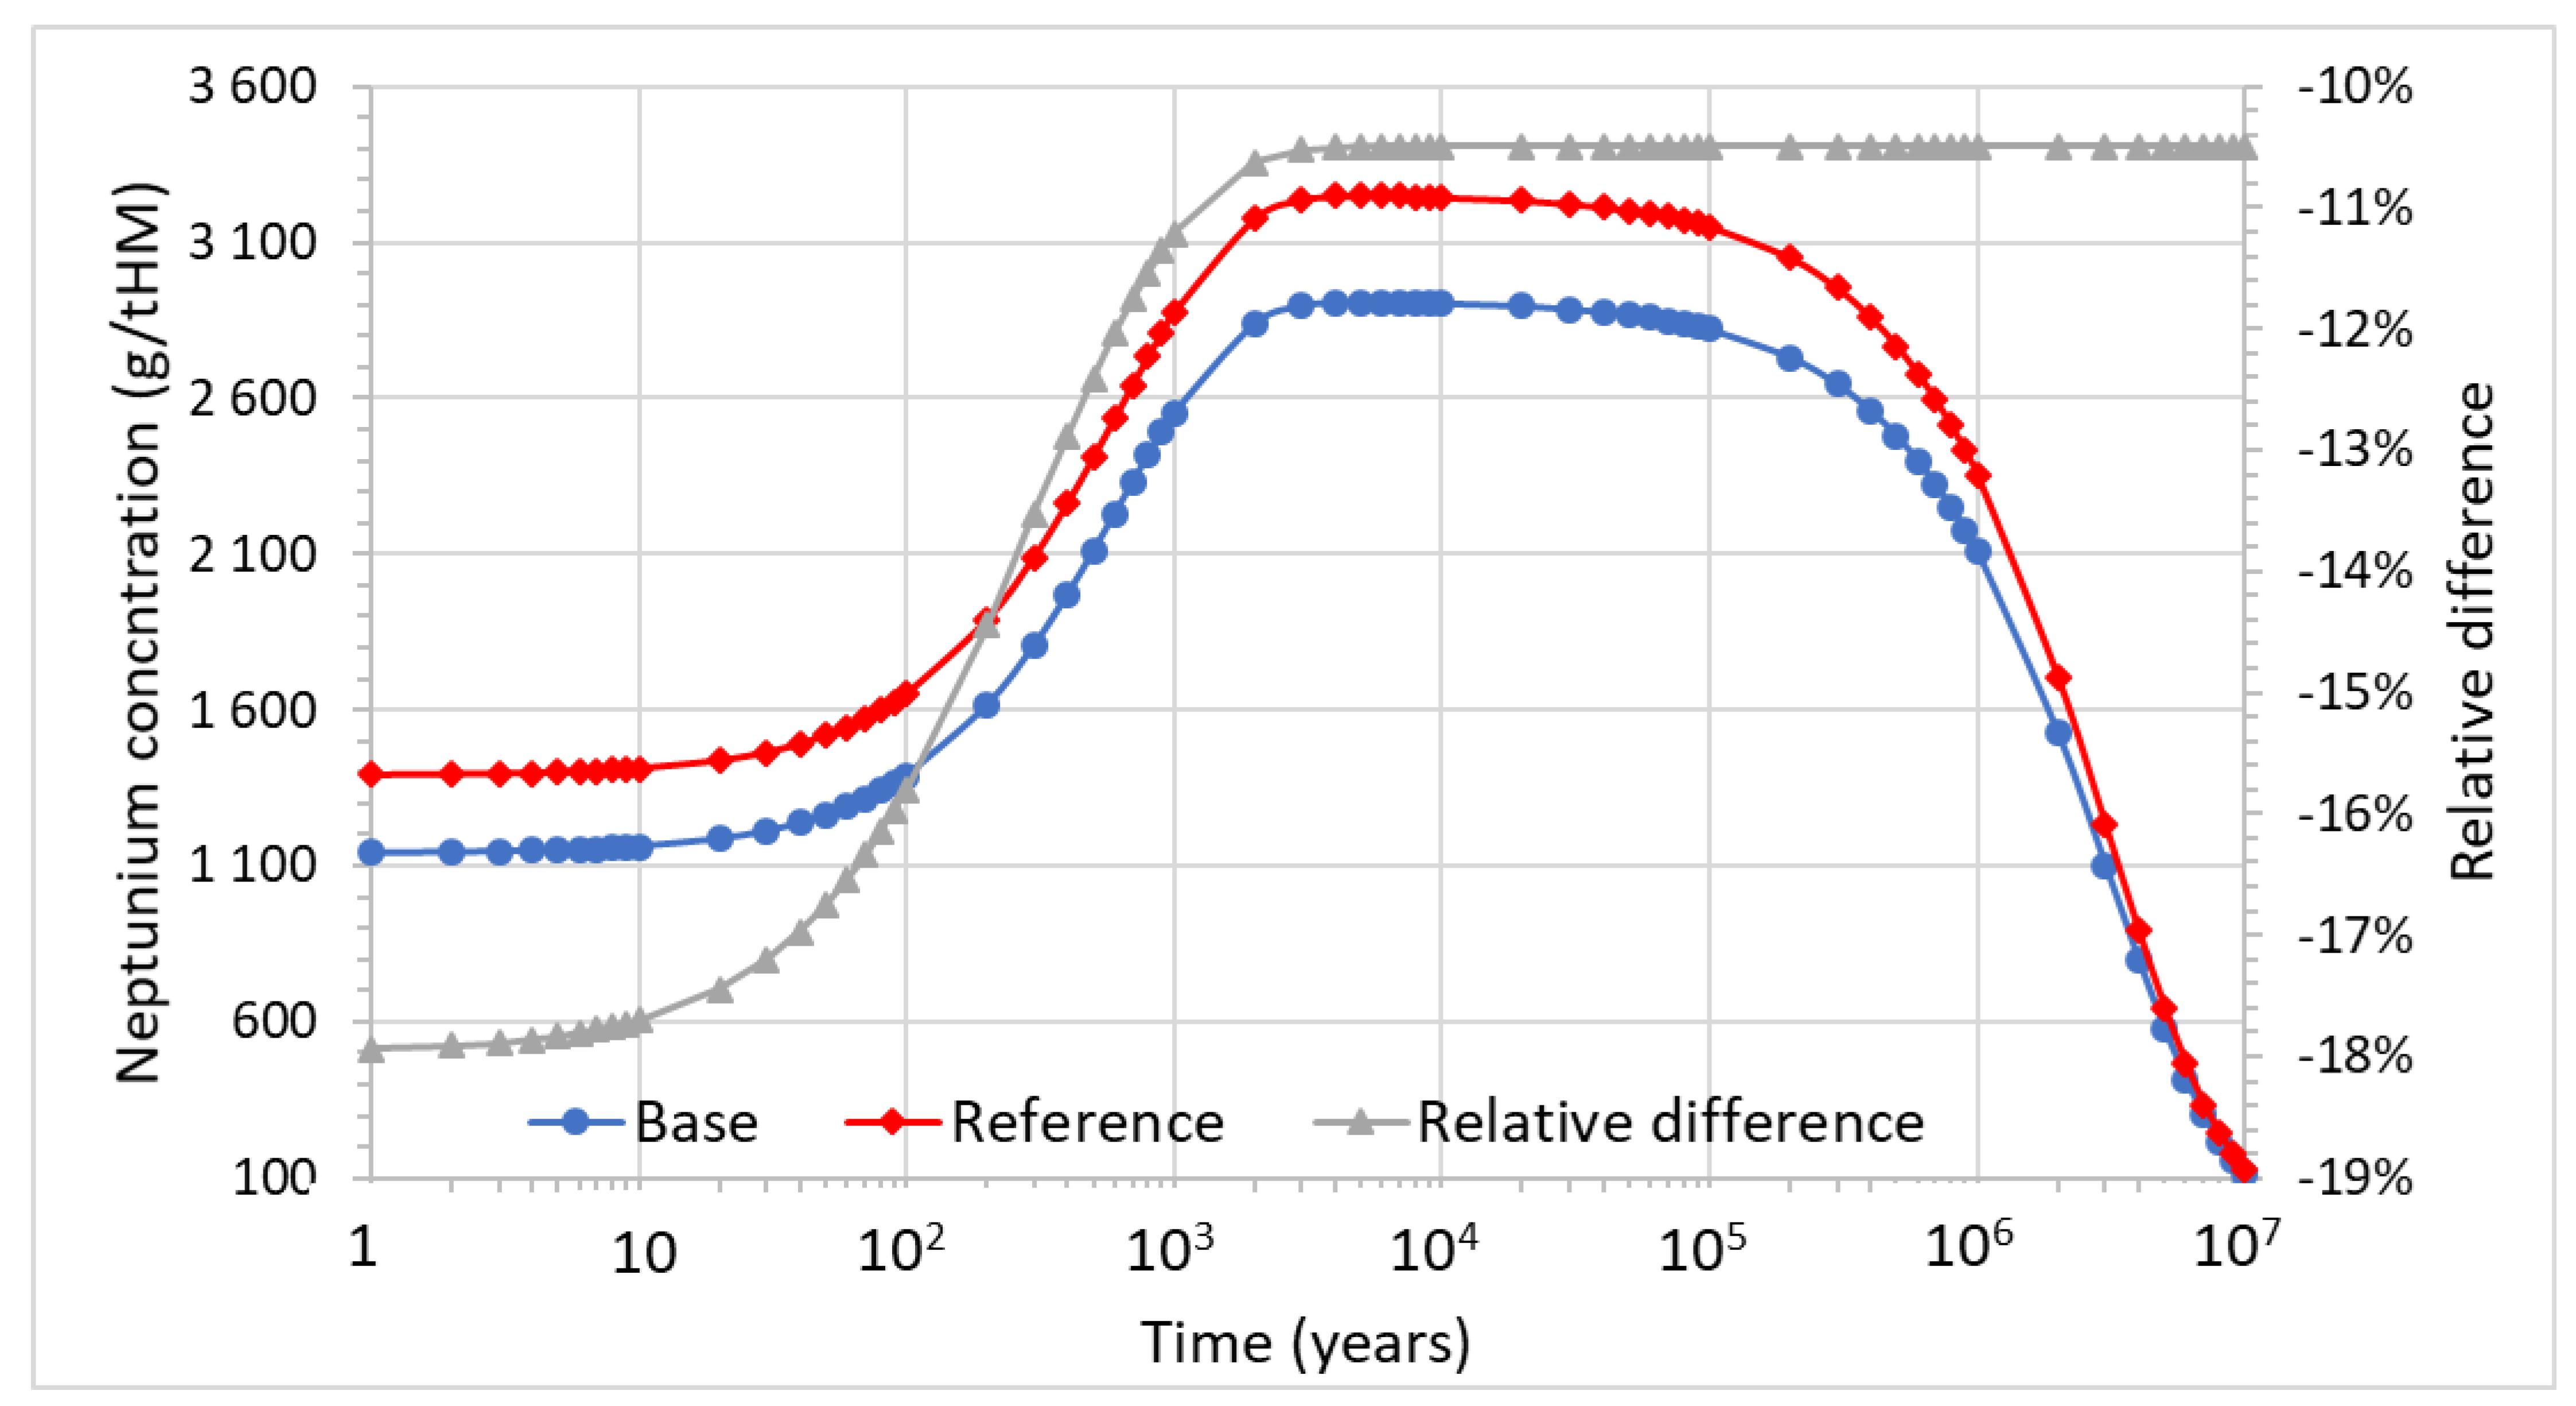
Figure 5 depicts the evolution of neptunium (237Np). The concentration of neptunium increases starting from about 10 years and almost reaches the equilibrium level at about 2 × 10³ years. The initial increase in the concentration of 237Np is related to its production from alpha decay of 241Am. Afterward, from about 105 years, it starts to decrease due to its decay to 233Pa. The concentration of 237Np is larger for the reference fuel composition during the whole decay time. This is caused by a higher initial concentration of 237Np. However, the difference decreases from −18% to −10.5%, till about 3 × 10³ years and then reaches a constant value. This originates from the production of 237Np from alpha decay of 241Am, production is initially driven by beta decay of 241Pu, the concentration is higher for the base fuel composition.
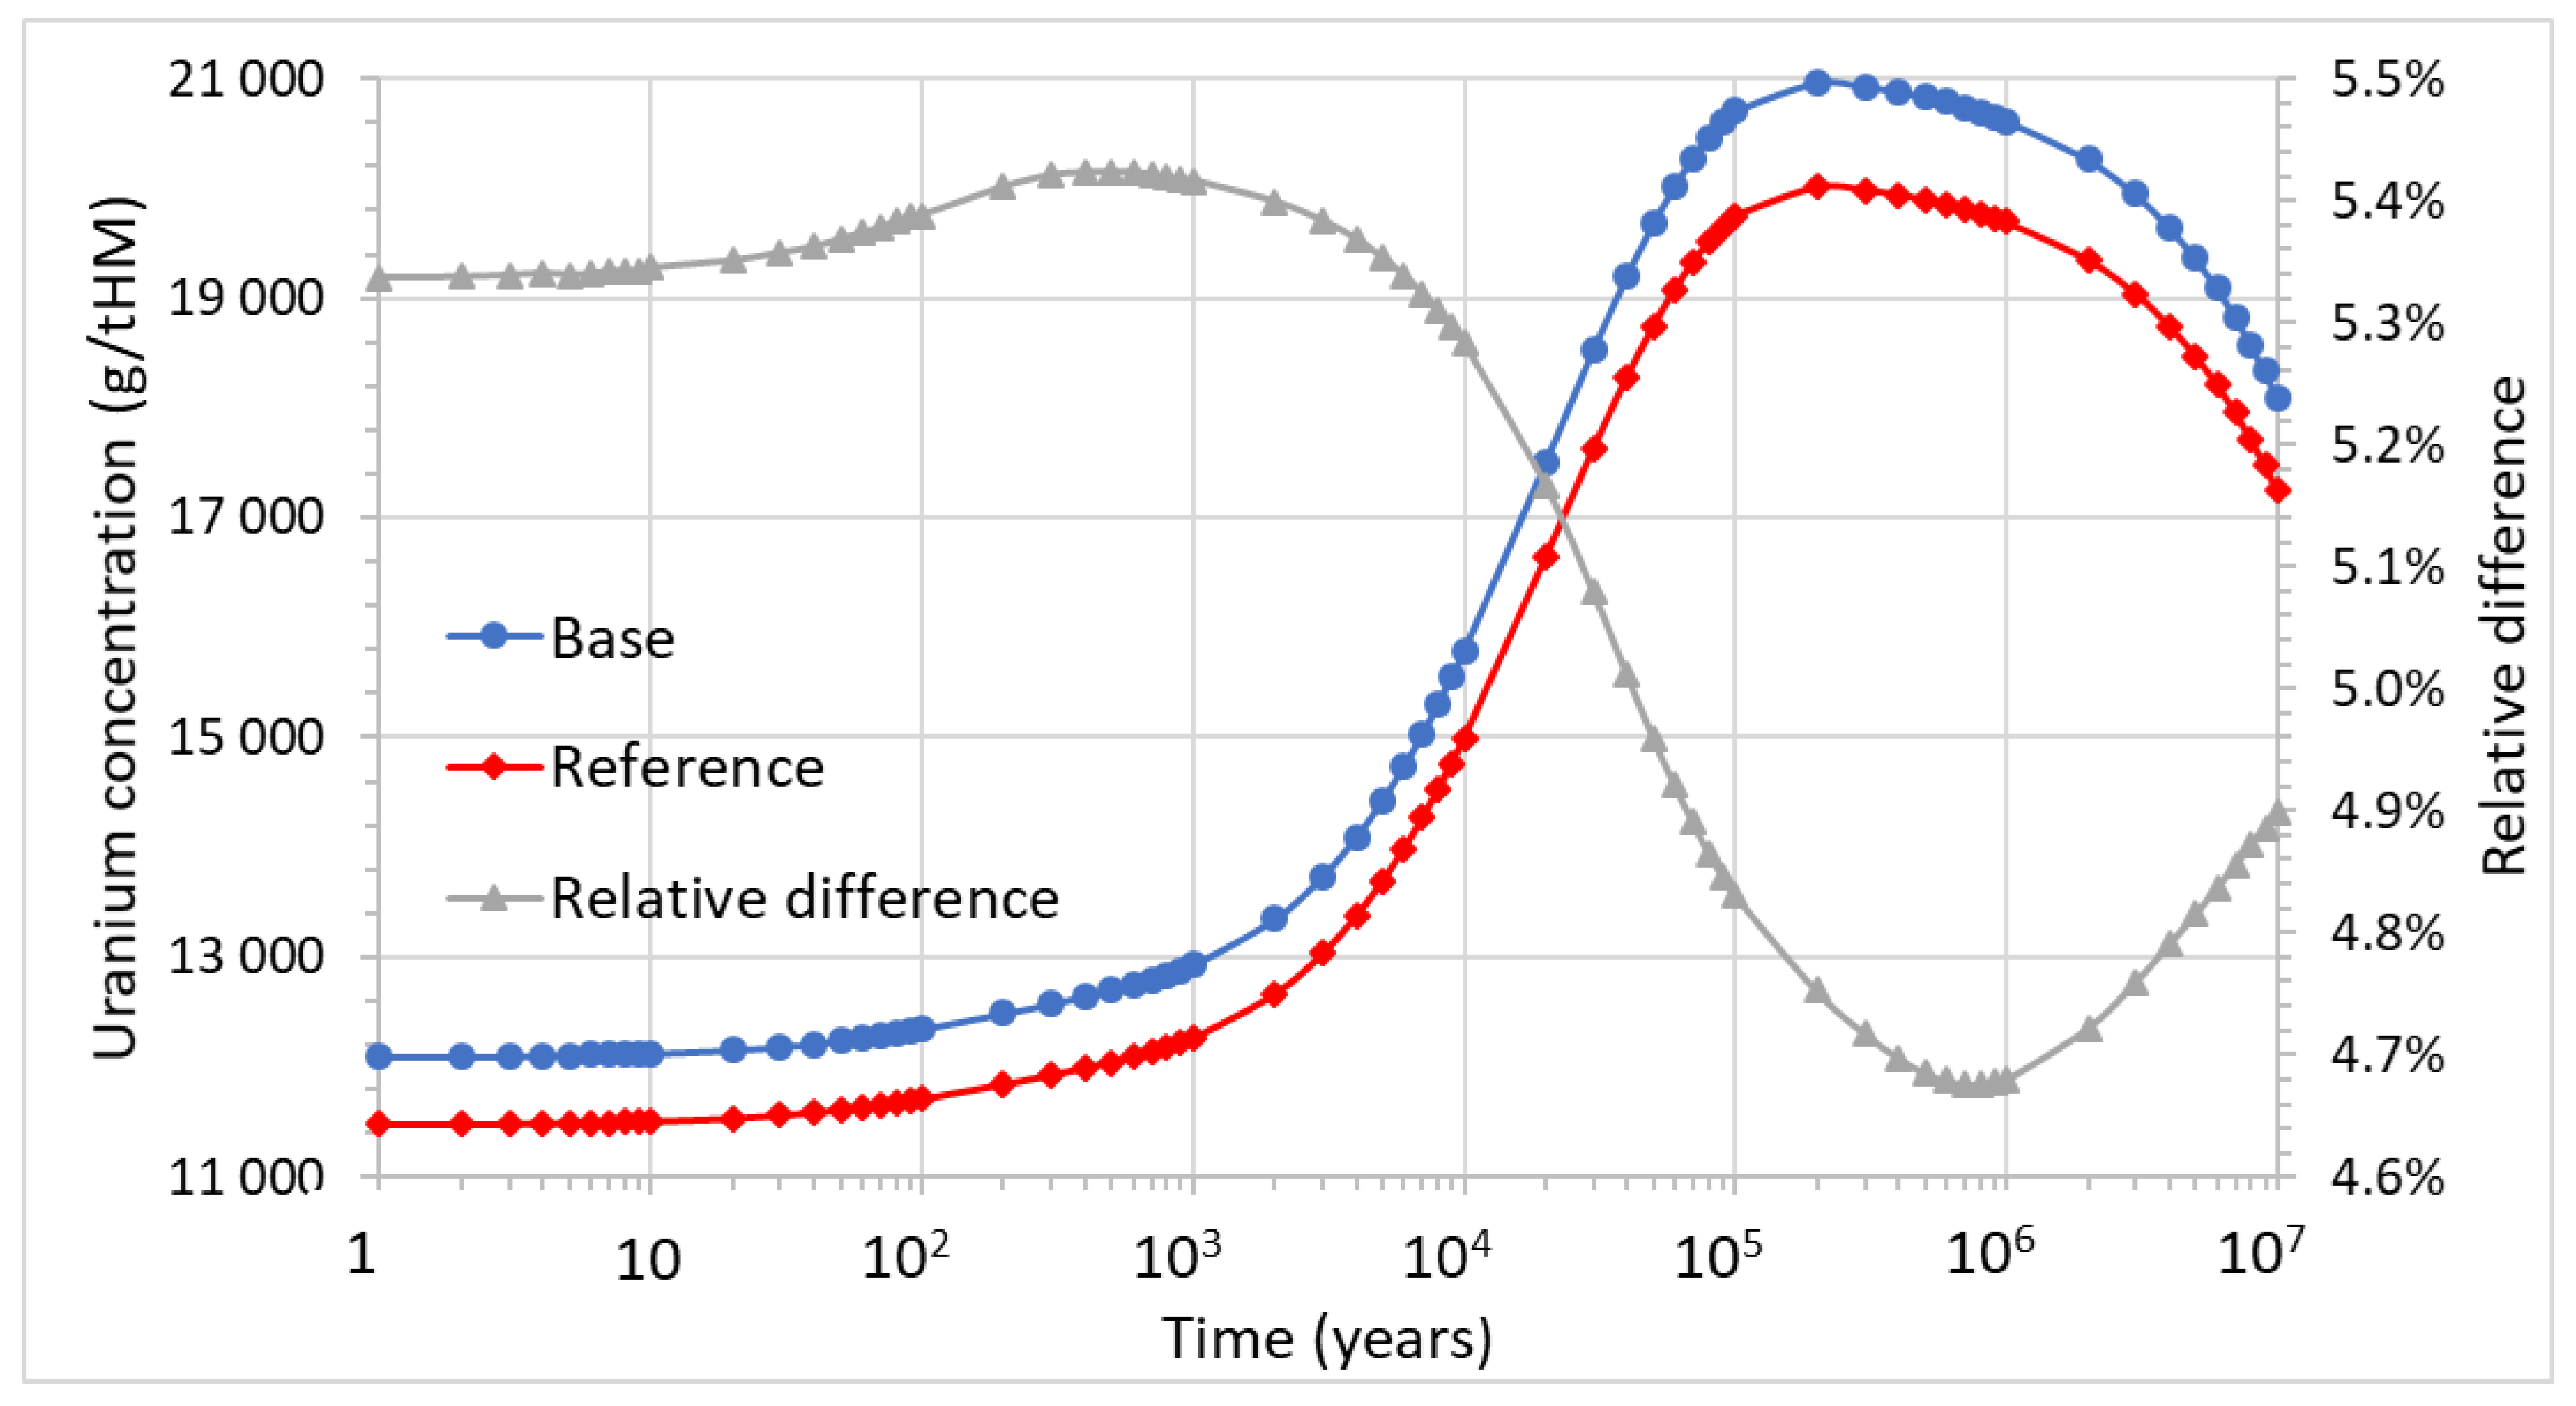
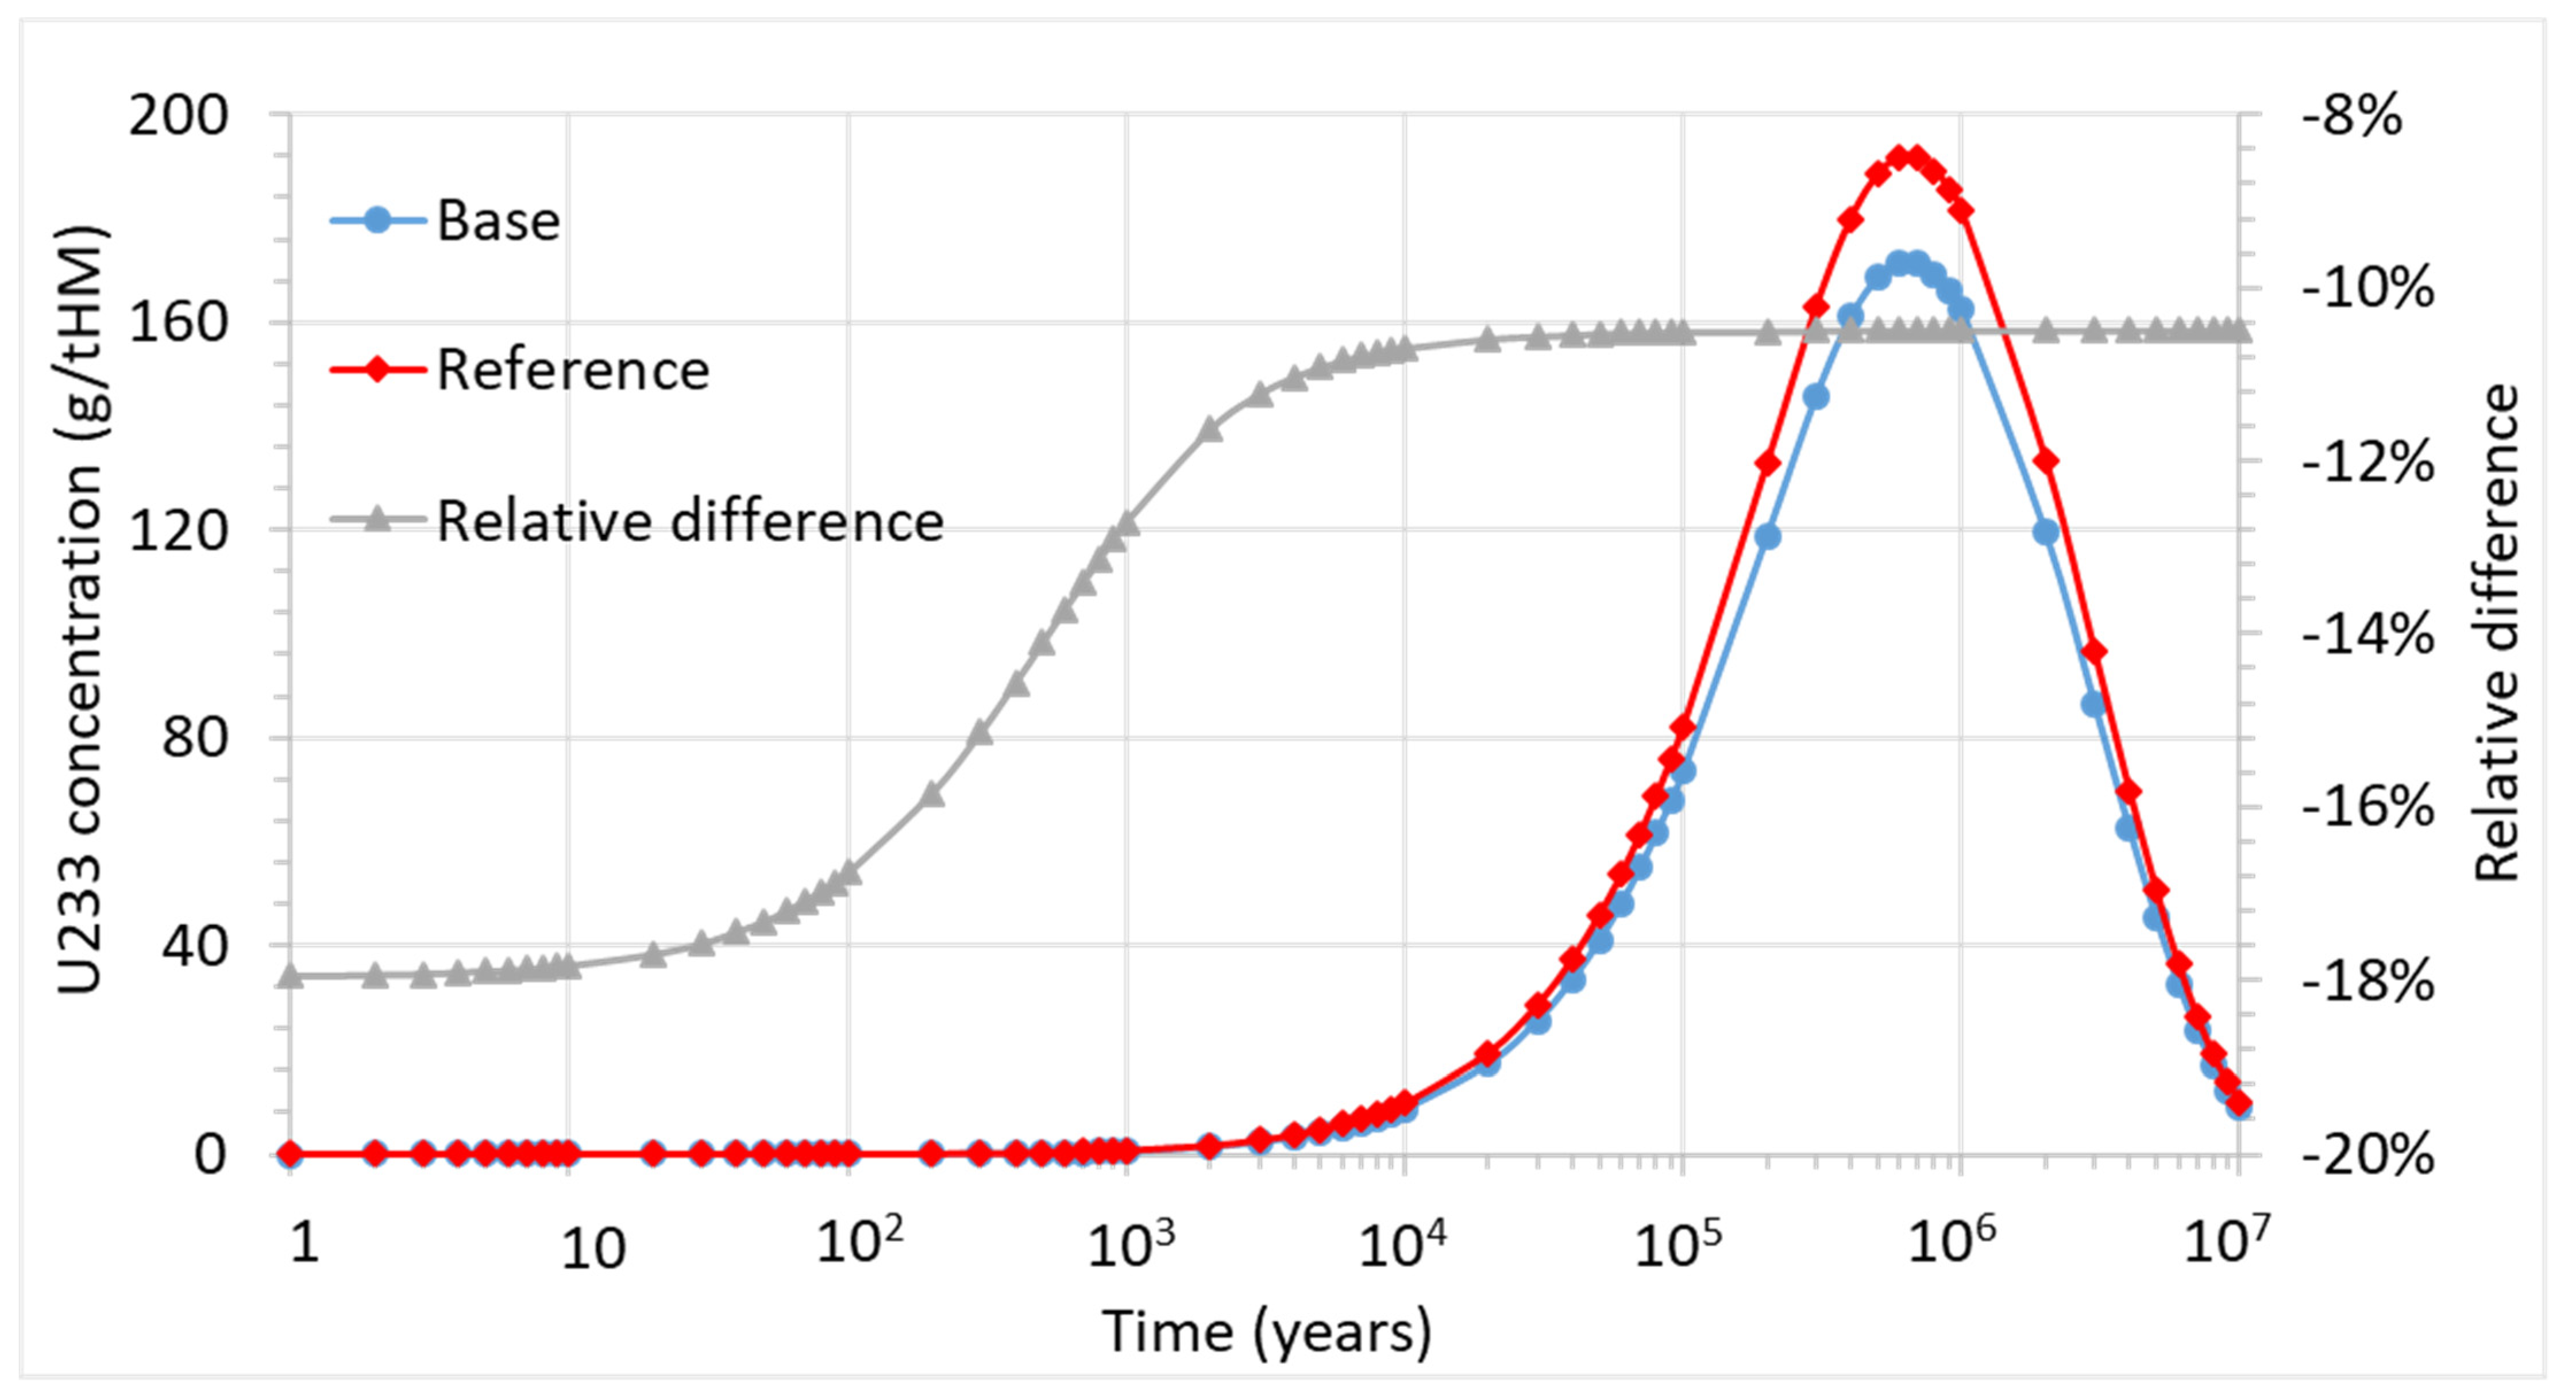
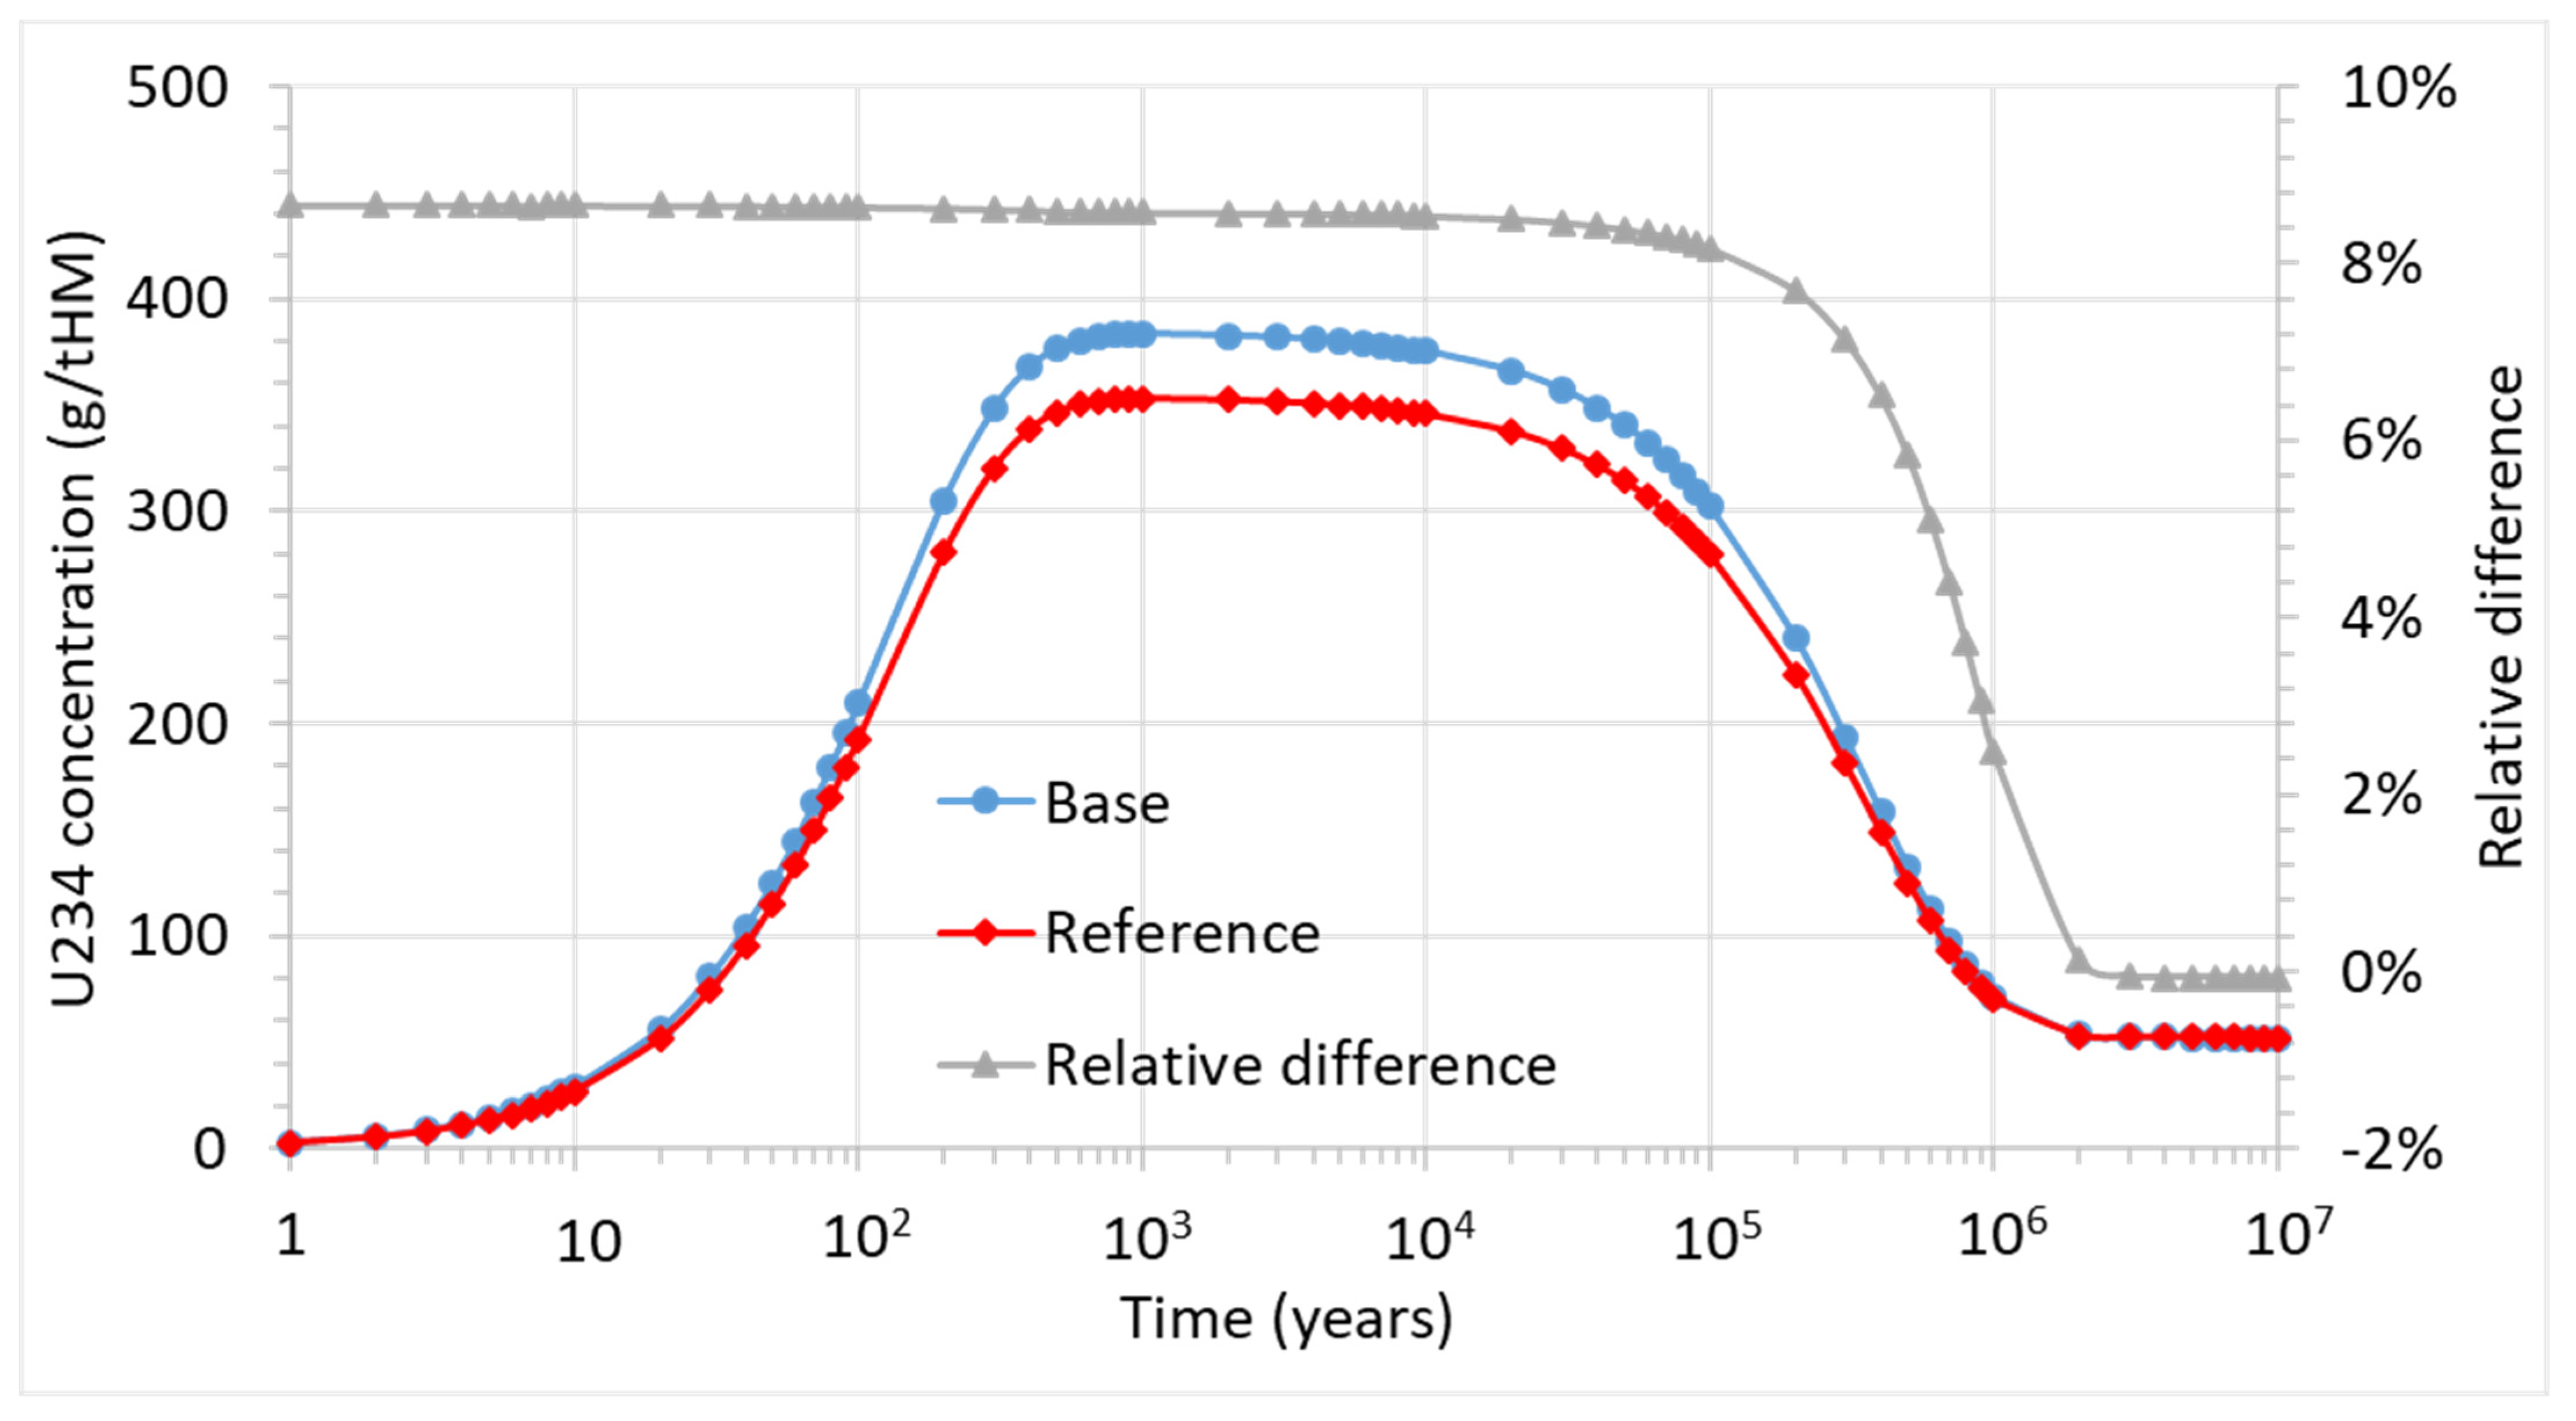
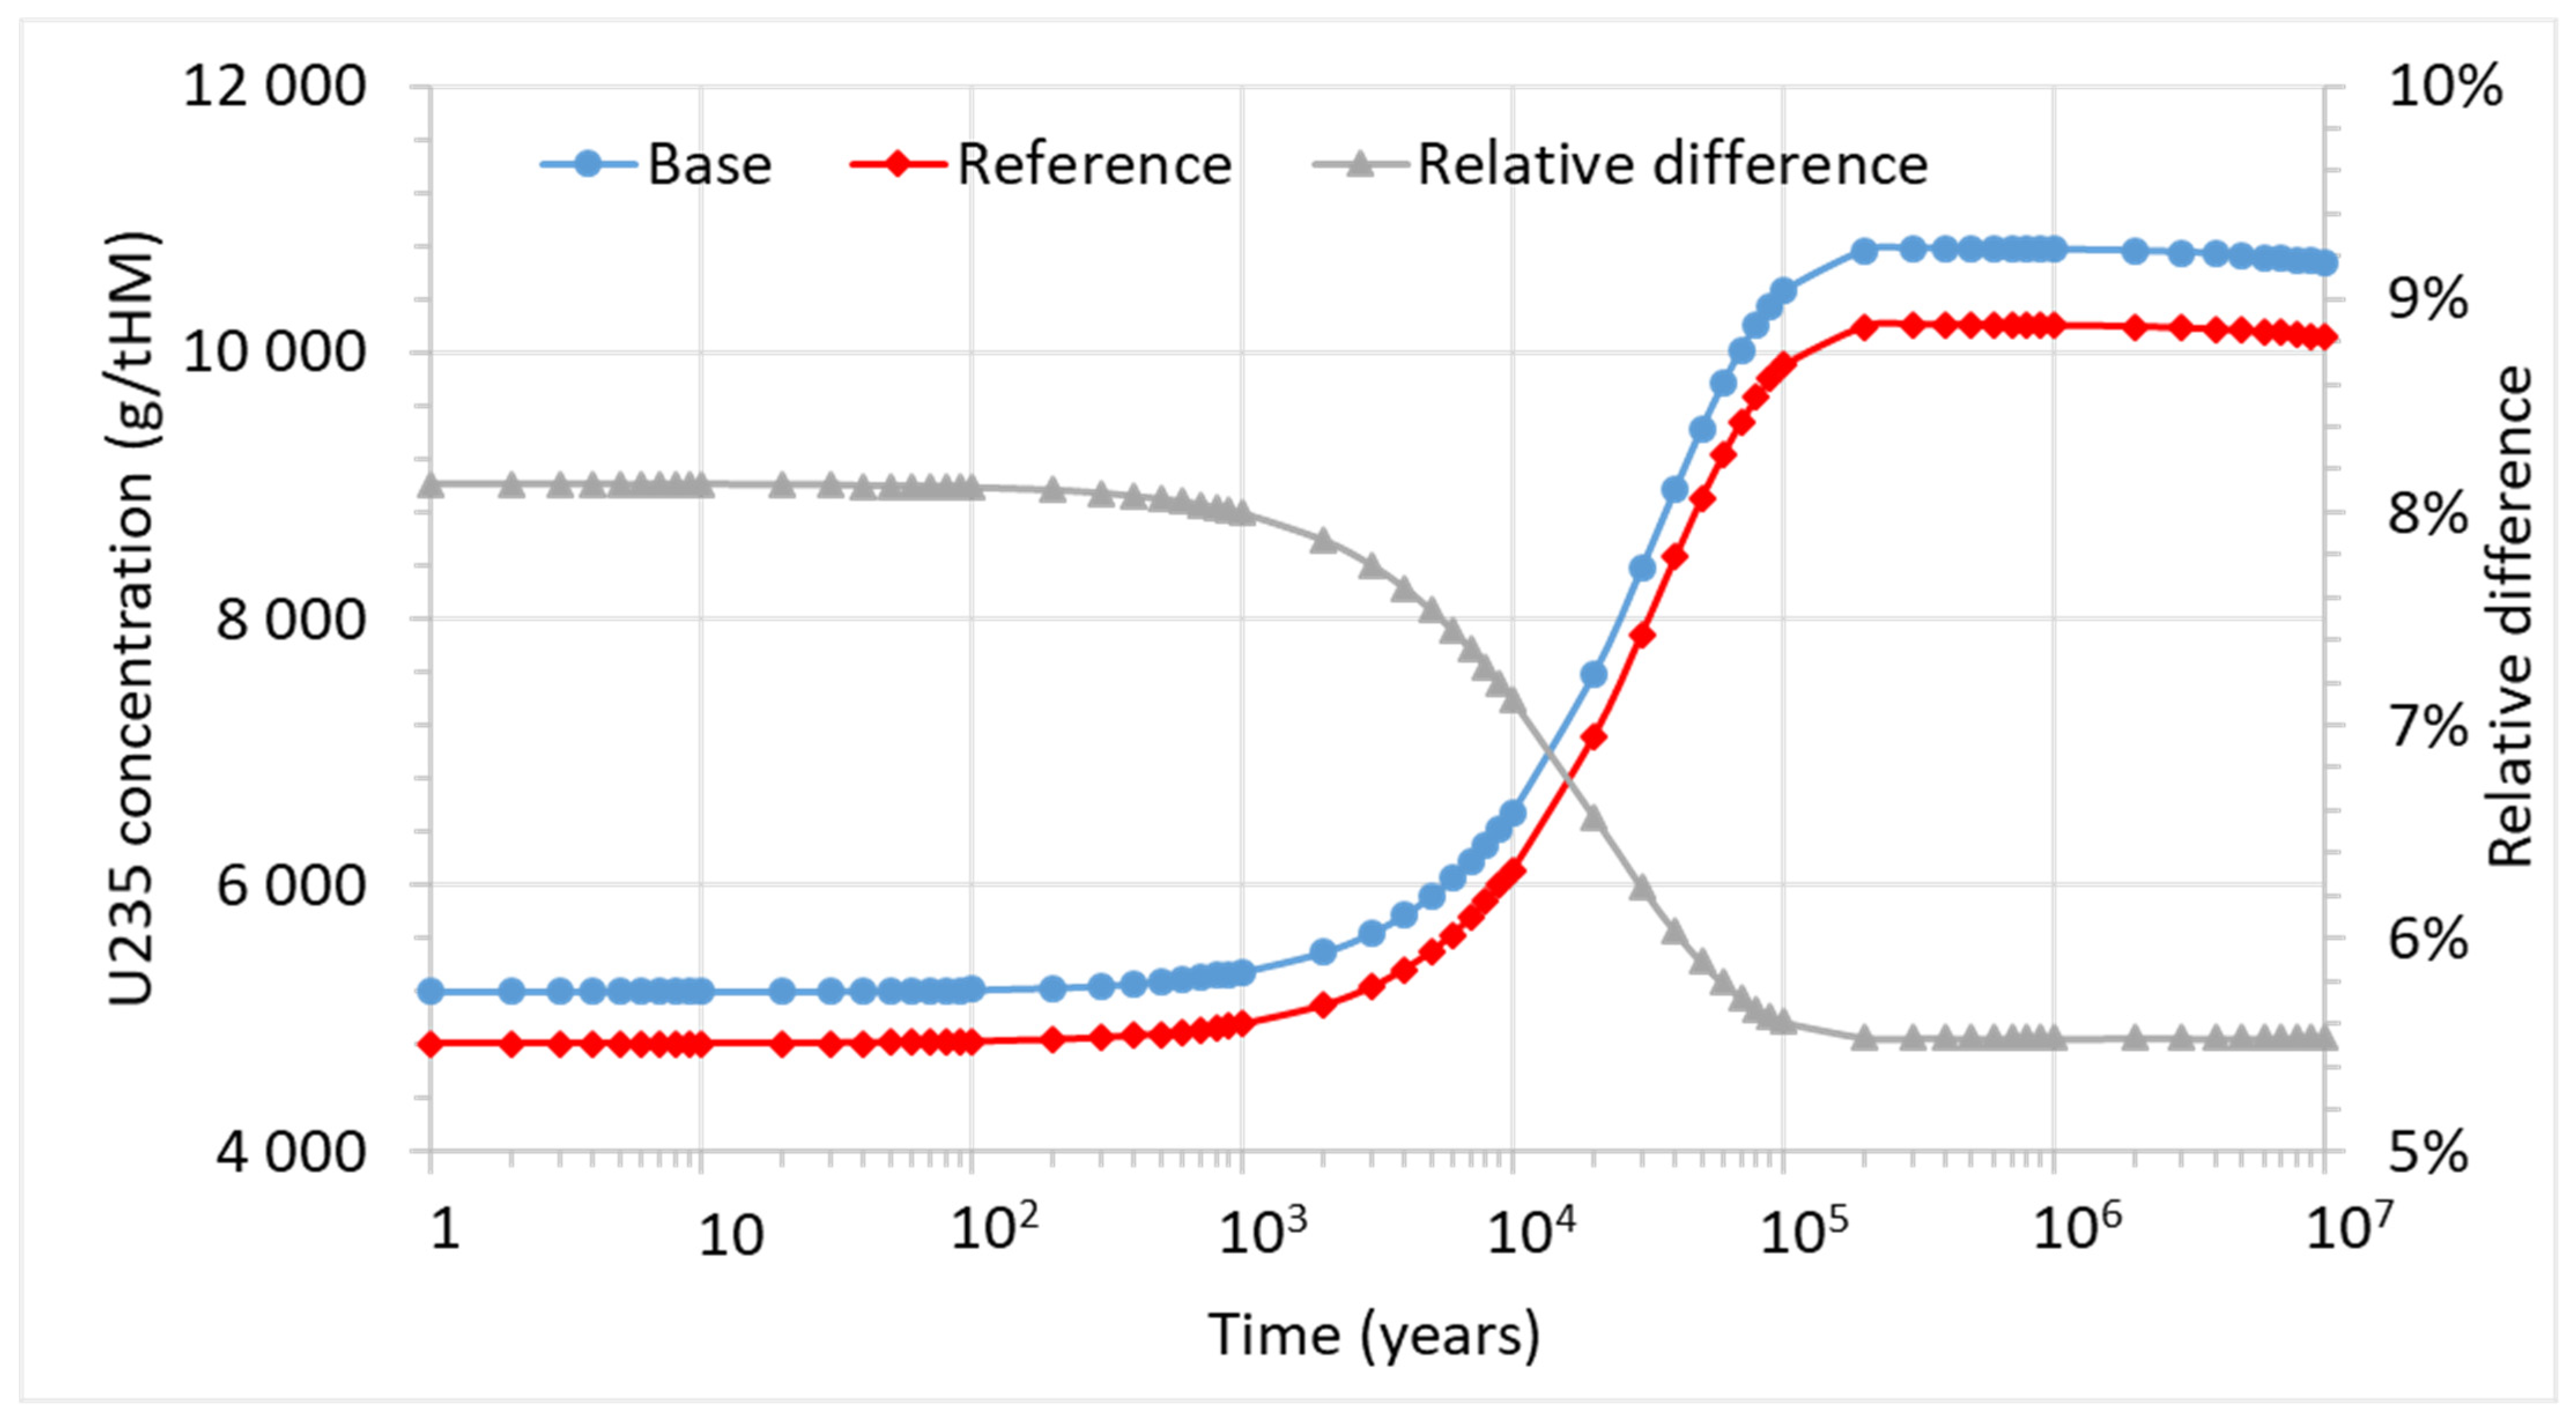
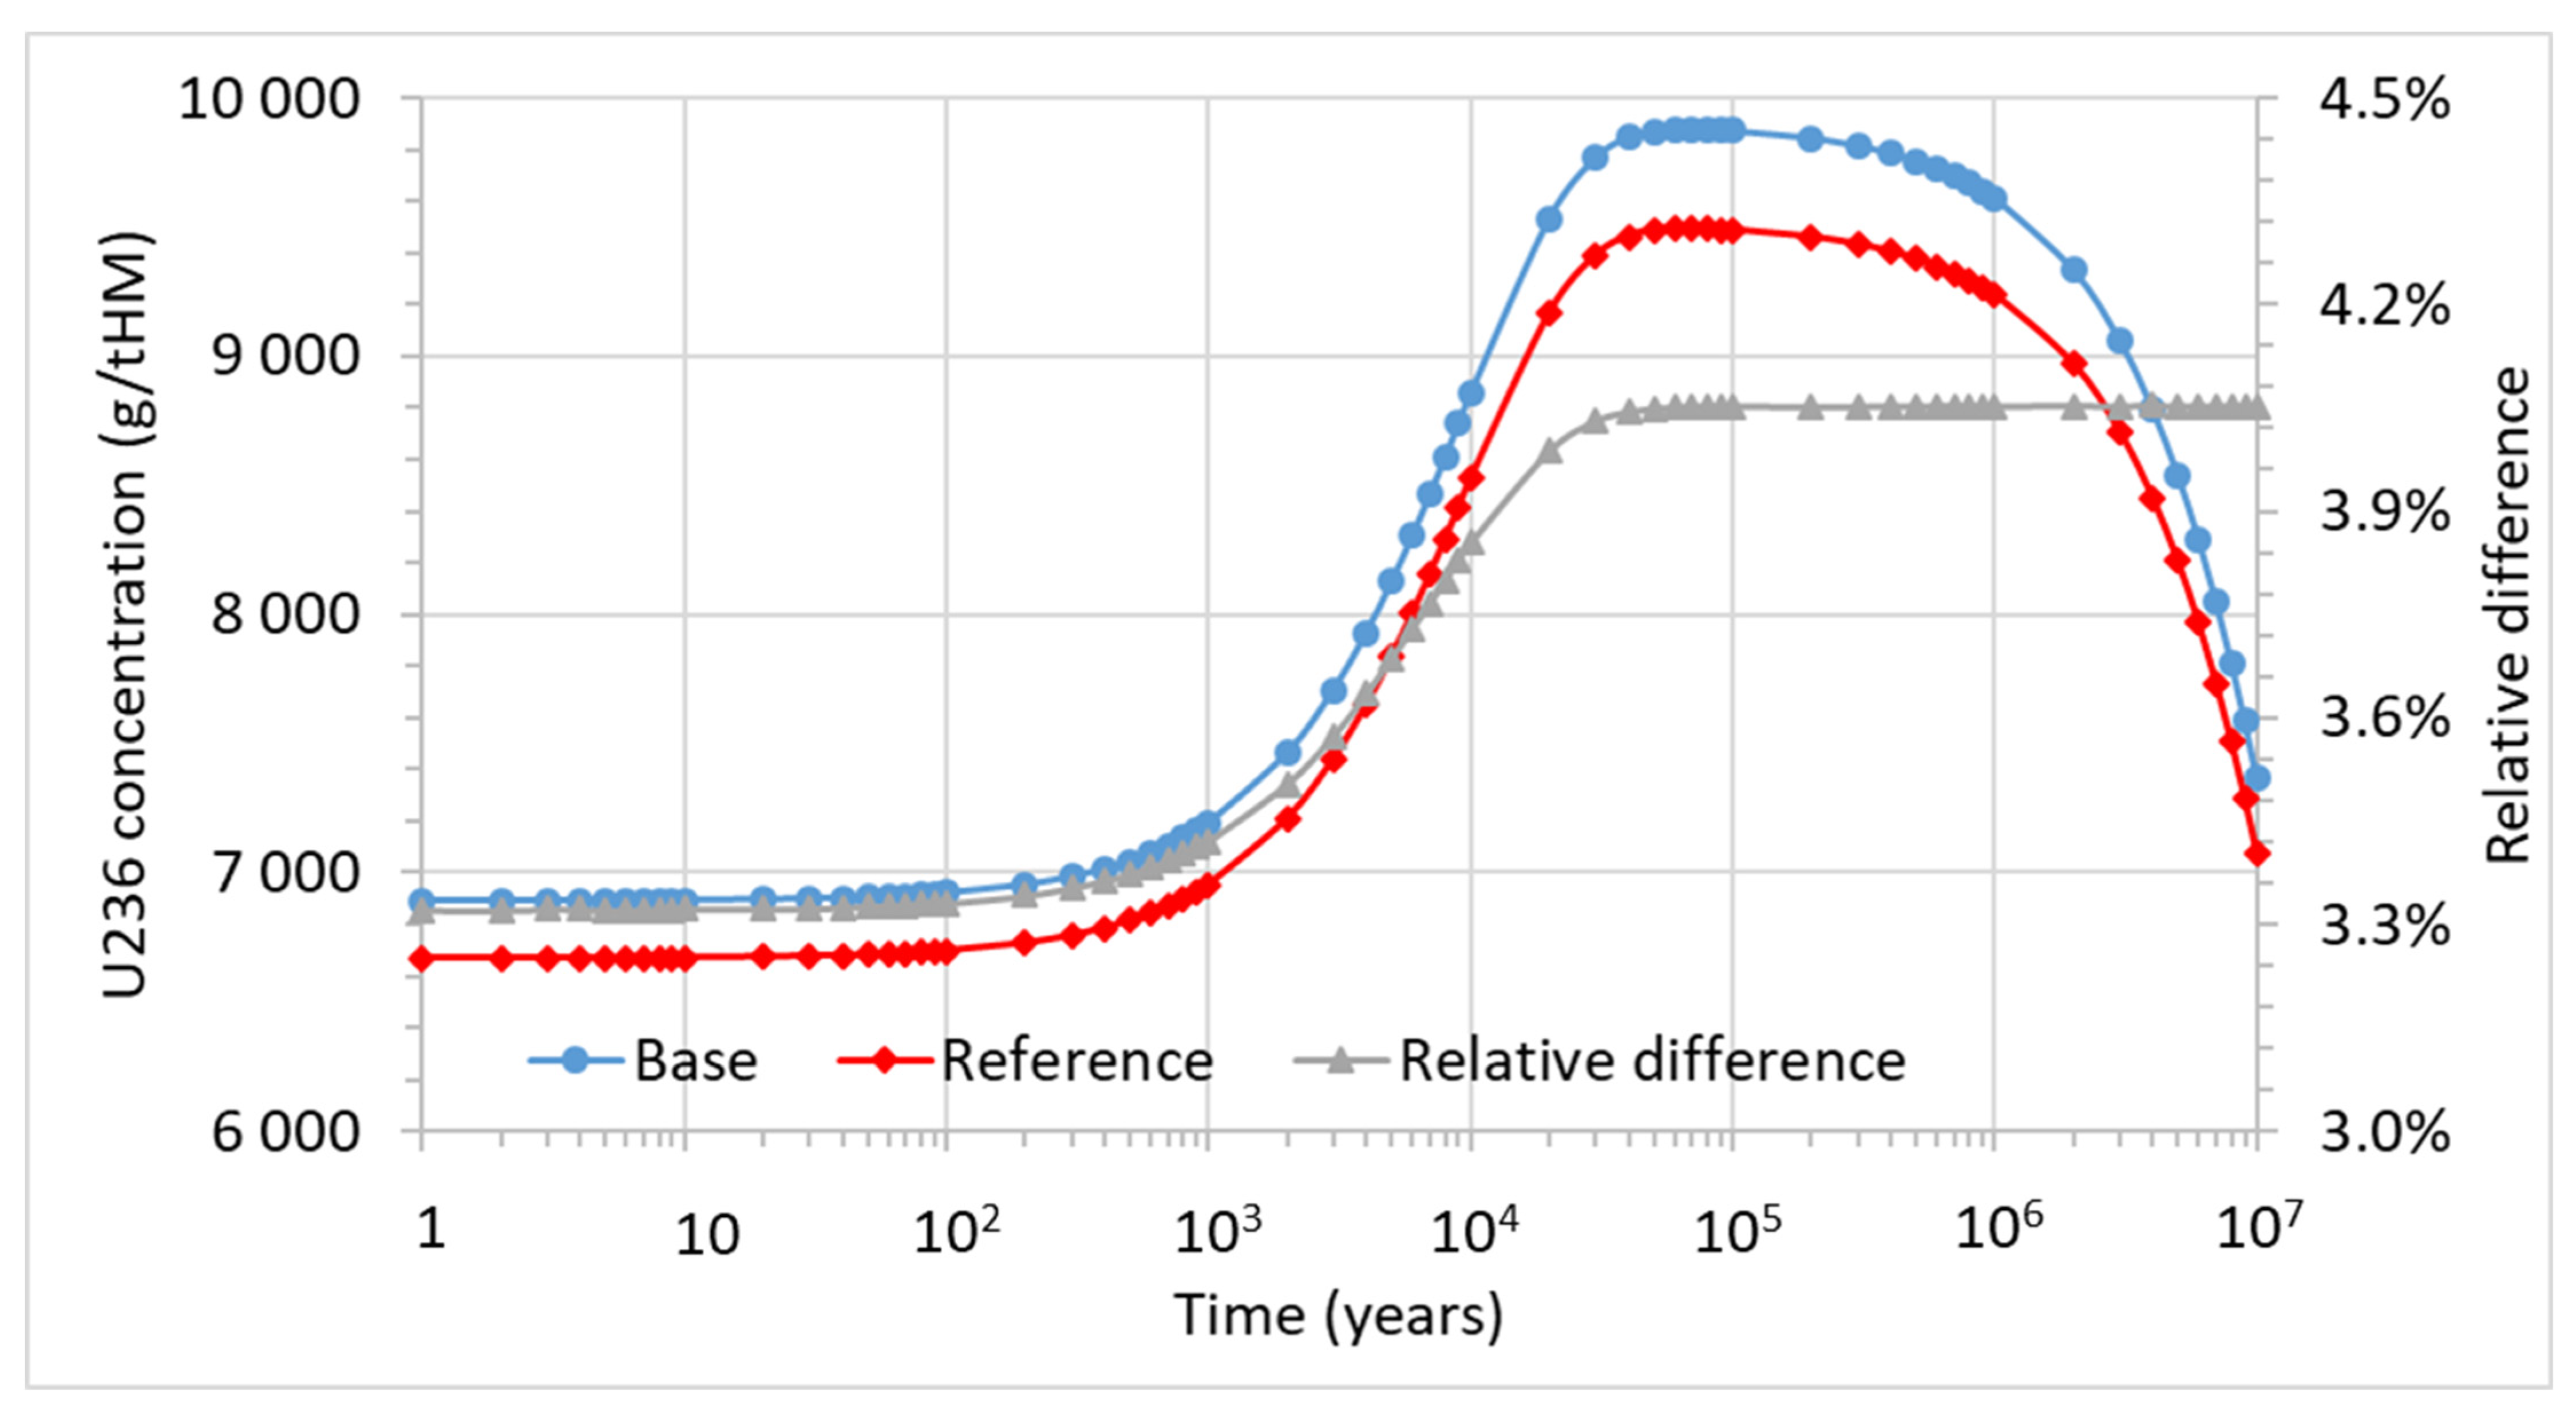
The evolution of uranium (233U, 234U, 235U, 236U) is shown in Figure 6. In the analysis, the evolution of 238U is excluded due to its low contribution to the radiotoxicity of spent nuclear fuel and minor changes in its concentration over the considered decay time. The concentration of uranium for both fuel compositions is quite stable till 103 years and then it starts to increase due to the rise in the concentration of 235U because of its formation from alpha decay of 239Pu. The peak in uranium concentration is reached at about 2 × 10⁵ years. Afterward, it starts to decrease due to the decay of the remaining uranium isotopes, especially 236U. The concentration of uranium for base fuel composition is higher by about 5% during considered decay time. The evolution of relative difference shows a fall at about 106 years. The fall corresponds mainly to the intensified production of 233U from the beta decay of 233Pa, which is produced in alpha decay of 237Np, the concentration of which is higher for the reference fuel composition. Figure 7, Figure 8, Figure 9 and Figure 10 show evolutions of considered uranium isotopes.
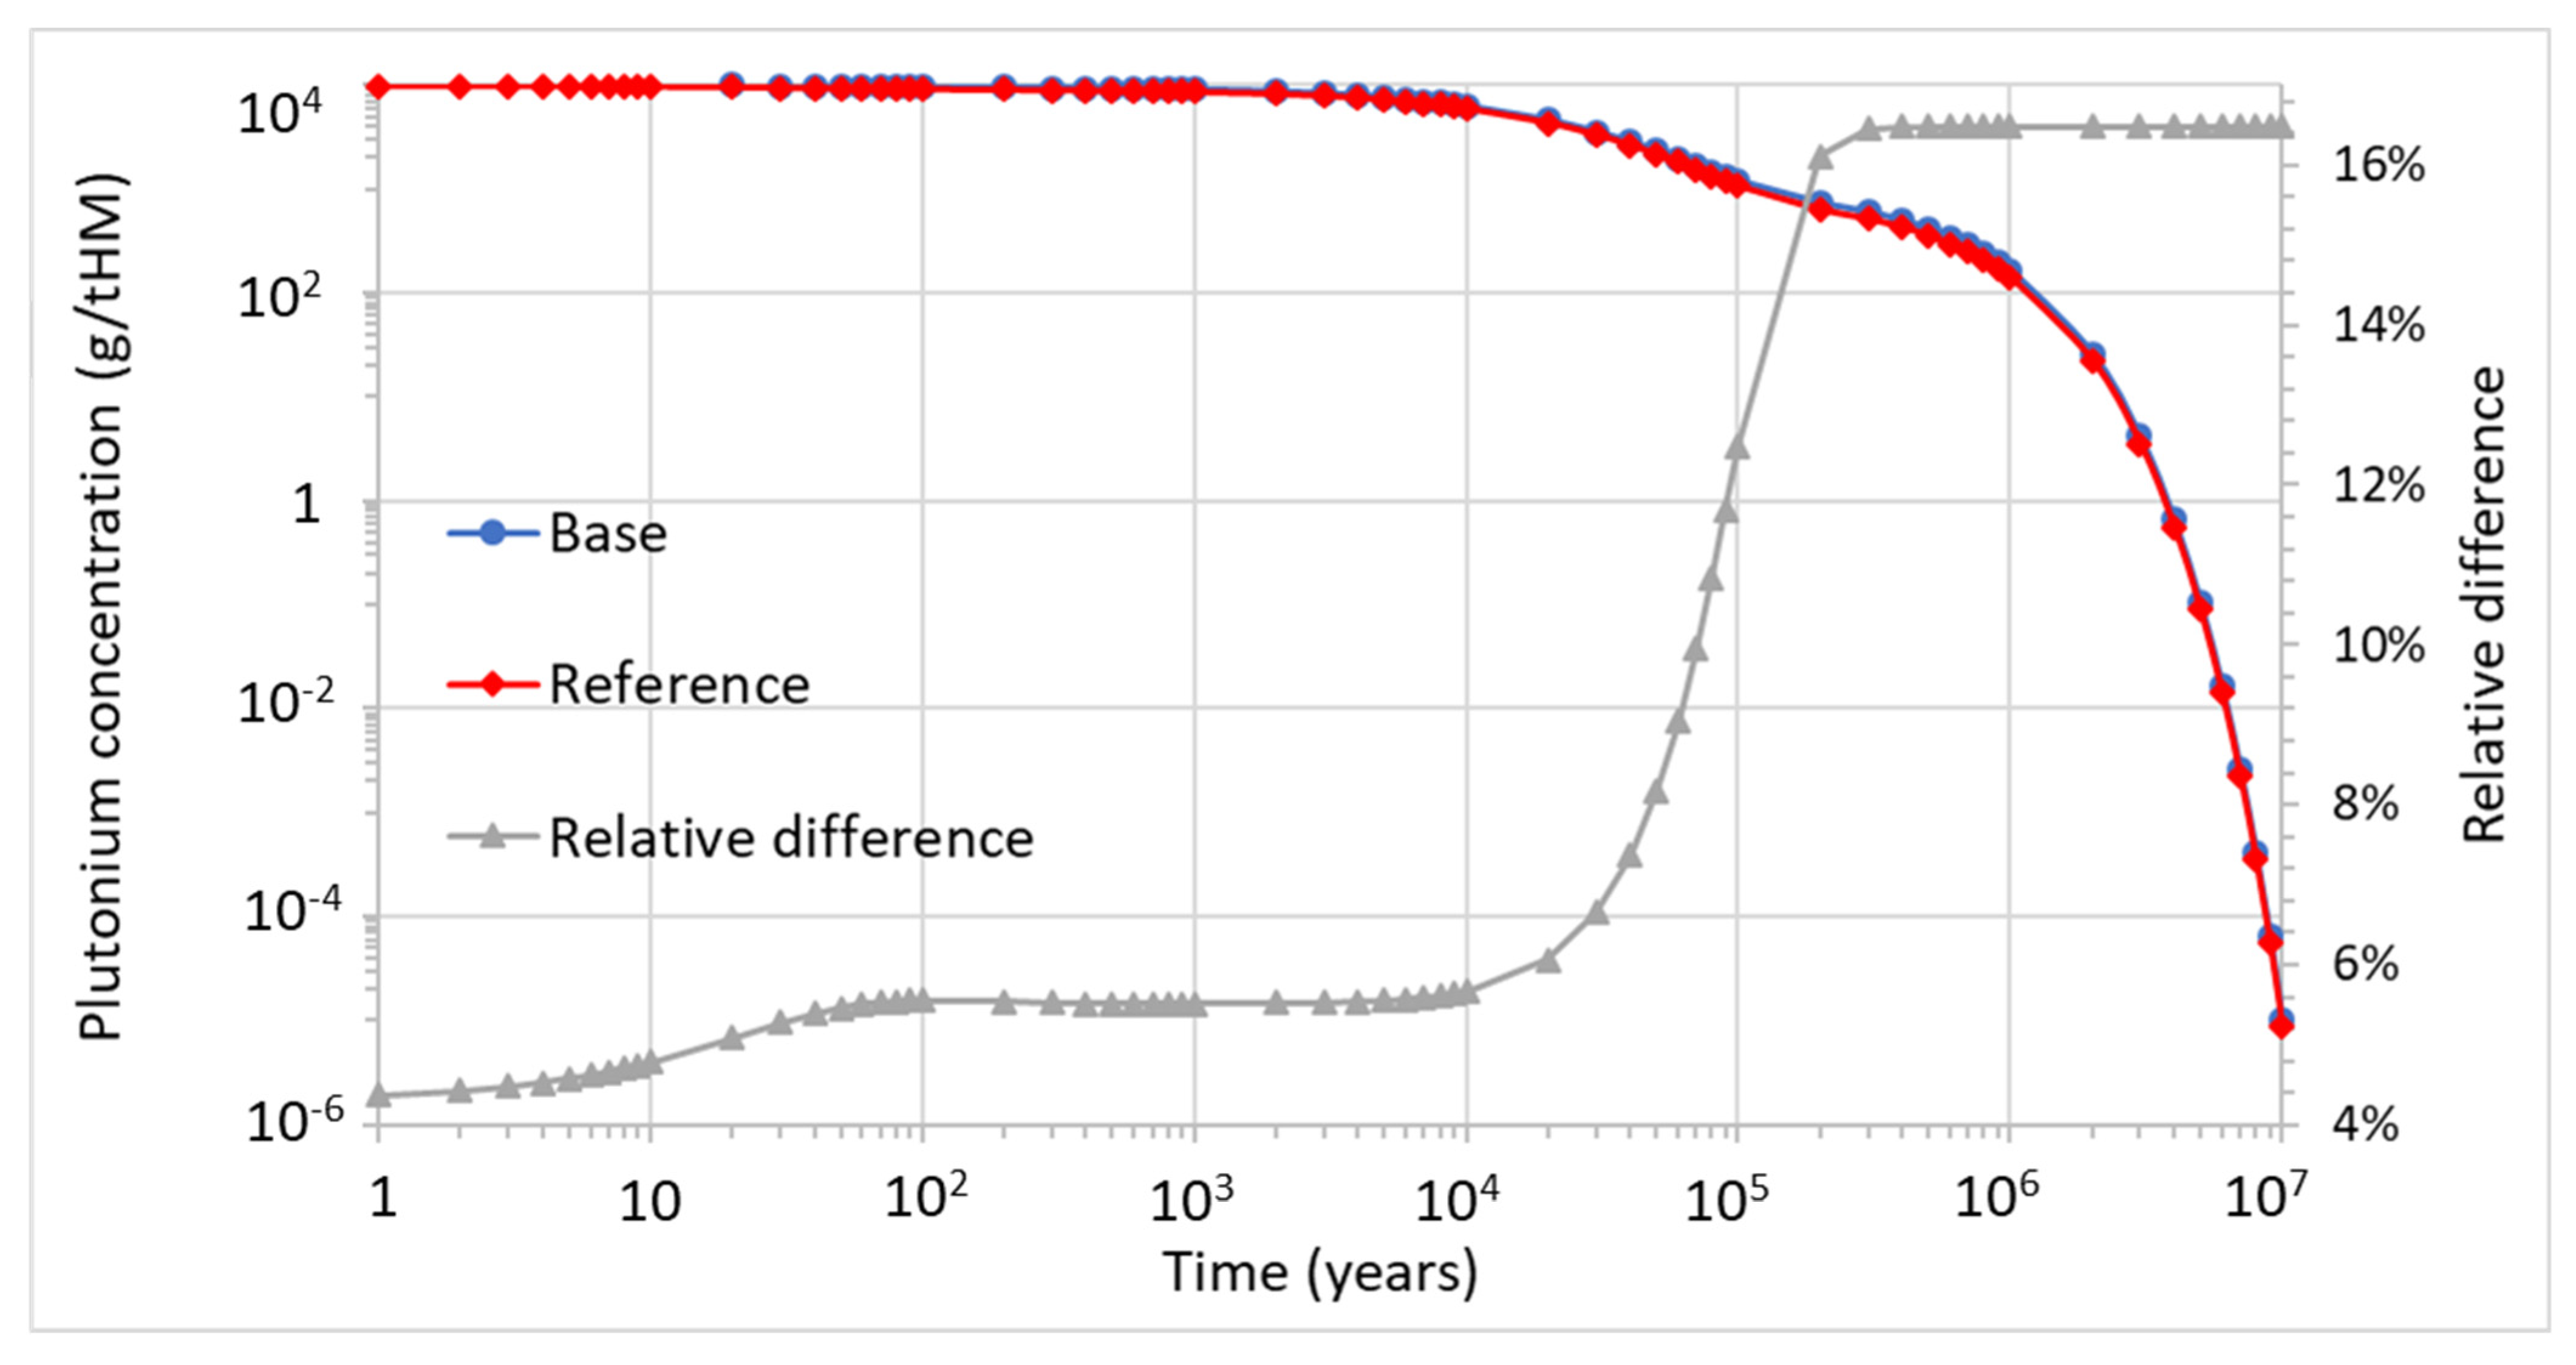
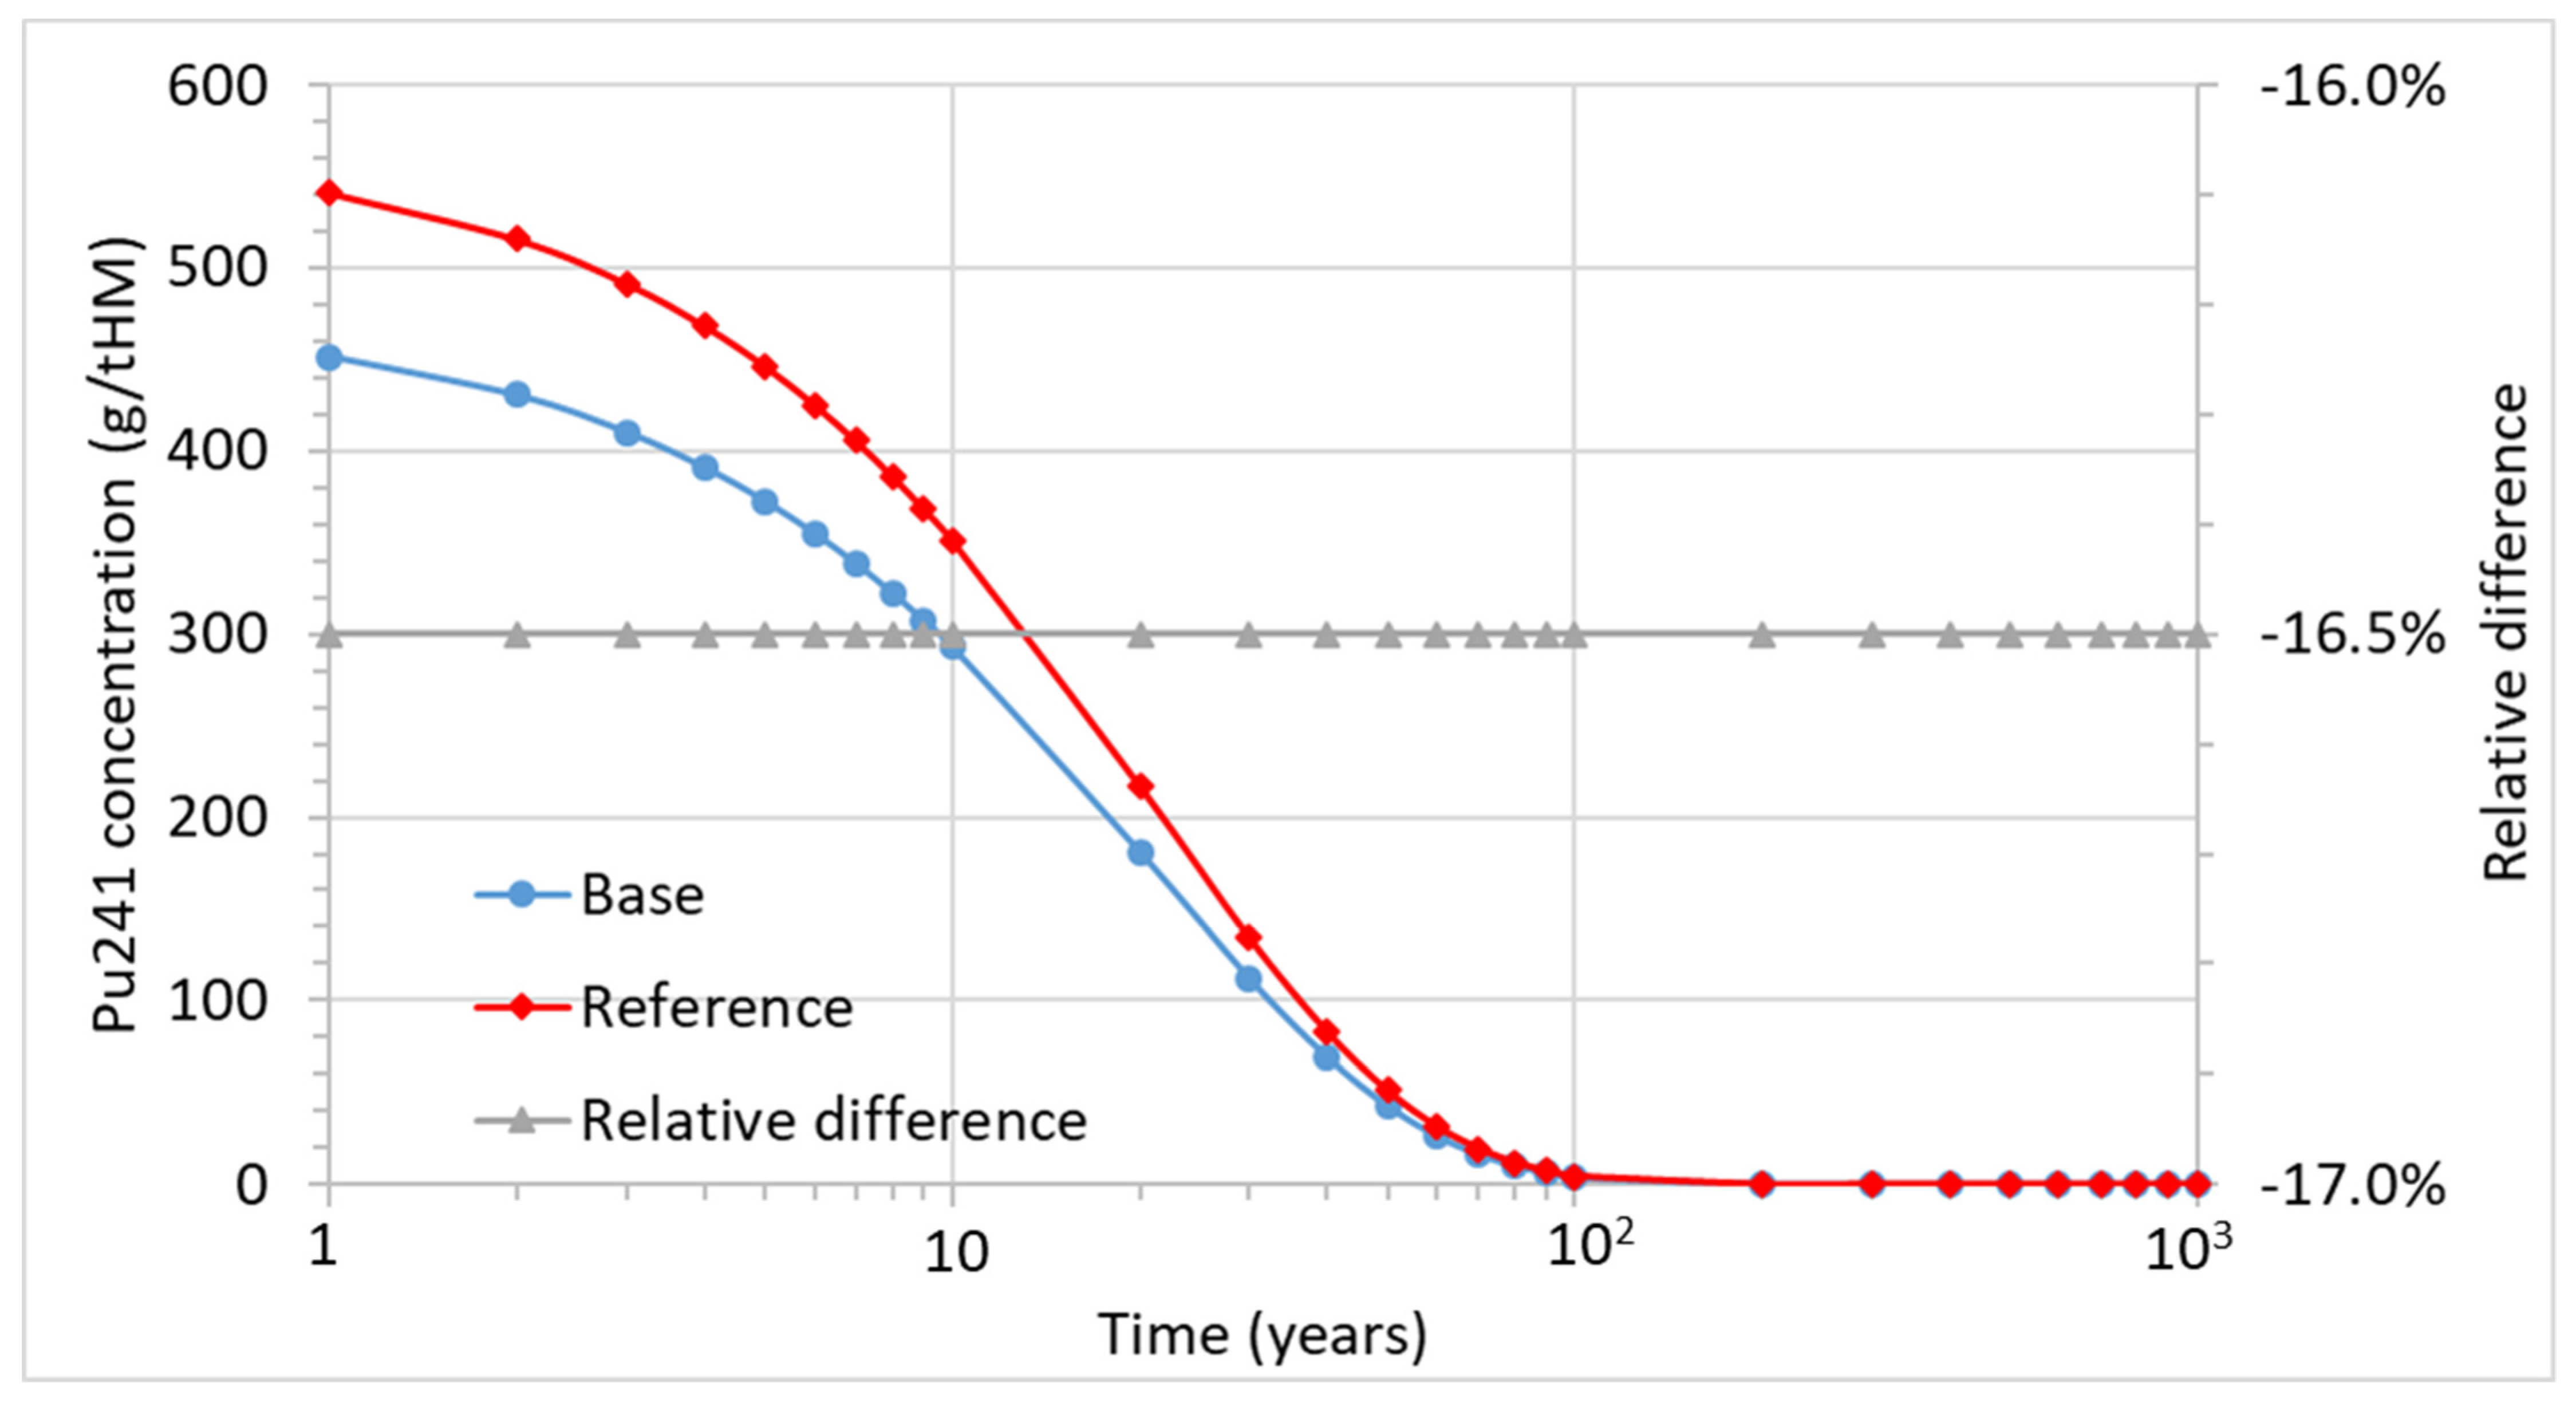
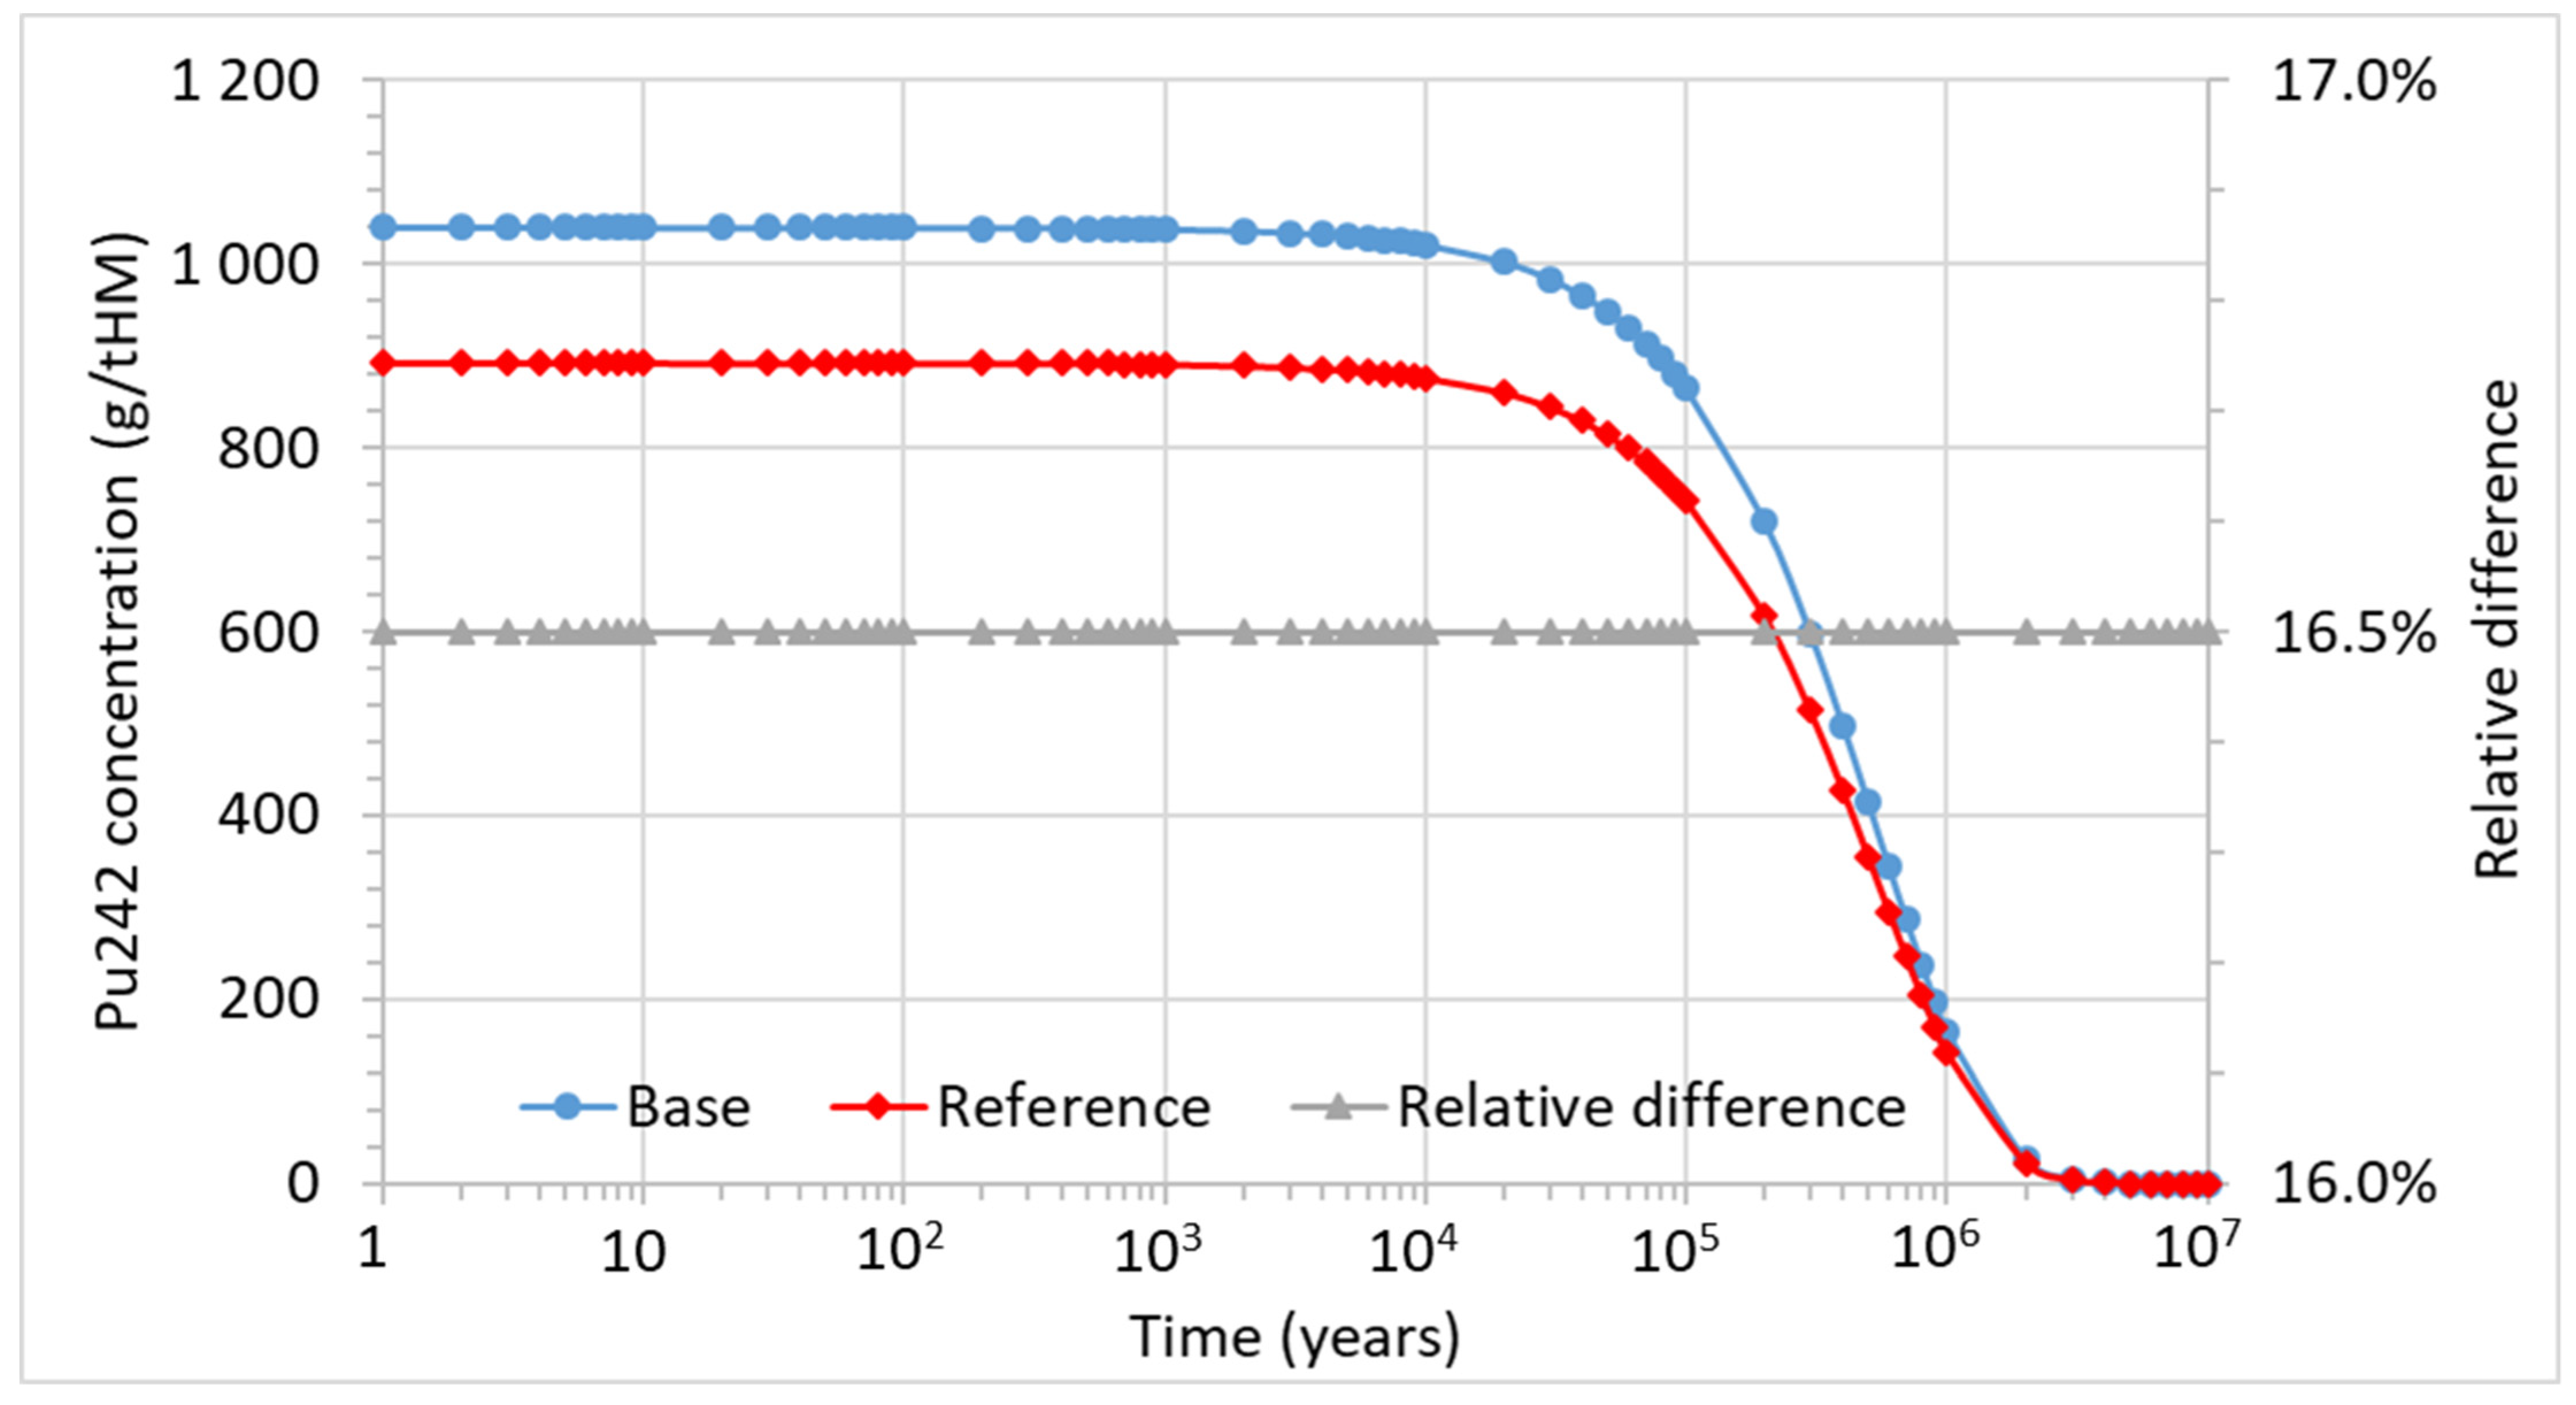
The evolution of plutonium (238Pu, 239Pu,240Pu,241Pu,242Pu) is considered in Figure 11. A decrease in the concentration of plutonium from about 104 years is mainly driven by the decay of 239Pu and 240Pu. The significant drop in the concentration from 105 years is caused by the decay of 242Pu. The decays of 238Pu and 241Pu do not contribute significantly to the shapes of the curves due to their’ lower concentrations compared to the remaining plutonium isotopes. The concentration of plutonium is higher for the base fuel composition during the decay period. Initially, the difference equals about 4% but, from about 104 years to 105 years, increases to 16%, which is related to the higher concentration of 242Pu for base fuel composition. Figure 12, Figure 13, Figure 14, Figure 15 and Figure 16 show evolutions of considered plutonium isotopes.
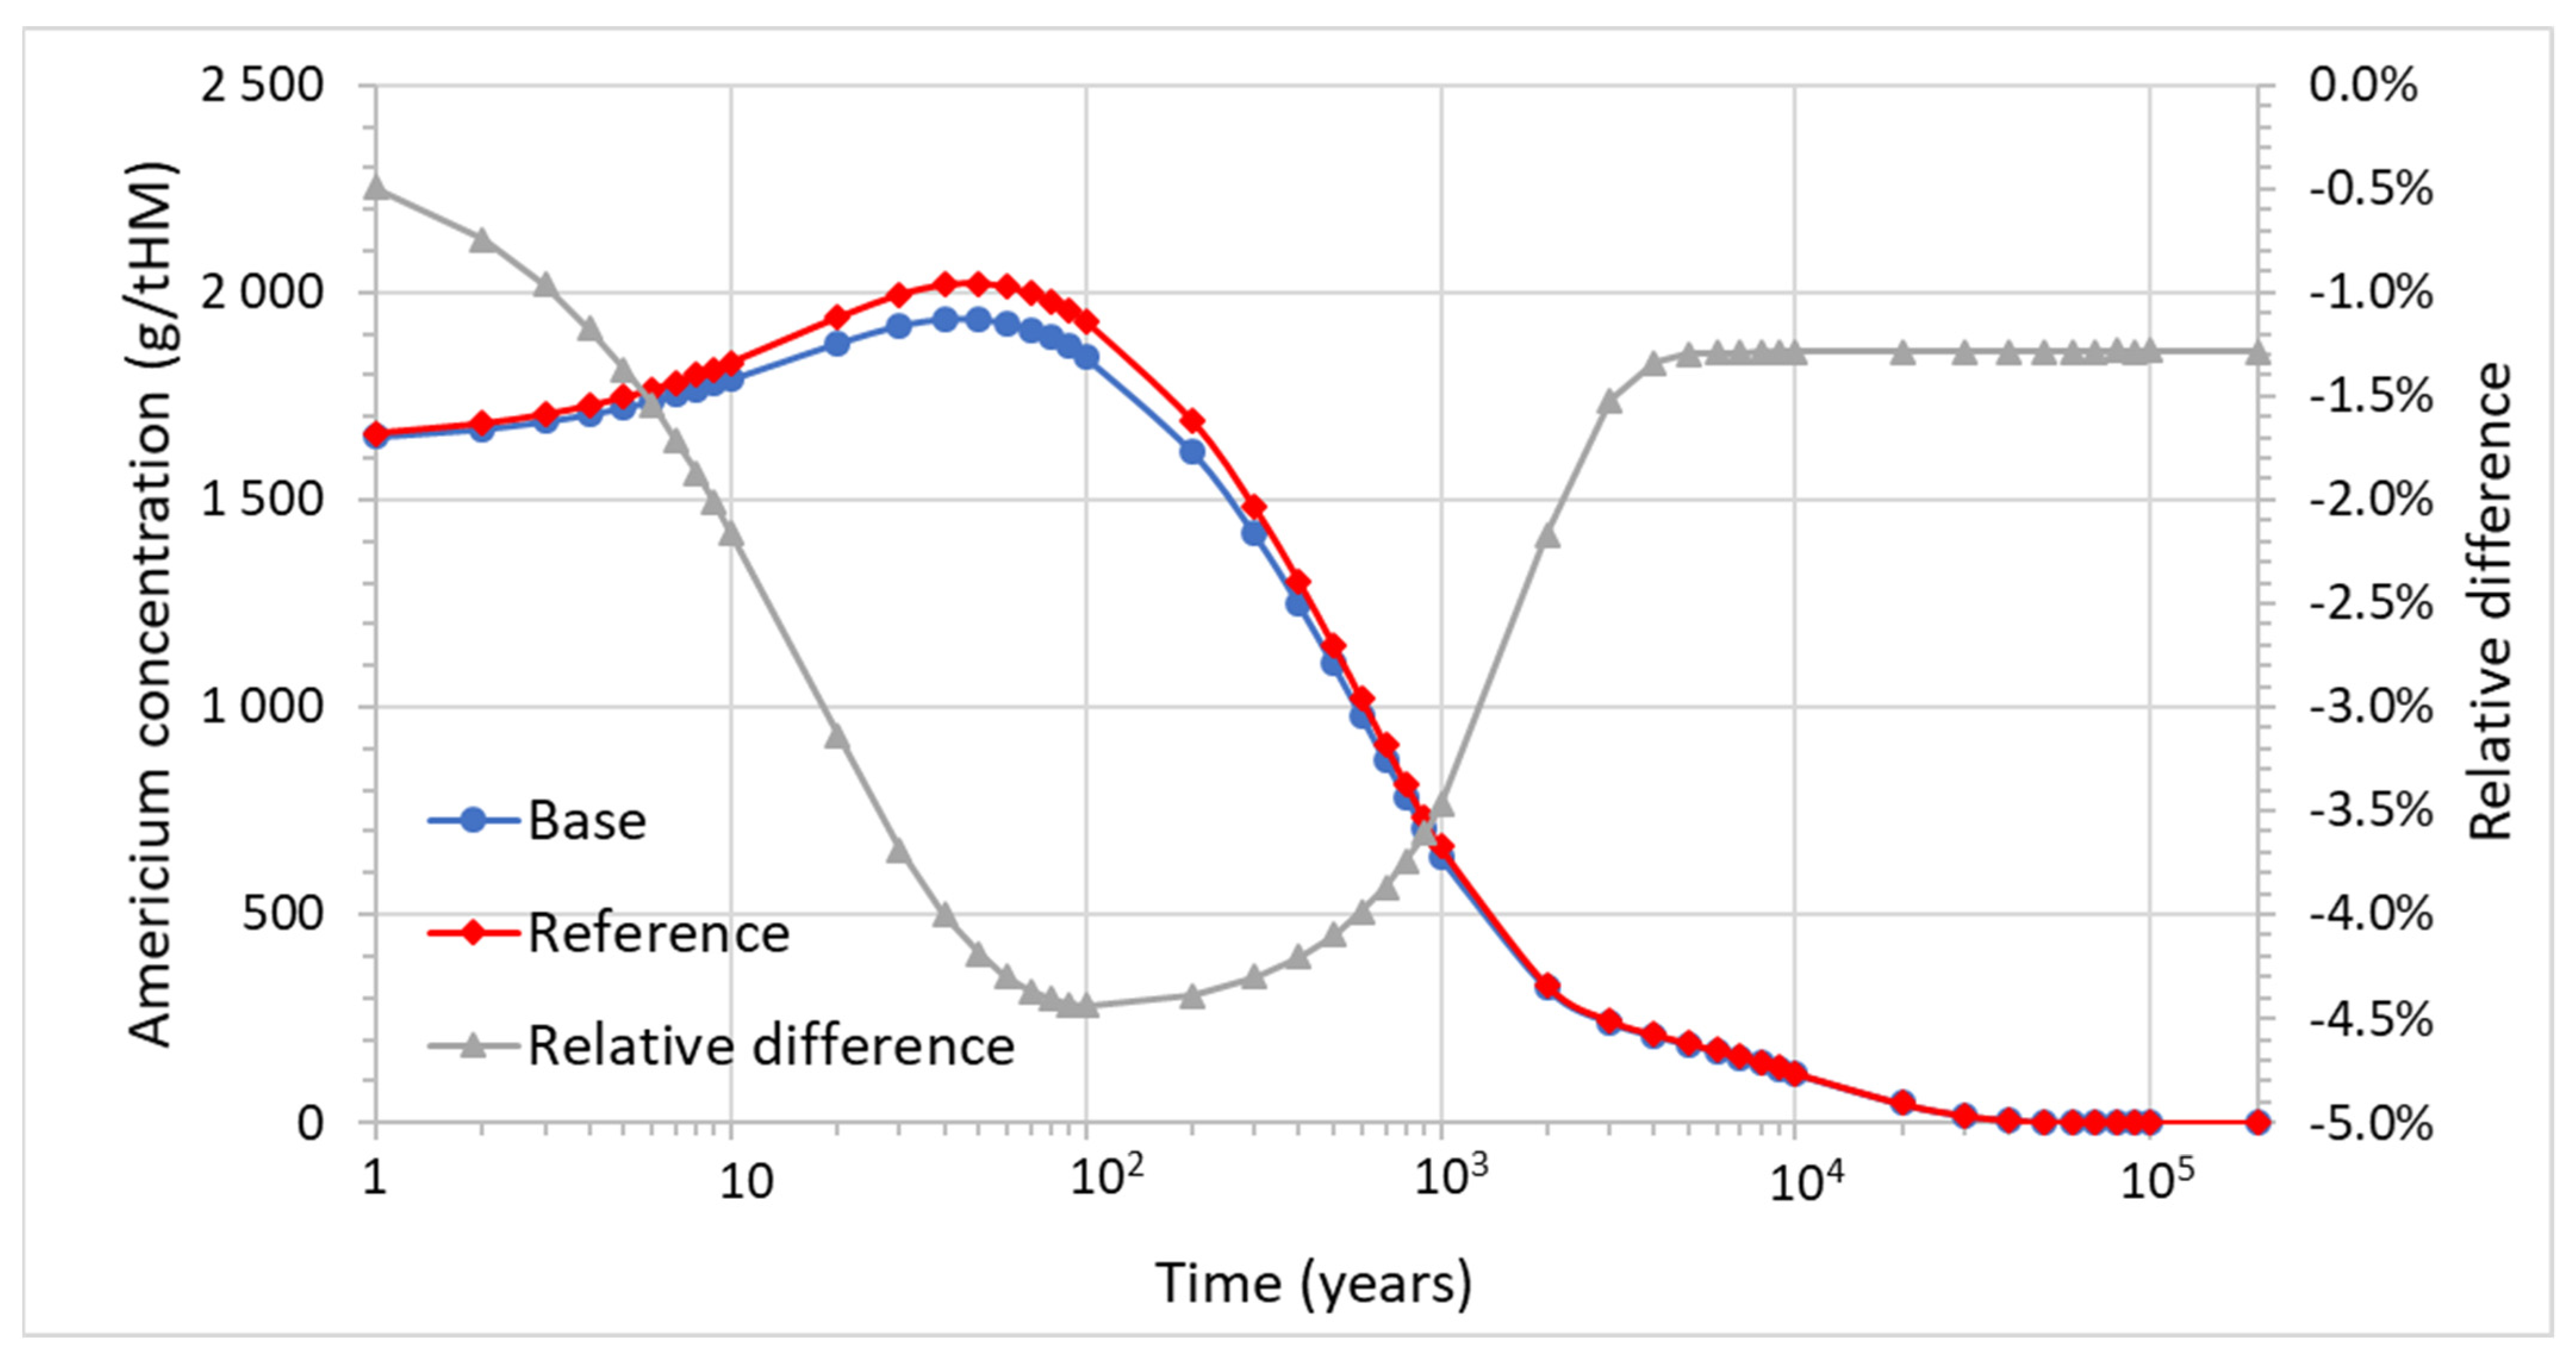
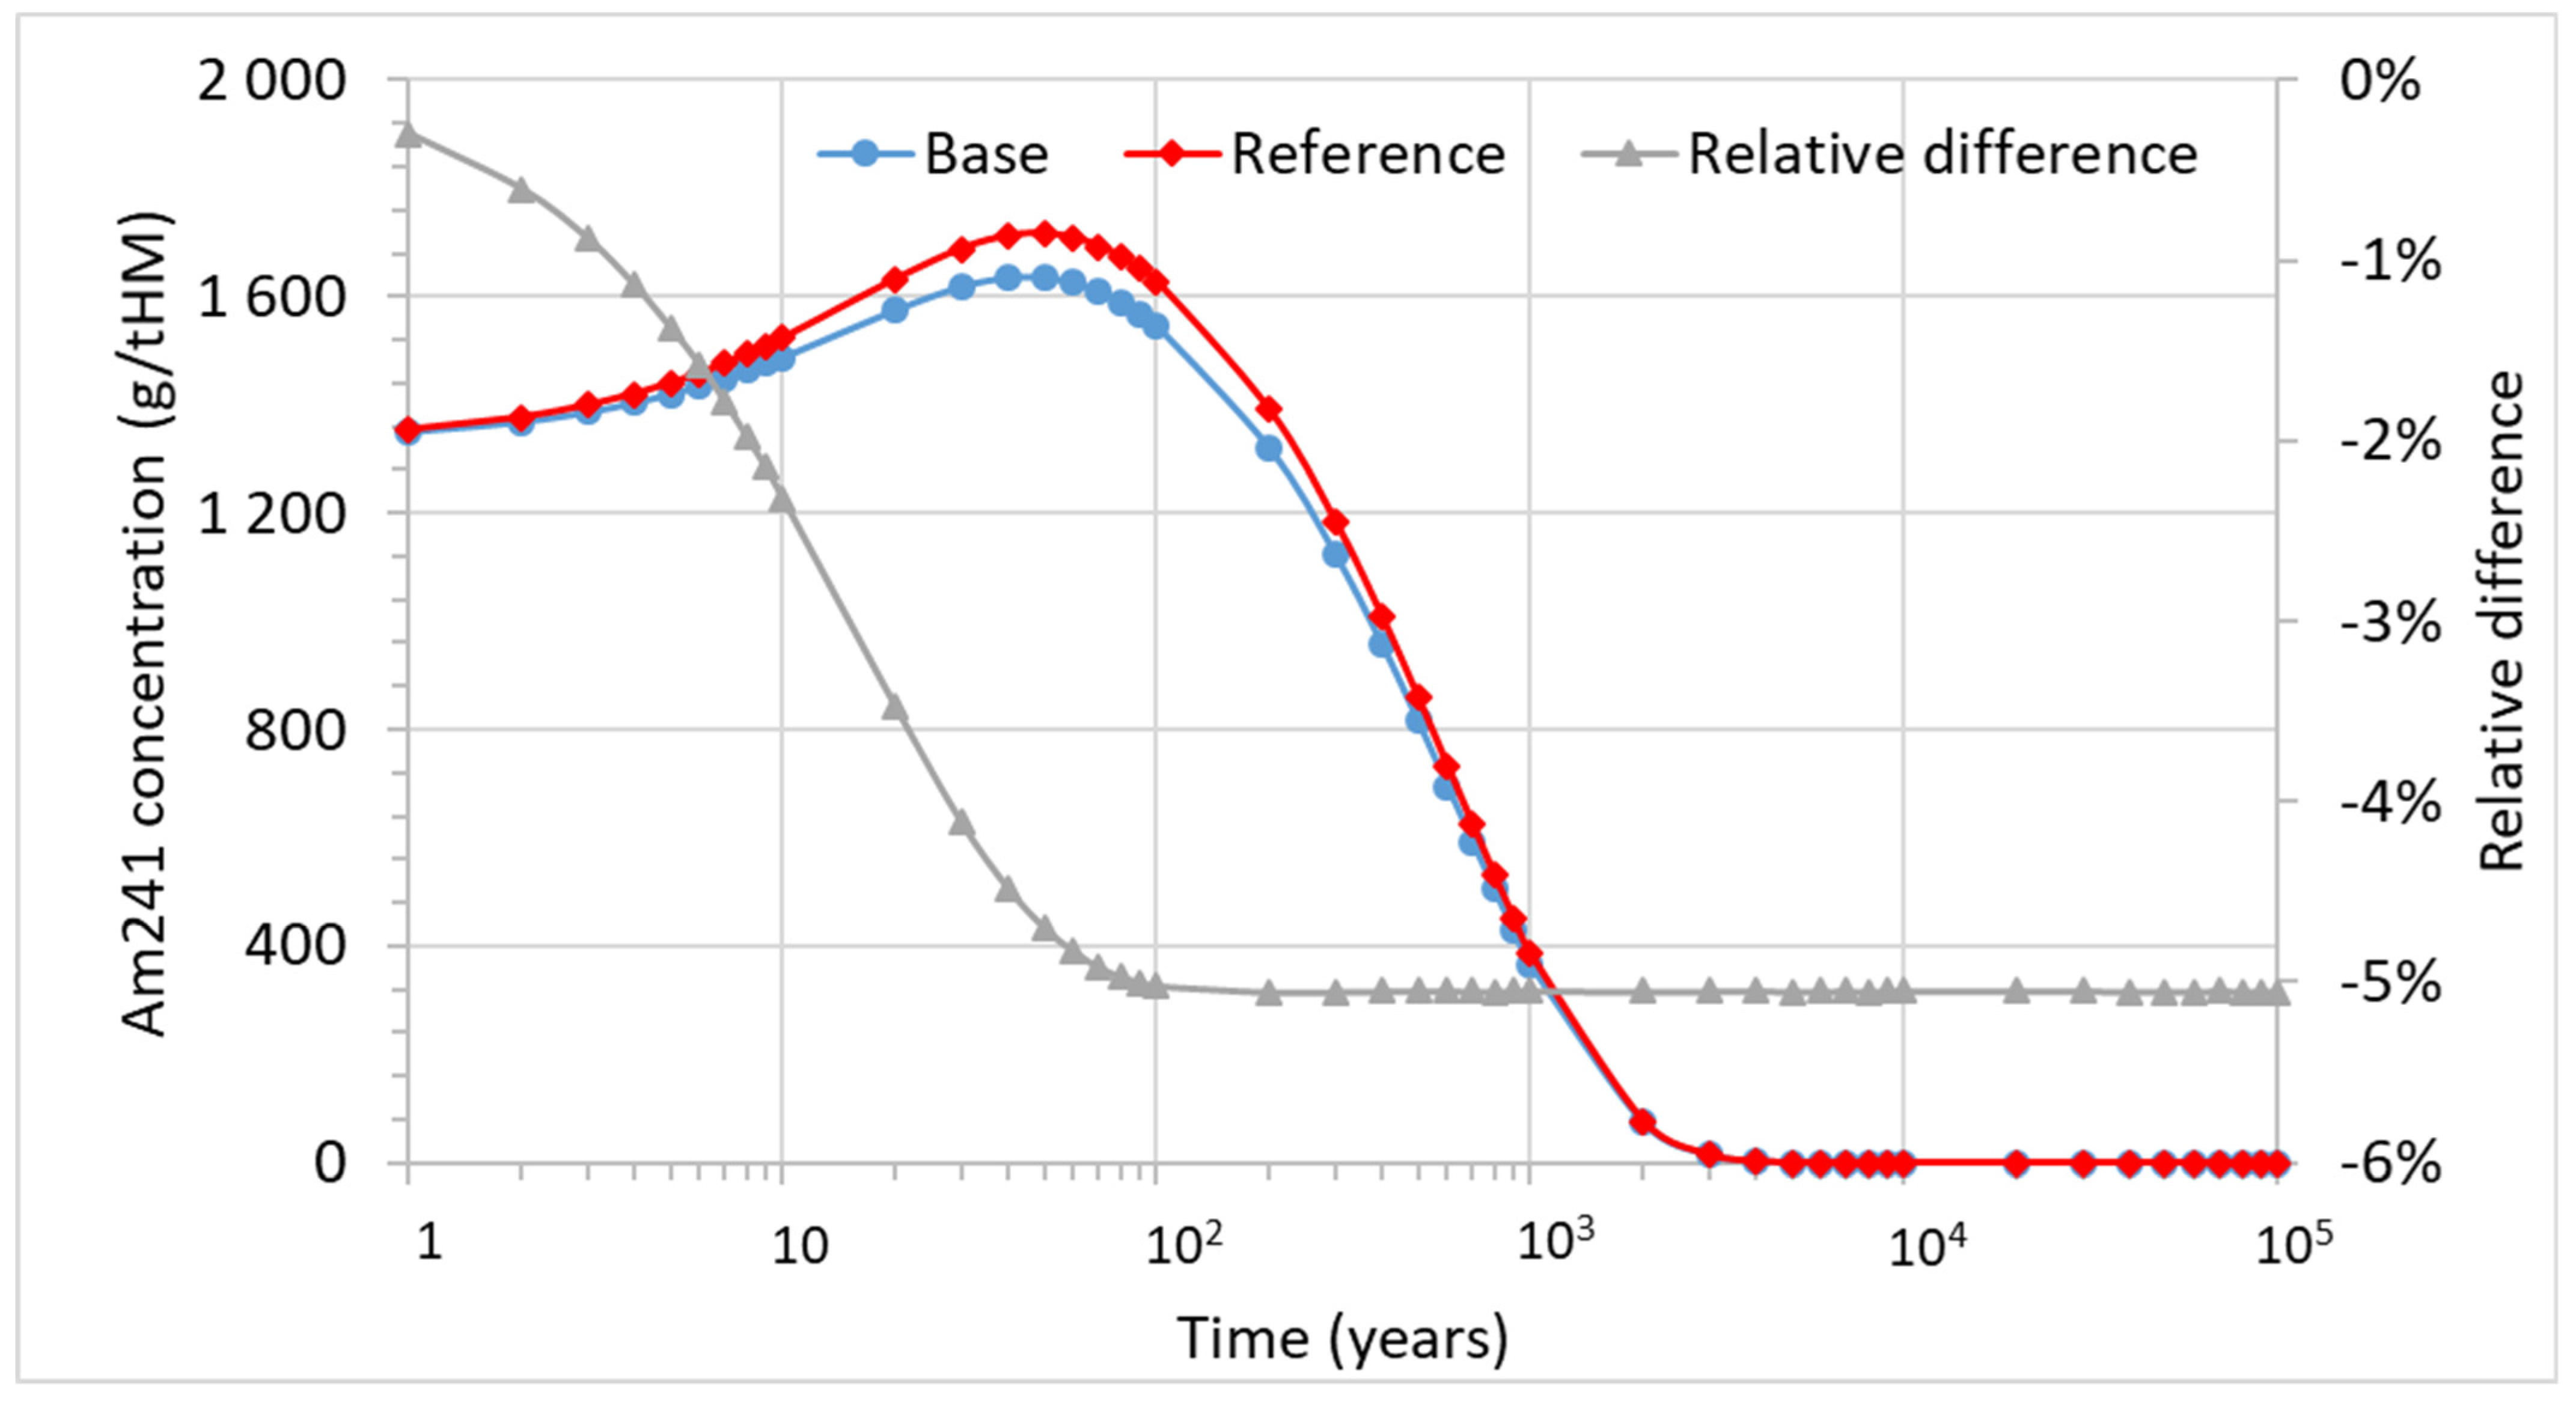
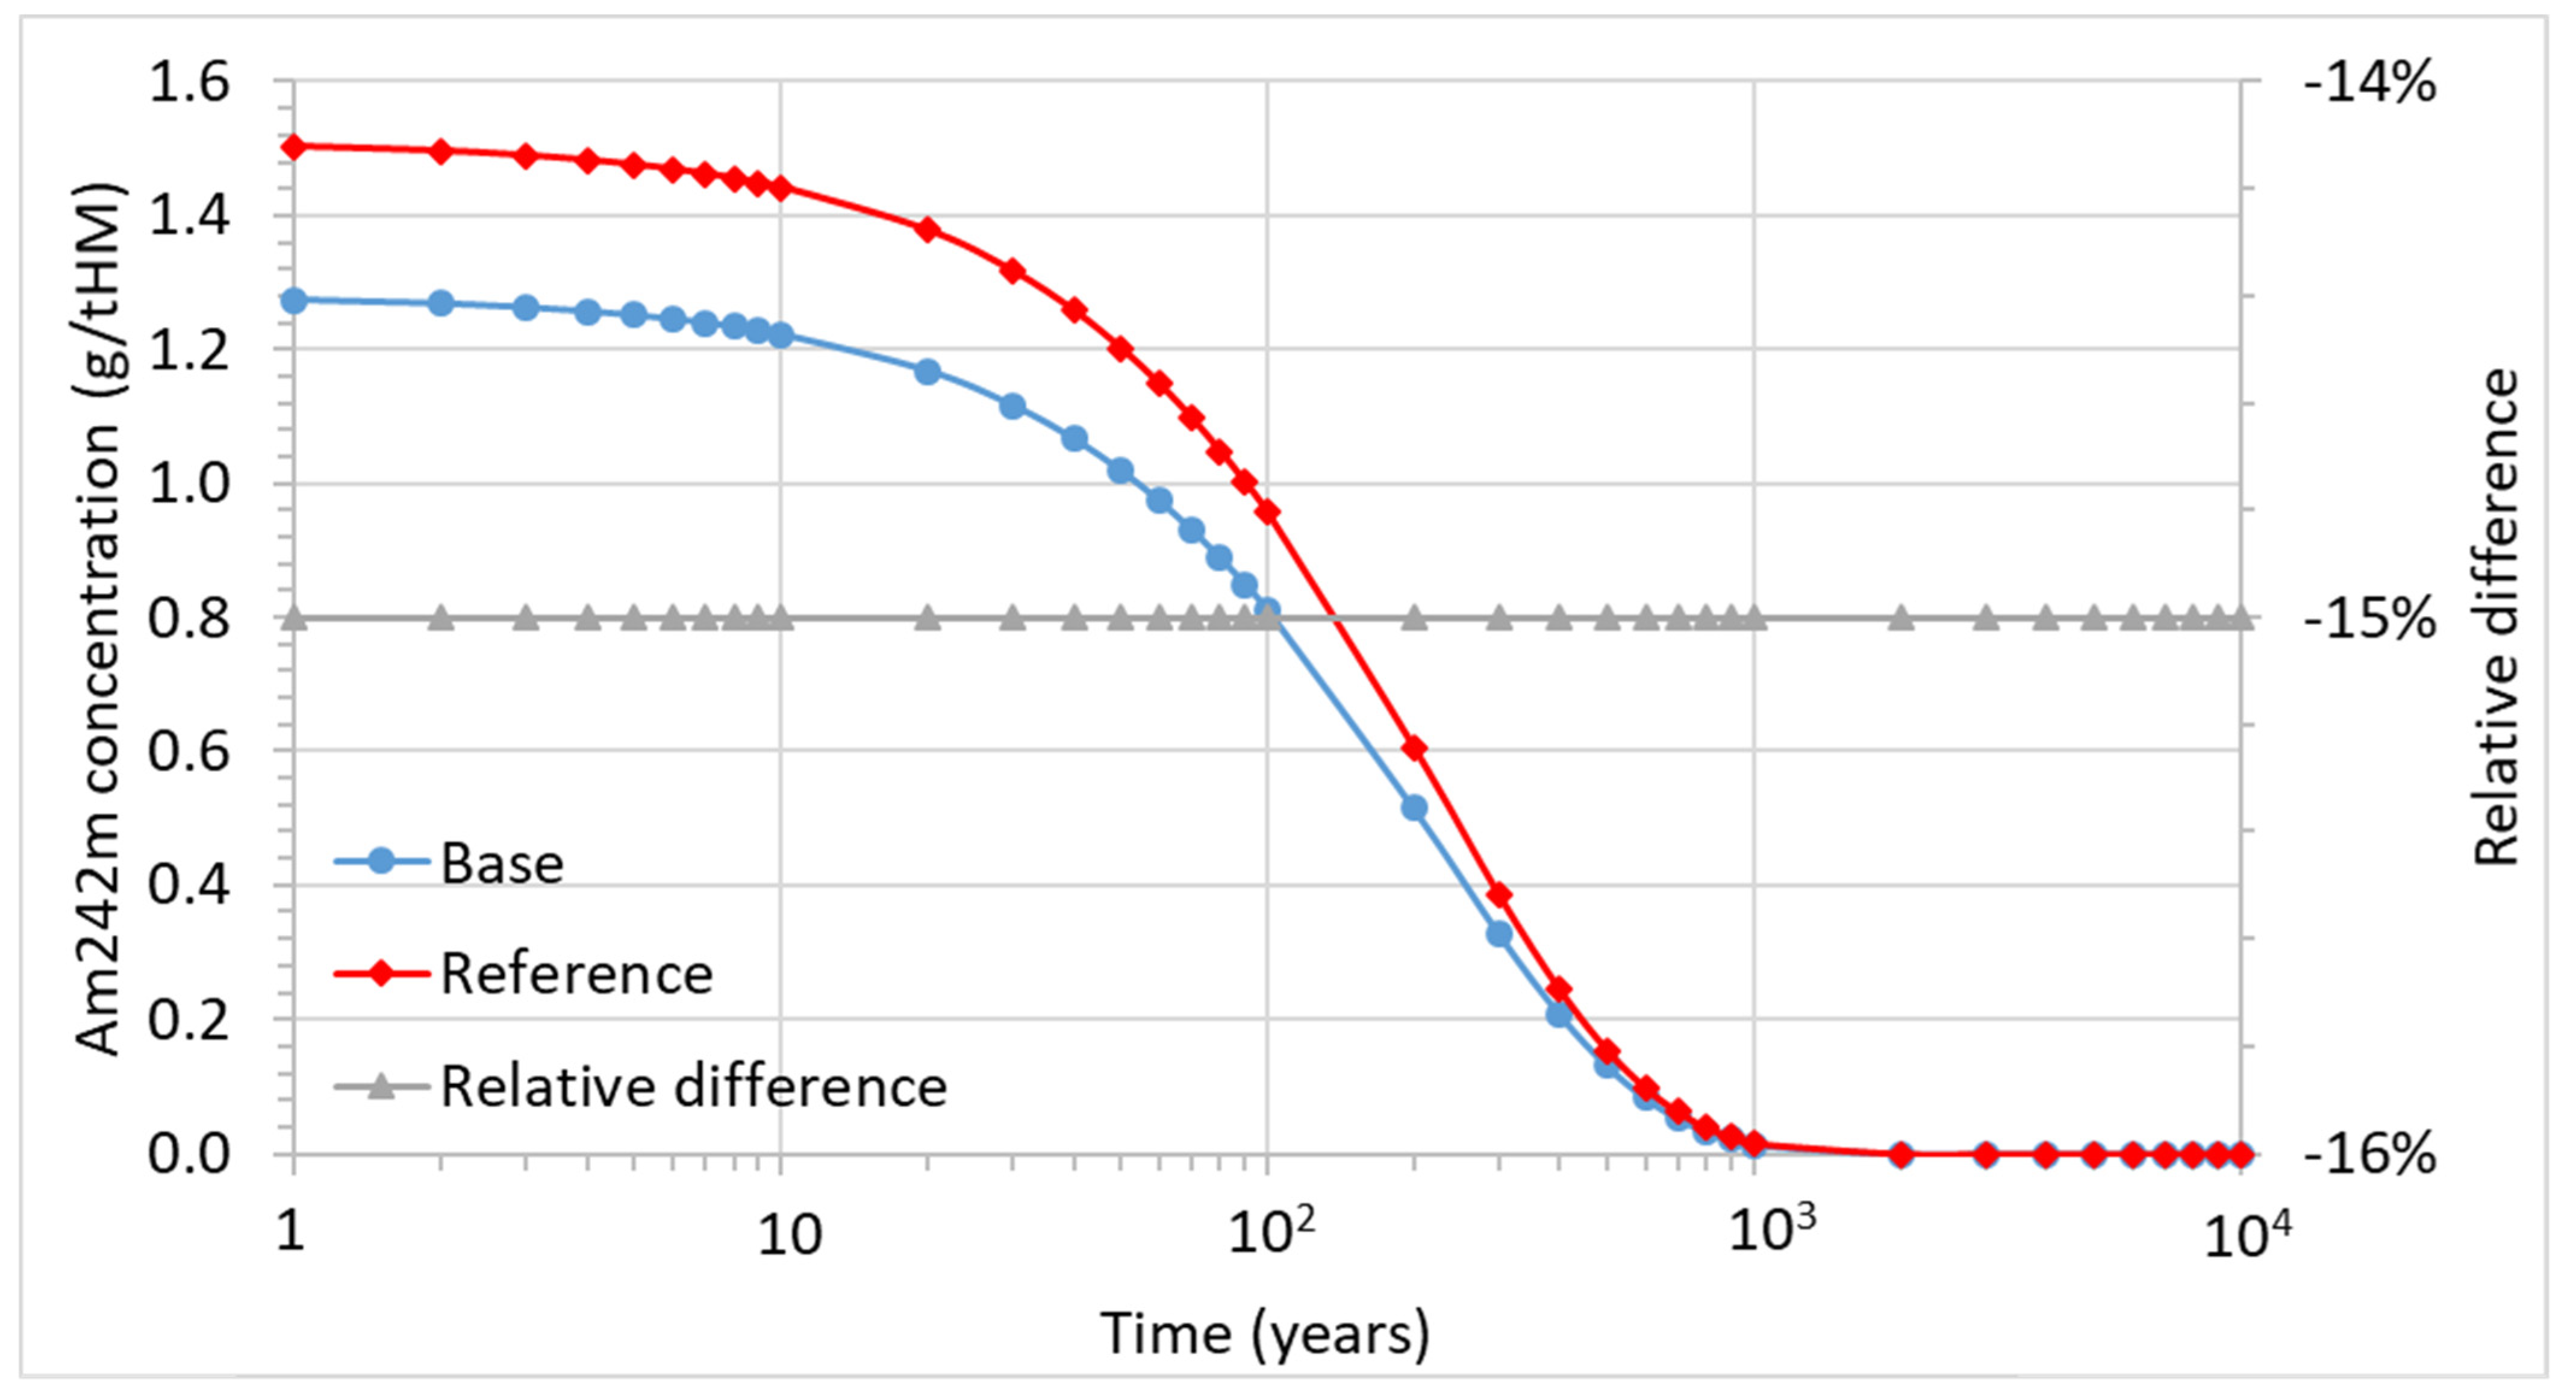
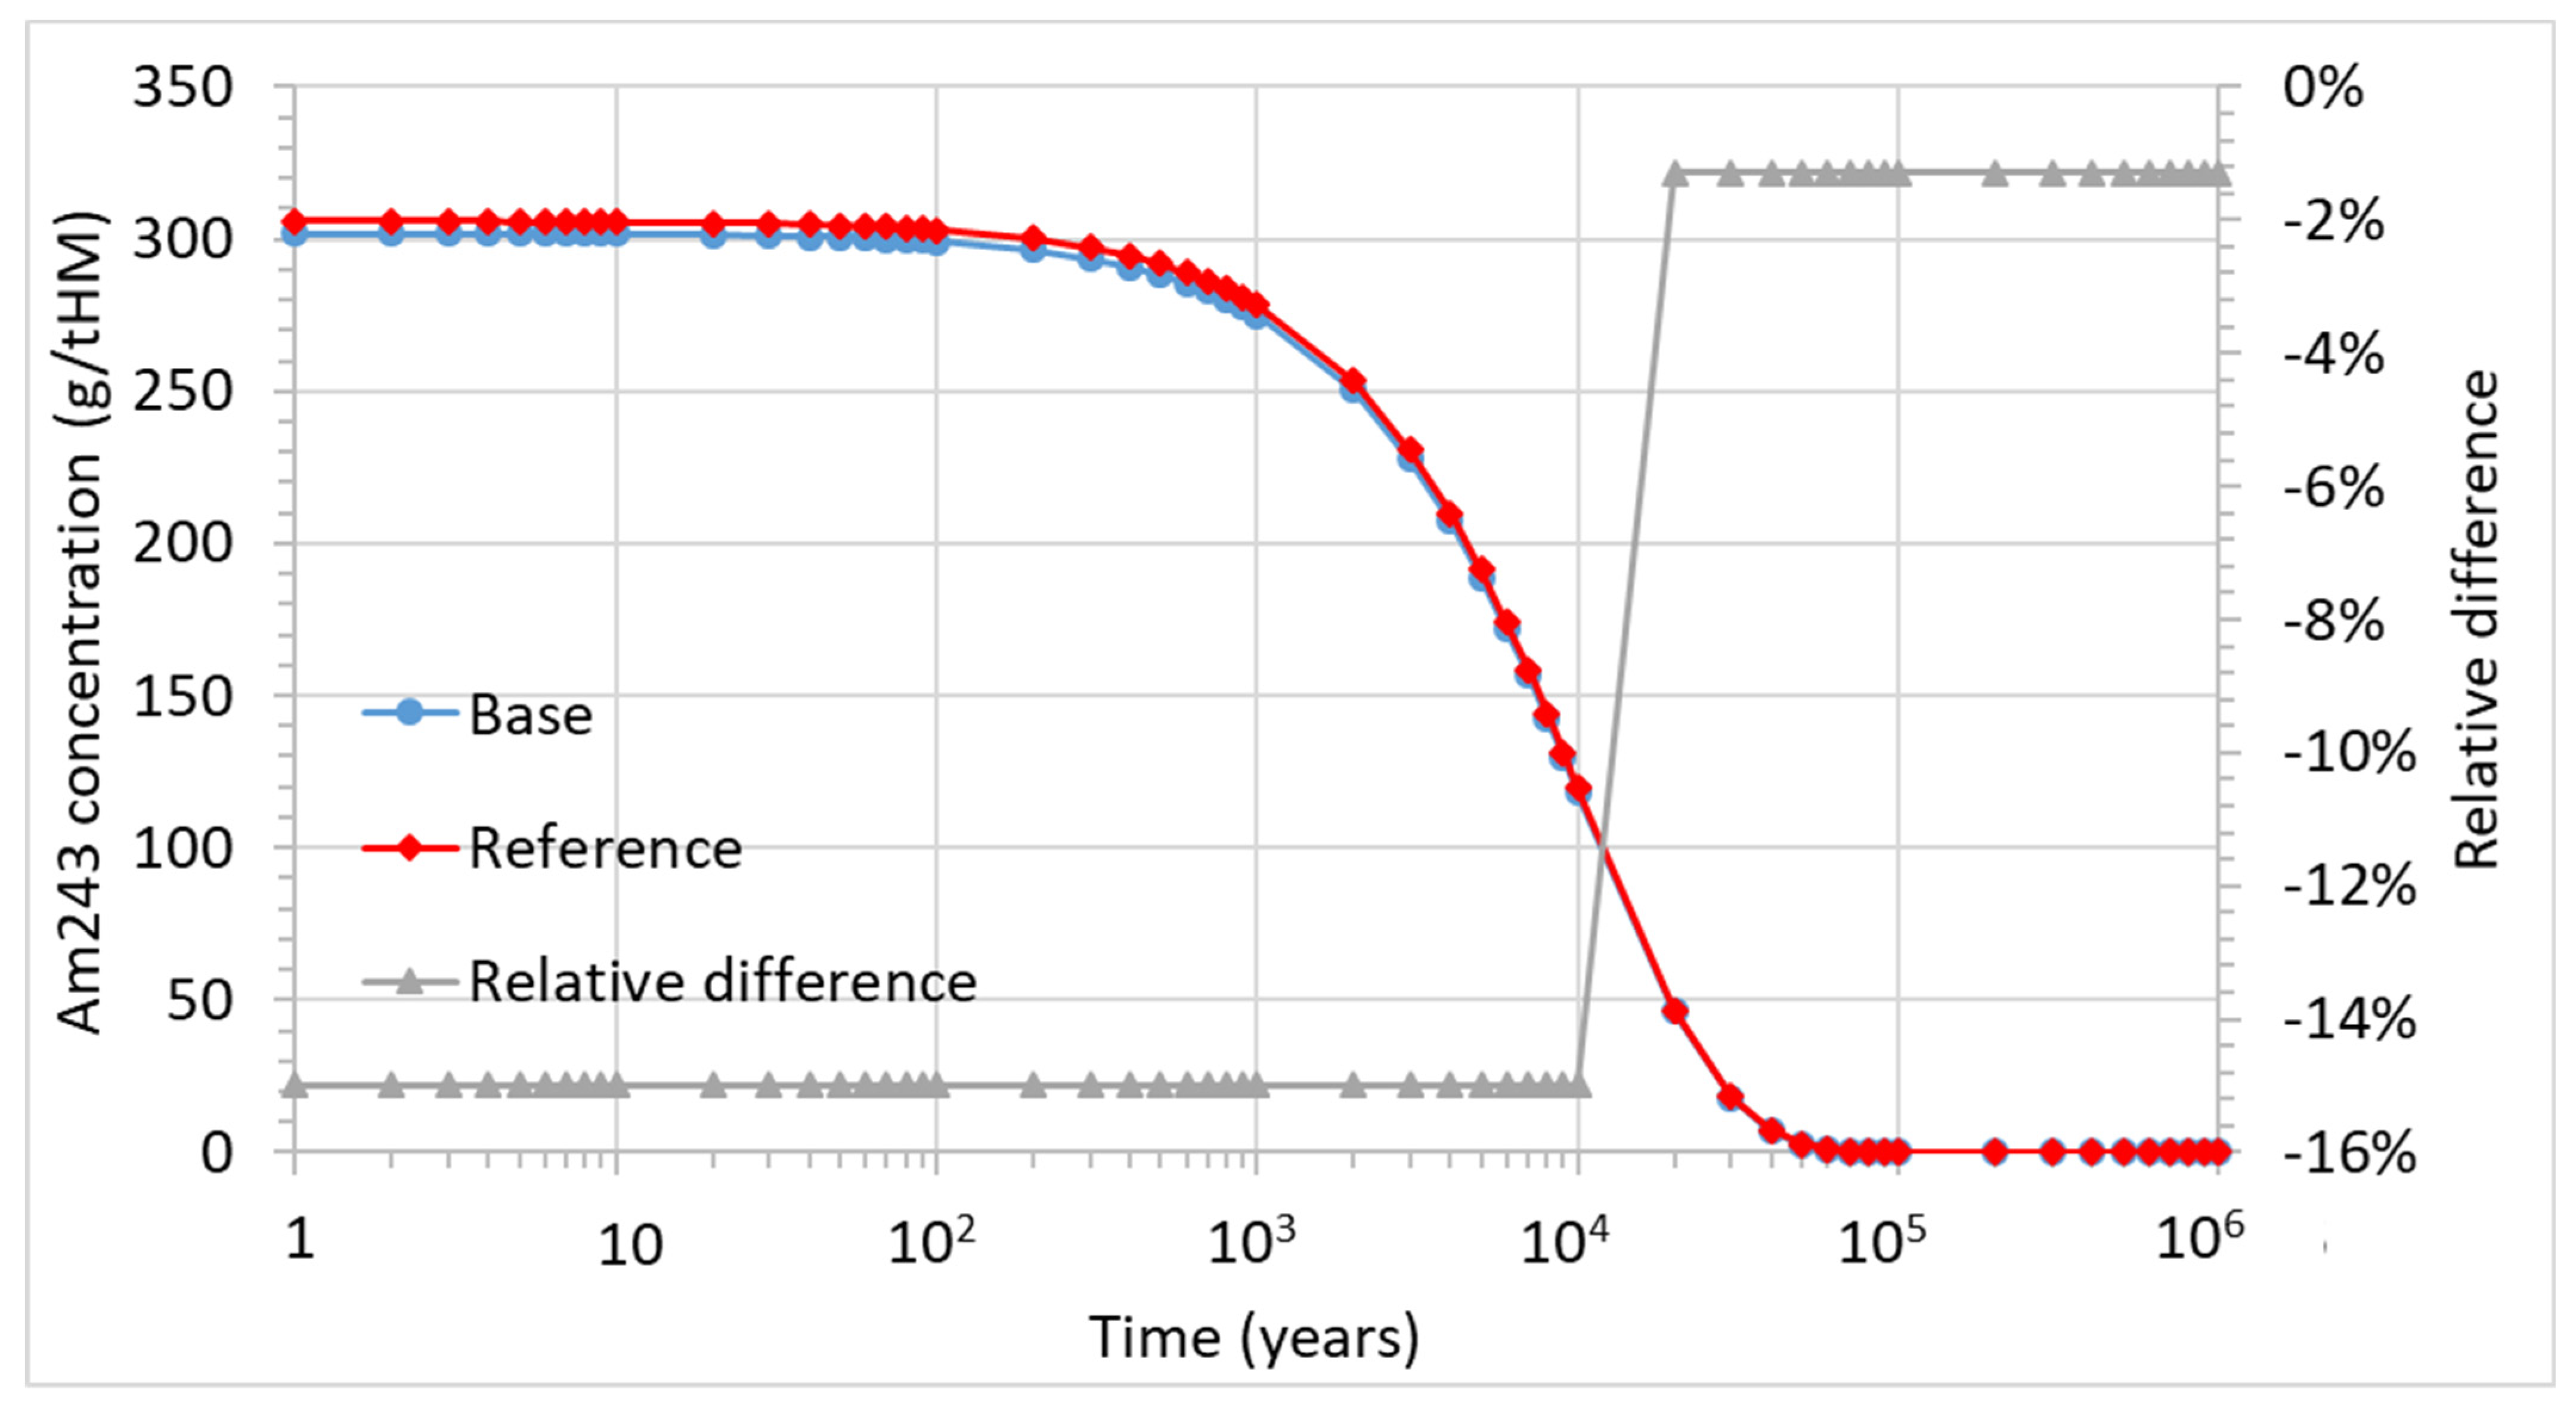
The evolution of americium (241Am, 242mAm, 243Am) is shown in Figure 17. The americium concentration increases until 50 years due to the formation of 241Am from the beta decay of 241Pu, present in spent nuclear fuel. Then, the concentration drops due to the decay of all americium isotopes. The 241Am decays almost completely until 5 × 10³ years, 242mAm until 103 years and 243Am until 105 years. After 105 years, americium has almost completely decayed. The concentration of americium for reference fuel composition is larger over a considered decay time. The difference initially increases from about −1% to −5% at 102 years. Afterward, it decreases to −1.5% at 4 × 10⁵ years and stays constant. The cause of the fall in relative difference is the increase of the 241Am concentration from a beta decay of 241Pu, the concentration of which is higher for the reference fuel composition. Figure 18, Figure 19 and Figure 20 show evolutions of considered americium isotopes.
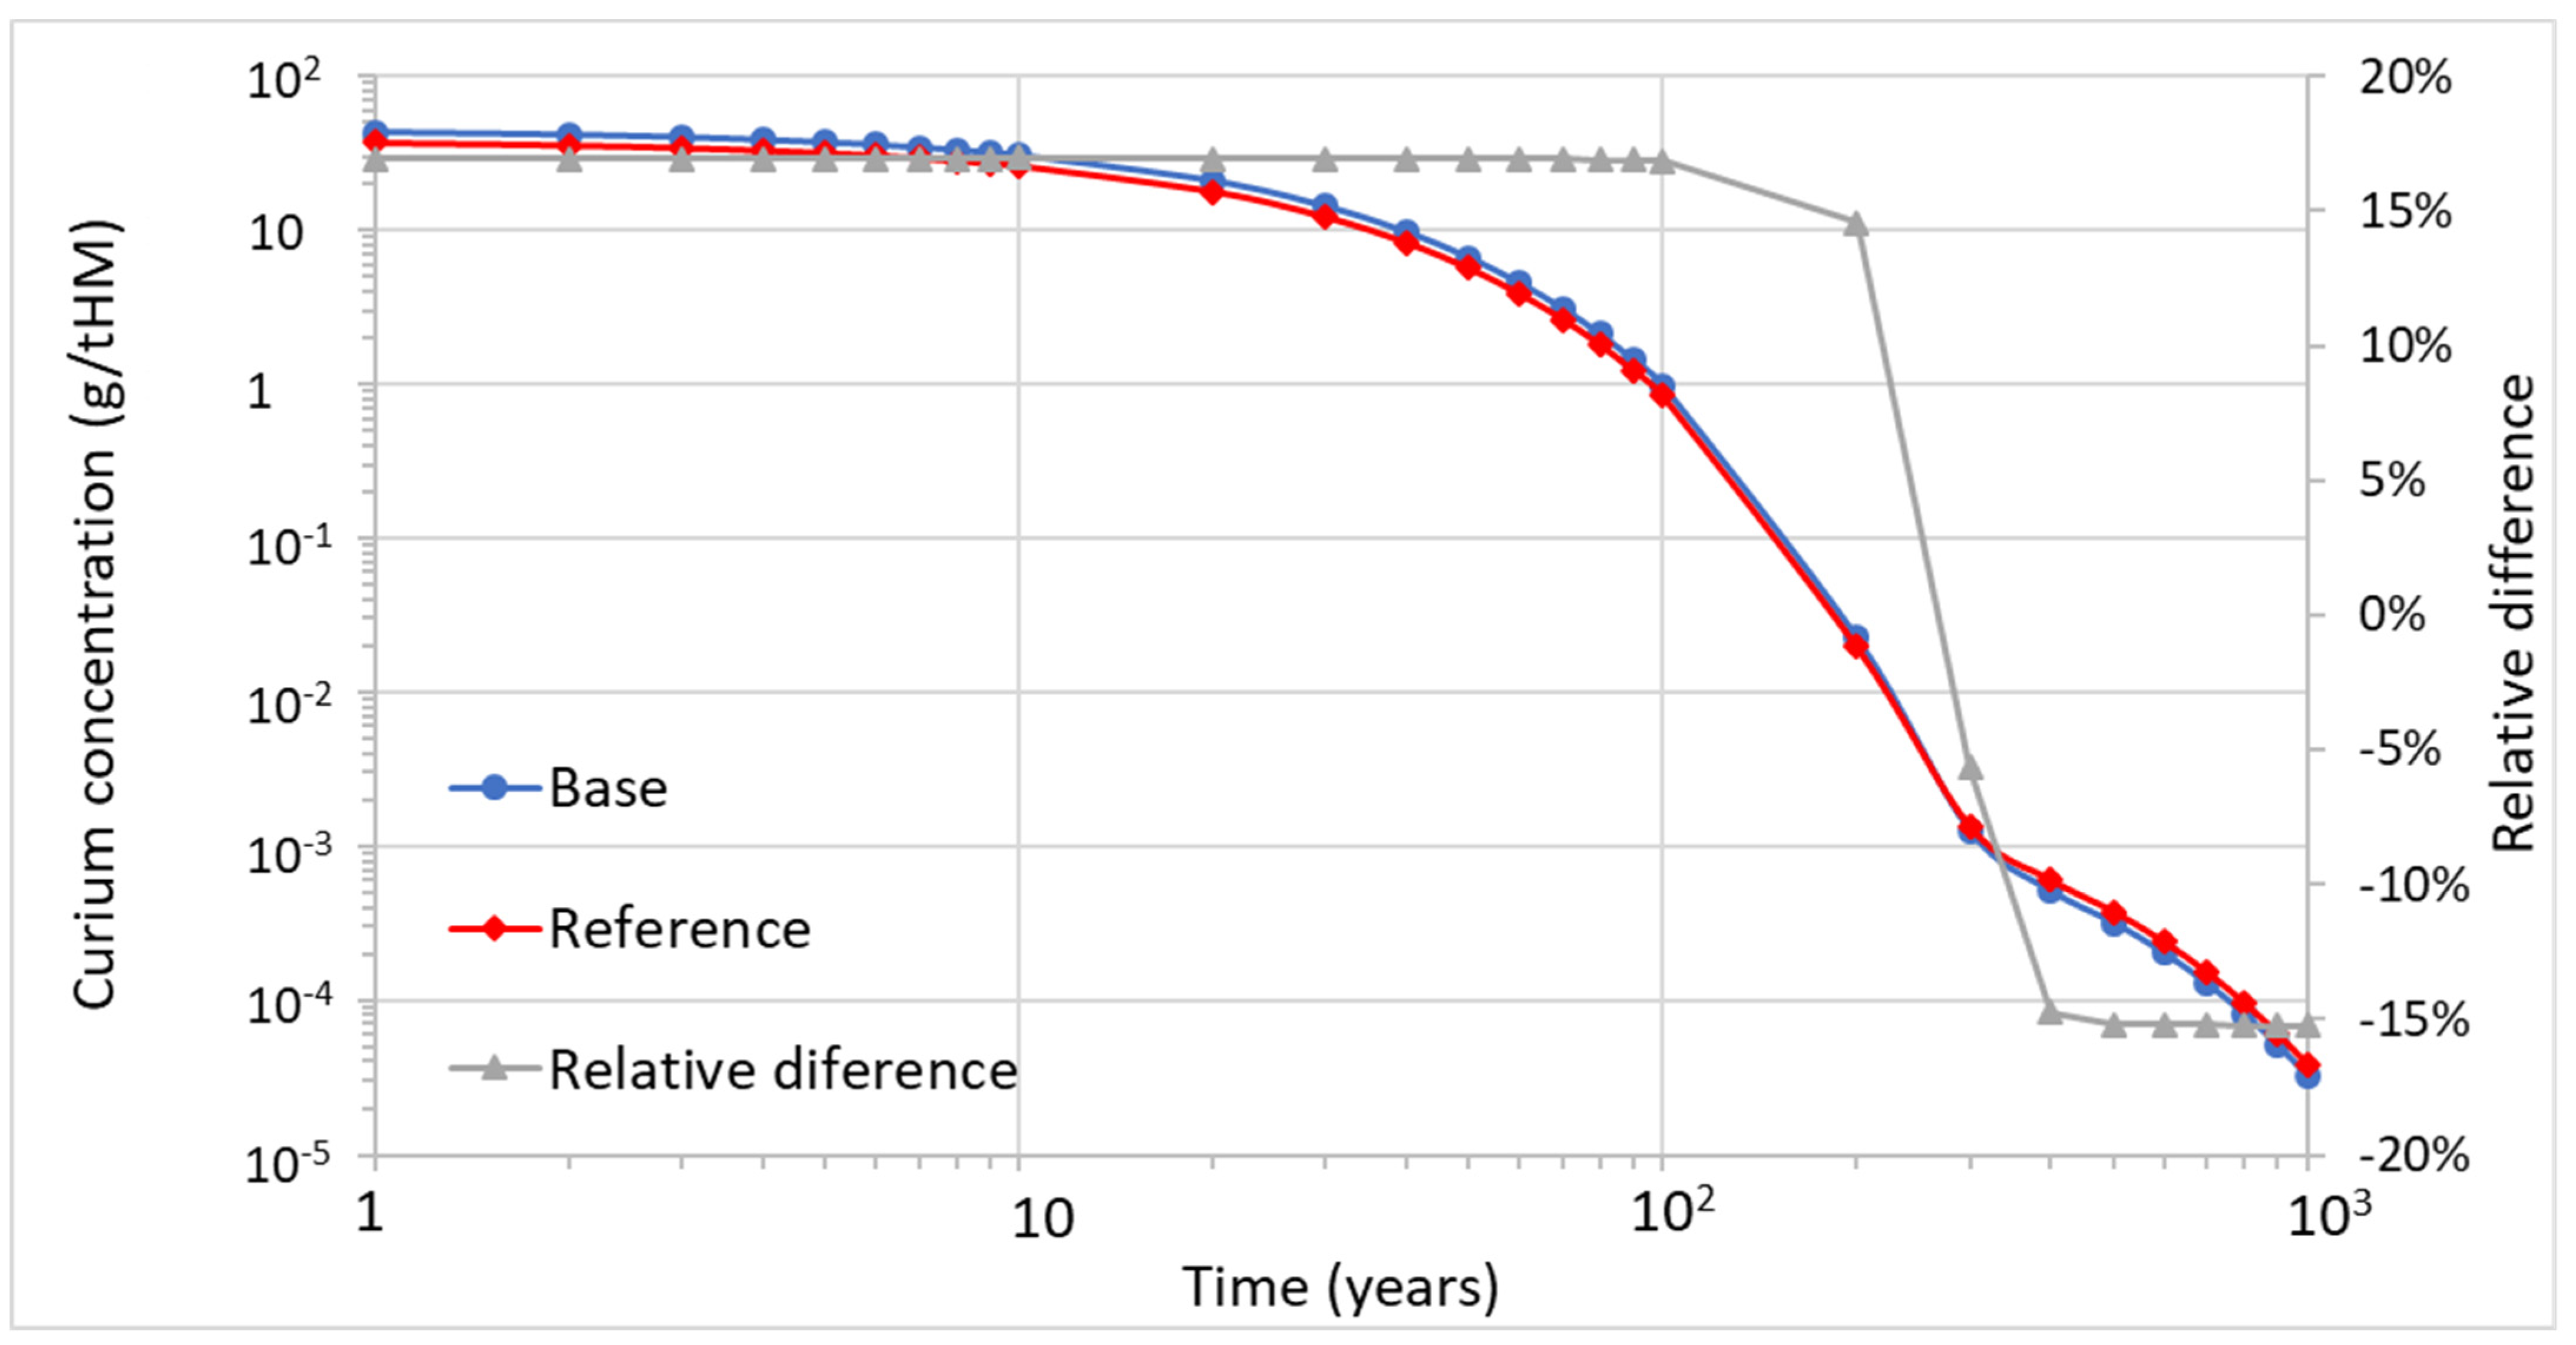
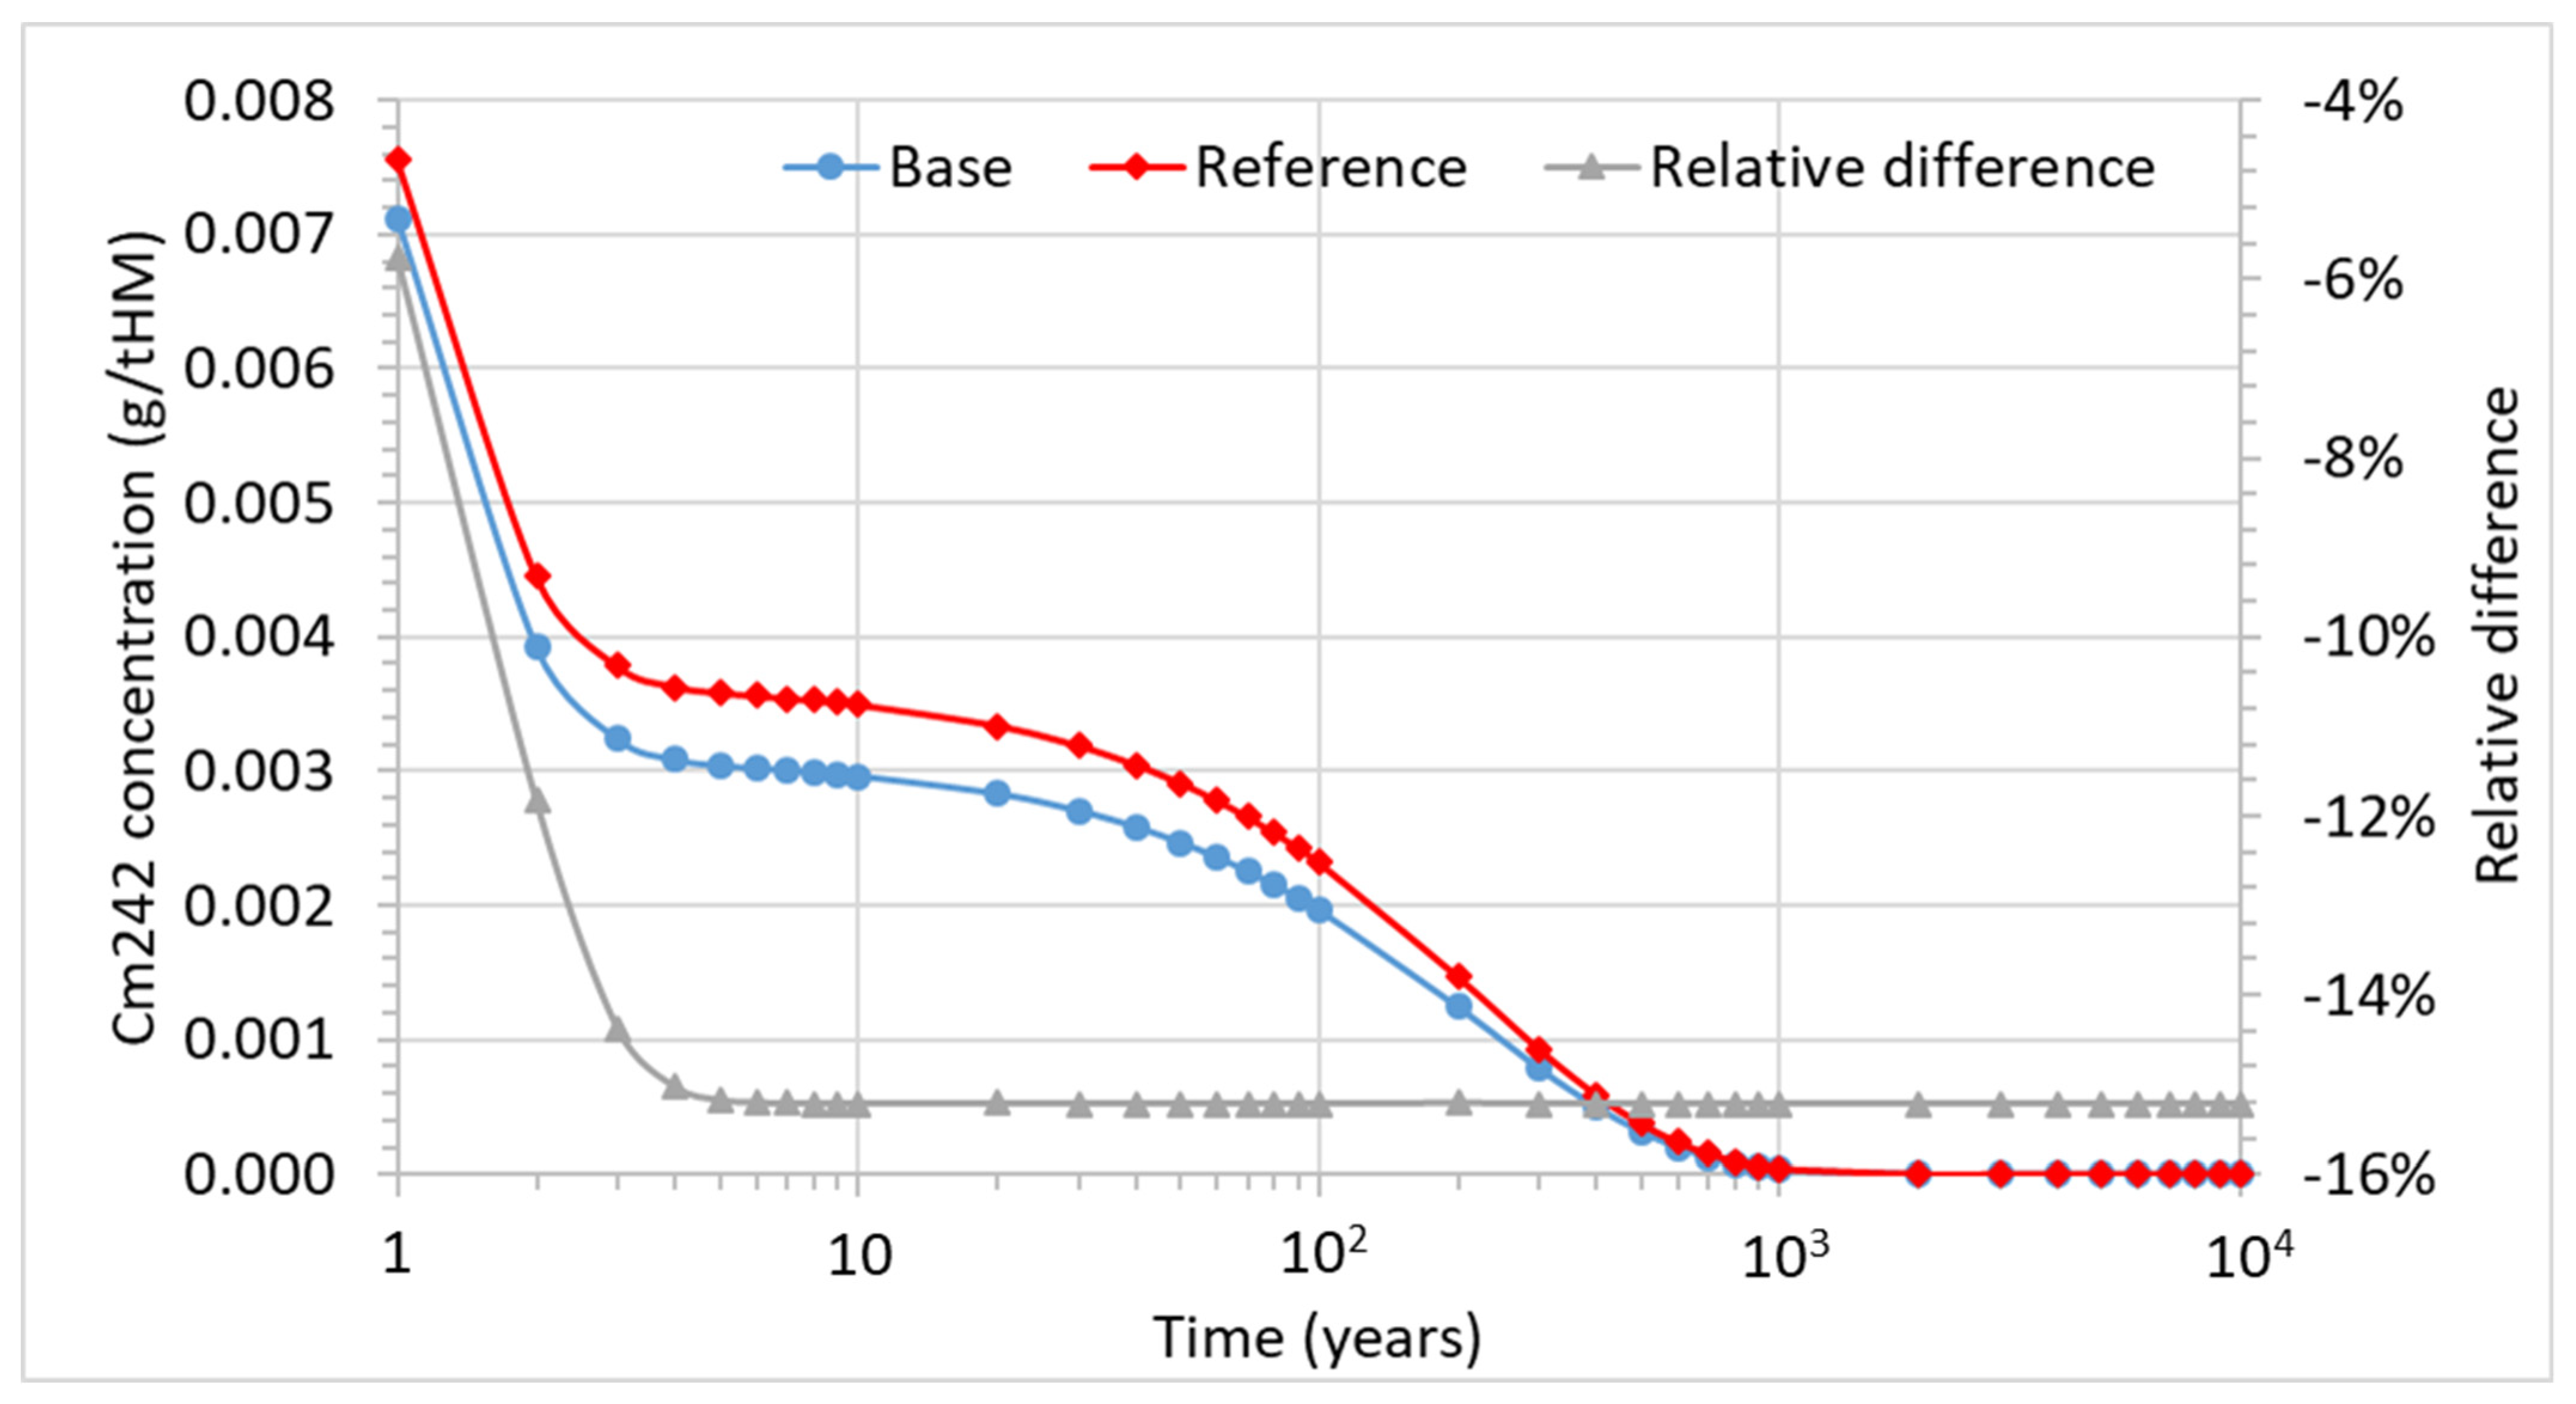
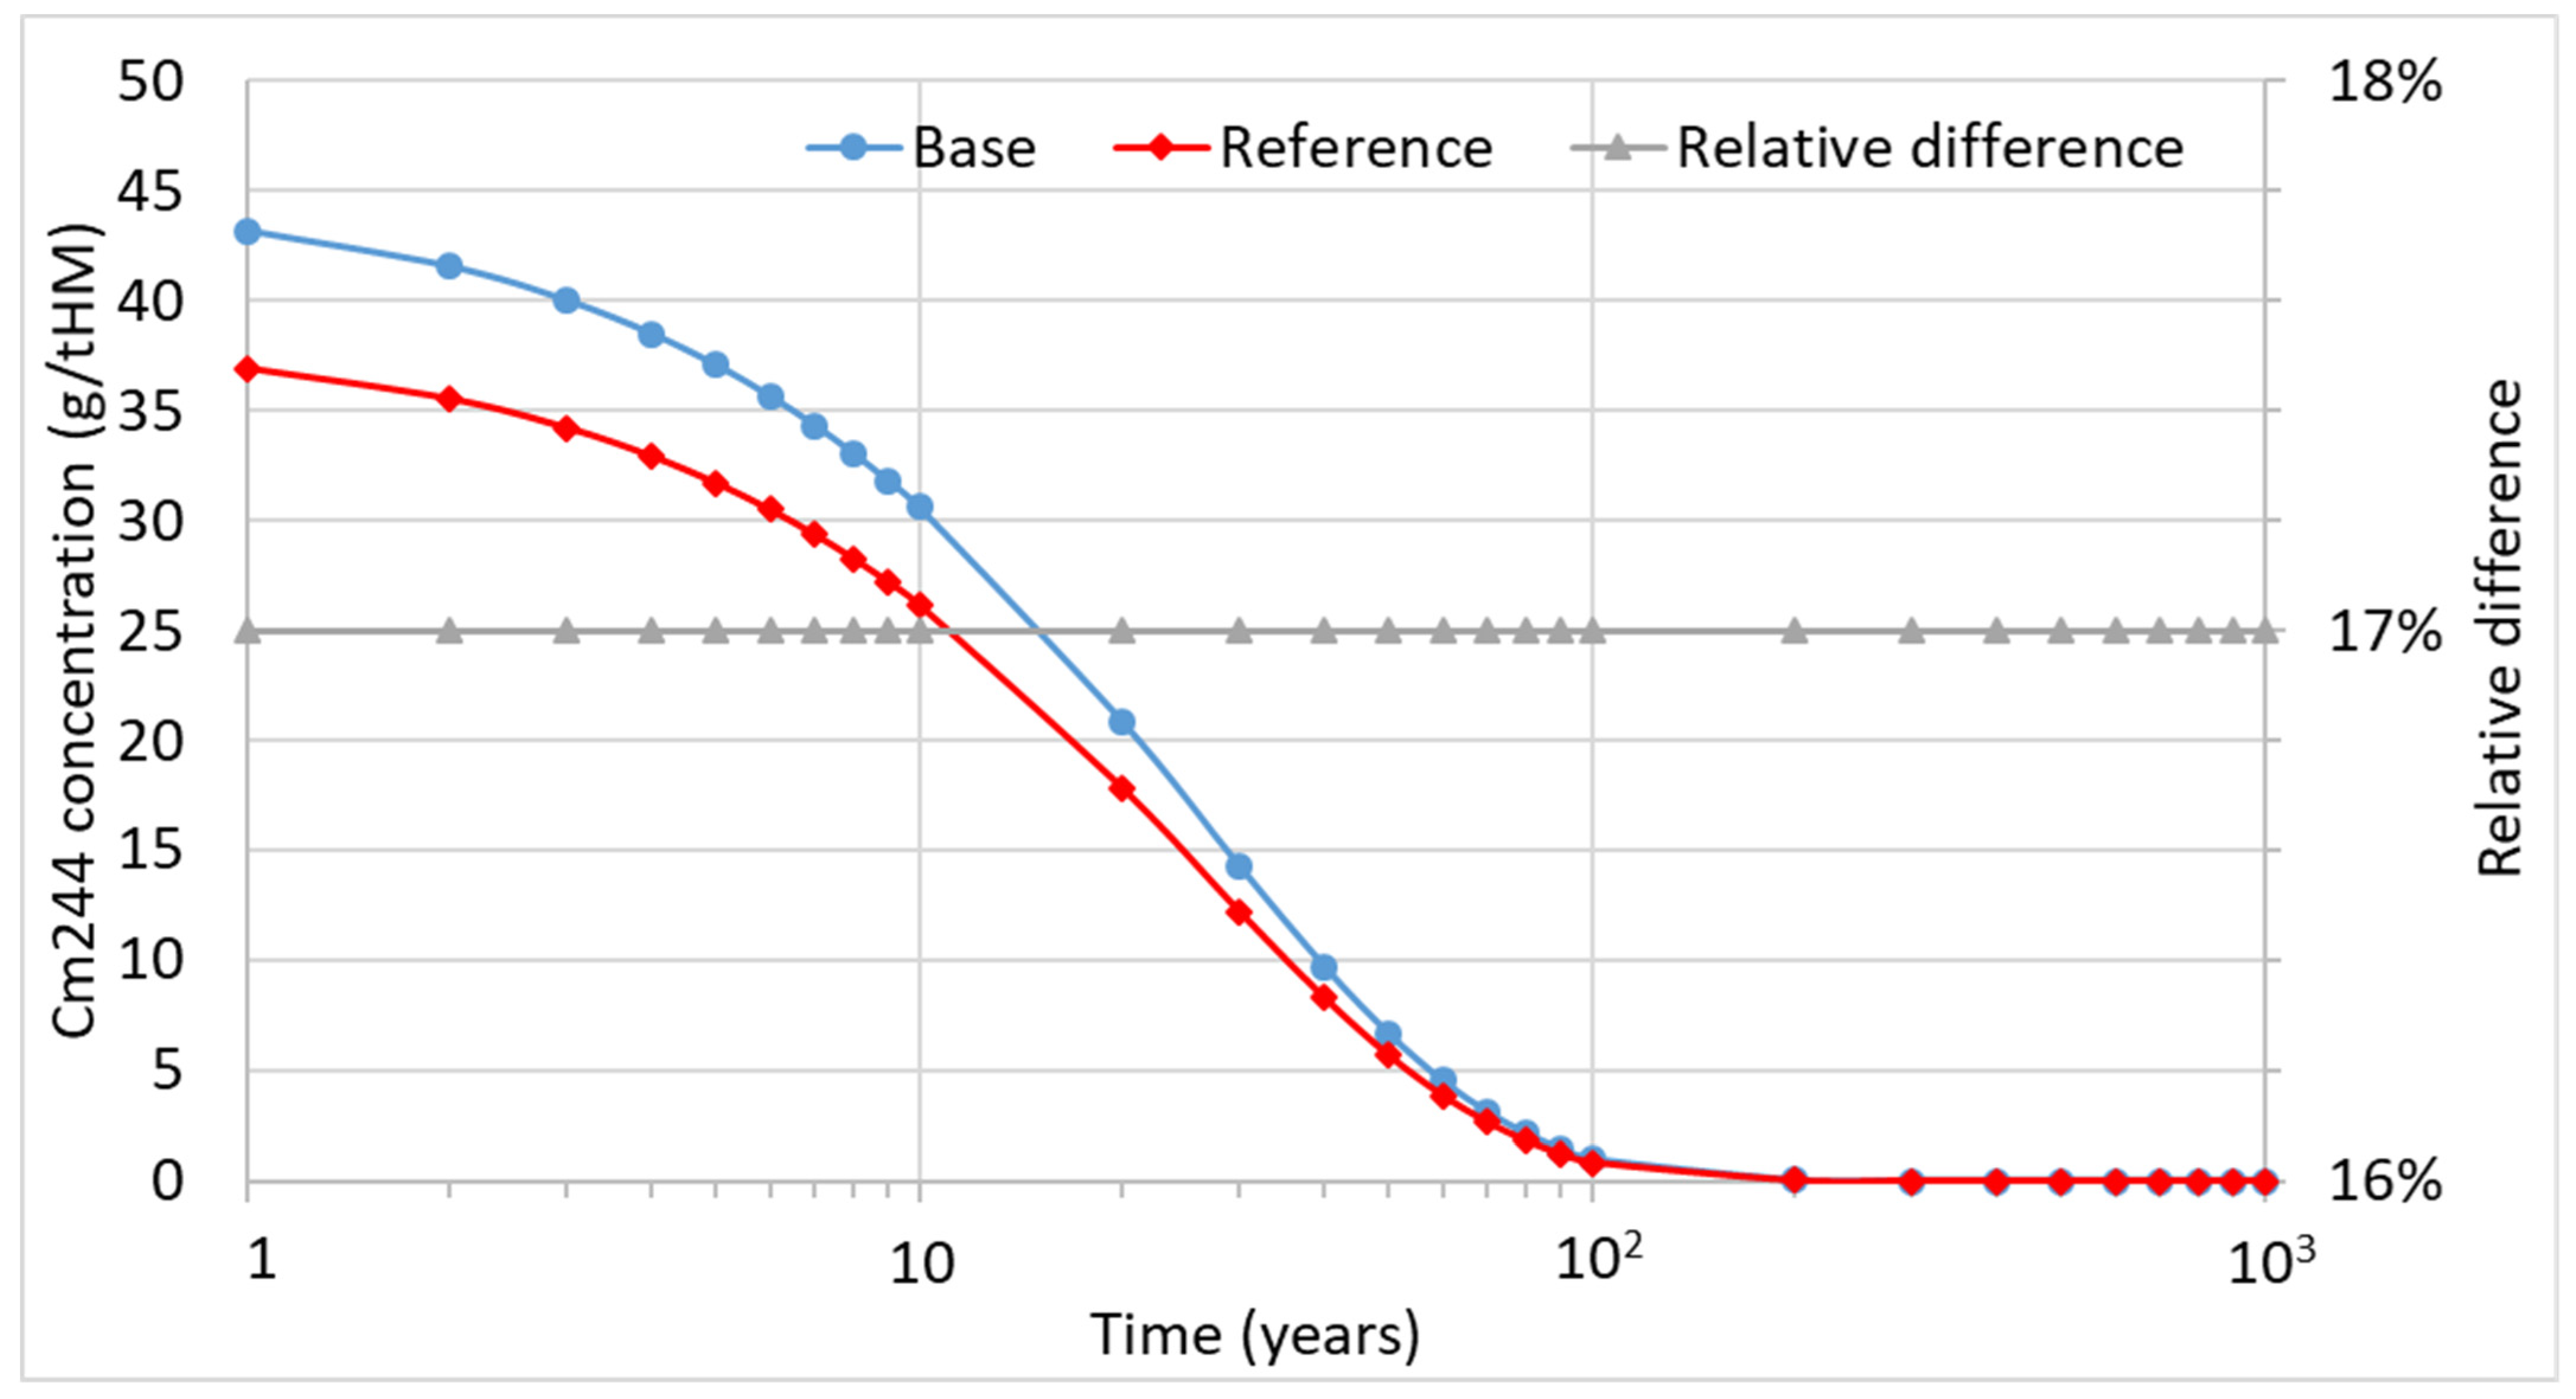
Eventually, the evolution of curium (242Cm, 244Cm) is shown in Figure 21. The concentration of curium is driven by the decay of 244Cm, the concentration of which is about four orders of magnitude higher than that of 242Cm. The curium isotopes almost completely decayed at about 103 years. Initially, the relative difference equals 17%, but from about 102 years to about 5 × 10³ years decreases to −18%. The effect is related to the full decay of 244Cm at about 103 years with the still ongoing production of 242Cm from the decay of 242mAm, the content of which is higher for the reference fuel composition. Figure 22 and Figure 23 show evolutions of considered curium isotopes.
5. Summary and Discussion
The new methodology for the estimation of the final spent nuclear fuel isotopic composition and its long-term actinides ingestion radiotoxicity was proposed in the study. The obtained results of the scenario-based modeling, validation and radioactive decay calculations show the promising capabilities of fast and consistent modeling of the nuclear fuel cycle. Therefore, the methodology is suitable for the implementation into a more advanced numerical tool for the whole power system modeling, with all types of electricity generators, including hybrid systems. The numerical tools for such modeling usually do not contain modules for the radiotoxicity estimation from spent nuclear fuel [27,28]. Thus, its implementation could significantly enhance the versatility and functionality of such tools.
The paper shows the verification of the NFCSS system for the burnup modeling as the key component of the developed methodology. The obtained isotopic compositions are acceptable for scenario-based tools. However, the author would recommend treating the isotopic compositions obtained using the NFCSS as first-approximation compositions for further, more complex 3D modeling and benchmarking, if necessary, for a given case. Moreover, more extensive validation using the SFCOMPO database for all available reactor types is recommended, which will increase the predictability of the NFCSS system and identify the possible areas for improvement. In addition, the modeling of the close fuel cycle with PWR spent fuel reprocessing is foreseen for future studies. Furthermore, the close fuel cycle modeling can be extended by modeling the more advanced fuel cycles [29]. Lastly, the implementation of a module that could calculate the concentrations of fission products would be helpful to estimate their radiotoxicity, which is important until about 300 years of decay. In addition, a similar validation study may be performed using fission product assay data from SFCOMP database. To sum up, the developed methodology has been successfully applied to the radiotoxicity estimation from a fleet of PWR reactors. Nevertheless, further development of the NFCSS system to increase its reliability and usage versatility is recommended.
6. Conclusions
The novelty and creativity of the developed methodology is mainly manifested in:
- The development of the reliable methodology for long-term actinides radiotoxicity and isotopic composition calculations, based on simple and user-friendly numerical tools;
- Obtaining consistent qualitative and quantitative numerical results of spent fuel isotopic composition, and of long-term actinides ingestion radiotoxicity evolutions, over a considered decay time;
- Enhanced validation of the spent nuclear fuel isotopic compositions obtained in the NFCSS modeling using the set of independent radiochemical measurements from the SFCOMPO database and related recommendations on 241Am and 242Cm;
- Application of the developed methodology for the newcomer country benchmark, for the modeling of spent nuclear fuel composition and long-term actinides radiotoxicity from a whole fleet of PWR reactors until the closure of the nuclear power program;
- Incorporation capability of the developed methodology into a more versatile numerical tools for the numerical modeling of the whole powers system, due to its simplicity and availability;
- Possible application of the developed methodology for the fast initial modeling of isotopic composition and long-term actinides radiotoxicity, before application of the more advanced tools for detailed modeling of reactor physics.
Funding
The financial support of this study under the scientific subvention 16.16.210.476 by the Polish Ministry of Science and Higher Education is kindly acknowledged.
Acknowledgments
The research was partially supported by PL Grid Infrastructure available at the Academic Computer Centre CYFRONET AGH. In addition, partial financial support of this study under the scientific subvention 16.16.210.476 by the Polish Ministry of Science and Higher Education is kindly acknowledged.
Conflicts of Interest
The author declares no conflict of interest.
References
- Rodríguez-Penalonga, L.; Soria, B.Y.M. A Review of the Nuclear Fuel Cycle Strategies and the Spent Nuclear Fuel Management Technologies. Energies 2017, 10, 1235. [Google Scholar] [CrossRef] [Green Version]
- International Atomic Energy Agency. Geological Disposal of Radioactive Waste: Technological Implications for Retrievability; No. NW-T-1.19; International Atomic Energy Agency: Vienna, Austria, 2009. [Google Scholar]
- Ebiwonjumi, B.; Lee, H.; Kim, W.; Lee, D. Validation of nuclide depletion capabilities in Monte Carlo code MCS. Nucl. Eng. Technol. 2020, 52, 1907–1916. [Google Scholar] [CrossRef]
- Oettingen, M.; Cetnar, J. Comparative analysis between measured and calculated concentrations of major actinides using destructive assay data from Ohi-2 PWR. Nukleonika 2015, 60, 571–580. [Google Scholar] [CrossRef] [Green Version]
- International Atomic Energy Agency. Nuclear Fuel Cycle Simulation System. Available online: https://infcis.iaea.org/NFCSS/About.cshtml (accessed on 22 April 2021).
- OECD, Nuclear Energy Agency. SFCOMPO 2.0 (Spent Fuel Isotopic Composition). Available online: https://www.oecd-nea.org/jcms/pl_21515/sfcompo-2-0-spent-fuel-isotopic-composition (accessed on 22 April 2021).
- Oettingen, M.; Cetnar, J.; Mirowski, T. The MCB code for numerical modelling of fourth generation nuclear reactors. Comput. Sci. 2015, 16, 329–350. [Google Scholar] [CrossRef]
- Liu, B.; Jia, R.; Han, R.; Lyu, X.; Han, J.; Li, W. Minor actinide transmutation characteristics in AP1000. Ann. Nucl. Energy 2018, 115, 116–125. [Google Scholar] [CrossRef]
- Schulz, T.L. Westinghouse AP1000 advanced passive plant. Nucl. Eng. Des. 2006, 236, 1547–1557. [Google Scholar] [CrossRef] [Green Version]
- Michel-Sendis, F.; Gauld, I.; Martinez, J.; Alejano, C.; Bossant, M.; Boulanger, D.; Cabellos, O.; Chrapciak, V.; Conde, J.; Fast, I.; et al. SFCOMPO-2.0: An OECD NEA database of spent nuclear fuel isotopic assays, reactor design specifications, and operating data. Ann. Nucl. Energy 2017, 110, 779–788. [Google Scholar] [CrossRef]
- International Atomic Energy Agency. Nuclear Fuel Cycle Simulation System: Improvements and Applications; IAEA-TECDOC-1864; International Atomic Energy Agency: Vienna, Austria, 2019. [Google Scholar]
- International Atomic Energy Agency. Nuclear Fuel Cycle Simulation System (VISTA); IAEA-TECDOC-1535; International Atomic Energy Agency: Vienna, Austria, 2007. [Google Scholar]
- Talamo, A.; Gudowski, W.; Cetnar, J.; Venneri, F. Key physical parameters and temperature reactivity coefficients of the deep burn modular helium reactor fueled with LWRs waste. Ann. Nucl. Energy 2004, 31, 1913–1937. [Google Scholar] [CrossRef]
- Cetnar, J. General solution of Bateman equations for nuclear transmutations. Ann. Nucl. Energy 2006, 33, 640–645. [Google Scholar] [CrossRef]
- Cetnar, J.; Stanisz, P.; Oettingen, M. Linear Chain Method for Numerical Modelling of Burnup Systems. Energies 2021, 14, 1520. [Google Scholar] [CrossRef]
- Macuk, R. Energy Transition in Poland; 2020 ed.; Forum Energii: Warsaw, Poland, 2020. [Google Scholar]
- Salant, S.W. What ails the European Union’s emissions trading system? J. Environ. Econ. Manag. 2016, 80, 6–19. [Google Scholar] [CrossRef]
- International Atomic Energy Agency. Milestones in the Development of a National Infrastructure for Nuclear Power; No. NG-G-3.1 (Rev. 1); International Atomic Energy Agency: Vienna, Austria, 2015. [Google Scholar]
- International Atomic Energy Agency. Status Report 8—Advanced Passive PWR (AP 1000); Advanced Reactors Information System (ARIS). 2011. Available online: https://aris.iaea.org/PDF/AP1000.pdf (accessed on 22 April 2021).
- Vezzoni, B.; Cerullo, N.; Forasassi, G.; Fridman, E.; Lomonaco, G.; Romanello, V.; Shwageraus, E. Preliminary Evaluation of a Nuclear Scenario Involving Innovative Gas Cooled Reactors. Sci. Technol. Nucl. Install. 2009, 2009, 1–16. [Google Scholar] [CrossRef] [Green Version]
- Nuclear Energy Agency. Spent Nuclear Fuel Assay Data for Isotopic Validation; NEA/NSC/WPNCS/DOC: Paris, France, 2011; p. 5. [Google Scholar]
- ICRP. Age-dependent Doses to the Members of the Public from Intake of Radionuclides—Part 5 Compilation of Ingestion and Inhalation Coefficients. Ann. ICRP 1995, 26. (ICRP Publication 72). [Google Scholar]
- Magill, J.; Berthou, V.; Haas, D.; Galy, J.; Schenkel, R.; Wiese, H.-W.; Heusener, G.; Tommasi, J.; Youinou, G. Impact limits of partitioning and transmutation scenarios on the radiotoxicity of actinides in radioactive waste. Nucl. Energy 2003, 42, 263–277. [Google Scholar] [CrossRef]
- Tsai, T.-L.; Chiou, Y.-F.; Tsai, S.-C. Overview of the Nuclear Fuel Cycle Strategies and the Spent Nuclear Fuel Management Technologies in Taiwan. Energies 2020, 13, 2996. [Google Scholar] [CrossRef]
- Shlenskii, M.; Kuteev, B. System Studies on the Fusion-Fission Hybrid Systems and Its Fuel Cycle. Appl. Sci. 2020, 10, 8417. [Google Scholar] [CrossRef]
- Plukiene, R.; Plukis, A.; Juodis, L.; Remeikis, V.; Šalkauskas, O.; Ridikas, D.; Gudowski, W. Transmutation considerations of LWR and RBMK spent nuclear fuel by the fusion–fission hybrid system. Nucl. Eng. Des. 2018, 330, 241–249. [Google Scholar] [CrossRef]
- Ringkjøb, H.-K.; Haugan, P.M.; Solbrekke, I.M. A review of modelling tools for energy and electricity systems with large shares of variable renewables. Renew. Sustain. Energy Rev. 2018, 96, 440–459. [Google Scholar] [CrossRef]
- Ceran, B.; Orłowska, A. The Impact of Power Source Performance Decrease in a PV/WT/FC Hybrid Power Generation System on the Result of a Multi-Criteria Analysis of Load Distribution. Energies 2019, 12, 3453. [Google Scholar] [CrossRef] [Green Version]
- Chersola, D.; Lomonaco, G.; Marotta, R. The VHTR and GFR and their use in innovative symbiotic fuel cycles. Prog. Nucl. Energy 2015, 83, 443–459. [Google Scholar] [CrossRef]
Figure 1.
Schematic diagram of the developed methodology.

Figure 2.
Phases of the nuclear power program.

Figure 3.
Mass of nuclear fuel of all reactors in the system.

Figure 4.
Evolution of radiotoxicity for the base and reference spent fuel composition.

Figure 5.
Evolution of neptunium for the base and reference spent fuel composition.

Figure 6.
Evolution of uranium for the base and reference spent fuel composition.

Figure 7.
Evolution of 233U for the base and reference spent fuel composition.

Figure 8.
Evolution of 234U for the base and reference spent fuel composition.

Figure 9.
Evolution of 235U for the base and reference spent fuel composition.

Figure 10.
Evolution of 236U for the base and reference spent fuel composition.

Figure 11.
Evolution of plutonium for the base and reference spent fuel composition.

Figure 12.
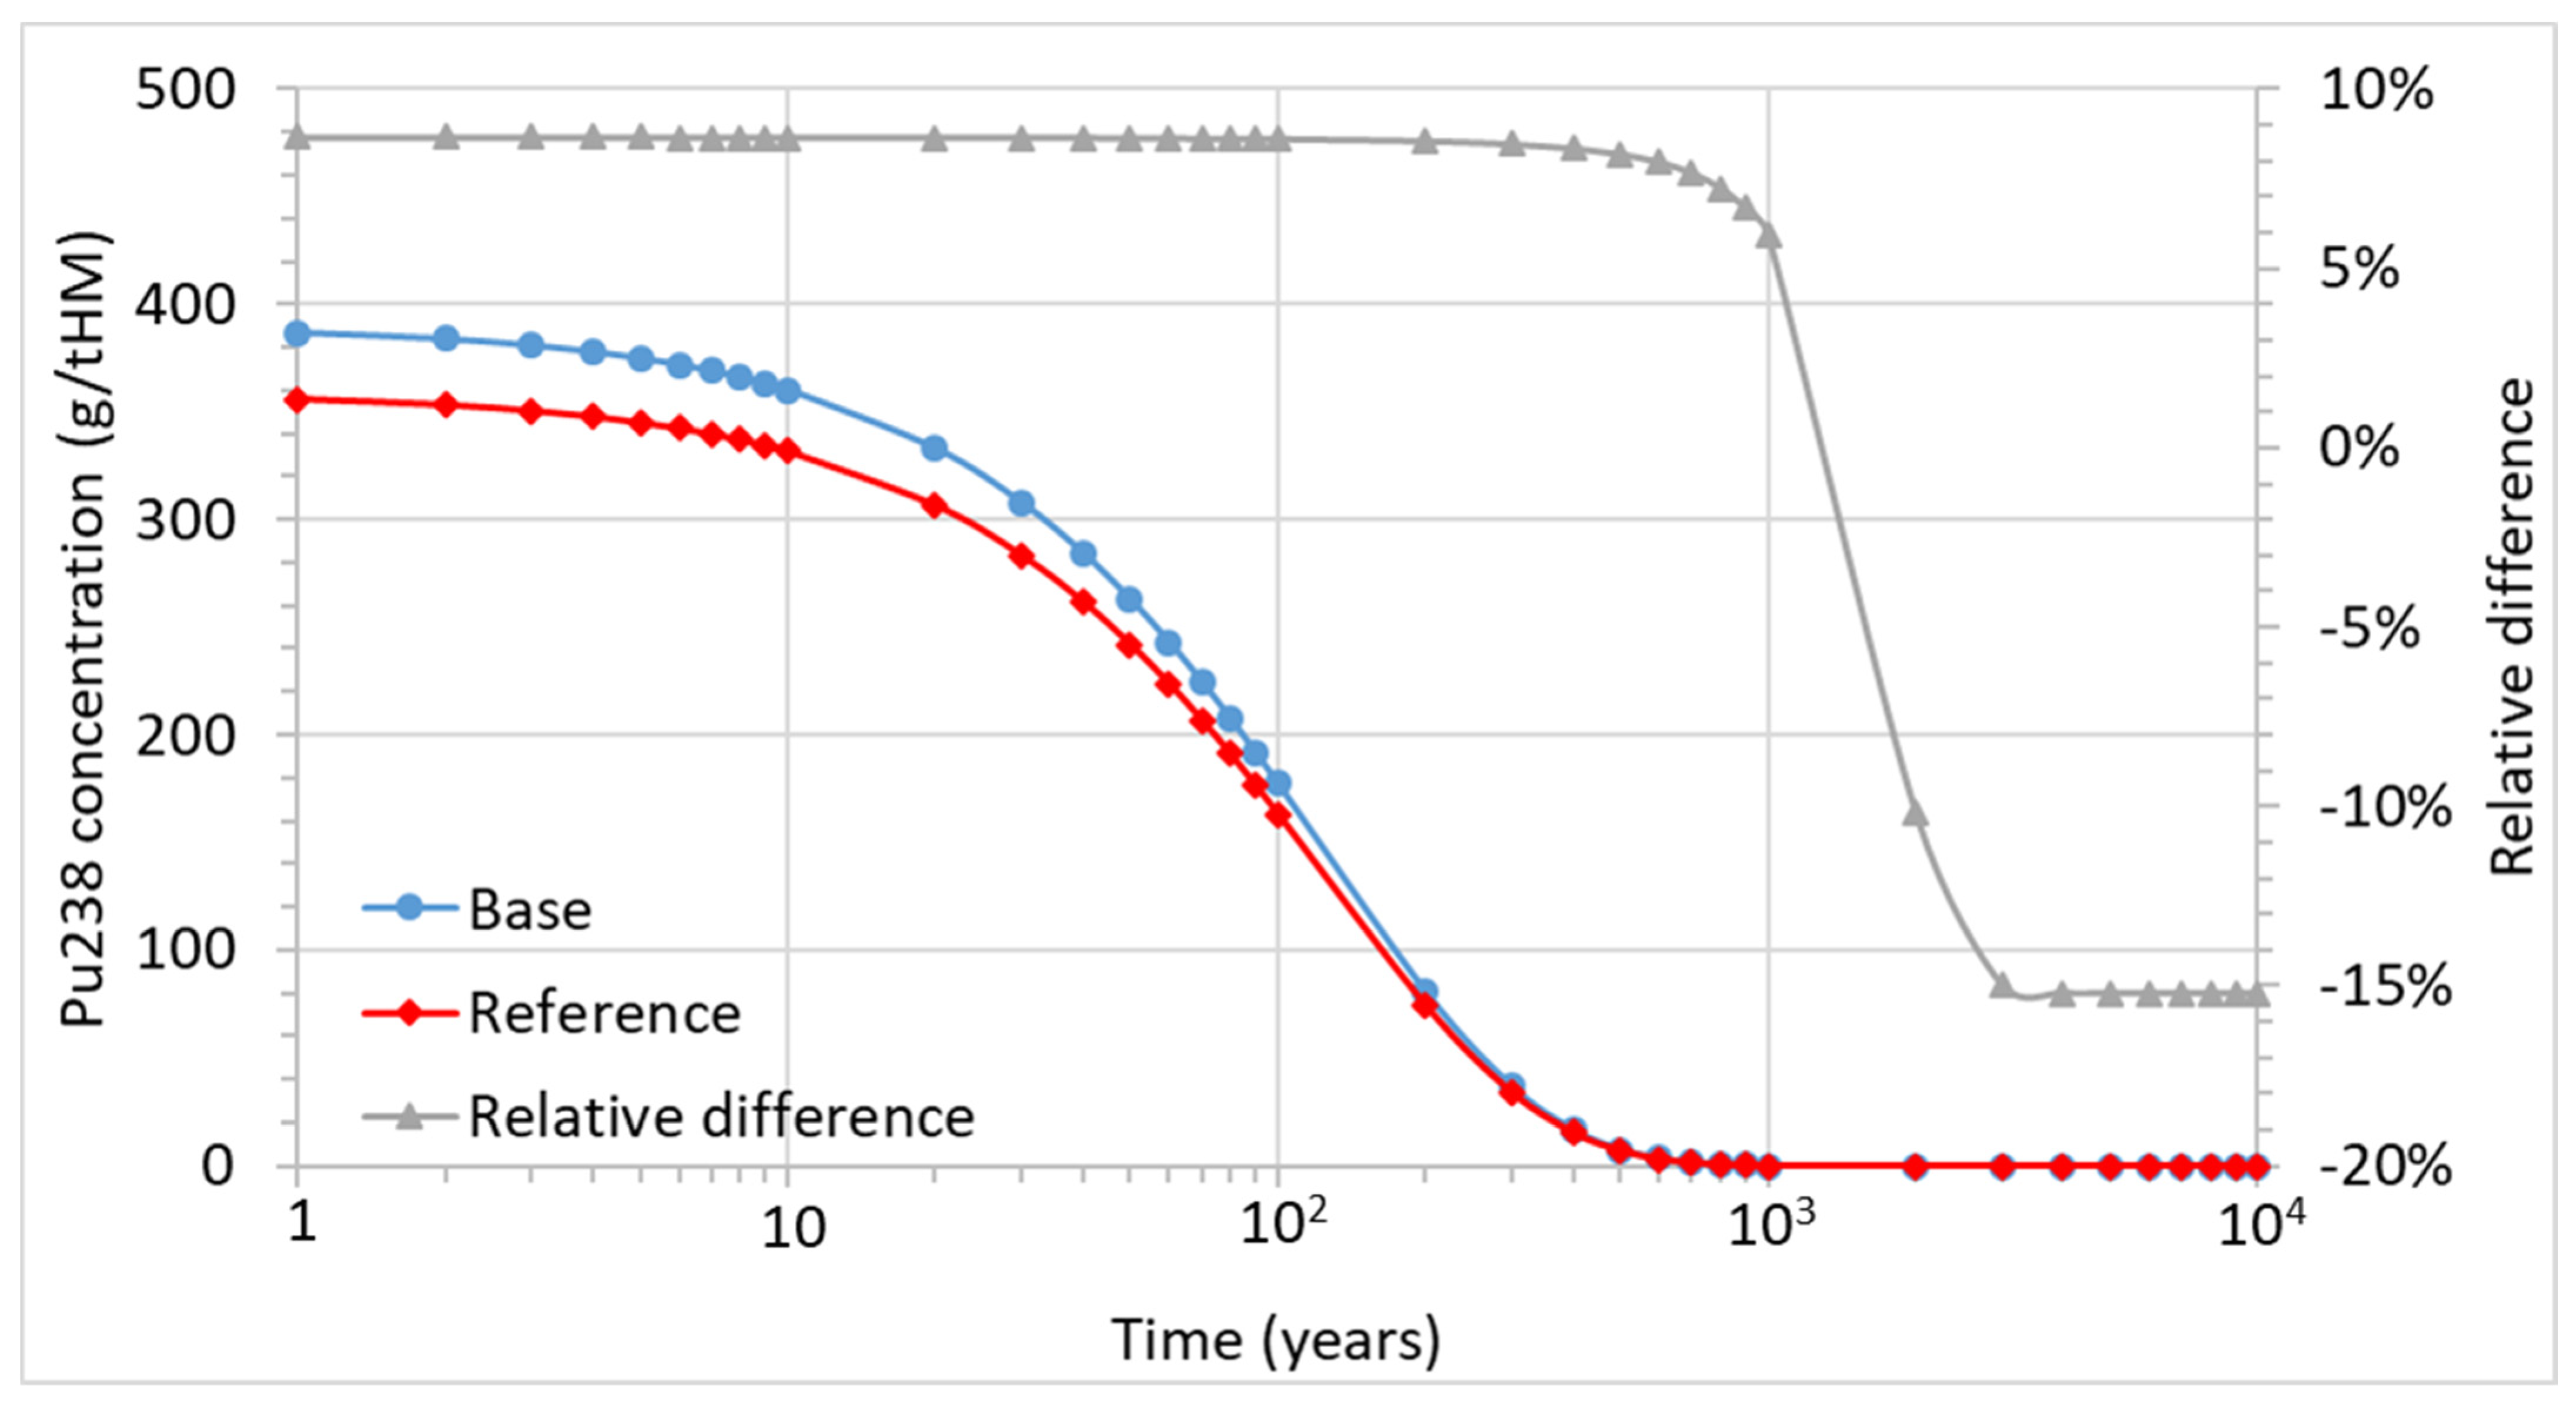
Evolution of 238Pu for the base and reference spent fuel composition.

Figure 13.
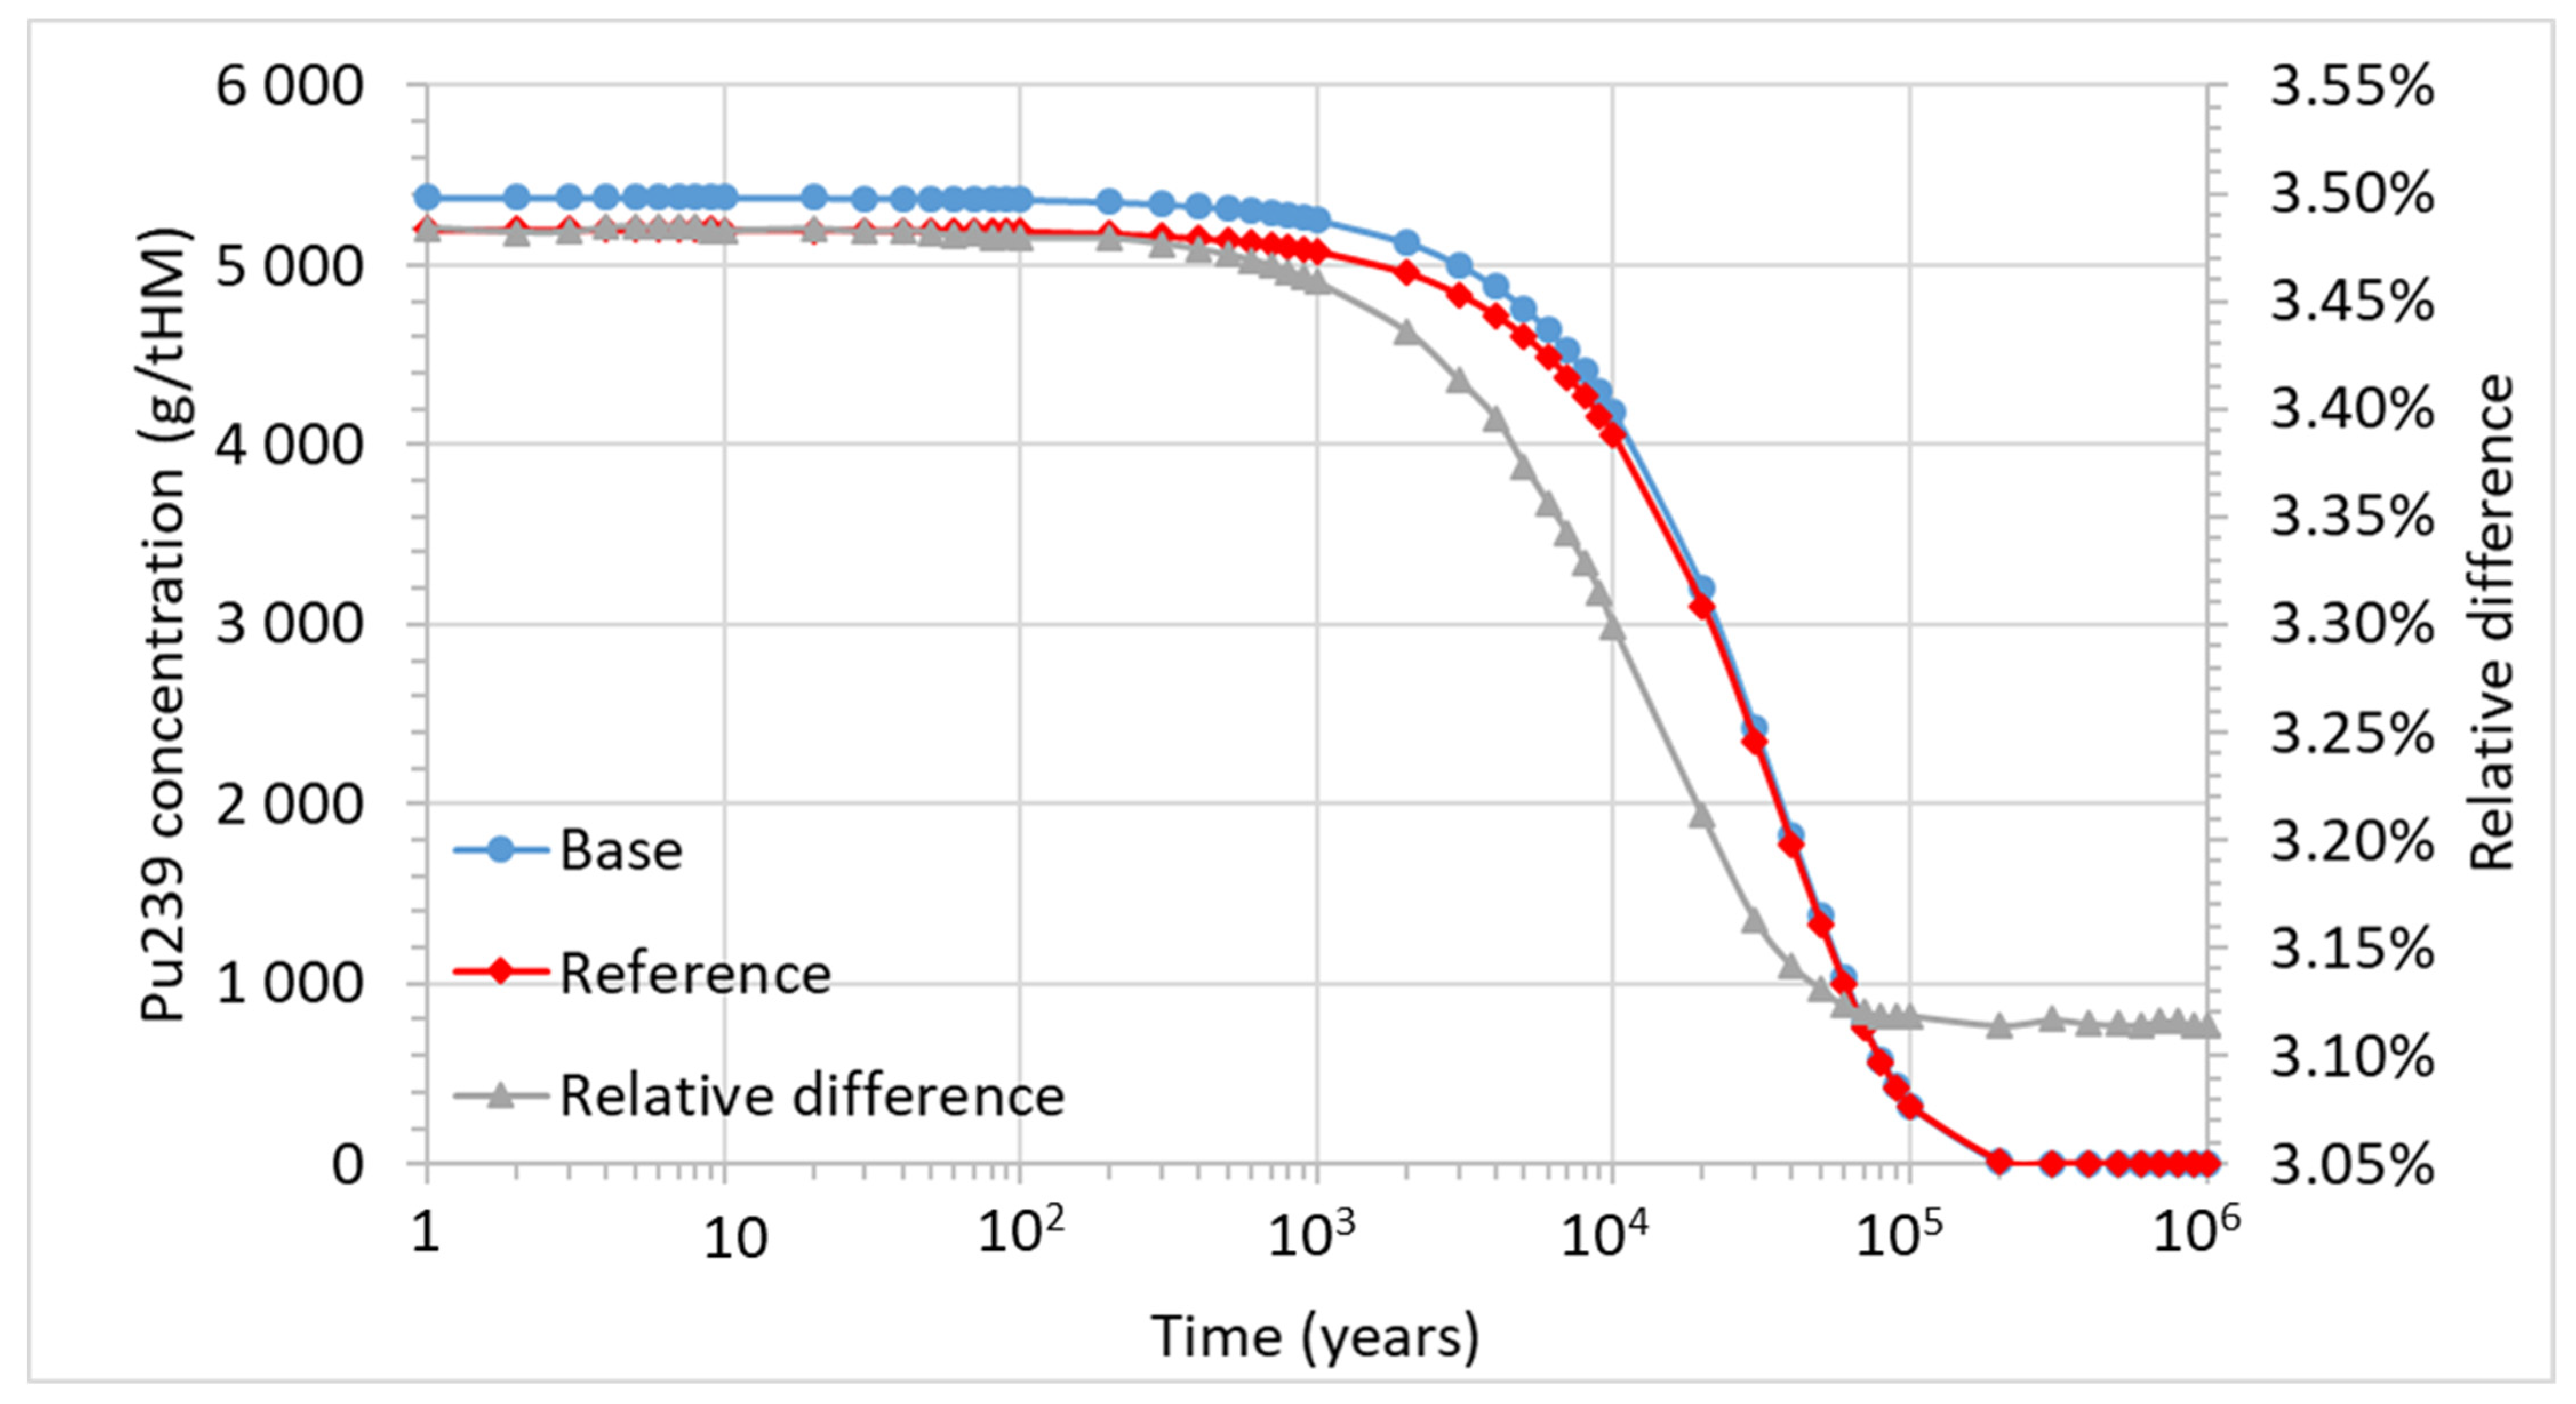
Evolution of 239Pu for the base and reference spent fuel composition.

Figure 14.
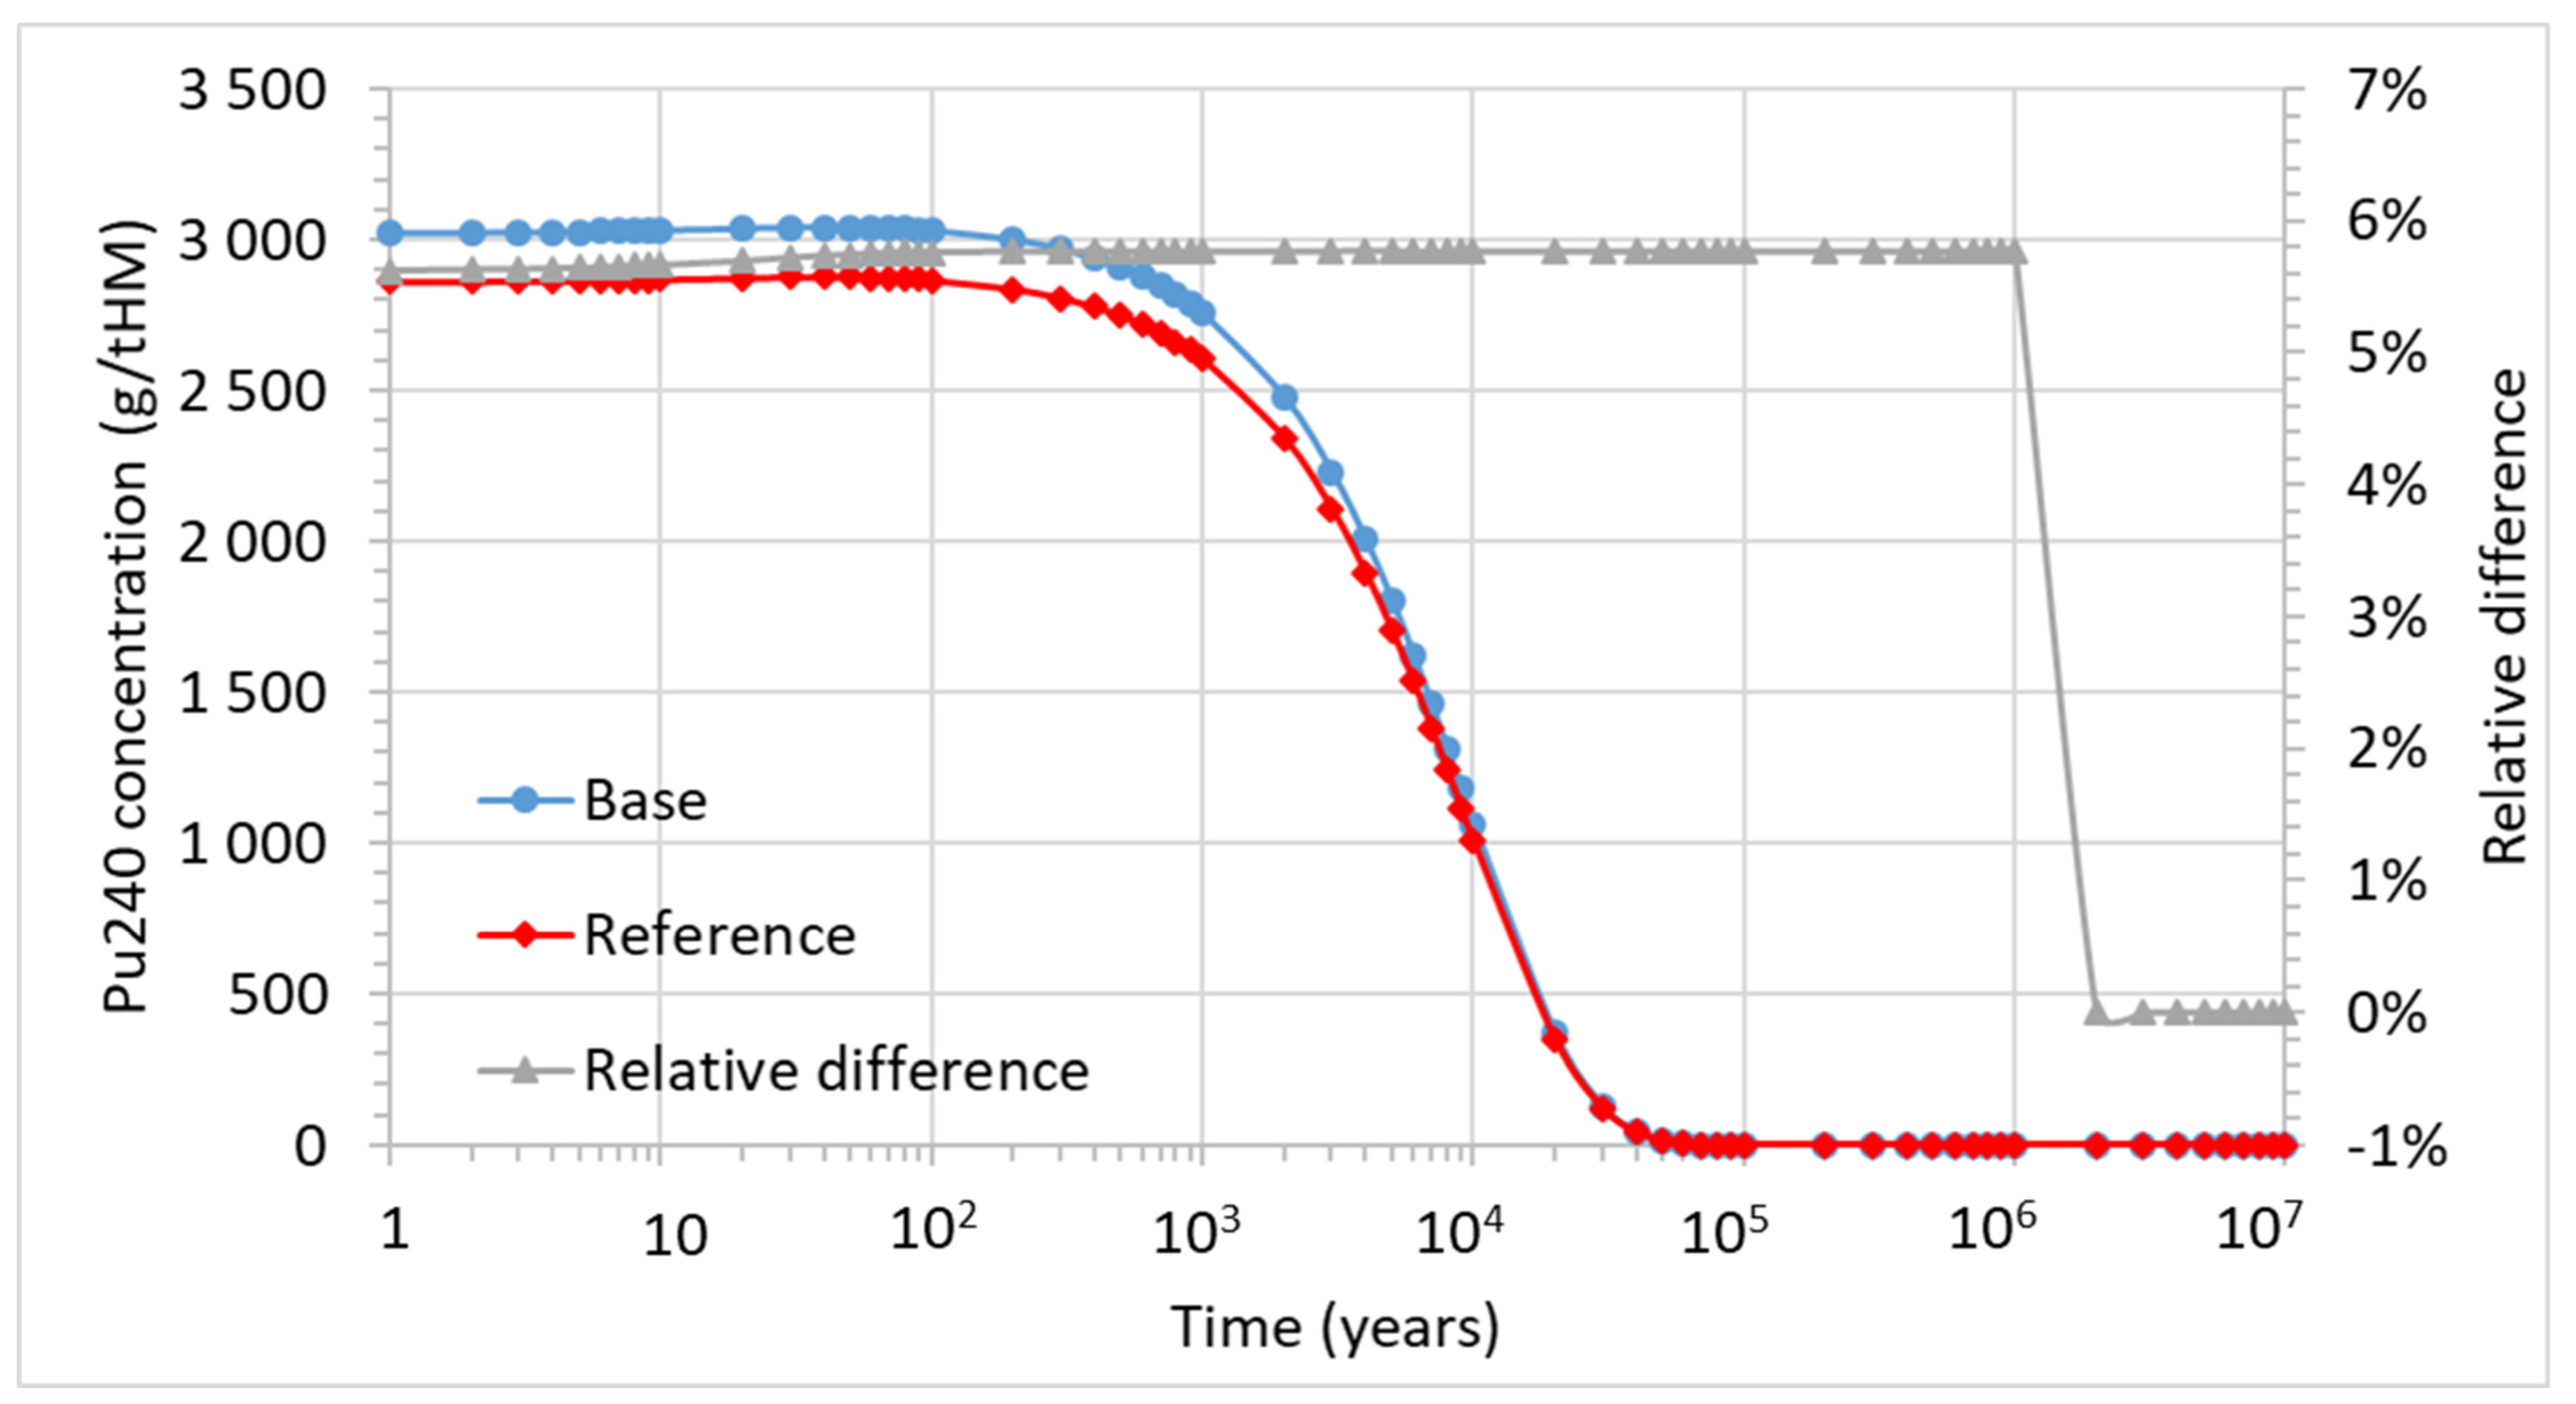
Evolution of 240Pu for the base and reference spent fuel composition.

Figure 15.
Evolution of 241Pu for the base and reference spent fuel composition.

Figure 16.
Evolution of 242Pu for the base and reference spent fuel composition.

Figure 17.
Evolution of americium for the base and reference spent fuel composition.

Figure 18.
Evolution of 241Am for the base and reference spent fuel composition.

Figure 19.
Evolution of 242mAm for the base and reference spent fuel composition.

Figure 20.
Evolution of 243Am for the base and reference spent fuel composition.

Figure 21.
Evolution of curium for the base and reference spent fuel composition.

Figure 22.
Evolution of 242Cm for the base and reference spent fuel composition.

Figure 23.
Evolution of 244Cm for the base and reference spent fuel composition.


Table 1.
Characteristics of the AP1000 reactor. Adapted from [19].
Table 1.
Characteristics of the AP1000 reactor. Adapted from [19].
| AP1000 | |
|---|---|
| Description | Value |
| Reactor thermal output | 3400 MWth |
| Power plant output, gross | 1200 MWel |
| Power plant output, net | 1100 MWel |
| Power plant efficiency, net | 32% |
| Mode of operation | Baseload and load follow |
| Plant design life | 60 years |
| Plant availability target | >93% |
| Primary coolant material | Light Water |
| Secondary coolant material | Light Water |
| Moderator material | Light water |
| Thermodynamic cycle | Rankine |
| Primary coolant flow rate | 14300 Kg/s |
| Reactor operating pressure | 15.513 Mpa |
| Core coolant inlet temperature | 279.4 °C |
| Core coolant outlet temperature | 324.7 °C |
| Mean temperature rise across the core | 45.2 °C |
| Steam flow rate at nominal conditions | 1889 Kg/s |
| Steam pressure | 5.76 Mpa |
| Steam temperature | 272.8 °C |
| Feedwater flow rate at nominal conditions | 1889 Kg/s |
| Feedwater temperature | 226.7 °C |
| Active core height | 4.267 m |
| Equivalent core diameter | 3.04 m |
| Average linear heat rate | 18.7 KW/m |
| Average fuel power density | 40.2 KW/KgU |
| Average core power density | 109.7 MW/m3 |
| Fuel material | Sintered UO2 |
| Rod array of a fuel assembly | Square, 17 × 17, XL |
| Number of fuel assemblies | 157 |
| Equilibrium enrichment | 4.8 weight % |
| Fuel cycle length | 18 months |
| Average discharge burnup of fuel | 60,000 MWd/Kg |
| Control rod absorber material | Ag-In-Cd, Ag-In-Cd/304SS |
| Soluble neutron absorber | H3BO3 |
Table 2.
Fuel samples from the SFCOMPO database chosen for validation [6].
Table 2.
Fuel samples from the SFCOMPO database chosen for validation [6].
| ID | Reactor | Assembly | Rod | Sample | Burnup (GW·d/tHMi) | Enrichment (% wt.) |
|---|---|---|---|---|---|---|
| 1 | Gösgen-1 | 1240 | 14H13 | GU1 (15) | 59.66 | 3.50 |
| 2 | Gösgen-1 | 1701 | 16B05 | GU3′ (18) | 52.50 | 4.10 |
| 3 | Neckarwestheim-2 | 419 | M11 | M11 | 54.00 | 3.80 |
| 4 | Ohi-1 | G13 | N13 | 91E07 | 52.43 | 3.20 |
| 5 | Takahama-3 | NT3G24 | SF97 | 4 | 47.03 | 4.11 |
| 6 | Takahama-4 | NT3G24 | SF97 | 5 | 47.25 | 4.11 |
| 7 | Calvert Cliffs-1 | BT03 | NBD107 | Q | 46.46 | 2.45 |
| 8 | Calvert Cliffs-1 | D047 | MKP109 | P | 44.34 | 3.04 |
Table 3.
Measured isotopic composition for the chosen fuel samples. Adapted from [6].
Table 3.
Measured isotopic composition for the chosen fuel samples. Adapted from [6].
| Sample | 1 | 2 | 3 | 4 | ||||
|---|---|---|---|---|---|---|---|---|
| ISOTOPE | Concentration (mg/gUi) | Uncertainty (%) | Concentration (mg/gUi) | Uncertainty (%) | Concentration (mg/gUi) | Uncertainty (%) | Concentration (mg/gUi) | Uncertainty (%) |
| 235U | 2.11 | 2.05 | 6.05 | 0.67 | 5.11 | 0.73 | 2.72 | 0.5 |
| 236U | 4.83 | 0.67 | 5.64 | 0.67 | 5.34 | 0.73 | 4.43 | 0.5 |
| 238U | 9.20 × 10² | 0.45 | 9.26 × 10² | 0.45 | 9.20 × 10² | 0.57 | 9.25 × 10² | 0.5 |
| 237Np | NA | NA | 8.04 × 10⁻¹ | 7.68 | 6.07 × 10⁻¹ | 20.00 | 5.98 × 10⁻¹ | 5.4 |
| 238Pu | 4.54 × 10⁻¹ | 3.05 | 3.77 × 10⁻¹ | 3.05 | 4.28 × 10⁻¹ | 3.10 | 3.87 × 10⁻¹ | 1.6 |
| 239Pu | 4.89 | 0.57 | 5.82 | 0.57 | 5.76 | 0.59 | 5.26 | 0.5 |
| 240Pu | 3.18 | 0.57 | 2.84 | 0.57 | 3.21 | 0.59 | 3.04 | 0.5 |
| 241Pu | 1.44 | 0.57 | 1.62 | 0.57 | 1.29 | 0.59 | 1.74 | 0.5 |
| 242Pu | 1.55 | 0.57 | 1.01 | 0.59 | 1.17 | 0.61 | 1.35 | 0.5 |
| 241Am | 2.48 × 10⁻¹ | 3.56 | 2.24 × 10⁻¹ | 3.48 | 5.24 × 10⁻¹ | 3.50 | 3.68 × 10⁻² | 8.3 |
| 242mAm | 6.85 × 10⁻⁴ | 10.60 | 9.19 × 10⁻⁴ | 10.58 | 1.56 × 10⁻³ | 11.0 | 9.56 × 10⁻⁴ | 1.5 |
| 243Am | 4.03 × 10⁻¹ | 3.56 | 2.38 × 10⁻¹ | 3.48 | 2.48 × 10⁻¹ | 3.50 | 3.50 × 10⁻¹ | 10.9 |
| 242Cm | 3.09 × 10⁻⁴ | 7.22 | 1.11 × 10⁻³ | 4.03 | 4.32 × 10⁻⁶ | 32.0 | 3.55 × 10⁻² | 0.5 |
| 244Cm | 2.44 × 10⁻¹ | 3.02 | 1.29 × 10⁻¹ | 3.24 | 1.32 × 10⁻¹ | 2.5 | 1.99 × 10⁻¹ | 0.9 |
Table 4.
Measured isotopic composition for the chosen fuel samples. Adapted from [6].
Table 4.
Measured isotopic composition for the chosen fuel samples. Adapted from [6].
| Sample | 5 | 6 | 7 | 8 | ||||
|---|---|---|---|---|---|---|---|---|
| ISOTOPE | Concentration (mg/gUi) | Uncertainty (%) | Concentration (mg/gUi) | Uncertainty (%) | Concentration (mg/gUi) | Uncertainty (%) | Concentration (mg/gUi) | Uncertainty (%) |
| 235U | 8.18 | 0.1 | 7.93 | 0.1 | 1.60 | 1.6 | 4.02 | 1.6 |
| 236U | 5.53 | 2 | 5.53 | 2 | 3.45 | 1.6 | 4.19 | 1.6 |
| 238U | 9.25 | 0.1 | 9.25 × 10² | 0.1 | 9.38 × 10² | 1.6 | 9.36 × 10² | 1.6 |
| 237Np | 6.60 × 10⁻¹ | 10 | 6.70 × 10⁻¹ | 10 | 4.29 × 10⁻¹ | 1.9 | 5.34 × 10⁻¹ | 1.9 |
| 238Pu | 3.20 × 10⁻¹ | 0.5 | 3.19 × 10⁻¹ | 0.5 | 3.22 × 10⁻¹ | 1.6 | 3.05 × 10⁻¹ | 1.6 |
| 239Pu | 6.04 | 0.3 | 5.98 | 0.3 | 4.27 | 1.6 | 4.94 | 1.6 |
| 240Pu | 2.67 | 0.3 | 2.65 | 0.3 | 2.95 | 1.6 | 2.89 | 1.6 |
| 241Pu | 1.77 | 0.3 | 1.75 | 0.3 | 1.01 | 1.6 | 1.16 | 1.6 |
| 242Pu | 8.25 × 10⁻¹ | 0.3 | 8.34 × 10⁻¹ | 0.3 | 1.33 | 1.6 | 9.53 × 10⁻¹ | 1.6 |
| 241Am | 5.31 × 10⁻² | 2 | 5.33 × 10⁻² | 2 | 7.21 × 10⁻¹ | 4.9 | 4.34 × 10⁻¹ | 4.9 |
| 242mAm | 1.23 × 10⁻³ | 10 | 1.20 × 10⁻³ | 10 | NA | NA | NA | NA |
| 243Am | 1.92 × 10⁻¹ | 5 | 1.94 × 10⁻¹ | 5 | NA | NA | NA | NA |
| 242Cm | 2.04 × 10⁻² | 10 | 1.90 × 10⁻² | 10 | NA | NA | NA | NA |
| 244Cm | 8.81 × 10⁻² | 2 | 8.82 × 10⁻² | 2 | NA | NA | NA | NA |
Table 5.
Characteristics of the investigated actinides. Adapted from [21].
Table 5.
Characteristics of the investigated actinides. Adapted from [21].
| Isotope | Half-Life (Years) | Application | ||
|---|---|---|---|---|
| BurnUp Credit | Radiological Safety | Waste Management | ||
| 233U | 1.59 × 10⁵ | N | N | N |
| 234U | 2.47 × 10⁵ | Y | N | Y |
| 235U | 7.04 × 10⁸ | Y | N | Y |
| 236U | 2.34 × 10⁷ | Y | N | Y |
| 238U | 4.47 × 10⁹ | Y | N | Y |
| 237Np | 2.14 × 10⁶ | Y | N | Y |
| 238Pu | 87.71 | Y | Y | Y |
| 239Pu | 2.41 × 10⁴ | Y | Y | Y |
| 240Pu | 6.55 × 10³ | Y | Y | Y |
| 241Pu | 14.29 | Y | N | Y |
| 242Pu | 3.76 × 10⁵ | Y | N | Y |
| 241Am | 4.33 × 10² | Y | Y | Y |
| 242mAm | 1.41 × 10² | N | N | N |
| 243Am | 7.37 × 10³ | Y | N | Y |
| 242Cm | 4.46 × 10⁻¹ | N | Y | N |
| 244Cm | 18.12 | N | Y | N |
Table 6.
Calculated-to-experimental ratios.
| Isotope | C/E | (C/E)AV | |||||||
|---|---|---|---|---|---|---|---|---|---|
| 1 | 2 | 3 | 4 | 5 | 6 | 7 | 8 | ||
| 235U | 1.01 | 0.80 | 0.72 | 0.97 | 0.80 | 0.81 | 1.33 | 0.94 | 0.92 |
| 236U | 0.96 | 0.97 | 0.96 | 0.97 | 0.98 | 0.98 | 0.95 | 0.97 | 0.97 |
| 238U | 1.00 | 1.00 | 1.00 | 1.00 | 1.00 | 1.00 | 1.00 | 1.00 | 1.00 |
| 237Np | NA | 1.04 | 1.39 | 1.28 | 1.11 | 1.10 | 1.42 | 1.19 | 1.22 |
| 238Pu | 1.07 | 0.94 | 0.91 | 0.97 | 0.84 | 0.85 | 0.92 | 0.87 | 0.92 |
| 239Pu | 1.04 | 0.88 | 0.89 | 0.97 | 0.85 | 0.85 | 1.21 | 1.04 | 0.97 |
| 240Pu | 0.89 | 0.97 | 0.87 | 0.93 | 1.00 | 1.01 | 0.97 | 0.96 | 0.95 |
| 241Pu | 1.25 | 1.03 | 1.34 | 1.02 | 0.87 | 0.88 | 1.75 | 1.44 | 1.20 |
| 242Pu | 0.83 | 0.88 | 0.87 | 0.83 | 0.84 | 0.84 | 0.83 | 0.91 | 0.86 |
| 241Am | 0.25 | 0.24 | 0.10 | 1.41 | 0.88 | 0.89 | 0.09 | 0.10 | 0.50 |
| 242mAm | 1.90 | 1.31 | 0.83 | 1.26 | 0.89 | 0.92 | NA | NA | 1.18 |
| 243Am | 1.12 | 1.02 | 1.22 | 1.01 | 0.84 | 0.85 | NA | NA | 1.01 |
| 242Cm | 92.36 | 21.27 | 6.13 × 10³ | 0.79 | 0.92 | 1.00 | NA | NA | 1.04 × 10³ |
| 244Cm | 1.08 | 0.78 | 1.07 | 0.90 | 0.64 | 0.66 | NA | NA | 0.85 |
Table 7.
Concentrations and masses of the investigated actinides in the spent nuclear fuel.
| Isotope | Concentrations (wt. fr.) | Masses (Tonnes) | ||
|---|---|---|---|---|
| Base | Reference | Base | Reference | |
| 235U | 5.20 × 10⁻³ | 4.81 × 10⁻³ | 47.39 | 43.79 |
| 236U | 6.89 × 10⁻³ | 6.67 × 10⁻³ | 62.70 | 60.73 |
| 238U | 9.75 × 10⁻¹ | 9.76 × 10⁻¹ | 8.88 × 10³ | 8.88 × 10³ |
| 237Np | 1.14 × 10⁻³ | 1.39 × 10⁻³ | 10.39 | 12.66 |
| 238Pu | 3.90 × 10⁻⁴ | 3.59 × 10⁻⁴ | 3.55 | 3.27 |
| 239Pu | 5.38 × 10⁻³ | 5.20 × 10⁻³ | 48.98 | 47.32 |
| 240Pu | 3.02 × 10⁻³ | 2.86 × 10⁻³ | 27.48 | 26.08 |
| 241Pu | 4.74 × 10⁻⁴ | 5.68 × 10⁻⁴ | 4.32 | 5.17 |
| 242Pu | 1.04 × 10⁻³ | 8.93 × 10⁻⁴ | 9.50 | 8.13 |
| 241Am | 1.33 × 10⁻³ | 1.33 × 10⁻³ | 12.15 | 12.15 |
| 242mAm | 1.28 × 10⁻⁶ | 1.51 × 10⁻⁶ | 1.16 × 10⁻² | 1.38 × 10⁻² |
| 243Am | 3.02 × 10⁻⁴ | 3.06 × 10⁻⁴ | 2.75 | 2.78 |
| 242Cm | 2.22 × 10⁻⁸ | 2.22 × 10⁻⁸ | 2.02 × 10⁻⁴ | 2.02 × 10⁻⁴ |
| 244Cm | 4.49 × 10⁻⁵ | 3.84 × 10⁻⁵ | 4.09 × 10⁻¹ | 3.50 × 10⁻¹ |
Publisher’s Note: MDPI stays neutral with regard to jurisdictional claims in published maps and institutional affiliations. |
© 2021 by the author. Licensee MDPI, Basel, Switzerland. This article is an open access article distributed under the terms and conditions of the Creative Commons Attribution (CC BY) license (https://creativecommons.org/licenses/by/4.0/).
Share and Cite
MDPI and ACS Style
Oettingen, M. Assessment of the Radiotoxicity of Spent Nuclear Fuel from a Fleet of PWR Reactors. Energies 2021, 14, 3094. https://0-doi-org.brum.beds.ac.uk/10.3390/en14113094
AMA Style
Oettingen M. Assessment of the Radiotoxicity of Spent Nuclear Fuel from a Fleet of PWR Reactors. Energies. 2021; 14(11):3094. https://0-doi-org.brum.beds.ac.uk/10.3390/en14113094
Chicago/Turabian StyleOettingen, Mikołaj. 2021. "Assessment of the Radiotoxicity of Spent Nuclear Fuel from a Fleet of PWR Reactors" Energies 14, no. 11: 3094. https://0-doi-org.brum.beds.ac.uk/10.3390/en14113094
Note that from the first issue of 2016, this journal uses article numbers instead of page numbers. See further details here.