
Energy Management System Based on a Gamified Application for Households
by
 , , , , and
Manuel Avila
1,*,† ,
,
Juana Isabel Méndez
1,†,
Pedro Ponce
1,† ,
,
Therese Peffer
2,†,
Alan Meier
3,† and
Arturo Molina
1,† 1
School of Engineering and Sciences, Tecnologico de Monterrey, Mexico City 14380, Mexico
2
Institute for Energy and Environment, University of California, Berkeley, CA 94720, USA
3
Energy and Efficiency Institute, University of California, Davis, CA 95616, USA
*
Author to whom correspondence should be addressed.
†
These authors contributed equally to this work.
Energies 2021, 14(12), 3445; https://0-doi-org.brum.beds.ac.uk/10.3390/en14123445
Submission received: 1 April 2021
/
Revised: 15 May 2021
/
Accepted: 1 June 2021
/
Published: 10 June 2021
(This article belongs to the Special Issue Smart Thermostats for Energy Saving in Buildings)
Abstract
:Nowadays, the growth in the consumption of energy and the need to face pollution resulting from its generation are causing concern for consumers and providers. Energy consumption in residential buildings and houses is about 22% of total energy production. Cutting-edge energy managers aim to optimize electrical devices in homes, taking into account users’ patterns, goals, and needs, by creating energy consumption awareness and helping current change habits. In this way, energy manager systems (EMSs) monitor and manage electrical appliances, automate and schedule actions, and make suggestions regarding electrical consumption. Furthermore, gamification strategies may change energy consumption patterns through energy managers, which are seen as an option to save energy and money. Therefore, this paper proposes a personalized gamification strategy for an EMS through an adaptive neuro-fuzzy inference system (ANFIS) decision-making engine to classify the level of electrical consumption and persuade the end-user to reduce and modify consumption patterns, saving energy and money with gamified motivations. These strategies have proven to be effective in changing consumer behavior with intrinsic and extrinsic motivations. The interfaces consider three cases for summer and winter periods to calculate the saving-energy potentials: (1) for a type of user that is interested in home-improvement efforts while helping to save energy; (2) for a type of user that is advocating to save energy; (3) for a type of user that is not interested in saving energy. Hence, each interface considers the end-user’s current consumption and the possibility to modify their consumption habits using their current electrical devices. Finally, an interface displaying the electrical consumption for each case exemplifies its linkage with EMSs.
Keywords:
energy management system; gamification; smart home; HMI; ANFIS; HVAC; thermostat; tailored products1. Introduction
Nowadays, the quality of life depends mainly on electrical devices, shaping how people dwell, work, recreate, and transport. According to [1], of the energy consumed worldwide, 21.69% is by residential buildings, 18.22% by the commercial sector, 27.84% by the transportation sector, and the rest by the industrial sector. Nevertheless, the use of energy is compromised mostly by how this energy comes, which is from thermoelectric plants that generate carbon dioxide emissions that threaten the quality of life from a global perspective. Therefore, it is essential to use energy efficiently and include renewable energy sources, which cannot replace the energy from thermoelectric plants. The level of technology reached today allows monitoring, measuring, controlling, and scheduling electrical appliances or devices in real time at home, work, and public places [2]. At home, modern electrical devices allow people to have the comfort level demanded today, facilitating domestic tasks, home office, homeschooling, recreational activities, entertainment, and the involvement with the community to which they belong [3].
Currently, energy manager systems (EMSs) allow handling the energy consumed by a group of people in a household and provide specific tools to make it as efficient as possible [4]. Nevertheless, the variety of electrical devices and their complexity make their integration, programming, or effective use within the EMS difficult, especially for those not related to cutting-edge technology, like senior users or digitally illiterate users [5]. Moreover, people develop energy consumption patterns that are usually related to cultural or psychological outcomes that are difficult to change [6]. Usually, residential consumers do not have the tools to measure and alter their energy consumption or control electrical devices when energy consumption is metered only monthly [7]. New tools and methodologies to improve the estimation accuracy of residential energy consumption are necessary to improve energy-saving potential calculations [8]. In this way, modifying habits or the creation of new ones may be possible, overlooking energy demand in the market and price variations, or to allow consumers to understand their environmental impact related to electricity consumption.
Gamification strategies allow people to change their consumption and social involvement through incentives, environmental awareness, and possible competition and cooperation with other community members in similar conditions [9]. Gamification techniques applied to EMS make it possible to stimulate users to diminish their energy consumption and save money on billing [10], which entails reducing greenhouse gas emissions produced by the primary electricity grid. In addition, these techniques may favor renewable energies and allow for exchange of information in real-time between suppliers and consumers for energy resilience and security. They provide valuable tools for the energy market to better distributor system operators (DSOs) and demand response (DR) programs while creating or increasing the community’s sense of belonging [11].
Current approaches for gamified saving-energy strategies try to positively influence the behavior of the users towards efficient consumption by socio-technical systems, which demonstrated that managing the consumers’ demand gives a more sustainable consumption [12]. One of these applications is Wattsup [13], that displays energy consumption and CO2 emission data through a social media application, giving users the ability to share and compare household data with their friend. This app uses an energy monitoring device which transmit the data to a server for a a social media gamified application. Another interesting project is enCOMPASS [14], in which a gamified web application was developed that is accessible via PC and cell phone, enabling interactive visualization of energy consumption patterns.
Using current technologies in artificial intelligence as an adaptive neuro-fuzzy inference system (ANFIS), fuzzy logic, or neural network decision systems gives insights regarding the type of gamification elements that can be displayed within the human–machine interface (HMI) environment to promote electrical energy reduction [15]. The relevance of adaption of these artificial techniques is that they emulate human making decisions so that reliable proposals can promote energy reduction. In this way, it is possible to think of an integrated and complex system for efficient energy management that favors renewable energies, creates awareness of consumption and energy savings, and provides analysis tools to improve techniques and algorithms related to forecasting consumption patterns. This project uses AI and fuzzy inference to recognize consumption patterns and calculate potential changes in users’ behavior to achieve energy efficiency, while offering an uncomplicated and custom interface to the user. Current gamified approaches do not offer a tailored interface for user engagement.
Therefore, this paper presents three types of users based on their preferences and goals. Then, it analyzes the energy usage impact for each home located at Concord, California, with a focus on the heater/furnace and air conditioner. Finally, this proposal presents a tailored gamified application linked to an EMS for each case and the proposal of flexible loads required during on-peak periods and the time of use (ToU). This gamified application uses an ANFIS decision system where the inputs consider the electrical consumption and the set point during the summer or winter seasons to deliver the type of gamified motivation needed to promote household appliances’ flexible usage.
The structure of this paper is as follows: Section 2 presents the state of the art regarding EMS, gamification, ANFIS, and thermal comfort. Section 3 presents the three-step methodology used for this paper. Section 4 describes the results, by step, of the previous section and the three tailored gamified interfaces for each case. Section 5 presents a discussion regarding the current EMS and the gamification approach with the advantages and disadvantages of the present proposal. Finally, Section 6 details the conclusions and future work.
2. State of the Art
Today’s technologies aim to inter-connectivity, automation, and high performance of the electrical grid using the Internet of Things (IoT) and artificial intelligence (AI) technologies such as big data (BD) and machine learning (ML) [16,17]. The smart new paradigm in the electrical grid allows the energy provider and end-user to track the energy consumption in real time and know how energy is being consumed in each electrical device, known as energy disaggregation and usually done through non-intrusive load monitoring (NILM) techniques [18,19]. This provides the opportunity to solve particular problems such as energy efficiency through the existing tools (e.g., smart metering infrastructure, smart electrical devices, smart plugs and sensors, internet, programming tools, and user interfaces) in order to build the smart grid and control the electrical devices involved [20,21]. A well known tool to deal with energy efficiency is EMS [22], where the information related to energy consumption, the electrical market, the user preferences and consumption patterns, as well as indoor thermal comfort and outdoors or environmental conditions can be merged into a decision-making process for optimizing energy usage.
2.1. Energy Management System
EMS is a computer-aided system to monitor, control, and optimize the generation, distribution, and consumption of the electricity within the grid, keeping the balance between supplied and demanded energy at any given time, managing the available DERs, the load scheme, and energy exchange with the primary grid [23]. EMS presents information about the electrical network status (e.g., energy stored, forecast energy production by distributed generators (DG), appliances scheduling), enabling decision-making about its safe and cost-effective operation [24]. Likewise, EMS would collect generation, consumption, and storage information of past and current performance to improve the decision-making process, optimal manipulation of controllable devices, consumption, and generation forecasting and, finally, network management recommendations. It would also provide relevant information on the weather, the energy market, and billing user status [2]. In this way, EMS would manage controllable loads using communication technologies, sensors, and actuator devices, nowadays usually included in electric devices or modern appliances, thus, enhancing the cost-effective and reliable operation of the user electrical grid, a smart home in this case, by active participation in the electricity market [25].
The current trend favors individualized and private monitoring of energy resources, facilitating the inclusion of distributed energy resources (DER) such as low voltage generators from renewable sources, electric vehicles (EV), and optimal managing of programmable and controllable devices such as thermostat HVAC systems [26,27,28]. In [27], uncertainty and load demand variability in a smart home are analyzed without the user’s preferences nor goals, and in [29], a certain level of comfort is assumed. Simulation frameworks [30,31] control electrical devices in a dynamic price scheme but do not consider human behavior as a part of the equation to achieve energy efficiency. In this way, the social part needs to be seen so the end-users can adopt the EMS without negatively affecting their social behavior, where consumption patterns and DR programs are allowed to reach energy efficiency and then achieve a smart and sustainable electrical grid that is required by society [32].
Nowadays, people can reduce and manage the electricity consumption in homes by installing home energy management systems (HEMS). Information and communication technologies (ICT) will enable two-way communication among the customers and distributors, providing real-time rates and billing status [2]. The EMS requires a user-friendly interface, energy consumption display, auto-configuration, or easy set-up to enhance user interaction with its energy distributor. Users will be able to optimize consumption when the price is high, and distributors will be able to shift and shape demand, providing statistical data to predict energy consumption. In this way, EMS allows the generation of databases of consumption patterns used in algorithms to optimize energy consumption [33]. Consumption patterns are essential to predict energy consumption, shape the energy demand, and favor renewable sources. Energy consumption patterns of a household contain the load scheme of appliances and electrical devices as EVs. The historical performance of DERs, such as photovoltaic panels, wind turbines, and batteries, are used to propose to the user to change their consumption habits by scheduling appliances and suggesting strategies. [34].
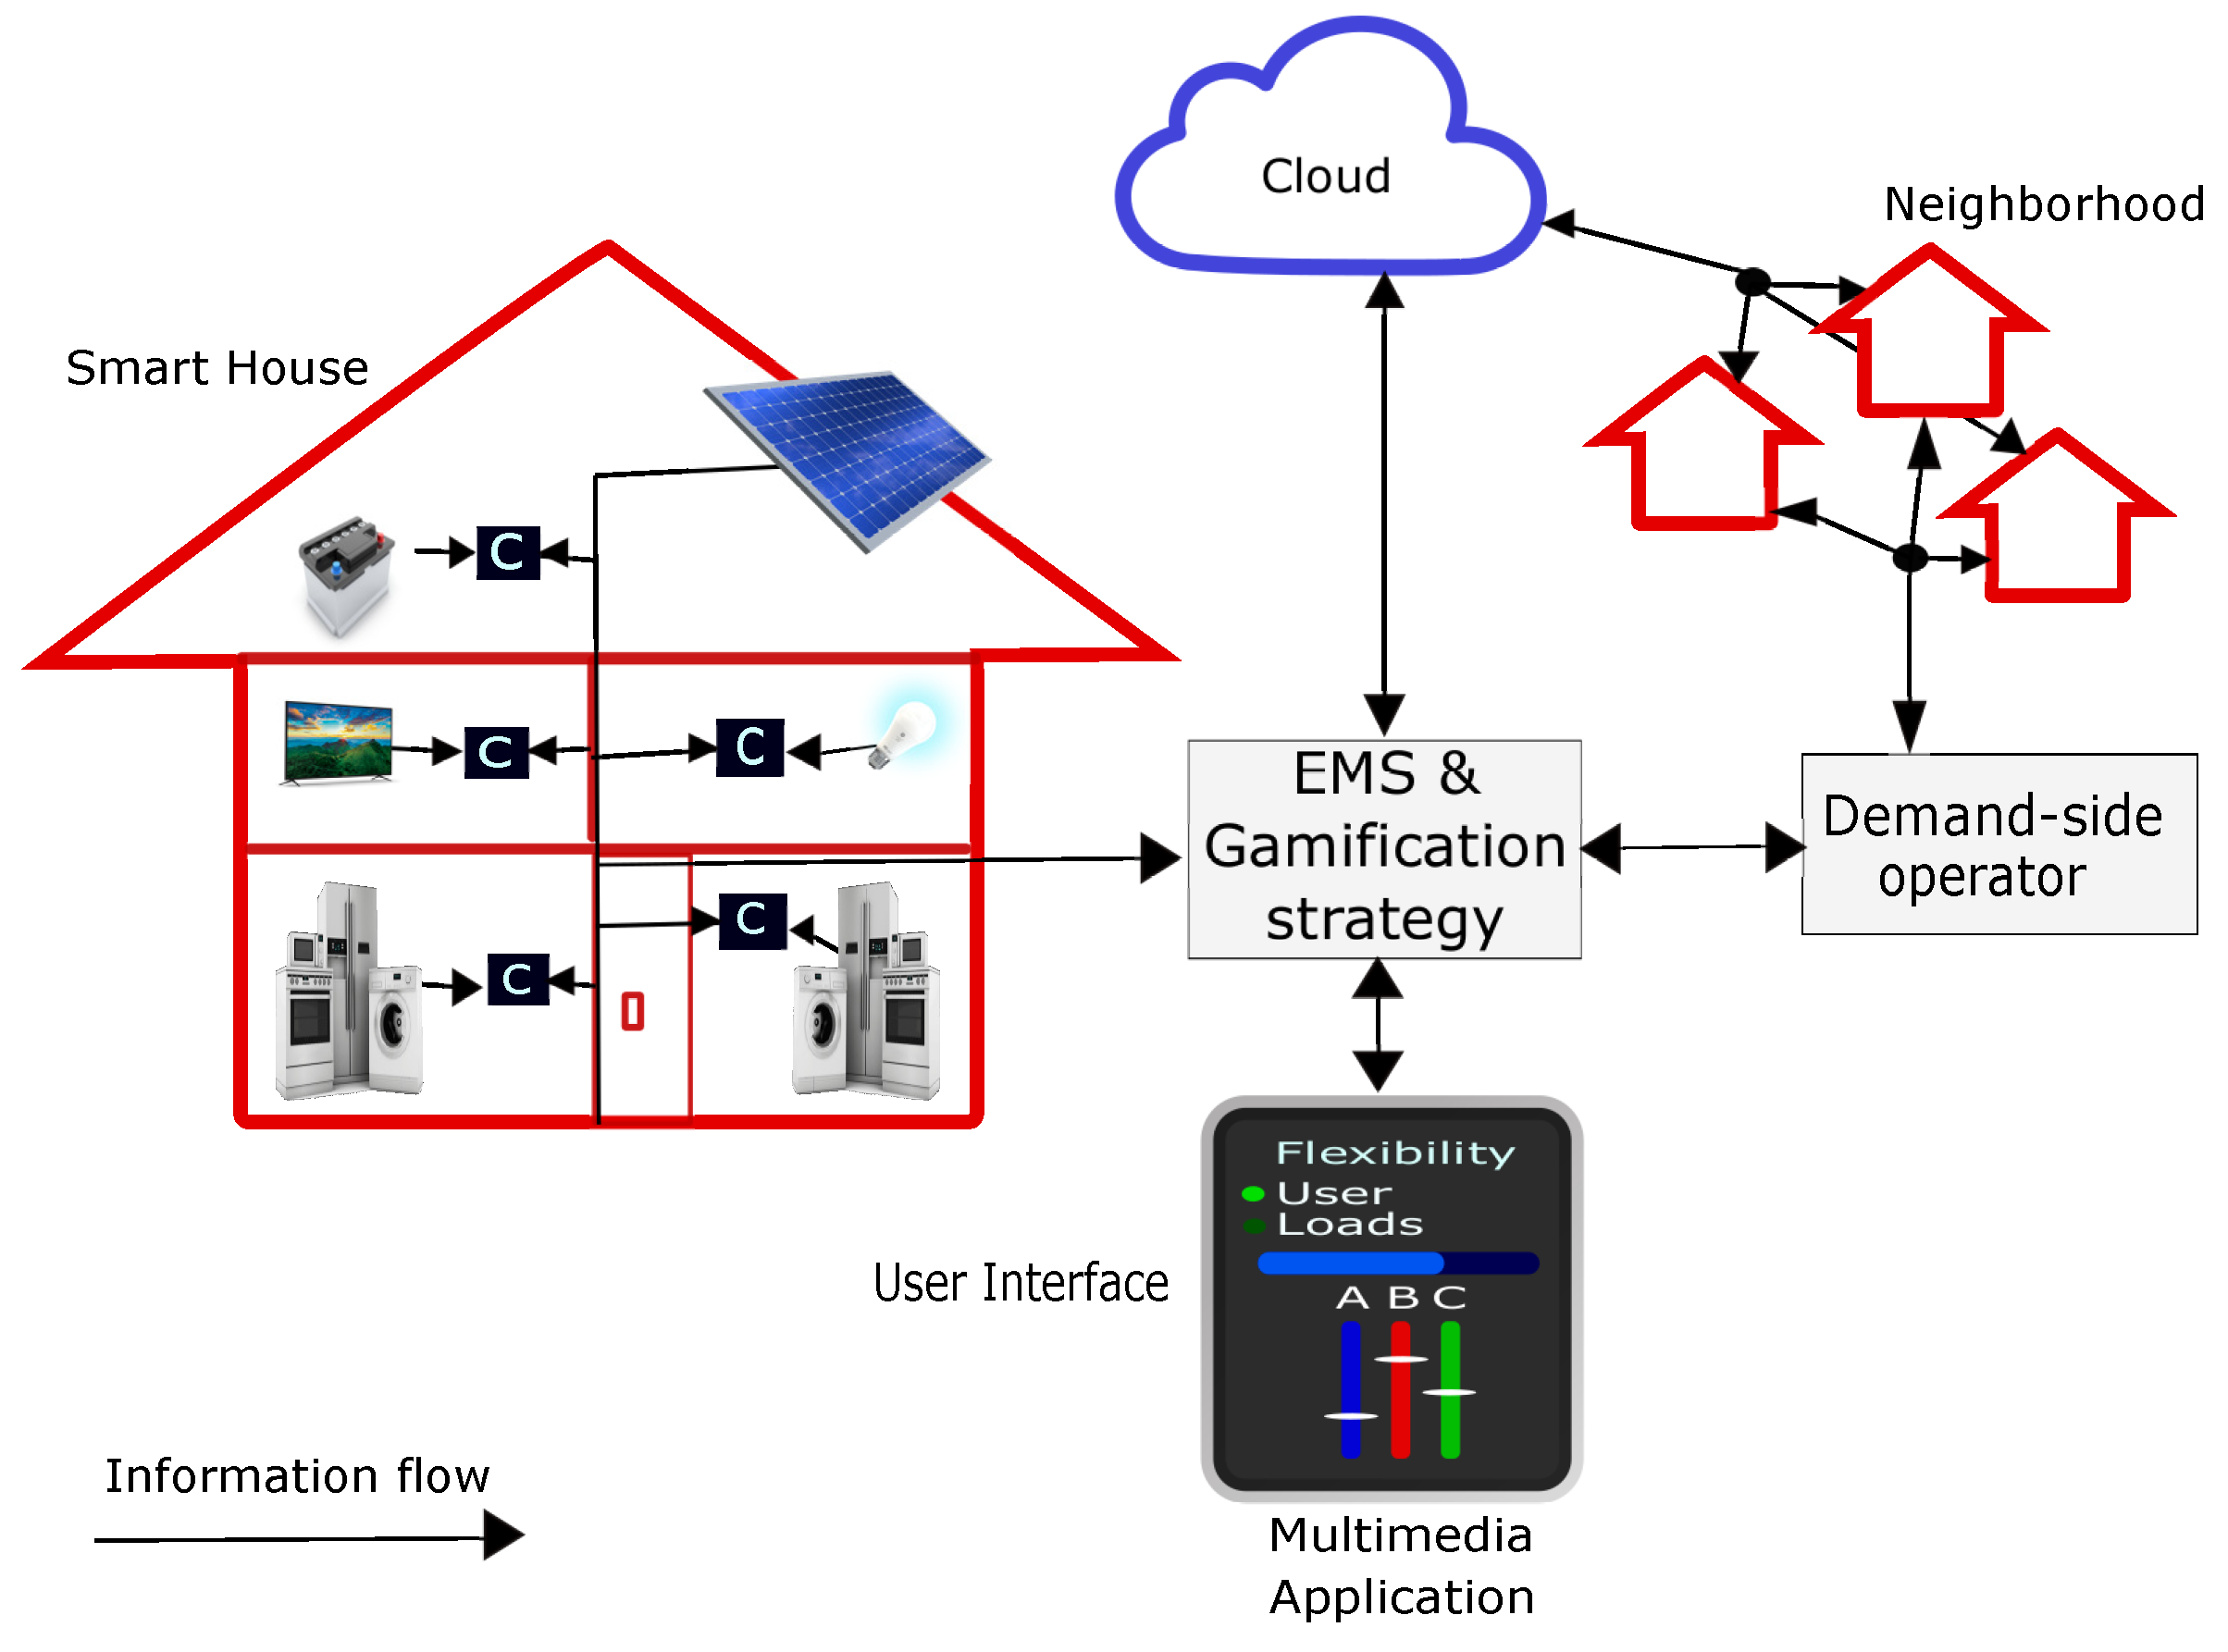
Therefore, the human factor must be included in the electrical simulators using probability functions based on actual data. In addition, one way to emulate the users’ response on DR programs and their interaction with DSOs is that gamification strategies can be used to study consumption patterns and how to change them to achieve energy efficiency. This is possible modeling electrical cases through a network of interconnected agents in order to test stochastic behaviors. Figure 1 shows the connected energy entities and the interaction among the load scheme, end-user, and the energy provider.
2.2. Gamification and Serious Games
Gamification uses game elements and game design techniques in a real-life context [9]. Some gamification strategies propose modifying the demand by taking advantage of the energy generated by DERs that usually work when demand is much lower than during peak hours [35]. Moreover, the users compete in shared spaces to save energy in real-time, using challenges, social sharing, rewards, leader-boards, points, tips, levels, rankings, avatars, badges to promote environmental education, consumer awareness and users engagement [36]. Therefore, gamification’s primary goal is to motivate users by using game-like techniques in the real world to shape individuals’ behavior and improve their skills [12].
In [37], the authors analyzed Fit for Green, PowerAgent, Greenify, and PowerHouse gamified applications to suggest three best practices for sustainable applications: make sustainability a fun and rewarding experience, create positive peer pressure sustainability issues, and use gamification to promote meaningful action. Regarding the gamification elements, the applications and their considerations are as follows:
- Fit for Green uses feedback and rewards by employing cardio machine workouts to promote environmental awareness through two impact workouts. The first by promoting exercise and feeding that energy back into the grid. The second, by generating funds for charities that protect the environment.
- Greenify focuses on motivating senior users to become aware of climate change by enhancing social sharing and tips between them to address this problem.
- PowerHouse uses avatars and archetypal characters to promote the sense of belonging of the end-user so the users accept exploring the cause and effect relationships of daily activities regarding electrical consumption and receive instant feedback.
- PowerAgent uses appealing computer games and mobile applications to promote changes in household users’ energy consumption patterns.
Moreover, an energy gamified application must be environmentally goal-oriented with game-like features [38]. In [36], they analyzed nineteen gamified projects from Europe to propose these game design elements to engage end-users in energy applications: statistics, messages, tips, discounts in electricity bill, virtual currency, prizes, offers and coupons, competition, collaboration, energy community, dashboard, leader-board, progress bar, message box, notifications, degree of control, points, badges, and levels.
- Extrinsic motivation: People are motivated because they want something they cannot get, and earning it infers outer recognition or even monetary prizes. Include factors of external control, identification, and integration.
- Intrinsic motivation: The activity is rewarding on its own without a particular purpose to succeed. This motivation considers autonomy, competence, and relatedness.
As described in [36], a gamified energy application framework can be compound system of technical, behavioral, and economic systems. The technical component has the smart metering system, EMS, web/mobile applications, network, and software, which are necessary to monitor and control energy consumption and user response. The game design elements for the behavioral aspect are information provisioned, rewarding system, social connection, user interface, and performance status. For the economic aspect or value proposition, the components are the residential customers, suppliers, and society, which bring significant value streams to users while driving positive and measurable business outcomes for energy providers and society.
Previous research includes the use of AI for residential EMS with no prior linkage to a gaming strategy that engages the end-user in the process of energy reduction [39,40,41]. In addition, the previous gamified strategies did not consider personalizing interfaces for energy reduction [42,43,44,45,46] or only proposed frameworks with no interface proposals [47,48]. Hence, some proposals include incorporating tailored gamified interfaces through a three-step framework that continuously runs through the HMIs to receive updates and feedback and make adjustments to the gamified interface to engage, teach, and motivate end-users to save energy in connected thermostats [49,50,51,52], smart homes [53,54], smart communities, and smart cities [55].
2.3. Adaptive Neuro-Fuzzy Inference Systems (Anfis) for Gamified Interfaces
A fuzzy inference system is a fuzzy-rule-based system consisting of linguistic rules or conditional states expressed in the form IF A–THEN B, where A and B are labels of fuzzy sets. Fuzzy systems are used to capture human thinking or the reasoning of human ability to make decisions in an environment of uncertainty and imprecision [56]. On the other hand, an adaptive network is a structure consisting of nodes and directional links through which the nodes are connected, their outputs depend on the parameters about these nodes, and the learning rule specifies how these parameters should be changed to minimize a prescribed error measure [57]. In that regard, several proposals have been made, such as the combination of artificial neural networks with fuzzy systems. Artificial neural networks can learn and adapt from experience, thus complementing fuzzy systems. Among the most important techniques is ANFIS, an adaptive neuro-fuzzy inference system proposed by Jang [58] in 1993, which generates fuzzy IF–THEN rule bases and fuzzy membership functions automatically. ANFIS is based on adaptive networks, a super set of feed-forward artificial neural networks with supervised learning capabilities as stated by Jang in [58] and [59]. The basic learning rule of adaptive networks is based on the gradient descent and the chain rule; however, this method is usually slow and likely to become trapped in local minimal. Thus, Jang proposed a hybrid learning rule that combines the gradient method and the least-squares estimate to identify parameters.
In [54], they proposed the inclusion of Alexa and cameras to track the senior people and monitor their daily mood to improve their quality of life by promoting social inclusion and physical exercise. The multi-sensor system is used within a smart home environment to identify the physical characteristics of older people. Thus, the voice and face detection are evaluated on an ANFIS system to propose the personalized gamified elements that run in an HMI needed for each type of user.
In [55], based on the type of environmental home and the amount of electrical energy usage, they used the ANFIS decision system to propose a gamified interface based on intrinsic or extrinsic motivations.
2.4. Thermal Comfort
Thermal comfort is essential in a built environment for energy saving, where data-driven thermal comfort models enhance the prediction accuracy to maintain optimal the human comfort reaction and its interaction with the environment. The existing thermal comfort models are applied in different environments like sleeping environments, indoor and outdoor environments. These models consider features such as groups or types of people, such as elderly and different races, gender, age, weight, the amount of activity, clothing thermal resistance, air temperature, radiation, relative humidity, wind speed, activity intensity, metabolic rate, and other factors [60]. Besides physiological aspects, weather conditions, and the level of activity and occupancy in the house, psychological aspects and users’ preferences are important to set up thermal comfort [60].
The Universal Thermal Climate Index (UTCI) considers a reference environment with 50 percent relative humidity, vapor pressure below 20 hPa, air temperature, and wind speed of 0.5 m/s at 10 m height or 0.3 m/s at 1.1 m. In addition, the thermal stress is categorized within the ten ranges of different values of the UTCI [61]:
- Extreme heat stress: above 46 °C
- Very strong heat stress: +38 to +46 °C
- Strong heat stress: +32 to +38 °C
- Moderate heat stress: +26 to +32 °C
- No thermal stress: +9 to +26 °C
- Slight cold stress: 0 to +9 °C
- Moderate cold stress: 0 to −13 °C
- Strong cold stress: −13 to −27 °C
- Very strong cold stress: −27 to −40 °C
- Extreme cold stress: below −40 °C
Thermostats stand for managing thermal comfort and energy consumption, whether temperature is good enough in the home, and how much comfort users are willing to concede to save energy and money. Because thermal comfort has to do with human psychology, there are many fuzzy elements in the modeling of these systems, where technologies such as machine learning and big data help create adequate and functional models [62]. ANFIS is widely used in thermal comfort models to calculate building energy needs by controlling humidity and temperature in HVAC systems, and thermostats [15,63,64]. In this study, the buildings’ construction material is taken into account to calculate the indoor temperature with the outdoor one. This information is important when thermal comfort is delimited form users preferences to calculate the energy-saving potential.
3. Methodology Proposed for Ems Using a Gamified Strategy
Simulation allows recreating different scenarios with different conditions and users’ responses using databases of previous performances and suitable models for recreating the process in order to analyze the viability before implementation [65]. As explained in [66], the simulation experiment process has the following states.
3.1. Problem Formulation
Problem formulation: matching users’ patterns and preferences with a customized EMS for households to propose changes in the user behavior when predicting energy efficiency consumption using a gamification strategy and prioritization scheme. In this step, the metrics, measures, and parameters are defined. Metrics are the kilowatts per hour (kWh) consumed and supplied, the US$ billing and dynamic rates, and carbon emission footprint in kilograms (kg). Measures will be the historical energy consumption by the smart home’s electrical grid at different rates by different types of users. Parameters are the simulation lapse time, power units, and delimitation of human variables (such as comfort level, environmental commitment, and savings goals).
Inputs of the system:
- Available electrical consumption/generation data and home energy profile—power features of loads and DERs
- Billing rates—currency and energy rates by hour, weekday, weekend, and season
- Temperature and season—outdoor temperature, indoor temperature, summer or winter season
- User preferences, goals, and patterns: environmental commitment, energy saving goals, thermal comfort and other home comfort, level of activity, schedules
Outputs of the system:
- Proposed energy consumption scheme for a particular user preferences and conditions
- Energy comparison with actual consumption patterns and proposal energy consumption—energy saving, billing status, and carbon emission indicators
- Gamification strategy to achieve energy efficiency goals—combination of intrinsic and extrinsic motivations, and interface proposal
3.2. Experiment Design
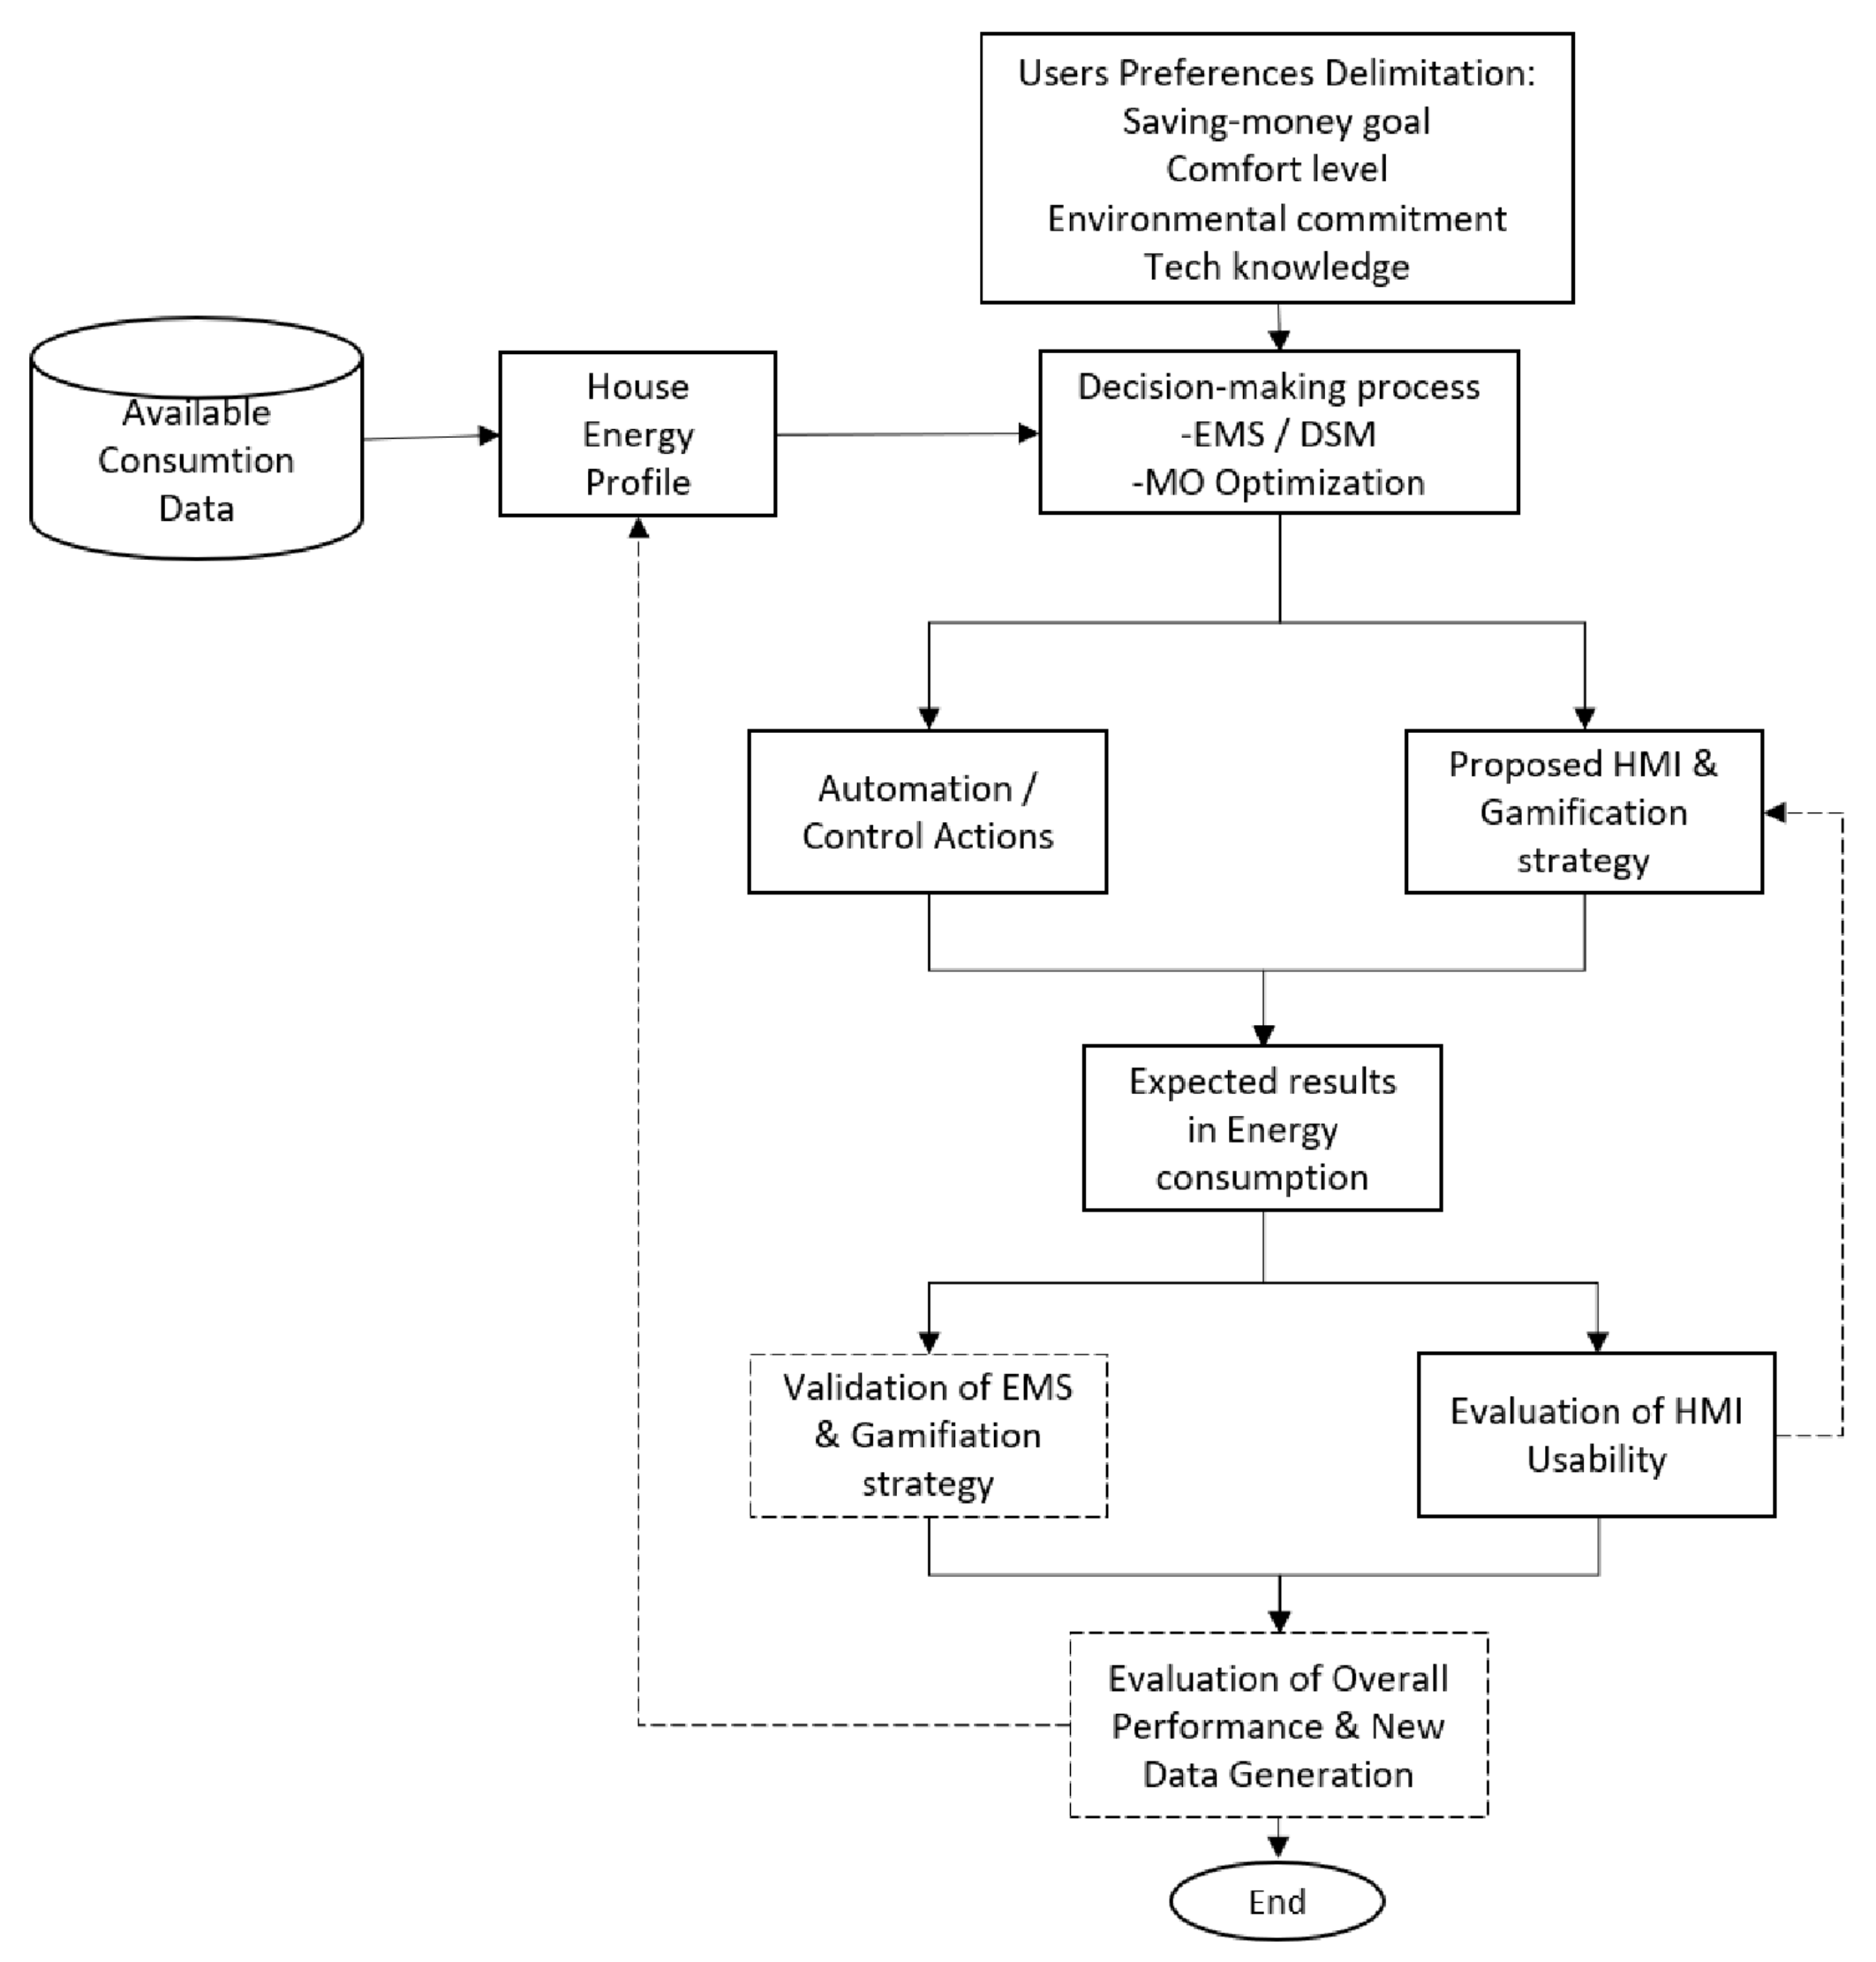
The general framework is shown in Figure 2. User preferences and goals are delimited based on four categories: environmental commitment, tech field knowledge, desired comfort, and saving money interest. House energy profile gives the power consumption of each appliance and electrical device and the consumption patterns based on the schedule and level of activity for that group of users. Then, the decision-making process classifies and prioritizes electrical devices, where the algorithm activates the automatic and controllable devices and proposes the gamification strategy for users. EMS and gamification strategy are shown in the energy consumption scheme for validation and usability evaluation of the proposed HMI. Each step is described below.
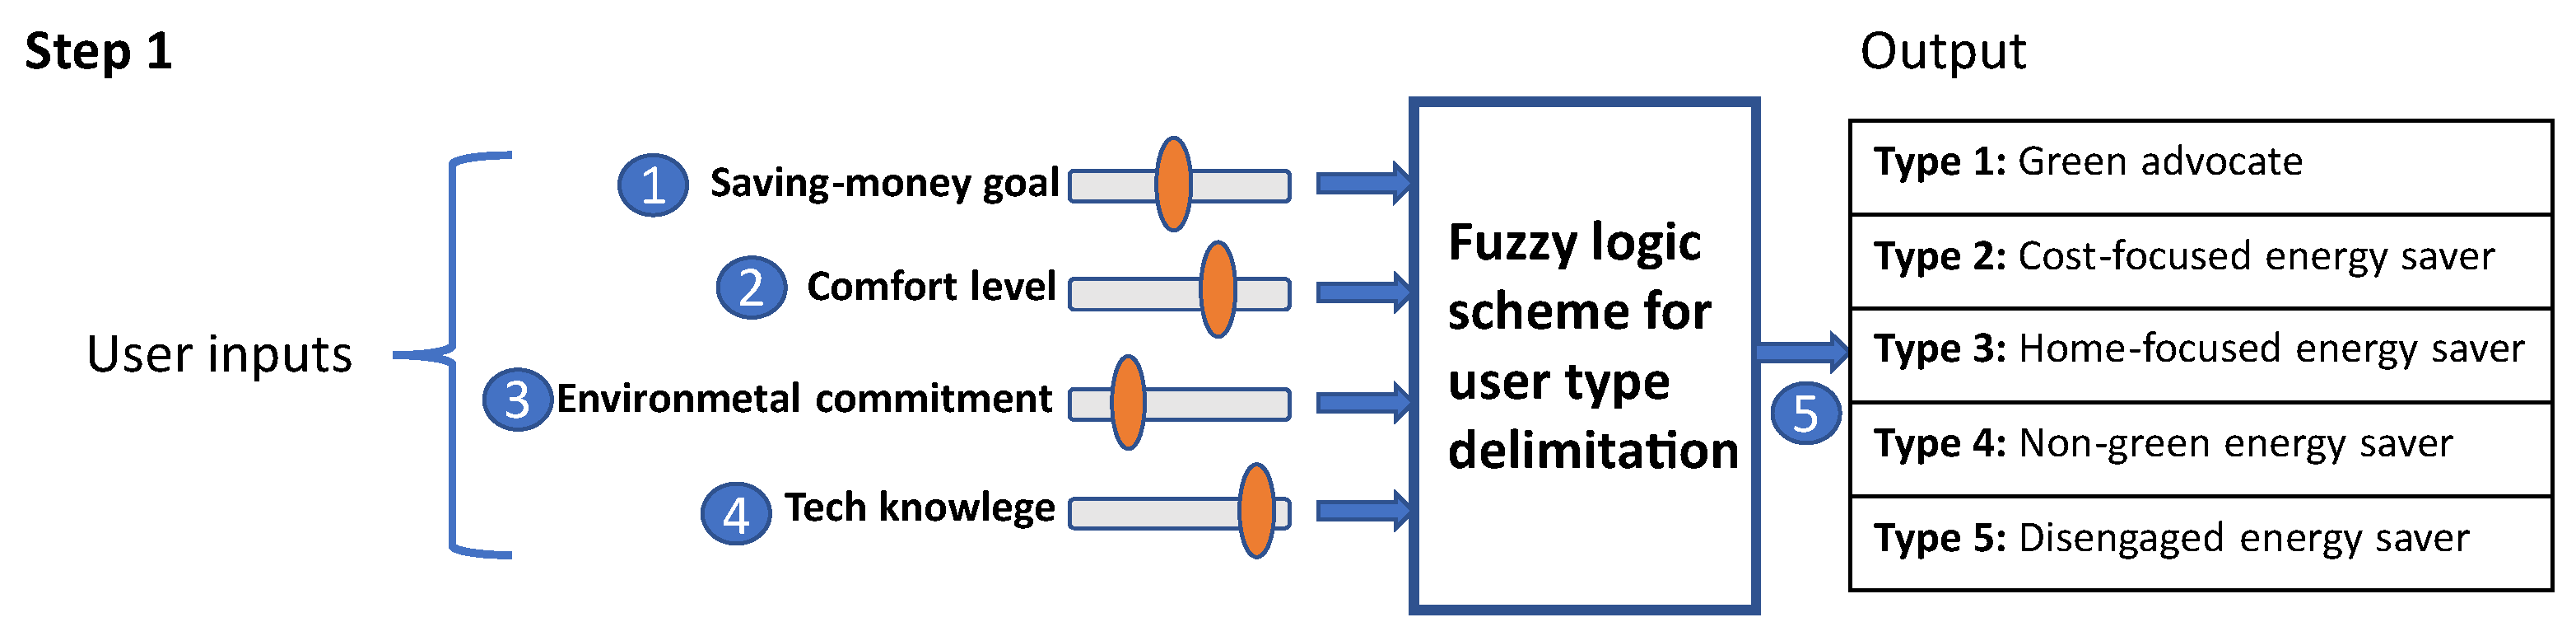
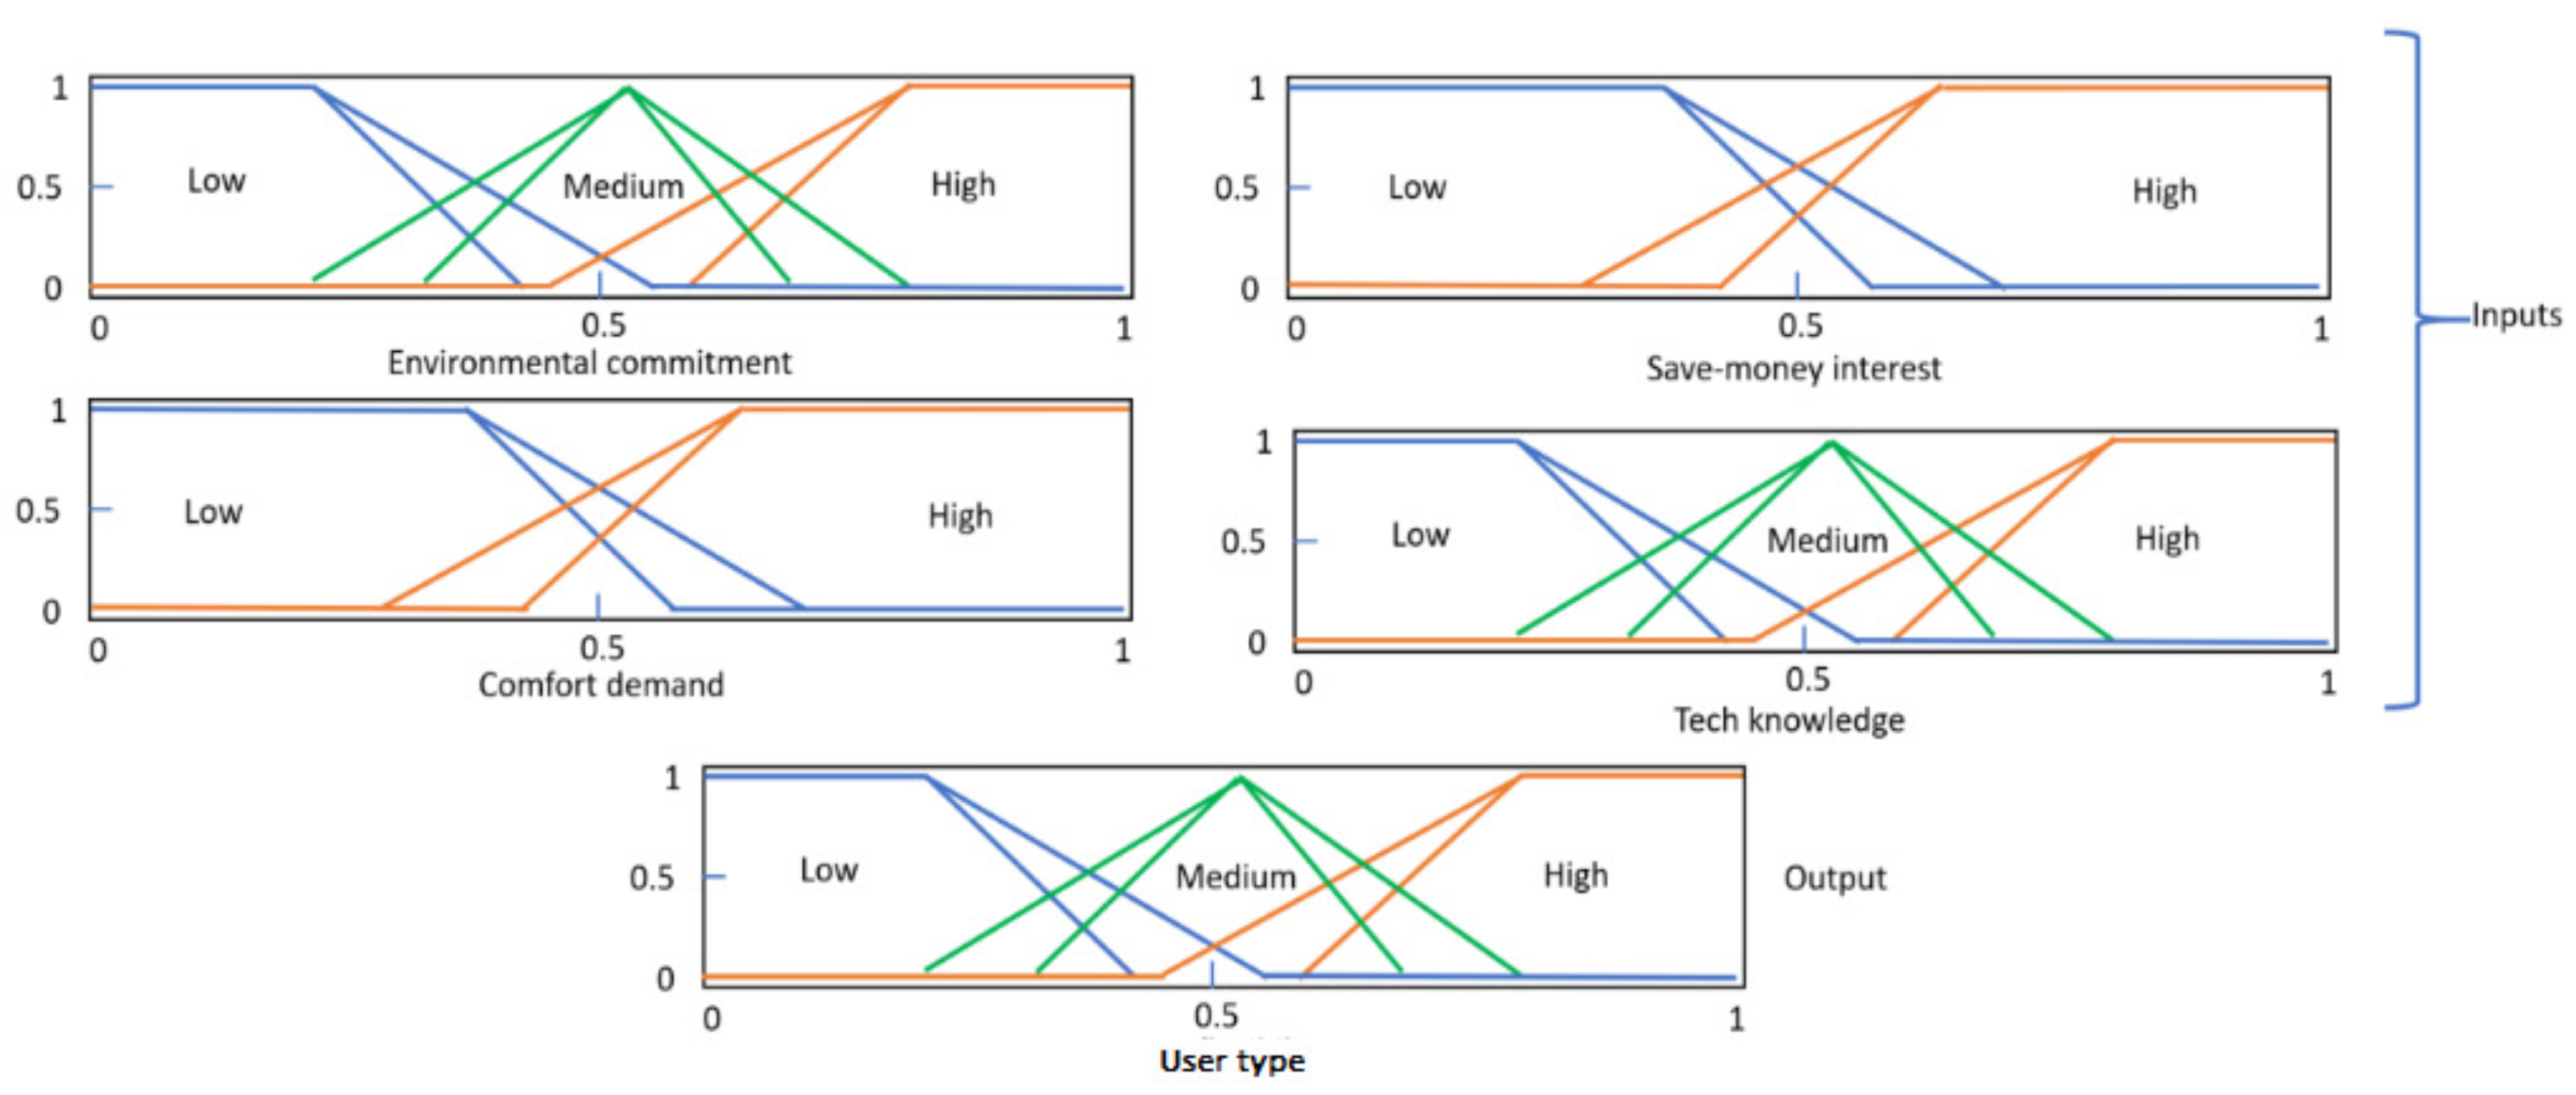
- Step 1: Figure 3 shows the user’s preferences for goals regarding saving money, comfort level, environmental commitment, and technology knowledge. The four goals reach the same destination through different routes: saving energy. Saving-money goal refers not only to saving energy reducing consumption but also to the shift in consumption to cheaper energy rates during the day, consuming the same energy but paying less. Environmental commitment means saving energy and the possibility to choose the technology of the energy source, when feasible. Comfort goal is related to the thermal comfort and the usage of appliances when the user wants to do it without caring about other goals. Finally, the technology knowledge point is related to the level of skills the user has to use their appliances, either user interfaces, smart appliances, schedule devices. It is essential to understand and profile the users better such that flexible loads can be proposed based on their needs and expectations during this step.In [35,67], they segmented the users into five categories: green advocate, traditionalist cost-focused energy saver, home-focused energy saver, non-green selective energy saver, and disengaged energy saver. These categories arise from a trade-off of the possible preferences that users may have when using electrical energy in energy-efficiency programs for utilities in US residential markets. A fuzzy logic scheme is proposed to develop a tool to use users’ predisposition to participate in DR programs and the uncertainty when using their electrical devices. This fuzzy logic scheme emulates how flexible the user may be when consuming energy.Fuzzy logic systems allow representing, manipulating, interpreting, and utilizing data and information that are vague and lack certainty [56]. Within these systems, the Sugeno fuzzy inference method uses singleton output membership functions that are either constant or a linear function of the input variables, which allows covering all the possible input combinations since it uses a weighted average or the weighted sum of a few data points [68]. Each type of user is described in Table 2. Inputs are environmental commitment, tech field knowledge, desired comfort, and saving money interest. Each input of the system is ranked between 0 and 1; therefore, the fuzzification step gives a linguistic value according to the membership functions (see Figure 4). IF–THEN rules determine the output related to the type of user and their willingness to participate in DR programs.The user flexibility is related to the willingness of the user to participate in DR programs to change consumption patterns depending on the equipment and infrastructure to monitor and control the appliances. Then, more flexibility and less total energy consumed are expected, changing consumption patterns depending on the equipment and infrastructure to monitor and control the appliances; the less flexible total energy consumption does not have noteworthy changes. The uncertainty in the user behavior leads to stochastic use of appliances, and EMS tries to minimize this uncertainty when autonomously managing appliance scheduling or suggesting the user turn on/off when necessary. The fuzzy logic type II scheme uses linguistic inputs and rules to assess the inherent uncertainty when using automatic, controllable devices. Upper and lower membership functions used in the fuzzy logic type II can represent more suitable the inputs and the output of the human behavior [69,70].
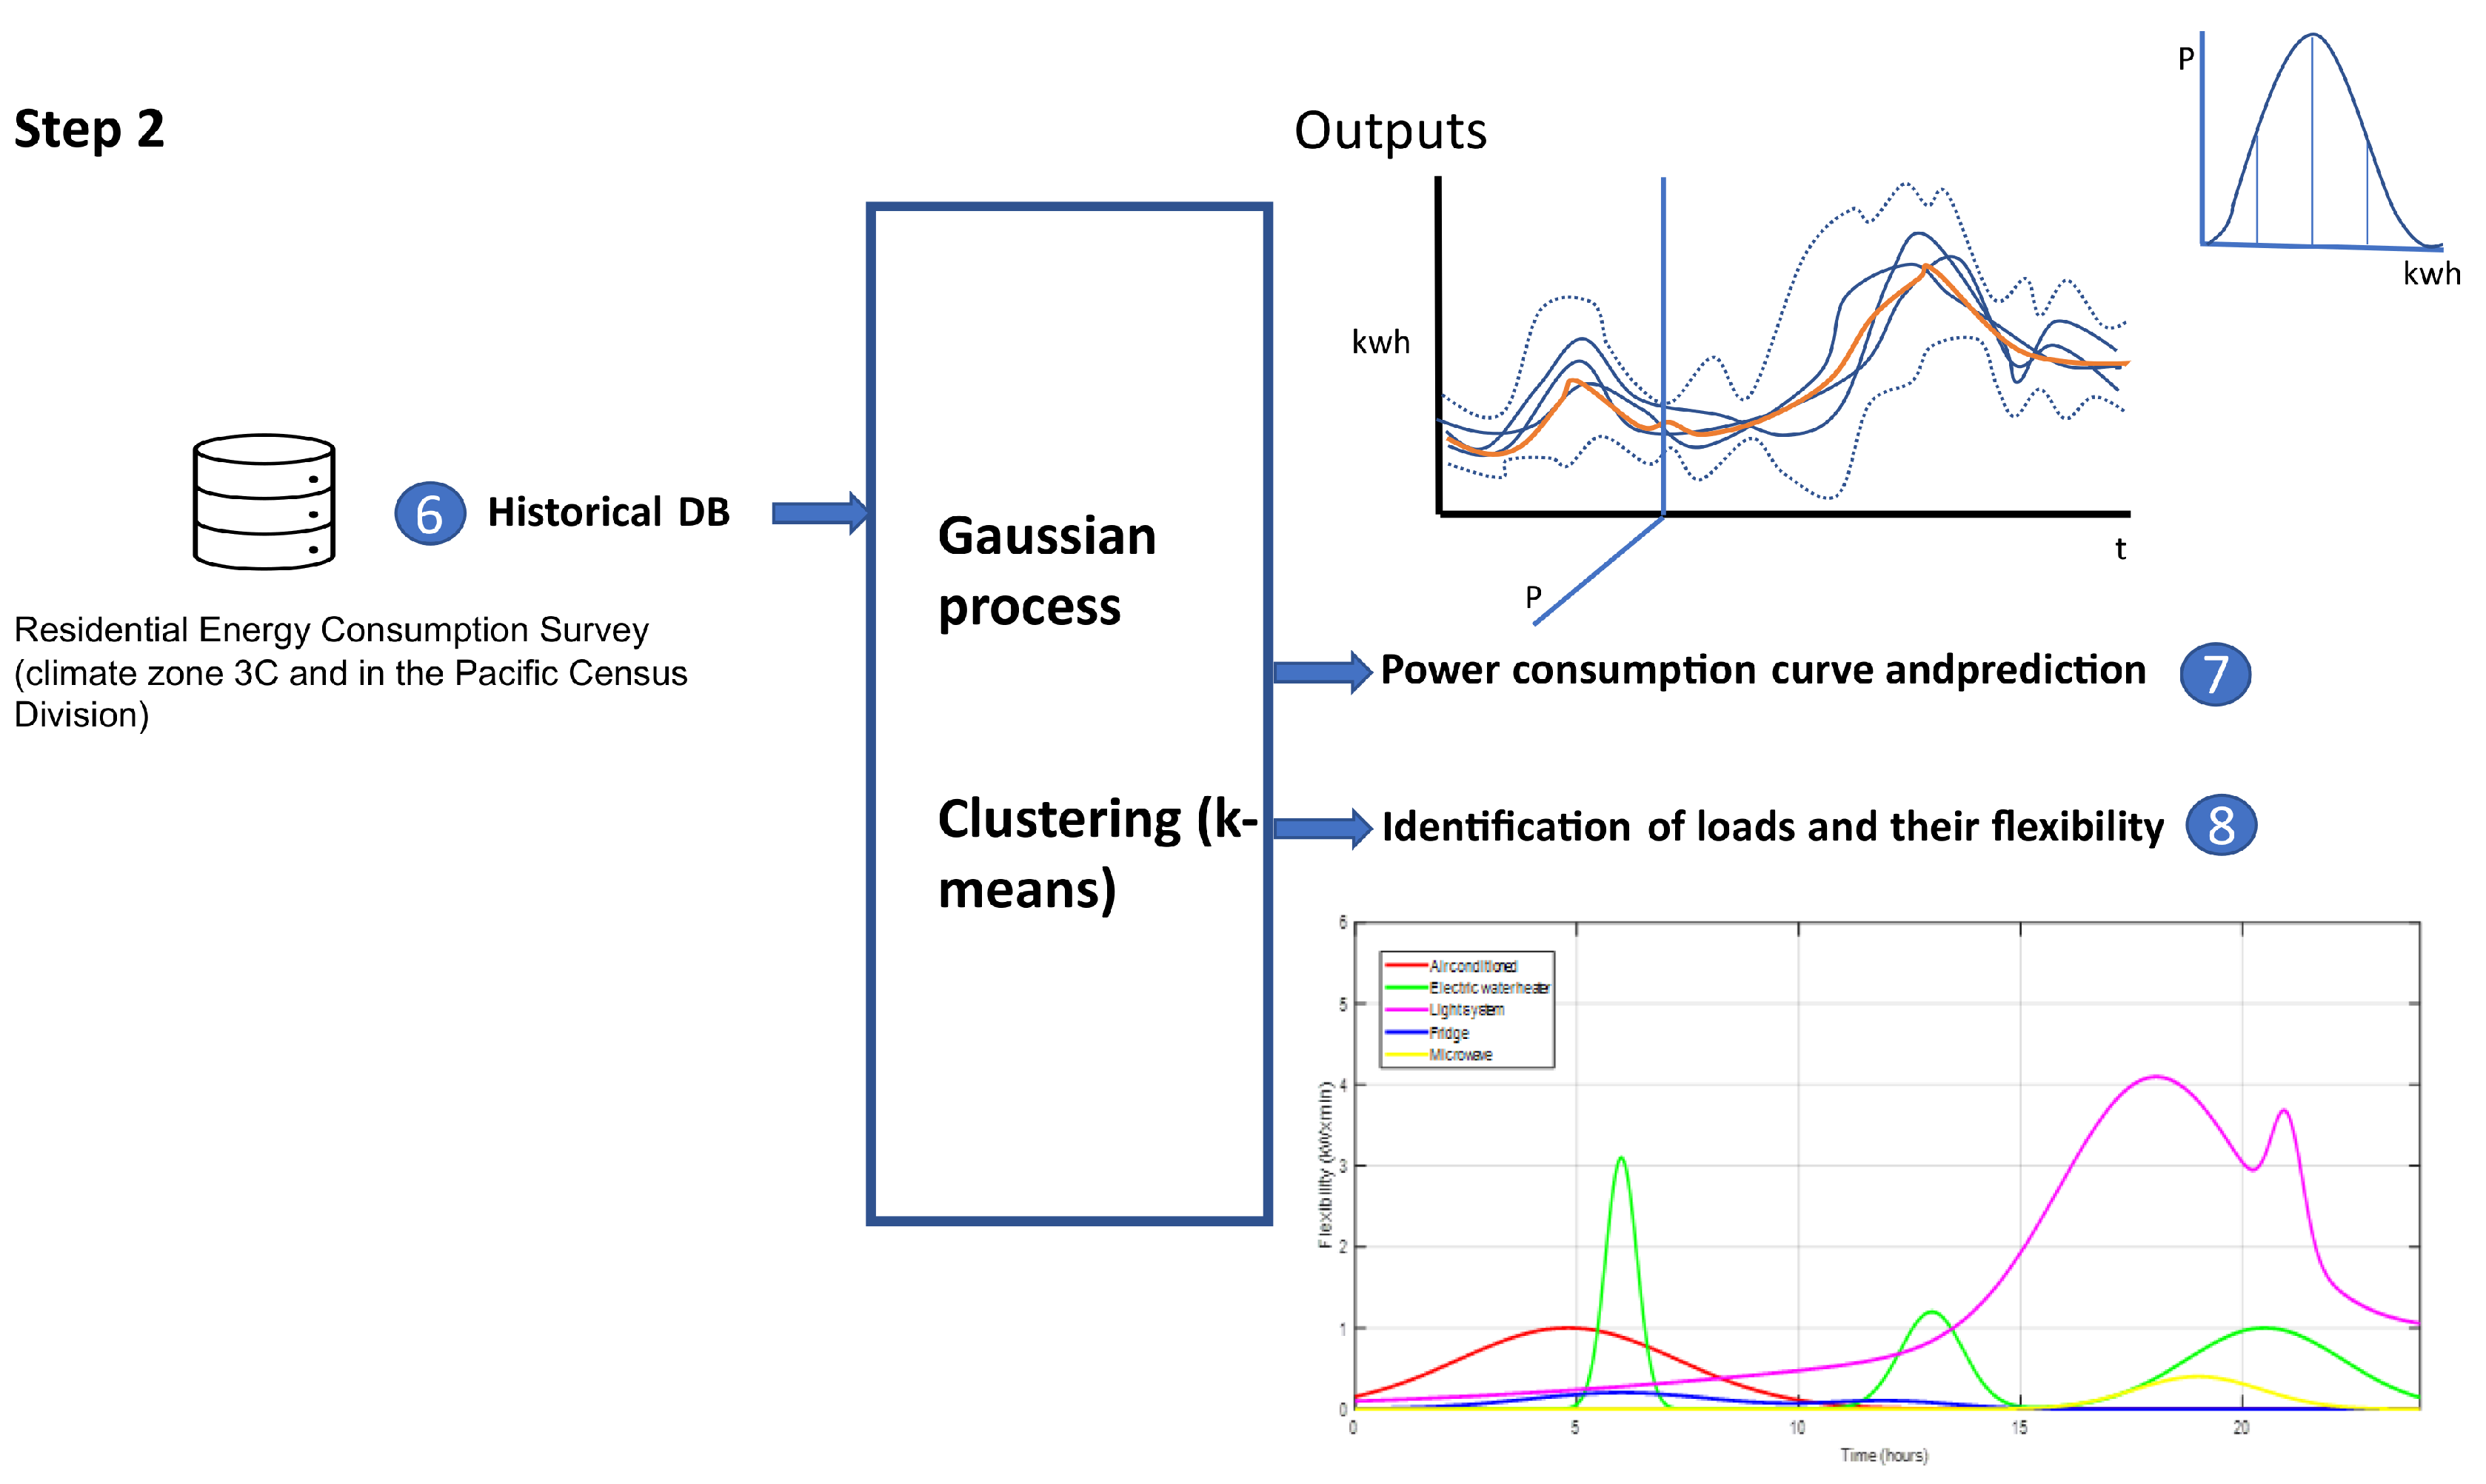
- Step 2. The consumption load profile of households. This is identified with the available historical databases of electrical consumption patterns, identifying the load scheme of the household and defining the average time of use and the expected initial and final times of use of each electrical device (see Figure 5). For this, machine learning techniques are used to discover the consumption curve and identify the loads.First, fit a Gaussian process (GP) regression model training the data to predict the energy consumption and quantify the uncertainty in the model. A Gaussian process is a probability distribution over random functions or infinite collection of variables (functions) such that any subset of finite random variables has a multivariate Gaussian distribution [71]. The Gaussian process provided a predictive posterior distribution of the output with full information of the prediction, including its confidence level and predicted mean [72]. Then, GP allows correlating the energy consumption as the dependent variable (output) with other known, measured independent parameters (inputs), as the time of the day and weather.Let the consumption data function be a vector X in ℜ, as the domain h has m elements, the has the probability density for each h function and makes a correspondence between the function and its vector , , then:where and are the covariances and means of the variables in the process, or the hyperparameters to be determined in a gradient-based process (non-convex optimization problem).For the Kernel function, squared exponential was used:where and has high covariance when x and are closed in input space and low covariance when they are separated in the input space.For this experiment, consumption patterns were obtained from California Energy Consumption databases [73] and the characterization of the power consumption and the uncertainty of user behavior follows Gaussian distribution [74], obtained from consumption patterns in a lapse time of a household, or consumption patterns of different households with certain similarities if the community consumption is desired. In this way, an energy consumption curve is calculated in order to predict consumption under certain conditions.
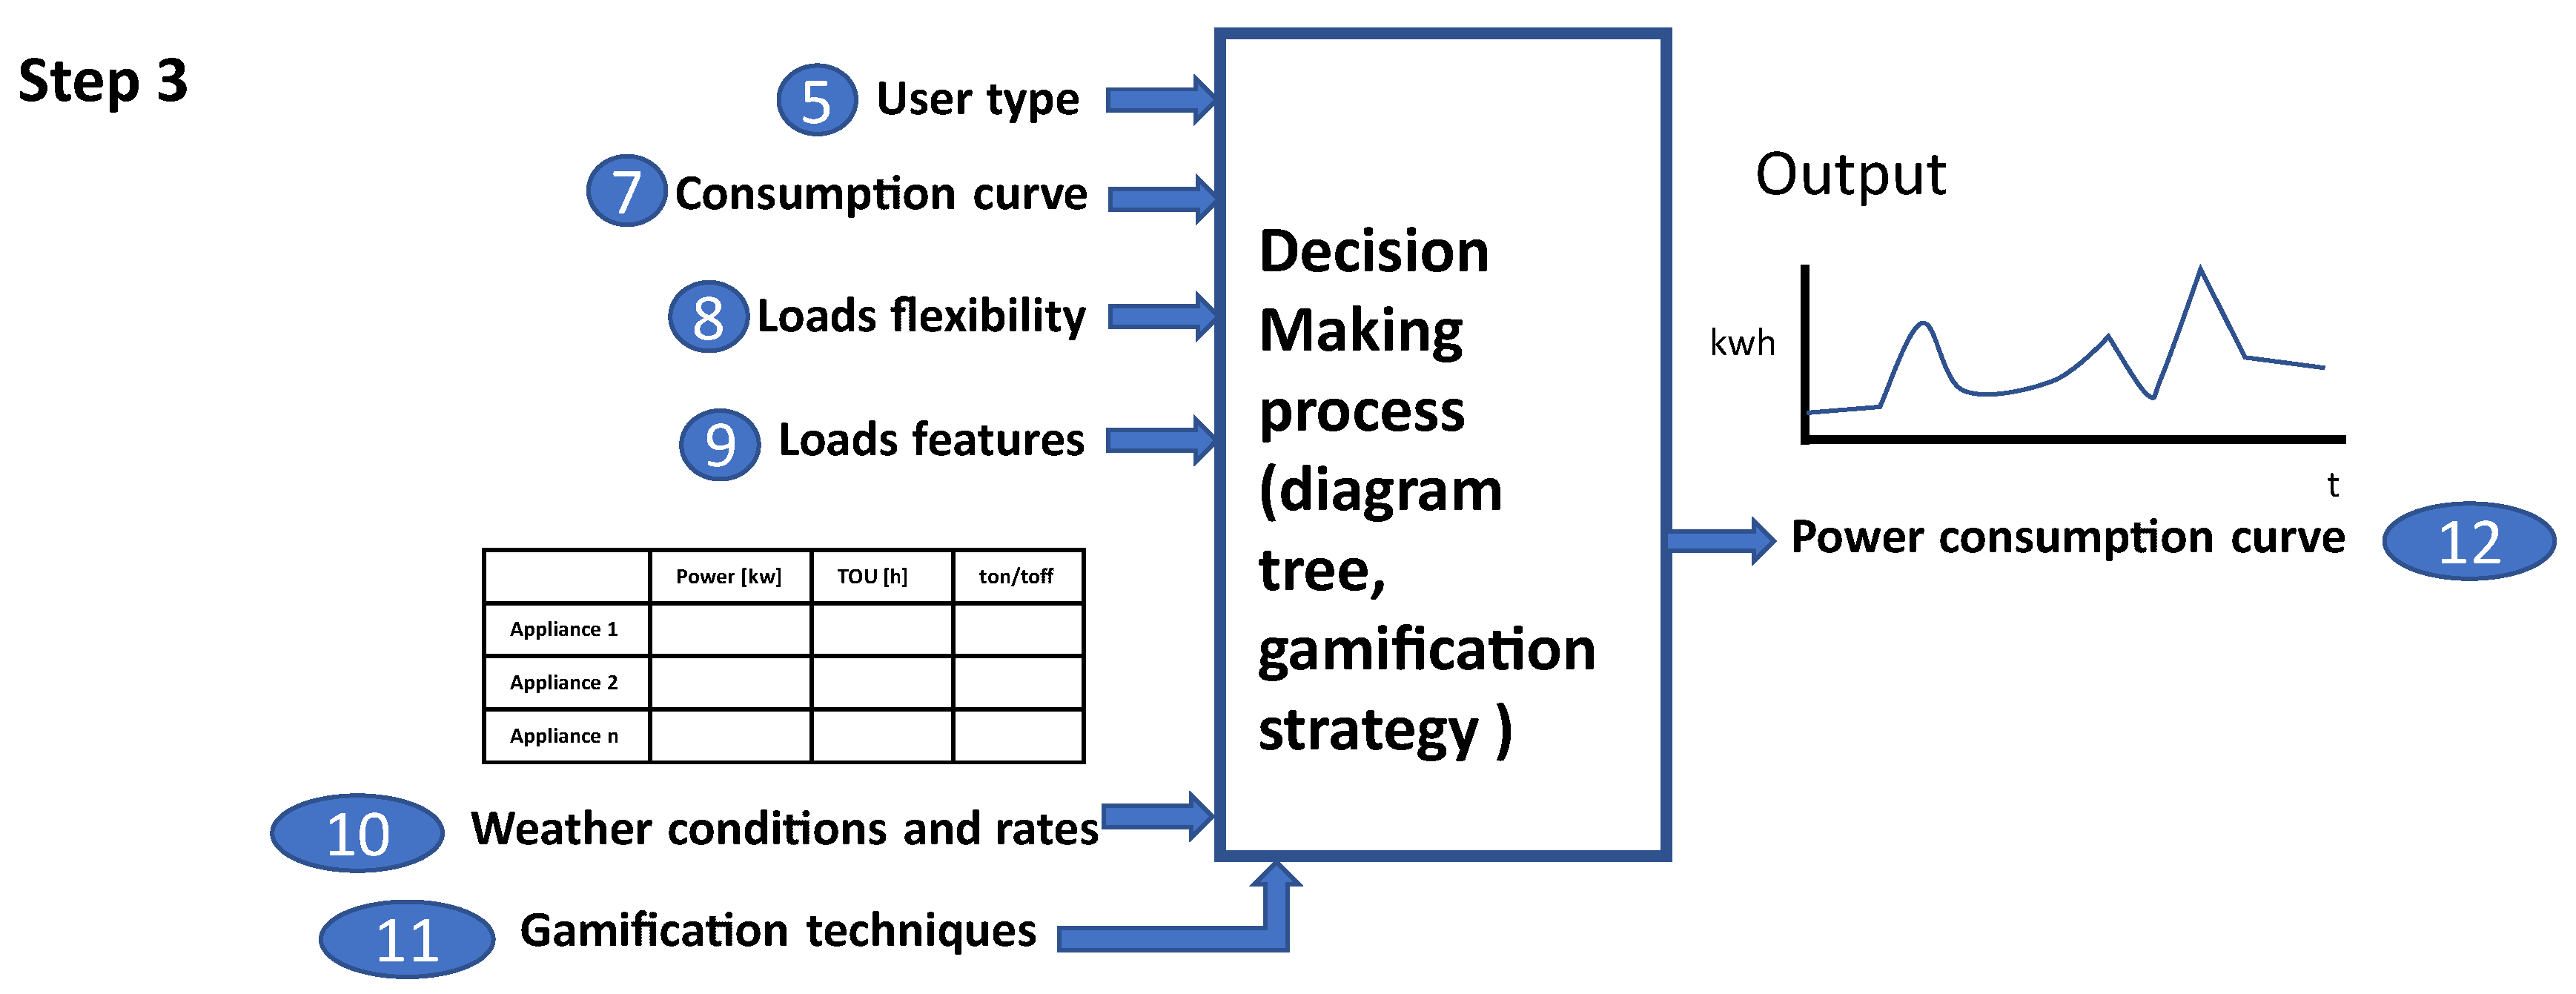
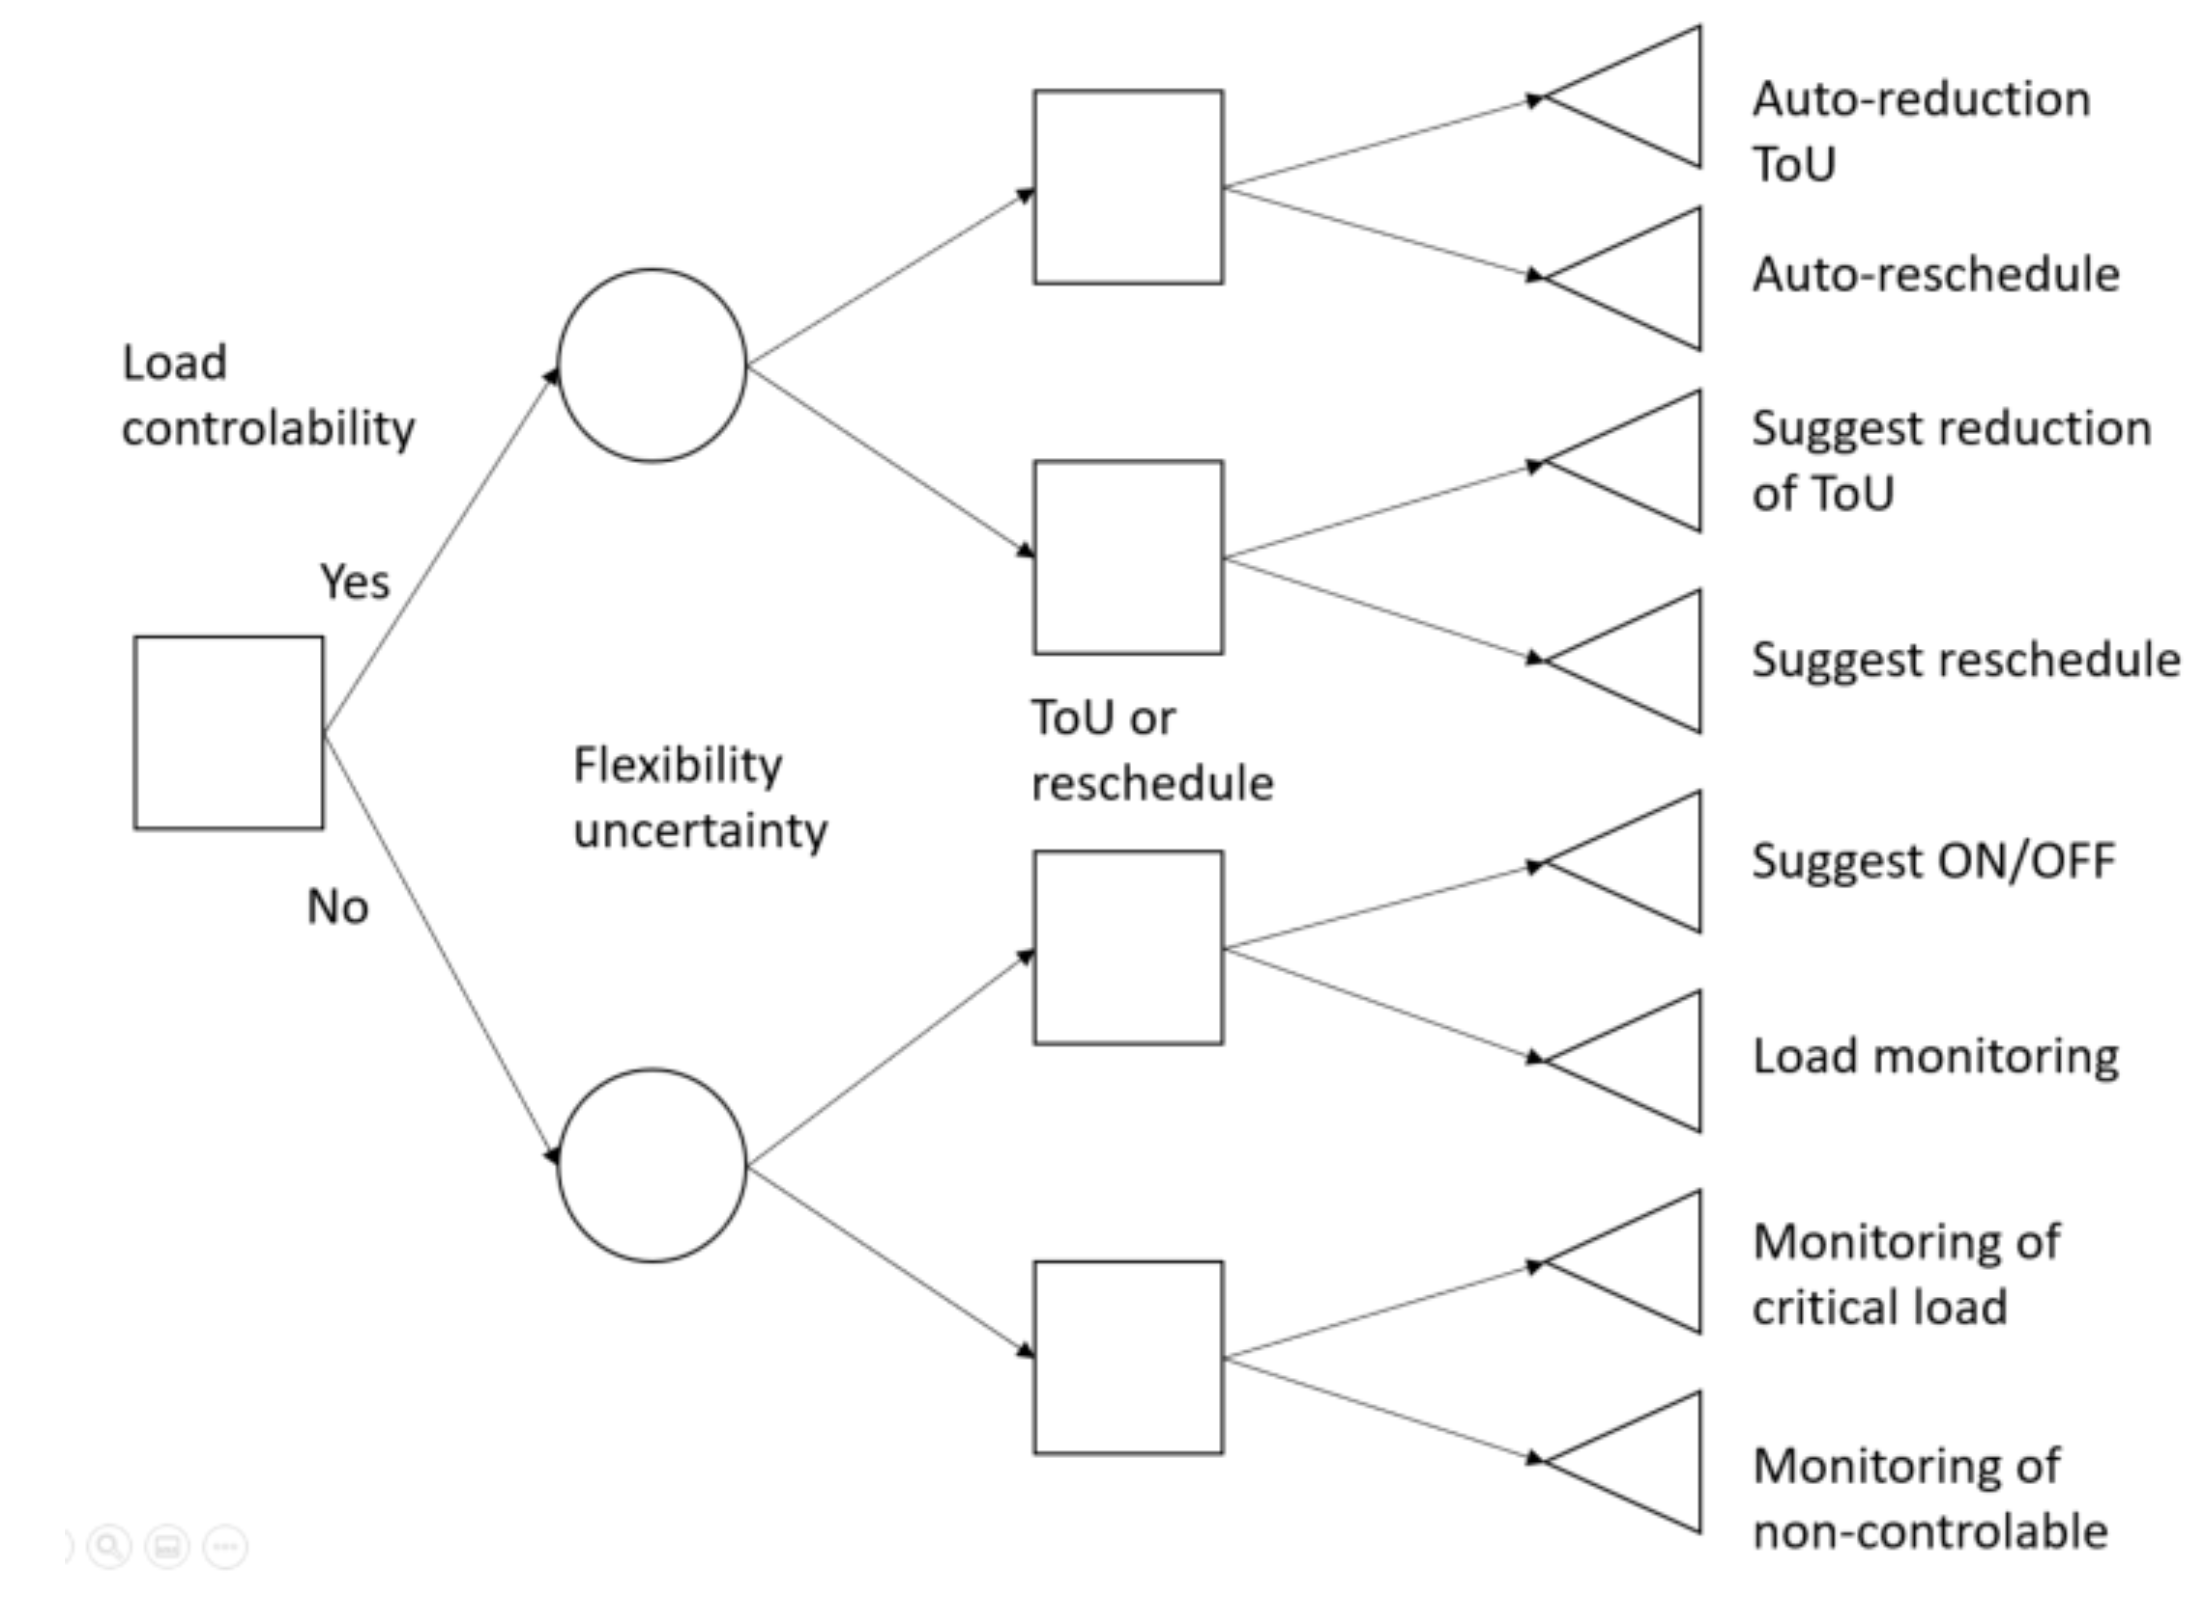
- Step 3. Decision-making process. Statistical analysis is made using Gaussian distributions based on consumption databases to calculate the expected consumption (see Figure 6). Considering the defined characteristics of the loads and the house’s consumption curve, the load flexibility identification is analyzed and determined. Loads are classified into flexible and non-flexible according to consumption patterns and load features, as described in [74,75].The tree diagram, shown in Figure 7, shows the decision-making process of the EMS related to the electrical devices, taking into account the load features and user’s preferences and goals [76]. Then, the automation and control actions will be decided for smart, controllable appliances and devices, and a proposed gamification strategy for those conventional, non-controllable loads is proposed, along with an interface to control them and to monitor the energy consumption, the state of the grid, and electricity rates.
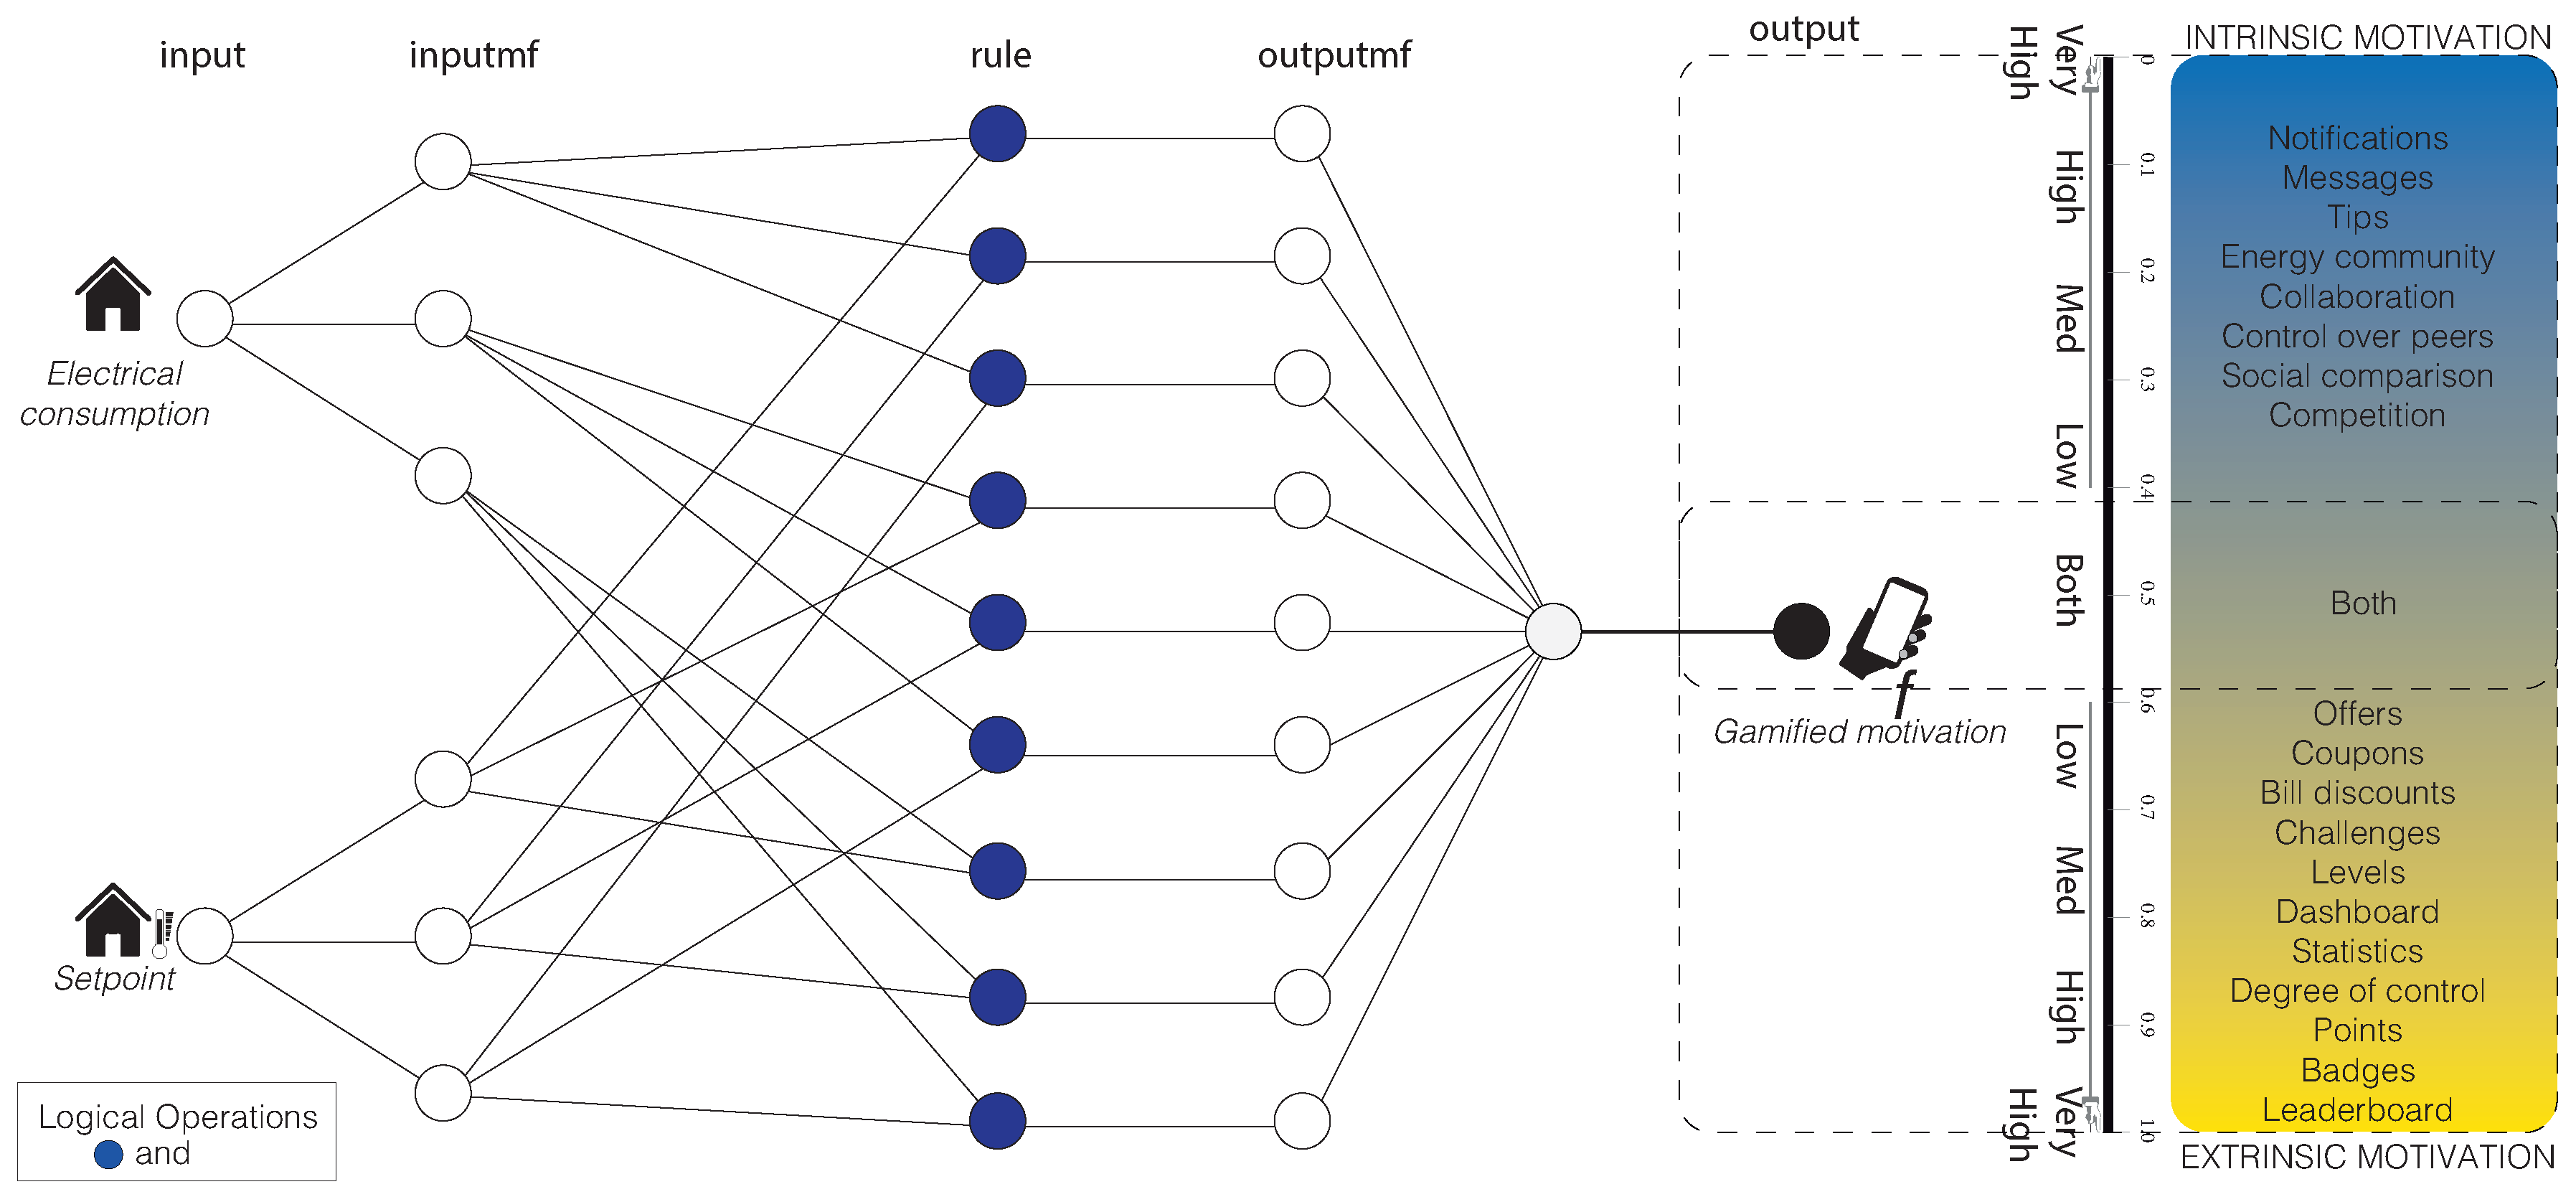
- Step 4. Automated, control actions and gamification strategy. Appliances actions are determined for the EMS for both controllable and non-controllable devices, and the suggested actions for each type of user-determined for the gamification strategy.Figure 8 depicts the ANFIS model structure. The input values are the end-user’s electrical consumption and, depending on the season, the heater’s setpoint or the AC. The output value is the gamified motivation described in Table 1.Once the decision-making process is taken for each electrical device based on the EMS decision tree (Figure 7) and the gamification strategy (Figure 8), a probability function stands for the use of the electrical device, changing the consumption pattern based on the DR program, and controlling the load scheme proposed.The controllability of an appliance is based on the load features and user behavior. The appliance controllability is determined by turn-on control and turn-off control . stands for an appliance’s time is a schedule, either to advance or retard in time.For example, an HVAC system and exterior lighting system can be automatically controlled by the EMS, water heater, and water pump are sensor devices activated by their use. The washer machine and clothes dryer can be used when suggested to the user because the electrical energy is cheap or when PV panels are supplying enough energy.
3.3. Experiment Development
For the experiment, the Residential Energy Consumption Survey (RECS) database was selected. RECS is a periodic survey conducted by the US Energy Information Administration and provides detailed information regarding homes’ energy usage. The recent version of the database was released in May 2017 and reflects the 2015 RECS household characteristics [73]. For the weather conditions in Concord, California, the data were selected for the meteorological database which derived weather data hourly from 2004 to 2018 [77]. Using software like EnergyPlus through interfaces such as Ladybug through Grasshopper [78], it is feasible to look up for different periods of the year. Grasshopper is a visual programming tool that allows designing a 3D model of the home and includes the construction materials, occupants, schedules and loads. The model was uploaded with the TMYx data file (EPW) and the occupants’ characteristics to have multiple scenarios.
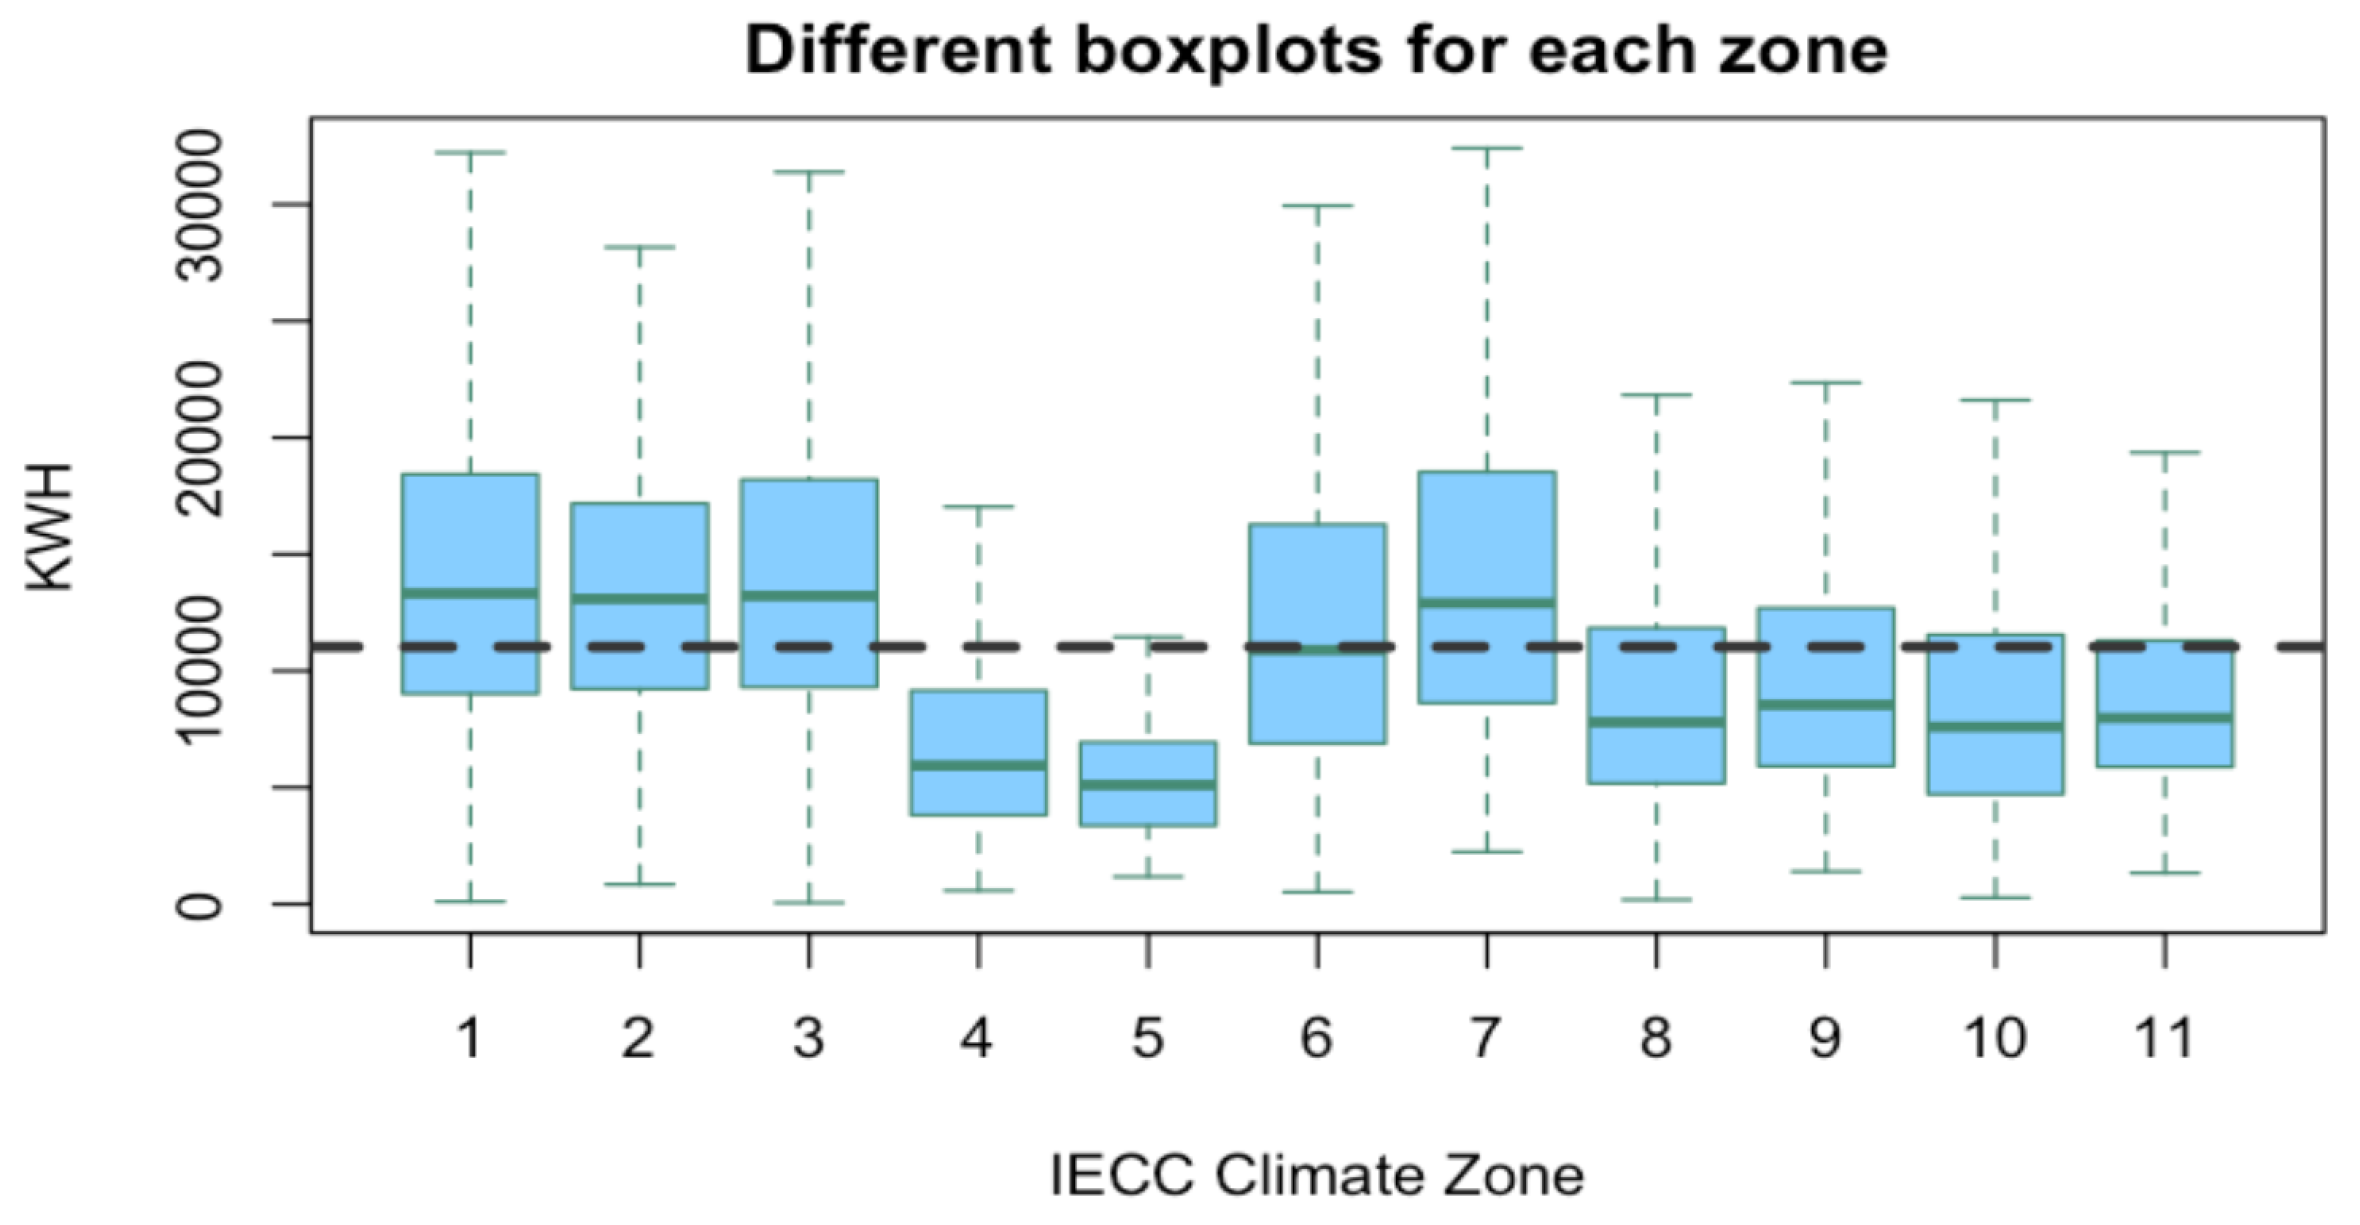
RECS database. The IECC Climate Code [73] classified the country into eleven zones (see Figure 9). The mean kWh in the US in 2015 was 11,028.93 kWh, with a standard deviation of 7049.728 kWh. Figure 9 depicts the box-plots for each IECC climate zone and their site electricity usage in kWh. The present work focused on the IECC climate zone 3C and in the Pacific Census Division. This zone, 3C, has a mean of 5684.16 kWh with a standard deviation of 3170.798 kWh. Figure 9 displays different box-plots for each zone and their total site electricity usage in kWh; the gray dashed line represents the average annual electricity consumption US residential utility customer.
Zone 3C is below the national average; hence, this paper aims to propose a strategy that promotes more household reduction if possible. Based on the data analysis, Table 3 shows the classification for the types of home in the United States and the IECC CLIMATE PUB = “3C” as follows:
4. Results
This section presents the results from the proposed methodology, describes each step’s results, and presents the tailored gamified interfaces based on the type of energy user based on their preferences regarding saving money, comfort level, environmental commitment, and technology knowledge. Thus, three cases are presented: a user who has a green attitude, a user who does not care about saving energy, and a user who wants to make home improvements while saving energy.
4.1. Step 1
Figure 3 shows the user’s preferences goals regarding saving money, comfort level, environmental commitment, and technology knowledge. It is essential to understand and profile the users better such that flexible loads can be proposed based on their needs and expectations during this step.
Using EMS framework simulation, it is possible to study the consumption patterns of an average household considering family characteristics such as the number of people and level of activity using their appliances. The level of comfort can be determined by factors like environmental conditions, house infrastructure, users’ willingness to modify consumption patterns to save money and energy, and environmental commitment.
For the purpose of this paper, three types of user were selected based on their energy awareness and motivation to modify their energy consumption by changing the time of use of the household appliances:
- Case 1. Home-focused energy saver—they are concerned about saving energy and interested in home-improvement efforts.
- Case 2. Green advocate—show the most positive overall energy-saving behavior, have the most robust positive environmental sense, and high interest in new technologies.
- Case 3. Disengaged energy saver—less motivated to save energy through energy savings. They are not concerned about the environment nor new technologies.
4.2. Step 2
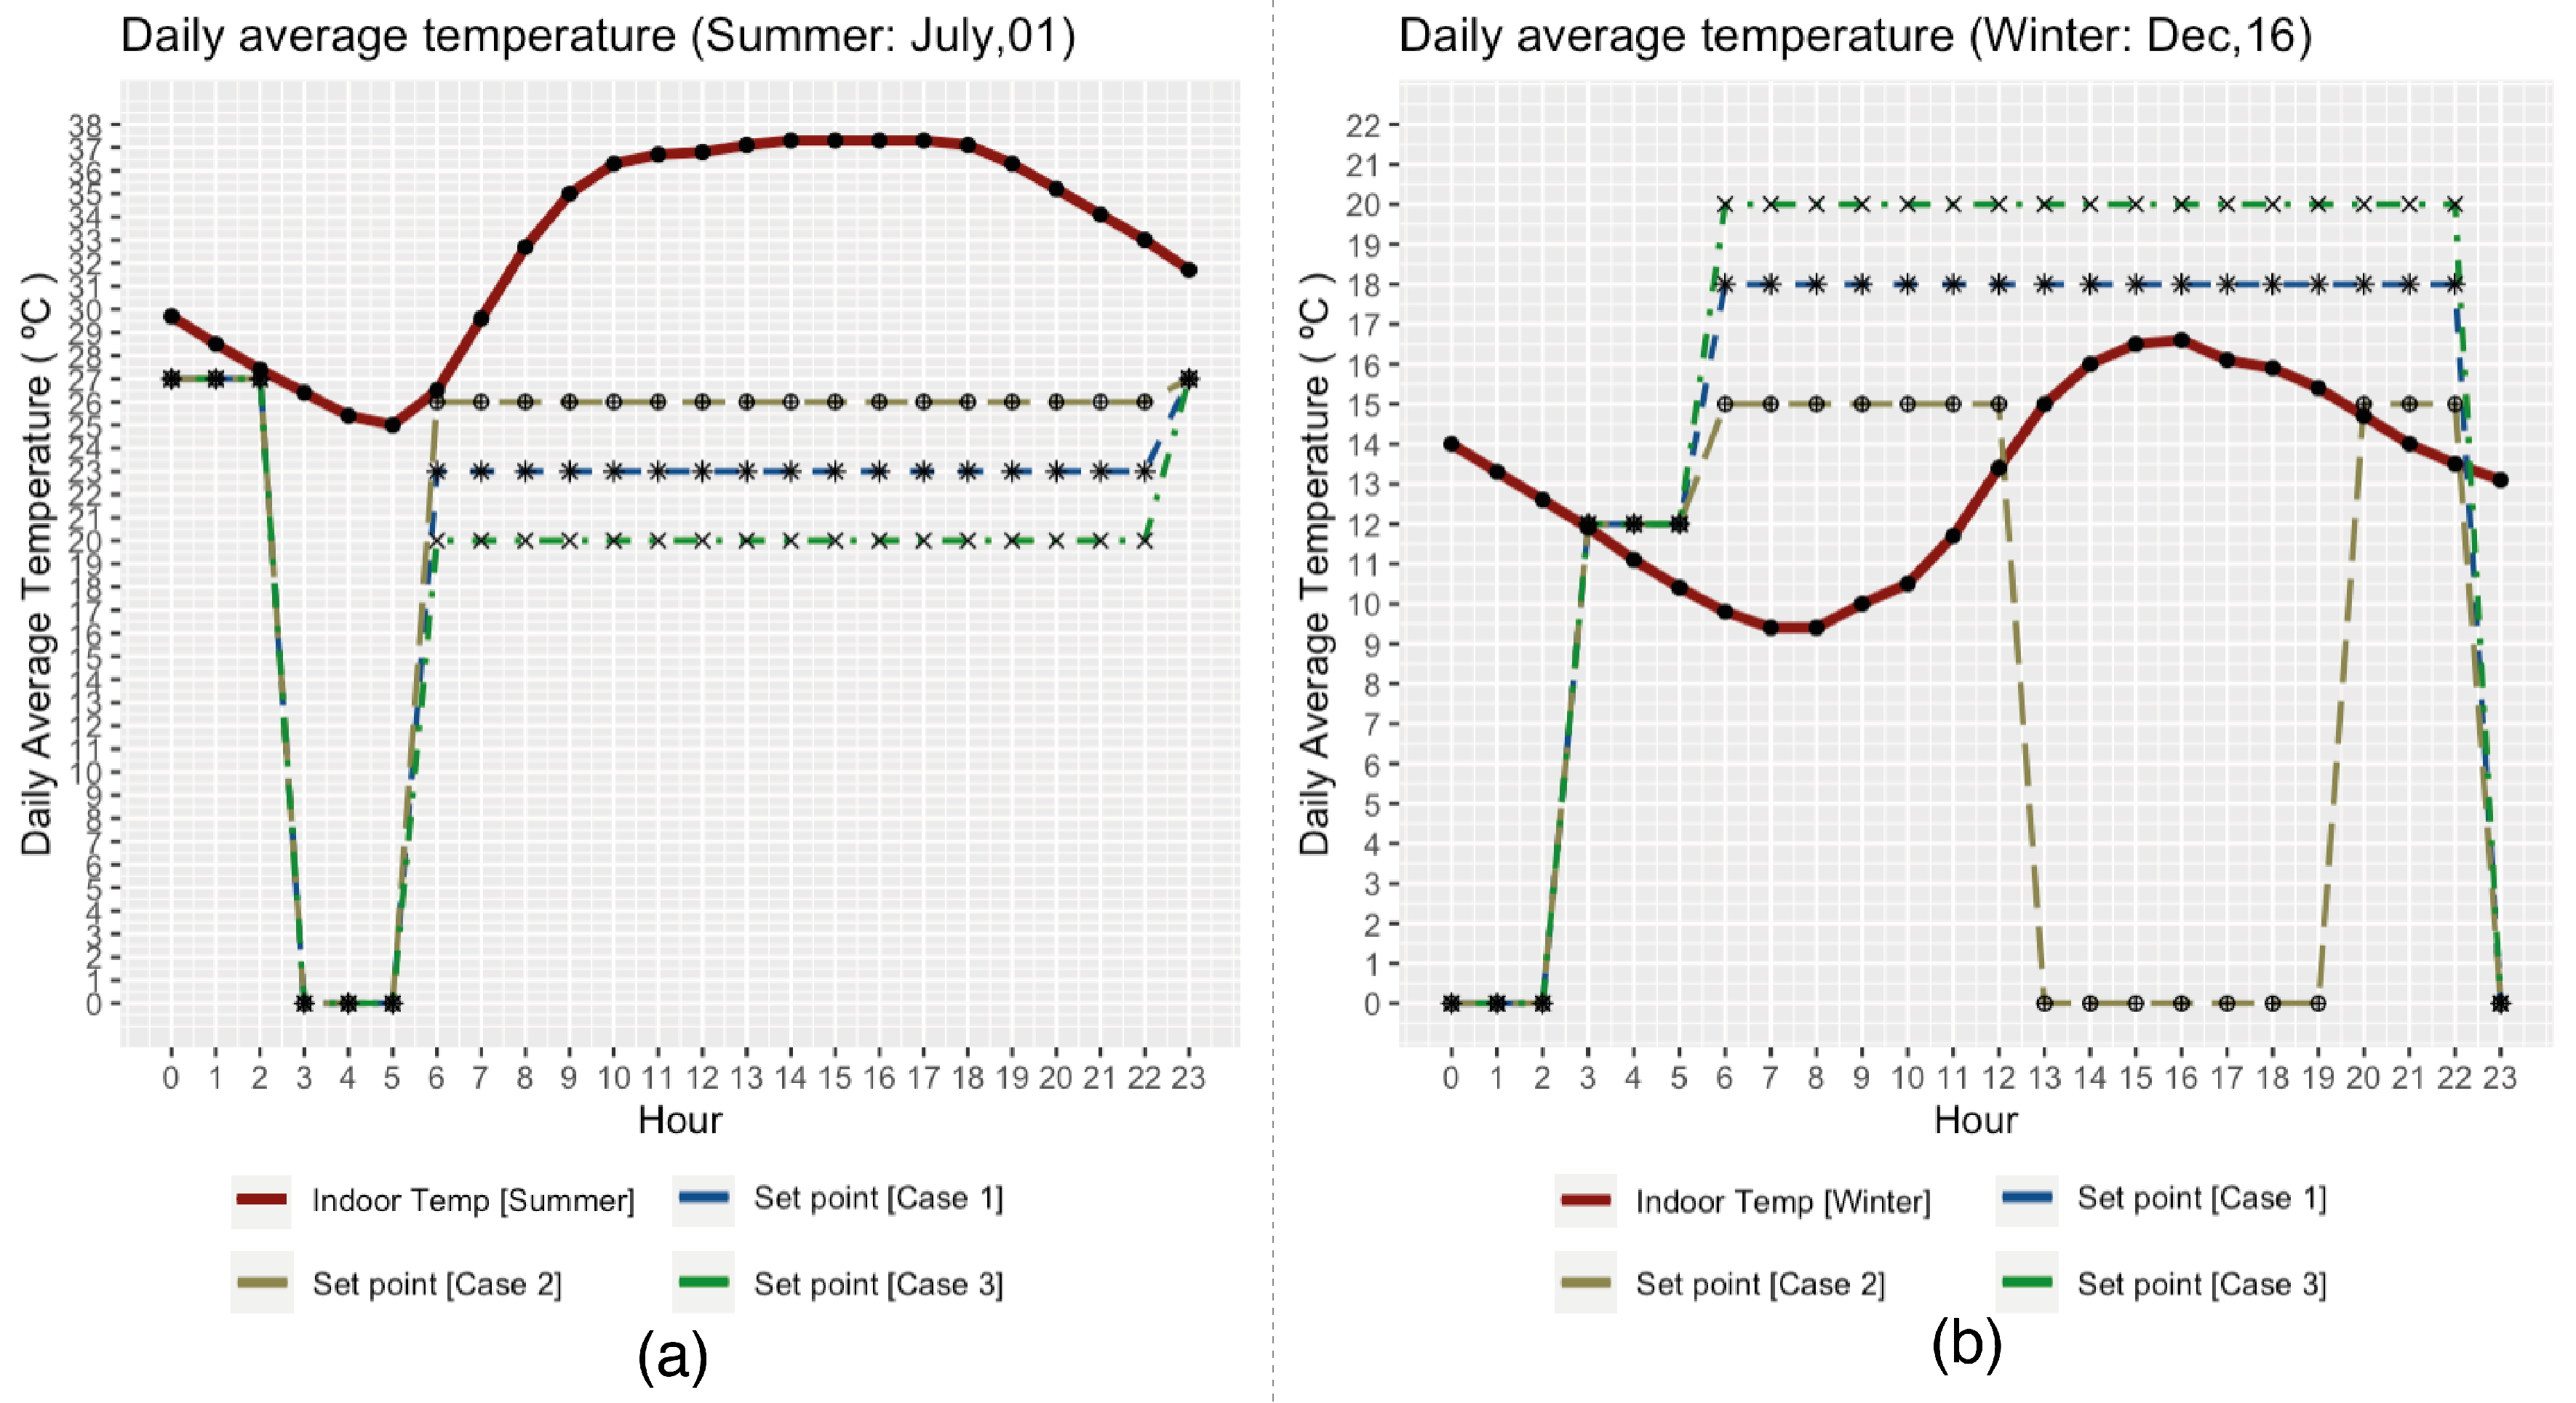
July 1st for the summer period and December 16th for the winter period were selected for this analysis. The outdoor temperature was obtained from the Statistic Report of the annual weather file (stat file) [79].
A typical year for this place involves use of the cooling system from April through October, and from November to March, use of the heating system. Table 4 describes the selected scenarios that emulated the energy consumption with different thermal conditions in different seasonal times.
Figure 10a depicts the summer period considering the indoor temperature and the setpoint for each case; the same in Figure 10b for winter season. Case 3 is consistent for an energy waster user as they prefer lower temperatures during summer and higher temperatures during winter. Case 1 is for a home-focused selective energy saver, which compared with case 2 and case 3, is between the home-focused selective energy saver and the disengaged energy saver. This graph shows that the home-focused energy saver (case 2) is oriented in saving energy while improving their home. During winter periods, this user can be motivated to change their consumption patterns by reducing the thermostat setpoint at least 1 °C and therefore saving energy without affecting the thermal comfort at home. For the disengaged energy saver user, as they are not interested in saving energy, the efforts need to be oriented to saving money strategies and into a rewarding system. The indoor temperatures during summer require air conditioners; however, the strategy needs to be oriented more in increasing the setpoint at least 1 °C. The UTCI scale demonstrates that the user could be without thermal stress from 9 to 26 °C [61]; at lower temperatures it is assumed that the user is wearing warmer clothes; at higher temperatures that they are using less or not heavy clothes. In addition, by increasing the setpoint by 1 °C during summer periods, at least 6% of the electrical bill could be saved [80].
Table 5 depicts the average daily electrical consumption profile for all the household appliances in the home in the summer and winter period. Therefore, considering the summer period and the kWh of the weekday times 365 days, the results for a year in each case is
- Case 1: 24.33 kWh/day × 365 days = 8881 kWh
- Case 2: 22.93 kWh/day × 365 days = 8370 kWh
- Case 3: 25.43 kWh/day × 365 days = 9282 kWh
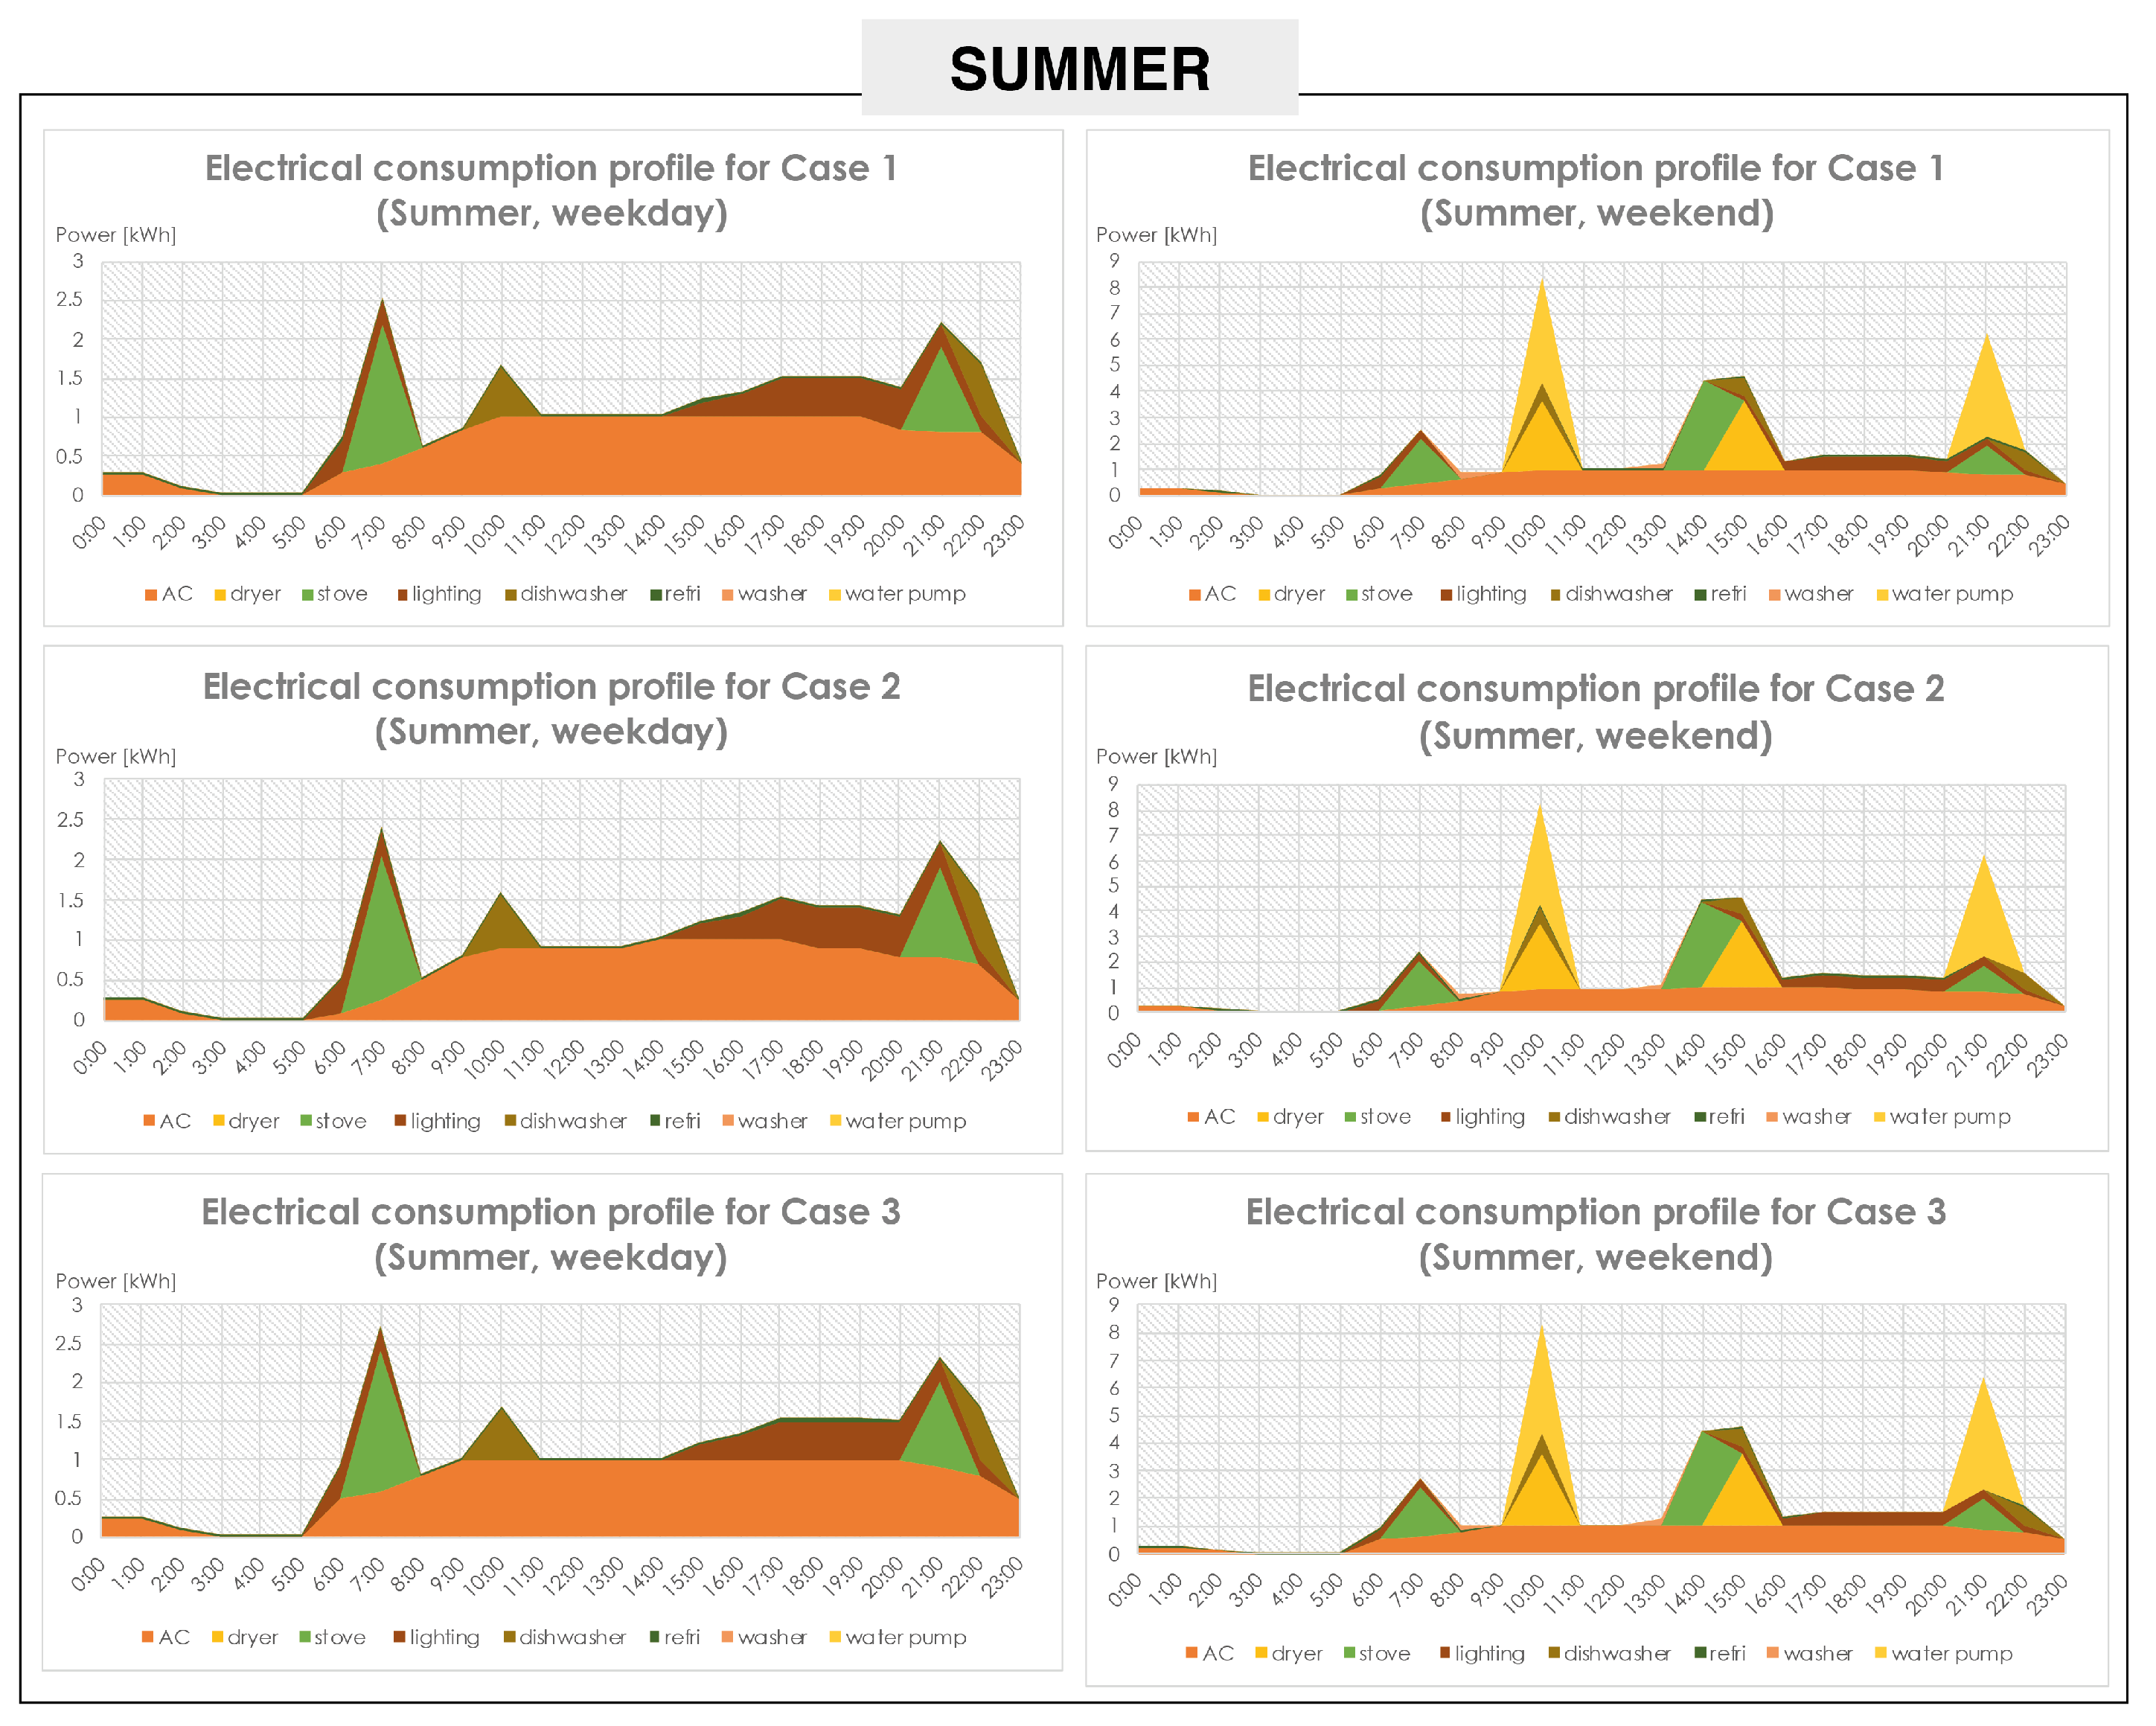
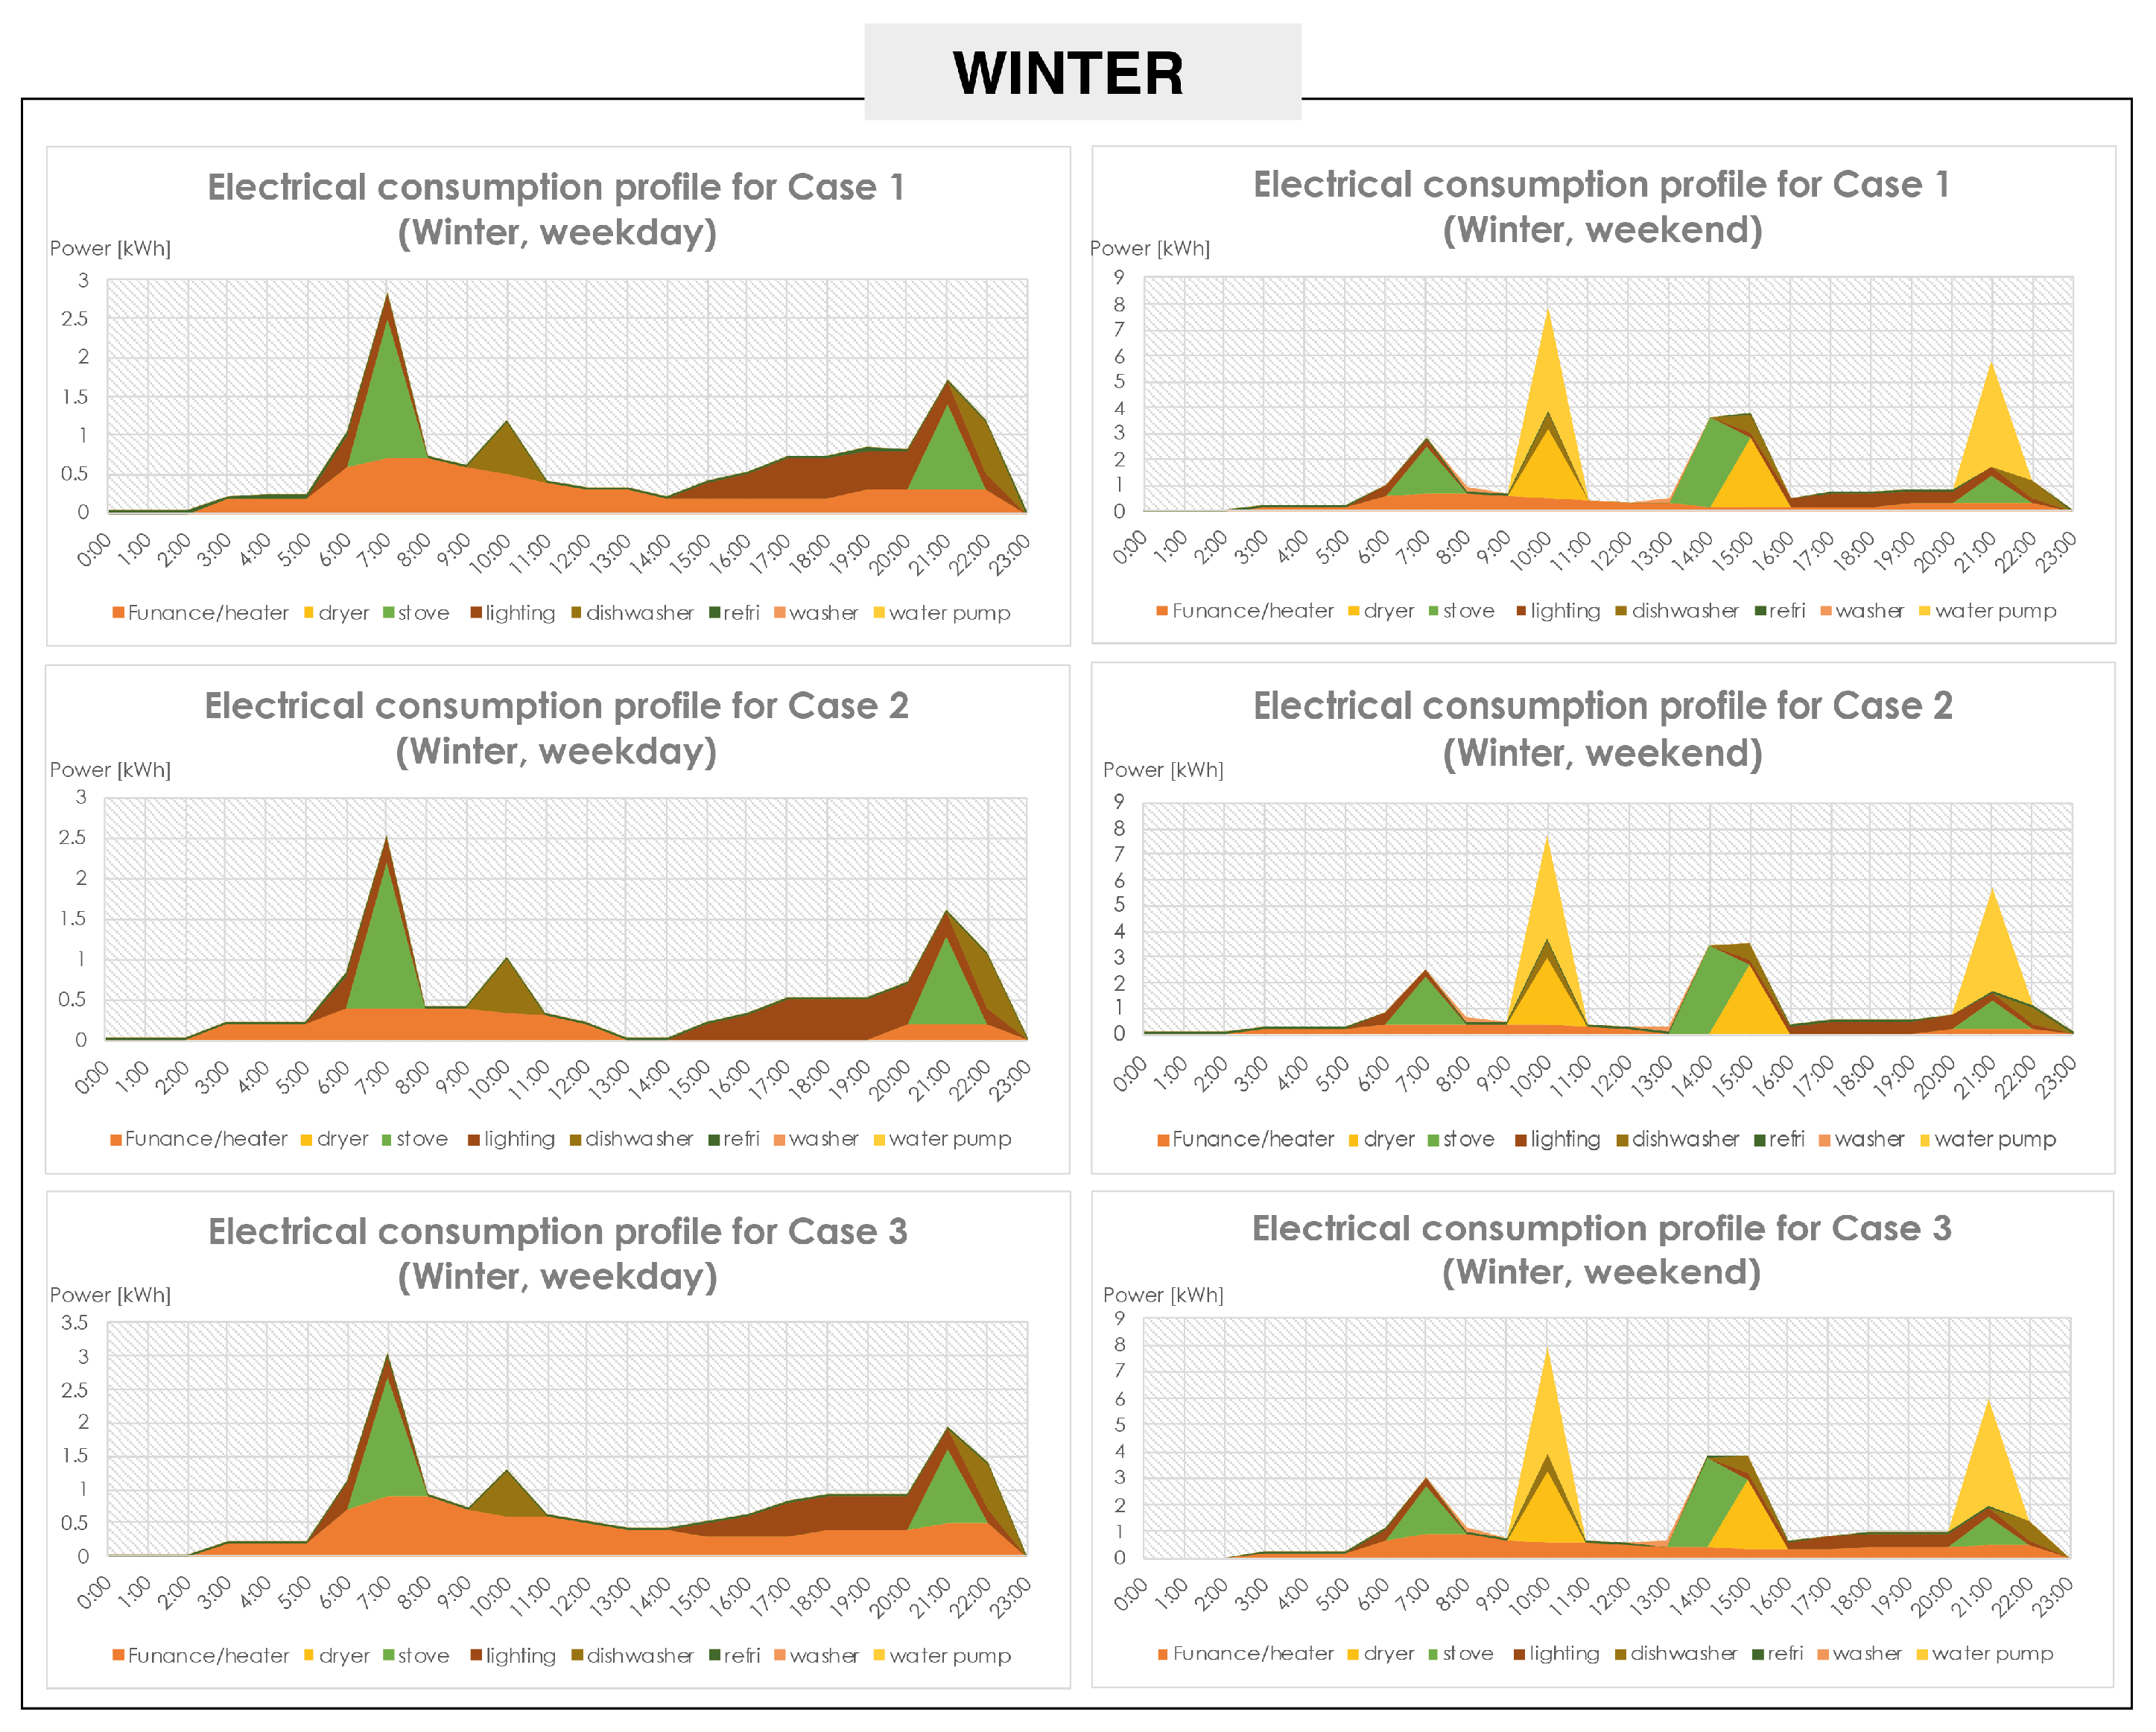
This was calculated this way due to more kWh being consumed in the summer period than in the winter period. The weekday was selected as the weekends have atypical consumption, and not every weekend the end-user is spending that electrical energy. Energy consumption does have not appreciable changes during weekdays since users share common zones such as living room and kitchen, but the increase in domestic tasks, such as laundry, on weekends and the usage of appliances such as the refrigerator increase a little bit. The lighting system is for a big house without EMS supervision or sensor care. Figure 11 and Figure 12 show the consumption patterns during weekdays and the weekend in summer and winter periods, respectively, with the load scheme due to AC or heater, lighting system, stove, dishwasher, refrigerator, washer machine, dryer, and water pump.
4.3. Steps 3 and 4
The household’s load scheme obtained from the database has the following appliances: air conditioner (AC), furnace/heater, dryer, stove, lighting system, dishwasher, refrigerator, clothes washer, and water pump. The study focuses on thermal comfort and energy savings, and the HVAC system is the most flexible and suitable to modify user consumption behavior. According to the decision tree diagram in Figure 7, the AC system in summer and the electric furnace or heater in winter have the most flexible range situated in the auto-reduction and auto-reschedule according to the time of the day and level of occupancy.
The ANFIS system has two inputs, the daily electrical consumption in kilowatts [kWh] and the set point temperature. To obtain the daily consumption for a year, the average high 3C IECC climate zone consumption was selected from Table 3. Then, considering the standard deviation and the mean, 365 values were created, giving an annual consumption of 8894.7 kWh, similar to Case 1. The set point temperature uses the occupied values from the energy saver user; it goes from 15 to 26 °C. The output is related to the type of gamified motivation, intrinsic, extrinsic, or both, and considers the following:
- A home that consumes more energy with a set point below 21 °C for cooling and above 20 °C for heating requires extrinsic motivation for outer recognition and external rewards. A home that consumes less energy with a set point above 23 °C for cooling and below 18 °C for heating can be related to intrinsic motivation. The house uses less kWh than the other in similar conditions. On the other hand, the average home and set point below 23 °C and above 21 °C for cooling and set point below 20 °C and above 18 °C have both motivations. This type of home may be motivated by external recognition or autonomy, competence, and relatedness elements.
- Some of the benefits of local motivation inside the home are that the end-user finds rewarding performing activities or changes if they receive outer recognition from the energy community or achieve the reduction with no outer recognition. Additionally, this user can help the community by sharing tips on modifying their habits without affecting, for instance, thermal comfort. Hence, the energy community motivation relies on social sharing and social belonging; the more the user is involved in social sharing and social activities, the more they want to improve and help the others [37,49].
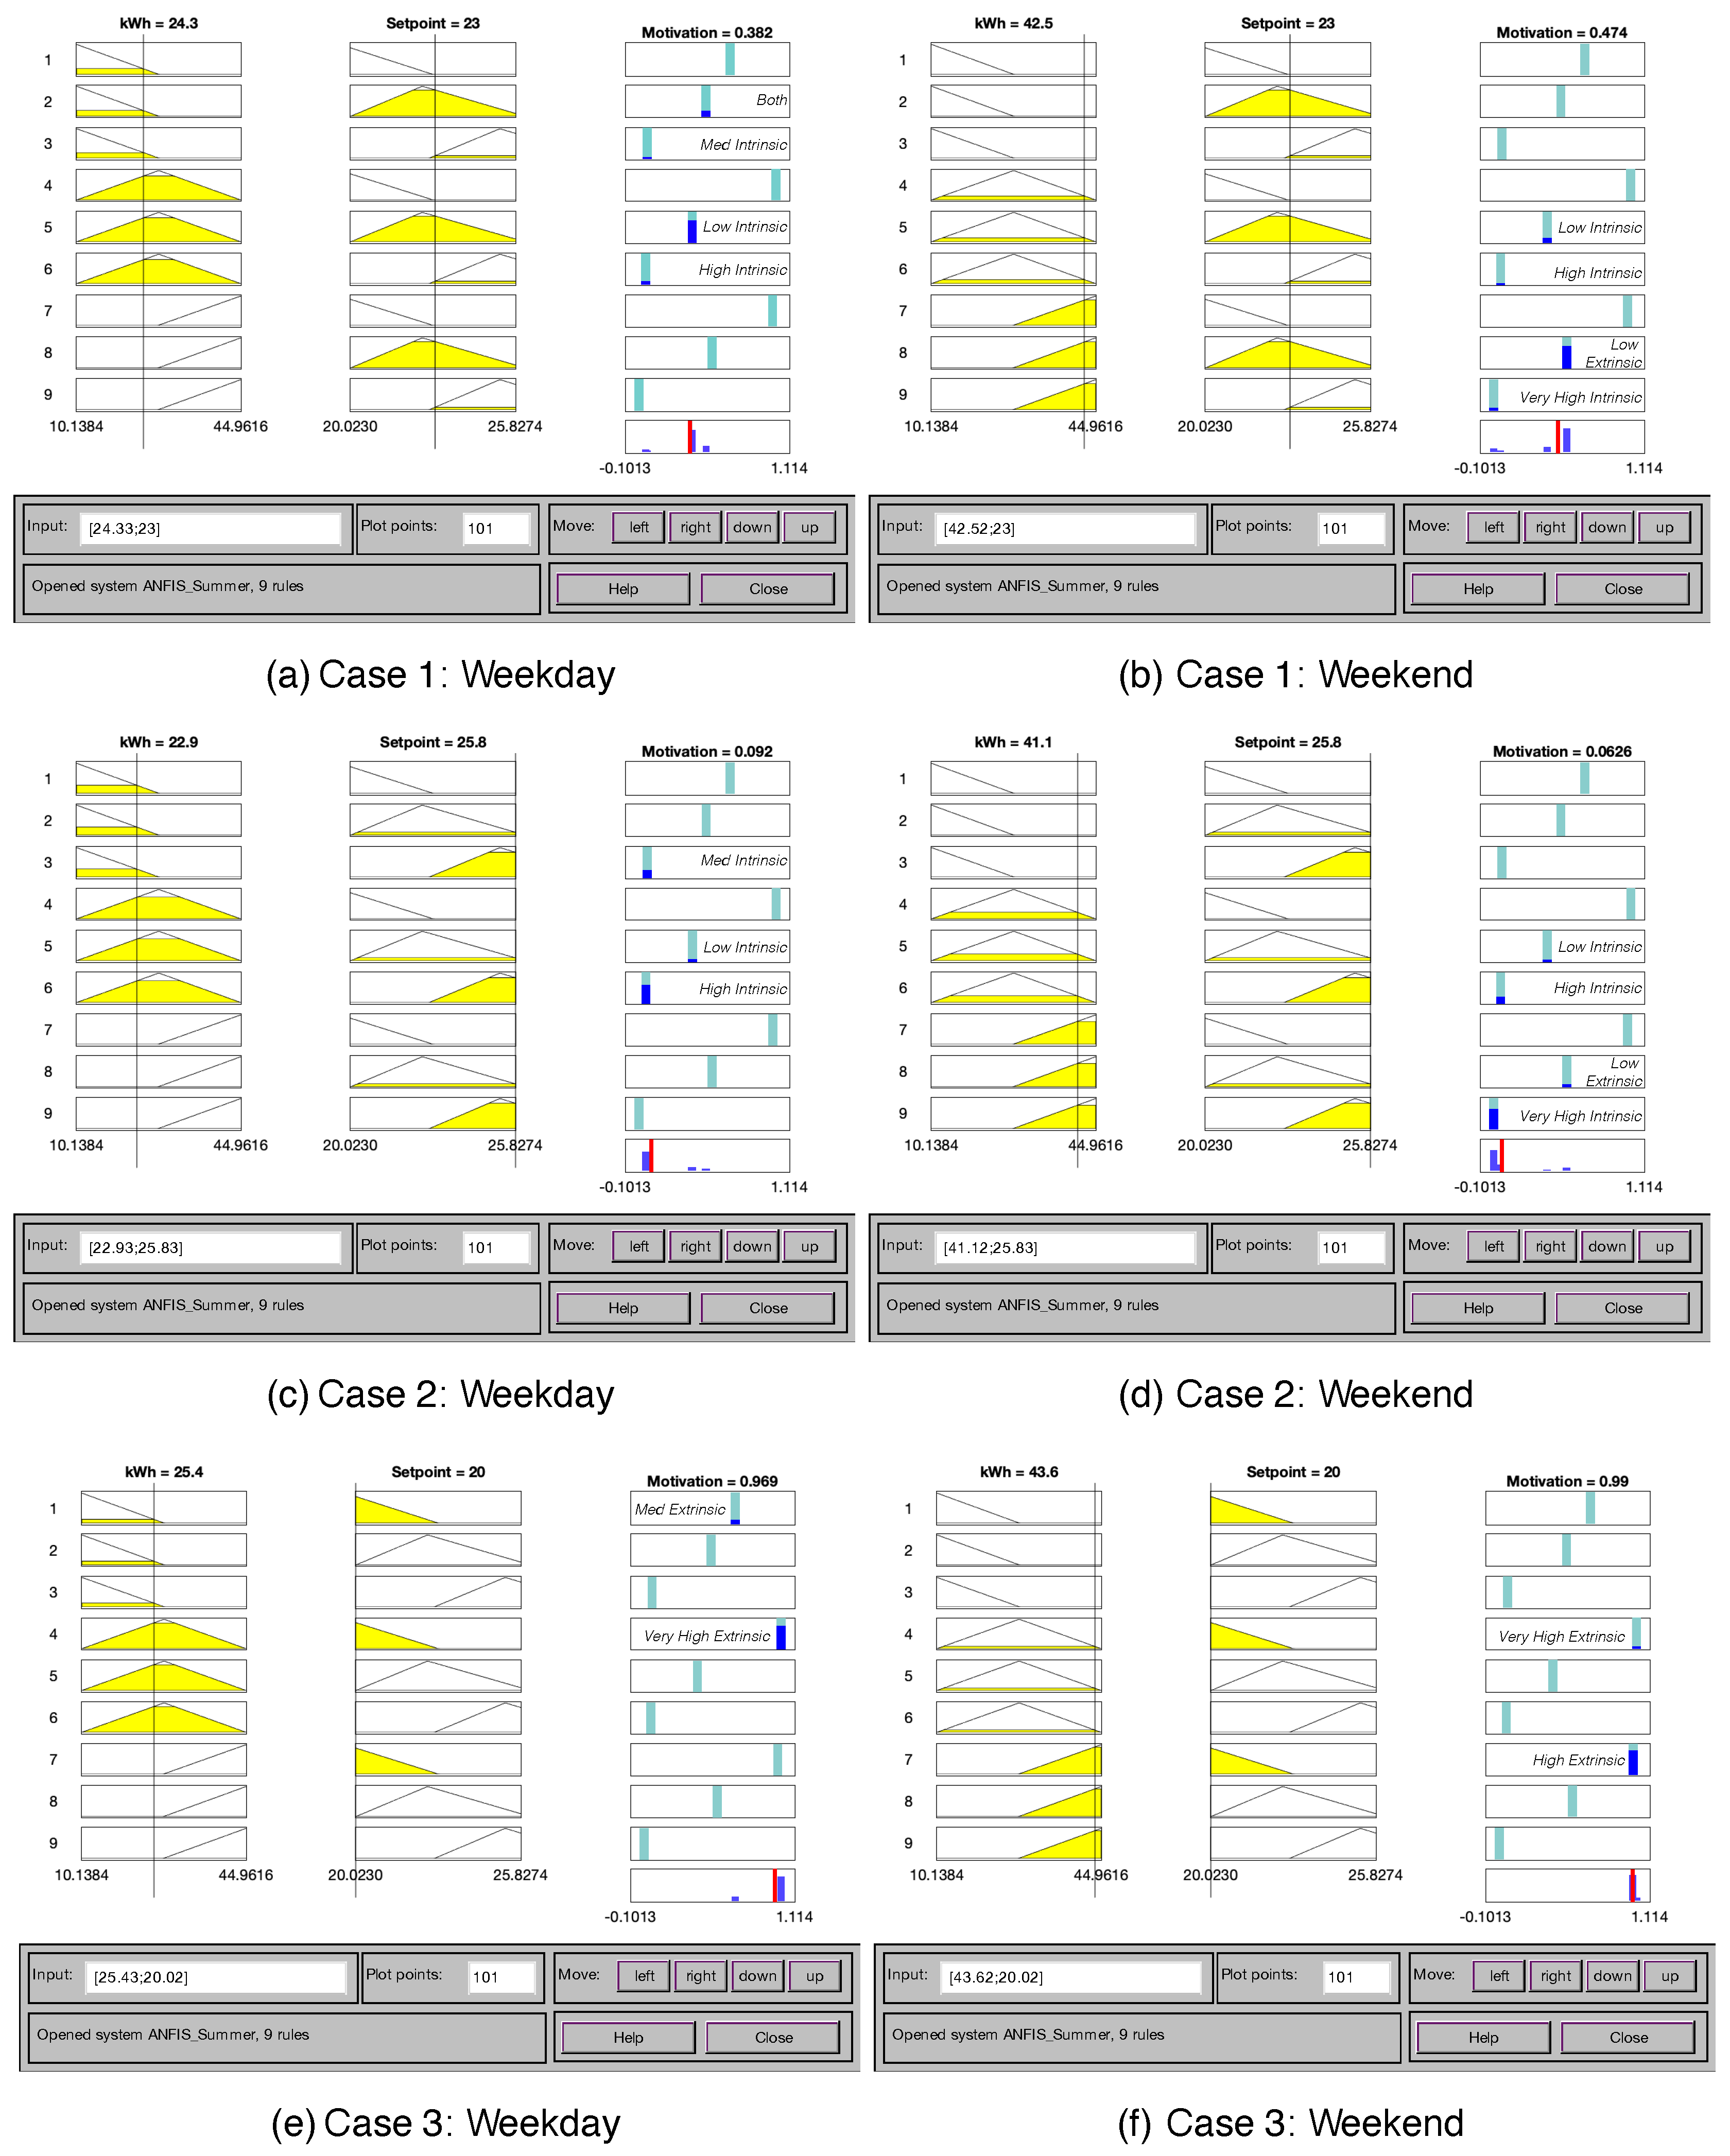
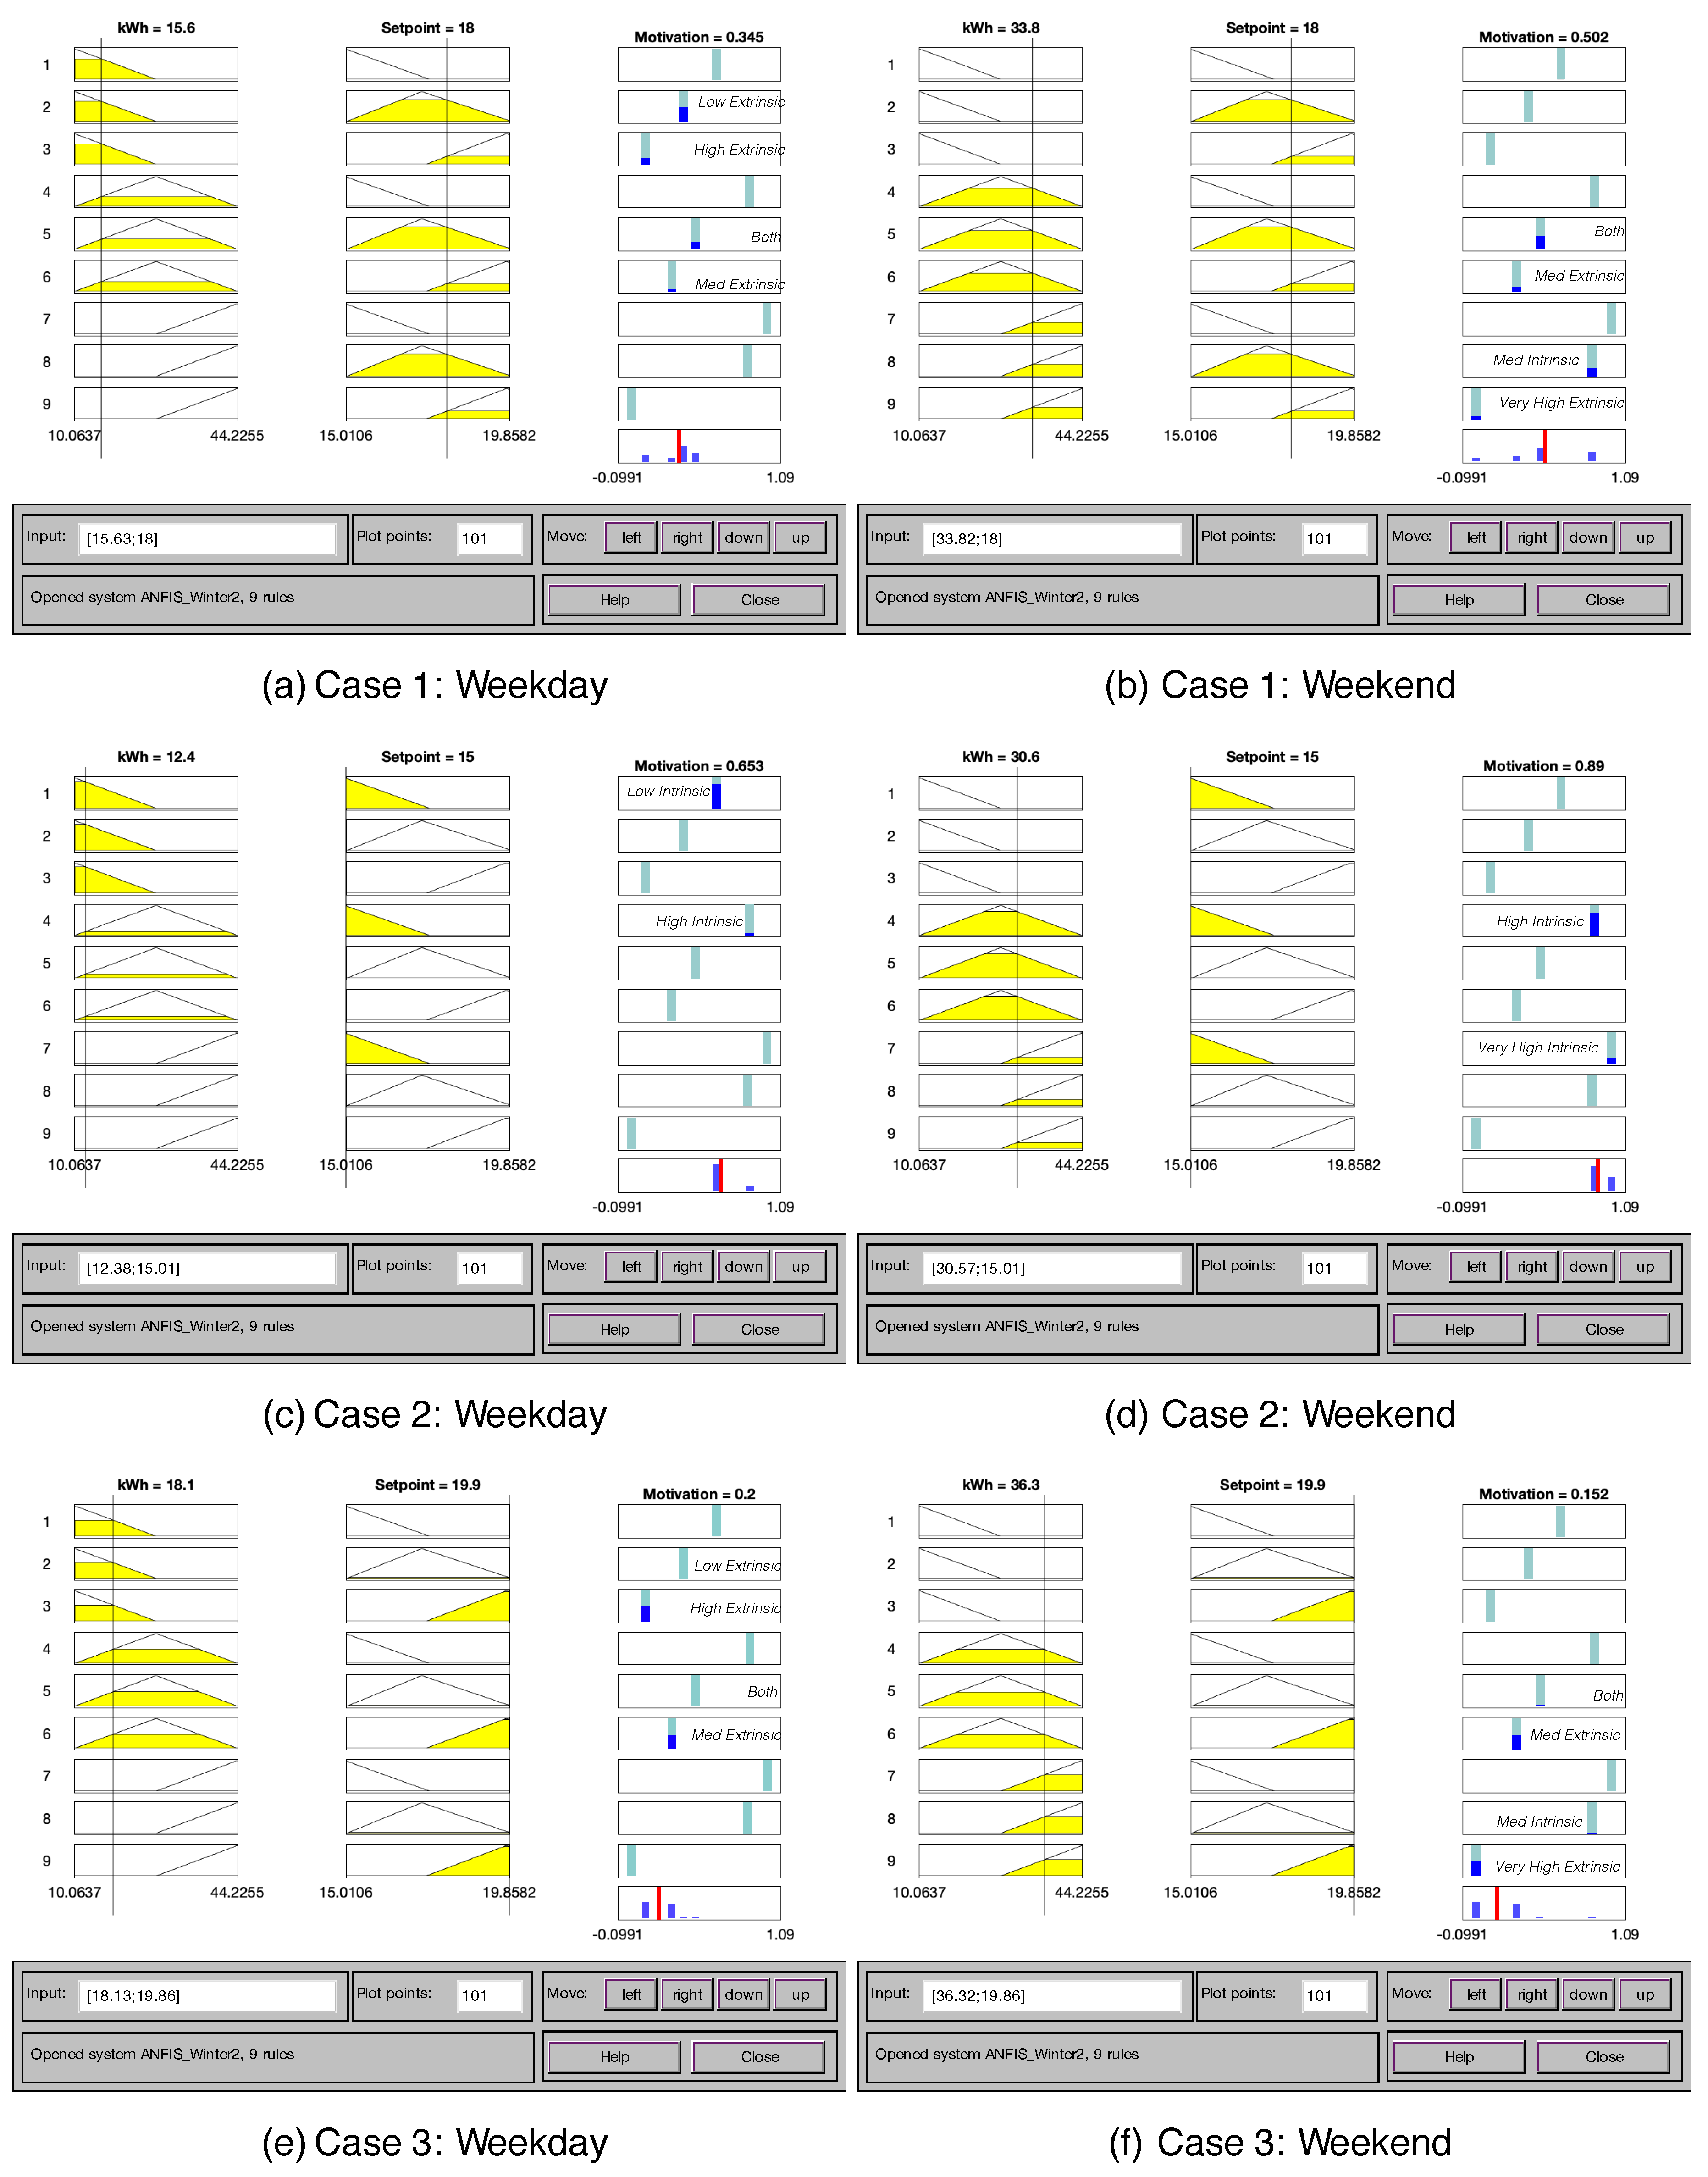
Table 6 and Table 7 show the neuro-fuzzy logic inference rules from the ANFIS system for the summer and winter seasons. The gamification motivation depends on the level of the kWh and setpoint of the house. Figure 13 shows the summer season rules during weekdays and weekends, and Figure 14 for the winter season. For Case 1, an interface oriented more to intrinsic motivations is required with a bit of extrinsic motivation during weekends (see Figure 13a,b). Case 2 requires an interface oriented to the intrinsic motivations(See Figure 13c,d); on the opposite, Case 3 requires an interface oriented to the extrinsic motivation (See Figure 13e,f). For the winter periods, Case 1 requires an interface more oriented to extrinsic motivations and a few elements of intrinsic motivation (see Figure 14a,b) and Case 2 remains with intrinsic motivations and Case 3 with extrinsic motivations (see Figure 14c–f).
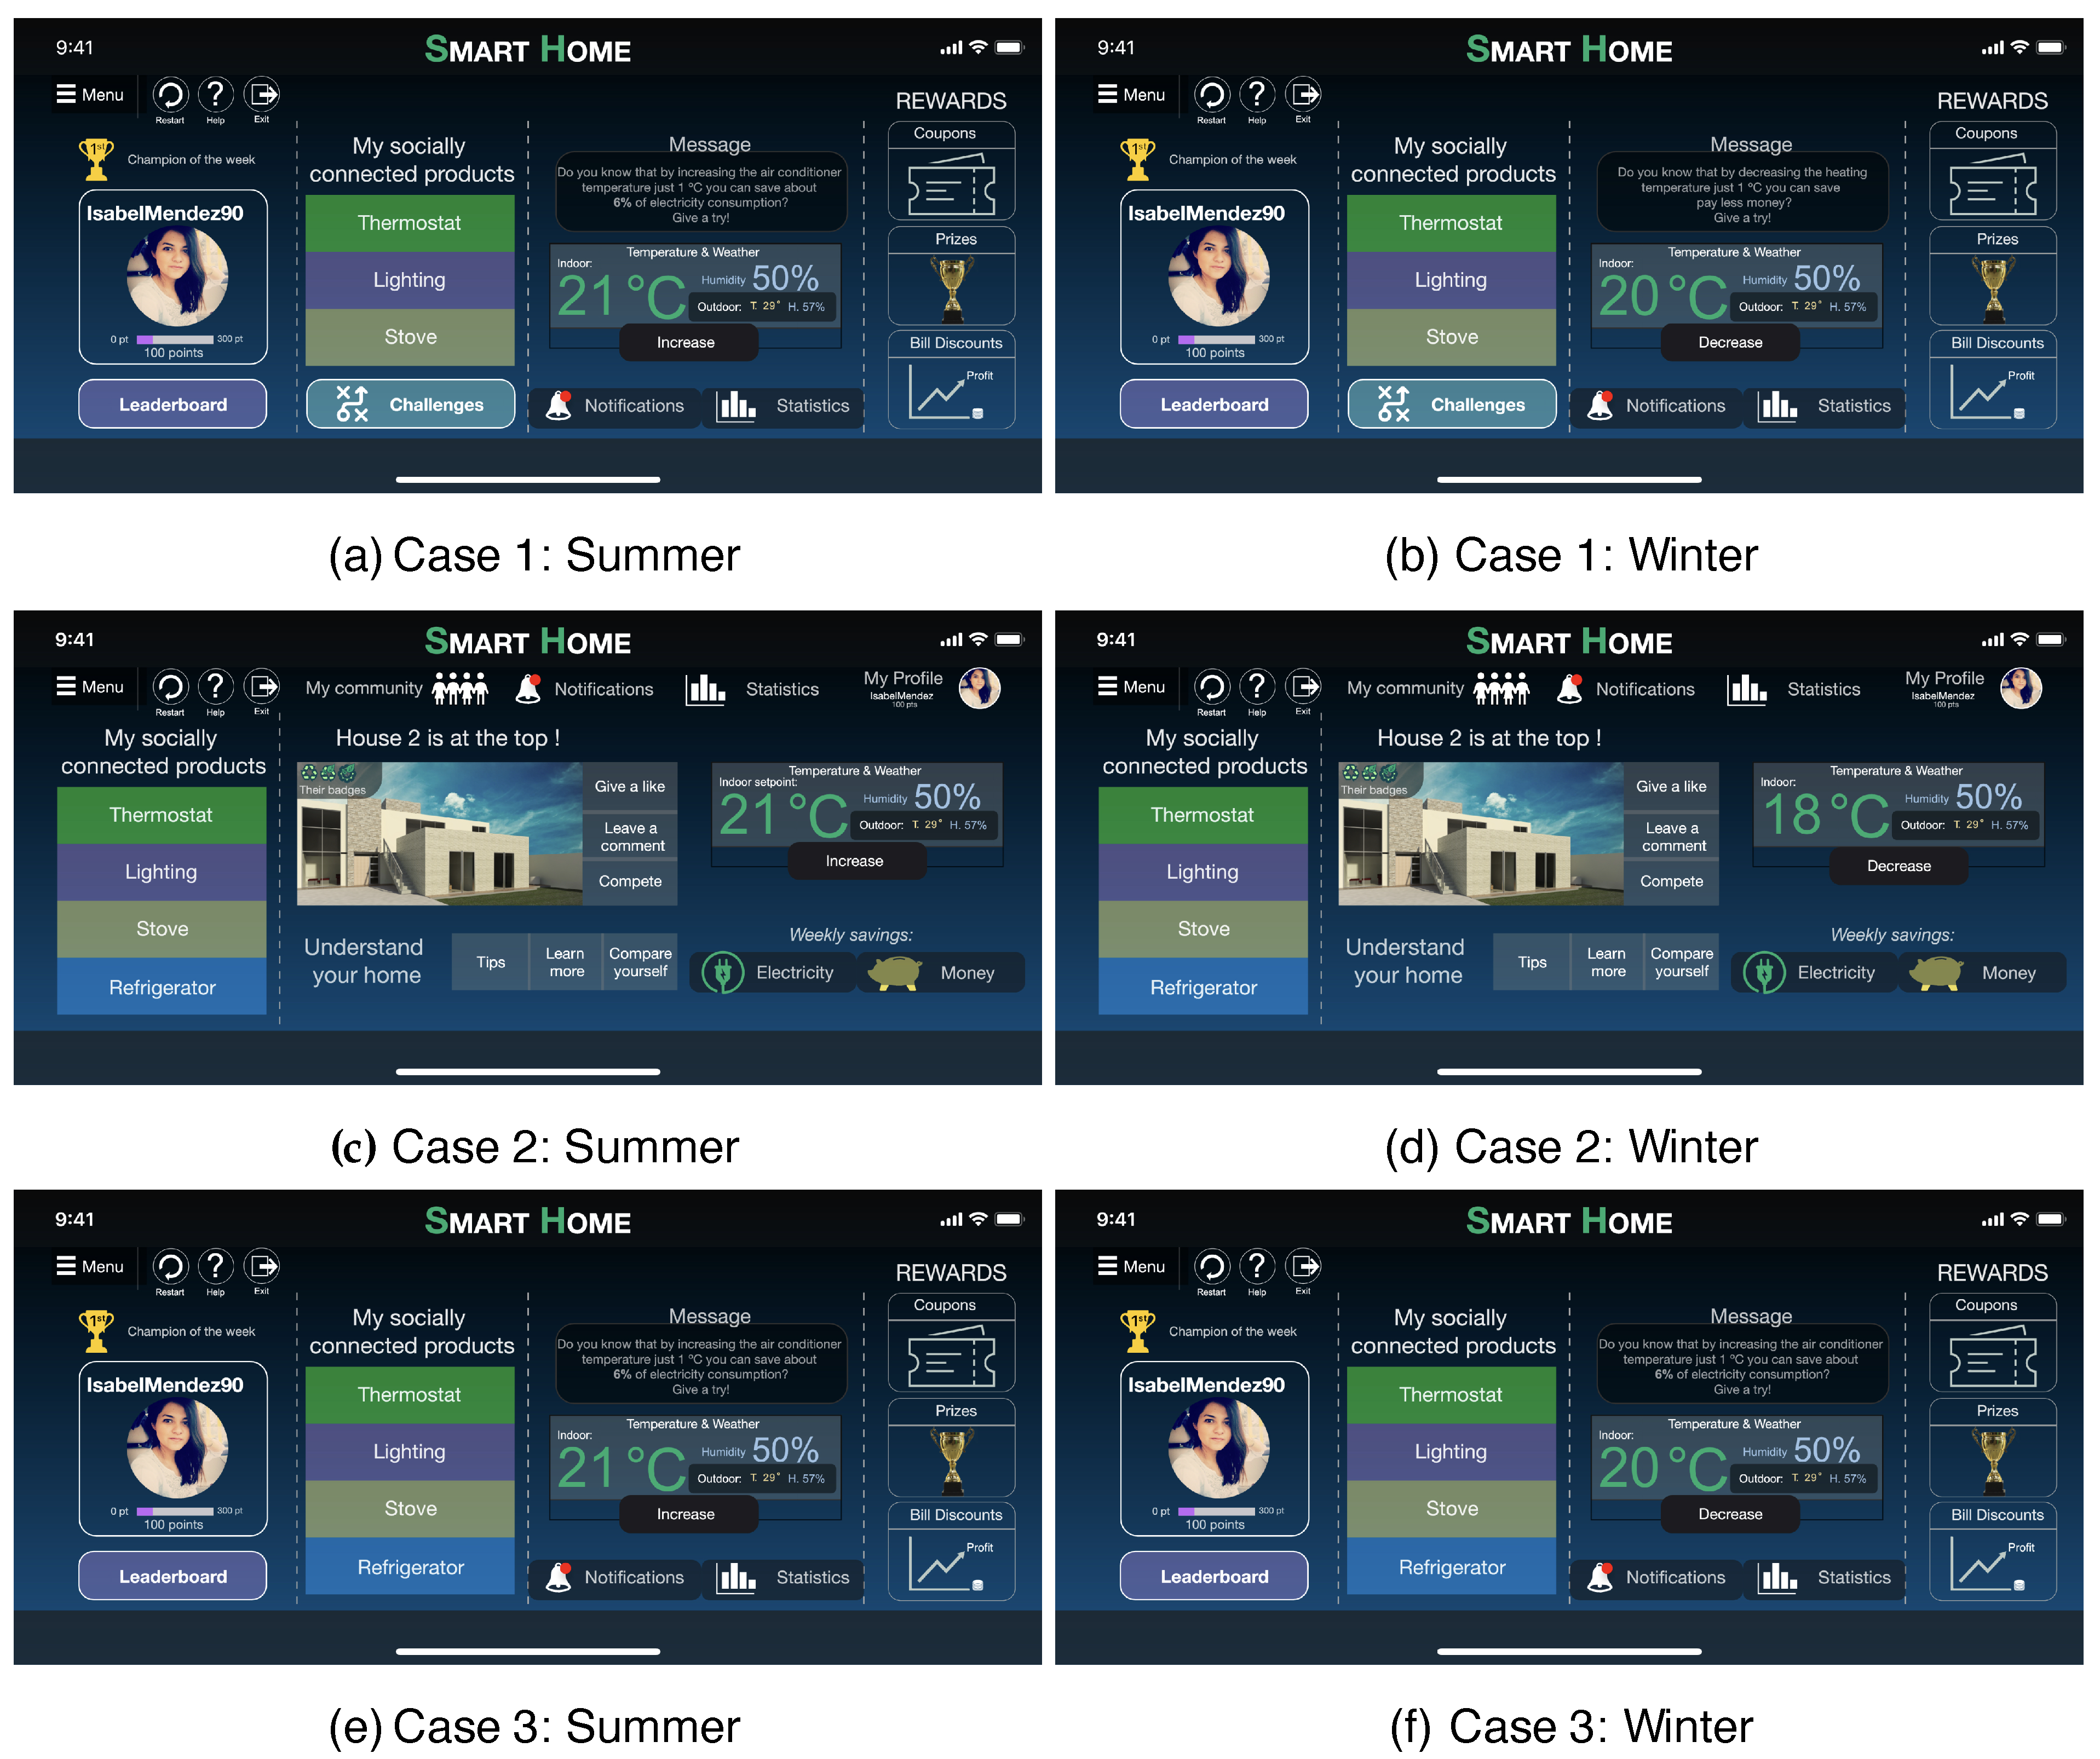
Based on the neuro-fuzzy rules for both periods, Figure 15 shows the interfaces for each case. The three types of user were selected based on their energy awareness and motivation to modify their energy consumption by changing the time of use of the household appliances:
- Case 1. Home-focused—this user is interested in home-improvement efforts while helping to save energy.
- Case 2. Green advocate—this user is concerned about saving energy as much as possible.
- Case 3. Disengaged energy saver—This user is not interested in saving energy.
The description of gamification elements based on the extrinsic and intrinsic motivation are described as follows:
- Case 1. Home-focused energy saver—The intrinsic elements used in Figure 15a are the notifications, tips, energy community, collaboration, control over peers through competition and social comparison, and the extrinsic elements consider challenges, bill discounts, the levels, and rewards. Moreover, Case 1 is fascinating as this type of user requires a more dynamic interface that changes toward the season and promotes this energy reduction; in that sense, an EMS is ideal for this user type. Figure 15b displays an interface that places more emphasis on rewards and leader-board elements.
- Case 2. Green advocate (Figure 15c,d)—This interface is oriented more to intrinsic elements, such as social comparison, notifications, tips, energy community, collaboration, control over peers, social comparison, and competition.
- Case 3. Disengaged energy saver (Figure 15e,f)—On the contrary, this interface is oriented to extrinsic elements such as coupons, bill discounts, and challenges. Moreover, a message is displayed as an intrinsic motivator, and this message is focused on showing the end-user the benefits of reducing energy.
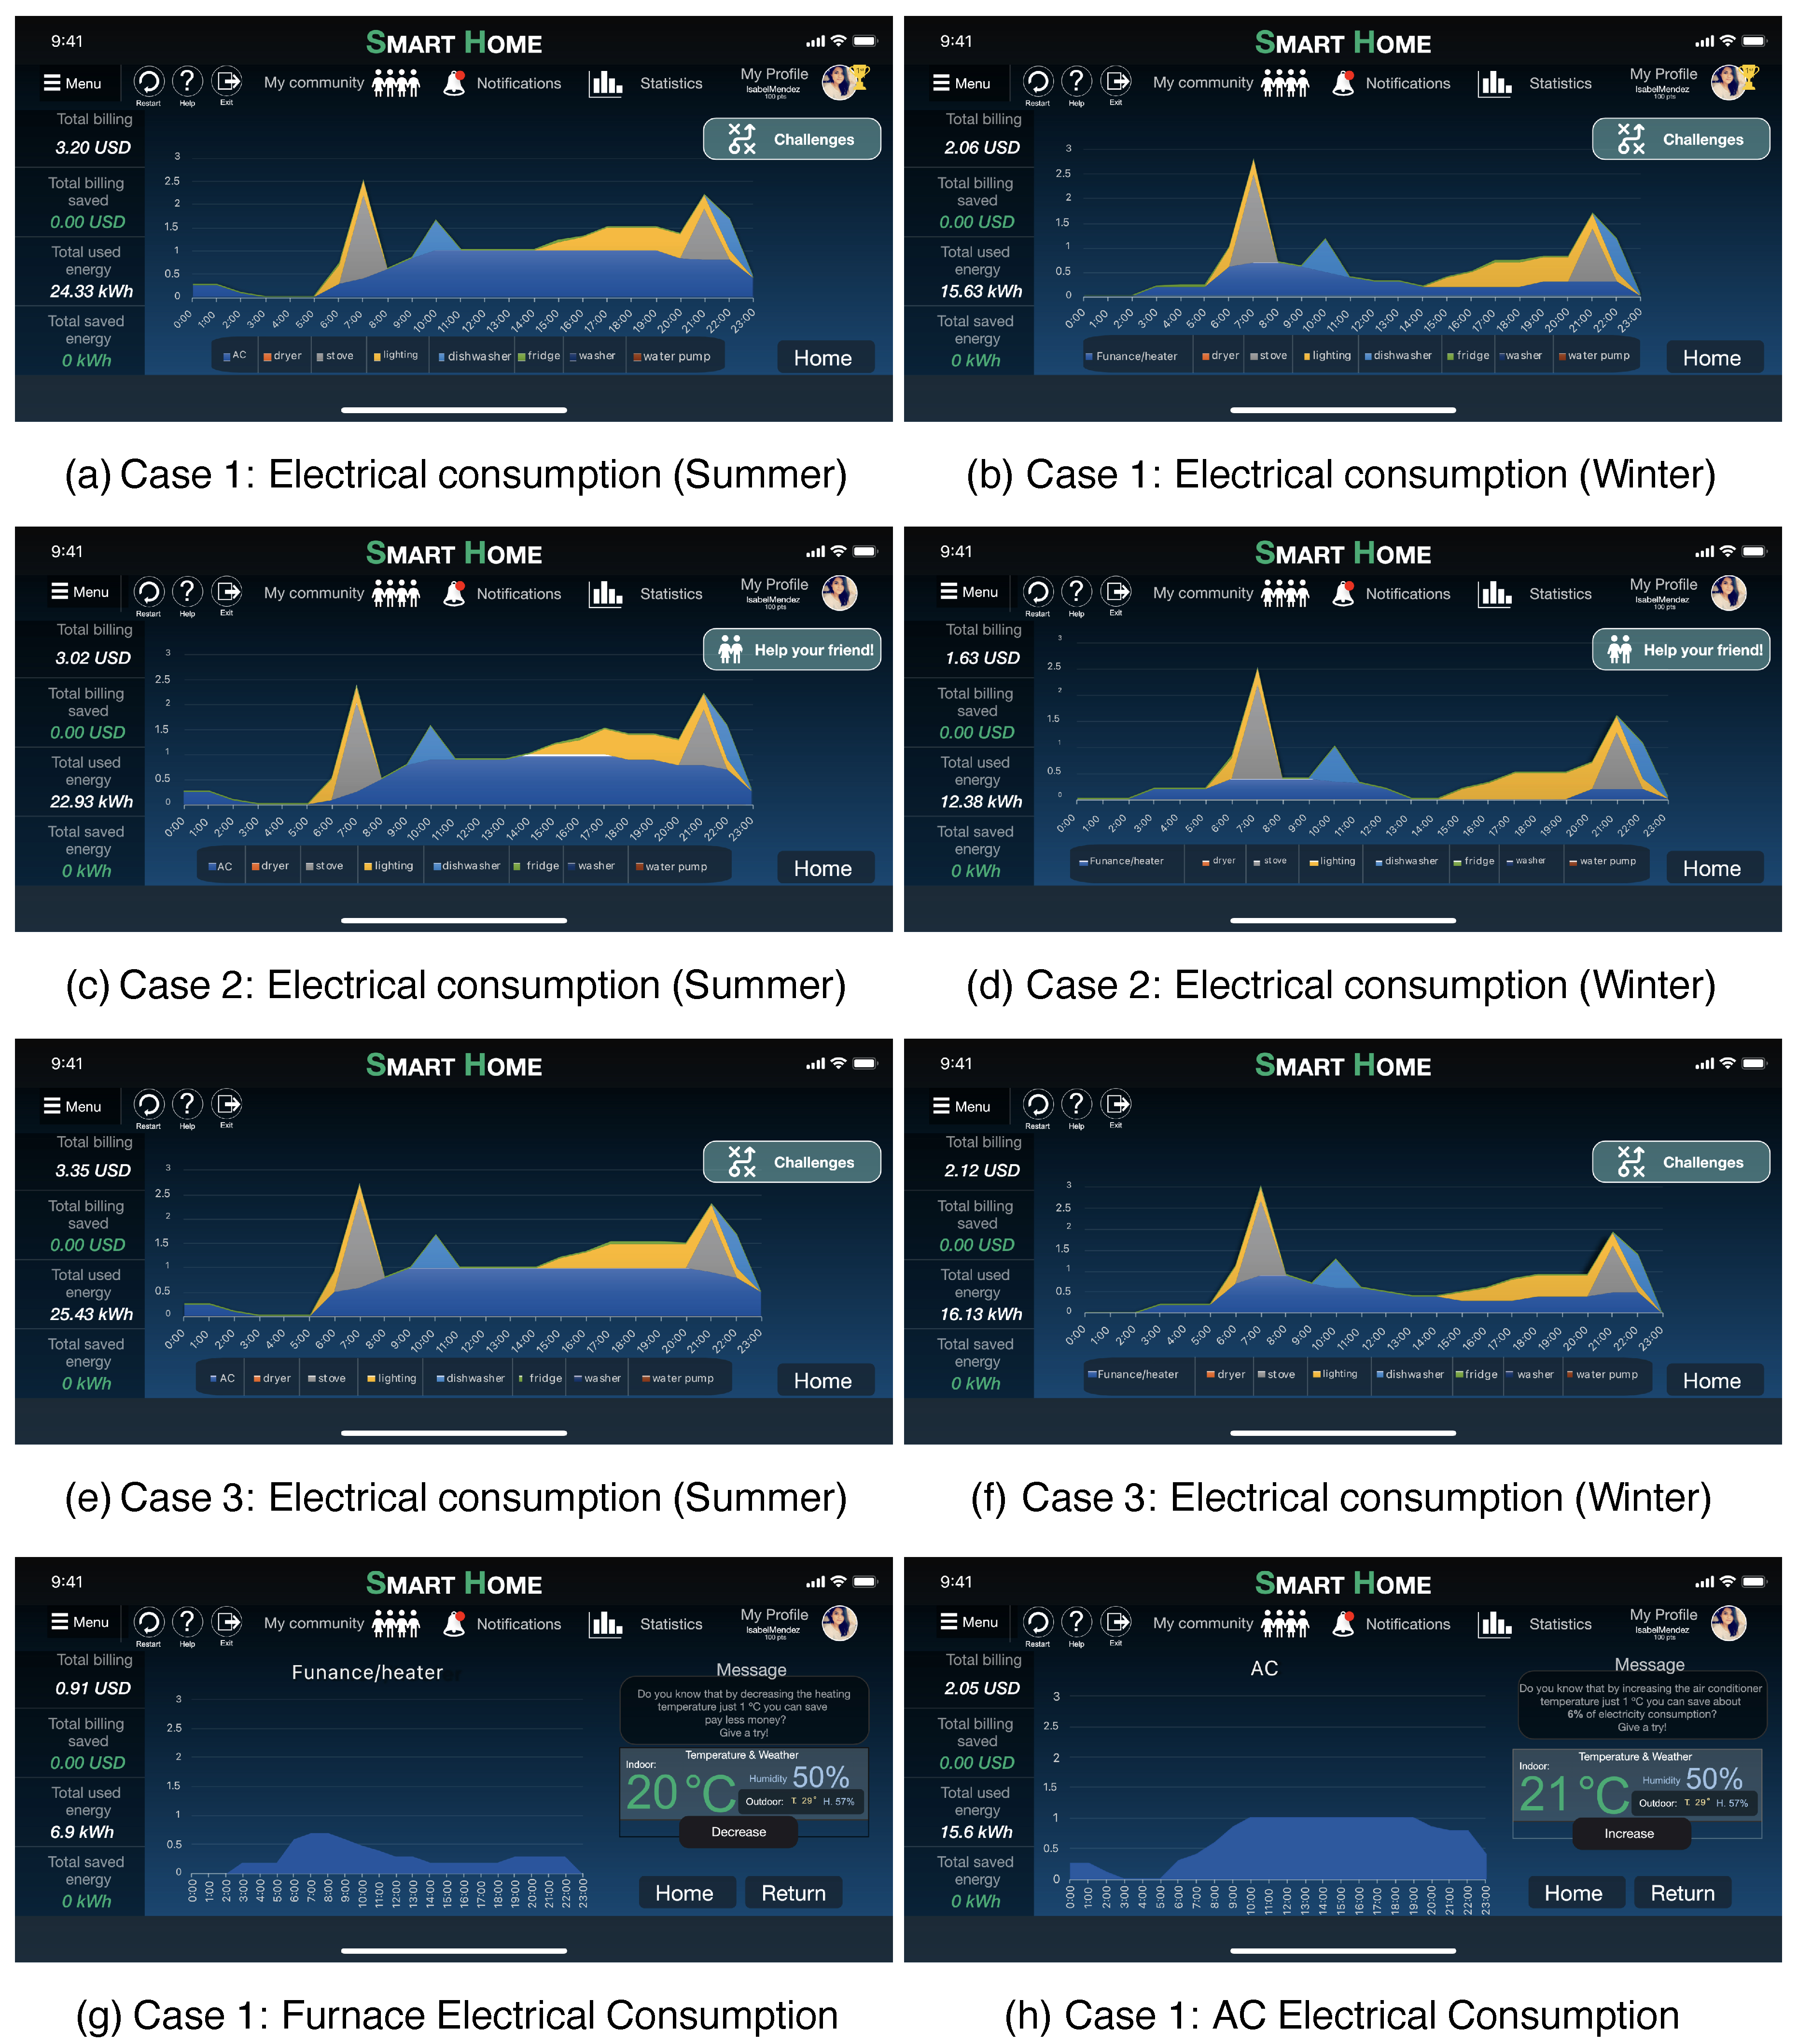
In addition to this, Figure 16a–f show the electrical consumption available in the section of statistics. This electrical consumption allows the user to know how much energy they are using and how they can save energy if they want to do it. Figure 16g,h display Case 1 for the heater and AC. The interface displays a message connected with the EMS, so several strategies can be used based on the decision tree from Figure 7.
The EMS automatizes flexible electrical appliances to perform at low or mid electric rates, reduces energy consumption, and guides the user to reduce non-flexible appliances. For example, the water pump, washing machine, and dryer can be used when a low electrical tariff is current in early and late hours to save money. Moreover, the EMS may reduce lighting consumption by sensing user activity in rooms.
5. Discussion
The state of the art reflects the need to combine an EMS with gamification techniques to promote energy reduction. Current frameworks assume a certain level of comfort without considering the user’s preferences and thermal comfort. Moreover, a friendly EMS that displays energy consumption and has auto-configuration or easy set-up is needed to engage the user and optimize consumption when the price is high; in the end, this can help users to reduce electrical consumption [26,27,28,29,30,31,32]. Thus, considering the human factor while designing an EMS is crucial.
Gamification techniques could help by knowing the types of end-user and proposing specific targets so the users could be engaged. A manner of classifying the type of user has been proposed in [49], where based on the type of user, tailored gamified interfaces are proposed. Moreover, this paper proposes five user classifications based on the user’s targets, such as saving-money goal, comfort level, environmental commitment, and technology knowledge.
One of the great advantages of AI is the possibility of considering sensors and monitoring the end-user to analyze the level of engagement and determine if, for instance, the gamification elements in the interface are accurate or if it requires changes [54]. Mainly, this proposal uses the ANFIS decision system to determine which type of gamified motivation is needed to engage the end-user and promote flexible loads during the day.
Although this paper does not consider the inclusion of multi-sensor systems, this could be included in further research for monitoring and tracking the end-user to determine their level of comfort and promote load flexibility based on the users’ daily tasks.
One of the disadvantages of this proposal is the numerous steps required for determining the type of interfaces based on the user; an optimized interface could tackle this disadvantage by providing a previous survey to the user so that the interface could be updated based on their requirements. The simulation could also include longer than one-year historical consumption to better determine the users’ patterns and their thermal comfort depending on the seasons.
Not all the houses or buildings can be used for deploying this technology. The conditions and limits that require a smart home for being benefited of this proposal are connectivity scheme among electrical devices and the monitoring system, in addition to a certain level of control of the flexible ones. The system runs on a smart device such as a cellphone, but it is not the only device that can receive and transmit energy information. On the other hand, energy companies can use the data generated for improving services or facilitate green energy inclusion and stability of the electric grid.
However, this proposal’s advantage is the inclusion of EMS with a gamification structure to provide goal-oriented lucid interfaces, in this case, with the reduction of electrical consumption during peak hours and promoting flexible usage.
6. Conclusions
A gamification strategy and EMS were used to help improve energy efficiency, save energy and money, avoid peak rates, and reduce energy consumption. As a result, this proposal studies energy scenarios with the same energy load schemes (flexible schedule loads and non-flexible loads). Still, for different types of users (user willing to change its consumption patterns without restrictions, user partially willing to modify patterns, and user not flexible), the simulation showed an approximate 10% energy consumption reduction. Aside from AI techniques, fuzzy logic and decision tree were used for the decision-making process, which matched the load scheme and user preferences in a compound tailored interface with the required gamification elements to save energy according to users’ personalities. According to the decision tree system, the fuzzy logic scheme delimits the user preferences to manage the flexible loads (an HVAC system for this case study). Thus, the ANFIS system reaches the tailored interface compound of gamification elements for the rest of the load scheme management for energy efficiency.
Moreover, simulation allows a better decision-making process and forecasting, saving energy and money by making proper use of electrical devices and achieving user goals and preferences. Although this simulation is for consumption per hour and monthly rate, the algorithm allows testing different custom load schemes, dynamic price schemes, and different user behavior. In addition, classifying the type of consumer allows a more accurate profile that helps make decisions required for proposing changes in household appliances. For instance, disengaged energy saver users are not interested in saving energy, so the interface displays gamified extrinsic motivations that motivate them to perform activities to receive rewards. Those activities include the change of thermostat setpoint or the change in household appliance usage during off-peak periods.
On the other hand, green advocate users require interfaces with intrinsic motivations that allow these consumers’ interaction with other types of consumers such as the disengaged or the home-focused, promoting social commitment and social sharing. Therefore, these users can feel part of the community as they help other users reduce energy or promote flexible loads. Further work could provide feedback and adjust the model based on energy consumption to evaluate the overall performance and adapt the interface and the gamification elements. Another aspect to include in evaluating usability and heuristics is to optimize the interface and make it more appealing. In addition, the classification of the user type, their personality traits, and type of gamified user could be included to improve the game dynamics during the application usage.
Author Contributions
Conceptualization, M.A., J.I.M., P.P., T.P., A.M. (Alam Meier) and A.M. (Arturo Molina); methodology, M.A., J.I.M., P.P., T.P., A.M. (Alam Meier) and A.M. (Arturo Molina); software, M.A. and J.I.M.; validation, M.A., J.I.M., P.P., T.P., A.M. (Alam Meier) and A.M. (Arturo Molina); formal analysis, M.A. and J.I.M.; investigation, M.A., J.I.M., P.P., T.P., A.M. (Alam Meier) and A.M. (Arturo Molina); resources, P.P., T.P., A.M. (Alam Meier) and A.M. (Arturo Molina); data curation, M.A. and J.I.M.; writing—original draft preparation, M.A. and J.I.M.; writing—review and editing, P.P., T.P., A.M. (Alam Meier) and A.M. (Arturo Molina); visualization, M.A. and J.I.M.; supervision, P.P., T.P., A.M. (Alam Meier) and A.M. (Arturo Molina); project administration, P.P., T.P., A.M. (Alam Meier) and A.M. (Arturo Molina); funding acquisition, P.P., T.P., A.M. (Alam Meier) and A.M. (Arturo Molina). All authors have read and agreed to the published version of the manuscript.
Funding
This research project is supported by Tecnologico de Monterrey and CITRIS under the collaboration ITESM-CITRIS Smart thermostat, deep learning, and gamification project (https://citris-uc.org/2019-itesm-seed-funding/ (accessed on 5 April 2021)).
Conflicts of Interest
The authors declare no conflict of interest.
References
- EIA: Total Energy Annual Data—U.S. Energy Information Administration (EIA). Available online: https://www.eia.gov/totalenergy/data/annual/index.php (accessed on 9 December 2020).
- Rosselló-Busquet, A.; Soler, J. Towards efficient energy management: Defining HEMS and smart grid objectives. Int. J. Adv. Telecommun. 2011, 4, 249–263. [Google Scholar]
- Kadam, R.; Mahamuni, P.; Parikh, Y. Smart home system. Int. J. Innov. Res. Adv. Eng. (IJIRAE) 2015, 2, 81–86. [Google Scholar]
- Akbari-Dibavar, A.; Nojavan, S.; Mohammadi-Ivatloo, B.; Zare, K. Smart home energy management using hybrid robust-stochastic optimization. Comput. Ind. Eng. 2020, 143, 106425. [Google Scholar] [CrossRef]
- Kon, B.; Lam, A.; Chan, J. Evolution of smart homes for the elderly. In Proceedings of the 26th International Conference on World Wide Web Companion, Perth, Australia, 3–7 April 2017; pp. 1095–1101. [Google Scholar]
- Hossain, K.A. Global energy consumption pattern and GDP. Int. J. Renew. Energy Technol. Res. 2012, 1, 23–29. [Google Scholar]
- Alanezi, A.; P Hallinan, K.; Elhashmi, R. Using Smart-WiFi Thermostat Data to Improve Prediction of Residential Energy Consumption and Estimation of Savings. Energies 2021, 14, 187. [Google Scholar] [CrossRef]
- Ma, R.; Yang, S.; Wang, X.; Wang, X.C.; Shan, M.; Yu, N.; Yang, X. Systematic Method for the Energy-Saving Potential Calculation of Air Conditioning Systems via Data Mining. Part II: A Detailed Case Study. Energies 2021, 14, 86. [Google Scholar] [CrossRef]
- Deterding, S.; Dixon, D.; Khaled, R.; Nacke, L. From game design elements to gamefulness: Defining “gamification”. In Proceedings of the 15th International Academic MindTrek Conference: Envisioning Future Media Environments, Tampere, Finland, 28–30 September 2011; pp. 9–15. [Google Scholar]
- Fraternali, P.; Cellina, F.; Herrera, S.; Krinidis, S.; Pasini, C.; Rizzoli, A.E.; Rottondi, C.; Tzovaras, D. A Socio-Technical System Based on Gamification Towards Energy Savings. In Proceedings of the 2018 IEEE International Conference on Pervasive Computing and Communications Workshops (PerCom Workshops), Athens, Greece, 19–23 March 2018; pp. 59–64. [Google Scholar]
- Páris, J.; Cambeiro, J.; Amaral, V.; Rodrigues, A. Using Gamification to motivate occupants to energy efficiency in a social setting of a Building automation system. In Proceedings of the 2019 IEEE 43rd Annual Computer Software and Applications Conference (COMPSAC), Milwaukee, WI, USA, 15–19 July 2019; Volume 1, pp. 638–643. [Google Scholar]
- Albertarelli, S.; Fraternali, P.; Herrera, S.; Melenhorst, M.; Novak, J.; Pasini, C.; Rizzoli, A.E.; Rottondi, C. A survey on the design of gamified systems for energy and water sustainability. Games 2018, 9, 38. [Google Scholar] [CrossRef] [Green Version]
- Foster, D.; Lawson, S.; Blythe, M.; Cairns, P. Wattsup? Motivating reductions in domestic energy consumption using social networks. In Proceedings of the 6th Nordic Conference on Human-Computer Interaction: Extending Boundaries, Reykjavik, Iceland, 16–20 October 2010; pp. 178–187. [Google Scholar]
- Fraternali, P.; Herrera, S.; Novak, J.; Melenhorst, M.; Tzovaras, D.; Krinidis, S.; Rizzoli, A.E.; Rottondi, C.; Cellina, F. enCOMPASS—An integrative approach to behavioural change for energy saving. In Proceedings of the 2017 Global Internet of Things Summit (GIoTS), Geneva, Switzerland, 6–9 June 2017; pp. 1–6. [Google Scholar]
- Ekici, B.B.; Aksoy, U.T. Prediction of building energy needs in early stage of design by using ANFIS. Expert Syst. Appl. 2011, 38, 5352–5358. [Google Scholar] [CrossRef]
- Taivalsaari, A.; Mikkonen, T. A roadmap to the programmable world: Software challenges in the IoT era. IEEE Softw. 2017, 34, 72–80. [Google Scholar] [CrossRef]
- Lin, Y.H.; Hu, Y.C. Residential consumer-centric demand-side management based on energy disaggregation-piloting constrained swarm intelligence: Towards edge computing. Sensors 2018, 18, 1365. [Google Scholar] [CrossRef] [Green Version]
- Faustine, A.; Mvungi, N.H.; Kaijage, S.; Michael, K. A survey on non-intrusive load monitoring methodies and techniques for energy disaggregation problem. arXiv 2017, arXiv:1703.00785. [Google Scholar]
- Schirmer, P.A.; Mporas, I. Statistical and electrical features evaluation for electrical appliances energy disaggregation. Sustainability 2019, 11, 3222. [Google Scholar] [CrossRef] [Green Version]
- Fadlullah, Z.M.; Pathan, A.S.K.; Singh, K. Smart grid internet of things. Mob. Netw. and Appl. 2018, 23, 879–880. [Google Scholar] [CrossRef] [Green Version]
- Chiosa, R.; Piscitelli, M.S.; Capozzoli, A. A Data Analytics-Based Energy Information System (EIS) Tool to Perform Meter-Level Anomaly Detection and Diagnosis in Buildings. Energies 2021, 14, 237. [Google Scholar] [CrossRef]
- Elmouatamid, A.; Ouladsine, R.; Bakhouya, M.; El Kamoun, N.; Khaidar, M.; Zine-Dine, K. Review of Control and Energy Management Approaches in Micro-Grid Systems. Energies 2021, 14, 168. [Google Scholar] [CrossRef]
- Zia, M.F.; Elbouchikhi, E.; Benbouzid, M. Microgrids energy management systems: A critical review on methods, solutions, and prospects. Appl. Energy 2018, 222, 1033–1055. [Google Scholar] [CrossRef]
- Aznavi, S.; Fajri, P.; Asrari, A.; Harirchi, F. Realistic and intelligent management of connected storage devices in future smart homes considering energy price tag. IEEE Trans. Ind. Appl. 2019, 56, 1679–1689. [Google Scholar] [CrossRef]
- Su, W.; Huang, A.Q. Proposing a electricity market framework for the Energy Internet. In Proceedings of the 2013 IEEE Power & Energy Society General Meeting, Vancouver, BC, Canada, 21–25 July 2013; pp. 1–5. [Google Scholar]
- Marzband, M.; Ghazimirsaeid, S.S.; Uppal, H.; Fernando, T. A real-time evaluation of energy management systems for smart hybrid home Microgrids. Electr. Power Syst. Res. 2017, 143, 624–633. [Google Scholar] [CrossRef]
- Thomas, D.; Deblecker, O.; Genikomsakis, K.; Ioakimidis, C.S. Smart house operation under PV and load demand uncertainty considering EV and storage utilization. In Proceedings of the IECON 2017—43rd Annual Conference of the IEEE Industrial Electronics Society, Beijing, China, 29 October–1 November 2017; pp. 3644–3649. [Google Scholar]
- Steinberg, J.D. System and Method for Using a Wireless Device as a Sensor for an Energy Management System. U.S. Patent 9,244,470, 26 January 2016. [Google Scholar]
- Anvari-Moghaddam, A.; Vasquez, J.C.; Guerrero, J.M. Load shifting control and management of domestic microgeneration systems for improved energy efficiency and comfort. In Proceedings of the IECON 2015—41st Annual Conference of the IEEE Industrial Electronics Society, Yokohama, Japan, 9–12 November 2015; pp. 96–101. [Google Scholar]
- Lopez, J.M.G.; Pouresmaeil, E.; Canizares, C.A.; Bhattacharya, K.; Mosaddegh, A.; Solanki, B.V. Smart residential load simulator for energy management in smart grids. IEEE Trans. Ind. Electron. 2018, 66, 1443–1452. [Google Scholar] [CrossRef] [Green Version]
- Lebedev, D.; Rosin, A.; Kütt, L. Simulation of real time electricity price based Energy Management System. In Proceedings of the IECON 2016—42nd Annual Conference of the IEEE Industrial Electronics Society, Florence, Italy, 23–26 October 2016; pp. 2106–2110. [Google Scholar]
- Dixon, T. Smart and sustainable? The future of ‘future’cities. Sustain. Futur. Built Environ. 2050 2018, 2050, 94–116. [Google Scholar]
- Dey, N.; Fong, S.; Song, W.; Cho, K. Forecasting energy consumption from smart home sensor network by deep learning. In Proceedings of the International Conference on Smart Trends for Information Technology and Computer Communications, Pune, India, 18–19 August 2017; pp. 255–265. [Google Scholar]
- Yousefi, M.; Hajizadeh, A.; Soltani, M. Energy management strategies for smart home regarding uncertainties: State of the art, trends, and challenges. In Proceedings of the 2018 IEEE International Conference on Industrial Technology (ICIT), Lyon, France, 20–22 February 2018; pp. 1219–1225. [Google Scholar]
- Ponce, P.; Peffer, T.; Molina, A. Framework for communicating with consumers using an expectation interface in smart thermostats. Energy Build. 2017, 145, 44–56. [Google Scholar] [CrossRef]
- AlSkaif, T.; Lampropoulos, I.; van den Broek, M.; van Sark, W. Gamification-based framework for engagement of residential customers in energy applications. Energy Res. Soc. Sci. 2018, 44, 187–195. [Google Scholar] [CrossRef]
- Schiele, K. Utilizing gamification to promote sustainable practices. In Handbook of Engaged Sustainability; Springer: Cham, Switzerland, 2018; pp. 427–444. [Google Scholar]
- Chou, Y.k. Actionable Gamification: Beyond Points, Badges, and Leaderboards; Packt Publishing Ltd.: Birmingham, UK, 2019. [Google Scholar]
- Keshtkar, A.; Arzanpour, S. An adaptive fuzzy logic system for residential energy management in smart grid environments. Appl. Energy 2017, 186, 68–81. [Google Scholar] [CrossRef]
- Lu, Q.; Zhang, Z.; Lü, S. Home energy management in smart households: Optimal appliance scheduling model with photovoltaic energy storage system. Energy Rep. 2020, 6, 2450–2462. [Google Scholar] [CrossRef]
- Wang, X.; Mao, X.; Khodaei, H. A multi-objective home energy management system based on internet of things and optimization algorithms. J. Build. Eng. 2021, 33, 101603. [Google Scholar] [CrossRef]
- Casals, M.; Gangolells, M.; Macarulla, M.; Fuertes, A.; Vimont, V.; Pinho, L.M. A serious game enhancing social tenants’ behavioral change towards energy efficiency. In Proceedings of the 2017 Global Internet of Things Summit (GIoTS), Geneva, Switzerland, 6–9 June 2017; pp. 1–6. [Google Scholar]
- Casals, M.; Gangolells, M.; Macarulla, M.; Forcada, N.; Fuertes, A.; Jones, R.V. Assessing the effectiveness of gamification in reducing domestic energy consumption: Lessons learned from the EnerGAware project. Energy Build. 2020, 210, 109753. [Google Scholar] [CrossRef]
- Denti, E. Novel pervasive scenarios for home management: The Butlers architecture. SpringerPlus 2014, 3, 1–30. [Google Scholar] [CrossRef] [PubMed] [Green Version]
- Fijnheer, J.D.; Van Oostendorp, H. Steps to design a household energy game. In Proceedings of the International Conference on Games and Learning Alliance, Rome, Italy, 9–11 December 2015; pp. 12–22. [Google Scholar]
- Kashani, A.; Ozturk, Y. Residential energy consumer behavior modification via gamification. In Proceedings of the 2017 IEEE 6th International Conference on Renewable Energy Research and Applications (ICRERA), San Diego, CA, USA, 5–8 November 2017; pp. 1221–1225. [Google Scholar]
- Zacharioudakis, E.; Leligou, H.C.; Papadopoulou, A. Energy efficiency tools for residential users. In Proceedings of the MATEC Web of Conferences, Crete, Greece, 14–17 July 2017; Volume 125, p. 02066. [Google Scholar]
- Johnson, D.; Horton, E.; Mulcahy, R.; Foth, M. Gamification and serious games within the domain of domestic energy consumption: A systematic review. Renew. Sustain. Energy Rev. 2017, 73, 249–264. [Google Scholar] [CrossRef] [Green Version]
- Ponce, P.; Meier, A.; Mendez, J.; Peffer, T.; Molina, A.; Mata, O. Tailored gamification and serious game framework based on fuzzy logic for saving energy in smart thermostats. J. Clean. Prod. 2020, 121167. [Google Scholar] [CrossRef]
- Méndez, J.I.; Ponce, P.; Meier, A.; Peffer, T.; Mata, O.; Molina, A. S4 Product Design Framework: A Gamification Strategy Based on Type 1 and 2 Fuzzy Logic. In Smart Multimedia; McDaniel, T., Berretti, S., Curcio, I.D.D., Basu, A., Eds.; Springer International Publishing: Cham, Switzerland, 2020; Volume 12015, pp. 509–524. [Google Scholar] [CrossRef]
- Mata, O.; Ponce, P.; Méndez, I.; Molina, A.; Meier, A.; Peffer, T. A Model Using Artificial Neural Networks and Fuzzy Logic for Knowing the Consumer on Smart Thermostats as a S3 Product. In Advances in Soft Computing; Martínez-Villaseñor, L., Batyrshin, I., Marín-Hernández, A., Eds.; Springer International Publishing: Cham, Switzerland, 2019; Volume 11835, pp. 430–439. [Google Scholar] [CrossRef]
- Mendez, J.I.; Ponce, P.; Meier, A.; Peffer, T.; Mata, O.; Molina, A. Framework for promoting social interaction and physical activity in elderly people using gamification and fuzzy logic strategy. In Proceedings of the 2019 IEEE Global Conference on Signal and Information Processing (GlobalSIP), Ottawa, ON, Canada, 11–14 November 2019; pp. 1–5. [Google Scholar] [CrossRef]
- Mendez, J.I.; Ponce, P.; Mata, O.; Meier, A.; Peffer, T.; Molina, A.; Aguilar, M. Empower saving energy into smart homes using a gamification structure by social products. In Proceedings of the 2020 IEEE International Conference on Consumer Electronics (ICCE), Las Vegas, NV, USA, 4–6 January 2020; pp. 1–7. [Google Scholar] [CrossRef]
- Méndez, J.I.; Mata, O.; Ponce, P.; Meier, A.; Peffer, T.; Molina, A. Multi-sensor system, gamification, and artificial intelligence for benefit elderly people. In Challenges and Trends in Multimodal Fall Detection for Healthcare; Springer: Berlin/Heidelberg, Germany, 2020; pp. 207–235. [Google Scholar]
- Méndez, J.I.; Ponce, P.; Medina, A.; Meier, A.; Peffer, T.; Molina, A. Human-Machine Interfaces for Socially Connected Devices: From Smart households to Smart Cities. In Multimedia for Accessible Human Computer Interfaces, 1st ed.; Springer International Publishing: Berlin/Heidelberg, Germany, 2021; p. 31. [Google Scholar]
- Zadeh, L.A. Fuzzy logic. Computer 1988, 21, 83–93. [Google Scholar] [CrossRef]
- Sayed, A.H. Adaptive networks. Proc. IEEE 2014, 102, 460–497. [Google Scholar] [CrossRef]
- Jang, J.S. ANFIS: Adaptive-network-based fuzzy inference system. IEEE Trans. Syst. Man, Cybern. 1993, 23, 665–685. [Google Scholar] [CrossRef]
- Abraham, A. Adaptation of fuzzy inference system using neural learning. In Fuzzy Systems Engineering; Springer: Berlin/Heidelberg, Germany, 2005; pp. 53–83. [Google Scholar]
- Zhao, Q.; Lian, Z.; Lai, D. Thermal Comfort models and their developments: A review. Energy Built Environ. 2020, 2, 21–33. [Google Scholar] [CrossRef]
- Błażejczyk, K.; Jendritzky, G.; Bröde, P.; Fiala, D.; Havenith, G.; Epstein, Y.; Psikuta, A.; Kampmann, B. An introduction to the Universal Thermal Climate Index (UTCI). Geogr. Pol. 2013, 86, 5–10. [Google Scholar] [CrossRef] [Green Version]
- Hu, W.; Wen, Y.; Guan, K.; Jin, G.; Tseng, K.J. ITCM: Toward learning-based thermal comfort modeling via pervasive sensing for smart buildings. IEEE Internet Things J. 2018, 5, 4164–4177. [Google Scholar] [CrossRef]
- Soyguder, S.; Alli, H. An expert system for the humidity and temperature control in HVAC systems using ANFIS and optimization with Fuzzy Modeling Approach. Energy Build. 2009, 41, 814–822. [Google Scholar] [CrossRef]
- Ku, K.; Liaw, J.; Tsai, M.; Liu, T. Automatic control system for thermal comfort based on predicted mean vote and energy saving. IEEE Trans. Autom. Sci. Eng. 2014, 12, 378–383. [Google Scholar] [CrossRef]
- King, D.W.; Hodson, D.D.; Peterson, G.L. The role of simulation frameworks in relation to experiments. In Proceedings of the 2017 Winter Simulation Conference (WSC), Las Vegas, NV, USA, 3–6 December 2017; pp. 4153–4174. [Google Scholar]
- Bowley, D.; Comeau, P.; Edwards, R.; Hiniker, P.J.; Howes, G.; Kass, R.A.; Labbé, P.; Morris, C.; Nunes-Vaz, R.; Vaughan, J.; et al. Guide for Understanding and Implementing Defense Experimentation (GUIDEx)-Version 1.1; The Technical Cooperation Program (TTCP): Ottawa, ON, Canada, 2006. [Google Scholar]
- Frankel, D.; Heck, S.; Tai, H. Using a Consumer-Segmentation Approach to Make Energy-Efficiency Gains in the Residential Market; McKinsey and Company: New York, NY, USA, 2013. [Google Scholar]
- Sugeno, M. Industrial Applications of Fuzzy Control; Elsevier Science Inc.: Amsterdam, The Netherlands, 1985. [Google Scholar]
- Ponce-Cruz, P.; Molina, A.; MacCleery, B. Fuzzy Logic Type 1 and Type 2 Based on LabVIEW(TM) FPGA, 1st ed.; Springer Publishing Company: Berlin/Heidelberg, Germany, 2016. [Google Scholar]
- Sahin, A.; Kumbasar, T. Type-2 Fuzzy Logic Control in Computer Games. In Type-2 Fuzzy Logic and Systems; John, R., Hagras, H., Castillo, O., Eds.; Springer International Publishing: Cham, Switzerland, 2018; Volume 362, pp. 105–127. [Google Scholar] [CrossRef] [Green Version]
- Dudley, R.M. Sample functions of the Gaussian process. In Selected Works of RM Dudley; Springer: New York, NY, USA, 2010; pp. 187–224. [Google Scholar]
- Yoon, Y.R.; Moon, H.J. Energy consumption model with energy use factors of tenants in commercial buildings using Gaussian process regression. Energy Build. 2018, 168, 215–224. [Google Scholar] [CrossRef]
- Residential Energy Consumption Survey (RECS). Available online: https://www.eia.gov/consumption/residential/data/2015/ (accessed on 9 December 2020).
- Soe, W.T.; Belleudy, C. Load Recognition from Smart Plug Sensor for Energy Management in a Smart Home. In Proceedings of the 2019 IEEE Sensors Applications Symposium (SAS), Sophia Antipolis, France, 11–13 March 2019; pp. 1–6. [Google Scholar]
- Ramírez, M.A.; Cruz, P.P.; Gutiérrez, A.M. Fuzzy logic smart electric manager for building energy efficiency. In Proceedings of the 2019 IEEE 28th International Symposium on Industrial Electronics (ISIE), Vancouver, BC, Canada, 12–14 June 2019; pp. 1562–1567. [Google Scholar]
- Avila, M.; Ponce, P.; Molina, A.; Romo, K. Simulation framework for load management and behavioral energy efficiency analysis in smart homes. In Proceedings of the International Conference on Smart Multimedia, San Diego, CA, USA, 16–18 December 2019; pp. 497–508. [Google Scholar]
- Climate Region 4 North and Central America, USA. Available online: http://climate.onebuilding.org/WMO_Region_4_North_and_Central_America/USA_United_States_of_America/index.html (accessed on 6 May 2021).
- Ladybug Tools Ladybug Tools. Available online: https://www.ladybug.tools/ (accessed on 2 May 2021).
- Statistic Report of the annual weather file. Available online: https://www.ncdc.noaa.gov/data-access (accessed on 9 December 2020).
- Energy Conservation in Building Space Cooling through Recommended Optimum Temperature Setting. 2018. Available online: http://mowr.nic.in/core/Circulars/2019/GA_24-07-2019_43.PDF (accessed on 5 April 2021).
Figure 1.
EMS and gamification strategy diagram.

Figure 2.
EMS diagram flow.

Figure 3.
Diagram of Step 1.

Figure 4.
Fuzzy logic type II membership functions.

Figure 5.
Diagram of Step 2.

Figure 6.
Diagram of Step 3.

Figure 7.
Decision tree for load management.

Figure 8.
ANFIS model structure.

Figure 9.
Box-plot for each IECC climate zone and their site electricity usage in kWh.

Figure 10.
Indoor temperature in summer and winter and the setpoint for each case: (a) displays the indoor temperature for 16 December and the setpoints for each case, and (b) displays the indoor temperature for 1 July and the setpoints for each case.
Figure 10.
Indoor temperature in summer and winter and the setpoint for each case: (a) displays the indoor temperature for 16 December and the setpoints for each case, and (b) displays the indoor temperature for 1 July and the setpoints for each case.

Figure 11.
Daily average energy consumption in summer season for Case 1, Case 2, and Case 3 during weekday and weekend.
Figure 11.
Daily average energy consumption in summer season for Case 1, Case 2, and Case 3 during weekday and weekend.

Figure 12.
Daily average energy consumption in winter season for Case 1, Case 2, and Case 3 during weekday and weekend.
Figure 12.
Daily average energy consumption in winter season for Case 1, Case 2, and Case 3 during weekday and weekend.

Figure 13.
Neuro-fuzzy rules for summer season.

Figure 14.
Neuro-fuzzy rules for winter season.

Figure 15.
Gamified HMI for each case.

Figure 16.
HMI for daily electrical consumption for each case during weekdays.


Table 1.
Gamification elements for extrinsic and intrinsic motivations.
| Extrinsic Motivations | Intrinsic Motivations |
|---|---|
| Offers, coupons | Notifications |
| Bill discounts | Messages |
| Challenges | Tips |
| Levels | Energy community |
| Dashboard | Collaboration |
| Statistics | Control over peers |
| Degree of control | Social comparison |
| Points, badges, leader-board | Competition |
Table 2.
Classification user scheme.
| Type of User | Description | Environmental Commitment | Tech Knowledge | Desired Comfort | Save Money Interest |
|---|---|---|---|---|---|
| Green advocate | Show the most positive overall energy saving behavior, have the strongest positive environmental sense and high interest in new technologies. | High | High | Low | High |
| Traditionalist cost-focused energy saver | Their energy-saving behavior is motivated by cost savings rather than the environmental impact. Limited interest in new technologies. | Medium | Low | Low | High |
| Home-focused selective energy saver | They are concerned about saving energy and interested in home-improvement efforts. | Medium | High | Medium | High |
| Non-green selective energy saver | Selective energy saving behavior focused on “set and forget” type interventions. They are not concerned about environmental considerations. | Low | Medium | High | Medium |
| Disengaged energy saver | Less motivated to save energy through energy savings. They are not concerned about environment nor new technologies. | Low | Low | Medium | Low |
Table 3.
Five types of home based on the electric consumption from the RECS data analysis.
| Electric Consumption in Homes | United States Average Consumption [kWh] | 3C IECC Climate Zone Consumption [kWh] (California Pacific Region) |
|---|---|---|
| Low | Below 3979.3 | Below 2513.36 |
| Average Low | 3979.3 | 2513.36 |
| Average | 11,028.93 | 5684.16 |
| Average High | 18,078.65 | 8855.14 |
| High | Above 18,078.65 | Above 8855.14 |
Table 4.
Heating and cooling designs with different setpoints.
| Case 1: Home-Focused Selective | Summer(AC): Jul. 01 | Winter (Heater): Dec. 16 |
|---|---|---|
| Daily Average Consumption | 15.6 kWh | 6.9 kWh |
| Unoccupied/rest setpoint (23 to 6 h) | 27 °C | 12 °C |
| Occupied comfort setpoint (6 to 23 h) | 23 °C | 18 °C |
| Case 2: Green advocate | Summer(AC): Jul. 01 | Winter (Heater): Dec. 16 |
| Daily Average Consumption | 14.2 kWh | 3.65 kWh |
| Unoccupied/rest setpoint (23 to 6 h) | 27 °C | 12 °C |
| Occupied comfort setpoint (6 to 23 h) | 26 °C | 15 °C |
| Case 3: Disengaged energy saver | Summer(AC): Jul. 01 | Winter (Heater): Dec. 16 |
| Daily Average Consumption | 16.7 kWh | 9.4 kWh |
| Unoccupied/rest setpoint (23 to 6 h) | 27 °C | 12 °C |
| Occupied comfort setpoint (6 to 23 h) | 20 °C | 20 °C |
Table 5.
Average daily weekday and weekend day electrical consumption profile in winter and summer with different thermal comfort (TC).
Table 5.
Average daily weekday and weekend day electrical consumption profile in winter and summer with different thermal comfort (TC).
| Week Type | Electrical Device | Energy Consumption (kWh) |
|---|---|---|
| Weekday | Stove | 2.9 |
| for all | Lighting | 3.7 |
| cases | Dishwasher | 1.33 |
| Refrigerator | 0.8 | |
| Subtotal energy consumption on weekday (A) | 8.73 | |
| Weekend day | Stove | 6.3 |
| for all | Lighting | 3.7 |
| cases | Dishwasher | 2.0 |
| Refrigerator | 1.2 | |
| Washing machine | 0.4 | |
| Dryer | 5.32 | |
| Water pump | 8 | |
| Subtotal energy consumption on weekend (B) | 26.92 | |
| Case | Energy Consumption in Summer (kWh) | Energy Consumption in Winter (kWh) |
| 1: Home-focused | Air Conditioner (AC): 15.6 | Heater: 6.9 |
| Weekday | Total kWh (A) + AC: 24.33 | Total kWh (A) + Heater: 15.63 |
| Weekend | Total kWh (B) + AC: 42.52 | Total kWh (B) + Heater: 33.82 |
| 2: Green advocate | Air Conditioner (AC): 14.2 | Heater: 3.65 |
| Weekday | Total kWh (A) + AC: 22.93 | Total kWh (A) + Heater: 12.38 |
| Weekend | Total kWh (B) + AC: 41.12 | Total kWh (B) + Heater: 30.57 |
| 3: Disengaged | Air Conditioner(AC): 16.7 | Heater: 9.4 |
| Weekday | Total kWh (A) + AC: 25.43 | Total kWh (A) + Heater: 18.13 |
| Weekend | Total kWh (B) + AC: 43.62 | Total kWh (B) + Heater: 36.32 |
Table 6.
Fuzzy logic inference rules for summer period.
| Rule | IF | AND | THEN |
|---|---|---|---|
| kWh | Setpoint | Gamified Motivation | |
| 1 | Low | Low | Med Extrinsic |
| 2 | Low | Med | Both |
| 3 | Low | High | Med Intrinsic |
| 4 | Med | Low | Very High Extrinsic |
| 5 | Med | Med | Low Intrinsic |
| 6 | Med | High | High Intrinsic |
| 7 | High | Low | High Extrinsic |
| 8 | High | Med | Low Extrinsic |
| 9 | High | High | Very High Intrinsic |
Table 7.
Fuzzy logic inference rules for winter period.
| Rule | IF | AND | THEN |
|---|---|---|---|
| kWh | Setpoint | Gamified Motivation | |
| 1 | Low | Low | Low Intrinsic |
| 2 | Low | Med | Low Extrinsic |
| 3 | Low | High | High Extrinsic |
| 4 | Med | Low | High Intrinsic |
| 5 | Med | Med | Both |
| 6 | Med | High | Med Extrinsic |
| 7 | High | Low | Very High Intrinsic |
| 8 | High | Med | Med Intrinsic |
| 9 | High | High | Very High Extrinsic |
Publisher’s Note: MDPI stays neutral with regard to jurisdictional claims in published maps and institutional affiliations. |
© 2021 by the authors. Licensee MDPI, Basel, Switzerland. This article is an open access article distributed under the terms and conditions of the Creative Commons Attribution (CC BY) license (https://creativecommons.org/licenses/by/4.0/).
Share and Cite
MDPI and ACS Style
Avila, M.; Méndez, J.I.; Ponce, P.; Peffer, T.; Meier, A.; Molina, A. Energy Management System Based on a Gamified Application for Households. Energies 2021, 14, 3445. https://0-doi-org.brum.beds.ac.uk/10.3390/en14123445
AMA Style
Avila M, Méndez JI, Ponce P, Peffer T, Meier A, Molina A. Energy Management System Based on a Gamified Application for Households. Energies. 2021; 14(12):3445. https://0-doi-org.brum.beds.ac.uk/10.3390/en14123445
Chicago/Turabian StyleAvila, Manuel, Juana Isabel Méndez, Pedro Ponce, Therese Peffer, Alan Meier, and Arturo Molina. 2021. "Energy Management System Based on a Gamified Application for Households" Energies 14, no. 12: 3445. https://0-doi-org.brum.beds.ac.uk/10.3390/en14123445
Note that from the first issue of 2016, this journal uses article numbers instead of page numbers. See further details here.