
Optimal Seasonal Heat Storage in a District Heating System with Waste Incineration


1
Real Estate Business, School of Engineering, Aalto University, Otakaari 4, 02150 Espoo, Finland
2
Vantaa Energy Ltd., Peltolantie 27, 01300 Vantaa, Finland
*
Author to whom correspondence should be addressed.
Energies 2021, 14(12), 3522; https://0-doi-org.brum.beds.ac.uk/10.3390/en14123522
Submission received: 3 May 2021
/
Revised: 3 June 2021
/
Accepted: 10 June 2021
/
Published: 13 June 2021
(This article belongs to the Special Issue Heat Storage in the Deep Underground)
Abstract
:European Union climate goals aim to increase waste incineration instead of landfills. Incineration of waste increases the mismatch between heat production and consumption since waste is generated constantly but energy demand varies significantly between seasons. Seasonal energy storage is suggested to alleviate this mismatch. However, traditional seasonal storage options have not been cost-effective investments for energy companies. This paper explores the feasibility of a large cavern thermal energy storage in a large district heating system with waste incineration. First, 62 one-year optimisations for seasonal storage with varying size and power were conducted to determine the economic performance of the system. Second, the annual system emissions were estimated. The results show that even small capacity seasonal storage reduces system emissions significantly. Return on investment for the most profitable storage with a capacity of 90 GWh and power of 200 MW range between 3.6% and 9.4%, and the investment varies between EUR 43–112 M depending on costs. Seasonal energy storages are still not as profitable as traditional energy investments. This might change due to growing waste heat recovery and the rising cost of carbon emissions. Further research is needed into new business models for implementing large seasonal storages.
1. Introduction
The European Union targets carbon neutrality by 2050 and calls for actions to reduce emissions in several key sectors [1]. Emissions from energy production and the built environment are in this scope due to their large share from overall emissions [2,3]. As a part of its climate goals, the EU has set out to expand the circular economy by using municipal solid waste (MSW) in energy production when other recycling methods are exhausted [4]. More than half of the waste incineration capacity in Europe is located only in three countries—France, Germany, and the Netherlands. Adding Italy, Sweden, and the United Kingdom, this share is raised to 74%, while other countries are still mostly reliant on MSW landfills [5]. This creates an overproduction of heat during summer because heat demand is low, but MSW is generated year round. Growth in waste produced per capita and decline in landfilling in Europe has led to an increased demand for waste incineration, which has been considered a way of avoiding emissions from landfilling and fossil fuel energy production [6,7].
Another type of waste heat utilisation is also growing due to more energy-efficient buildings and local heat pumps (HPs). Multiple mapping studies of industrial waste heat potential have been conducted from a local- and industry-specific perspective, both in a global and European context [8,9,10,11]. Utilising waste heat from data centres has also been found to be potentially significant for cities with district heating [12,13]. Tightening energy efficiency also creates excess waste heat production since residential buildings, offices, and retail buildings require cooling, especially in the summer, but sometimes also year round. These energy flows are utilised with heat pumps. Moreover, the cooling needs of buildings are expected to grow significantly [14]. This has already been observed in practice [15]. Especially in the Nordic countries, the majority of energy use in buildings still happens during winter, when energy demand can be 10 times higher than in summer.
The Nordic countries have a long history of combined heat and power (CHP) production, a process in which electricity is produced with steam turbines, and thereafter, the steam is condensed back into the water by cooling it with district heating (DH) water. District heating, as an areal heating system, has been used in several places for over a century [16]. In Finland, DH is the most common heating form for buildings, with a national market share of 46% and over 90% in larger cities. Most new buildings still choose district heating [17]. However, DH has major challenges to achieve carbon emission reductions without increasing production costs [18]. On the other hand, EU-funded research found that large reductions in emissions could be achieved by increasing the use of DH in Europe from 12% to 50% by 2050 [19].
Heat storages have a large potential for reducing emissions of DH systems. Heat storage units, especially hot water tanks, are used to balance the mismatch between heat consumption and production. This can be either short-term hourly balancing or long-term balancing over several months. Heat storages are usually based on sensible heat systems using water as a medium due to the high specific heat capacity of water and the simplicity of design for vessels. There are also other types of heat storages, such as thermochemical storages but this article focuses on hot water storages. Past research has found that smaller heat storages are more profitable when used in conjunction with CHP plants. Small heat storages are suitable for correcting short-term variations in either demand or production and they are especially suitable when combined with volatile electricity prices [20]. Small scale thermal energy storages have also been investigated as part of buildings to improve the utilisation of renewable energy sources. However, they seem to be often unprofitable [21].
In order to tackle seasonal changes in heat demand, a larger storage capacity is required. This is a topic that has raised interest for decades [22]. These storages can store energy for up to several months and help balance seasonal fluctuation of both space heating and domestic hot water. Since the energy content of seasonal heat fluctuation is often large, the storage has to be large as well.
Heat storages can be divided into five different technologies: aquifer thermal energy storages (ATES), borehole thermal energy storages (BTES), cavern thermal energy storages (CTES), pit storages, and water tanks. These technologies are described more closely by Novo et al. in [22]. CTES and water tanks use only water for storing energy and have the highest heat capacity. Water in these storage types can also be stored at a slight overpressure. This increases the usable temperature range to accommodate the temperatures used in DH networks, which are often over 100 °C in existing systems [23].
Large seasonal heat storages have also been found to reduce CO2 emissions in solar collector heated systems, compared to systems without seasonal storages. However, seasonal storages also increased the overall costs of these systems significantly [24]. Tank seasonal storage has been found to be uneconomical due to large investment costs and technological uncertainties [22,25]. Underground thermal energy storages have been found to be technically feasible and one of the most promising ways to reduce challenges from fluctuating building sector heat demand, but their challenge is a large upfront investment [22]. The challenge for implementing novel large-scale storages into energy systems is partly due to company policies. Traditional energy companies might not make investments into novel and risky projects due to profits falling below required rates of return [25]. Major technical challenges related to implementing tank or CTES systems are related to efficiency and finding economical, ecological, and reliable materials [26]. Tank storages are often above ground; hence, heat loss occurs due to differences between outside and storage temperatures. In CTES systems, the surrounding temperature of the rock does not significantly change because of weather but modelling the heat transfer rate from the storage into the surrounding rock can be difficult. However, once the surrounding rock mass has heated up, the heat loss is reduced, and the cumulative heat loss during the operation period is lower, compared to above-ground tank storage [27]. Large seasonal CTES have not been widely researched in connection with MSW incineration.
This paper analyses the technology, costs, and return of large-scale seasonal heat storage in an urban setting with fluctuating head demand and summertime excess heat from MSW incineration. Technical analysis is used to determine the size, technology, and costs for seasonal storage. Economic analysis is used to determine the return of the storage investment. The aim is to discover what is the return of a large-scale seasonal storage investment in a DH system with low-cost excess production in the summer and large heat demand in winter. As a research method, the paper uses simulations of a production system, which has several production units. Simulations are used to determine the most suitable seasonal storage option. The results show that cavern-type seasonal heat storage can be economically feasible in an energy system which has low-cost and low-emission production during the summer months when heating demand is low.
2. Methods and Data
Simulations were made of a production system with several production units to determine the most profitable size of centralised heat storage.
Detailed information and sources for input values are presented in Table A3 (In Appendix A). Here, the key inputs are discussed. The investment of the seasonal storage was estimated based on literature values of excavation, power output, electricity, fixed operation and maintenance costs, and heat losses. The excavation costs were evaluated based on realised costs from several large-scale energy storages from Finland and Sweden. The excavation costs varied between 26 EUR/m3 to 50 EUR/m3. Power output cost represents the cost of acquiring and installing equipment (pumps, pipes, and heat exchangers) capable of a certain charge and discharge power. Power output costs and fixed operation and maintenance costs were evaluated from tank and pit energy storages which use the same technology. Electricity consumption was assumed to be 1% of the thermal energy capacity of the storage for one cycle. Heat losses were assumed to be between 17% and 50%, depending on the scenario. Heat loss values were evaluated based on previous research. To evaluate excavation volume based on energy capacity, a 60 °C temperature difference was assumed for energy capacity calculation.
The energy system was modelled based on an existing system in Vantaa, Finland. In total, 62 one-year simulations with an hourly resolution were used to estimate the size, use, and return of the seasonal heat storage. The return on investment of the storage was estimated from the change of profit (production costs minus sales of heat and electricity) with different storage sizes, compared to the cost of the storage investment.
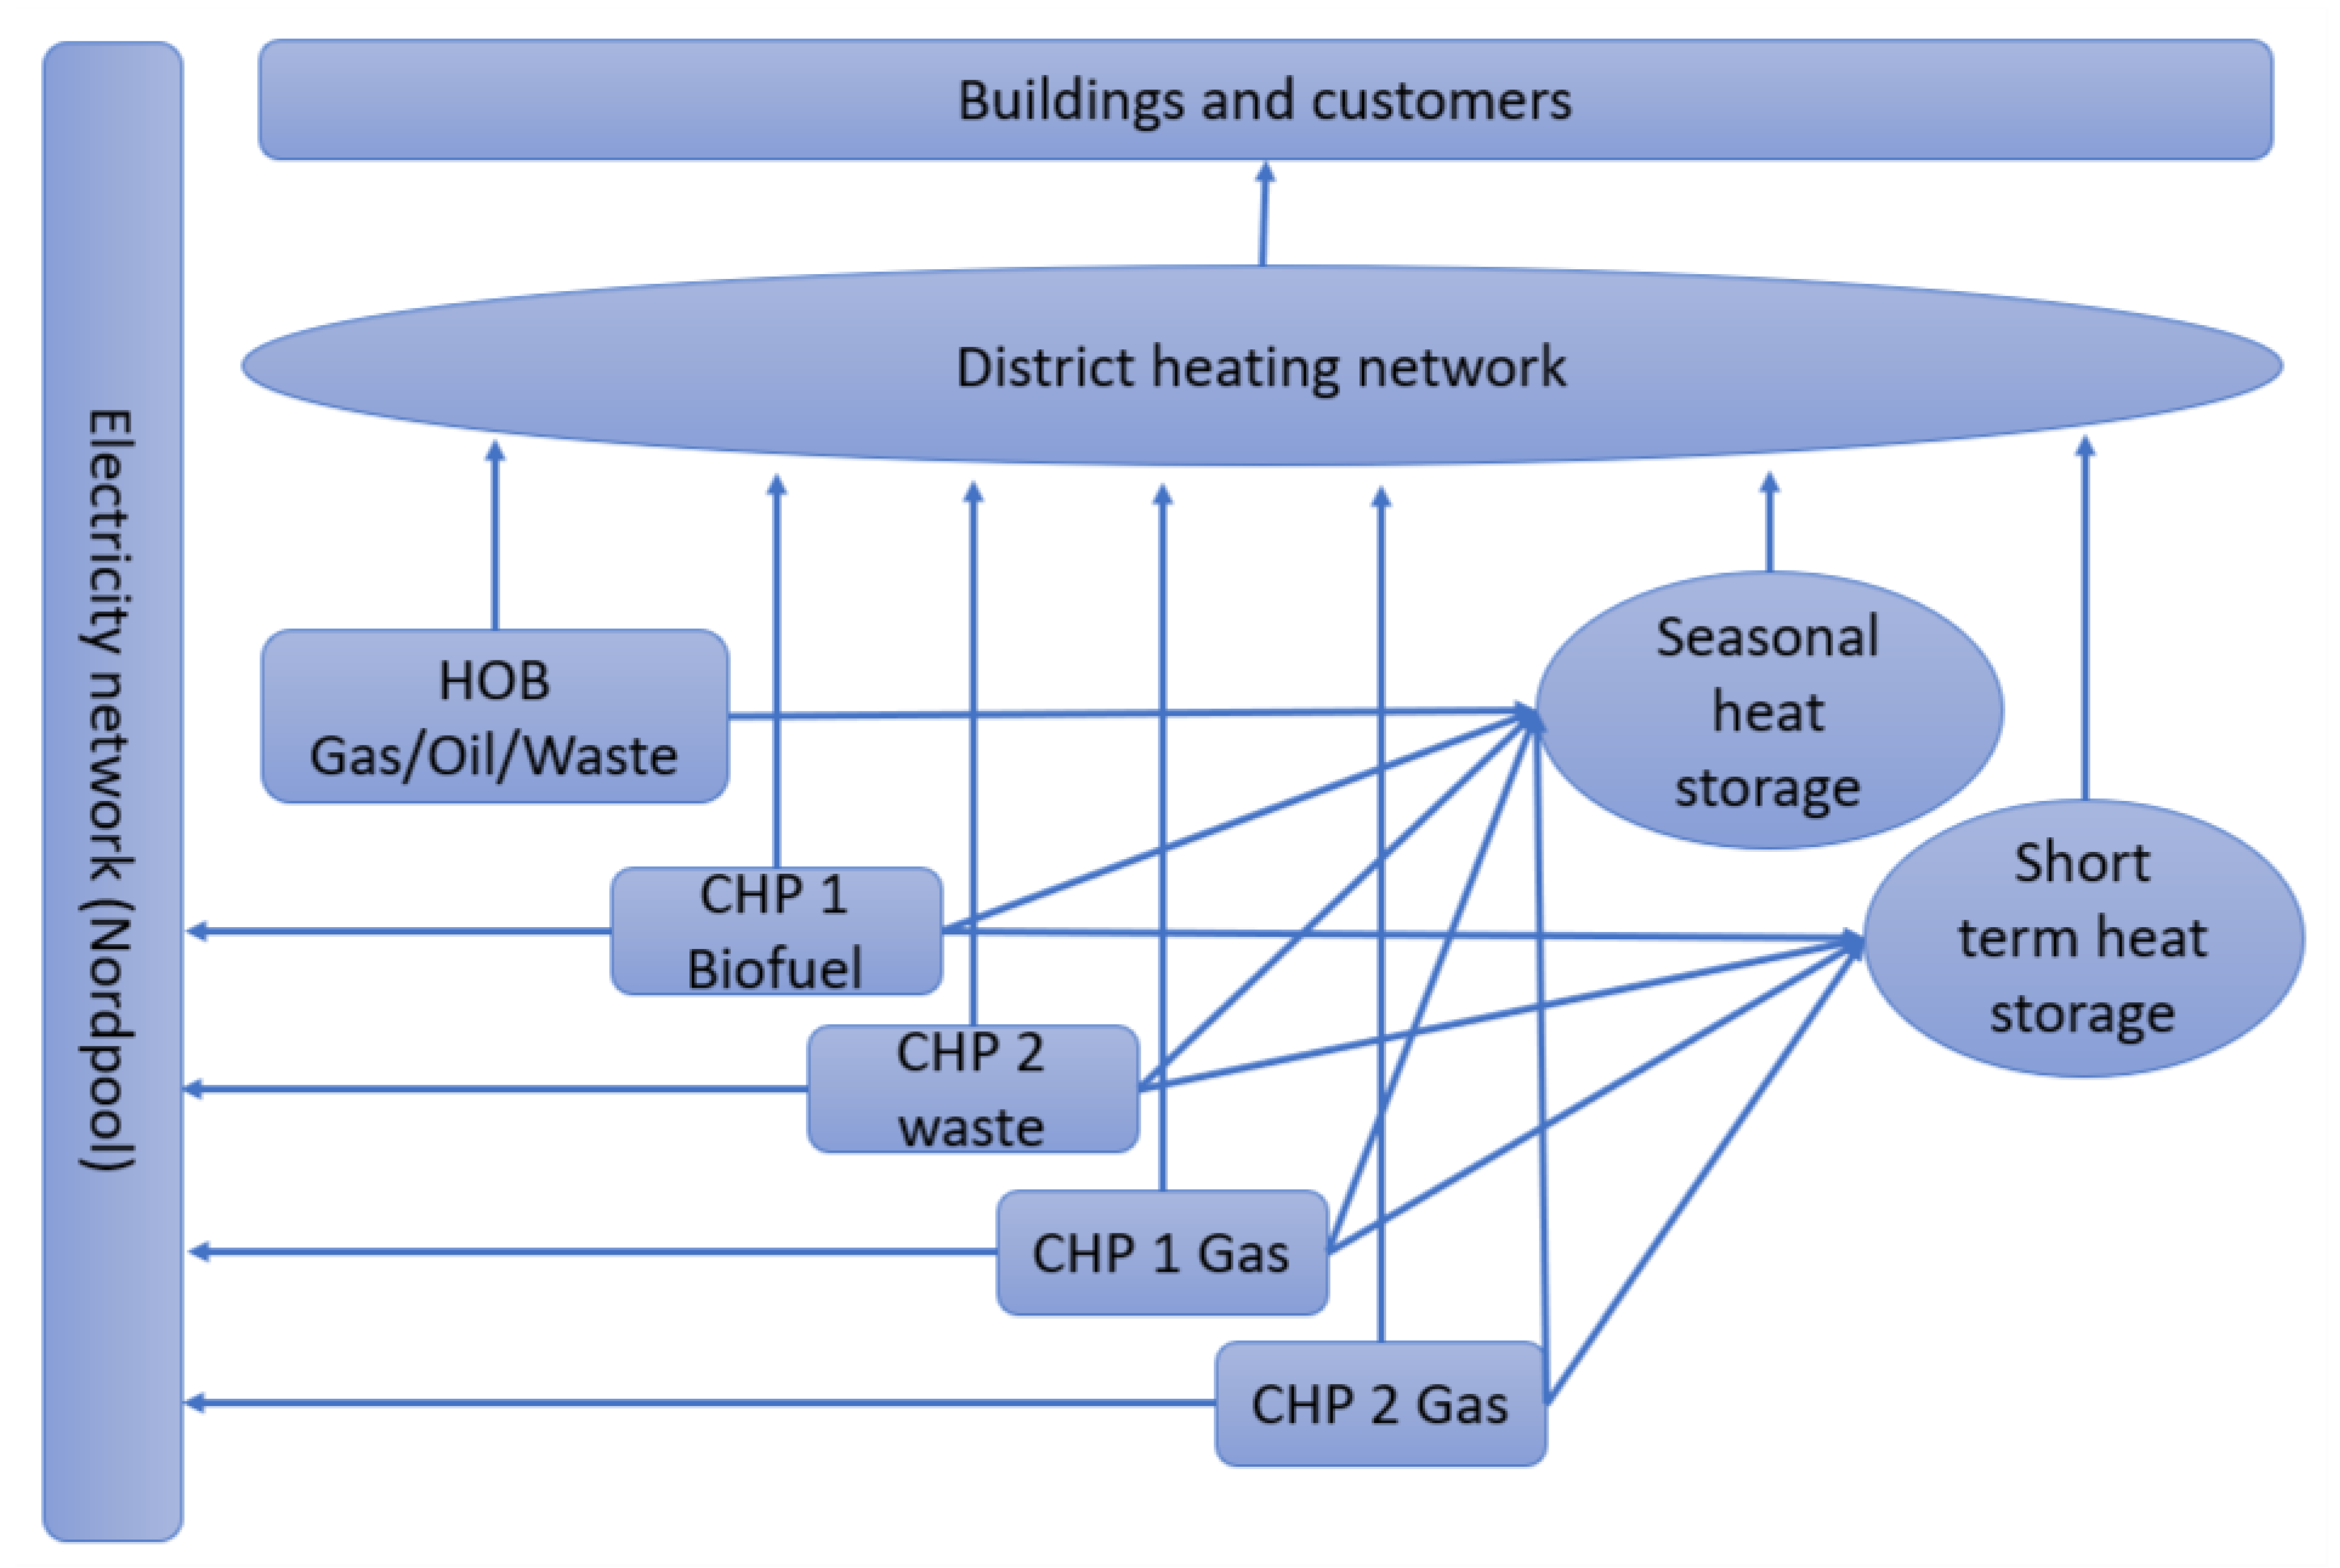
Data included in the paper consist of real production unit data for simulations and energy consumption data of the whole city. A simplified model of the connections between the production units and electricity and heat networks is presented in Figure 1.
The DH system consists of several CHP and heat-only boiler (HOB) units. There are two main power plant sites with two CHP units in each. CHP 1 has a biofuel boiler connected to a steam turbine. CHP 1 also has a gas turbine connected to a heat-recovery steam generator. CHP 2 has two waste incineration boilers connected to one steam turbine. CHP 2 also has a gas turbine connected to a heat-recovery steam generator. The system also has several HOBs which use waste, gas, or light fuel oil as fuel. These units can function as separate units and thus are divided into separate units by fuel use. More detailed information on the production units can be found in Table A1 (Appendix A). The production is divided into base production, intermediate production, and peak production based on production costs. Base production consists of waste incineration (CHP 2 and HOB) and biomass (CHP 1). Intermediate production consists of gas turbines connected to heat-recovery gas generators (CHP 1 gas and CHP 2 gas) due to lower taxation of natural gas use. Peak production consists of HOBs which use natural gas or light fuel oil as fuel. Prices and taxes of the fuels can be seen in Table A2 (Appendix A).
Energy Optima 3 was used to estimate the effect of seasonal storage on the system profitability. Two of the largest district heating companies in Finland use Energy Optima 3 for their production planning. The program is also used to assess the impact on the profitability of new production units over different time horizons [28]. Kontu et al. used the program to assess the change-in-fuel use when large-scale demand-side management of heat customers was implemented. The program automatically runs a total optimisation, which includes electricity production and district heating production. The program decides the merit order of the production plants to reduce production cost by using technical, financial, and external parameters of the system [29]. The prices and taxes used in the optimisations are displayed in Table A2. Hourly electricity market price from Nordpool from 2019 was used in the optimisations [30]. Energy Optima 3 was used to calculate the annual cost of heat production and revenue for electricity sales based on the constraints of the system. Mainly, these are heat consumption, fuel costs and capacity constraints of energy production facilities. As the seasonal heat storage is added to the model, the program charges the storage with affordable energy during times of low energy consumption because later in the year consumption will grow based on heat consumption forecast. Since the seasonal storage displaces costly fossil energy production in the winter, production costs decrease, and system revenue increases.
2.1. Input Values
The input values for the optimisations can be found in Table A1 and Table A2 (Appendix A). In Table A1, the technical values of production units and the characteristics of the network are listed. The hourly heat load data are actual data from a DH system in Vantaa, Finland from the year 2019. Network losses were 6% in total for the entire year and were assumed to stay the same in all optimisations. In Table A2, the prices of fuels and sales prices of DH are presented. Fuel prices and emissions factors used in the simulations are from Statistics Finland, and taxation and subsidies for fuels are ones used in Finland in 2019. Input values used for assessing the costs of the seasonal storage are presented in Table A3. Emissions from the construction of the seasonal storage were not estimated.
2.2. Heat Demand and Temperatures
Heat power demand in the analysed system varied between 48 MW and 634 MW during the analysed year, whereas energy consumption was 1811 GWh. The temperatures used in the DH system depend largely on the weather conditions and the functionality of the substations in buildings. Due to older buildings and substations network temperatures have to be high during freezing temperatures. According to Finnish Energy, the network temperatures in DH typically vary between 65 °C to 115 °C during the year, 120 °C being the rated maximum temperature of the network [31]. These systems are still using quite high temperatures and would be categorised as third-generation DH networks, according to Lund et al. The temperatures in the third-generation networks are often below 100 °C but can be as high as 120 °C in the winter season [23].
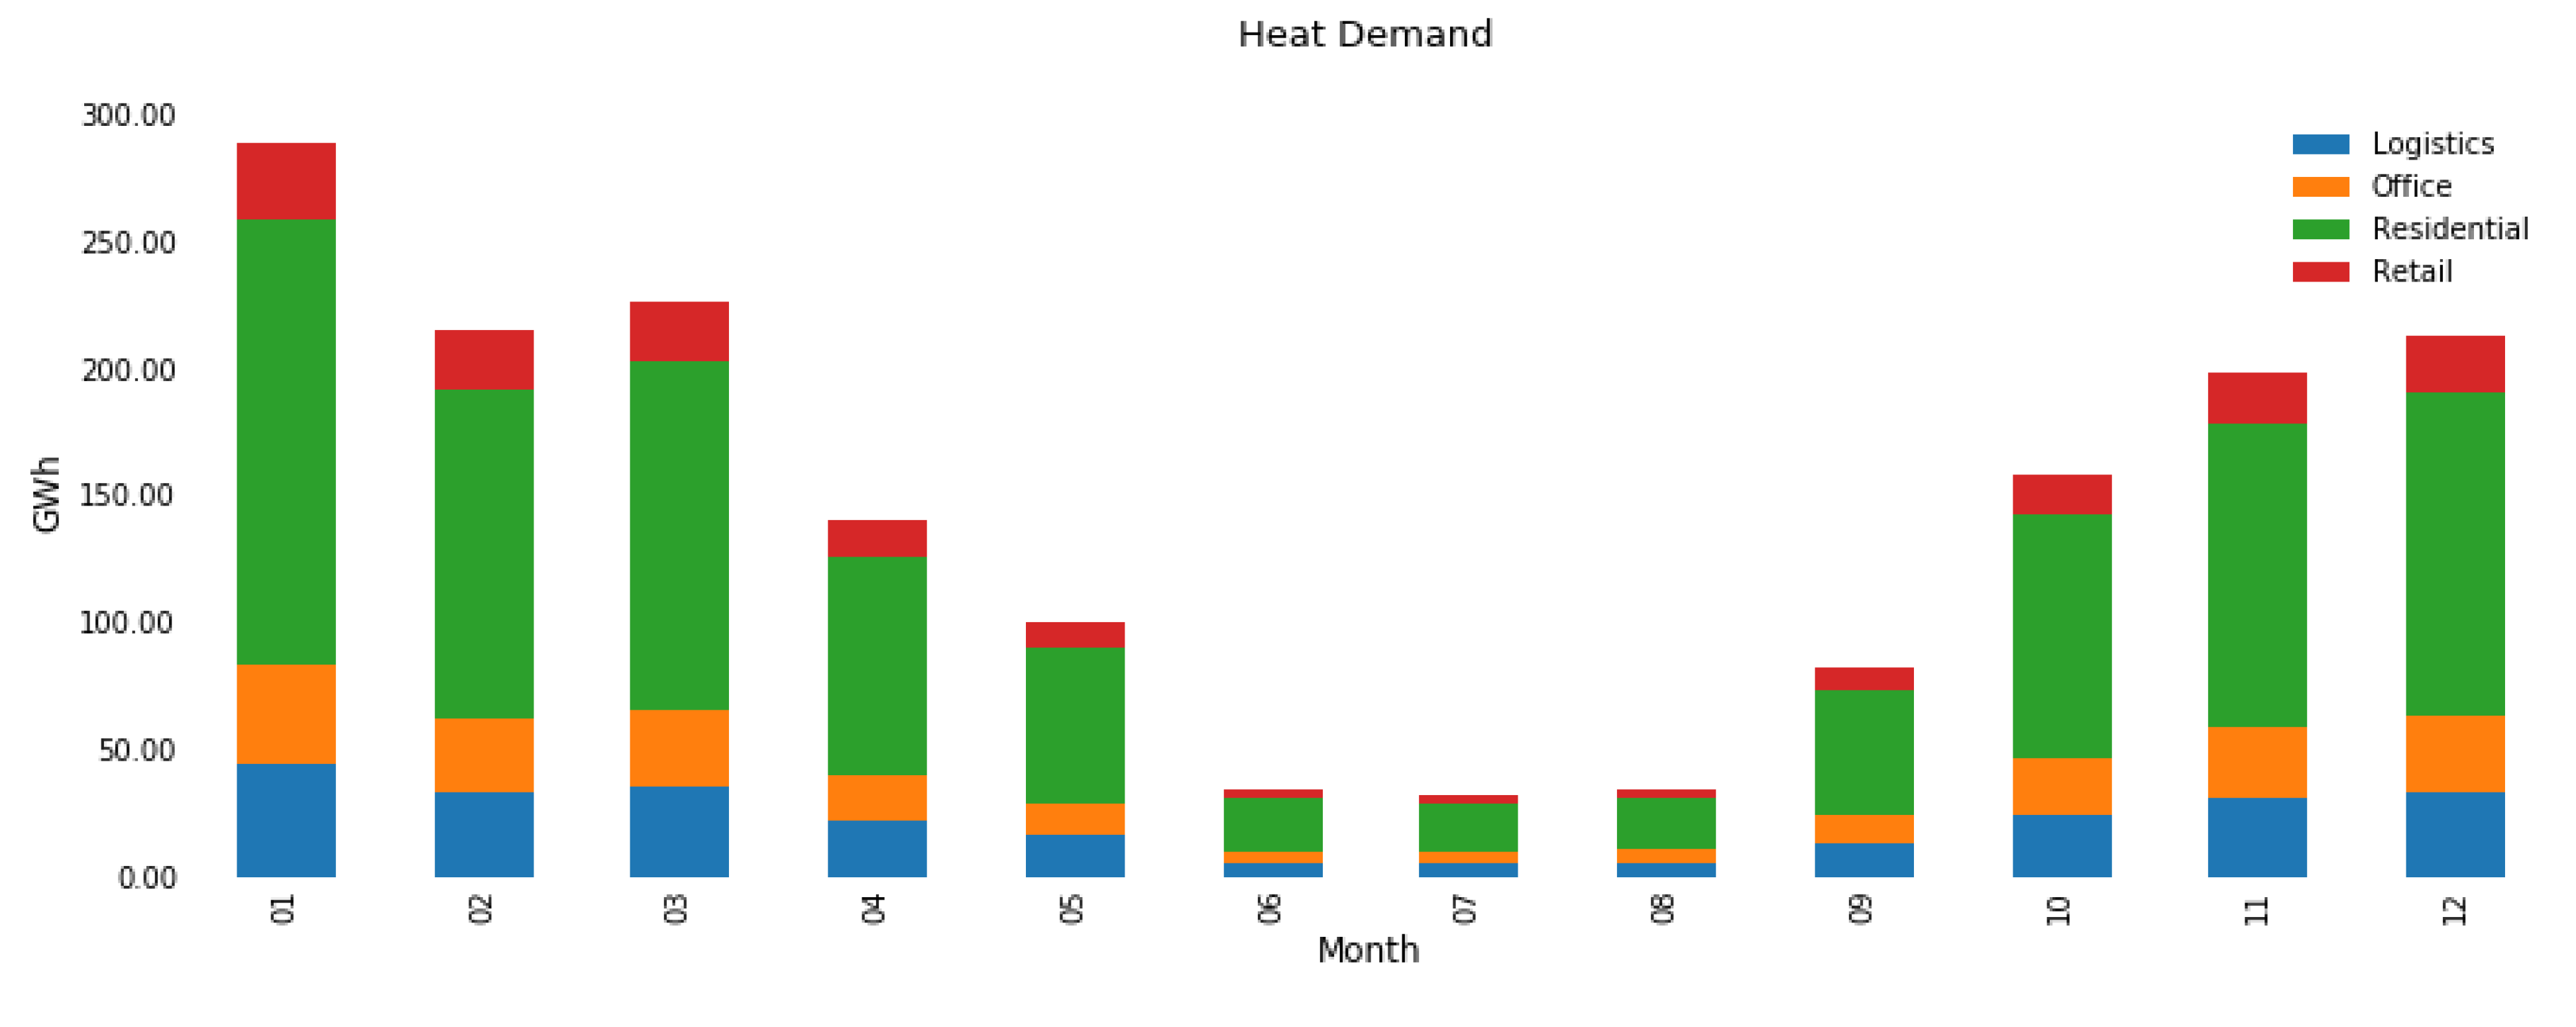
The heat demand of a DH system stems from the need of the built environment. Space heating dominates over domestic hot water (DHW) heating in the Nordic countries. Heat demand is usually far greater in the wintertime, compared to summer, since heating during the summer months, the heat demand consists only of DWH heating. In Figure 2, a representation of heat consumption in the analysed system is shown per month for different building types.
There are 4930 substations in the heating system of the analysed city. Typically, one substation serves the heating demand of one building. Some large industrial buildings or shopping centres can have several substations. Most (78%) of these substations supply energy to residential buildings. Substations for offices and logistics buildings each account for approximately 9% of the substations. The rest are retail building substations. Overall, the analysed city has approximately 230,000 inhabitants.
2.3. Seasonal Storage
Different technologies can be used for seasonal storage. These technologies were shortly described in the introduction. For purposes of this article, a cavern seasonal storage is considered. This stems from the needed temperature range and sheer size of the storage. Due to high temperatures, water has to be used as a storage medium. CTES is more favourable to use in an urban heating system due to the high price of land since building a CTES does not limit the use of the land above for other purposes.
The data used for evaluating the costs of the seasonal storage consisted of excavation costs, power output costs, electricity usage, operation and maintenance costs, and heat losses. These values are listed in Table A3 (Appendix A). The effect of heat losses was taken into account as a need for larger storage; therefore, a certain energy capacity could be achieved, i.e., if heat losses are 10%, the capacity (volume) has to be 10% larger to accommodate for this loss.
Cavern-type energy storages are suitable for high-temperature waste storage and are capable to produce high charging and discharging power which is important in a city-wide energy system, especially in the winter, in order to avoid more pollution resulting from heat production by natural gas boilers. The storage consists of a cavern excavated in a stable rock which is filled with water. The storage is connected to the DH system by a heat exchanger and a pumping station. As the storage is charged, water from the bottom of the storage is heated up by supply water of the DH system and pumped to the top of the storage for better stratification. The cooled DH supply water is pumped into the return pipe of the DH system. When the storage is discharged, the process is reversed and hot water from the top part of the storage device heats return water from the DH system which is then pumped into the supply pipe.
To demonstrate theoretically why building certain tank-type seasonal storages are challenging in an urban system, one can consider the typical building in the studied system. A common district heated building in Finland is a residential building from the 1970s with a size of approximately 2000 square meters which would have an annual energy consumption of approximately 300 MWh, of which 270 MWh would be consumed outside of the summer season (June–August) [32]. If a heat capacity of 80 kWh/m3 [22] is assumed for heat storage, a single building would require storage of 3380 cubic meters which would be approximately half of the volume of the building itself. Storage of this size serving only one building would be difficult to implement economically in an urban setting, where space is scarce. According to Schmidt et al. (2004), the investment cost per cubic meter of energy storage decreases significantly as the storage size increases. Seasonal storage of 3380 cubic meters would cost between EUR 0.3 M and EUR 0.7 M [33]. This makes distributed seasonal storages difficult to build profitably.
The heat losses of the seasonal storage are difficult to estimate due to multiple factors affecting heat loss in a certain area. Heat loss is also reduced rapidly after a few years of use of a CTES as the surrounding rock mass is heated up. Heat losses are likely to be smaller over time than the one used in this paper. For example, in the Lyckebo storage, heat losses were recorded to be 26% of heat production [34].
Heat storages between 20 GWh and 650 GWh were analysed. Different storage capacities were optimised with 10 GWh increments until 100 GWh and after in 50 GWh increments. Three different charge and discharge powers were also analysed for all storage capacities: 100 MW, 200 MW, and 300 MW.
2.4. Economic Analysis
The return on investment (ROI), payback period (PP), and internal rate of return (IRR) are used for evaluating the investment. The following equations are used for ROI, PP, and IRR:
where n is the total number of years (investment life cycle), i is the number of the year, and CF is the net cash flow for the year. ROI is a simple calculation measuring the relative return (%) of the investment based on the first year’s net cash flow. PP is used to calculate the number of years for the investment to repay the original investment cost, based on the first year’s net cash flow. IRR is the annual rate of return for the investment’s life cycle in which the investment’s net present value is zero. It is compared to an investor’s discount rate in which investments with an IRR over the investor’s discount rate should be undertaken. A life cycle of 50 years was used for seasonal storage. OPEX and revenue from heat sales were assumed to increase 2% per annum. A long lifecycle is assumed since the majority of the investment is for the excavation of the cavern which is very long lasting, and caverns have been used successfully for decades as energy storage [35]. The increase in revenue from heat sales and OPEX costs is an estimate based on a long-term inflation goal of 2% which energy prices are assumed to follow.
3. Results
Results are presented in the following subsections for the investment size and components of the seasonal storage, return of the investment, and impact on system emissions. Overall, 62 one-year simulations with a resolution of one hour were run for the production system to discover the seasonal storage that had the highest return on investment.
3.1. Results of Simulations for Seasonal Storage
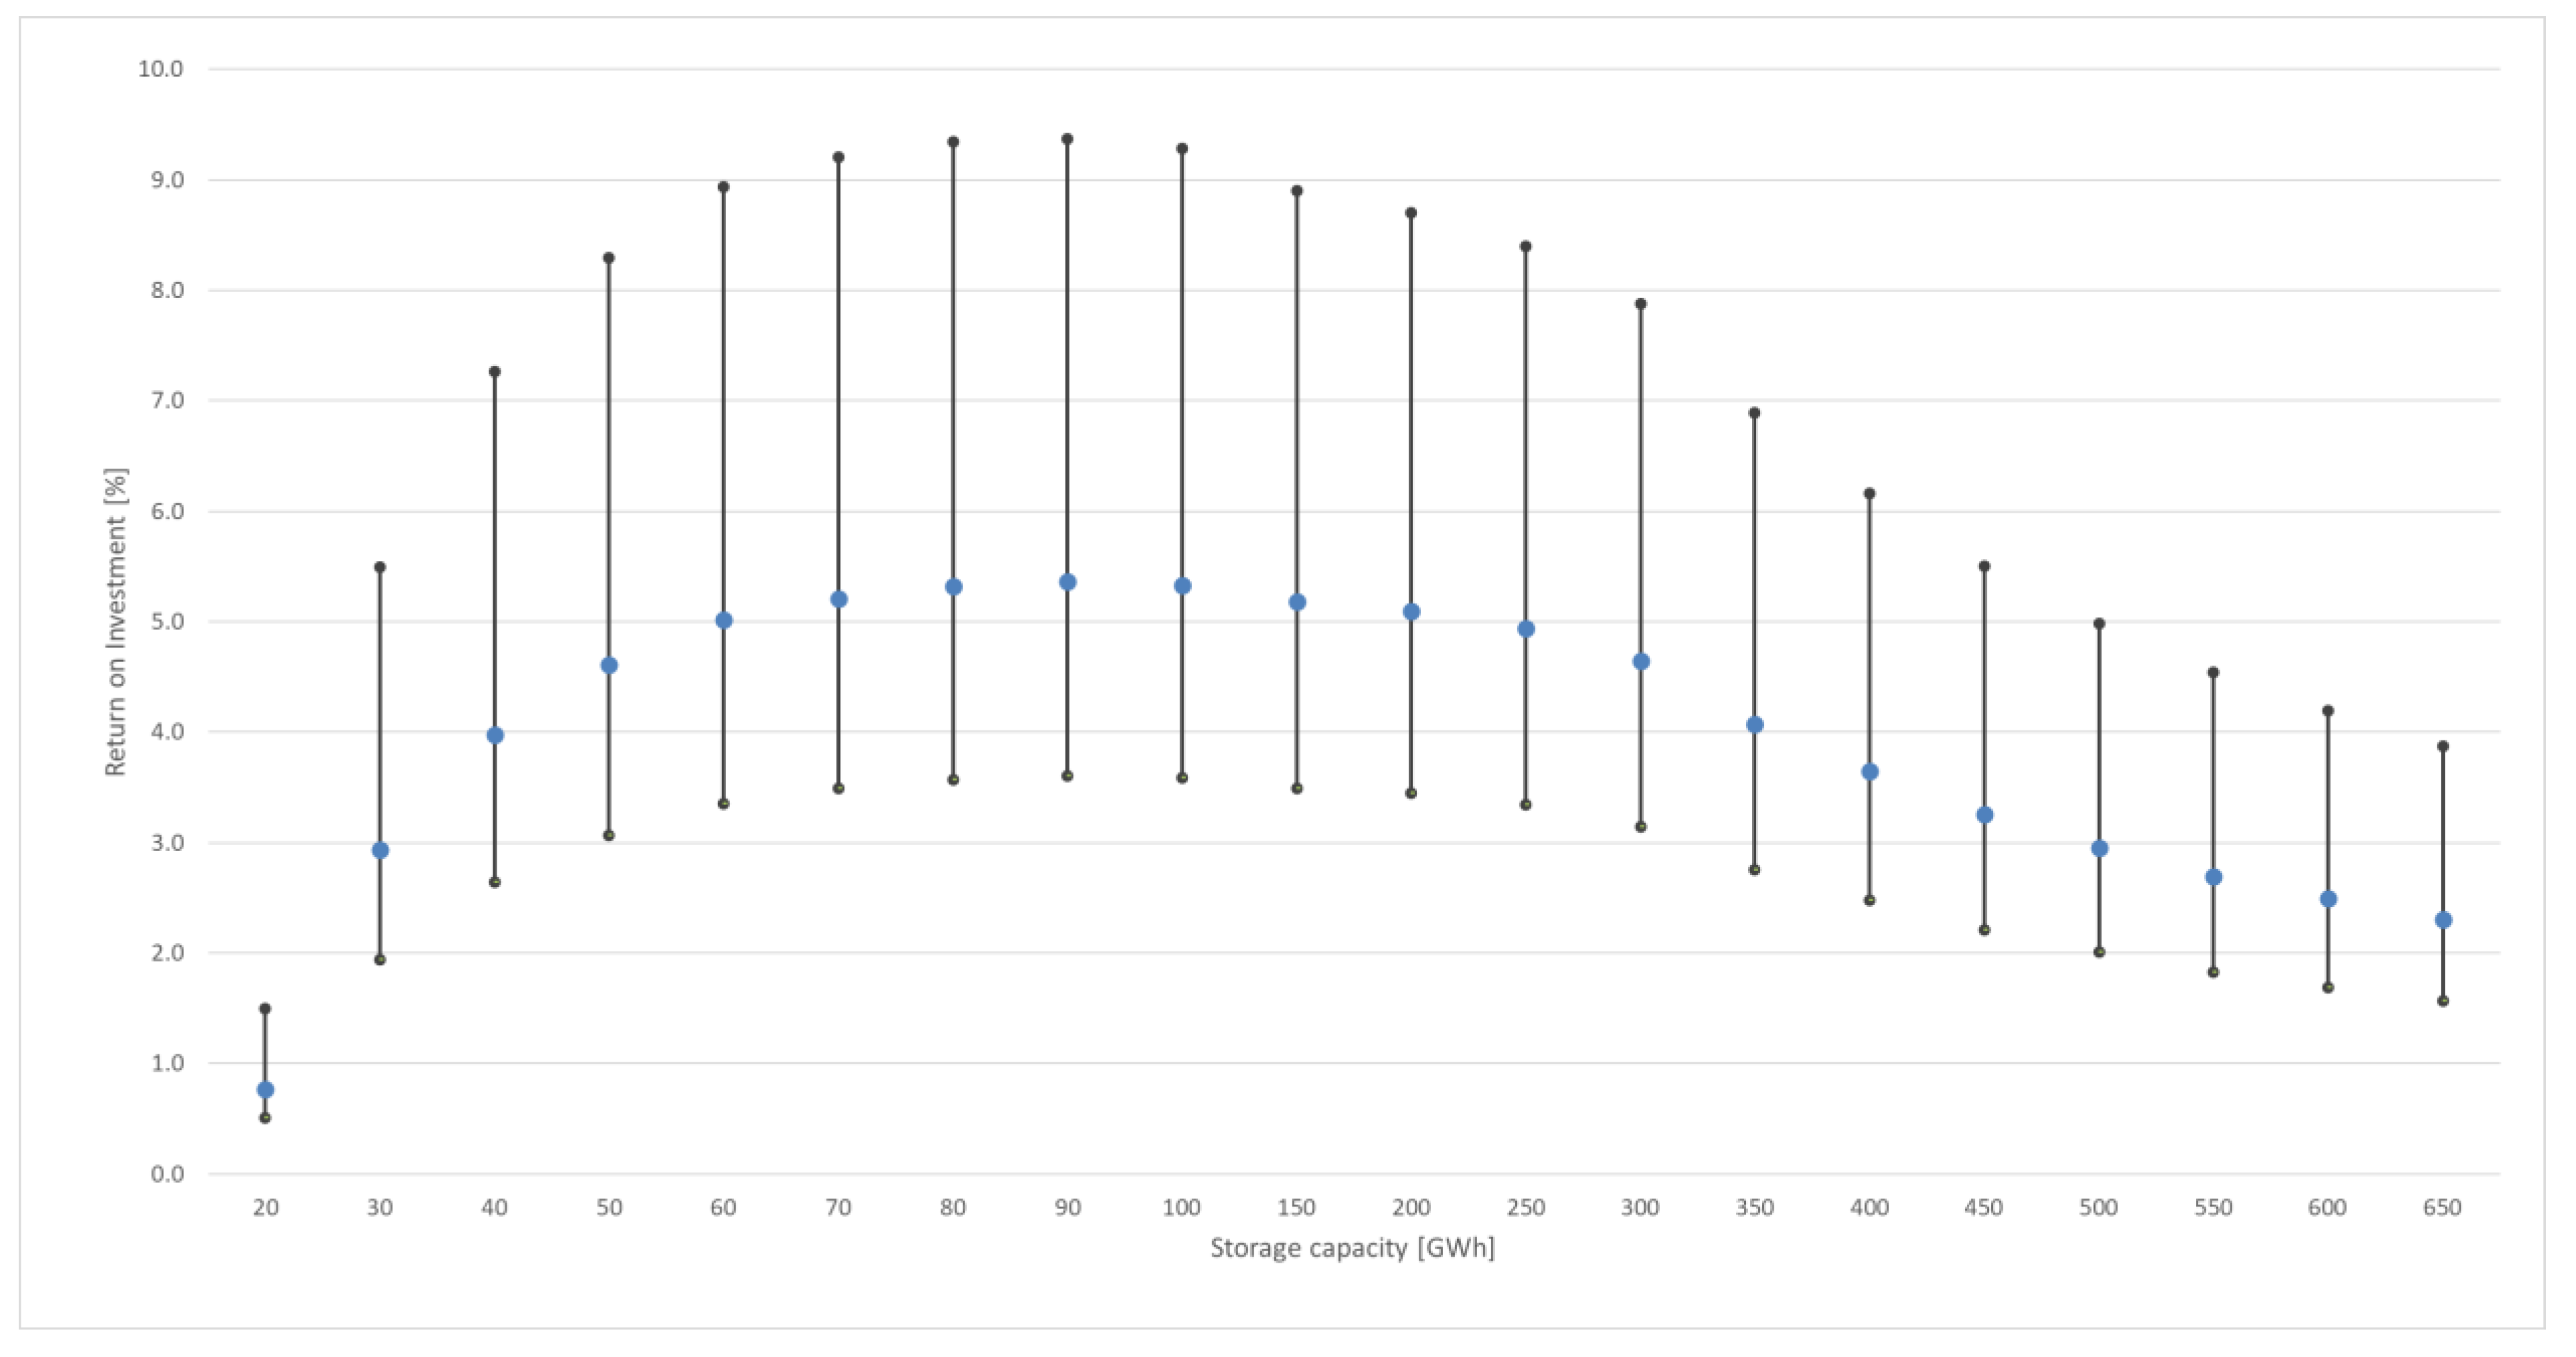
Return on investment was calculated from the improvement of the system income divided by the investment into the seasonal storage. The highest return was found for storage with a 200 MW charge and discharge power and 90 GWh capacity.
Values for all of the storages with 200 MW charge and discharge power are presented in Figure 3. Three different scenarios were formed based on cost estimations (minimum, average, maximum) of implementing the seasonal storage. The upper side of the range represents return when minimum costs are applied to investment components. The lower side of the range represents returns when maximum costs are applied. The blue dot represents average costs for investment components. For example, return on investment for the 90 GWh and 200 MW storage ranges between 3.6% and 9.4%. When average costs for investment components are used, the return on investment is 5.4%.
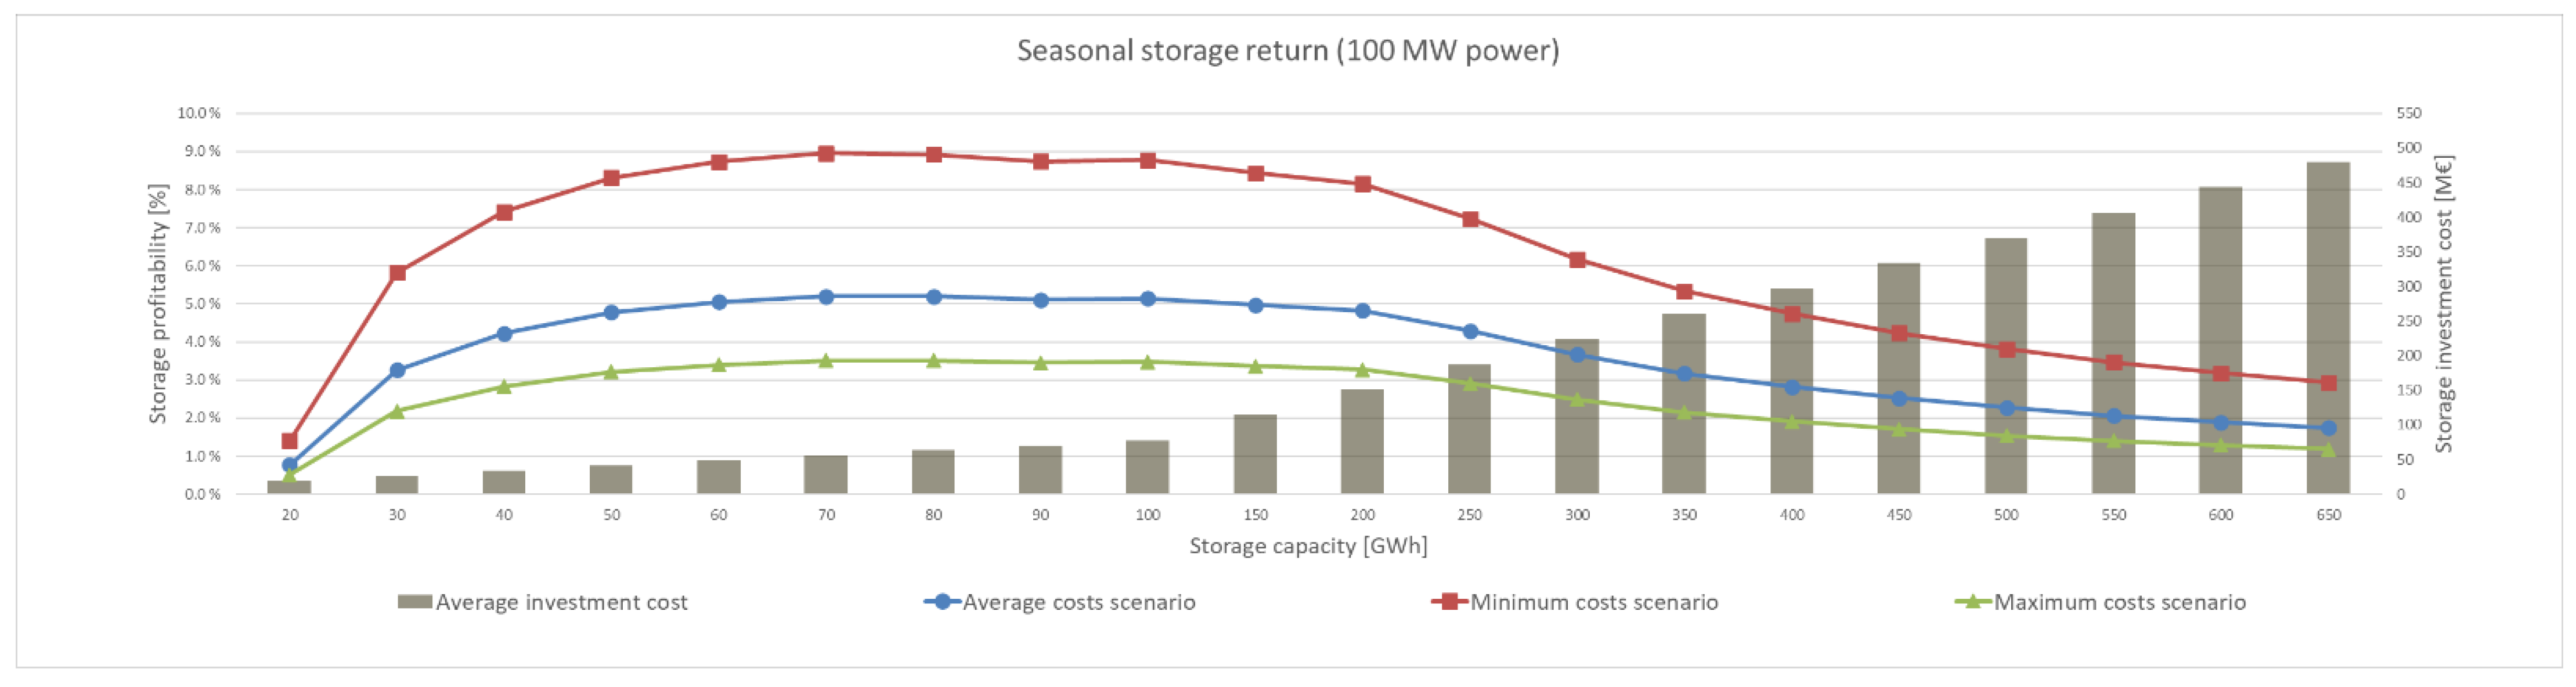
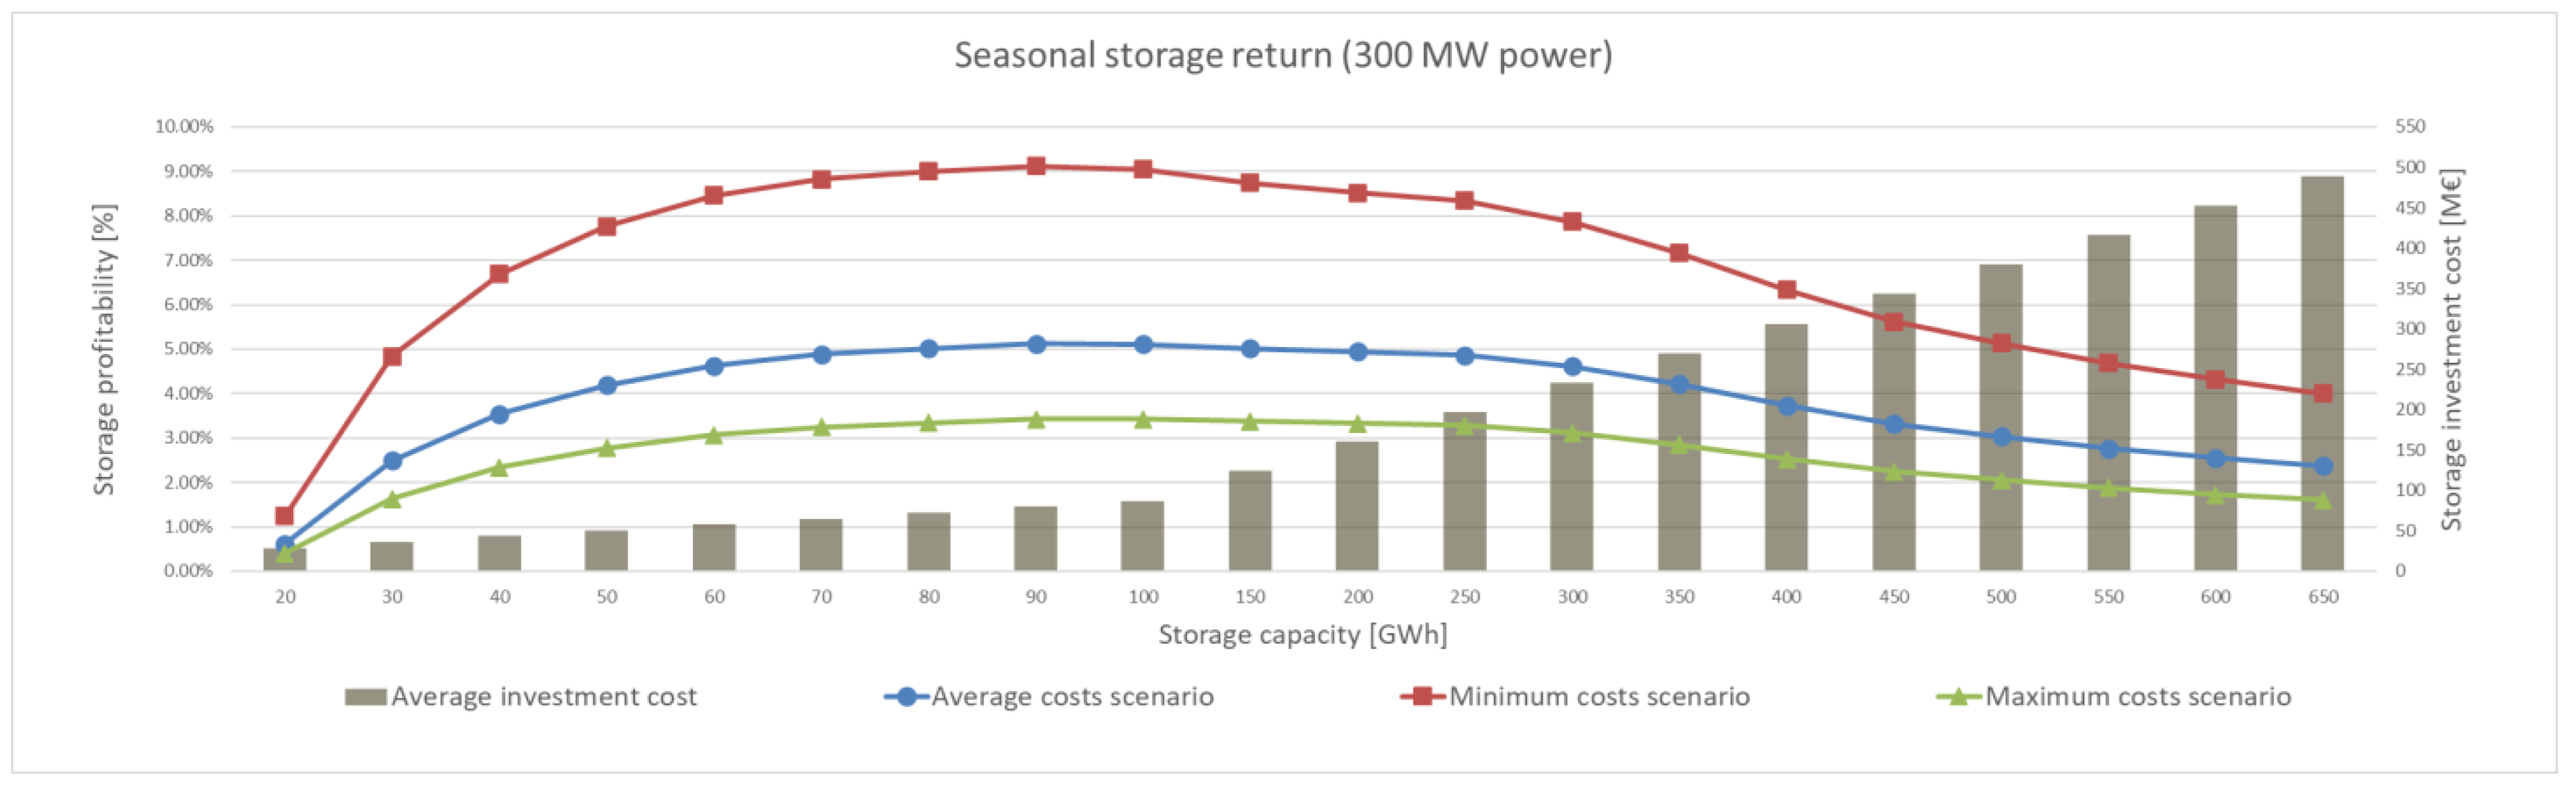
Figures for return and investment storages with 100 MW and 300 MW charge and discharge power can be found in Figure A1 and Figure A2 (Appendix A). The difference in return is not significant between storages with different charge and discharge powers. For the 90 GWh and 100 MW storage, the return is between 3.4% and 8.7%; the most profitable capacity for this power is 70 GWh, with a return between 3.5% and 8.9%. For the 300 MW power storage, the most profitable capacity is 90 GWh, with returns ranging between 3.4% and 9.1%. For the same investment (90 GWh, 200 MW), the payback period is 14.5 years, and IRR is 8.6%. These values should be examined within the context of the investment life cycle that is very long. From a risk perspective, the investor has to examine whether the full technical potential of the storage can be used over this long life cycle. The weighted average cost of capital (WACC) of energy investments in Finland is 6–7% according to a DiaCore report [36].
3.2. Investment Costs
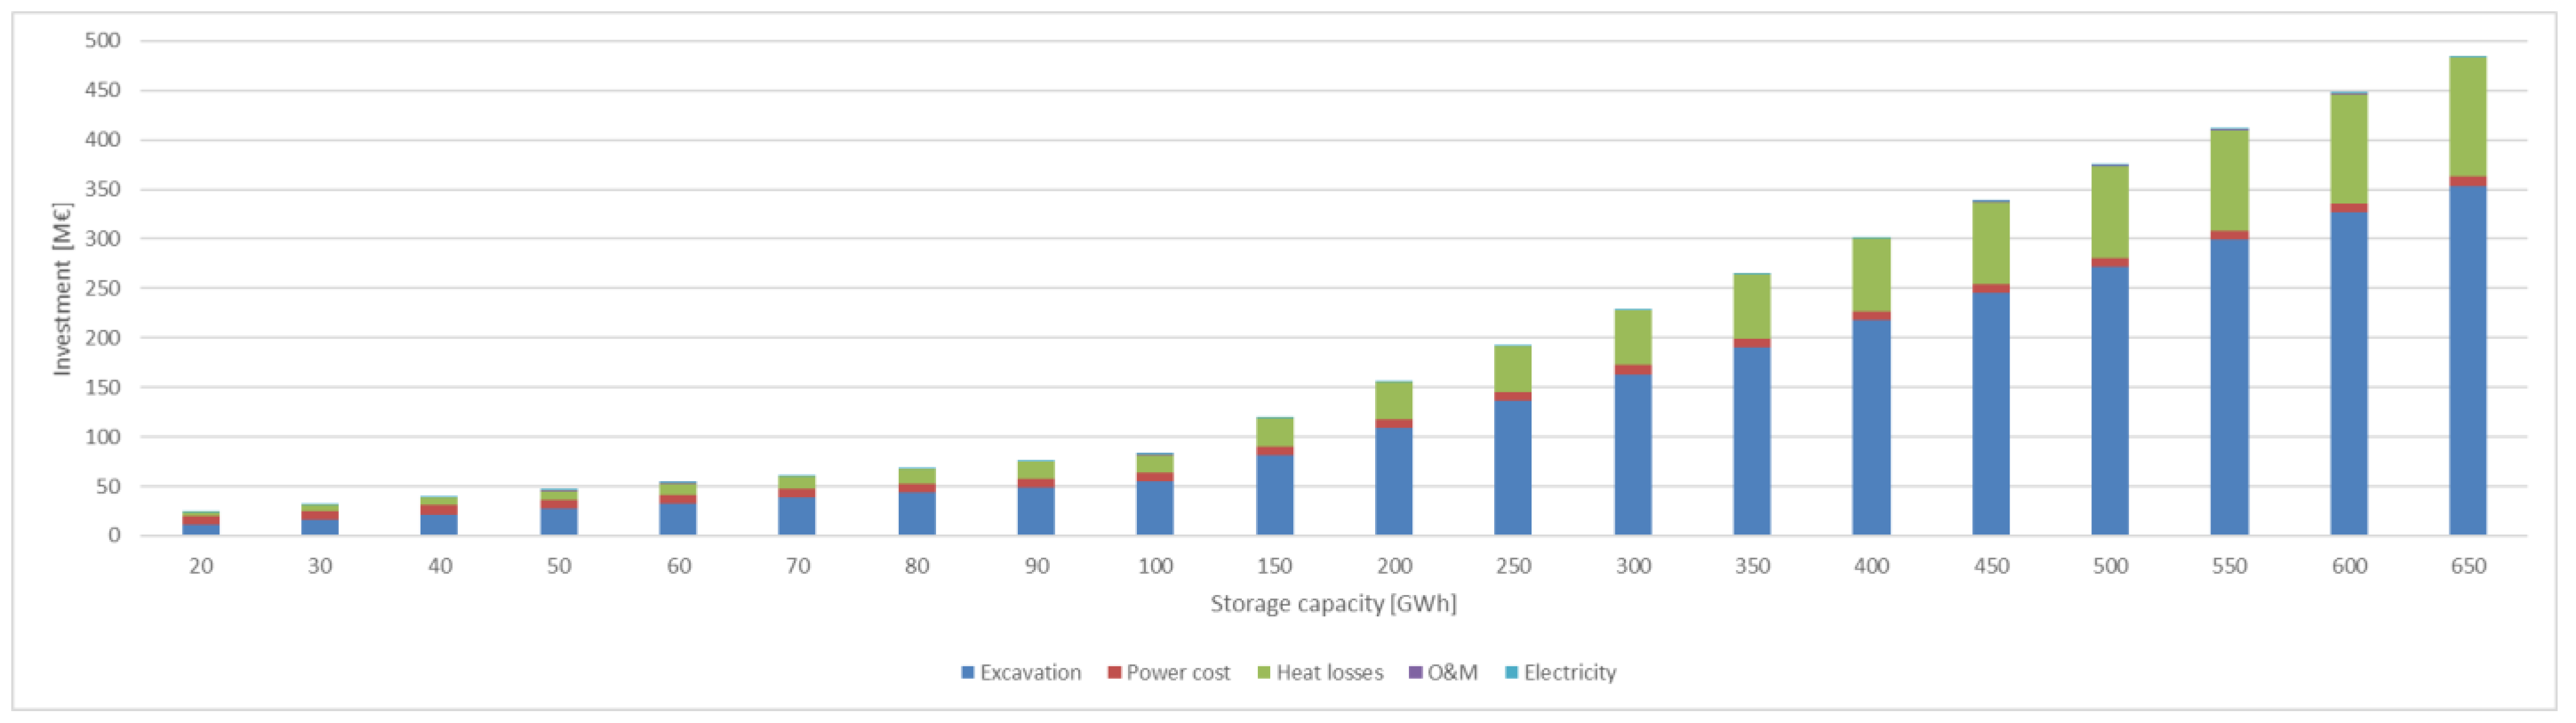
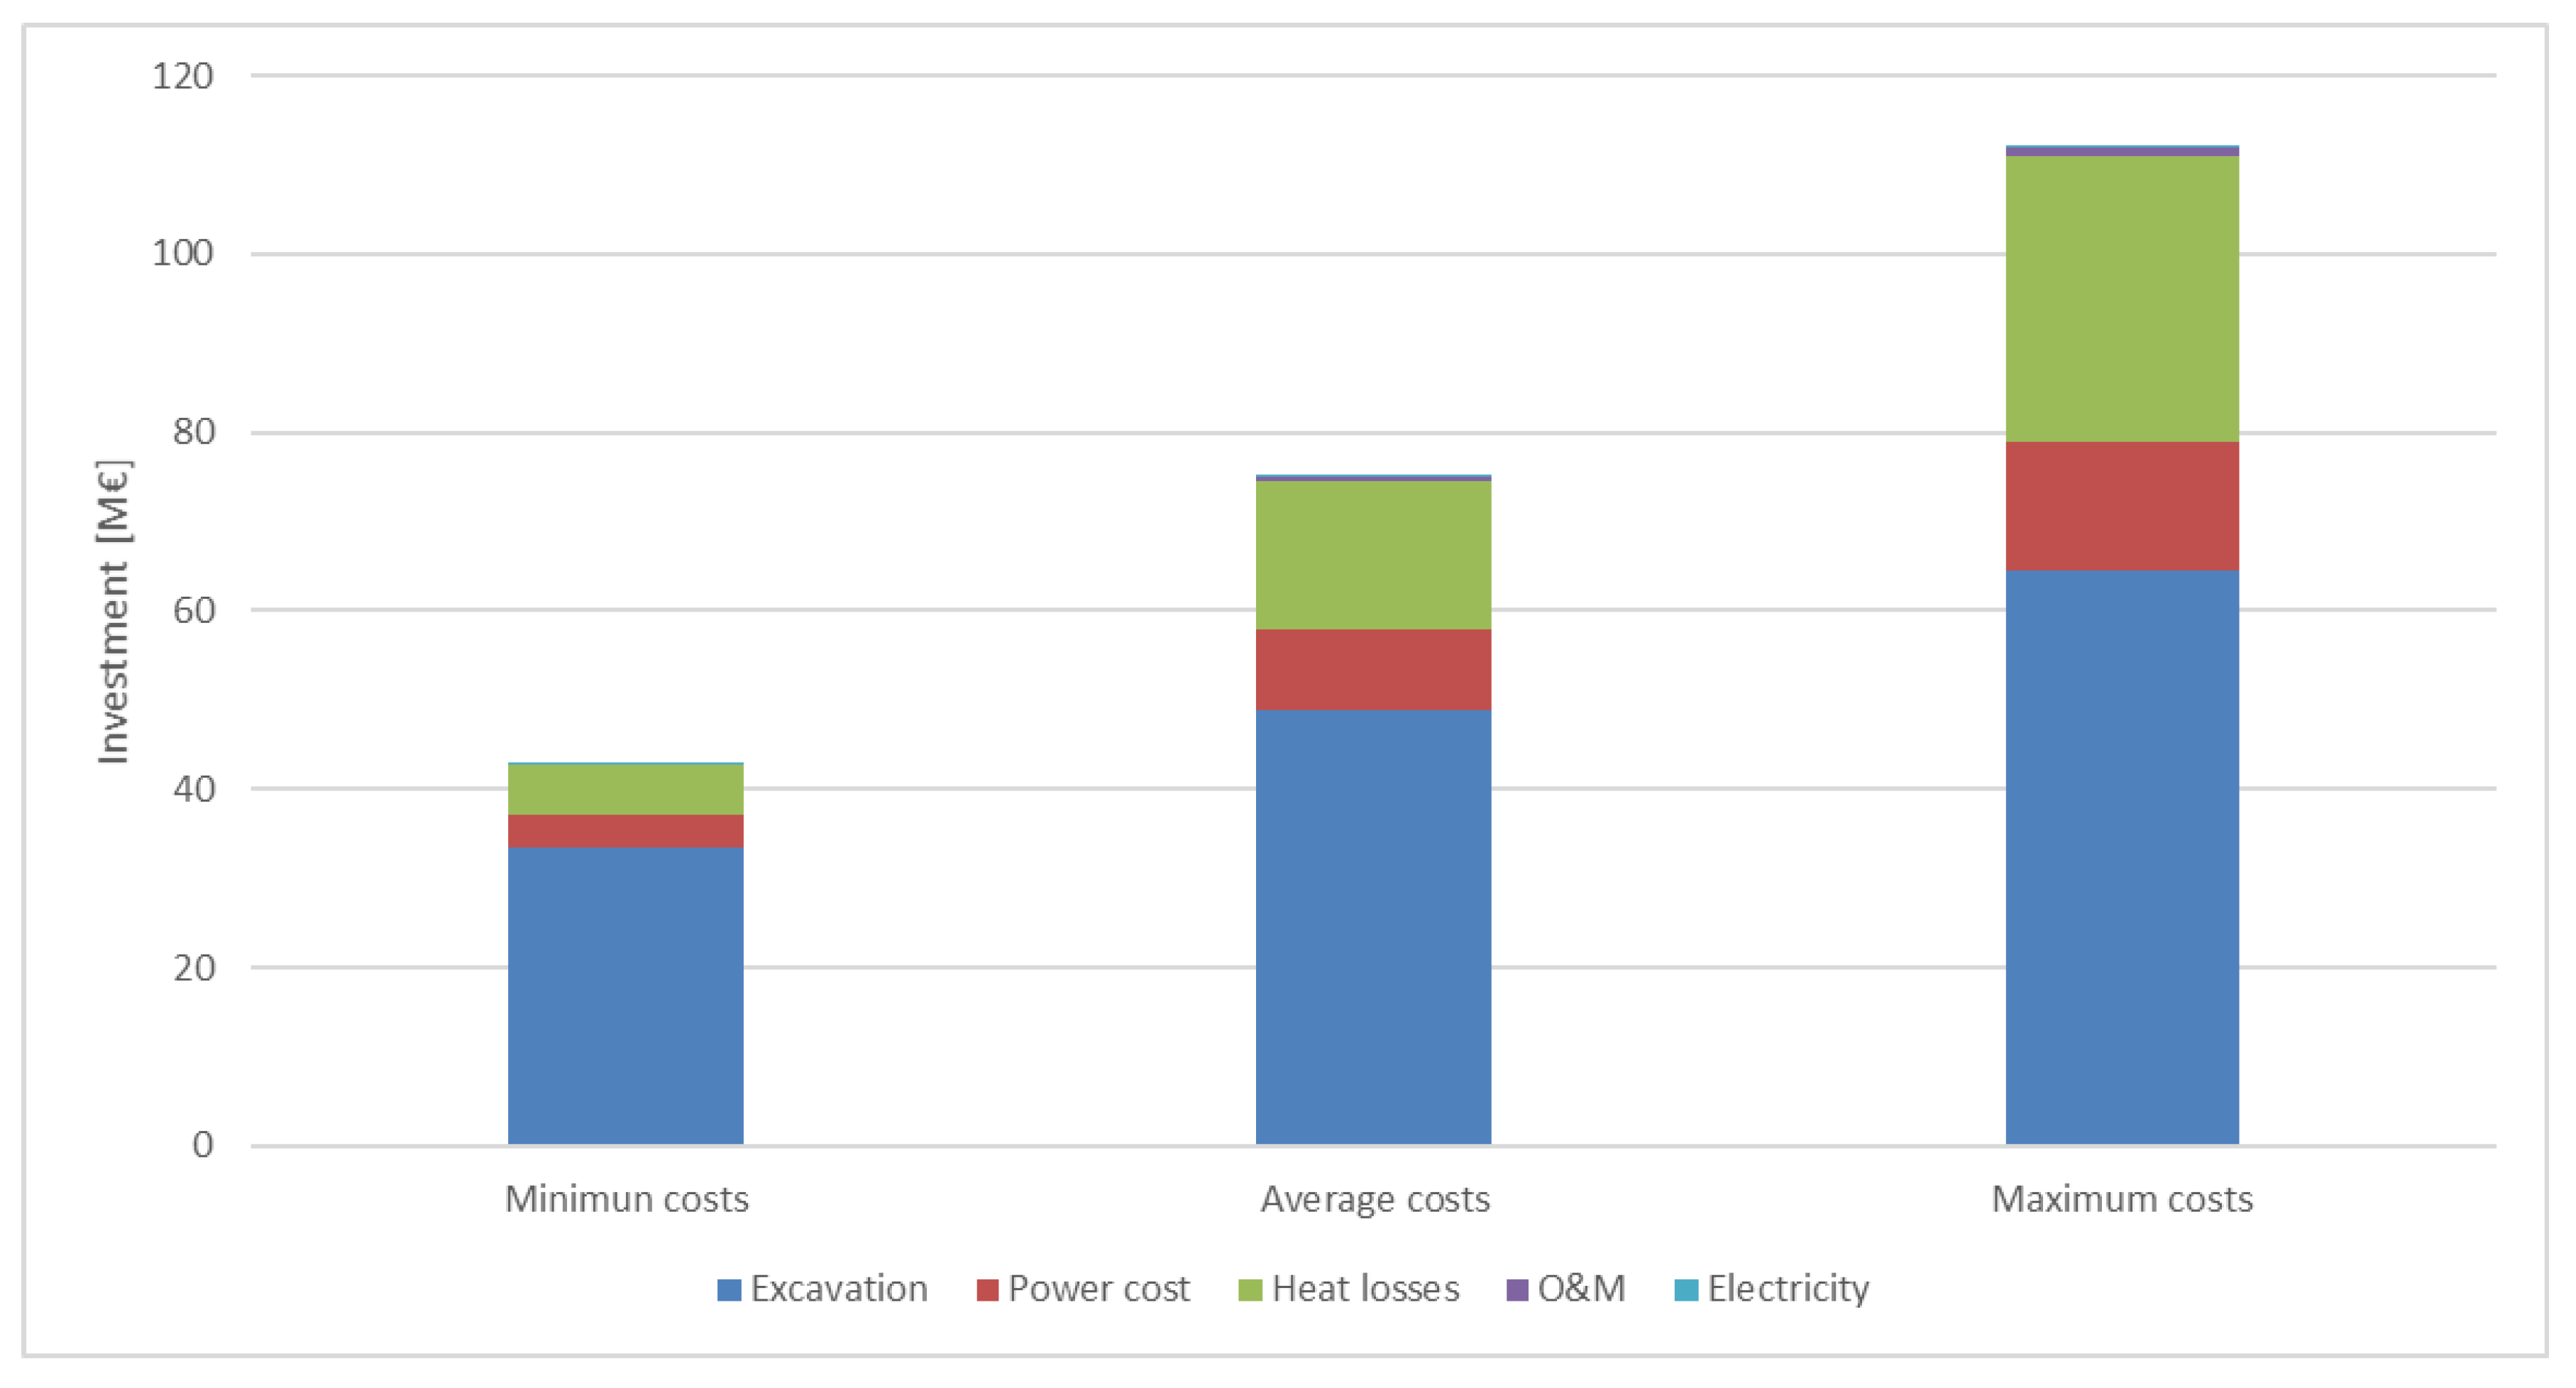
Investment for the seasonal storage consists of excavation costs, charge and discharge power costs, heat losses, fixed operation and maintenance costs, and electricity costs. Breakdown of these costs can be seen in Figure 4 for 200 MW storages, using average costs for the components.
As can be seen, the largest costs during one year of operation come from excavation and heat losses. In the smallest 20 GWh storage, the share of excavation and heat losses out of the whole investment is 62%, while charge and discharge power costs, fixed operation and maintenance costs, and electricity costs account for the remaining 38%. When the size of the storage is increased, the share of costs from excavation and heat losses increases rapidly. In the 90 GWh storage, this share is 87%, and in the largest 650 GWh storage, it is almost 98% of the total investment. The investment with different cost scenarios for 90 GWh and 200 MW storage can be seen in Figure 5.
3.3. Impact on Fuel Use and Emissions
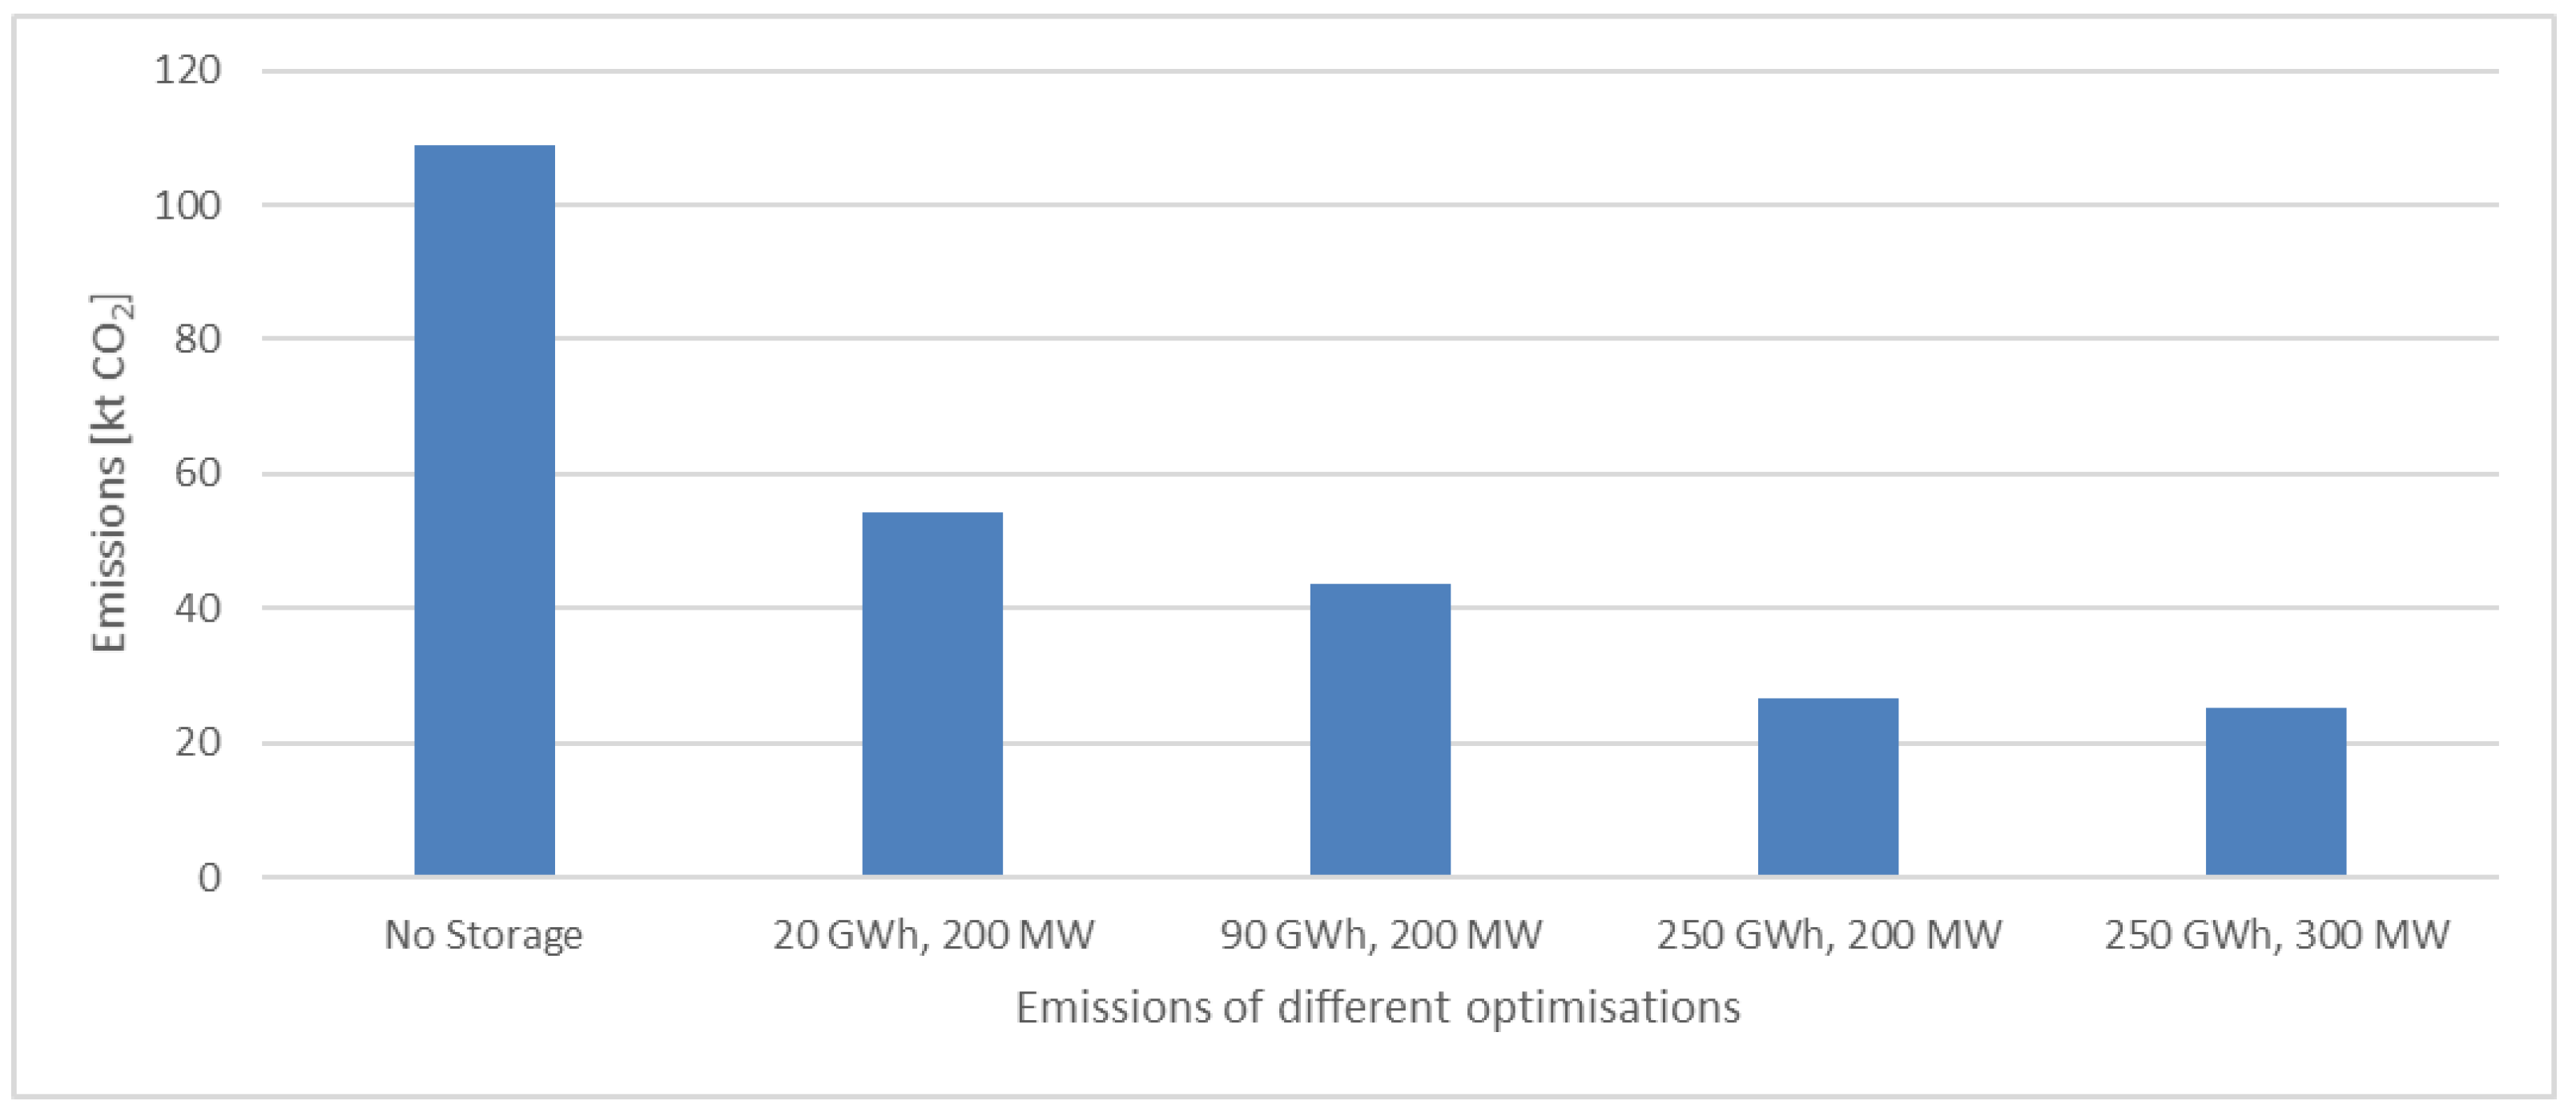
The optimisation runs production units according to the cost of production and the price of heat and electricity. Therefore, there is a large impact on emissions when cheaper and cleaner production can be shifted from low to high consumption. The impact on system emissions can be seen in Figure 6 for 20 GWh, 90 GWh, and 250 GWh storage implementation with varying power.
The size of the storage affects the emissions reduction favourably. Already with the smallest storage, the system emissions are reduced by 50%. However, the cost efficiency of the emission reduction rate declines as the storage capacity grows. The lowest emissions for 200 MW storage simulations are recorded with a storage of 250 GWh capacity (26.5 kilotons CO2). However, the CO2 emissions fall from the 90 GWh storage by 17 kilotons or 39%, whereas the investment more than doubles from EUR 75.2 M to EUR 192.2 M, according to average costs. Interestingly, following the average cost return line (in Figure 3), the 250 GWh storage does not fall far behind the 90 GWh storage, having a return of 4.9%, compared to 5.4% of the 90 GWh storage. From all the simulations, the lowest emissions are recorded as 25.2 kilotons for a 250 GWh storage with 300 MW power. The return of this storage is also 4.9% with an investment of EUR 196 M with average costs.
4. Discussion and Conclusions
Expansion of waste incineration and waste heat production leads to excess heat production during summer when heat consumption is lowest. Energy storage is needed to utilise these energy sources fully. Technology, capacity, and return on investment of a seasonal heat storage unit were analysed in this paper.
The results show that investments into large centralised seasonal cavern thermal energy storages have reasonable, albeit a wide range of, returns. Differences in return between different charge and discharge powers were quite small, less than 5%. This is mainly due to power costs’ small impact on total investment in a CTES. The paper also showed that energy storages reduce emissions if storages can be used to replace peak production with high emissions. However, lifecycle assessment for the seasonal storage was not conducted as a part of this study. Centralised energy storages are also more cost effective, compared to distributed energy storages. Investment for the most profitable energy storage size in this paper varies between EUR 43 M and EUR 112 M. As earlier mentioned in the paper, distributed storages cost between EUR 0.3 M and EUR 0.7 M per apartment building. Thus, at most, an investment of EUR 112 M could be used to implement 373 distributed storages, while the DH network analysed has over 2000 residential buildings. In an urban setting, distributed storages might also suffer from a lack of space.
Similar to previous research, this paper also shows the large upfront cost for a seasonal energy storage unit. However, this cost is not higher than other investments into power production facilities that can range from tens of millions to several hundred million euros in a large DH network. Similar feasibility of implementation is found in previous research. Still, investments into new clean energy solutions are often not as profitable as traditional technology. If energy sector companies follow old return requirements for new technologies, investments might not be carried out. These large-scale investments have to be made if climate commitments are to be fulfilled.
The results presented in this paper are for a DH system that has waste incineration plants. This leads to a situation in which the system has cheap abundant energy in the summer that increases the profitability of seasonal storage. A similar analogy can be made with waste heat production from data centres or heat from solar collectors. The profitability also increases if the cost of carbon emissions rises.
In the studied system, the waste incineration capacity was approximately 400,000 tons per year. In 2014, the MSW incineration capacity of the EU, Norway, and Switzerland combined was 81.3 million tons per year. If each MSW incineration unit would be equipped with a seasonal energy storage device, there would be a possibility to implement over 18 TWh of storage capacity.
Further research should be conducted on how to improve the profitability of seasonal storages. For example, if heat pumps are used to increase the temperature of the heat storage system, the usable capacity can be increased. This will increase the use of electricity and might not be profitable if electricity prices are high. In addition, the seasonal storage system could also be equipped with electrical heaters that are relatively inexpensive to invest in but could be used to balance the electrical grid in a volatile market situation in which electricity production exceeds demand. Alternatively, the storage could be used for enabling an increase in electricity production when it is joined with a CHP plant. In this scenario, the storage is used to support electricity production by charging or discharging when electricity demand is high, and the CHP plant would be able to produce maximum electricity.
Most of the end energy use happens in buildings, and especially in Nordic countries, energy usage is highly volatile over seasons. The real estate sector also often has lower return expectations for investments, compared to the energy sector. This calls for more research into activating different emission-intensive sectors. More information is needed on how to develop business models that serve both the energy industry and the real estate business. Investments in energy systems require a long-term commitment. However, this should not be considered an issue in the real estate sector as building life cycles are between 40 and 50 years, and they cannot be used without energy. Long-term energy planning would reduce the uncertainty of costs for the real estate owner. Nevertheless, motivation for long-term commitment has to be studied further since joint investment is a new concept for the two sectors. One option for bridging the gap between the two sectors could be a long-term power purchase agreement (PPA) for the use of the seasonal storage that is tied to the underlying real estate asset and transferable with the building. PPAs are used for renewable electricity generation, but the concept could also prove successful with heat. One challenge for implementing emission reduction together in these two sectors comes from the fact that the energy sector has much larger emission reduction goals than the real estate sector.
In Finland, municipalities usually own the company which provides energy services within the city municipality. Municipalities are also large real estate owners with moderate return goals. Perhaps municipalities could leverage their real estate portfolios to invest in large seasonal storages in order to achieve their climate goals since many municipalities have decided to become climate neutral in the next 10–20 years. In addition, large international funds which invest in real estate assets have set climate targets which could focus capital into sustainable investments regarding energy use in real estate.
Author Contributions
Conceptualization, P.P.; methodology, P.P. and J.V.; software, P.P.; validation, P.P. and J.V.; formal analysis, P.P. and J.V.; investigation, P.P.; data curation, P.P.; writing—original draft preparation, P.P.; writing—review and editing, P.P., J.V. and S.J.; visualization, P.P. and J.V.; supervision, J.V. and S.J. All authors have read and agreed to the published version of the manuscript.
Funding
This research received no external funding.
Institutional Review Board Statement
Not applicable.
Informed Consent Statement
Not applicable.
Data Availability Statement
Not applicable.
Conflicts of Interest
The authors declare no conflict of interest.
Appendix A

Table A1.
Input values for heat production plants in simulations.
| System Side | Amount and Type |
|---|---|
| 634 |
| 1811 |
| Base production | CHP 2, waste |
| 140/140/36 (1) |
| CHP 1, biofuel | |
| 120/126/35 |
| HOB, waste | |
| 70/70 | |
| Intermediate production | CHP 1, gas |
| 235/90/94 |
| CHP 2, gas | |
| 100/200/34.8 (1) |
| Peak production | HOB, gas |
| 520/470 |
| HOB, oil | |
| 100/90 |
| Other | |
| 30,000 |
| (1) Full power achieved with both units |
Table A2.
Fuel and heat prices and taxes used in optimisations.
| Fuel | Price [€/MWh] | Tax [€/MWh] | Subsidies [€/MWh,e] | Emissions Factor [tCO2/TJ] |
|---|---|---|---|---|
| Natural gas | 20.70 | 13.02 (CHP), 20.65 (HOB) | 56.1 | |
| Light fuel oil | 50.45 | 17.25 (CHP), 24.88 (HOB) | 74.1 | |
| Biofuel (forest residue) | 21.00 | 18.6 | 0 | |
| Peat | 13.50 | 3 (CHP) | 105.9 | |
| Municipal solid waste | 0 | 0 | 0 | |
| Other prices | ||||
| CO2 price [€/tCO2] | 25.24 | |||
| District heating price according to month [€/MWh] (+VAT 24% for consumers) | ||||
| 1:58.7, 2:58.7, 3:45.7, 4:37.8, 5:23.4, 6:19.6, 7:19.6, 8:19.6, 9:23.5, 10:38.4, 11:45.8, 12:59.9 | ||||
Table A3.
Table of values used for seasonal storage investment calculations.
| Excavation Cost [€/m3] | Reference | Reference No. | ||
|---|---|---|---|---|
| min | max | average | Janiszewski et al. (2016) Feasibility of underground seasonal storage of solar heat in Finland | [37] |
| 26 | 50 | 38 | Ritola (1983) Kalliotilojen energiatalous ja lämmön varastointi kallioon | [38] |
| Ritola (1990) Oulun kalliolämpövarasto. Osa 2. Lämpövaraston muutostyöt sekä niiden kustannukset | [39] | |||
| Tonhammar (2014) Solar District Heating the potential of a large-scale solar district heating facility in Stockholm | [40] | |||
| Power output cost [k€/MW] | ||||
| min | max | average | Grosse et al. (2017) Long term (2050) projections of techno-economic performance of large-scale heating and cooling in the EU. | [41] |
| 17.9 | 72 | 44.9 | ||
| Electricity usage [%/MWh], [100€/MWh] | ||||
| min | max | average | Grosse et al. (2017) Long term (2050) projections of techno-economic performance of large-scale heating and cooling in the EU. | [41] |
| 1 | 1 | 1 | ||
| O&M costs [k€/a] | ||||
| min | max | average | Moser et el. (2018) Socioeconomic cost–benefit analysis of seasonal heat storages in district heating systems with industrial waste heat integration | [25] |
| 40 | 400 | 220 | SDH Online-Calculator | [42] |
| (100 MW pumps) | (100 MW HP) | Grosse et al. (2017) Long term (2050) projections of techno-economic performance of large-scale heating and cooling in the EU. | [41] | |
| Heat losses per annum [%] | ||||
| min | max | average | Sipilä (1989) Oulun kalliolämpövarasto. Osa 1. Lämpövaraston käyttö ja hankkeen kannattavuus | [35] |
| 17 | 50 | 37 | ||
| Evaluating volume for capacity | ||||
| Q = mcp∆T | ||||
| Q = Effective heat storage capacity [kJ] | ||||
| m = Mass of storage medium [kg] | ||||
| cp = Specific heat capacity [kJ/(kg °C)] | ||||
| ∆T = Temperature difference [°C] | ||||
| Value used for usable temperature difference in storage: 60 °C | ||||
| To simplify calculations water was assumed to have a constant mass of 1 kg per litre | ||||
Figure A1.
The 100 MW seasonal storage return.

Figure A2.
The 300 MW seasonal storage return.

References
- European Commission. 2050 Long-Term Strategy. Available online: https://ec.europa.eu/clima/policies/strategies/2050_en (accessed on 18 October 2020).
- Ürge-Vorsatz, D.; Harvey, L.D.D.; Mirasgedis, S.; Levine, M.D. Mitigating CO2emissions from energy use in the world’s buildings. Build. Res. Inf. 2007, 35, 379–398. [Google Scholar] [CrossRef]
- Kamal-Chaoui, L.; Robert, A. Competitive Cities and Climate Change. OECD Reg. Dev. Work. Pap. 2009. [Google Scholar] [CrossRef]
- The Role of Waste-To-Energy in the Circular Economy. Available online: https://eur-lex.europa.eu/LexUriServ/LexUriServ.do?uri=COM:2017:0034:FIN:EN:PDF (accessed on 18 October 2020).
- Assessment of Waste Incineration Capacity and Waste Shipments in Europe. Eionet Portal. Available online: https://www.eionet.europa.eu/etcs/etc-wmge/products/etc-reports/assessment-of-waste-incineration-capacity-and-waste-shipments-in-europe (accessed on 13 February 2021).
- Levaggi, L.; Levaggi, R.; Marchiori, C.; Trecroci, C. Waste-to-Energy in the EU: The Effects of Plant Ownership, Waste Mobility, and Decentralization on Environmental Outcomes and Welfare. Sustainability 2020, 12, 5743. [Google Scholar] [CrossRef]
- Moya, D.; Aldás, C.; López, G.; Kaparaju, P. Municipal solid waste as a valuable renewable energy resource: A worldwide opportunity of energy recovery by using Waste-To-Energy Technologies. Energy Procedia 2017, 134, 286–295. [Google Scholar] [CrossRef]
- Brückner, S.; Schäfers, H.; Peters, I.; Lävemann, E. Using industrial and commercial waste heat for residential heat supply: A case study from Hamburg, Germany. Sustain. Cities Soc. 2014, 13, 139–142. [Google Scholar] [CrossRef]
- Panayiotou, G.P.; Bianchi, G.; Georgiou, G.; Aresti, L.; Argyrou, M.; Agathokleous, R.; Tsamos, K.M.; Tassou, S.; Florides, G.; Kalogirou, S.; et al. Preliminary assessment of waste heat potential in major European industries. Energy Procedia 2017, 123, 335–345. [Google Scholar] [CrossRef]
- Forman, C.; Muritala, I.K.; Pardemann, R.; Meyer, B. Estimating the global waste heat potential. Renew. Sustain. Energy Rev. 2016, 57, 1568–1579. [Google Scholar] [CrossRef]
- Persson, U.; Möller, B.; Werner, S. Heat Roadmap Europe: Identifying strategic heat synergy regions. Energy Policy 2014, 74, 663–681. [Google Scholar] [CrossRef]
- Wahlroos, M.; Pärssinen, M.; Rinne, S.; Syri, S.; Manner, J. Future views on waste heat utilization—Case of data centers in Northern Europe. Renew. Sustain. Energy Rev. 2018, 82, 1749–1764. [Google Scholar] [CrossRef]
- Wahlroos, M.; Pärssinen, M.; Manner, J.; Syri, S. Utilizing data center waste heat in district heating—Impacts on energy efficiency and prospects for low-temperature district heating networks. Energy 2017, 140, 1228–1238. [Google Scholar] [CrossRef]
- ECOHEATCOOL Work Package 1. The European Heat Market. Final Report (Technical Report)|ETDEWEB. Available online: https://www-osti-gov.libproxy.aalto.fi/etdeweb/biblio/20758195 (accessed on 9 July 2019).
- Papakostas, K.; Mavromatis, T.; Kyriakis, N. Impact of the ambient temperature rise on the energy consumption for heating and cooling in residential buildings of Greece. Renew. Energy 2010, 35, 1376–1379. [Google Scholar] [CrossRef]
- Mäkelä, V.-M.; Tuunanen, J. Suomalainen Kaukolämmitys, Mikkelin Ammattikorkeakoulu. 2015. Available online: http://www.theseus.fi/handle/10024/97138 (accessed on 18 October 2020).
- Energiateollisuus ry—Finnish Energy Industries. Kaukolämpötilastot. Available online: https://energia.fi/ajankohtaista_ja_materiaalipankki/tilastot/kaukolampotilastot (accessed on 18 October 2020).
- Hast, A.; Syri, S.; Lekavičius, V.; Galinis, A. District heating in cities as a part of low-carbon energy system. Energy 2018, 152, 627–639. [Google Scholar] [CrossRef]
- Heat Roadmap Europe 4 Quantifying the Impact of Low Carbon Heating and Cooling Roadmaps. Available online: https://vbn.aau.dk/ws/portalfiles/portal/288075507/Heat_Roadmap_Europe_4_Quantifying_the_Impact_of_Low_Carbon_Heating_and_Cooling_Roadmaps.pdf (accessed on 21 November 2020).
- Streckienė, G.; Martinaitis, V.; Andersen, A.N.; Katz, J. Feasibility of CHP-plants with thermal stores in the German spot market. Appl. Energy 2009, 86, 2308–2316. [Google Scholar] [CrossRef]
- Heier, J.; Bales, C.; Martin, V. Combining thermal energy storage with buildings—A review. Renew. Sustain. Energy Rev. 2015, 42, 1305–1325. [Google Scholar] [CrossRef]
- Novo, A.V.; Bayon, J.R.; Castro-Fresno, D.; Rodriguez-Hernandez, J. Review of seasonal heat storage in large basins: Water tanks and gravel–water pits. Appl. Energy 2010, 87, 390–397. [Google Scholar] [CrossRef]
- Lund, H.; Werner, S.; Wiltshire, R.; Svendsen, S.; Thorsen, J.E.; Hvelplund, F.; Mathiesen, B.V. 4th Generation District Heating (4GDH). Energy 2014, 68, 1–11. [Google Scholar] [CrossRef]
- Fisch, M.; Guigas, M.; Dalenbäck, J.-O. A REVIEW OF LARGE-SCALE SOLAR HEATING SYSTEMS IN EUROPE. Sol. Energy 1998, 63, 355–366. [Google Scholar] [CrossRef]
- Moser, S.; Mayrhofer, J.; Schmidt, R.-R.; Tichler, R. Socioeconomic cost-benefit-analysis of seasonal heat storages in district heating systems with industrial waste heat integration. Energy 2018, 160, 868–874. [Google Scholar] [CrossRef]
- Xu, J.; Wang, R.; Li, Y. A review of available technologies for seasonal thermal energy storage. Sol. Energy 2014, 103, 610–638. [Google Scholar] [CrossRef]
- Park, J.-W.; Park, D.; Ryu, D.-W.; Choi, B.-H.; Park, E.-S. Analysis on heat transfer and heat loss characteristics of rock cavern thermal energy storage. Eng. Geol. 2014, 181, 142–156. [Google Scholar] [CrossRef]
- Valmet. Optimized Means Profitable at All Times 2020. Available online: https://www.valmet.com/media/articles/automation/optimized-means-profitable-at-all-times/ (accessed on 18 June 2020).
- Energy Opticon. Production Optimization 2020. Available online: https://en.energyopticon.com/energy-optima-3/production-optimization/ (accessed on 18 June 2020).
- Nordpool—Market Data. Available online: https://www.nordpoolgroup.com/Market-data1/ (accessed on 31 January 2021).
- Finnish Energy. Raportti KK5_2015 Kaukolämmön ja Jäähdytyksen Tekninen Laatu. Available online: http://energia.fi/files/837/RaporttiKK5_2015_Kaukolammon_ja_-jaahdytyksen_tekninen_laatu.pdf (accessed on 29 November 2020).
- City of Vantaa, Finland. Open Source Building Data. Available online: https://www.avoindata.fi/data/fi/dataset/vantaan-rakennukset (accessed on 9 January 2021).
- Mangold, D.; Schmidt, T.; Müller-Steinhagen, H. Seasonal Thermal Energy Storage in Germany. Struct. Eng. Int. 2004, 14, 230–232. [Google Scholar] [CrossRef] [Green Version]
- Brimström, C.; Larsson, M.; Hoist, P.; Zinko, H.; Hillström, C.-G. The lyckebo project a swedish central solar heating plant with seasonal storage. In Intersol Eighty Five; Bilgen, E., Hollands, K.G.T., Eds.; Elsevier BV: Amsterdam, The Netherlands, 1986; pp. 61–65. [Google Scholar] [CrossRef]
- Sipilä, K. Oulun Kalliolämpövarasto. Osa 1. Lämpövaraston Käyttö ja Hankkeen Kannattavuus; VTT Technical Research Centre of Finland: Espoo, Finland, 1989. [Google Scholar]
- Noothout, P.; de Jager, D.; Tesnière, L.; van Rooijen, S.; Karypidis, N.; Brückmann, R.; Jirouš, F.; Breitschopf, B.; Angelopoulos, D.; Doukas, H.; et al. The Impact of Risks in Renewable Energy Investments and the Role of Smart Policies; European Commission: Brussels, Belgium, 2016; 179p, DiaCore Report; Available online: http://publica.fraunhofer.de/eprints/urn_nbn_de_0011-n-3829091.pdf (accessed on 3 May 2021).
- Janiszewski, M. Feasibility of underground seasonal storage of solar heat in Finland. In International Conference on Geo-Mechanics, Geo-Energy and Geo-Resources: Conference Proceedings; Monash University: Melbourne, Australia, 2016. [Google Scholar]
- Ritola, J. Kalliotilojen Energiatalous ja Lämmön Varastointi Kallioon; VTT Technical Research Centre of Finland: Espoo, Finland, 1983. [Google Scholar]
- Ritola, J. Oulun Kalliolämpövarasto. Osa 2. Lämpövaraston Muutostyöt Sekä Niiden Kustannukset; VTT Technical Research Centre of Finland: Espoo, Finland, 1990. [Google Scholar]
- Tonhammar, A. Solar District Heating: The Potential of a Large Scale Solar District Heating Facility in Stockholm; Uppsala University: Uppsala, Sweden, 2014; p. 96, UPTEC ES; ISSN 1650-8300; Available online: http://www.diva-portal.org/smash/get/diva2:698746/FULLTEXT01.pdf (accessed on 18 October 2020).
- Grosse, R. Long Term (2050) Projections of Techno-Economic Performance of Large-Scale Heating and Cooling in the EU. Publ. Off. Eur. Union 2017. [Google Scholar] [CrossRef]
- Schmidt, T.; Deschaintre, L. SDH Online-Calculator 2013. Available online: https://sdh-online.solites.de/Content/media/SDH-Online-Calculator.PDF (accessed on 12 March 2021).
Figure 1.
Model of the optimised energy system.

Figure 2.
Heat demand of the built environment.

Figure 3.
Return on investment of seasonal storages with 200 MW power.

Figure 4.
Investment cost for seasonal storages with 200 MW power.

Figure 5.
Investment costs for 90 GWh and 200 MW seasonal storage.

Figure 6.
One-year emissions for different optimisations.

Publisher’s Note: MDPI stays neutral with regard to jurisdictional claims in published maps and institutional affiliations. |
© 2021 by the authors. Licensee MDPI, Basel, Switzerland. This article is an open access article distributed under the terms and conditions of the Creative Commons Attribution (CC BY) license (https://creativecommons.org/licenses/by/4.0/).
Share and Cite
MDPI and ACS Style
Penttinen, P.; Vimpari, J.; Junnila, S. Optimal Seasonal Heat Storage in a District Heating System with Waste Incineration. Energies 2021, 14, 3522. https://0-doi-org.brum.beds.ac.uk/10.3390/en14123522
AMA Style
Penttinen P, Vimpari J, Junnila S. Optimal Seasonal Heat Storage in a District Heating System with Waste Incineration. Energies. 2021; 14(12):3522. https://0-doi-org.brum.beds.ac.uk/10.3390/en14123522
Chicago/Turabian StylePenttinen, Petri, Jussi Vimpari, and Seppo Junnila. 2021. "Optimal Seasonal Heat Storage in a District Heating System with Waste Incineration" Energies 14, no. 12: 3522. https://0-doi-org.brum.beds.ac.uk/10.3390/en14123522
Note that from the first issue of 2016, this journal uses article numbers instead of page numbers. See further details here.