Article

A Study of Hot Climate Low-Cost Low-Energy Eco-Friendly Building Envelope with Embedded Phase Change Material

1
Department of Mechatronics and Bio-Medical Engineering, Faculty of Engineering, Air University, Islamabad 44000, Pakistan
2
College of Business, Engineering and Technology, Texas A & M University-Texarkana, Texarkana, TX 75503, USA
3
Department of Engineering, School of Science and Technology, Nottingham Trent University, Nottingham NG11 8NS, UK
4
Department of Mechanical Engineering, Khwaja Fareed University of Engineering & IT, Rahim Yar Khan, Punjab 64200, Pakistan
*
Author to whom correspondence should be addressed.
Submission received: 26 April 2021 / Revised: 8 June 2021 / Accepted: 11 June 2021 / Published: 14 June 2021
(This article belongs to the Special Issue Biofuels and Sustainable Energy Materials Development)

Abstract

:
The generation and use of energy are significant contributors to CO2 emissions. Globally, approximately 30% to 40% of all energy consumption can be directly or indirectly linked to buildings. Nearly half of energy usage in buildings is linked to maintaining the thermal comfort of the inhabitants. Therefore, finding solutions that are not only technically but also economically feasible is of utmost importance. Though much research has been conducted to address this issue, most solutions are still costly for developing countries to implement practically. This study endeavors to find a less expensive yet straightforward methodology to achieve thermal comfort while conserving energy. This study takes a broader view of multiple habitat-related CO2 emission issues in developing regions and describes a hybrid solution to address them. New technologies and innovative concepts are being globally examined to benefit from the considerable potential of PCMs and their role in thermal energy storage (TES) applications for buildings. The current study numerically investigates the thermal response of a hybrid building envelope consisting of PCM and local organic waste materials for low-cost low-energy buildings. The local organic waste materials used are those whose disposal is usually done by burning, resulting in an immense amount of greenhouse gases. In the first phase, different waste materials are characterized to determine their thermophysical properties. In the second phase, a low-cost, commonly available PCM calcium chloride hexahydrate, CaCl2·6H2O, is integrated with a brick and corn husk wall to enhance the thermal storage in the building envelope to minimize energy consumption. Temperature distribution plots are primarily used for analysis. The results show a marked improvement in thermal comfort by maintaining a maximum indoor temperature of 27 °C when construction is performed with a 6% corn husk composite material embedded with the PCM, while under similar conditions, the standard brick construction maintained a 31 °C indoor temperature. It is concluded that the integration of the PCM layer with the corn husk wall provides an adequate solution for low-cost and low-energy buildings.

1. Introduction

The buildings and construction sectors utilize one-third of global energy consumption and are the primary source of carbon emissions globally [1]. Forty-three percent of residential building energy is utilized in heating, cooling, and lighting, while for commercial buildings, these applications account for 39% of total energy consumption [2]. PCMs have several applications in refrigeration [3], air-conditioning [4], solar PV [5], and buildings [6]. The latent heat thermal energy storage capabilities of PCMs make them particularly suitable for applications in low-cost, lightweight buildings with lesser heat storage capacity.
Passive techniques employing PCMs to minimize energy consumption in the building sector have increased over time [7,8]. Various experimental and numerical studies have been performed to evaluate the effectiveness of utilizing PCMs. Zhang et al., studied the suitable PCMs with appropriate incorporation methods to assess the latent heat thermal energy storage in buildings [9]. Gracia and Cabeza have given a thorough review of PCM in passive TES applications in buildings [10]. Yasiri and Szabo provided a thorough analysis of PCMs utilization in buildings and energy savings associated with the applications [11]. Cabeza et al. studied the applications of PCMs in concrete walls for energy saving [12]. The main criteria for selecting appropriate PCMs are their phase change temperature and heat of fusion, depending on the particular applications [13].
While the built environment is also responsible for 35–40% of the greenhouse gas GHG) emissions [14], half of the total primary energy is consumed by commercial and residential buildings in Pakistan, while they produce about one-third of total carbon emissions. Managing energy usage and GHG emissions has become a global challenge, and its impact on the developing regions is causing immense problems for the population. This has, therefore, become a critical issue needing regulation to reduce the energy being consumed by the built environment.
It is feared that unless all countries across the globe take immediate positive action, the world carbon emissions will double by the year 2030 [15]. For developing countries, this ratio is expected to be even higher due to their rapid development rates. Reducing carbon emissions is, therefore, becoming a priority in Pakistan as well. One way of achieving this goal is to minimize the energy consumed by the buildings and provide these minimized energy needs using renewable energy sources. In Pakistan, with a population approaching 220 million people, nearly 60% are youth [16]. Due to this, Pakistan’s education system is costly. As per the data available from Pakistan Education Statistics 2016–2017 [17,18], Pakistan’s education system comprises more than 317,323 educational institutions that provide education to nearly 50.28 million students at any given time. It is, therefore, foregone that these educational institutions are one of the leading energy consumers within the built environment. Considering these statistics, the current study concentrates on low-cost academic buildings as a case in point.
It has been observed that energy conservation in academic institutions can provide significant cost savings for academic institutions and reduce carbon emissions in the country. So far, energy expenses in academic institutions are treated as unimportant in comparison with other priorities. However, historical trend analysis of academic institutions’ operating budgets shows that energy bills can constitute between 10% to 15% of the total expenditure of the academic institutions and are the subsequent highest expenditure after the salaries of the faculty and staff. Crosby and Metzger [
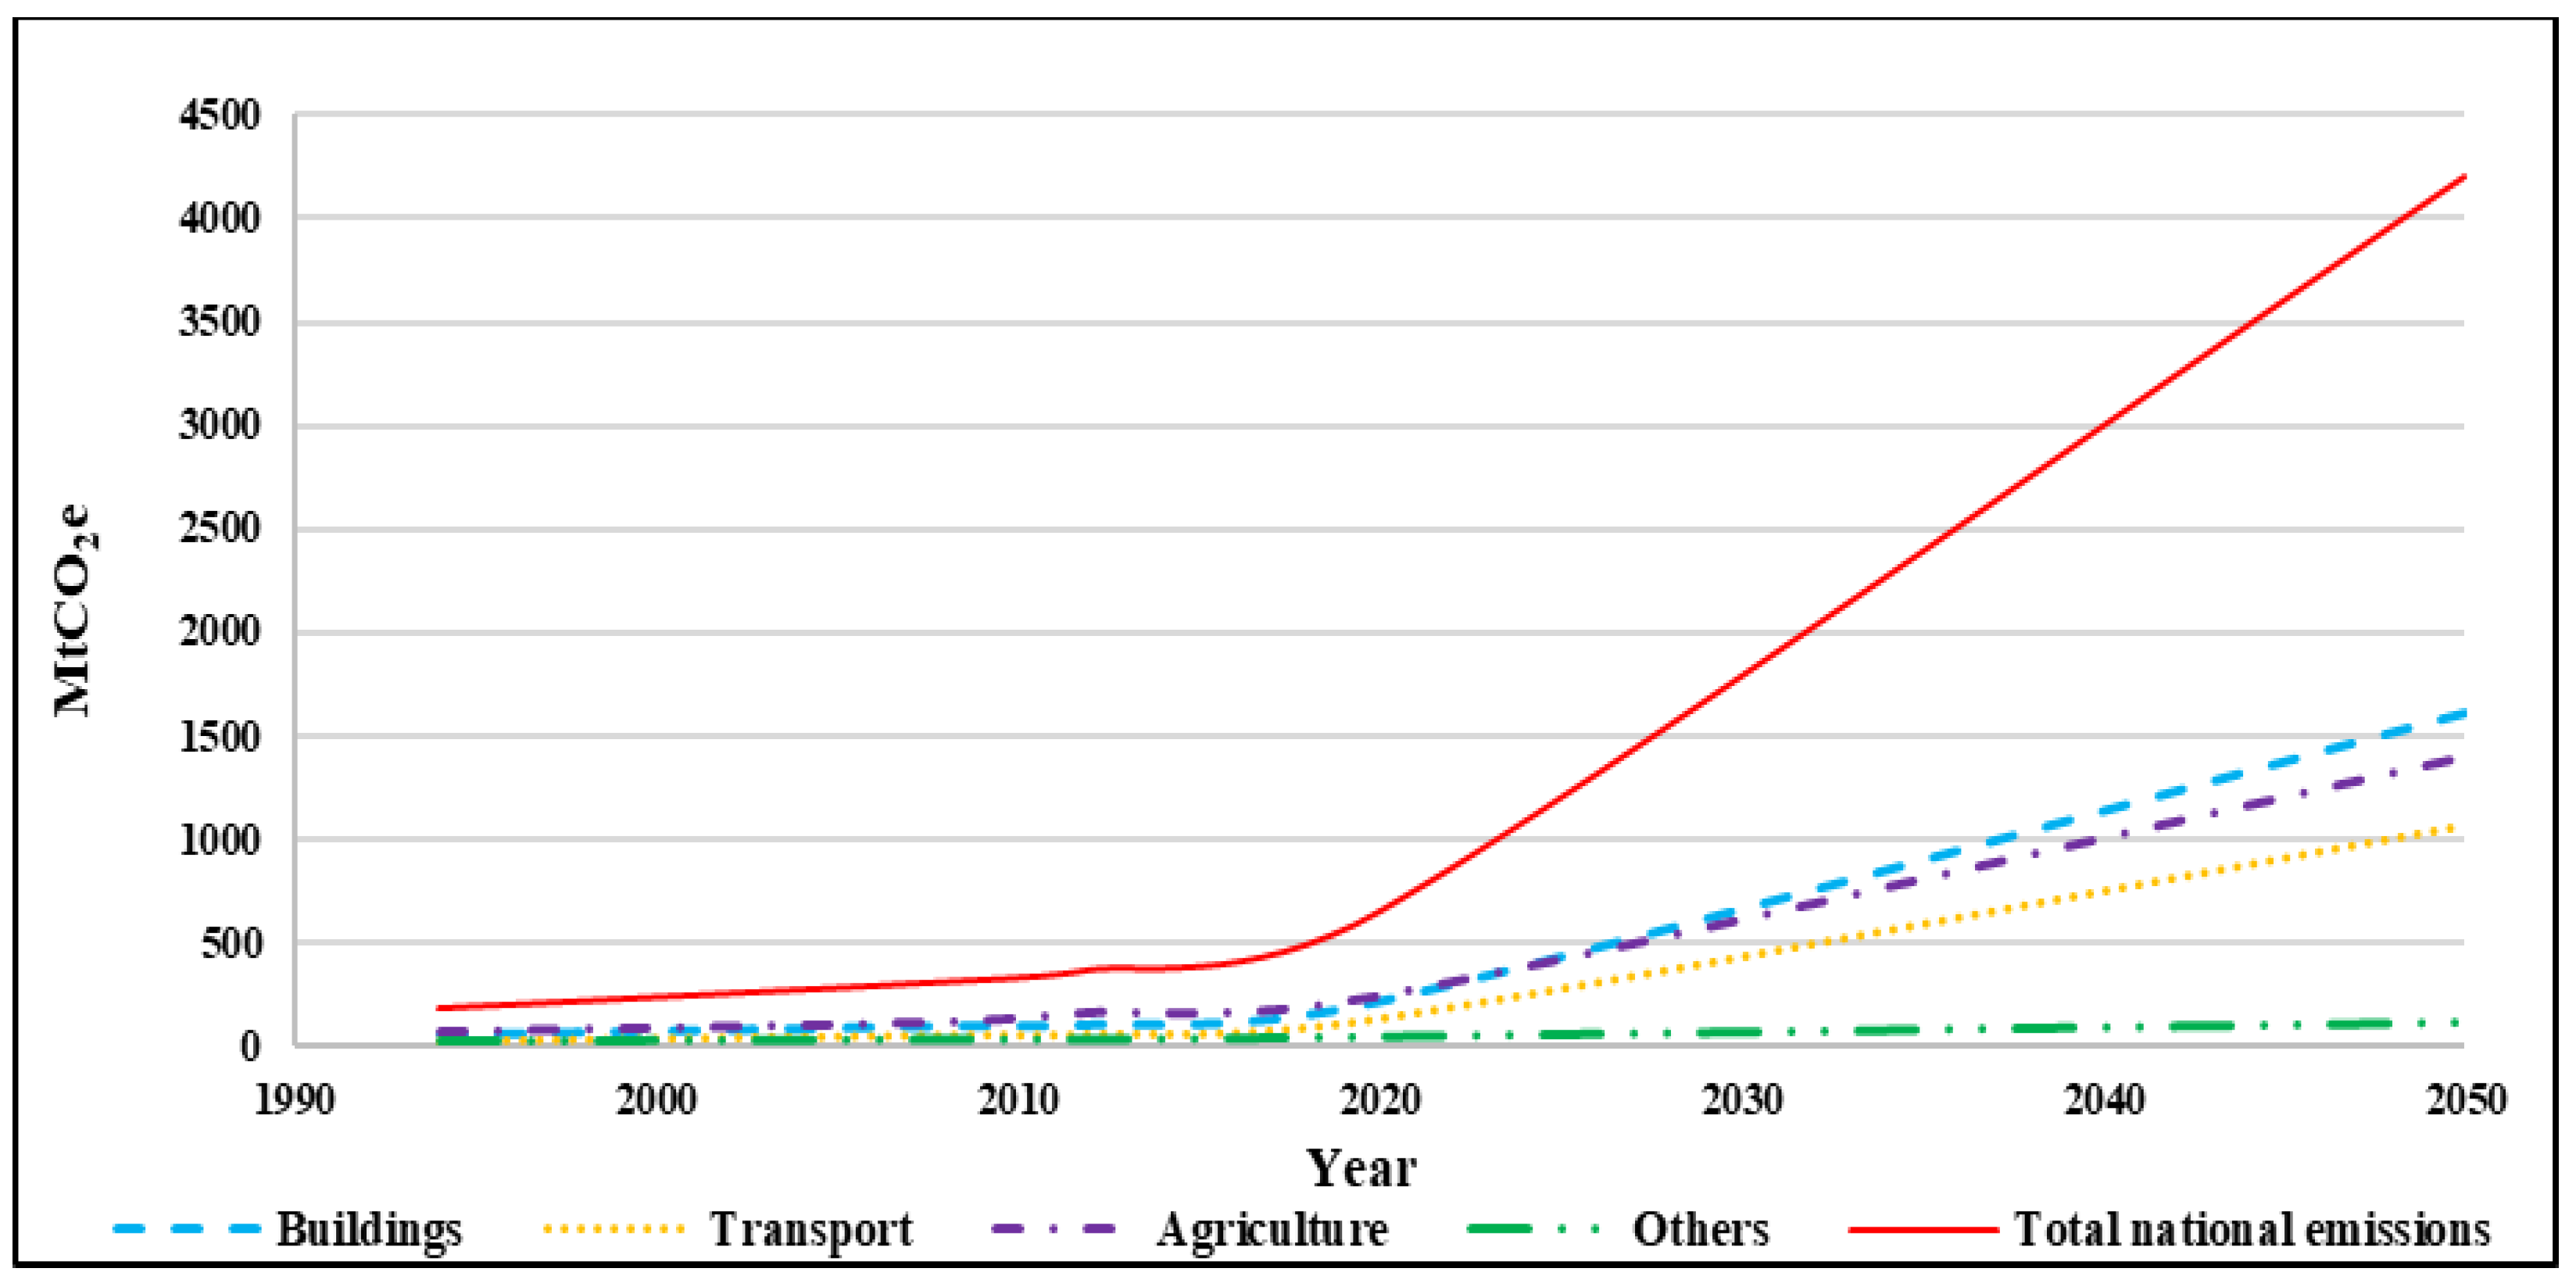
19] concluded that there was an increasing focus on managing energy used in these institutions in recent times. It is considered that to achieve higher energy efficiency and conservation, it is vital to bring awareness among students around the globe about conserving available energy resources, the use of renewables, and mitigating the effects of greenhouse gases on our global environment. In developing countries, the rate of increase of GHG emissions is much higher than that of the developed world; their rate of development is higher. The trend of Pakistan’s GHG emissions [20] in a million tons of carbon dioxide equivalent (MtCO2e) is shown in Figure 1.
The two sectors of agriculture and buildings can be seen as significant contributors to GHG emissions. Electric power generation totaling more than 12,230 MW capacity has been added to Pakistan’s national grid in the recent past [21], taking the total power production to 40,000 MW in the current year. This is likely to cause a further increase in GHG emissions in Pakistan unless immediate measures are not taken to control the emissions of pollutants. In comparison to global carbon emissions, Pakistan’s per capita carbon footprint has been small in the past, but it has started to increase rapidly [20] in the last few years due to a healthy growth rate of the economy.
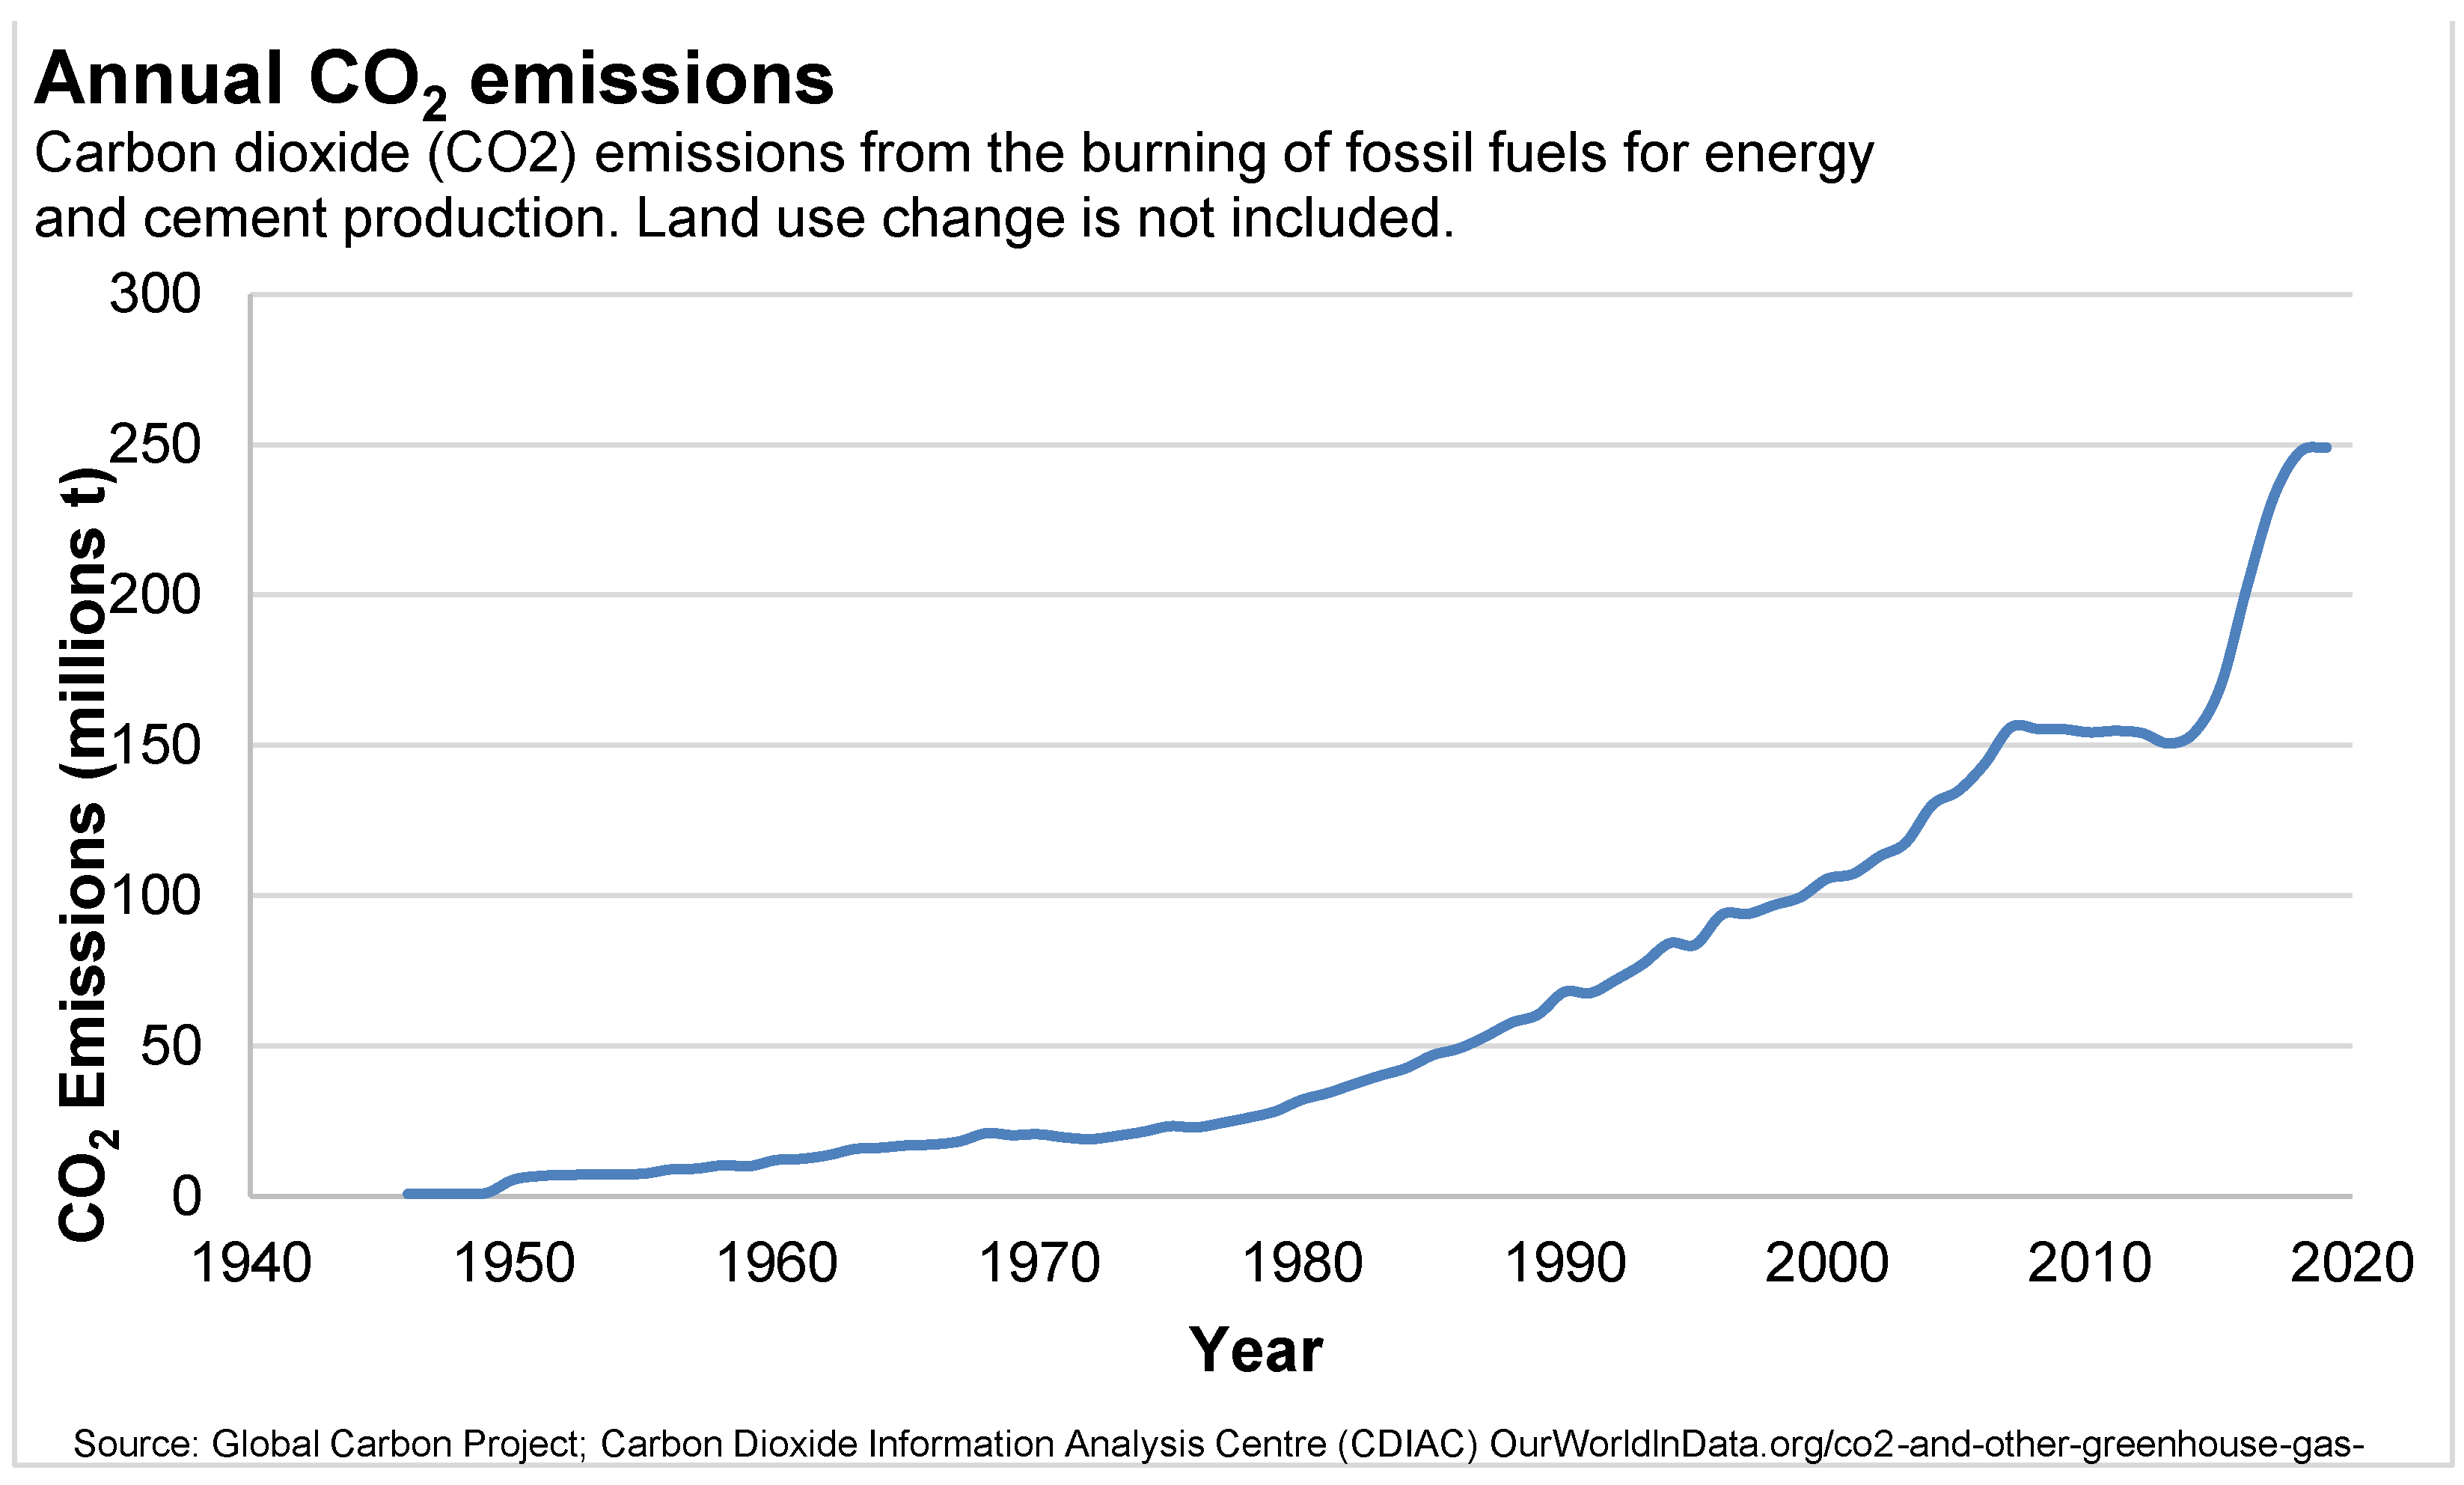
As a result of the increase in energy consumption, the CO2 emissions have also risen sharply, as depicted in Figure 2.
The latest available data on CO2 emissions in Pakistan are shown in 
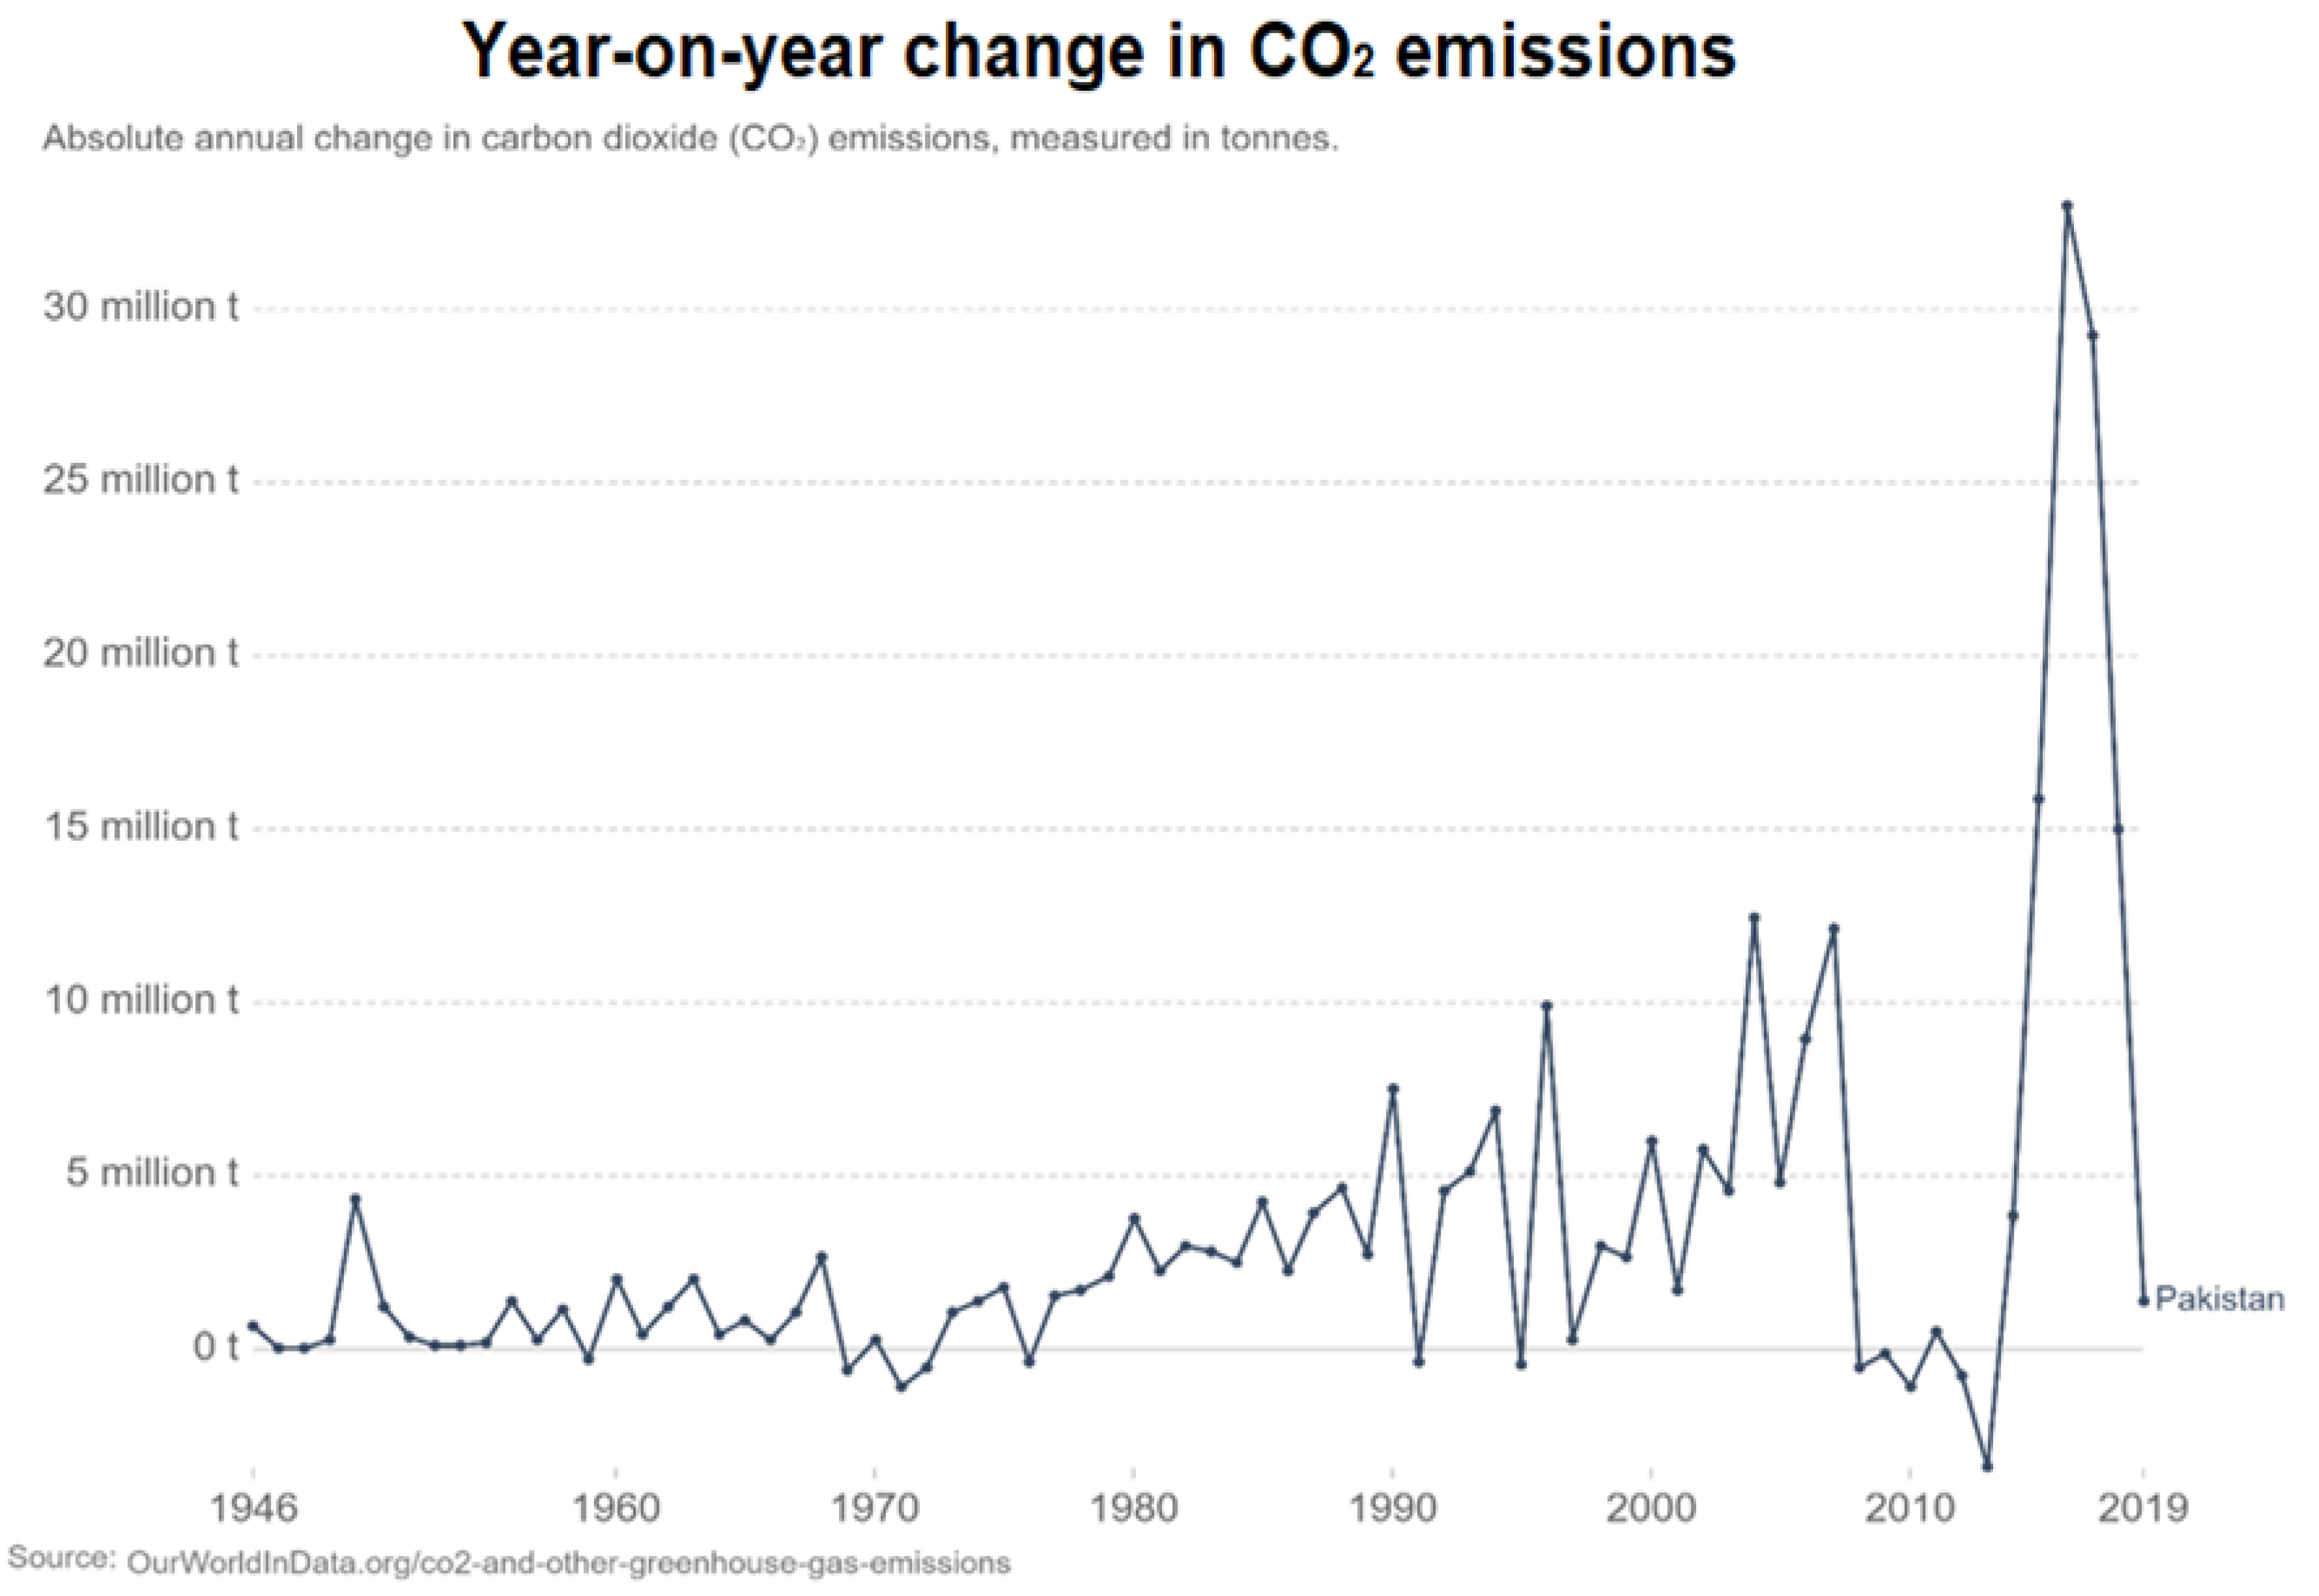
Figure 2, and the annual variation in emissions is seen in Figure 3. Figure 2 clearly shows a sharp rise in CO2 emissions for the last decade compared to a slow increase from 1950–2010. Figure 3 shows a step change from 2010 to 2019 while analyzing historical emissions data of Pakistan.
As seen from the above data, emissions from the built environment are the highest and increasing alarmingly. Several efforts have been made to achieve energy efficiency and reduce the carbon footprint of different buildings in the past decade [23,24,25,26]. It has also been observed that thermal comfort is lacking in most academic buildings available to school-going children in developing countries, even where a significant cost is being incurred on heating and cooling of academic buildings [27]. Thus, improving thermal comfort using efficient temperature control techniques and designing buildings with inbuilt thermal comfort using thermal energy storage materials [27,28,29], providing natural ventilation, and using optimum building orientation are also priorities in developed countries.
Similarly, several studies have been performed on composite materials having clay, cement, or gypsum plaster. Khabbazi et al. [30] have investigated an insulating material based on a mixture of cement mortar and cork. Cherki et al. [31,32,33] and Mounir et al. [34] have worked on materials based on granular cork mixed with different binders to achieve better thermal properties. Mounir et al. [35] have also shown improved thermal properties of clay by mixing it with wool. Date palm wood and fibers have also been suggested as an ingredient to make composite reinforced building materials by several studies. Kriker et al. studied date palm fiber-reinforced concrete properties as a function of water curing [36]. Tlijani et al. used the periodic method to determine thermal conductivity and thermal diffusivity of the wood-scale of palm trees [37]. Agoudgil et al. report thermophysical properties of different varieties of date palm wood [38]. Mekhermeche et al. studied the thermal properties of date palm fiber reinforced clay bricks [39]. Benmansour et al. examined the thermophysical and mechanical properties of date palm fibers [40]. The experimental work shows that date palm wood and fibers mixed with binders result in good thermal properties for use in the built environment. Laaroussi et al. [41,42] use a hot plate and flash method to measure the thermal properties of different mixtures of clay bricks. Mahamat et al. study the thermophysical properties of cow dung mixed with clay and their effect on energy consumption of buildings [43]. Lamrani et al. [44] and Bhutto [45] have worked on new ecological building materials based on peanut shells and wheat straw mixed with plaster.
In the current research effort, authors concentrate on a novel hybrid building envelope consisting of PCM and local organic waste materials for low-cost low-energy buildings. The locally available sustainable materials are mixed with clay, sand, cement, and their thermal properties. These materials are then simulated to form the building envelope. Numerical simulation is conducted to investigate their effect on the annual energy consumption for heating and cooling loads. The results are then compared with the energy consumption of buildings made from standard construction materials. TRNSYS software is initially used for simulations under local annual weather conditions. So far, the potential for use of PCMs in these buildings has remained limited due to associated cost and accessibility in the local market [46,47]. To overcome the economic barrier, this study proposes a reduction in the existing construction cost by using the proposed composite material compressed bricks. These compressed bricks are used to replace the existing brick and concrete blocks as the primary construction material. There are many abundantly and locally available waste materials that can be used in this sustainable construction process. This work studies the integration of low-cost PCM and local raw materials to find whether this approach provides a better solution that is viable to be commercialized at a large scale. Currently, fired bricks are used as the primary construction material. The manufacturing of these bricks results in a considerable amount of greenhouse gases (GHG). The fired brick has been replaced in this study by locally developed compressed bricks. After experimental testing of several materials, a mixture of clay–cement–sand was selected as the base material. To further enhance the base material’s thermal energy storage (TES) capability, several waste materials were added to form a composite construction material. The mixture of the said materials was formed into a block shape using compressive forces. This study examines the TES capability of the materials mentioned above. It also studies the possibility of introducing a PCM layer with the best performing block replacing the bricks. CaCl2·6H2O is selected for this study based on the melting temperature of 28–29 °C. For Islamabad, Pakistan, about eight months of hot weather and cooling load are a substantial part of annual energy consumption. CFD simulations have been performed on a typical 9 inches thick masonry brick wall and corn husk wall with and without PCM. The authors have conducted a comprehensive effort to study the effects of this hybrid building envelope in detail earlier, not mentioned in the literature. Experimental and numerical analysis using TRNSYS and CFD tools are used to study various aspects of the proposed building envelope. The authors also consider some pressing emissions issues of the region, like burning paddy fields and other organic waste. The study shows that a significant reduction in energy consumption and greenhouse gas emissions is possible using the proposed comprehensive approach while curtailing the construction cost. Section 2 presents the material and methods used for this study; Section 3 presents the base material testing; Section 4 discusses the details of the composite material used. Computational analysis is discussed in Section 5, followed by Section 6, which provides a detailed comparison of all the scenarios. Recommendations are made as per the finding of the current study in the conclusions section.

2. Materials and Methods

For this study, a school building located in Islamabad, Pakistan, was selected. The selected school was built in 2004. The school’s building is a double-story structure with 44 classrooms and a floor area of 2240 m2. The school has an enrolment of 1020 students on average. A detailed analysis of the school building energy consumption was performed earlier to show energy-saving opportunities and the possibility of cost savings and reduction in carbon emission [48]. Considering the data obtained [48], the current study investigates the advantages of using composite materials and phase change materials (PCMs) in the building envelope to increase the building thermal mass to improve indoor thermal comfort.
The simplest and most cost-effective method for thermal energy storage is sensible heat storage. Further, the amount of heat stored in a material depends on the density ρ , volume v , temperature variation T , and specific heat capacity C p and thermal conductivity k of the storage materials. The sensible heat storage capacity of a material is calculated using Equation (3). The temperature difference T across the storage material has inverse dependence on the thermal conductivity k of the material.
Q = m a s s × C p × T  
m a s s = ρ v
By replacing mass in Equation (1), it becomes:
Q = ρ v × C p × T

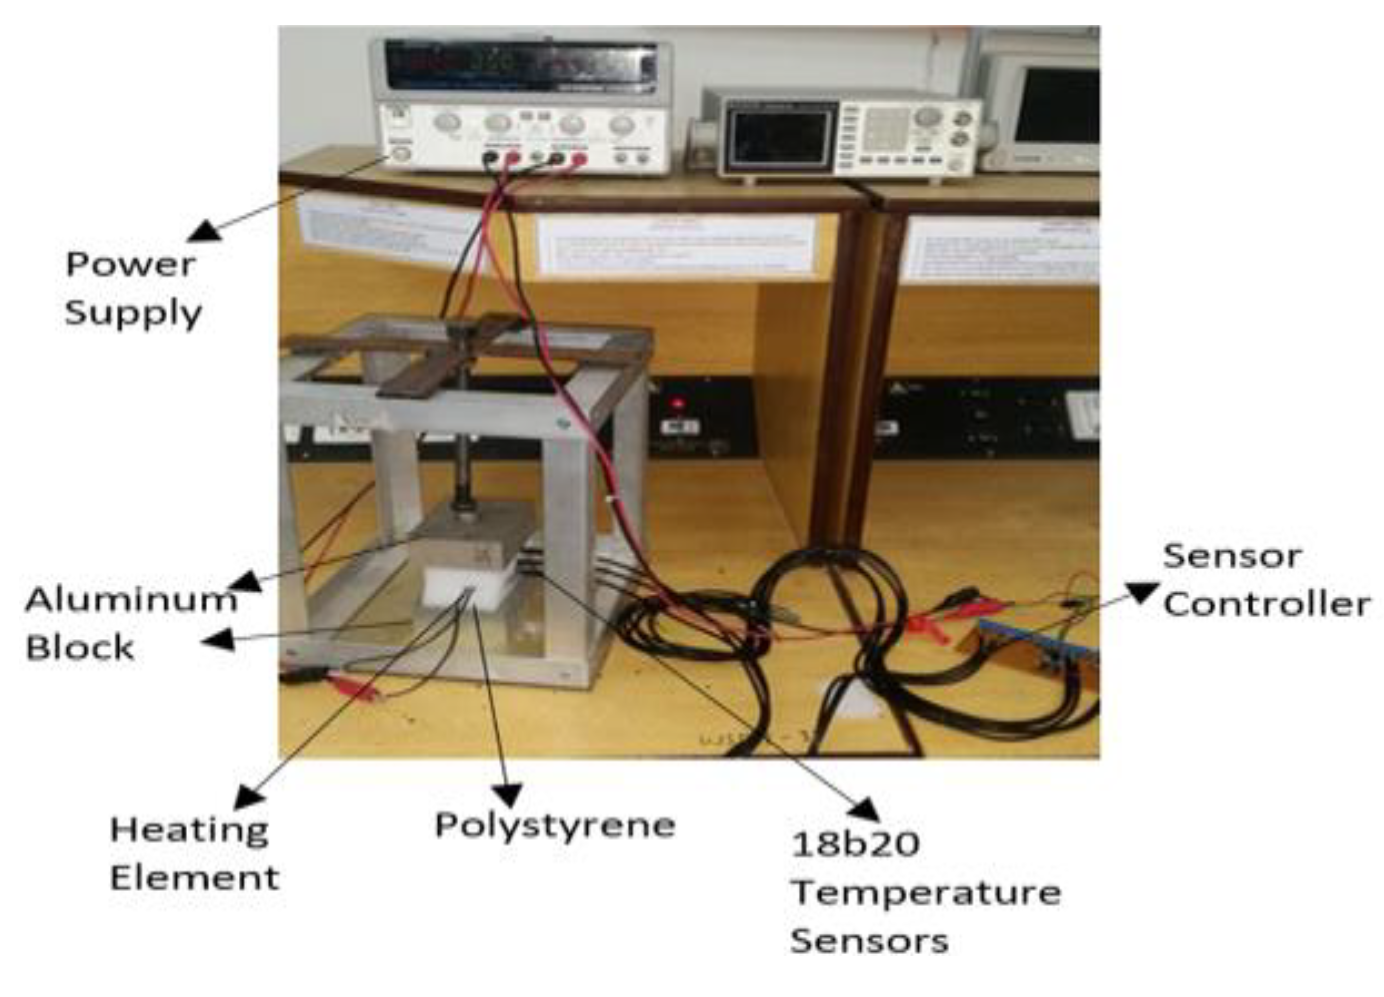
2.1. Thermal Conductivity

To find out the thermal conductivity of various eco-friendly materials used in this study, an experimental setup is designed, as shown in Figure 4.
This experimental setup is known as the hot-plate steady-state method for finding the thermal conductivity of materials [32,35,42,44].
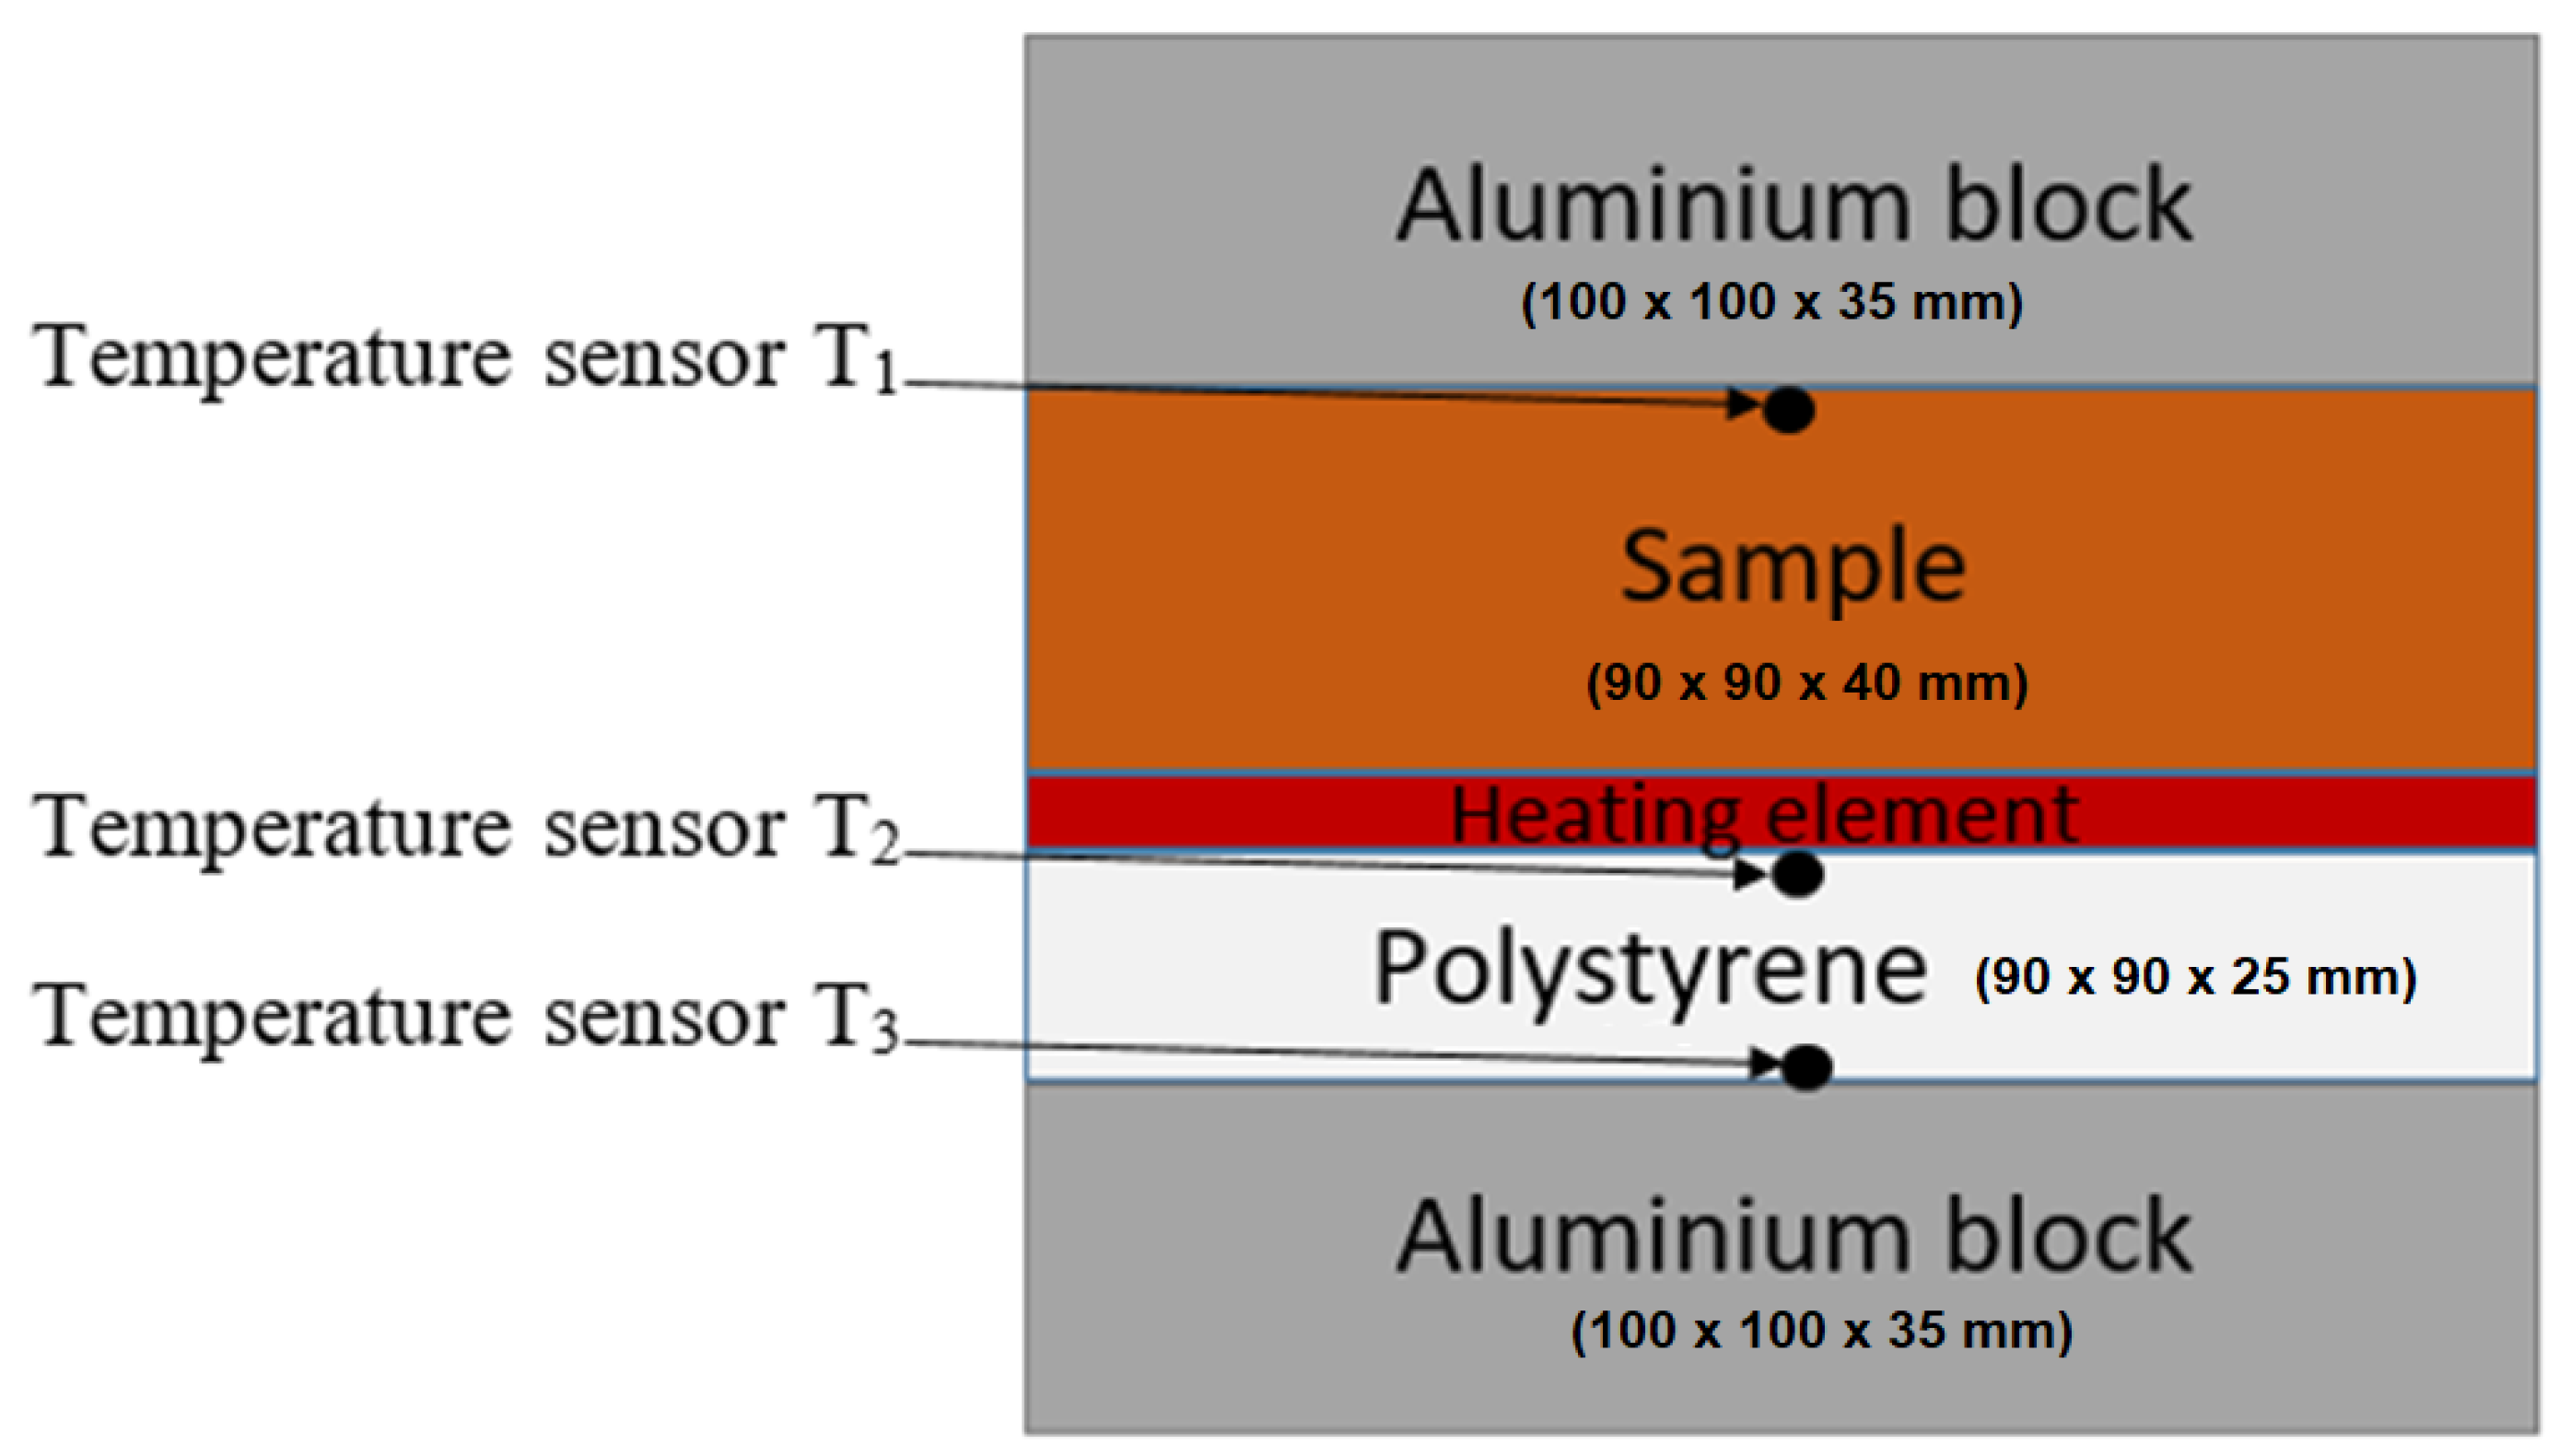
A screwed rod is used to slightly press all the materials together to ensure gap-less contact between different materials to avoid a rise in thermal conductivity due to air gaps and any heat loss. To measure the temperatures of the testing material, heating element, and polystyrene foam, temperature sensors are placed as shown in Figure 5. These temperature sensors have a temperature sensitivity of 0.125 °C.
A microcontroller (Arduino) is used to record the temperature values received from the temperature sensors, and Tera Term© open-source software by PARSEC Group, Arvada, CO, USA [51] is used for the graphical display of temperature values.
The temperature difference across test material ( T 2 T 1 ) and temperature difference across polystyrene ( T 2 T 3 ) are calculated to find the thermal conductivity of test material by using Equation (4).
k 1 = e 1 T 2 T 1 [ U 2 R . S k 2 e 2 ( T 2 T 3 ) ]
where
e 1 = Thickness of sample. (m)
e 2 = Thickness of polystyrene. (m)
U = Voltage (V)
R = Resistance of the heating element. (Ω)
S = Surface area (m)
k 1 = Thermal conductivity of the sample (W/m-K)
k 2 = Thermal conductivity of polystyrene (W/m-K).

2.2. Specific Heat Capacity

The calorimetry method as described by Cengel [52] is used to measure the heat capacity of various materials being investigated. The changes in temperature of the water and the sample are measured and specific heat capacity is calculated using Equation (7).
Q s a m p l e = Q w a t e r
m s a m p l e   × C p       s a m p l e × Δ T s a m p l e = m w a t e r × C p       w a t e r × Δ T w a t e r  
C p       s a m p l e = m w a t e r × C p       w a t e r ×   Δ T w a t e r m s a m p l e   × Δ T s a m p l e  
where
Q = heat applied (W)
m = mass (kg/m3)
C p = Specific heat capacity (kJ/kg-K)
Δ T = Temperature difference. (°C)

2.3. Validation

The experimental setup is validated by calculating the thermal conductivity of the known materials using this setup and comparing the measured results with the standard data of polystyrene [35,42,44,52], clay [41,53], brick [42,54], and concrete [49,54], respectively.
After getting the temperature difference, the thermal conductivity of the samples is calculated by using Equation (4). Fourier’s law of heat conduction for one-dimensional heat conduction is given in Equation (8) [52].
Q ˙ c o n d = k S d T d x         ( W )
where
Q ˙ c o n d = rate of heat transfer;   k = thermal conductivity; S = surface area.
d T d x   = temperature gradient.
The rate of heat transfer and the area of the material is constant. Thus, d T d x is constant, which means that the temperature through the test material varies linearly with e (thickness of the material in the direction of heat flow), and the temperature distribution in the material under a steady state is a straight line. By integrating the above equation for change in length and temperature, Equation (8) will become:
x = 0 L Q ˙ c o n d , w a l l     d x = T = T 2 T 1 k S   d T
Q ˙ c o n d , w a l l = k S T 2 T 1 e    
For reference material:
Q ˙ c o n d , p o l y s t y r e n e = k S T 2 T 3 e
Q ˙ =   U 2 R    
where U = applied voltage and R = resistance of the heating element.
As the heating element provides equal heat on both sides, so Equation (12), in this case, will become.
Q ˙ =   U 2 2 R  
By adding both Equations (10) and (11) and using Equation (13).
U 2 2 R   +     U 2 2 R =   k 1 S T 2 T 1 e 1 +     k 2 S T 2 T 3 e 2  
k 1 = e 1 T 2 T 1 [ U 2 R . S k 2 e 2 ( T 2 T 3 ) ]
Equation (15) is used in this study to calculate the thermal conductivity of test materials, as given in Table 1 below. Polystyrene is taken as the reference material with known thermal conductivity k 2 .

2.4. Specific Heat Capacity

The calorimetry method [52,53] is used to measure the heat capacity of the various materials. The changes in temperature of the water and the sample and specific heat capacity are calculated by using Equation (7).

3. Base Material Testing

One of the aims of this study was to compare different waste organic materials to formulate a new eco-friendly construction material that can reduce energy consumption and GHG emissions. For that purpose, different sustainable materials were selected for the study. First, a base material was taken, which is locally available and itself environmentally friendly. Clay was selected as the base material, as it is abundantly available in nature, low-cost, and environmentally friendly. Fired clay bricks are most commonly used in Pakistan as a building construction material. A large amount of waste rubber and coal is burned during the brick manufacturing process. According to the EIA report, this is not an eco-friendly manufacturing process; one pound of coal produces 2.86 pounds of carbon dioxide [54]. Therefore, in this study, 20 kN compression force is used to produce clay bricks for thermal properties testing, using the ©G.U.N.T. Hamburg, Germany, Gerätebau GmbH compression equipment. To improve the structural strength of brick and improve its binding properties, sand and cement were added in different samples [55]. After preparing the samples, they were sundried for a week to allow mechanical stabilization. Then thermal conductivity and specific heat of the clay samples were calculated using the experimental setups described earlier. The thermal conductivity and the specific heat results are shown in Table 2.

Base Material Selection

The clay–cement–sand sample was considered to possess better thermal properties than other samples. It displayed better strength, much smaller thermal conductivity, greater density, and thermal diffusivity equal to clay. Hence, clay–cement–sand brick was selected as the base material for the formation of composite eco-friendly sustainable materials.

4. Composite Materials

4.1. Wheat Straw

Wheat is the main agricultural crop in Pakistan; around nine million hectares of area are used for the growth of wheat, which is almost 40% of the country’s total cultivated land. In the 2016/2017 season, the total wheat production was around 25.6 million metric tons in Pakistan [56]. After harvesting the wheat crop, a considerable amount of wheat residue is produced, which is used for various purposes. However, many farmers are unable to use it fully and burn a significant portion. This crop residue burning produces a considerable amount of harmful emissions, causing breathing difficulties and atmospheric pollution. Wheat straw, being abundantly available, was selected in this study as the first composite material. Wheat straw is a natural material and environmentally friendly, and its use in building materials can avoid the pollution created due to its burning. Samples of the first sustainable building material were prepared by adding 2%, 4%, and 6% wheat straw by weight in the base material while reducing the same amount of clay.

4.2. Corn Husk

Corn is the second-largest agricultural crop in Pakistan after wheat; around 1.350 million hectares of area are used to grow corn. In the 2017/2018 season, the total corn production was around 5.8 million tons [56]. After harvesting the corn crop, a considerable amount of corn residue is left over as waste material. Thus, corn husk is selected as the second composite material for mixing in the base material. The exact mixing ratio, as in the case of wheat straw, is used.

4.3. Rice Husk

Rice is the third-largest crop in Pakistan after wheat and cotton in terms of area sown. The total production of rice in Pakistan is 10.351 million metric tons [56]. For every 1 ton of rice, about 1.5 tons of waste crop residue are produced [57]. The burning of this crop residue produces a vast amount of GHG emissions, estimated at 0.9 kg CO2/kg-rice husk [57]. This crop burning practice has a harmful impact not only on humans but also on animals and birds. Due to residue burning, a very lightweight particulate matter is generated, which causes massive smog, as it can stay in the air for a long time and travels along with the wind for hundreds of kilometers [58]. In October 2017, crop fires in and across the border in Indian provinces produced a considerable amount of smoke. This smoke mixed with fog with cooler weather in November and resulted in dangerous amounts of pollution. The smoke particles and fog, industrial pollution, and dust formed a particularly thick haze for several days in November 2017. On 7 November 2017, the Moderate Resolution Imaging Spectroradiometer (MODIS) on NASA’s Aqua satellite captured a natural-color image of haze and fog blanketing the region, as shown in Figure 6 and Figure 7 below.
Figure 7 shows the effect of airborne particles on absorption and reflection of light by the atmosphere, with the aerosol pollution shown in red-brown color.
As shown in Figure 6 and Figure 7, the immense pollution caused by carbon emissions is a real danger to achieving the global warming and emission control goals. This disaster in the past became a primary reason for selecting wheat straw, rice husk, and corn husk as waste for the composite construction material. The burning of organic waste materials is a common practice [60] that is followed in the region. The literature presents the work related to these composites. Saman et al. determined the fired clay brick composite thermophysical properties with rice husk, corn cob, and waste tea [61]. Phonphuak et al. experimentally determined the physical and mechanical properties of fired clay brick samples with different percentages of rice husk [62]. Using these materials in construction will help mitigate the emissions. If these waste materials become a sellable commodity for construction, it will provide the farmers with an incentive to avoid burning. This work, therefore, studies the disposal of the said organic waste materials by using them in construction to achieve the following two significant advantages.
  • First, the improvement in thermal comfort of the buildings with reduced energy usage.
  • Second, a significant reduction in greenhouse gas emissions volume resulted from burning these waste materials.
These aims align with the targets set by the IEA-COP26 Net Zero Summit of realizing net zero emissions by 2050 [63].
Brick samples using 2%, 4%, and 6% of these three organic waste material ratios by weight were produced. The waste residues of wheat straw, corn husk, and rice husk used in this study are shown in Figure 8, while the compressed brick samples produced are depicted in Figure 9 below.
The method described earlier was used to calculate the thermal properties of these brick samples and the results are shown in Table 3.

5. Computational Analysis

The thermal properties established during the above detailed experimental study were used for computational analysis to calculate the heating and cooling loads for a selected building. The computational analysis also established how much energy use and GHG emissions due to energy saving can be reduced. The computational analysis was performed using TRNSYS simulation software [64]. The local weather conditions were used to calculate the annual heating and cooling loads for a two-story building of an academic institute located in Islamabad. To conduct the simulations, the building was designed using TRNSYS plugin TRNSYS3D in Google SketchUp. The modeled building design is shown in Figure 10.
The selected building envelope building properties with the selected materials are defined in TRNSYS using the TRNBuild tool. The heating and cooling loads using each of the selected envelope materials are obtained for the entire year. The simulation results are compared to show the thermal efficiency of the designed materials. The thermal behavior of the building is simulated using building envelope properties for a nine-inch-thick brick wall of experimentally studied materials, with half-inch plaster on both sides. Properties of plaster used are thermal conductivity 0.5 W/m-K, heat capacity 1.00 kJ/kg-K, and density 1300 kg/m3 [23]. The ground floor ceilings are designed as four-inch concrete slabs with half-inch plaster on both sides. The thermal properties of concrete used are thermal conductivity of 1.30 W/m-K, the specific heat capacity of 1.13 kJ/kg-K, and a concrete density of 2240 kg/m3 [29]. Properties of plaster are the same as those used in the case of the wall.
Properties of the external roof of the building are defined as a four-inch concrete slab whose properties are with half-inch plaster covered with one inch of granite having thermal conductivity 1.87 W/m-K, specific heat capacity 0.71 kJ/kg-K, and density of 2200 kg/m3 [23].
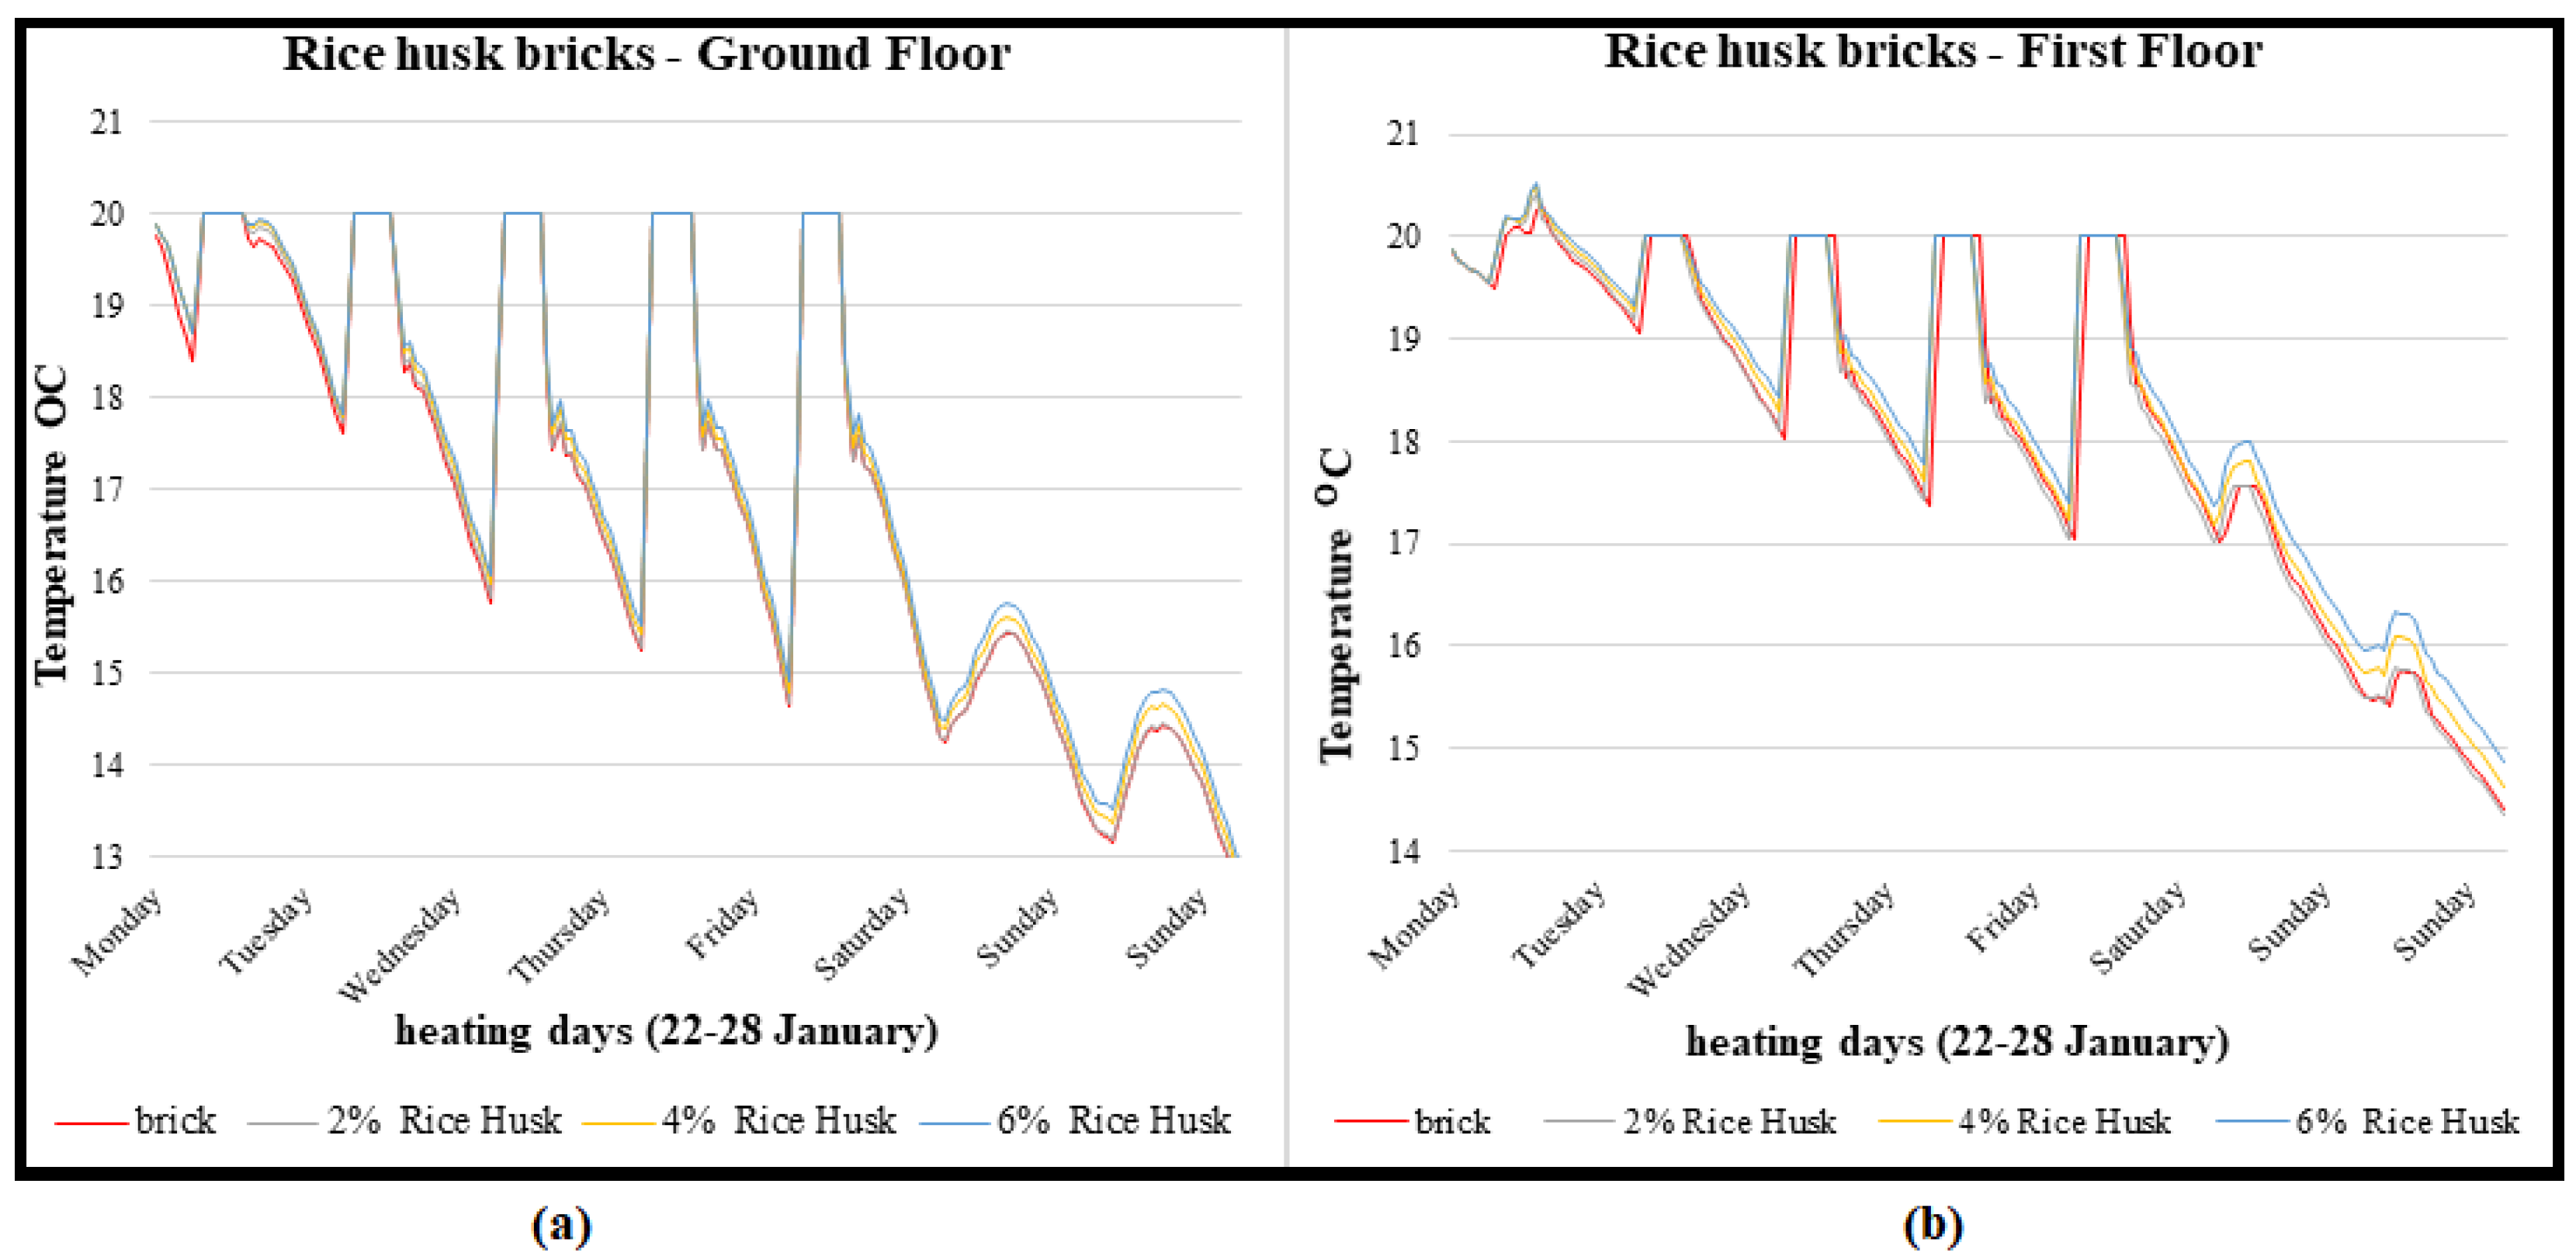
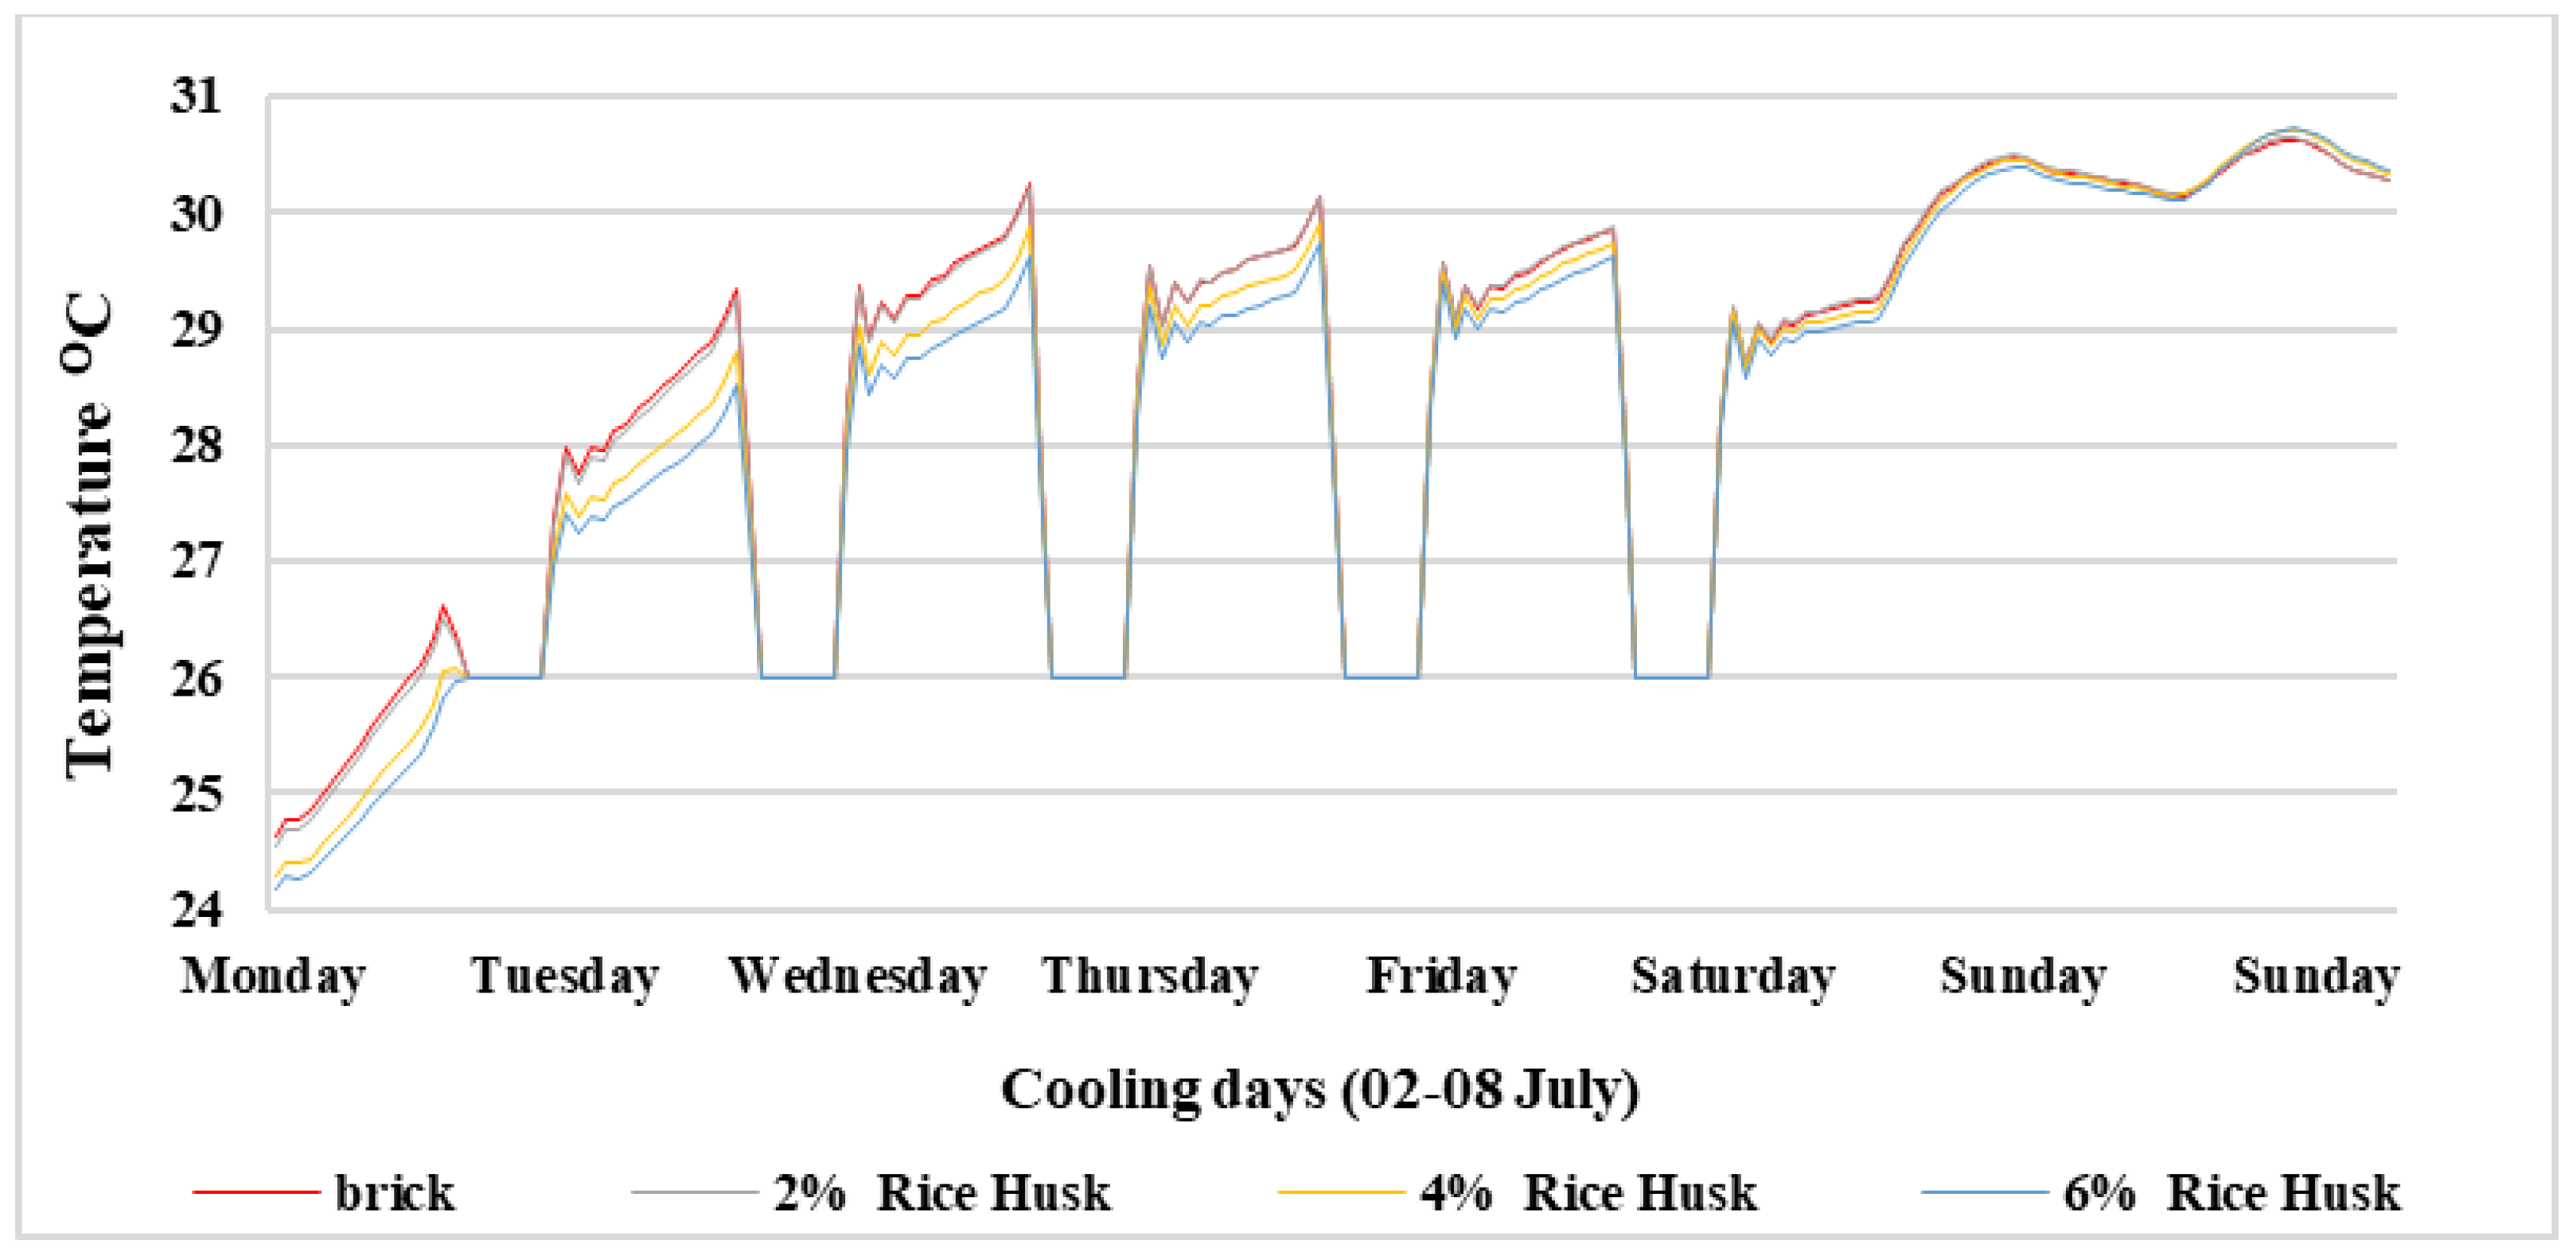
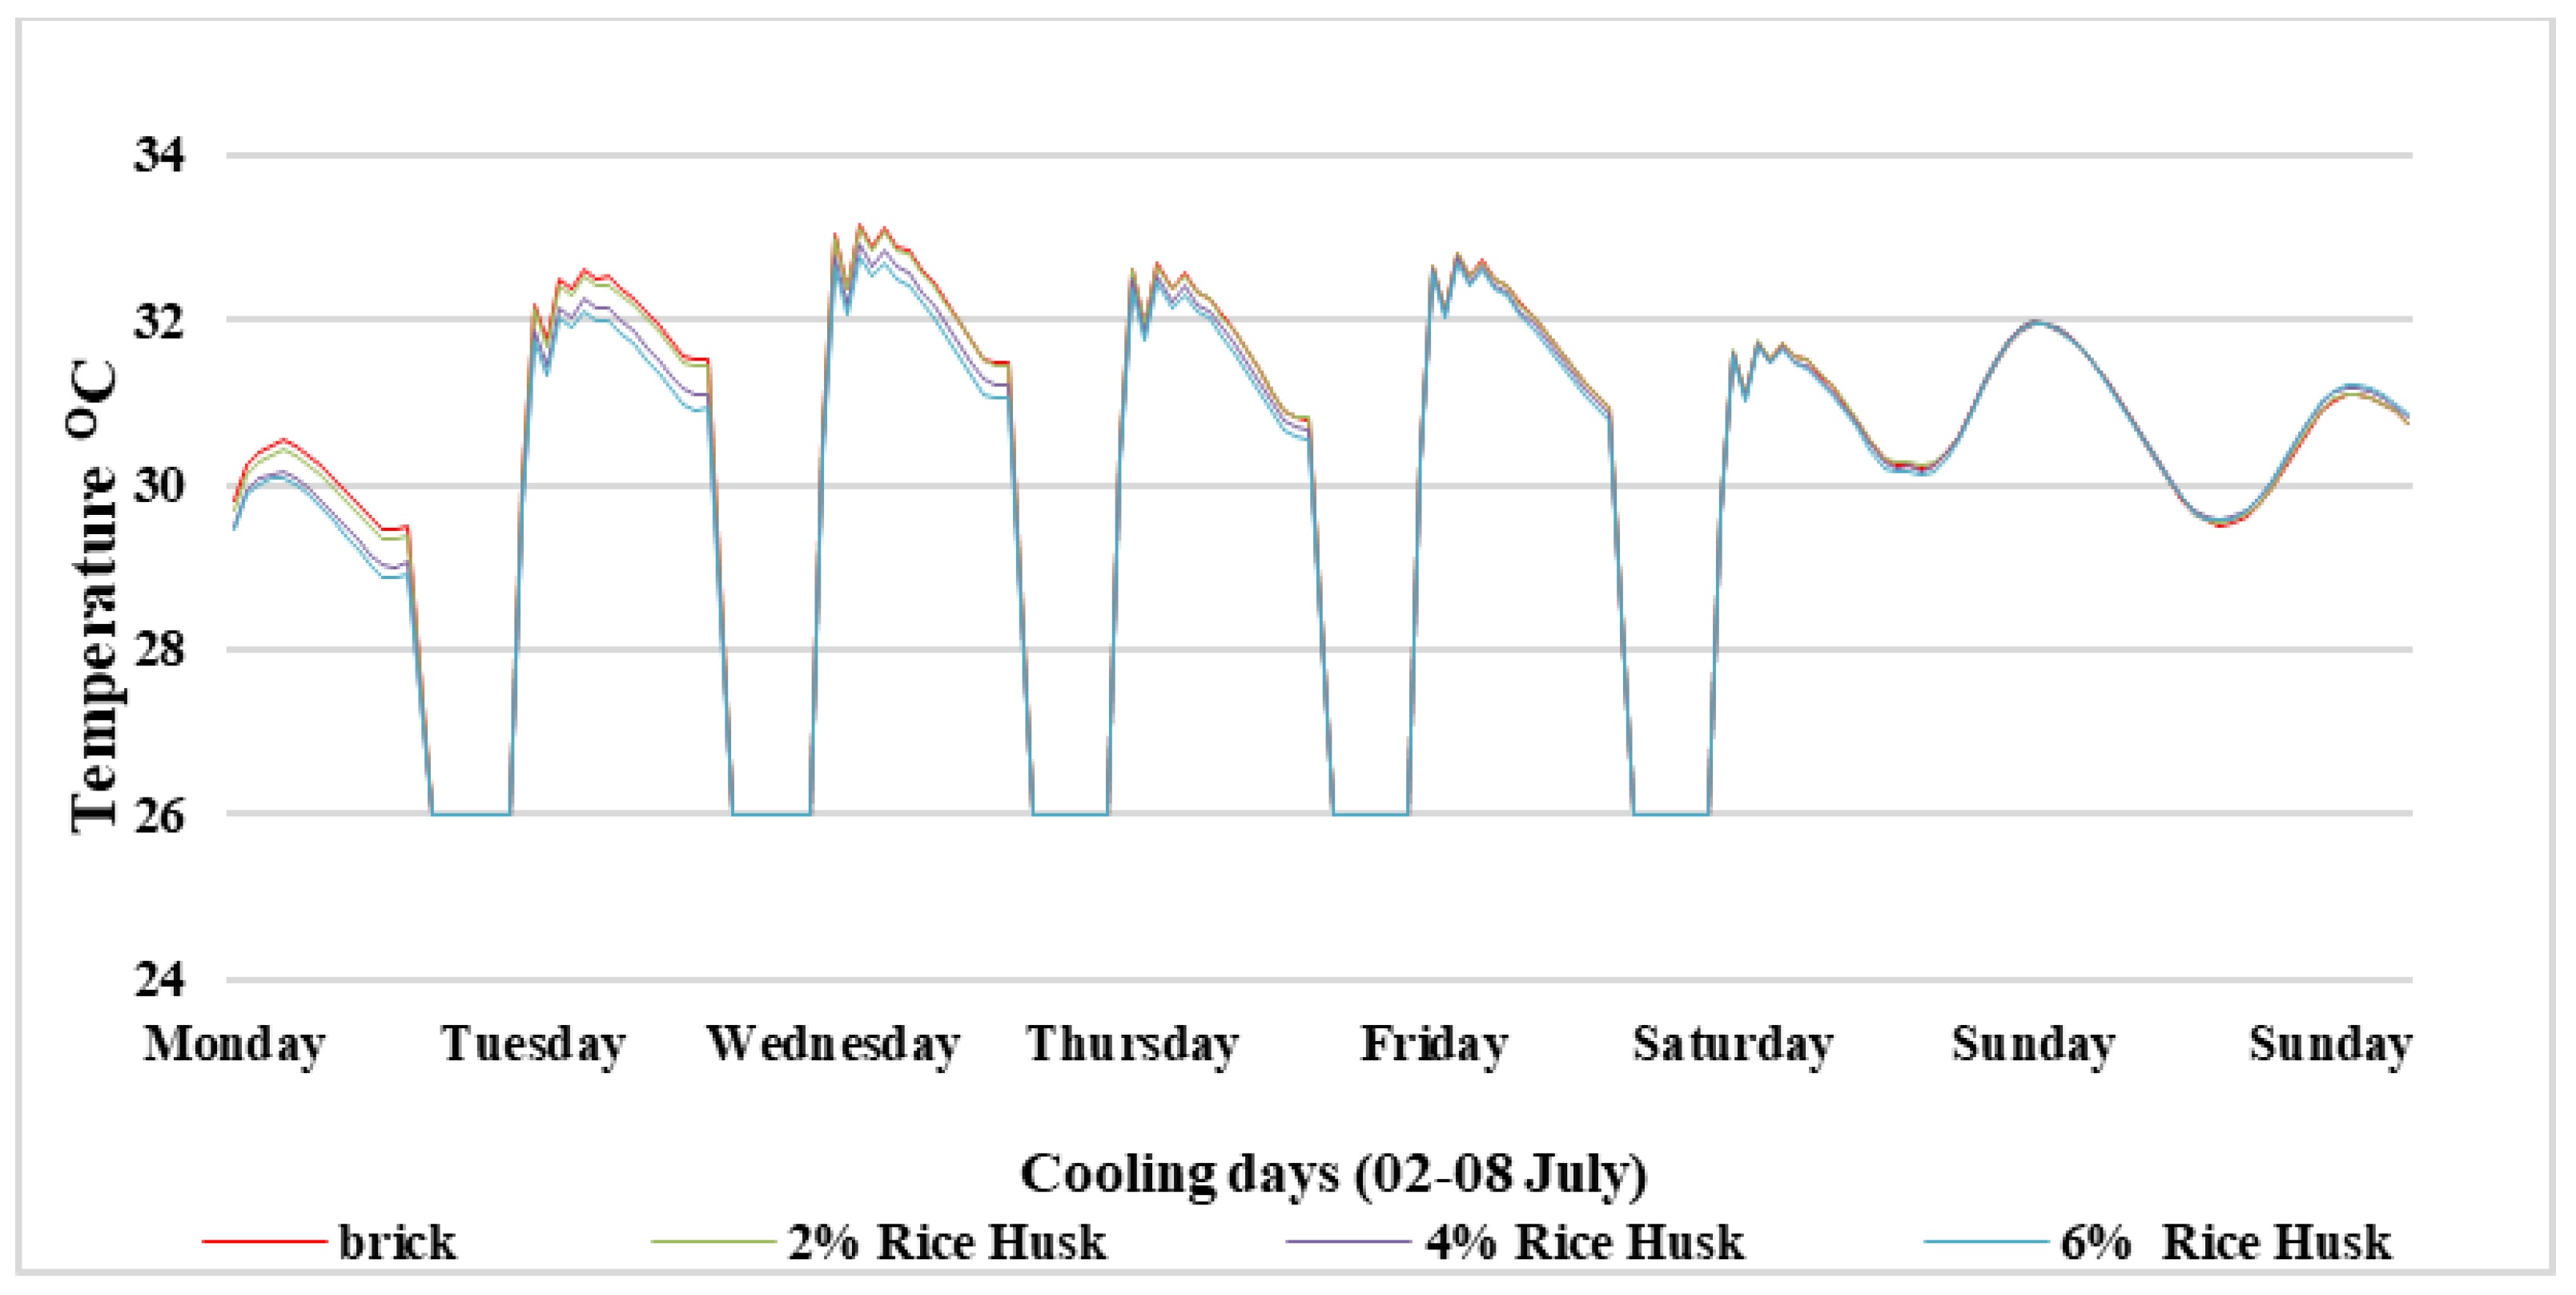
For the winter months, the required 20 °C temperature is set to calculate the heating load. During the summer months, 26 °C temperature is set as the requirement to calculate the cooling load. The reference building is an academic institute building, so heating and cooling loads are calculated according to the institute work timing of 08:00 AM to 06:00 PM for working days, while Saturday and Sunday are considered the closed weekend. The heating load is calculated for January, February, March, October, November, and December, while the cooling load is calculated for March, April, May, June, July, August, September, and October.

6. Results and Discussion

6.1. Heating Load

The heating load of the schedule mentioned above is simulated in TRNSYS simulation software. As an example, the heating load of the last week of January using rice husk composite bricks in the building envelope is shown in Figure 11. The school is in session from Monday to Friday and hence the heating load on weekends is negligible. It is clear in Figure 11 that heating load decreases with the increase of composite material mixing ratio. Higher room temperature is kept on both floors when composite bricks with a 6% husk composition are used for construction. The above results show that the rice husk mixing increases the heat storage capacity of the building envelope. The detailed results for the heating load calculated are given in Table 4.
Trends of energy consumption for rice husk, wheat straw, and corn husk with different mixing ratios are shown in Figure 12. These results indicate that increasing the mixing density of all three composite materials causes an appreciable decrease in the energy required to heat the building. Among the three materials selected for this study, it is found that the mixing of corn husk provides the best results, and the energy needed to maintain thermal comfort level is decreased substantially by approximately 15.6% when compared with the standard brick construction.

6.2. Cooling Load

The cooling load for the building ground and the first floor of the days mentioned above and the schedule are simulated in TRNSYS simulation software. For example, the cooling load of the first week of July using rice husk composite bricks in the building envelope is shown in Figure 13 and Figure 14. The results show that cooling load decreases with the increase of composite material mixing ratio. Lower room temperature is kept on both floors when composite bricks with a 6% husk composition are used for construction. This shows that the rice husk mixing increases the building envelope’s heat storage capacity, thus allowing lesser heat to be transmitted from the surroundings to inside the building. The results for cooling load are calculated for different density ratios of three selected waste materials and are given in Table 5.
As seen in the graph, cooling load is decreasing with the increase of the composite material mixing ratio. The detailed results for the cooling load calculated are given in Table 5.
Trends of energy consumption for rice husk, wheat straw, and corn husk with different mixing ratios are shown in Figure 15 below. These results indicate that increasing the mixing density of all three composite materials causes a decrease in the energy needed to cool the building. Among the three materials selected for this study, it is found that the mixing of corn husk provides the best results, and the energy needed to keep thermal comfort level is decreased and a saving of 36 GJ is achieved by using 6% corn husk bricks for the building envelope when compared with the standard brick construction.

6.3. CO2 Emissions

CO2 emissions during the production of the materials and building life cycle (assumed to be 40 years) are shown in Table 6. CO2 emission during the production of 1000 bricks is 427.985 kg [60]. The total wall area of the building is 2043 m2 (excluding windows area; the total number of bricks for that area is calculated by taking the brick size of 9 × 4.5 × 3 inches, and the size of the in-between plaster layer of 0.12 inch (3 mm). The total number of bricks used during the construction of the building comes out to be 258,427 and the total CO2 emission during the production of a standard brick used in the building is calculated to be 0.12 MtCO2e, while the emission during the production of proposed samples is almost zero because manual compression is used for their preparation.

7. Introducing PCM Layer

The above analysis showed the advantage of using composite building blocks; by finding a significant reduction in energy consumption and GHG emissions and to further consolidate this advantage and avoid the use of cooling altogether while providing better thermal comfort for the dwellers in low-cost housings, the use of PCMs was considered. BenZaid et al. experimentally determined the thermal advantage of using PCMs in clay–straw walls in Morocco [65]. Usually, as already mentioned, the cost of PCMs is high [66]. Paraffin is one choice available to be used as a PCM in the human thermal comfort range. However, paraffin is considered a fire hazard and still expensive for use in low-cost housing. Hydrated salts are not a fire hazard coupled with higher volumetric storage abilities and are among the least expensive PCMs available [67]. Considering this, calcium chloride hexahydrate CaCl2·6H2O was selected for this study. The thermophysical properties of CaCl2·6H2O are given in Table 7. As thermophysical properties given in Table 7 of selected PCM include both solid and liquid phases of material along with the melting temperature around 29 °C, it shows that when the temperature reached this threshold, the PCM would change its phase from solid to liquid by using heat to change its phase at a constant temperature.
To prove the relative advantage of incorporating PCMs and composite material blocks in the construction of low-cost housing, a wall was modeled in ANSYS software. Simulation of heat transfer through the wall was conducted for the full-fired brick wall, entire composite 6% corn husk block wall, fired brick wall with embedded PCM, and composite 6% corn husk block wall with embedded PCM.
Simulations were conducted for weather conditions of the first ten days of June. In simulations, the time-dependent energy equation is solved for fired brick and 6% corn husk composite block case, while for PCM, the enthalpy porosity-based energy equation is used. SIMPLE (semi-implicit method) pressure velocity coupling and second-order upwind formulation for energy are used. A time step size of 60 s is selected.

7.1. Wall Geometry

The wall geometries for all four wall configurations are given in Figure 16. A 10 mm layer of PCM is embedded at the horizontal center of the 220 mm wall thickness used in this study. Configurations for fired brick and 6% corn husk composite block are considered. Comparison for indoor temperature is obtained for all configurations for the climatic conditions of the first ten days of June of Islamabad, Pakistan. It is characterized as humid subtropical weather with all four seasons, including a hot summer typically from May to August. The latitude and longitude of Islamabad are 33.6844° N and 73.0479° E, respectively.
The outdoor transient temperature profile is input in all the cases, and free convection with a heat transfer coefficient of 5 W/m2 at the outlet boundary is used to simulate the typical wall loading of a hot climate. The top and bottom sides are set as adiabatic for 1-dimensional heat transfer.

7.2. Simulation Results for PCM Wall

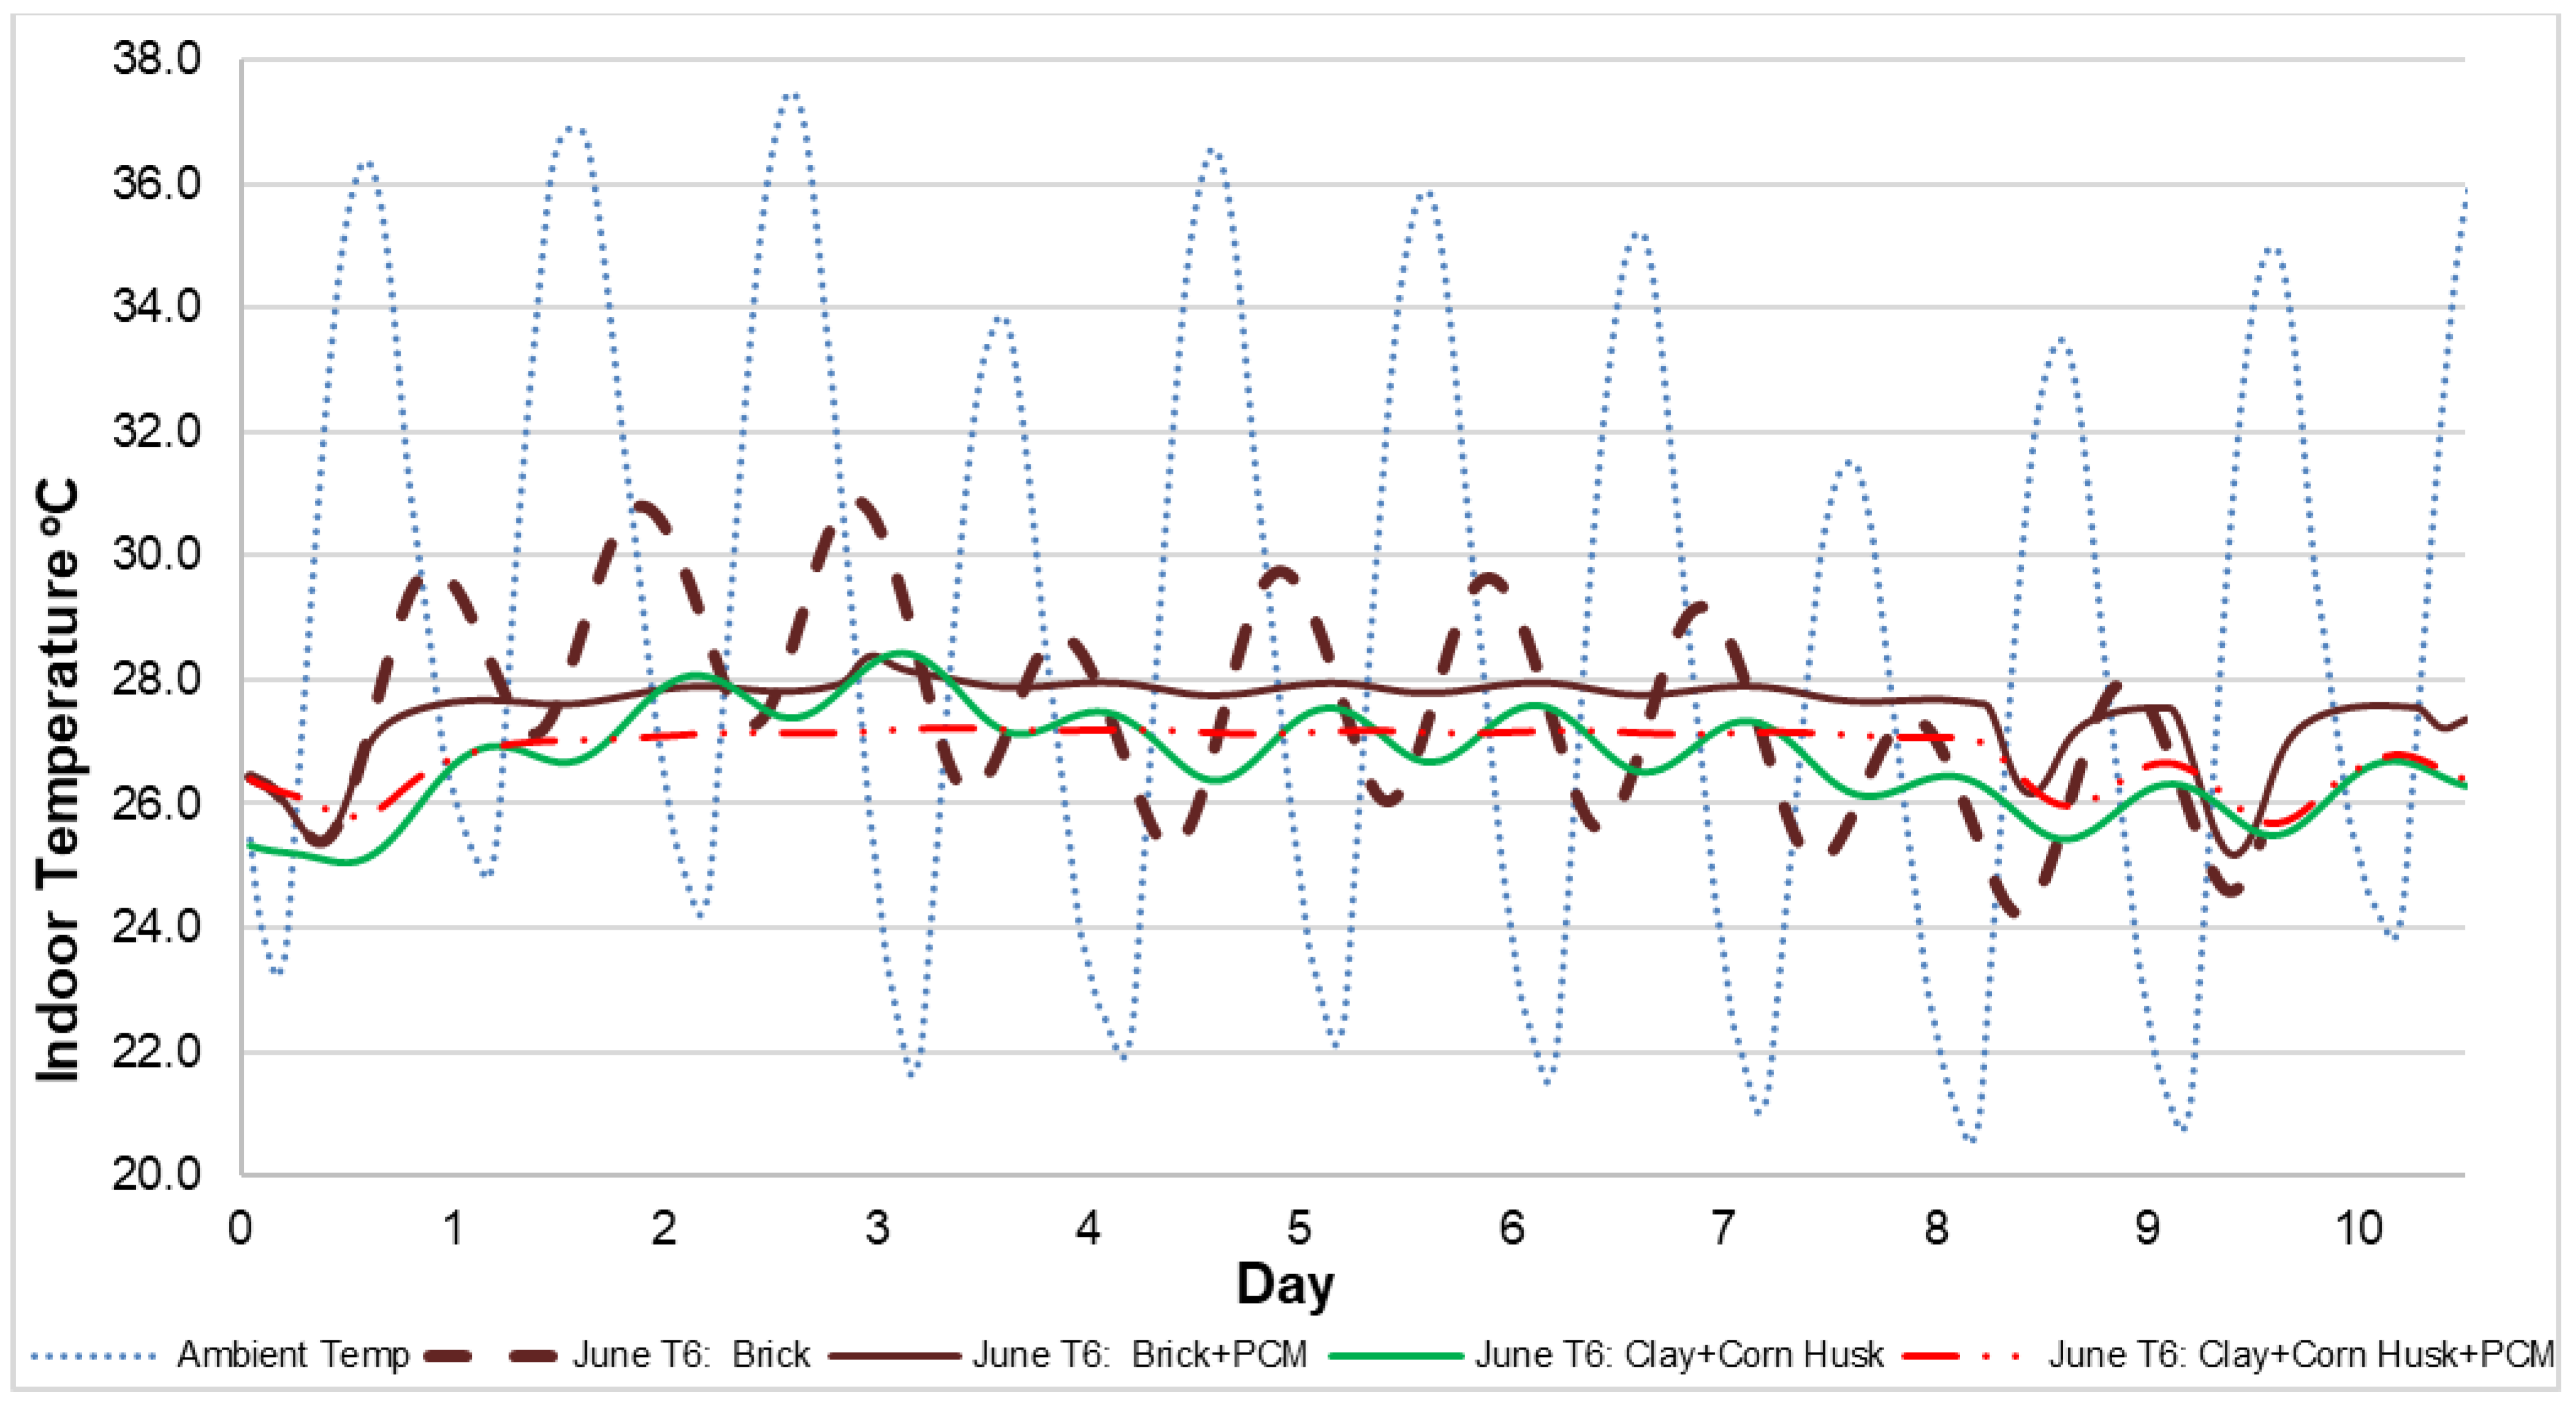
The outdoor boundary condition and the indoor temperatures for the first ten days of June and the simulation results depicting indoor temperature variation with outdoor ambient conditions are shown in Figure 17. It can be seen from these results that standard fired brick wall performs quite poorly, and much higher temperatures are experienced indoors, at times reaching as high as 31 °C, which is considered beyond the human thermal comfort range. The fired brick wall without PCM integration shows a high sensitivity to the outdoor temperature, showing that it does not protect the inhabitants from the varying weather conditions. Even with a PCM layer, the fired brick wall does not perform too well, and the performance of the 6% Corn Husk composite block wall even without any PCM layer is better than a brick wall. In comparison, the 6% Corn Husk composite block wall with the PCM layer is very stable and can keep an indoor temperature of 27 °C throughout the day, even on scorching days when the outdoor ambient temperatures are reaching close to 38 °C. For the first three days, the indoor temperature for PCM-based fired brick wall fluctuates between 27–28 °C, showing temperature fluctuating within the 1 °C range, whereas the fired brick shows temperature fluctuation of 4 °C. The trend is continued for fired brick with and without PCM for days 4–7. For days 8–10, both simple fired brick and embedded PCM exhibit more significant temperature variation, as the outdoor temperature peaks lower than preceding days.
Furthermore, the 6% Corn Husk configuration without PCM maintains a lower temperature than the PCM-based fired brick configuration but fluctuates throughout ten days, while PCM based configuration keeps a constant temperature for days 1–8. This shows PCM’s latent heat thermal energy storage capability, which makes them a potential candidate for energy storage in buildings at a constant temperature. Moreover, this implies integrating PCMs with alternative sustainable materials solutions for construction to give a better trade-off with energy consumption and construction cost. It can thus be concluded that the 6% Corn Husk composite block with integrated PCM can provide reasonable thermal comfort and is a good choice as a construction material for low-cost housing projects.

8. Conclusions

Sustainable and organic waste materials like corn husk, rice husk, and wheat straw are abundantly available in Pakistan. Experimental and simulation studies show how they can help save energy when used in construction materials. Thermo-physical properties and thermal energy storage of base materials are improved by mixing the suggested organic waste materials in different weight ratios. The overall result shows that mixing of corn husk in base material improves its thermo-physical properties and thermal energy storage better than rice husk and wheat straw, but rice husk and wheat straw can also help reduce the consumption of energy in building sectors. The use of waste agri-materials to create the suggested building material can save energy consumption of buildings by up to 3.5% and reduce carbon dioxide during production and usage. Standard fired bricks used for the construction of the buildings are baked using coal or other harmful fuels. CO2 emission to produce 1000 bricks is 120 MtCO2e, while in the production of sustainable material bricks using manual compression, no emission of CO2 occurs during the production. Similarly, a considerable amount of CO2 emissions is also saved by preventing the burning of waste agri-materials and using them as building materials.
PCMs using their thermal characteristics can store and use heat to change their phase at a constant temperature, which provides a better opportunity for building design primarily from a thermal comfort point of view. However, a low-cost PCM should be integrated with new and innovative construction materials such as those derived from agriculture waste materials to be possible. This unique combination not only reduces energy consumption and cost but also has an impact on GHG emission reduction. It is further concluded that integrating PCM within the Corn Husk composite block wall stabilizes the indoor temperature and provides reasonable thermal comfort for humans. This combination can keep a constant 27 °C temperature indoors without cooling even when the outdoor temperatures are very high. Therefore, the corn husk composite blocks with integrated PCM are recommended as good construction material for low-cost low-energy buildings. In future work, it is envisaged that a detailed error analysis of experiments may be performed. Furthermore, samples of these agriculture waste-compressed composite bricks need to be characterized for structural and mechanical properties. Experimental testing of a building with a PCM-integrated composite wall may be conducted to find the heat transfer characteristics of the building envelope and the level of thermal comfort achieved. A detailed economic analysis including life-cycle costing and emissions of construction using the compressed composite bricks in comparison to energy savings when compared to fired brick structures may be conducted.

Author Contributions

Conceptualization, A.U.R., N.G., S.R.S. and Z.K.; data curation, A.U.R., N.G., S.R.S. and F.S. formal analysis, S.R.S., F.S. and M.F.S.; investigation, S.R.S., Z.K. and F.S.; methodology, A.U.R., S.R.S., Z.K. and F.R.; project administration, S.R.S. and Z.K.; resources, S.R.S., F.R. and F.S.; software, A.U.R., N.G. and S.R.S.; supervision, S.R.S. and Z.K.; validation, S.R.S., Z.K. and F.S.; visualization, A.U.R. and N.G.; writing—original draft, A.U.R. and S.R.S.; writing—review and editing, F.S., M.F.S. and H.Y. All authors have read and agreed to the published version of the manuscript.

Funding

This research received no external funding.

Data Availability Statement

Not applicable.

Acknowledgments

The support of the Air University Mechatronics Engineering Department and lab staff was crucial in the completion of work.

Conflicts of Interest

The authors declare no conflict of interest.

Nomenclature

PCMPhase Change Material
TESThermal Energy Storage
CaCl2·6H2OCalcium Chloride Hexahydrate
MtCO2eMillion tons of carbon dioxide equivalent
PVPhotovoltaic
GHGGreen House Gases
MWMegawatt
CFDComputational Fluid Dynamics
ρ Density (kg/m3)
v Volume
T Temperature difference
C p Specific Heat Capacity (kJ/kg-K)
k Thermal Conductivity (W/m-K)
e 1 Thickness of sample
e 2 Thickness of polystyrene
U Voltage
R Resistance of heating element
S Surface area
k 1 Thermal conductivity of the sample
k 2 Thermal conductivity of polystyrene
Q Applied heat
Q ˙ c o n d Heat Conduction Rate
d T d x Temperature gradient
U Applied voltage
R Resistance of the heating element
EIAEnergy Information Administration
kNKilonewton
αThermal diffusivity (m2/s)
MODISModerate Resolution Imaging Spectroradiometer
NASANational Aeronautics and Space Administration
GJGigajoule
CCSClay Cement Sand
CO2Carbon dioxide
AgriAgriculture
mmeter
mmmillimeter
Ωohm

References

  1. Buildings—Topics—IEA. Available online: https://www.iea.org/topics/buildings (accessed on 14 March 2021).
  2. U.S. Department of Energy (DOE). Innovations in Sensors and Controls for Building Energy Management. Office Energy Efficiency Renewable Energy; U.S. Department of Energy: Washington, DC, USA, 2020.
  3. Tulapurkar, C.; Subramaniam, P.R.; Thagamani, G.; Thiyagaranjin, R. Phase change materials for domestic refrigerators to improve food quality and prolong compressor off time. In Proceedings of the International Refrigeration and Air Conditioning Conference 2010, West Lafayette, IN, USA, 12–15 July 2010. Paper 1044. [Google Scholar]
  4. Nada, S.A.; Alshaer, W.G.; Saleh, R.M. Experimental investigation of PCM transient performance in free cooling of the fresh air of air conditioning systems. J. Build. Eng. 2020, 29, 101153. [Google Scholar] [CrossRef]
  5. Hasan, A.; McCormack, S.J.; Huang, M.J.; Norton, B. Evaluation of phase change materials for thermal regulation enhancement of building integrated photovoltaics. Sol Energy 2010, 84, 1601–1612. [Google Scholar] [CrossRef] [Green Version]
  6. Tyagi, V.V.; Buddhi, D. PCM thermal storage in buildings: A state of art. Renew. Sust. Energ. Rev. 2007, 11, 1146–1166. [Google Scholar] [CrossRef]
  7. Castell, A.; Martorell, I.; Medrano, M.; Pérez, G.; Cabeza, L.F. Experimental study of using PCM in brick constructive solutions for passive cooling. Energy Build. 2010, 42, 534–540. [Google Scholar] [CrossRef]
  8. Akeiber, H.; Nejat, P.; Majid, M.Z.A.; Wahid, M.A.; Jomehzadeh, F.; Zeynali Famileh, I.; Calautit, J.K.; Hughes, B.R.; Zaki, S.A. A review on Phase Change Material (PCM) for sustainable passive cooling in building envelopes. Renew. Sust. Energ. Rev. 2016, 60, 1470–1497. [Google Scholar] [CrossRef]
  9. Zhang, Y.; Zhou, G.; Lin, K.; Zhang, Q.; Di, H. Application of latent heat thermal energy storage in buildings: State-of-the-art and outlook. Build. Environ. 2007, 42, 2197–2209. [Google Scholar] [CrossRef]
  10. de Gracia, A.; Cabeza, L.F. Phase change materials and thermal energy storage for buildings. Energy Build. 2015, 103, 414–419. [Google Scholar] [CrossRef] [Green Version]
  11. Al-Yasiri, Q.; Szabó, M. Incorporation of phase change materials into building envelope for thermal comfort and energy saving: A comprehensive analysis. J. Build. Eng. 2021, 36, 102122. [Google Scholar] [CrossRef]
  12. Cabeza, L.F.; Castellón, C.; Nogués, M.; Medrano, M.; Leppers, R.; Zubillaga, O. Use of microencapsulated PCM in concrete walls for energy savings. Energy Build. 2007, 39, 113–119. [Google Scholar] [CrossRef]
  13. Cabeza, L.F.; Castell, A.; Barreneche, C.; de Gracia, A.; Fernández, A.I. Materials used as PCM in thermal energy storage in buildings: A review. Renew. Sust. Energ. Rev. 2011, 15, 1675–1695. [Google Scholar] [CrossRef]
  14. Riffat, S.B.; Mardiana, A. Building energy consumption and carbon dioxide emissions: Threat to climate change. J. Earth Sci. Clim. Change 2015, S3. [Google Scholar] [CrossRef] [Green Version]
  15. Christiansen, L.; Bois von Kursk, O.; Haselip, J.A. Emissions Gap Report 2018; United Nations Environment Programme: Nairobi, Kenya, 2018; ISBN 9789280737264. [Google Scholar]
  16. Kaneda, T.; Greenbaum, C.; Patierno, K. World Population Data Sheet with Focus on Changing Age Structures; Population Reference Bureau: Nairobi, Kenya, 2018; pp. 1–4. [Google Scholar]
  17. Shah, D.; Amin, N.; Kakli, M.B.; Piracha, Z.F.; Zia, M.A. Pakistan Education Statistics 2016–17; National Education Management Information System (NEMIS): Islamabad, Pakistan; Academy of Educational Planning and Management (AEPAM): Islamabad, Pakistan, 2018; 208p.
  18. Pakistan Education Statistics. An Analysis of Educational Indicators of Pakistan; Pakistan Education Statistics: Islamabad, Pakistan, 2011; 244p. [Google Scholar]
  19. Crosby Kate, A.B.M. Powering Down: A Toolkit for Behaviour-Based Energy Conservation in K-12 Academic Institutions; US Green Building Council (USGBC): Washington, DC, USA, 2012. [Google Scholar]
  20. Zaman, Q.U.Z. Climate Change Profile of Pakistan; Asian Development Bank: Manila, Philippine, 2017; Available online: https://www.adb.org/sites/default/files/publication/357876/climate-change-profile-pakistan.pdf (accessed on 9 March 2021).
  21. World Bank Group. Pakistan Development Update October 2018—At a Crossroad. Available online: https://openknowledge.worldbank.org/handle/10986/30527 (accessed on 12 May 2021).
  22. Global Carbon Project; Carbon Dioxide Information Analysis Centre (CDIAC). Pakistan: CO2 Country Profile. Available online: https://ourworldindata.org/co2/country/pakistan (accessed on 12 May 2021).
  23. Asan, H.; Sancaktar, Y.S. Effects of wall’s thermophysical properties on time lag and decrement factor. Energy Build. 1998, 28, 159–166. [Google Scholar] [CrossRef]
  24. Bal, H.; Jannot, Y.; Gaye, S.; Demeurie, F. Measurement and modelisation of the thermal conductivity of a wet composite porous medium: Laterite based bricks with millet waste additive. Constr Build Mater. 2013, 41, 586–593. [Google Scholar] [CrossRef]
  25. Estabragh, A.R.; Khatibi, M.; Javadi, A.A. Effect of cement on treatment of a clay soil contaminated with glycerol. J. Mater. Civ. Eng. 2016, 28, 04015157. [Google Scholar] [CrossRef] [Green Version]
  26. D’Amico, B.; Pomponi, F.; Hart, J. Global potential for material substitution in building construction: The case of cross laminated timber. J. Clean. Prod. 2021, 279, 123487. [Google Scholar] [CrossRef]
  27. Zomorodian, Z.S.; Tahsildoost, M.; Hafezi, M. Thermal comfort in educational buildings: A review article. Renew. Sust. Energ. Rev. 2016, 59, 895–906. [Google Scholar] [CrossRef]
  28. Cabeza, L.F. Thermal energy storage. Compr. Renew. Energy 2012, 3, 211–253. [Google Scholar]
  29. Tatsidjodoung, P.; le Pierrès, N.; Luo, L. A review of potential materials for thermal energy storage in building applications. Renew. Sust. Energ. Rev. 2013, 18, 327–349. [Google Scholar] [CrossRef]
  30. Khabbazi, A.; Garoum, M.; Terhmina, O. Experimental study of thermal and mechanical properties of a new insulating material based on cork and cement mortar. AMSE J. Adv. Model. Simul. 2005, 74, 73–80. [Google Scholar]
  31. Cherki, A. Thermal properties characterization of materials based on granular cork. Phys. Chem. News 2013, 67, 90–93. [Google Scholar]
  32. Cherki, A.B.; Remy, B.; Khabbazi, A.; Jannot, Y.; Baillis, D. Experimental thermal properties characterization of insulating cork-gypsum composite. Constr. Build Mater. 2014, 54, 202–209. [Google Scholar] [CrossRef]
  33. Cherki, A.B.; Khabbazi, A.; Remy, B.; Baillis, D. Granular cork content dependence of thermal diffusivity, thermal conductivity and heat capacity of the composite material/granular cork bound with plaster. Energy Procedia 2013, 42, 83–92. [Google Scholar] [CrossRef]
  34. Mounir, S.; Maaloufa, Y.; Cherki, A.B.; Khabbazi, A. Thermal properties of the composite material clay/granular cork. Constr Build Mater. 2014, 70, 183–190. [Google Scholar] [CrossRef]
  35. Mounir, S.; Khabbazi, A.; Khaldoun, A.; Maaloufa, Y.; el Hamdouni, Y. Thermal inertia and thermal properties of the composite material clay-wool. Sustain. Cities Soc. 2015, 19, 191–199. [Google Scholar] [CrossRef]
  36. Kriker, A.; Debicki, G.; Bali, A.; Khenfer, M.M.; Chabannet, M. Mechanical properties of date palm fibres and concrete reinforced with date palm fibres in hot-dry climate. Cem. Concr. Compos. 2005, 27, 554–564. [Google Scholar] [CrossRef]
  37. Tlijani, M.; ben Younes, R.; Durastanti, J.F.; Boudenne, A. A simultaneous characterization and uncertainty analysis of thermal conductivity and diffusivity of bio-insulate material “palm date wood” obtained from a periodic method. IOP Conf. Ser. Mater. Sci. Eng. 2010, 13, 012015. [Google Scholar] [CrossRef]
  38. Agoudjil, B.; Benchabane, A.; Boudenne, A.; Ibos, L.; Fois, M. Renewable materials to reduce building heat loss: Characterization of date palm wood. Energy Build. 2011, 43, 491–497. [Google Scholar] [CrossRef]
  39. Mekhermeche, A.; Kriker, A.; Dahmani, S. Contribution to the study of thermal properties of clay bricks reinforced by date palm fiber. AIP Conf. Proc. 2016, 1758, 030004. [Google Scholar] [CrossRef]
  40. Benmansour, N.; Agoudjil, B.; Gherabli, A.; Kareche, A.; Boudenne, A. Thermal and mechanical performance of natural mortar reinforced with date palm fibers for use as insulating materials in building. Energy Build. 2014, 81, 98–104. [Google Scholar] [CrossRef]
  41. Laaroussi, N.; Cherki, A.; Garoum, M.; Khabbazi, A.; Feiz, A. Thermal properties of a sample prepared using mixtures of clay bricks. Energy Procedia 2013, 42, 337–346. [Google Scholar] [CrossRef]
  42. Laaroussi, N.; Lauriat, G.; Garoum, M.; Cherki, A.; Jannot, Y. Measurement of thermal properties of brick materials based on clay mixtures. Constr Build. Mater. 2014, 70, 351–361. [Google Scholar] [CrossRef]
  43. Mahamat, A.; Hamid, O.; Soultan, M.; Khayal, M.; Elhamdouni, Y.; Garoum, M.; Gaye, S. Effect of cowś dung on thermophysical characteristics of building materials based on clay. Res. J. Appl. Sci. Eng. Technol. 2015, 10, 464–470. [Google Scholar] [CrossRef]
  44. Lamrani, M.; Laaroussi, N.; Khabbazi, A.; Khalfaoui, M.; Garoum, M.; Feiz, A. Experimental study of thermal properties of a new ecological building material based on peanut shells and plaster. Case Stud. Constr. Mater. 2017, 7, 294–304. [Google Scholar] [CrossRef]
  45. Bhutto, A. Efficient utilization of rice-wheat straw to produce value—Added composite products. Int. J. Chem. Environ. Eng. 2010, 1, 136–143. [Google Scholar]
  46. Bland, A.; Khzouz, M.; Statheros, T.; Gkanas, E.I. PCMs for residential building applications: A short review focused on disadvantages and proposals for future development. Buildings 2017, 7, 78. [Google Scholar] [CrossRef] [Green Version]
  47. Frigione, M.; Lettieri, M.; Sarcinella, A. Phase change materials for energy efficiency in buildings and their use in mortars. Materials 2019, 12, 1260. [Google Scholar] [CrossRef] [PubMed] [Green Version]
  48. Sheikh, S.R.; Koreshi, Z.U.; Ghafoor, N.; Khalil, M.S.; Ghaffar, M. Mitigating CO2 emissions of academic buildings in Pakistan using energy conservation techniques. J. Eng. Appl. Sci. 2019, 38, 75–86. [Google Scholar]
  49. ASTM C177-19 Standard Test Method for Steady-State Heat Flux Measurements and Thermal Transmission Properties by Means of the Guarded-Hot-Plate Apparatus. Available online: https://www.astm.org/Standards/C177.htm (accessed on 8 June 2021).
  50. ISO 8302:1991(en), Thermal insulation—Determination of Steady-State Thermal Resistance and Related Properties—Guarded Hot Plate Apparatus. Available online: https://www.iso.org/obp/ui/#iso:std:iso:8302:ed-1:v1:en (accessed on 8 June 2021).
  51. Online System Manager for OpenVMS: PARSEC Group. Available online: https://www.parsec.com/support/osm/ (accessed on 8 June 2021).
  52. Cengel, Y.; Ghajar, A. Heat and Mass Transfer Fundamentals and Applications; McGraw-Hill Education: New York, NY, USA, 2014; ISBN 9781626239777. [Google Scholar]
  53. ChemTeam: How to Determine Specific Heat. Available online: https://www.chemteam.info/Thermochem/Determine-Specific-Heat.html (accessed on 14 March 2021).
  54. Carbon Dioxide Emission Factors for Coal. Available online: https://www.eia.gov/coal/production/quarterly/co2_article/co2.html (accessed on 14 March 2021).
  55. Balaji, N.C.; Mani, M.; Venkatarama Reddy, B.V. Thermal conductivity studies on cement-stabilised soil blocks. Proc. Inst. Civil Eng. Constr. Mater. 2017, 170, 40–54. [Google Scholar] [CrossRef]
  56. Williams, D.; Raza, A. Pakistan: Grain and Feed Annual; USDA Foreign Agricultural Service: Washington, DC, USA, 2017; pp. 1–11.
  57. Irfan, M.; Riaz, M.; Arif, M.S.; Shahzad, S.M.; Saleem, F.; Rahman, N.U.; van den Berg, L.; Abbas, F. Estimation and characterization of gaseous pollutant emissions from agricultural crop residue combustion in industrial and household sectors of Pakistan. Atmos. Environ. 2014, 84, 189–197. [Google Scholar] [CrossRef]
  58. Singh, C.P.; Panigrahy, S. Characterisation of residue burning from agricultural system in India using space based observations. J. Indian Soc. Remote Sens. 2011, 39, 423–429. [Google Scholar] [CrossRef]
  59. Haze Blankets Northern India. Available online: https://earthobservatory.nasa.gov/images/91240/haze-blankets-northern-india (accessed on 14 March 2021).
  60. Maheshwari, H.; Jain, K. Carbon footprint of bricks production in fixed chimney bull’s trench kilns in India. Indian J. Sci. Technol. 2017, 10, 1–11. [Google Scholar] [CrossRef]
  61. Saman, N.S.M.; Deraman, R.; Hamzah, M.H. Development of low thermal conductivity brick using rice husk, corn cob and waste tea in clay brick manufacturing. AIP Conf. Proc. 2017, 1901, 130007. [Google Scholar] [CrossRef]
  62. Phonphuak, N.; Saengthong, C.; Srisuwan, A. Physical and mechanical properties of fired clay bricks with rice husk waste addition as construction materials. Mater. Today Proc. 2019, 17, 1668–1674. [Google Scholar] [CrossRef]
  63. Energy and Climate Leaders from Around the World Pledge Clean Energy Action at the IEA-COP26 Net Zero Summit—News—IEA. Available online: https://www.iea.org/news/energy-and-climate-leaders-from-around-the-world-pledge-clean-energy-action-at-the-iea-cop26-net-zero-summit (accessed on 8 June 2021).
  64. TRNSYS, a Transient Simulation Program—Catalog—UW-Madison Libraries. Available online: https://search.library.wisc.edu/catalog/999800551102121 (accessed on 8 June 2021).
  65. Ben Zaid, Z.; Tilioua, A.; Lamaamar, I.; Ansari, O.; Souli, H.; Hamdi Alaoui, M.A. An experimental study of the efficacy of integrating a phase change material into a clay-straw wall in the Drâa-Tafilalet Region (Errachidia Province), Morocco. J. Build. Eng. 2020, 32. [Google Scholar] [CrossRef]
  66. Syntroleum Corporation. Low-Cost Phase Change Material for Building Envelopes; Final Report 2013; Syntroleum Corporation: Tulsa, OK, USA, 2013. [Google Scholar]
  67. Sivanathan, A.; Dou, Q.; Wang, Y.; Li, Y.; Corker, J.; Zhou, Y.; Fan, M. Phase change materials for building construction: An overview of nano-/micro-encapsulation. Nanotechnol. Rev. 2020, 9, 896–921. [Google Scholar] [CrossRef]
Figure 1. Emission outlook of different greenhouse gas production sectors of Pakistan [20]. This work is available online under the Creative Commons Attribution 3.0 IGO license (CC BY 3.0 IGO) https://creativecommons.org/licenses/by/3.0/igo/, accessed on 13 June 2021.
Energies 14 03544 g001
Figure 2. Pakistan CO2 emissions from fossil fuel burning and cement production for the last 70 years [22]. This work is available online under the Creative Commons Attribution 3.0 IGO license (CC BY 3.0 IGO) https://creativecommons.org/licenses/by/3.0/igo/, accessed on 13 June 2021.
Energies 14 03544 g002
Figure 3. The yearly variation of CO2 emissions for the period of 1946–2019 [22]. This work is available online under the Creative Commons Attribution 3.0 IGO license (CC BY 3.0 IGO) https://creativecommons.org/licenses/by/3.0/igo/, accessed on 13 June 2021.
Energies 14 03544 g003
Figure 4. Temperature sensors are placed at different locations in the experimental setup.
Energies 14 03544 g004
Figure 5. Experimental setup for thermal conductivity measurement [49,50]. This work is available online under the Creative Commons Attribution 3.0 IGO license (CC BY 3.0 IGO) https://creativecommons.org/licenses/by/3.0/igo/, accessed on 13 June 2021.
Energies 14 03544 g005
Figure 6. NASA’s captured image of haze and fog [59]. This work is available online under the Creative Commons Attribution 3.0 IGO license (CC BY 3.0 IGO) https://creativecommons.org/licenses/by/3.0/igo/, accessed on 13 June 2021.
Energies 14 03544 g006
Figure 7. NASA’s image showing aerosol pollution [59]. This work is available online under the Creative Commons Attribution 3.0 IGO license (CC BY 3.0 IGO) https://creativecommons.org/licenses/by/3.0/igo/, accessed on 13 June 2021.
Energies 14 03544 g007
Figure 8. Different agriculture wastes (a) wheat straw, (b) corn husk, and (c) rice husk.
Energies 14 03544 g008
Figure 9. Manufactured bricks samples based on crop residue (a) wheat straw brick, (b) corn husk brick, and (c) rice husk brick.
Energies 14 03544 g009
Figure 10. The design of the institute building, located in Islamabad.
Energies 14 03544 g010
Figure 11. Ground (a) and first floor (b) heating loads using rice husk composite bricks.
Energies 14 03544 g011
Figure 12. Heating load comparison using different composite materials and mixing ratios.
Energies 14 03544 g012
Figure 13. Ground floor cooling load using rice husk composite bricks.
Energies 14 03544 g013
Figure 14. First-floor cooling load using rice husk composite bricks.
Energies 14 03544 g014
Figure 15. Cooling load comparison using different composite materials and mixing ratios.
Energies 14 03544 g015
Figure 16. Model of fired brick and 6% corn husk composite block walls (ad) with and without PCM.
Energies 14 03544 g016
Figure 17. Simulation results depicting indoor temperature variation with outdoor ambient conditions.
Energies 14 03544 g017
Table 1. Validation of results for thermal conductivity experiments.
MaterialVoltage (V)Material Thickness (m)Polystyrene Temp (°C)Material Temp (°C)Expt. Value of k (W/m-K)Known Value of k (W/m-K)% Difference
Polystyrene1.90.01117.2019.000.04130.04 [42]3.34%
Clay3.50.06021.3824.010.96700.957 [41]1.05%
Brick4.00.07733.0056.880.66240.6–1.0 [42]-
Concrete block3.90.09523.1345.51.1681.0–1.8 [52]-
Table 2. Specific heat capacity, density, thermal conductivity, and thermal diffusivity of the samples.
Sample C p   ( kJ / kg - K ) ρ (kg/m3)k W/(m-K)α m²/s
Clay1.00341686.27450.96700.00057
Clay–Cement0.87671666.66671.01120.00069
Clay–Cement–Sand (CCS)0.68681916.66670.76120.00058
Table 3. Comparison of specific heat capacity, density, thermal conductivity, and thermal diffusivity of clay, clay–cement, and clay–cement–sand samples.
Sample C p   ( kJ / kg - K ) ρ (kg/m3)kW/(m-K)α (m²/s)
Clay–Cement–Sand (CCS)0.68681916.66670.76120.00058
CCS + 2% Rice0.95261874.02800.69790.00039
CCS + 4% Rice1.23421733.33330.53790.00025
CCS + 6% Rice1.45451546.43340.40410.00018
CCS + 2% Wheat0.97481747.78760.67020.00039
CCS + 4% Wheat1.12221442.80440.50890.00031
CCS + 6% Wheat1.23131254.44840.34450.00022
CCS + 2% Corn1.02241680.85110.62690.00036
CCS + 4% Corn1.25501563.02520.45920.00023
CCS + 6% Corn1.37421479.35780.34240.00017
Table 4. Heating load comparison using different composite materials and mixing ratios.
MaterialJanuary (GJ)February (GJ)March (GJ)October (GJ)November (GJ)December (GJ)Total End-Use Energy (GJ)Total Primary Energy (GJ)
Brick69.1434.370.370.0012.3353.31169.52508.56
CCS + 2% Rice69.4534.593.640.0012.3253.53173.53520.59
CCS + 4% Rice66.5933.043.260.0011.2451.16165.29495.87
CCS + 6% Rice64.0531.642.960.0010.4349.09158.17474.51
CCS + 2% Wheat69.0834.373.610.0012.2253.24172.52517.56
CCS +4% Wheat66.3832.803.280.0011.3351.04164.83494.49
CCS +6% Wheat63.1230.962.920.0010.3248.41155.73467.19
CCS +2% Corn68.3733.963.510.0011.9752.65170.46511.38
CCS +4% Corn65.2732.252.770.0010.8850.12161.29483.87
CCS +6% Corn62.8730.932.380.0010.1348.15154.46463.38
Table 5. Cooling load comparison using different composite materials and mixing ratios.
MaterialMarch (GJ)April (GJ)May (GJ)Jun (GJ)Jul (GJ)Aug (GJ)Sep (GJ)Oct (GJ)Total End-Use Energy (GJ)Total Primary Energy (GJ)
Brick0.0024.3474.8783.8981.7369.0149.145.15388.131164.39
CCS + 2% Rice0.0024.4774.9584.0681.8269.1149.105.08388.591165.78
CCS + 4% Rice0.0024.3973.9982.9280.5468.2748.845.07384.021152.06
CCS + 6% Rice0.0024.2773.0181.7279.3067.4048.425.06379.181137.55
CCS + 2% Wheat0.0024.6874.8683.9281.7069.0249.115.08388.371165.12
CCS + 4% Wheat0.0024.5574.1682.9480.7268.3548.975.08384.771154.30
CCS + 6% Wheat0.0024.3273.1981.6579.4267.4648.665.07379.771139.31
CCS + 2% Corn0.0024.6574.6783.6781.4468.8549.105.08387.461162.39
CCS + 4% Corn0.0024.5873.6882.4480.1267.9648.775.07382.621147.86
CCS + 6% Corn0.0024.3972.7481.2978.9367.1248.365.06377.891133.68
Table 6. Carbon dioxide emission during production and building life cycle.
MaterialEnergy Consumption Primary Energy (GJ)Emission during Brick Production (MtCO2e)Total Building Lifecycle Emission (MtCO2e)
Brick1333.9131,011.2437,260.84
+2% Rice1339.31-6250.17
+4% Rice1317.34-6147.65
+6% Rice1295.72-6046.73
+2% Wheat1337.63-6242.34
+4% Wheat1319.13-6155.97
+6% Wheat1295.04-6043.55
+2% Corn1332.85-6220.03
+4% Corn1309.15-6109.39
+6% Corn1288.14-6011.34
Table 7. The thermophysical properties of CaCl2·6H2O.
MaterialDensity (kg/m2)Thermal Conductivity (W/m-K)Specific Heat (J/kg-K)Melting Temperature (°C)Latent Heat (kJ/kg)
Calcium Chloride hexahydrate1710 (solid)1710 (liquid)1.088 (solid)0.539 (liquid)1460 (solid)2130 (liquid)29.7 (lower)29.9 (upper)187.4
Publisher’s Note: MDPI stays neutral with regard to jurisdictional claims in published maps and institutional affiliations.

