
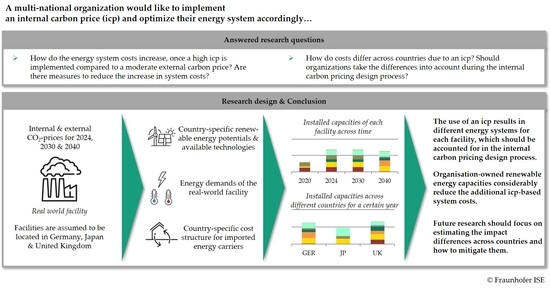
Impact of Internal Carbon Prices on the Energy System of an Organisation’s Facilities in Germany, Japan and the United Kingdom Compared to Potential External Carbon Prices


Abstract
:
1. Introduction
2. Materials and Methods
2.1. Overview
2.2. Optimisation Model
2.3. Data and Assumptions
3. Results
3.1. Germany
Country-Specific Summary
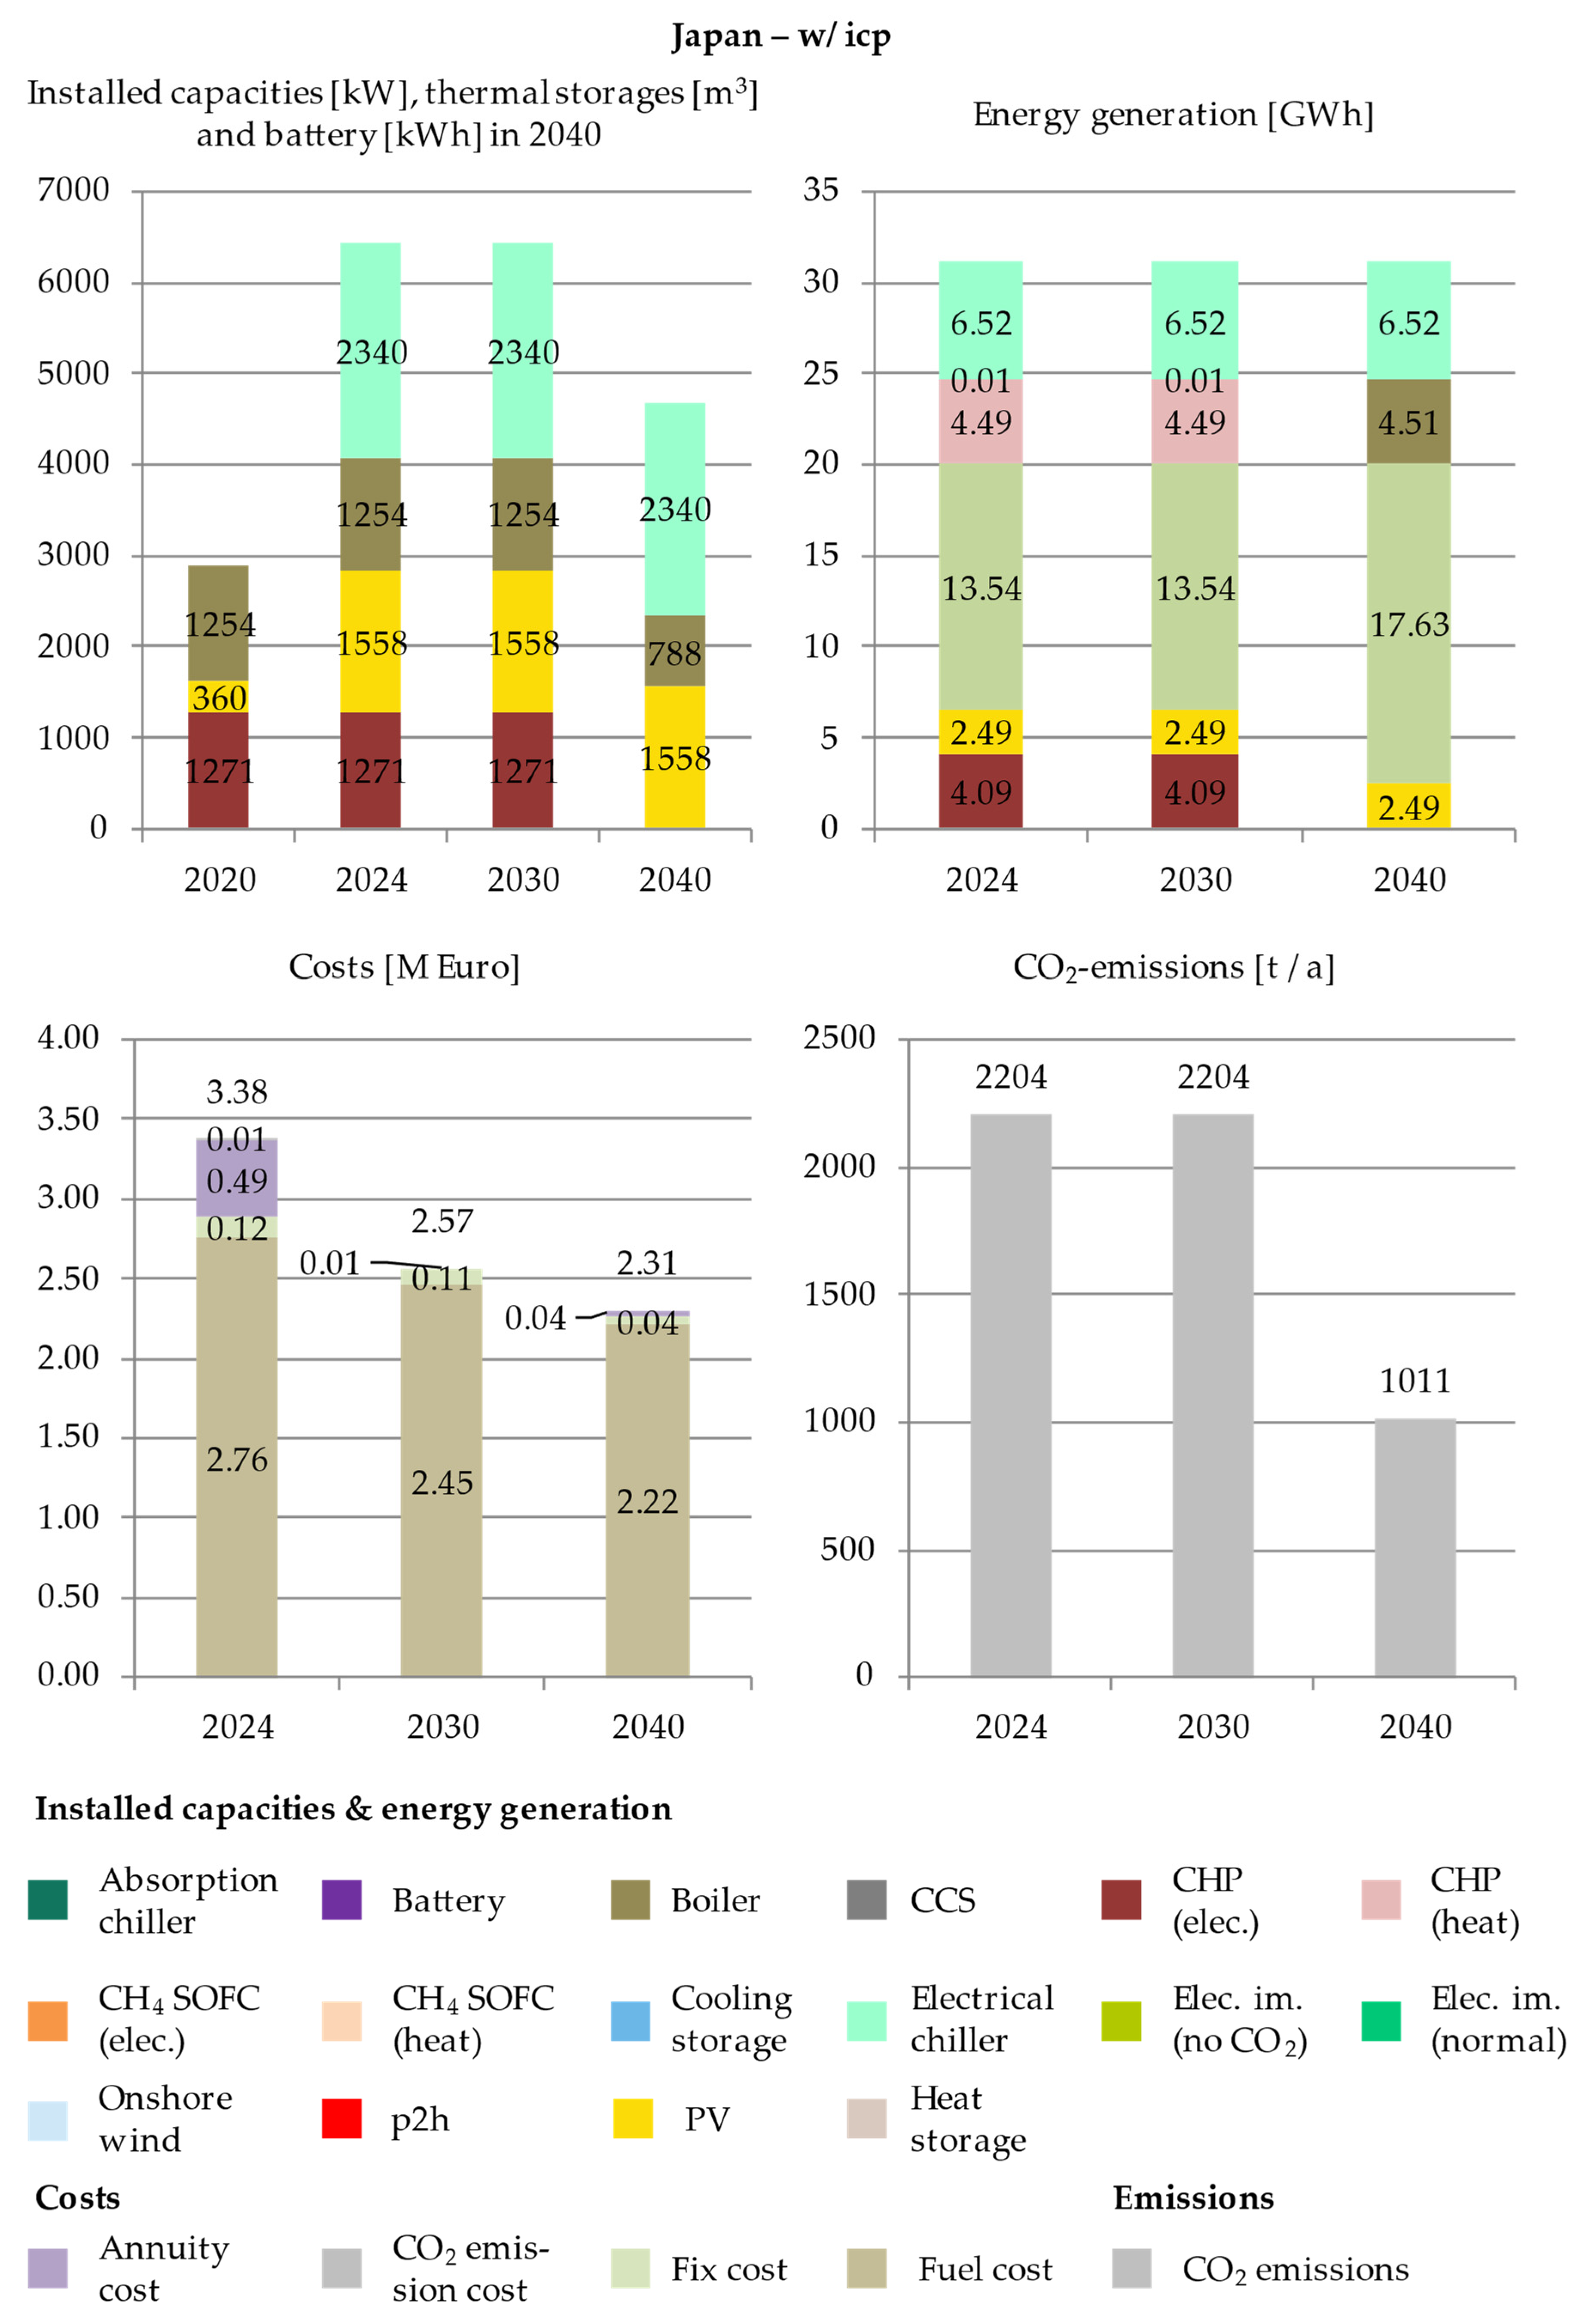
3.2. Japan
Country-Specific Summary
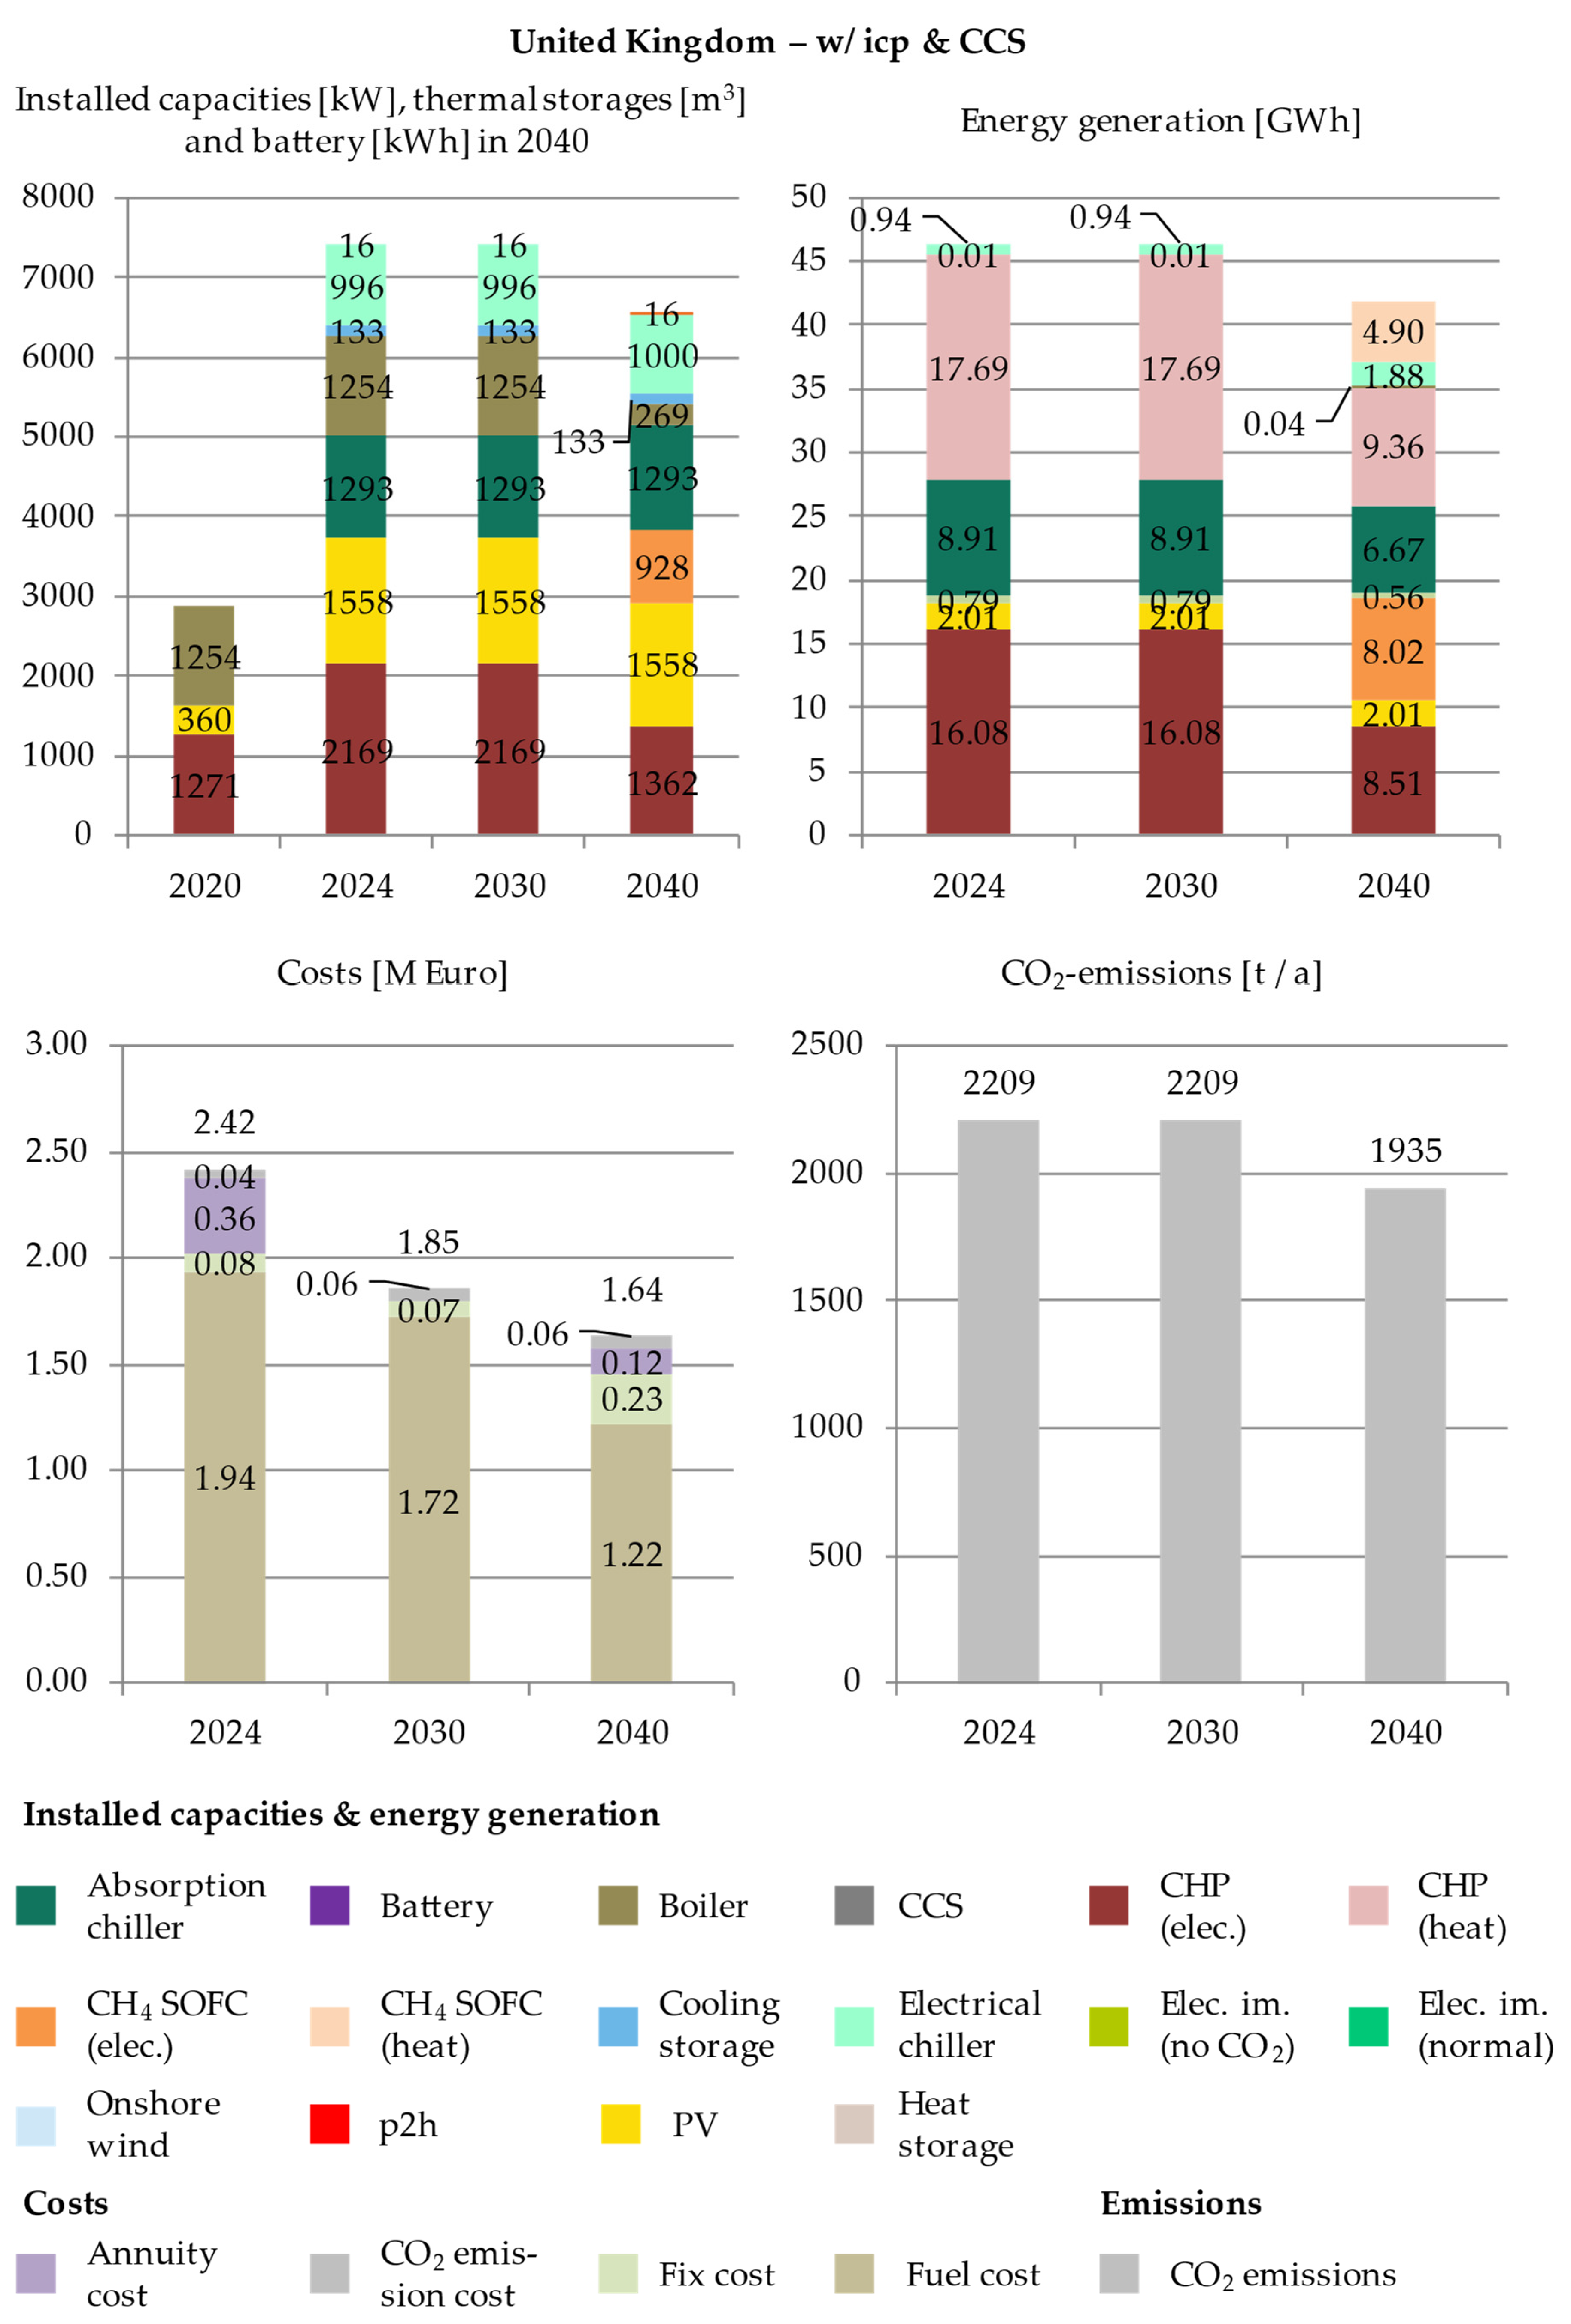
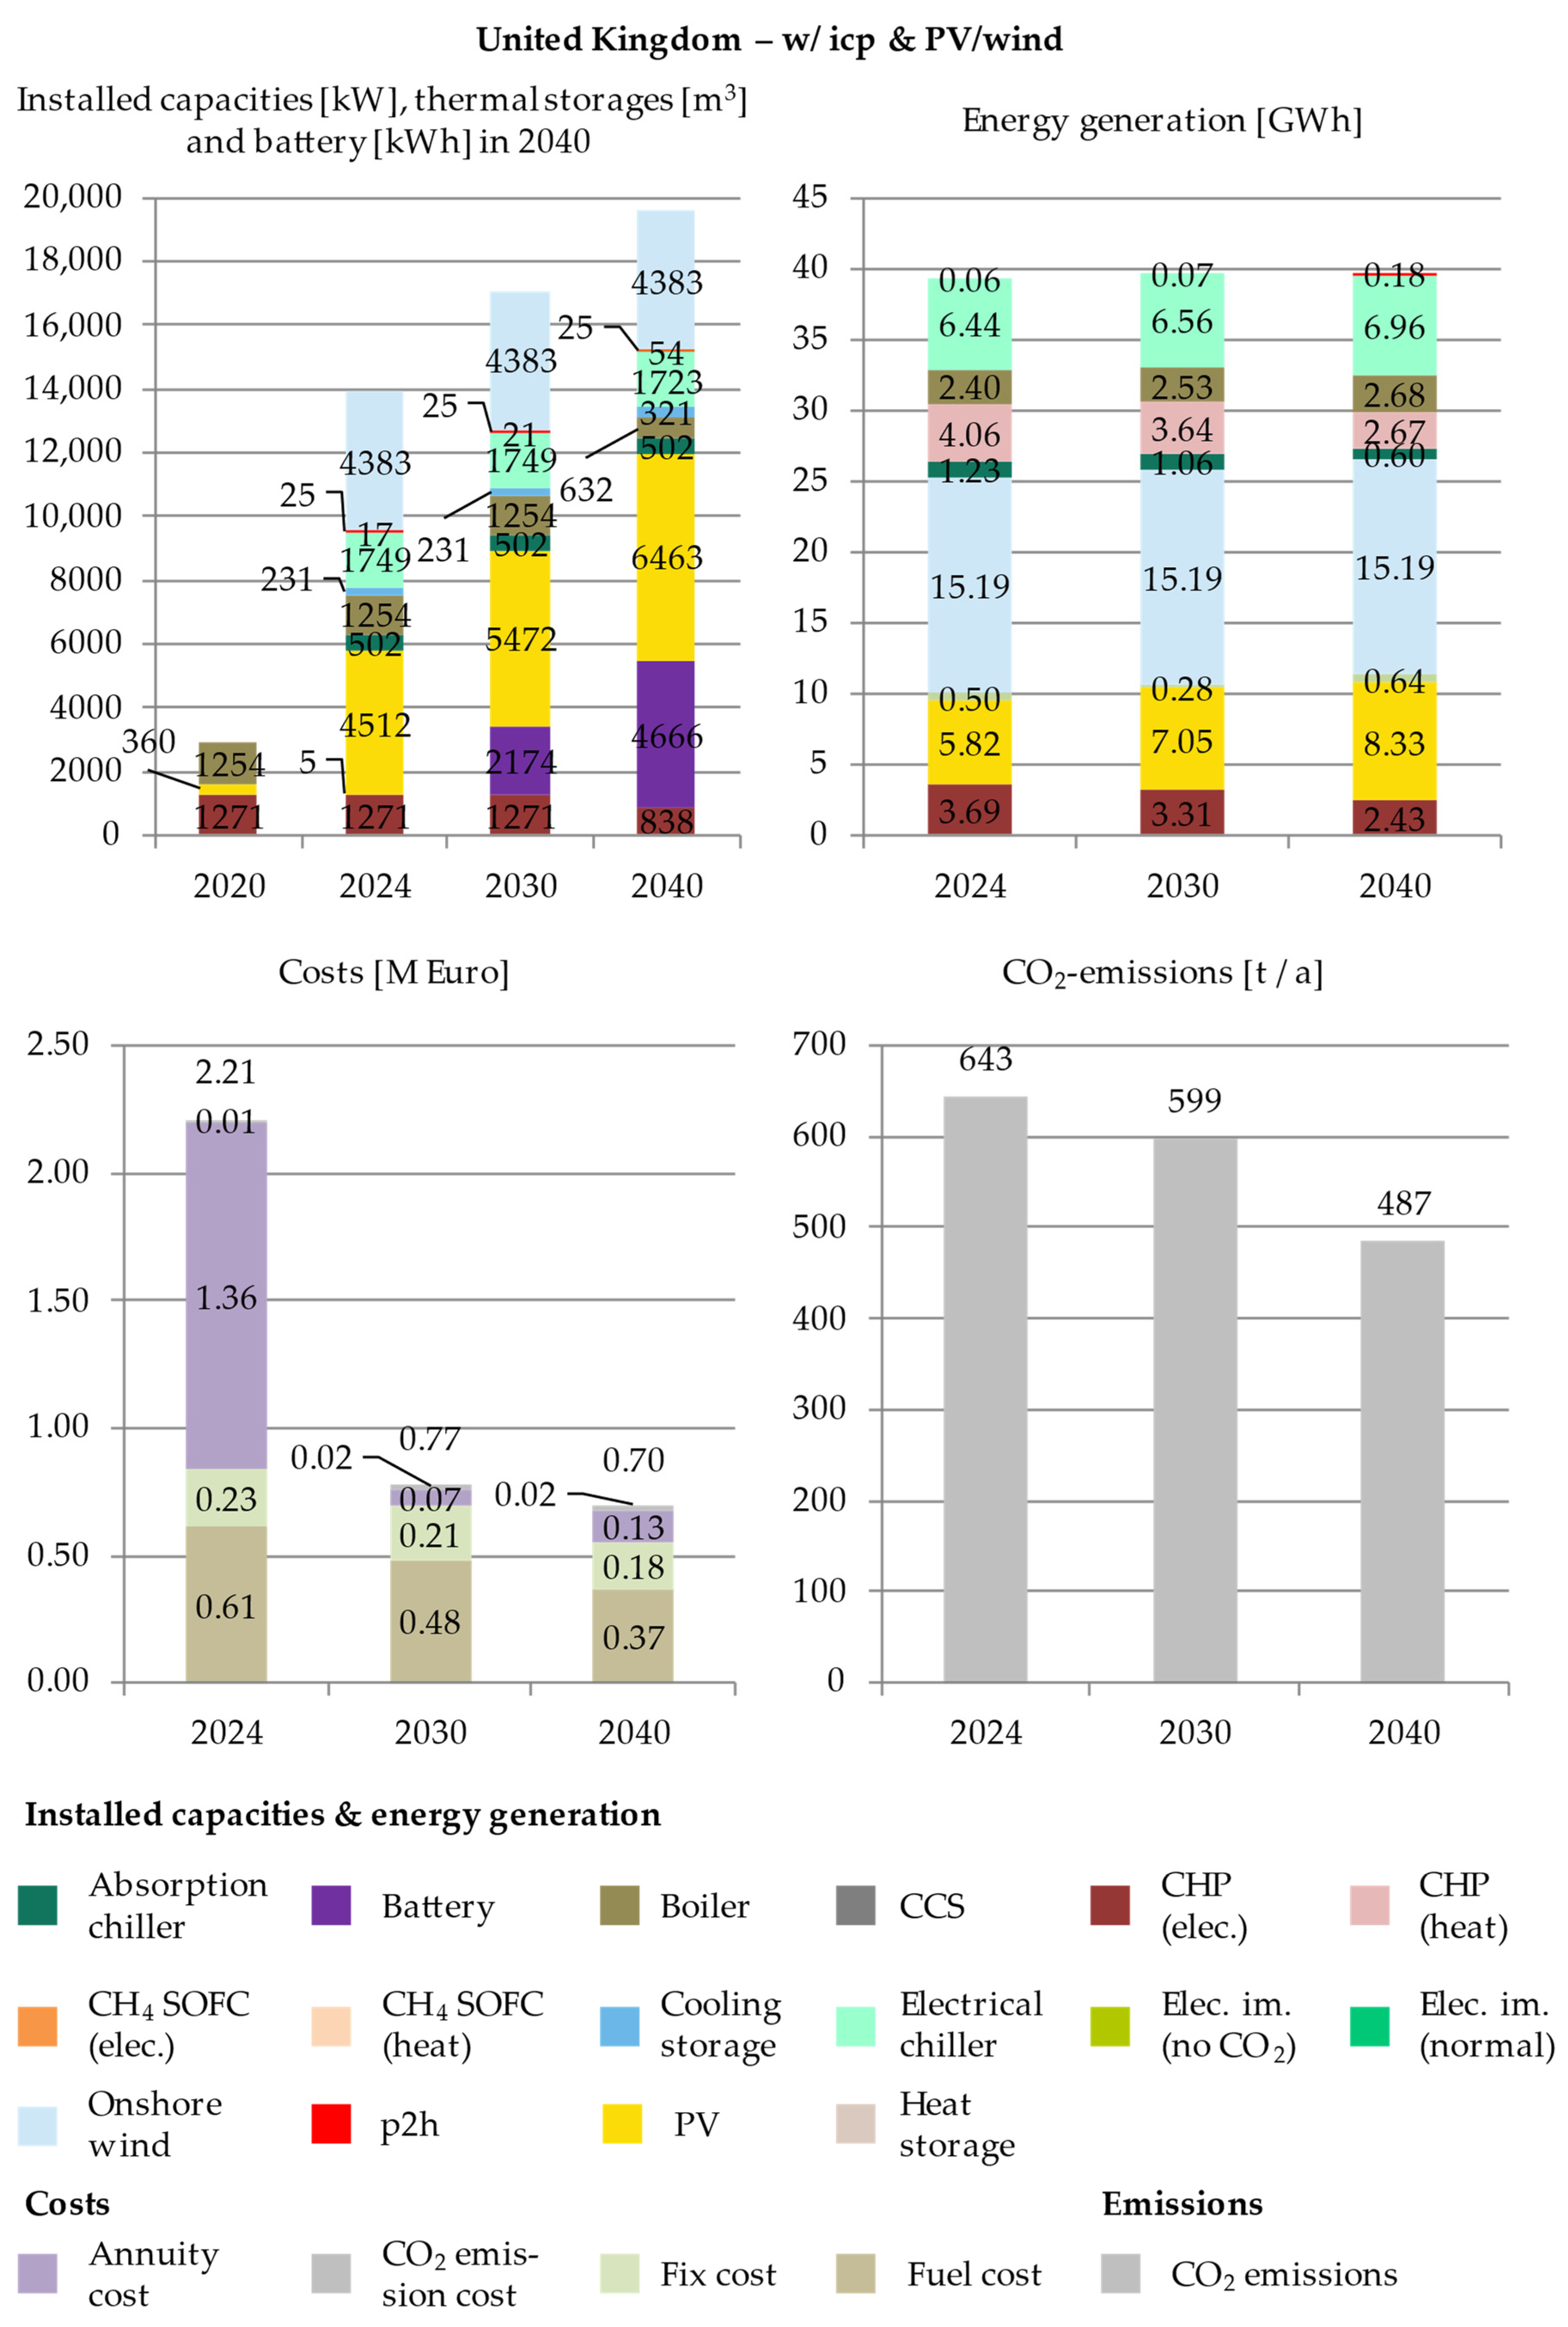
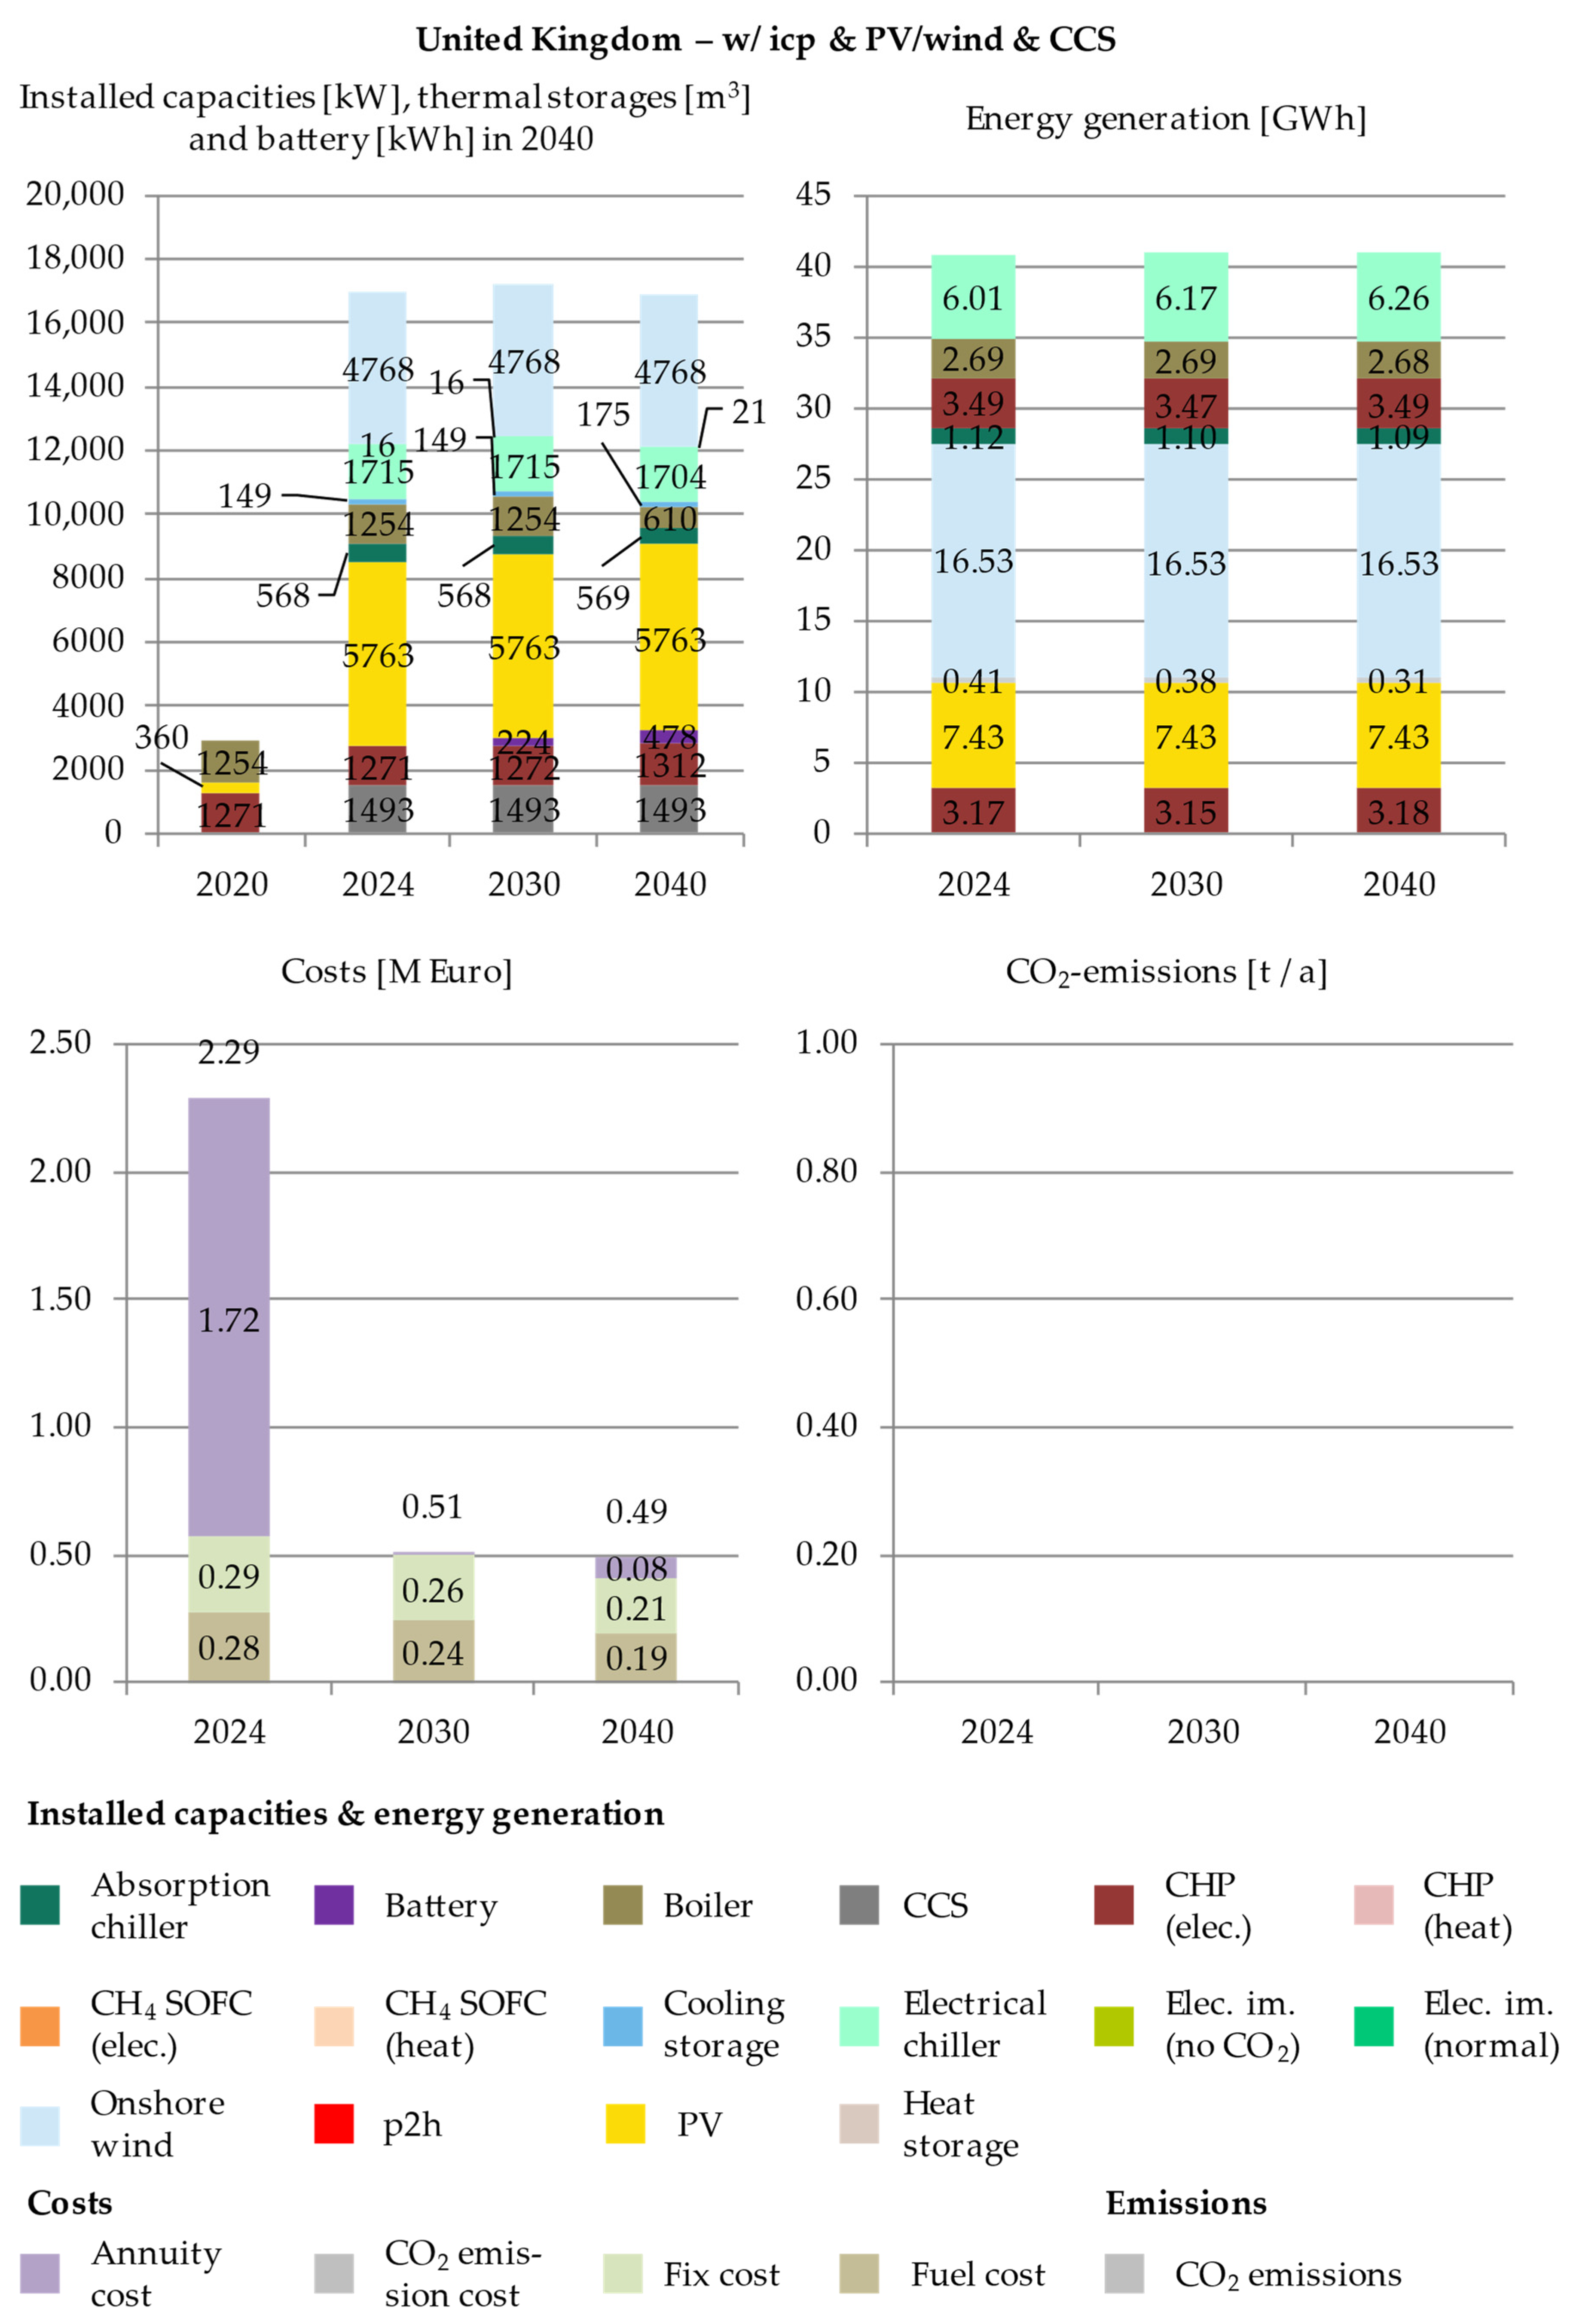
3.3. United Kingdom
Country-Specific Summary
4. Discussion
4.1. Significant Impact Differences in the Energy System Cost for the Countries Due to the ICP
4.2. Total System Cost Increase Due to ICP Is Not Proportional to the Price Difference between Internal and External Carbon Prices
4.3. Installation of Energy Storage and Sector Integration Technologies Depends on the Availability of Renewables and CCS
4.4. Building the Energy System on a Future Use of CCS Might Lead to a Path Dependency
4.5. CCS Is Not Effective without the Availability of Cheap Electricity
4.6. Cheapest Main Energy Source Shapes Energy System
4.7. Sensitivity Analysis
4.8. Limitations
5. Conclusions
Author Contributions
Funding
Data Availability Statement
Acknowledgments
Conflicts of Interest
Appendix A


Appendix B

| Germany | ||||||||
|---|---|---|---|---|---|---|---|---|
| Change of Initial ICP [%] | Energy System Cost [M €] | Total CO2 Emissions [t] | ||||||
| w/Price | w/ICP and CCS | w/ICP and PV/Wind | w/ICP and PV/Wind and CCS | w/Price | w/ICP and CCS | w/ICP and PV/Wind | w/ICP and PV/Wind and CCS | |
| −40 | 4.45 | 4.45 | 4.17 | 4.68 | 23,883 | 23,883 | 8430 | 1766 |
| −60 | 4.39 | 4.39 | 4.05 | 4.24 | 24,567 | 24,567 | 9723 | 6150 |
| −80 | 4.26 | 4.26 | 3.92 | 3.92 | 26,616 | 26,616 | 11,855 | 11,774 |
| 40 | 8.19 | 8.19 | 5.49 | 4.91 | 6871 | 6871 | 2606 | 0 |
| 60 | 9.67 | 9.90 | 5.91 | 4.91 | 1919 | 1124 | 1142 | 0 |
| 80 | 9.67 | 9.90 | 5.93 | 4.91 | 1919 | 1124 | 1138 | 0 |
| Japan | ||||||||
|---|---|---|---|---|---|---|---|---|
| Change of Initial ICP [%] | Energy System Cost [M €] | Total CO2 Emissions [t] | ||||||
| w/Price | w/ICP and CCS | w/ICP and PV/Wind | w/ICP and PV/Wind and CCS | w/Price | w/ICP and CCS | w/ICP and PV/Wind | w/ICP and PV/Wind and CCS | |
| −40 | 8.11 | 8.11 | 7.40 | 7.38 | 6415 | 6415 | 5033 | 4022 |
| −60 | 8.05 | 8.05 | 7.31 | 7.32 | 6982 | 6982 | 5850 | 4779 |
| −80 | 7.10 | 7.10 | 6.59 | 6.59 | 24,690 | 24,690 | 19,319 | 19,203 |
| 40 | 8.77 | 9.00 | 7.84 | 8.12 | 3034 | 2023 | 3034 | 0 |
| 60 | 8.77 | 9.30 | 7.84 | 8.12 | 3034 | 1011 | 3034 | 0 |
| 80 | 8.77 | 9.64 | 7.84 | 8.12 | 3034 | 0 | 3034 | 0 |
| United Kingdom | ||||||||
|---|---|---|---|---|---|---|---|---|
| Change of Initial ICP [%] | Energy System Cost [M €] | Total CO2 Emissions [t] | ||||||
| w/Price | w/ICP and CCS | w/ICP and PV/Wind | w/ICP and PV/Wind and CCS | w/Price | w/ICP and CCS | w/ICP and PV/Wind | w/ICP and PV/Wind and CCS | |
| −40 | 3.76 | 3.76 | 3.04 | 3.28 | 20,067 | 20,067 | 5833 | 0 |
| −60 | 2.99 | 2.99 | 2.74 | 3.11 | 26,977 | 26,977 | 8721 | 1952 |
| −80 | 2.99 | 2.99 | 2.64 | 2.69 | 27,057 | 27,057 | 10,540 | 8849 |
| 40 | 5.80 | 6.17 | 3.66 | 3.28 | 6078 | 4321 | 1607 | 0 |
| 60 | 5.83 | 6.78 | 3.67 | 3.28 | 5977 | 2328 | 1578 | 0 |
| 80 | 5.92 | 7.59 | 3.68 | 3.28 | 5696 | 0 | 1552 | 0 |
References
- Rogelj, J.; Huppmann, D.; Krey, V.; Riahi, K.; Clarke, L.; Gidden, M.; Nicholls, Z.; Meinshausen, M. A new scenario logic for the Paris Agreement long-term temperature goal. Nature 2019, 573, 357–363. [Google Scholar] [CrossRef]
- UN. Paris Agreement; UN: New York, NY, USA, 2016. [Google Scholar]
- UNFCCC. Adoption of the Paris Agreement: Proposal by the President; Draft decision -/CP.21; UNFCCC: New York, NY, USA, 2015. [Google Scholar]
- Schleussner, C.-F.; Rogelj, J.; Schaeffer, M.; Lissner, T.; Licker, R.; Fischer, E.M.; Knutti, R.; Levermann, A.; Frieler, K.; Hare, W. Science and policy characteristics of the Paris Agreement temperature goal. Nat. Clim. Chang. 2016, 6, 827–835. [Google Scholar] [CrossRef] [Green Version]
- IPCC. Global Warming of 1.5 °C. An IPCC Special Report on the Impacts of Global Warming of 1.5 °C above Pre-Industrial Levels and Related Global Greenhouse Gas Emission Pathways, in the Context of Strengthening the Global Response to the Threat of Climate Change, Sustainable Development, and Efforts to Eradicate Poverty: Annex I: Glossary; IPCC: Genf, Switzerland, 2018. [Google Scholar]
- Myhre, G.; Shindell, D.; Bréon, F.-M.; Collins, W.; Fuglestvedt, J.; Huang, J.; Koch, D.; Lamarque, J.-F.; Lee, D.; Mendoza, B.; et al. The Physical Science Basis. Contribution of Working Group I to the Fifth Assessment Report of the Intergovernmental Panel on Climate Change: Anthropogenic and Natural Radiative Forcing; Cambridge University Press: Cambridge, UK; New York, NY, USA, 2013. [Google Scholar]
- Ahluwalia, M.B. The Business of Pricing Carbon: How Companies are Pricing Carbon to Mitigate Risks and Prepare for a Low-Carbon Future; Center for Climate and Energy Solutions: Arlington, VA, USA, 2017. [Google Scholar]
- Narassimhan, E.; Gallagher, K.S.; Koester, S.; Alejo, J.R. Carbon Pricing in Practice: A Review of the Evidence; Climate Policy Lab: Medford, MA, USA, 2017. [Google Scholar]
- The Economist. Companies Are Moving Faster than Many Governments on Carbon Pricing. Available online: https://www.economist.com/business/2018/01/11/companies-are-moving-faster-than-many-governments-on-carbon-pricing?frsc=dg%7Ce (accessed on 12 November 2020).
- Bartlett, N.; Cushing, H.; Law, S. Embedding a Carbon Price into Business Strategy; Carbon Disclosure Project (CDP) North America: New York, NY, USA, 2016. [Google Scholar]
- Bartlett, N.; Coleman, T.; Schmidt, S. Putting a Price on Carbon: The State of Internal Carbon Pricing by Corporates Globally; Carbon Disclosure Project (CDP) North America: New York, NY, USA, 2016. [Google Scholar]
- Fawson, C.; Cottle, C.; Hubbard, H.; Marshall, M. Carbon Pricing in the US Private Sector; EconPapers: Logan, UT, USA, 2019. [Google Scholar]
- Damert, M.; Paul, A.; Baumgartner, R.J. Exploring the determinants and long-term performance outcomes of corporate carbon strategies. J. Clean. Prod. 2017, 160, 123–138. [Google Scholar] [CrossRef]
- Damert, M.; Baumgartner, R.J. Intra-Sectoral Differences in Climate Change Strategies: Evidence from the Global Automotive Industry. Bus. Strategy Environ. 2018, 27, 265–281. [Google Scholar] [CrossRef] [PubMed] [Green Version]
- DiMaggio, P.J.; Powell, W.W. The Iron Cage Revisited: Institutional Isomorphism and Collective Rationality in Organizational Fields. Am. Sociol. Rev. 1983, 48, 147. [Google Scholar] [CrossRef] [Green Version]
- Böttcher, C.F.; Müller, M. Drivers, Practices and Outcomes of Low-carbon Operations: Approaches of German Automotive Suppliers to Cutting Carbon Emissions. Bus. Strat. Environ. 2015, 24, 477–498. [Google Scholar] [CrossRef]
- Gillingham, K.; Carattini, S.; Esty, D. Lessons from first campus carbon-pricing scheme. Nature 2017, 551, 27–29. [Google Scholar] [CrossRef]
- Ducret, P.; Leguet, B.; Senard, J.-D.; Fischer, S.; Canfin, P.; Grandjean, A.; Kerr, T.; Alberola, E.; Afriat, M.; Dahan, L.; et al. Internal Carbon Pricing. A Growing Corporate Practice; Institute for Climate Economics: Paris, France, 2016. [Google Scholar]
- Chang, V. Private firm incentives to adopt internal carbon pricing. J. Public Int. Aff. 2017, 1, 56–77. [Google Scholar]
- Dechezleprêtre, A.; Sato, M. The Impacts of Environmental Regulations on Competitiveness. Rev. Environ. Econ. Policy 2017, 11, 183–206. [Google Scholar] [CrossRef] [Green Version]
- Fischedick, M.; Roy, J.; Abdel-Aziz, A.; Acquaye, A.; Allwood, J.M.; Ceron, J.-P.; Geng, Y.; Kheshgi, H.; Lanza, A.; Perczyk, D.; et al. Climate Change 2014: Mitigation of Climate Change. Contribution of Working Group III to the Fifth Assessment Report of the Intergovernmental Panel on Climate Change: Industry; Cambridge University Press: Cambridge, UK; New York, NY, USA, 2014. [Google Scholar]
- Bartlett, N.; Cushing, H.; Law, S. Putting a Price on Carbon: Integrating Climate Risk into Business Planning; Carbon Disclosure Project (CDP) North America: New York, NY, USA, 2017. [Google Scholar]
- Gajjar, C.; Adhia, V. Reducing Risk, Addressing Climate Change Through Internal Carbon Pricing: A Primer for Indian Business; World Bank: Washington, DC, USA, 2018. [Google Scholar]
- Metzger, E.; Park, J.; Gallagher, D. Executive Guide to Carbon Pricing Leadership; UN Global Compact: New York, NY, USA, 2015. [Google Scholar]
- Barron, A.R.; Parker, B.J.; Sayre, S.S.; Weber, S.S.; Weisbord, D.J. Carbon pricing approaches for climate decisions in U.S. higher education: Proxy carbon prices for deep decarbonization. Elem Sci. Anth 2020, 8, 42. [Google Scholar] [CrossRef]
- Barron, A.R.; Parker, B.J. Selecting an Internal Carbon Price for Academic Institutions; Smith College: Northampton, MA, USA, 2018. [Google Scholar]
- Kotchen, M. Which Social Cost of Carbon? A Theoretical Perspective; The University of Chicago Press: Chicago, IL, USA, 2016. [Google Scholar]
- Nordhaus, W.D. An optimal transition path for controlling greenhouse gases. Science 1992, 258, 1315–1319. [Google Scholar] [CrossRef]
- Hänsel, M.C.; Drupp, M.A.; Johansson, D.J.A.; Nesje, F.; Azar, C.; Freeman, M.C.; Groom, B.; Sterner, T. Climate economics support for the UN climate targets. Nat. Clim. Chang. 2020, 10, 781–789. [Google Scholar] [CrossRef]
- World Bank. State and Trends of Carbon Pricing 2018: Washington DC, May 2018; World Bank: Washington, DC, USA, 2018. [Google Scholar]
- Bento, N.; Gianfrate, G. Determinants of internal carbon pricing. Energy Policy 2020, 143, 111499. [Google Scholar] [CrossRef]
- Limpens, G.; Moret, S.; Jeanmart, H.; Maréchal, F. EnergyScope TD: A novel open-source model for regional energy systems. Appl. Energy 2019, 255, 113729. [Google Scholar] [CrossRef]
- Mojica, J.L.; Petersen, D.; Hansen, B.; Powell, K.M.; Hedengren, J.D. Optimal combined long-term facility design and short-term operational strategy for CHP capacity investments. Energy 2017, 118, 97–115. [Google Scholar] [CrossRef] [Green Version]
- Kotzur, L.; Nolting, L.; Hoffmann, M.; Groß, T.; Smolenko, A.; Priesmann, J.; Büsing, H.; Beer, R.; Kullmann, F.; Singh, B.; et al. A Modeler’s Guide to Handle Complexity in Energy System Optimization. 2020. Available online: http://arxiv.org/pdf/2009.07216v2 (accessed on 4 July 2021).
- Ecofys; The Generation Foundation; CDP. How-to Guide to Corporate Internal Carbon Pricing—Four Dimensions to Best Practice Approaches: Consultation Draft; CDP: London, UK, 2017. [Google Scholar]
- Saad Hussein, N. A method for evaluating building retrofit effects on a decentral energy system by a sector coupling operation and expansion model. Energy Syst. 2018, 9, 605–645. [Google Scholar] [CrossRef]
- Saad Hussein, N.; Thomsen, J. System Development & Market Integration Heat & Power: »DISTRICT«. Available online: https://www.ise.fraunhofer.de/en/business-areas/power-electronics-grids-and-smart-systems/energy-system-analysis/energy-system-models-at-fraunhofer-ise/district.html (accessed on 2 June 2021).
- Thomsen, J. Enhancing operation of decentralized energy systems by a regional economic optimization model DISTRICT. Energy Syst. 2018, 9, 669–707. [Google Scholar] [CrossRef]
- Staffell, I.; Pfenninger, S. Using bias-corrected reanalysis to simulate current and future wind power output. Energy 2016, 114, 1224–1239. [Google Scholar] [CrossRef] [Green Version]
- Pfenninger, S.; Staffell, I. Long-term patterns of European PV output using 30 years of validated hourly reanalysis and satellite data. Energy 2016, 114, 1251–1265. [Google Scholar] [CrossRef] [Green Version]
- Pfenninger, S.; Staffell, I. Renewables-Ninja. Available online: https://www.renewables.ninja/ (accessed on 22 March 2021).
- OpenStreetMap-Mitwirkende. OpenStreetMap. Available online: www.openstreetmap.org/copyright (accessed on 5 July 2021).
- Schöpfer, M. Absorption Chillers: Their Feasibility in District Heating Networks and Comparison to Alternative Technologies; Technical University of Lisbon: Lisbon, Portugal, 2015. [Google Scholar]
- Shirazi, A.; Taylor, R.A.; Morrison, G.L.; White, S.D. A comprehensive, multi-objective optimization of solar-powered absorption chiller systems for air-conditioning applications. Energy Convers. Manag. 2017, 132, 281–306. [Google Scholar] [CrossRef]
- Fasihi, M.; Efimova, O.; Breyer, C. Techno-economic assessment of CO2 direct air capture plants. J. Clean. Prod. 2019, 224, 957–980. [Google Scholar] [CrossRef]
- Huang, Z.; Yu, H.; Chu, X.; Peng, Z. Energetic and exergetic analysis of integrated energy system based on parametric method. Energy Convers. Manag. 2017, 150, 588–598. [Google Scholar] [CrossRef]
- Sterchele, P.; Brandes, J.; Heilig, J.; Wrede, D.; Kost, C.; Schlegl, T.; Bett, A.; Henning, H.-M. Wege zu Einem Klimaneutralen Energiesystem: Die Deutsche Energiewende im Kontext Gesellschaftlicher Verhaltensweisen Anhang zur Studie; FRAUNHOFER-INSTITUT FÜR SOLARE ENERGIESYSTEME ISE: Freiburg im Breisgau, Germany, 2020. [Google Scholar]
- Wang, H.; Zhang, H.; Gu, C.; Li, F. Optimal design and operation of CHPs and energy hub with multi objectives for a local energy system. Energy Procedia 2017, 142, 1615–1621. [Google Scholar] [CrossRef]
- Zhang, Y.; Hua, Q.S.; Sun, L.; Liu, Q. Life Cycle Optimization of Renewable Energy Systems Configuration with Hybrid Battery/Hydrogen Storage: A Comparative Study. J. Energy Storage 2020, 30, 101470. [Google Scholar] [CrossRef]
- Zhang, Y.; Campana, P.E.; Lundblad, A.; Yan, J. Comparative study of hydrogen storage and battery storage in grid connected photovoltaic system: Storage sizing and rule-based operation. Appl. Energy 2017, 201, 397–411. [Google Scholar] [CrossRef]
- Arpagaus, C.; Bless, F.; Uhlmann, M.; Schiffmann, J.; Bertsch, S.S. High temperature heat pumps: Market overview, state of the art, research status, refrigerants, and application potentials. Energy 2018, 152, 985–1010. [Google Scholar] [CrossRef] [Green Version]
- Spitler, J.D.; Southard, L.E.; Liu, X. Ground-source and air-source heat pump system performance at the ASHRAE headquarters building. In Proceedings of the 12th IEA Heat Pump Conference, Rotterdam, The Netherlands, 15–18 May 2017. [Google Scholar]
- Chaudry, M.; Abeysekera, M.; Hosseini, S.H.R.; Jenkins, N.; Wu, J. Uncertainties in decarbonising heat in the UK. Energy Policy 2015, 87, 623–640. [Google Scholar] [CrossRef] [Green Version]
- Razipour, R.; Moghaddas-Tafreshi, S.-M.; Farhadi, P. Optimal management of electric vehicles in an intelligent parking lot in the presence of hydrogen storage system. J. Energy Storage 2019, 22, 144–152. [Google Scholar] [CrossRef]
- Kawakami, Y.; Komiyama, R.; Fujii, Y. (Eds.) Management of Surplus Electricity to Decarbonize Energy Systems in Japan; Conference on Energy, Economy, and Environment: Kyomachi-bori, Nishi-ku, Osaka, Japan, 2019. [Google Scholar]
- Mariaud, A.; Acha, S.; Ekins-Daukes, N.; Shah, N.; Markides, C.N. Integrated optimisation of photovoltaic and battery storage systems for UK commercial buildings. Appl. Energy 2017, 199, 466–478. [Google Scholar] [CrossRef]
- Groscurth, H.-M.; Bode, S. Discussion Paper Nr. 9 “Power-to-Heat” oder “Power-to-Gas”; Arrhenius Institut für Energie und Klimapolitik: Hamburg, Germany, 2013. [Google Scholar]
- Kimura, K. Solar Power Generation Costs in Japan: Current Status and Future Outlook; Renewable Energy Institute: Minato-City, Tokyo, Japan, 2019. [Google Scholar]
- Felseghi, R.-A.; Carcadea, E.; Raboaca, M.S.; Trufin, C.N.; Filote, C. Hydrogen Fuel Cell Technology for the Sustainable Future of Stationary Applications. Energies 2019, 12, 4593. [Google Scholar] [CrossRef] [Green Version]
- Owaku, T.; Akisawa, A.; Yamamoto, H. Optimal Power Generation Mix including Distributed Generation considering Heat Demand of the Residential and Commercial Sectors. In Proceedings of the ECOS 2020—The 33rd International Conference on Efficiency, Cost Optimization, Simulation and Environment Impact of Energy Systems, Osaka, Japan, 29 June–3 July 2020. [Google Scholar]
- BEIS. Evidence Gathering: Thermal Energy Storage (TES) Technologies; BEIS: London, UK, 2016.
- IRENA. Wind Power: Technology Brief. In IEA-ETSAP and IRENA© Technology Brief E07; IRENA: Abu Dhabi, United Arab Emirates, 2016. [Google Scholar]
- Obane, H. Forecasting photovoltaic and wind energy capital costs in Japan: A Bayesian approach. Energy Procedia 2019, 158, 3576–3582. [Google Scholar] [CrossRef]
- Sherry, P. (Ed.) An Analysis of the Potential Outcome of a Further "Pot 1" CfD Auction in GB; London, UK, 2017. [Google Scholar]
- Moore, A.; Price, J.; Zeyringer, M. The role of floating offshore wind in a renewable focused electricity system for Great Britain in 2050. Energy Strategy Rev. 2018, 22, 270–278. [Google Scholar] [CrossRef]
- Committee on Climate Change. Hydrogen in a Low-Carbon Economy; The Climate Change Committee: London, UK, 2018. [Google Scholar]
- Völler, K.; Reinholz, T. Branchenbarometer Biomethan 2019: Dena-ANALYSE; German Energy Agency: Berlin, Germany, 2019. [Google Scholar]
- Lambert, M. Biogas: A Significant Contribution to Decarbonising Gas Markets; The Oxford Institute for Energy Studies: Oxford, UK, 2017. [Google Scholar]
- Bdew. Strompreis für die Industrie. Available online: https://www.bdew.de/service/daten-und-grafiken/strompreis-fuer-die-industrie/ (accessed on 4 July 2021).
- Icha, P.; Kuhs, G. Entwicklung der Spezifischen Kohlendioxid- Emissionen des Deutschen Strommix in den Jahren 1990–2019; Umweltbundesamt: Dessau-Roßlau, Germany, 2020.
- Hauser, E.; Heib, S.; Hildebrand, J.; Rau, I.; Weber, A.; Welling, J. Marktanalyse Ökostrom II: Marktanalyse Ökostrom und HKN, Weiterentwicklung des Herkunftsnachweissystems und der Stromkennzeichnung Abschlussbericht; Umweltbundesamt: Dessau-Roßlau, Germany, 2019.
- Juhrich, K. CO2 Emission Factors for Fossil Fuels; Umweltbundesamt: Dessau-Roßlau, Germany, 2016.
- Dou, Y.; Togawa, T.; Dong, L.; Fujii, M.; Ohnishi, S.; Tanikawa, H.; Fujita, T. Innovative planning and evaluation system for district heating using waste heat considering spatial configuration: A case in Fukushima, Japan. Resour. Conserv. Recycl. 2018, 128, 406–416. [Google Scholar] [CrossRef]
- TEPCO. CO2 Emissions, CO2 Emissions Intensity and Electricity Sales. Available online: https://www.tepco.co.jp/en/corpinfo/illustrated/environment/emissions-co2-e.html (accessed on 16 April 2021).
- BEIS. Prices of Fuels Purchased by Non-Domestic Consumers in the UK; BEIS: London, UK, 2020.
- BEIS. UK Government GHG Conversion Factors for Company Reporting; BEIS: London, UK, 2020.
- MacDonald, S.; Eyre, N. An international review of markets for voluntary green electricity tariffs. Renew. Sustain. Energy Rev. 2018, 91, 180–192. [Google Scholar] [CrossRef]
- Hydrogen London (Ed.) London: A Capital for Hydrogen and Fuel Cell Technologies; Mayor of London: London, UK, 2016. [Google Scholar]
- IEA. World Energy Model: Documentation—2020 Version; IEA: Paris, France, 2021. [Google Scholar]
- UBA. Nationales Emissionshandelssystem: Hintergrundpapier; UBA: Berlin, Germany, 2020. [Google Scholar]
- Arimura, T.H.; Matsumoto, S. Carbon Pricing in Japan; Springer: Singapore, 2021; ISBN 978-981-15-6963-0. [Google Scholar]
- Burhenne, S. Monte Carlo Based Uncertainty and Sensitivity Analysis for Building Performance Simulation; Shaker Verlag: Düren, Germany, 2013. [Google Scholar]
- Hamby, D.M. A review of techniques for parameter sensitivity analysis of environmental models. Environ. Monit. Assess. 1994, 32, 135–154. [Google Scholar] [CrossRef] [PubMed]
- Hamby, D.M. A comparison of sensitivity analysis techniques. Health Phys. 1995, 68, 195–204. [Google Scholar] [CrossRef] [Green Version]


| General Technology Parameters | Germany | Japan | United Kingdom | |||||||
|---|---|---|---|---|---|---|---|---|---|---|
| Name | Efficiency | Lifetime [a] | CAPEX 1 in 2040 [portion of CAPEX (Today)] | OPEX 2 [Portion of CAPEX] | ||||||
| Absorption chiller | 0.7 [43] | 20 [44] | 1 | 0.03 | 300 [43] | 9 [43] | 300 [43] | 9 [43] | 300 [43] | 9 [43] |
| CCS (LT DAC) | 0.0005 [45] | 20 [45] | 0.32 [45] | 0.04 | 730 [45] | 29.2 [45] | 730 [45] | 29.2 [45] | 730 [45] | 29.2 [45] |
| CHP | 0.375 (electric) 0.4125 (thermal) [46] | 20 [47] | 0.90 [47] | 0.03 | 1595 [47] | 47.9 [47] | 1595 [47] | 47.85 [47] | 674.1 [48] | 20.2 |
| Electrical chiller | 4.5 [43] | 15 [44] | 1 | 0.035 | 210 [43] | 7.35 [43] | 210 [43] | 7.35 [43] | 210 [43] | 7.35 [43] |
| Electrolyser | 0.74 [49] | 15 [50] | 0.54 [49] | 0.04 | 900 [49] | 36 [49] | 900 [49] | 36 [49] | 900 [49] | 36 [49] |
| Gas boiler | 0.9 [46] | 20 [47] | 1 [47] | 0.02 | 97 [47] | 1.9 [47] | 97 [47] | 1.94 [47] | 78.6 [48] | 1.58 |
| Heat pump (air) | 2.9 [51] | 20 [47] | 0.81 [47] | 0.01 | 980 [47] | 9.8 [47] | 980 [47] | 9.8 [47] | 542.7 [48] | 5.4 |
| Heat pump (sole) | 3.7 [52] | 20 [47] | 0.92 [47] | 0.035 | 683 [47] | 23.9 [47] | 683 [47] | 23.9 [47] | 1011.1 [53] | 35.4 |
| Hydrogen storage | 0.95 [54] | 20 [49] | 0.66 | 0.05 | 1.25 [49] | 25 [49,50,54] | 1.25 [49] | 25 [49,50,54] | 1.25 [49] | 25 [49,50,54] |
| Li-I battery | 0.86 [47] | 10 [47] | 0.33 [47] | 0.01 | 375 [47] | 3.8 [47] | 333 [55] | 3.33 | 303.3 [56] | 3.0 |
| Power-to-heat | 0.98 [57] | 20 [57] | 1 | 0.03 | 150 [57] | 5 [57] | 150 [57] | 5 [57] | 150 [57] | 5 [57] |
| PV (ground) | 0.175 [47] | 25.7 [47] | 0.72 [47] | 0.02 | 640 [47] | 12.8 [47] | 1167 [58] | 25 [58] | 316 | 6.32 |
| PV (roof) | 0.175 [47] | 25.7 [47] | 0.63 [47] | 0.02 | 943 [47] | 18.9 [47] | 1875 [58] | 25 [58] | 494.3 [56] | 9.9 |
| SOFC CH4 | 0.54 (electric) 0.33 (thermal) [47] | 17 [47] | 0.18 [47] | 0.035 | 7826 [47] | 273.9 [47] | 7826 [47] | 273.9 [47] | 7826 [47] | 273.9 [47] |
| SOFC H2 | 0.525 (electric) 0.375 (thermal) [59] | 17 [47] | 0.18 [47] | 0.035 | 7115 [47] | 249.0 [47] | 3776.5 [60] | 132.2 | 7115 [47] | 249.0 [47] |
| Thermal storage (hot and cold) | 0.7 [61] | 20 [47] | 0.71 [47] | 0.013 | 404.5 [47] | 5.3 [47] | 404.46 [47] | 5.3 [47] | 404.4 [47] | 5.3 [47] |
| Wind (onshore) | 0.35 [62] | 23.7 [47] | 0.91 [47] | 0.03 | 1473 [47] | 44.2 [47] | 2295 [63] | 225 | 1168.4 [64] | 35.1 |
| Wind (offshore) | 0.35 [62] | 20 [47] | 0.72 [47] | 0.03 | 3449 [47] | 103.5 [47] | 4420 [63] | 231 | 3314.3 [65] | 99.4 |
| Technology Type | Capacity | Year of Installation |
|---|---|---|
| Combined heat and power (CHP) | 1271 kWel | 2019 |
| Cooling storage | 1000 m3 | 1980 |
| Gas boiler | 1254 kWth | 2014 |
| PV roof 1 | 310 kWel | 2015 |
| PV roof 2 | 50 kWel | 2018 |
| Biogas | Electricity (“Normal”) | Electricity (CO2-Neutral) | Gas | Hydrogen | |||||||
|---|---|---|---|---|---|---|---|---|---|---|---|
| 2024 | Germany | 0.0691 [67] | 0.0000515 [68] | 0.1840 [69] | 0.000485 [70] | 0.194 [69,71] | 0 | 0.0230 [47] | 0.000202 [72] | 0.2480 [47] | 0 |
| Japan | 0.1500 | 0.1275 [73] | 0.000468 [74] | 0.1558 | 0.060 [73] | 0.2354 | |||||
| United Kingdom | 0.0420 [68] | 0.1411 [75] | 0.000233 [76] | 0.1711 [77] | 0.0190 [75] | 0.2138 [78] | |||||
| 2030 | Germany | 0.0691 | 0.0000515 | 0.1840 | 0.000485 | 0.194 | 0 | 0.0230 | 0.000202 | 0.2126 [47] | 0 |
| Japan | 0.1500 | 0.1275 | 0.000468 | 0.1558 | 0.060 | 0.2085 | |||||
| United Kingdom | 0.0420 | 0.1411 | 0.000233 | 0.1711 | 0.0190 | 0.1474 | |||||
| 2040 | Germany | 0.0691 | 0.0000515 | 0.1840 | 0.000485 | 0.194 | 0 | 0.0230 | 0.000202 | 0.1640 [47] | 0 |
| Japan | 0.1500 | 0.1275 | 0.000468 | 0.1558 | 0.060 | 0.1556 | |||||
| United Kingdom | 0.0420 | 0.1411 | 0.000233 | 0.1711 | 0.0190 | 0.0810 [66] | |||||
| 2024 | 2030 | 2040 | |
|---|---|---|---|
| CO2 Price | 201 | 222 | 264 |
| 2024 | 2030 | 2040 | |
|---|---|---|---|
| Germany | 45 [80] | 72.5 | 100 |
| Japan | 2.5 [81] | 4 | 5.6 |
| United Kingdom | 20 [81] | 32 | 44 |
| Name | Description |
|---|---|
| no ICP | This serves as a reference scenario, where no ICP is implemented and only onsite PV potential is available. |
| w/ICP | Same as “no ICP” scenario. Additionally, the ICP (see Table 2) is implemented. |
| w/ICP and CCS | Same as “w/ICP” scenario. Additionally, CCS can be installed. |
| w/ICP and PV/wind | Same as “w/ICP” scenario. Additionally, an unlimited offsite PV and wind (onshore and offshore) potential is assumed. |
| w/ICP and PV/wind & CCS | Same as “w/ICP and PV/wind” scenario. Additionally, CCS can be installed. |
| No ICP | w/ICP | w/ICP and CCS | w/ICP and Wind/PV | w/ICP and Wind/PV and CCS | |
|---|---|---|---|---|---|
| Total emissions [t] | 27,957 | 19,240 | 19,240 | 7111 | 0 |
| Energy system cost [M €] | 4.24 | 5.28 | 5.28 | 4.37 | 4.91 |
| Total system cost [M €] | 5.92 | 6.44 | 6.44 | 4.79 | 4.91 |
| Emission costs [M €] | 1.68 | 1.16 | 1.16 | 0.42 | 0 |
| No ICP | w/ICP | w/ICP and CCS | w/ICP and Wind/PV | w/ICP and Wind/PV and CCS | |
|---|---|---|---|---|---|
| Total emissions [t] | 25,648 | 5419 | 5419 | 5020 | 1437 |
| Energy system cost [M €] | 7.09 | 8.23 | 8.23 | 7.40 | 7.81 |
| Total system cost [M €] | 7.18 | 8.25 | 8.25 | 7.41 | 7.81 |
| Emission costs [M €] | 0.09 | 0.02 | 0.02 | 0.01 | <0.01 |
| No ICP | w/ICP | w/ICP and CCS | w/ICP and Wind/PV | w/ICP and Wind/PV and CCS | |
|---|---|---|---|---|---|
| Total emissions [t] | 27,098 | 6353 | 6353 | 1729 | 0 |
| Energy system cost [M €] | 2.98 | 5.74 | 5.74 | 3.63 | 3.28 |
| Total system cost [M €] | 3.71 | 5.91 | 5.91 | 3.68 | 3.28 |
| Emission costs [M €] | 0.73 | 0.17 | 0.17 | 0.05 | 0 |
| Cost [M €] | Total CO2 Emissions [t] | ||||||||||
|---|---|---|---|---|---|---|---|---|---|---|---|
| No Price | w/Price | w/ICP & CCS | w/ICP and PV/Wind | w/ICP and PV/Wind and CCS | No Price | w/Price | w/ICP and CCS | w/ICP and PV/Wind | w/ICP and PV/Wind and CCS | ||
| Germany | Energy system | 4.24 | 5.28 | 5.28 | 4.37 | 4.91 | 27,957 | 19,240 | 19,240 | 7111 | 0 |
| Total system | 5.92 | 6.44 | 6.44 | 4.79 | 4.91 | ||||||
| Japan | Energy system | 7.09 | 8.23 | 8.23 | 7.40 | 7.81 | 25,648 | 5419 | 5419 | 5020 | 1437 |
| Total system | 7.18 | 8.25 | 8.25 | 7.41 | 7.81 | ||||||
| United Kingdom | Energy system | 2.98 | 5.74 | 5.74 | 3.63 | 3.28 | 27,098 | 6353 | 6353 | 1729 | 0 |
| Total system | 3.71 | 5.91 | 5.91 | 3.68 | 3.28 | ||||||
Publisher’s Note: MDPI stays neutral with regard to jurisdictional claims in published maps and institutional affiliations. |
© 2021 by the authors. Licensee MDPI, Basel, Switzerland. This article is an open access article distributed under the terms and conditions of the Creative Commons Attribution (CC BY) license (https://creativecommons.org/licenses/by/4.0/).
Share and Cite
Gorbach, O.G.; Hussein, N.S.; Thomsen, J. Impact of Internal Carbon Prices on the Energy System of an Organisation’s Facilities in Germany, Japan and the United Kingdom Compared to Potential External Carbon Prices. Energies 2021, 14, 4094. https://0-doi-org.brum.beds.ac.uk/10.3390/en14144094
Gorbach OG, Hussein NS, Thomsen J. Impact of Internal Carbon Prices on the Energy System of an Organisation’s Facilities in Germany, Japan and the United Kingdom Compared to Potential External Carbon Prices. Energies. 2021; 14(14):4094. https://0-doi-org.brum.beds.ac.uk/10.3390/en14144094
Chicago/Turabian StyleGorbach, Oliver Gregor, Noha Saad Hussein, and Jessica Thomsen. 2021. "Impact of Internal Carbon Prices on the Energy System of an Organisation’s Facilities in Germany, Japan and the United Kingdom Compared to Potential External Carbon Prices" Energies 14, no. 14: 4094. https://0-doi-org.brum.beds.ac.uk/10.3390/en14144094