
Simulation Study on the Effect of Flue Gas on Flow Field and Rotor Stress in Gas Turbines
by
 ,
,
Guangkui Liu
1 ,
,
Sicong Sun
1, 
Kui Liang
1,
Xisheng Yang
1,
Dong An
1,
Qi Wen
1 and
Xiaohan Ren
2,* 1
China Special Equipment Inspection & Research Institute, Beijing 100029, China
2
Institute of Thermal Science and Technology, Shandong University, Jinan 250061, China
*
Author to whom correspondence should be addressed.
Energies 2021, 14(19), 6135; https://0-doi-org.brum.beds.ac.uk/10.3390/en14196135
Submission received: 17 August 2021
/
Revised: 21 September 2021
/
Accepted: 23 September 2021
/
Published: 26 September 2021
(This article belongs to the Special Issue Trends and Prospects in Engine Combustion)
Abstract
:A flue gas turbine is the main energy recovery equipment in a heavy oil catalytic cracking unit. Blade erosion and fracture are the main reasons for gas turbine failure. In this study, the characteristics of the flow field and rotor stress in the gas turbine under different fume volumes are simulated and analyzed by simulation software (ANSYS). The influences of fume volume on the high-temperature fume flow field, temperature, velocity, catalyst particle movement rotor stress in the gas turbine, as well as the influence law of flue gas flow on temperature gradient, pressure gradient, velocity distribution, and the main position of blade erosion were studied. The stress distribution and maximum stress position of the impeller were also determined. It was found that the variation trends of the pressure gradient in the calculation domain of the gas turbine under different fume volumes are similar. The pressure on the working face of the rotor blade decreases gradually along the flow direction of the high-temperature fume. The highest pressure appears near the sharp corner with the large radius of the front edge of the rotor blade. The variation of the fume flow rate has little influence on the temperature field of the entire machine. The erosion wear of the rotor blade mainly occurs in the leading edge and tail. The maximum stress point of the blade is located at the large fillet of the first pair of tenon teeth. The maximum stress point of the disc is located at the large fillet of the third pair of tenon teeth. It is believed that these research results have reference help for analyzing the typical failure causes of flue gas turbine, optimizing the actual operating conditions and the reconstruction design of flue gas turbine.
1. Introduction
A gas turbine is the main energy recovery equipment in a heavy oil catalytic cracking unit and belongs to typical turbine machinery [1,2,3]. Gas turbines generally operate at a high speed of 6000–7000 r/min at 600–700 °C and approximately 0.2 MPa for an extended period of time. Given poor catalyst separation effect, a considerable number of catalyst particles become attached to the fume [4], thereby causing serious erosion of the rotor blades [5,6,7]. The erosion wear of gas turbine blades is a typical gas–solid erosion wear [8]. The high-temperature fume with solid catalyst particles enters the gas turbine, moves quickly in the stator and rotor runner, collides against the gas turbine blades, and causes blade wear [9,10]. The internal flow field of a gas turbine is complex and unusual [11]. The turbulent flow of a high-temperature fume affects the trajectory of catalyst particles and has an important impact on the erosion wear of rotor blades [12,13]. Therefore, to ensure the long-term and efficient operation of the gas turbine, conducting a detailed study on the relationship between the fume volume and flow field in the gas turbine is necessary.
Many researchers have studied the mechanism and influencing factors of erosion wear from different factors. Finnie and Mcfadden [14] studied an analytical study of the erosion of ductile metals by rigid abrasive grains through making a more realistic assumption about the location of the forces during particle–surface interaction. Bitter [15,16] put forward the deformation wear theory, which is verified on the single particle erosion wear tester and reasonably explains the erosion phenomenon of plastic materials. Adam Khan et al. [17] investigated the cyclic oxidation and hot corrosion behavior of metal materials and proposed a new erosion model based on adiabatic shear of metal; the plastic flow behavior of metal materials under high strain rate as well as adiabatic and constraint conditions was thereby revealed.
Many scholars have studied the numerical simulation of the flow in the gas turbine [18,19,20,21,22,23]. Mashayek and Pandya [24] reviewed the numerical simulation methods on predicting turbulent flows laden with solid particles or liquid droplets and introduced the numerical simulation methods of gas–solid and gas–liquid two-phase turbulent flow in detail, including the first category, direct numerical simulation (DNS), large-eddy simulation, and stochastic modeling, which are collectively called the ‘Lagrangian description’, and the second category, under the ‘Eulerian description’, including Reynolds-averaged Navier–Stokes (RANS) and probability density function (pdf) modeling. Tabakoff et al. [25,26,27] studied the trajectory of solid particles and the wear mechanism of solid wall materials in rotating cascade of turbomachinery by experimental and numerical methods. Han et al. [28] used the k-ε two-equation turbulence model of compressible fluid. The effects of the two inlet fume flow rates on the internal flow field and particle movement of the catalytic cracking gas turbine were analyzed. They confirmed that with the increase of the flow rate, the static pressure, static temperature, molecular viscosity, and gas velocity in the stator runner also increased. Dong et al. [29] employed a finite element software to simulate the engineering problem of fatigue damage caused by the erosion and wear of gas turbine blades under solid catalyst particles. The erosion laws of different erosion rates on the target material under the same particle size and the erosion effects of different size particles under the same erosion rate are ascertained. On the basis of the Euler–Lagrange model, Chen et al. [19] studied the gas–solid two-phase flow characteristics in a catalytic cracking gas turbine. They confirmed that the distribution of gas velocity and pressure in the fume runner was the main factor for the collision and deposition between solid particles and the blade surface. Schiele et al. [30] studied the temperature field distribution of the nozzle by using the fluid solid coupling heat transfer technology in a gas turbine. Evans et al. [31] calculated the gas flow velocity and thermal conductivity in the cavity between gas turbine stator components and compared the results under different turbulence models. Martin et al. [32] simulated the cooling of turbine blades by using the CFD coupled heat transfer method.
Based on the literature review, different fume flow rates will affect the gas–solid two-phase flow characteristics in the gas turbine. Thus, the influence of the fume flow rate on the gas–solid flow characteristics and rotor stress in the gas turbine requires further investigation. To examine the influence of the fume flow rate on the flow field of gas turbines, this research simulated the flow field characteristics of a gas turbine under different fume flow conditions. The effect of the fume flow rate on the high-temperature fume flow field, catalyst movement trajectory, and rotor blade erosion was studied in detail. The corresponding simulation methods and results are also presented.
2. Simulation Method
2.1. Computational Model
In this study, Fluent is used to simulate the flow field in the gas turbine. The species transport, k-ε turbulence, and DPM models are selected for the simulations. On the basis of the flow field characteristics in the gas turbine, the governing equations are chosen as follows:
Mass conservation equation:
Momentum conservation equation:
Energy conservation equation:
2.2. Geometric Model and Mesh Generation
2.2.1. Flow Field in a Gas Turbine
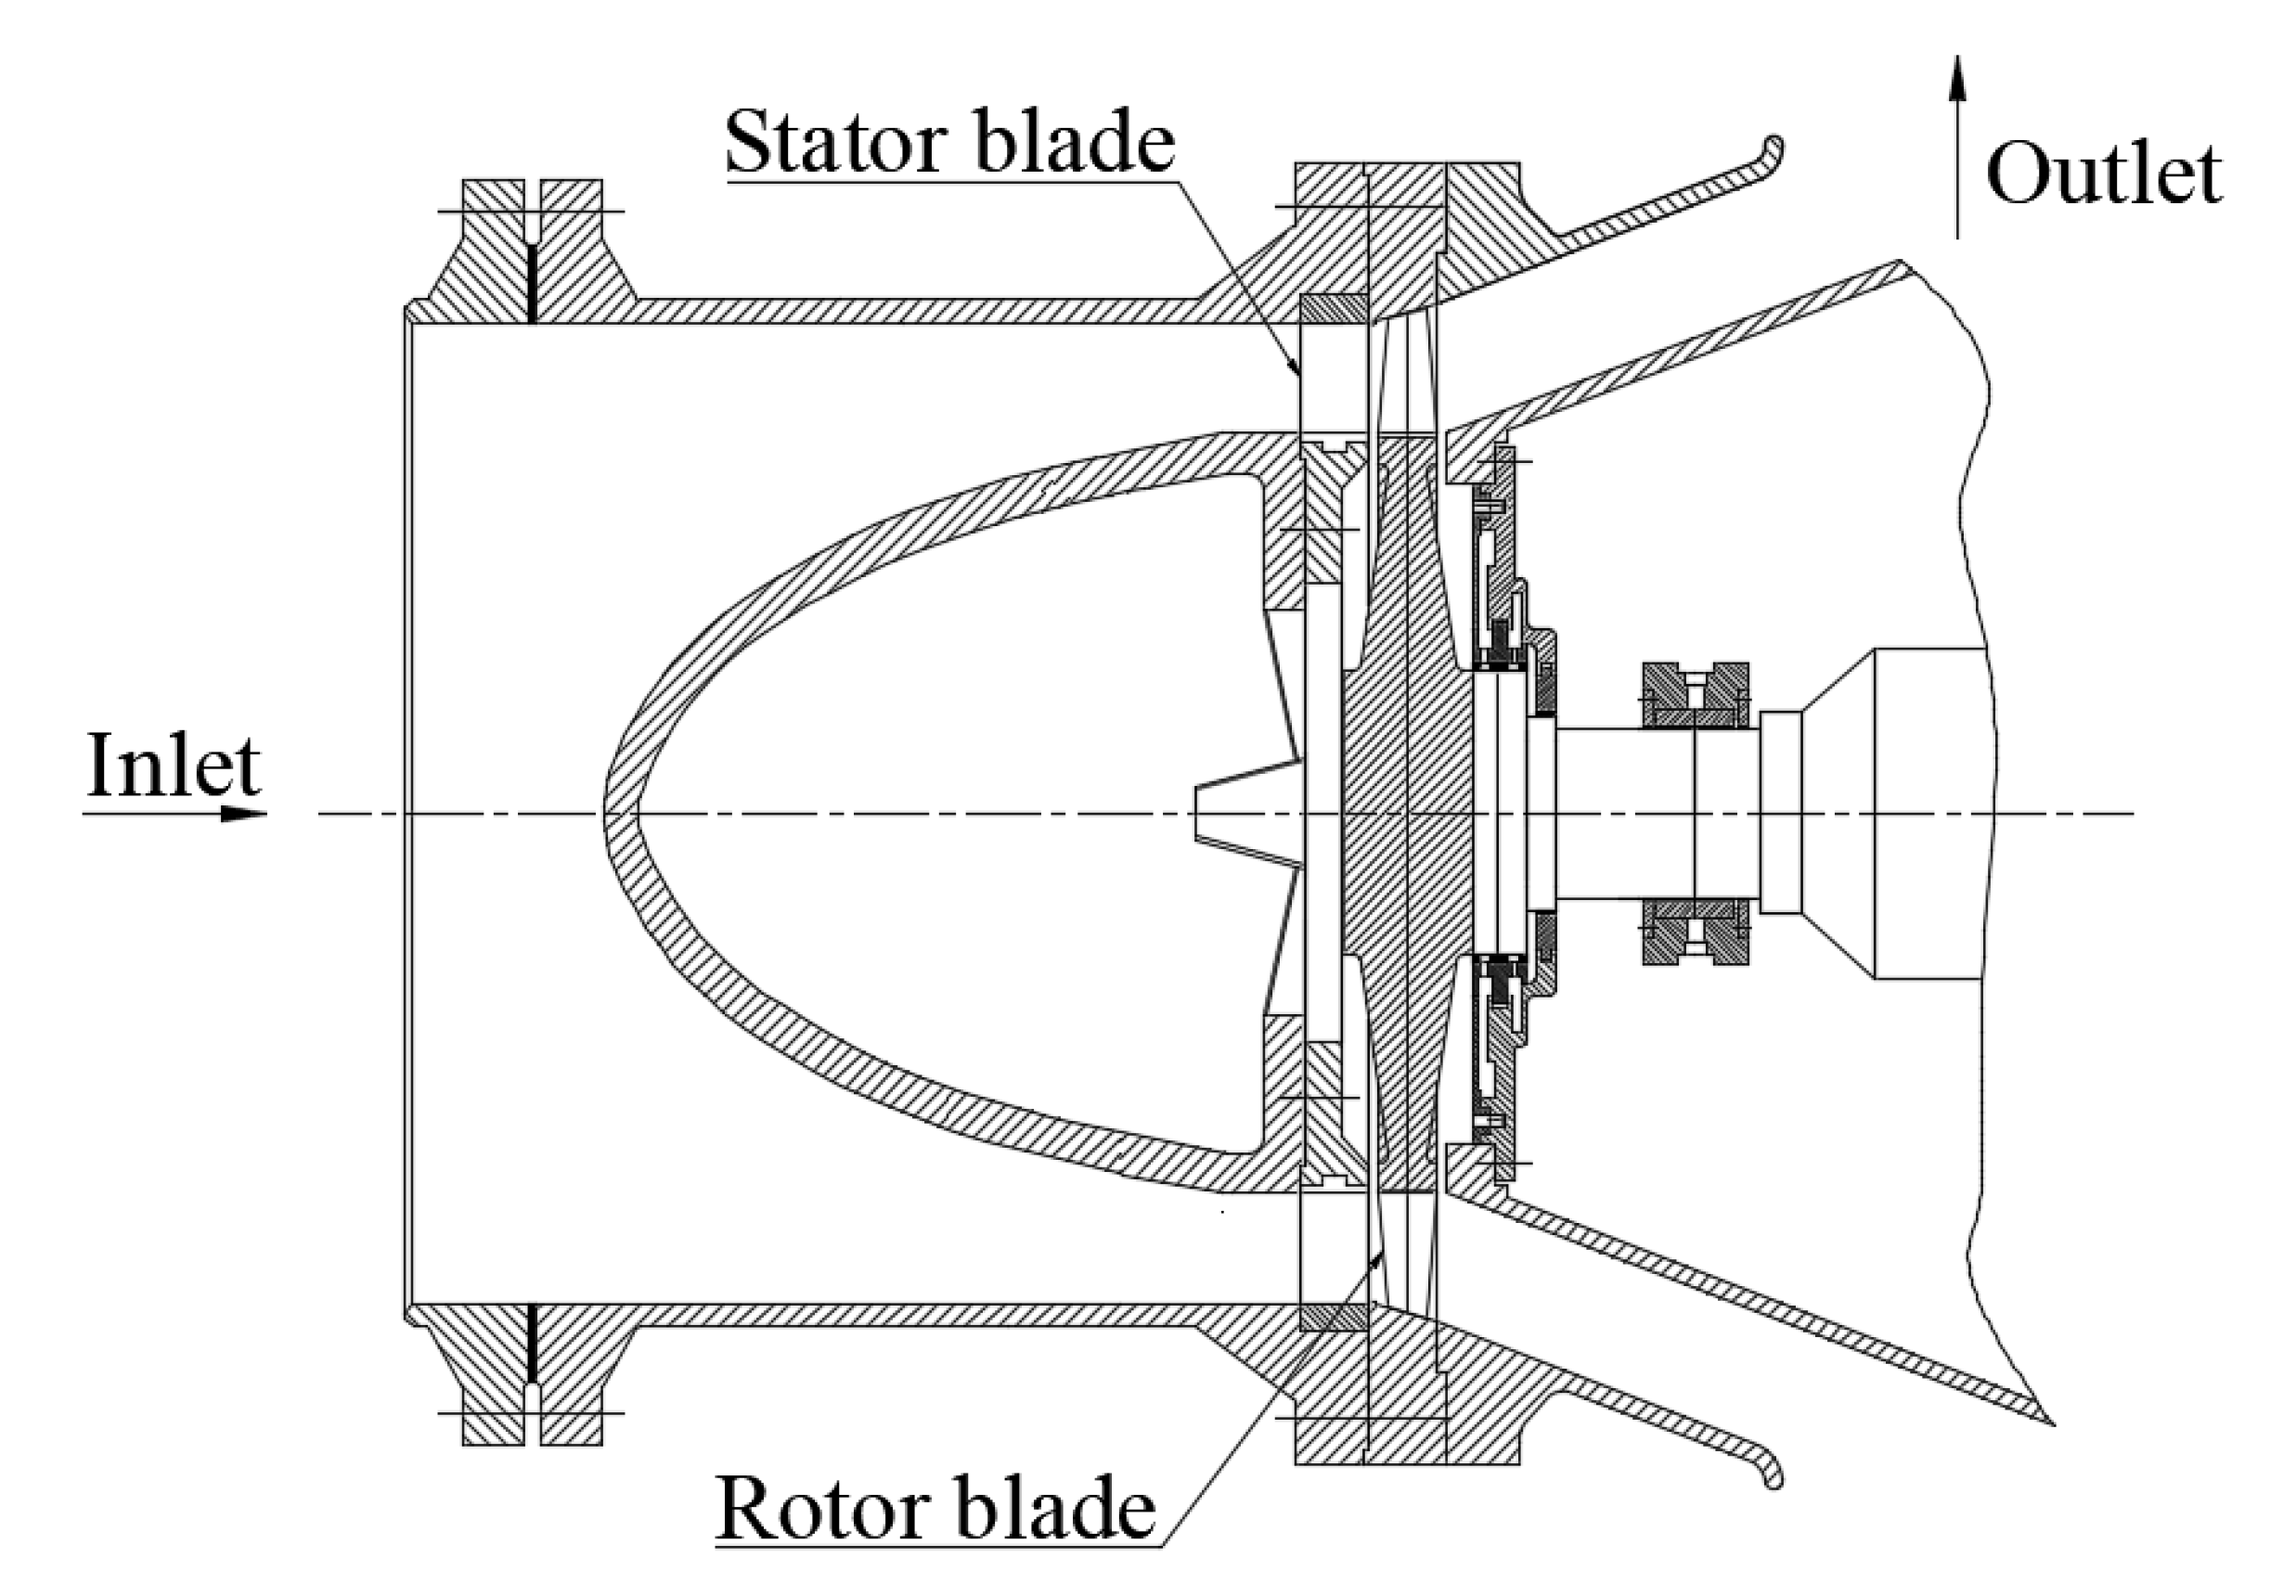
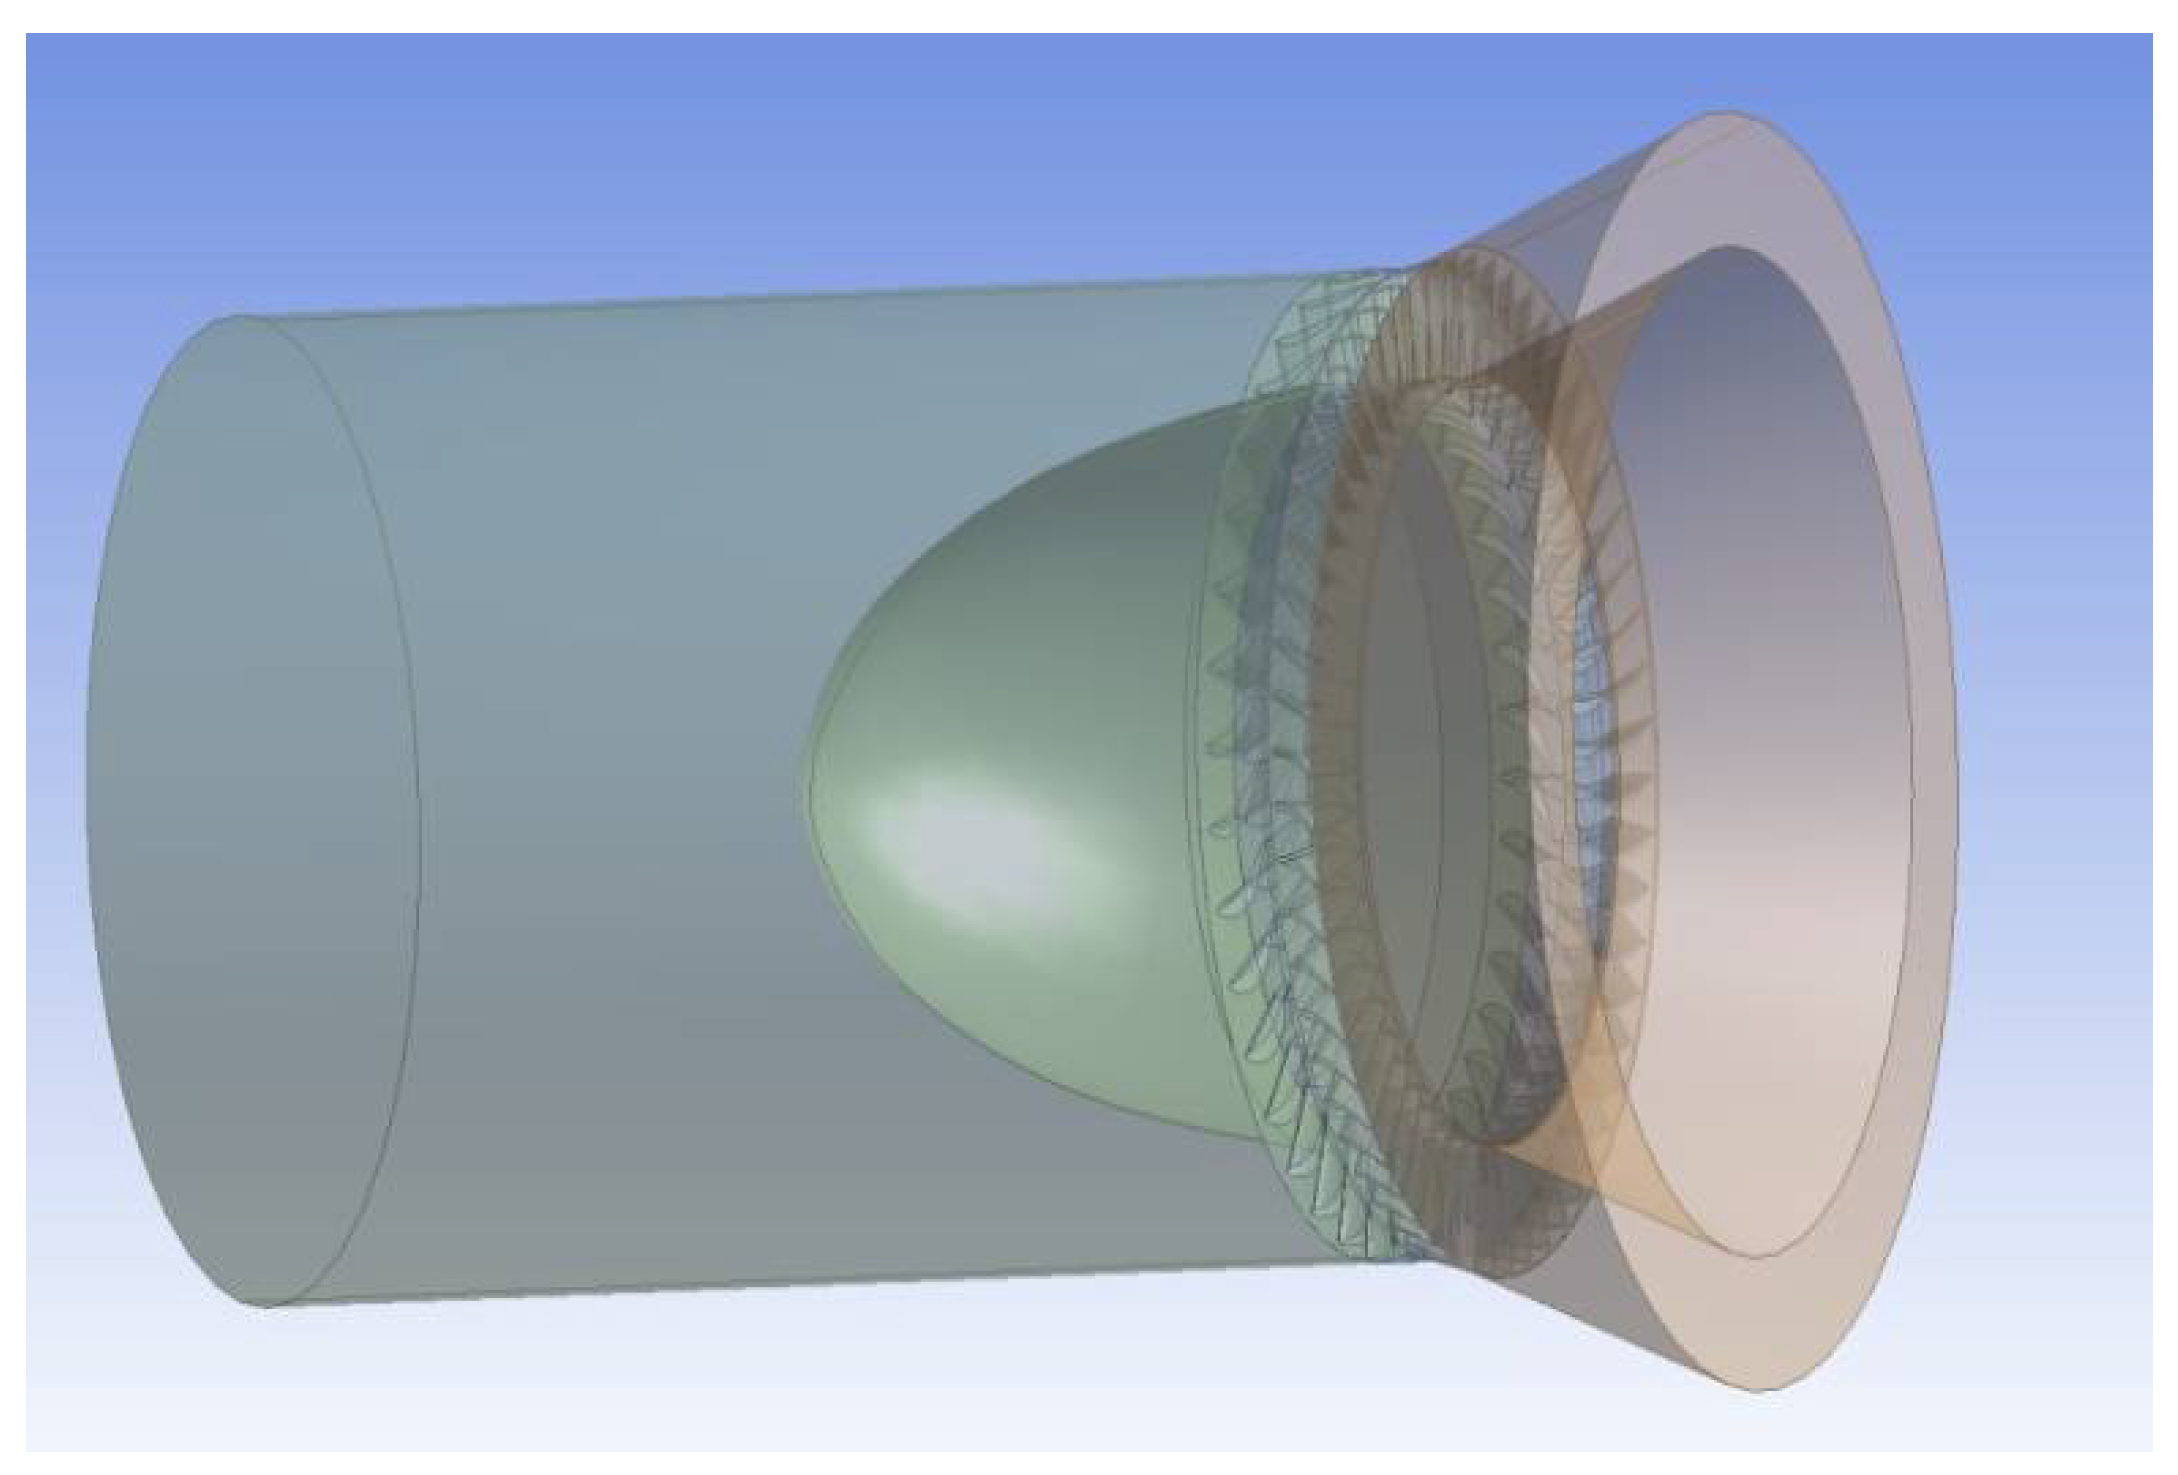
Flow field simulation of the gas turbine is conducted with the ANSYS Fluent 17.2. The geometric model of the fluid domain of the entire gas turbine is established according to the actual gas turbine structure. The fluid and calculation domains of the whole gas turbine includes the inlet section, stator blade, rotor blade, and outlet section. Specifically, 38 stator blades and 57 rotor blades are included. The actual structure of the gas turbine is shown in Figure 1. The geometric model of the numerical simulation is shown in Figure 2.
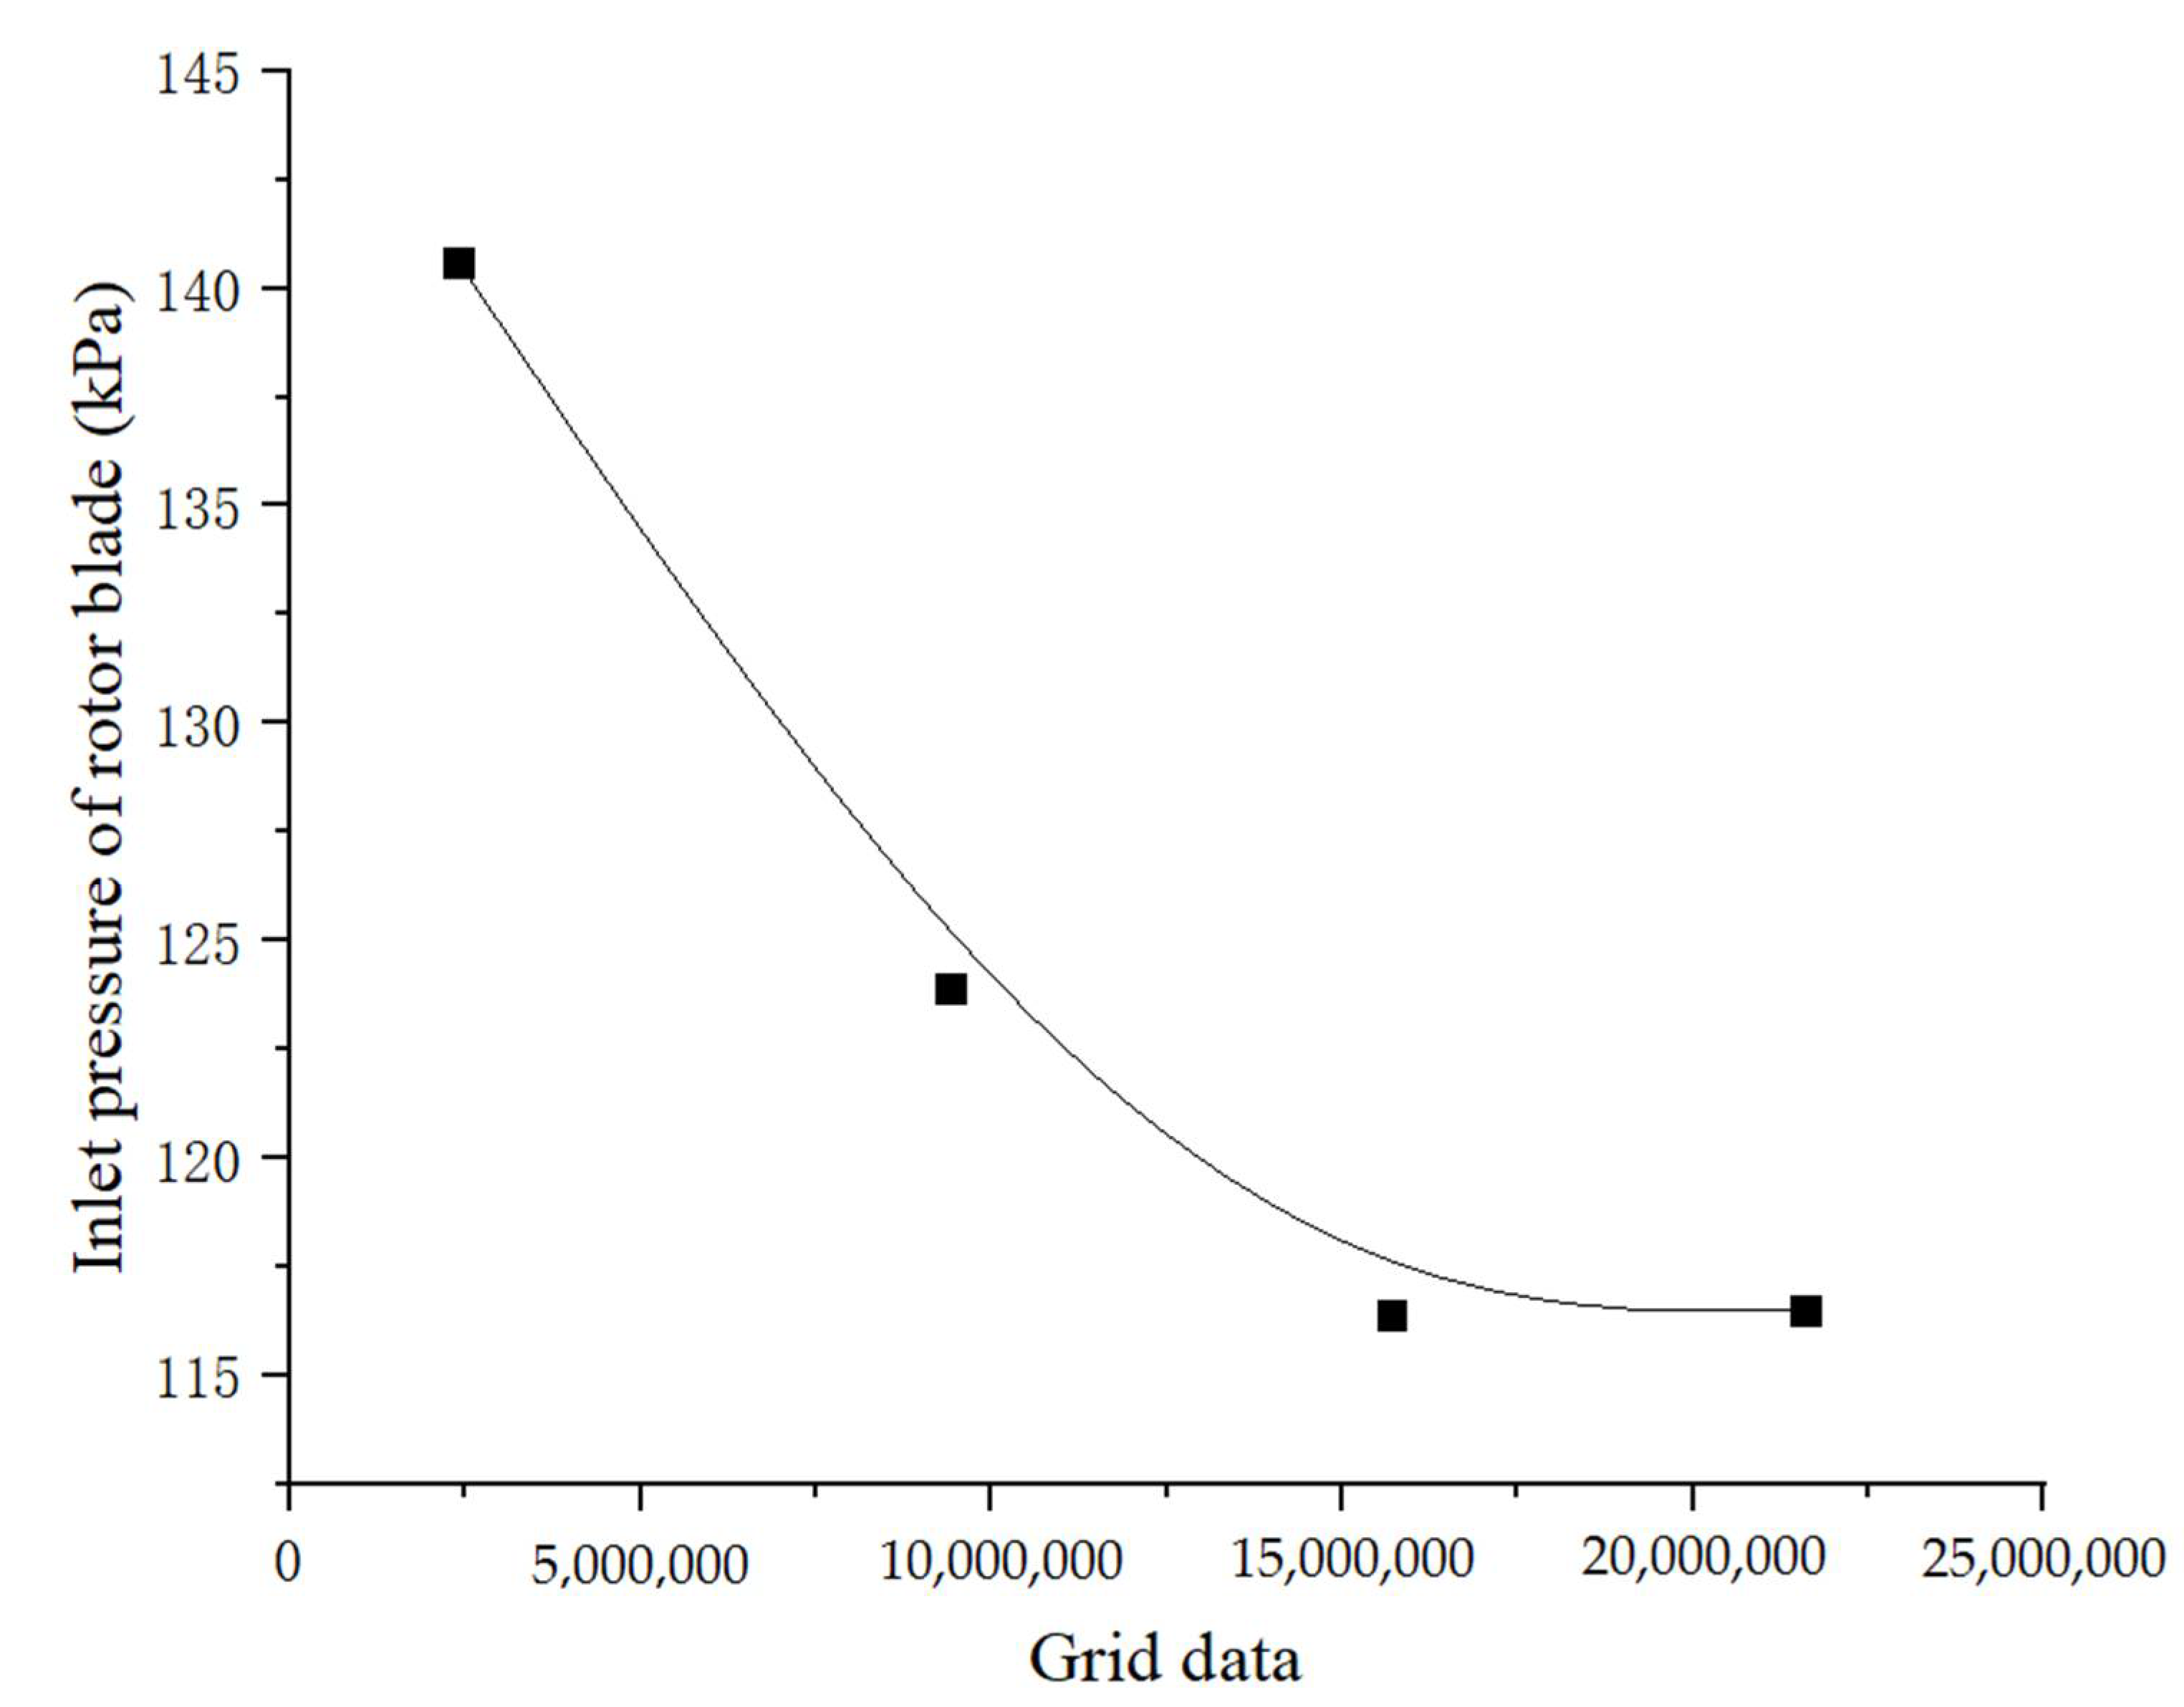
The mesh module in ANSYS is used to mesh the geometric model. This study utilizes a tetrahedral unstructured mesh. According to the previous numerical simulation experience of an axial flow compressor applied in a large wind tunnel and for a structure containing three rows of blades (one row of 49 rotor blades, the second one of 26 stator blades, and the third row of 49 stator blades), a grid node number of 2445 can be adopted to meet the calculation requirements. The research object in this work includes a row of 57 rotor blades and another of 38 stator blades. The shell structure is simple because it lacks small structures such as a sealing gap or relatively complex irregular structure. For reliable calculation accuracy and the control of the calculation amount under reasonable conditions, grid independence was verified. Four grid schemes were selected. The average pressures at the rotor blade inlet of the four schemes were intercepted for comparison. The grid data of the schemes are shown in Table 1.
The grid independence verification curve is shown in Figure 3. By comparison, the calculation results of Schemes Three and Four are basically the same. Thus, when the number of grids increases to 15.7 million, the investigation parameters are essentially stable. Therefore, Schemes Three and Four have reasonable grid density.
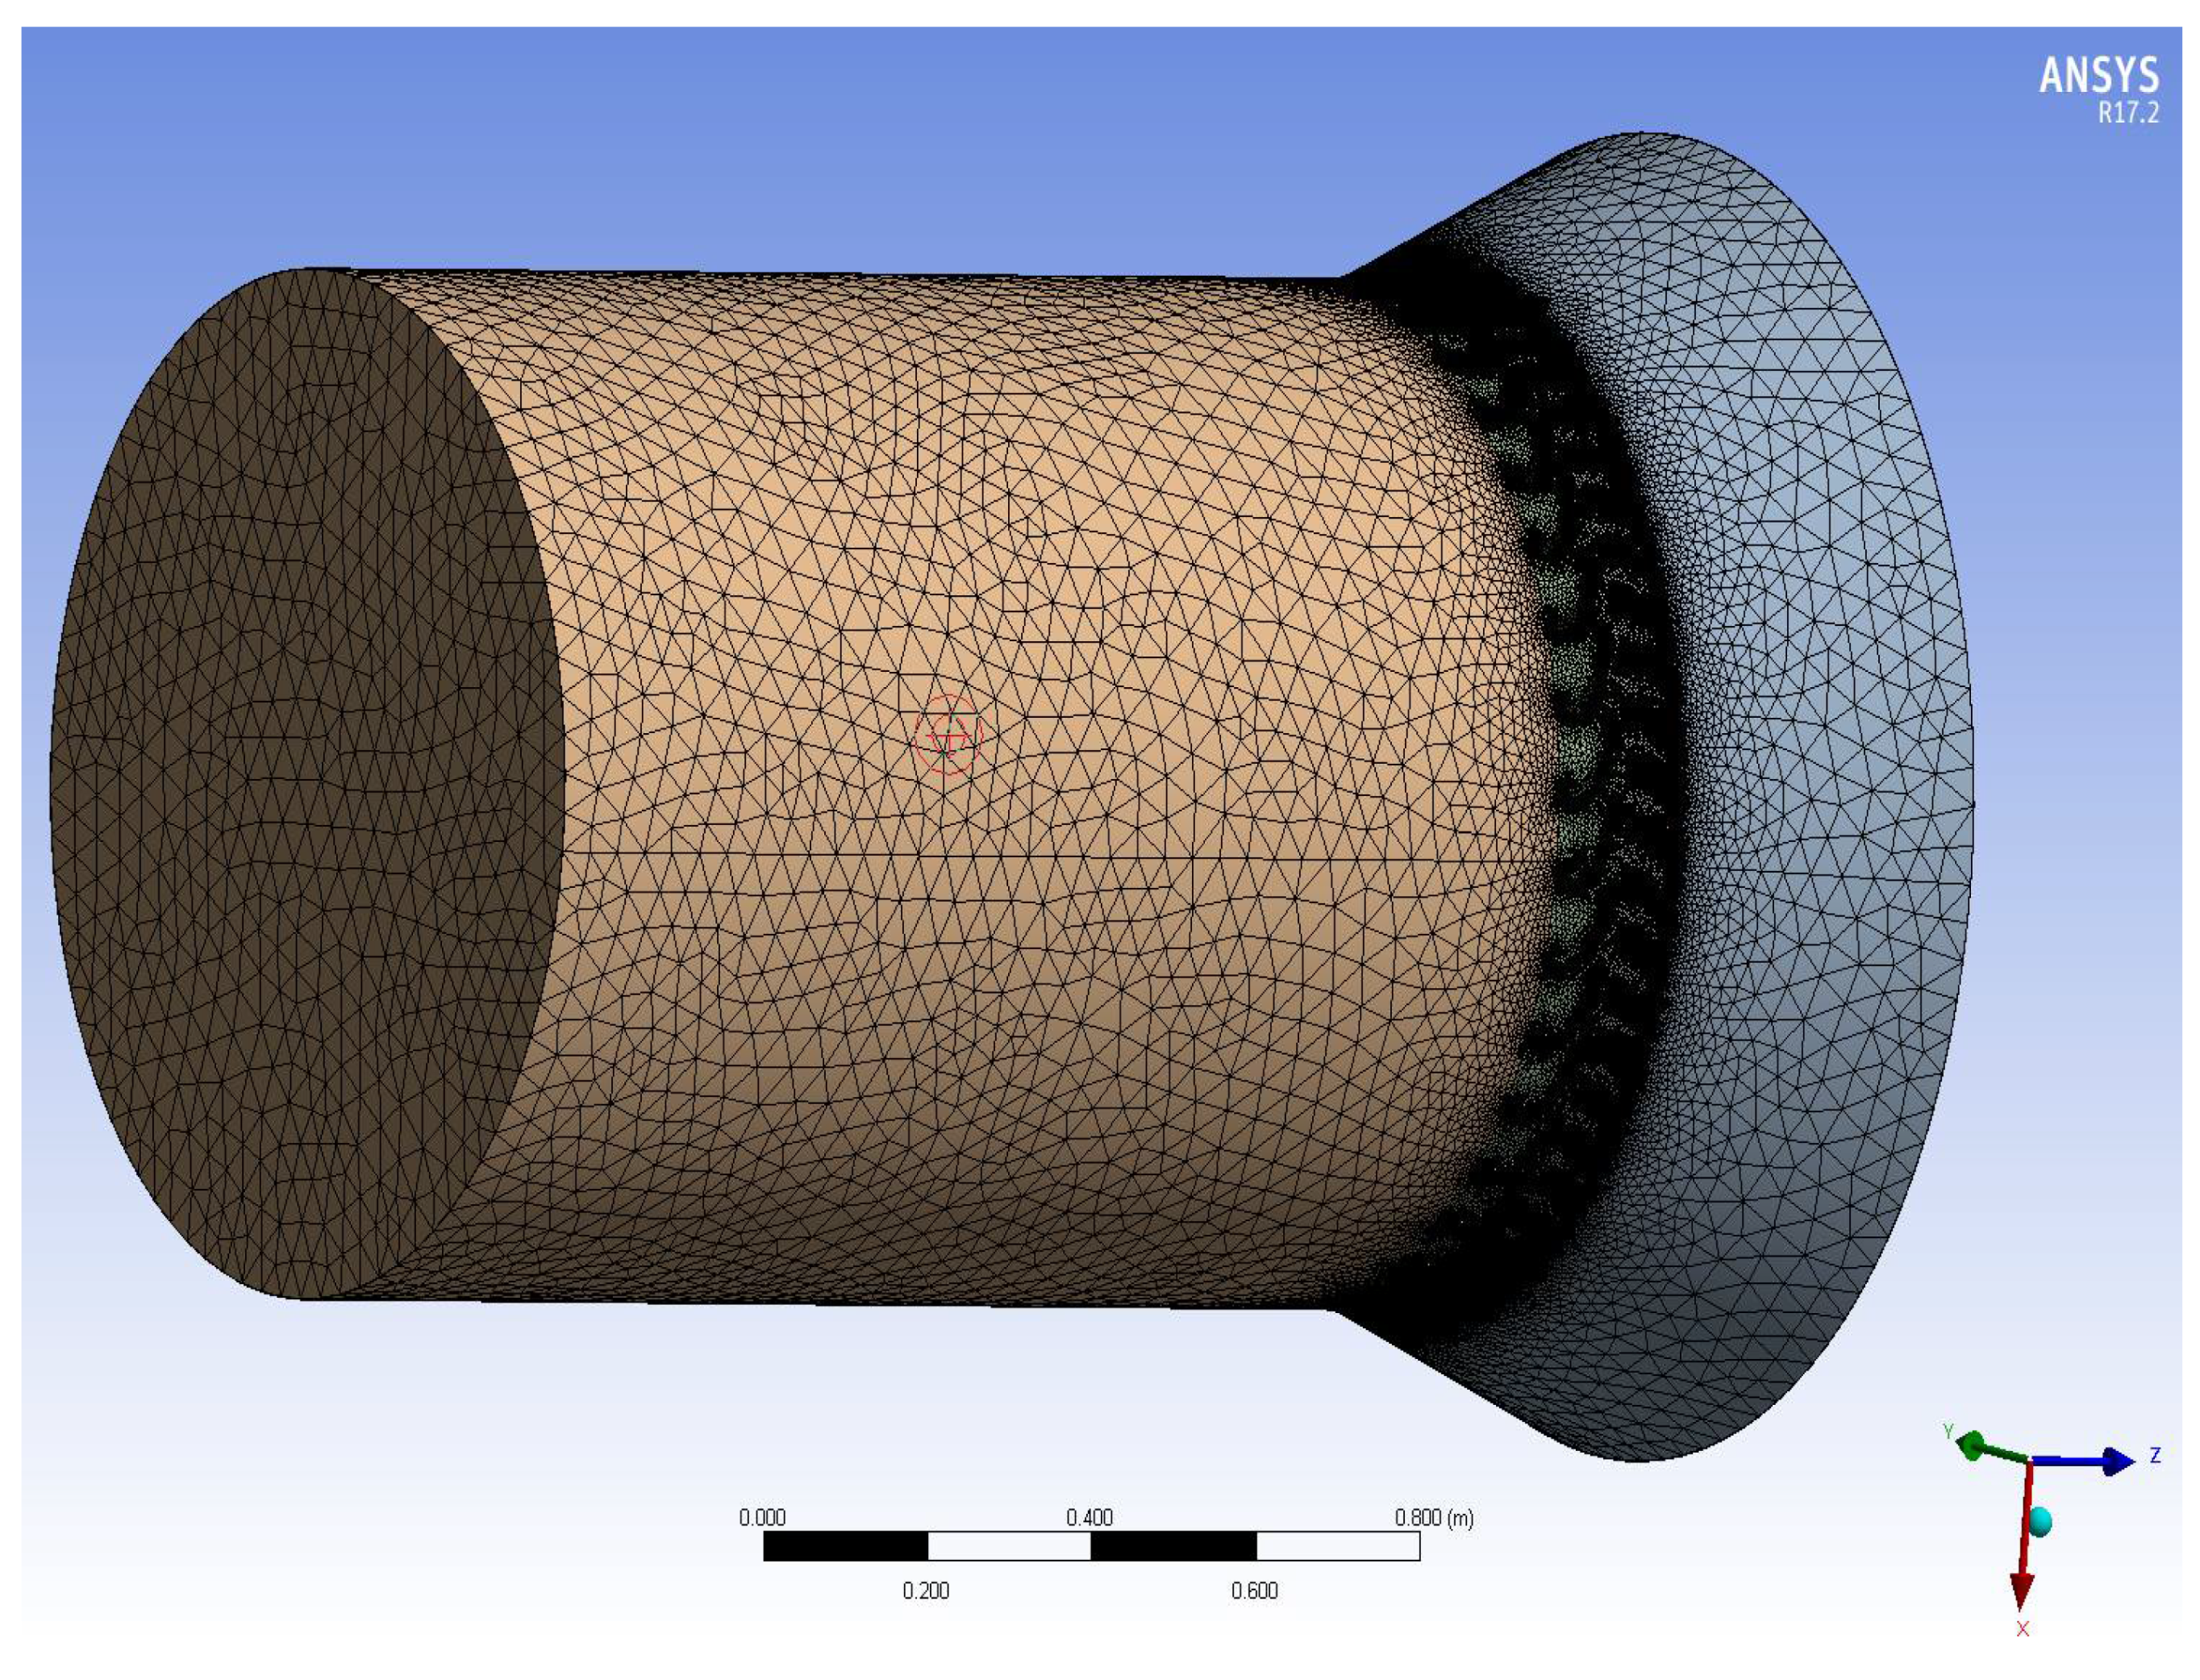
Considering the calculation accuracy and calculation cost comprehensively, the grid scheme of Scheme Three was selected for the numerical calculation of the flue gas turbine. The grid division results of the geometric model are shown in Figure 4.
2.2.2. Gas Turbine Rotor
Stress calculation and analysis of the gas turbine rotor are conducted with the ANSYS Mechanical 19.0.
The rotor disc and blade of the gas turbine are connected by a fir tree three-tooth structure. The fir type blade root has the advantages of small size, high strength, good safety, and easy disassembly. However, the tenon teeth of the rotor blade and the tenon groove of the disc must be carefully designed. The unsatisfactory matching between the two may affect the long-term stable operation of the gas turbine or even cause blade fracture.
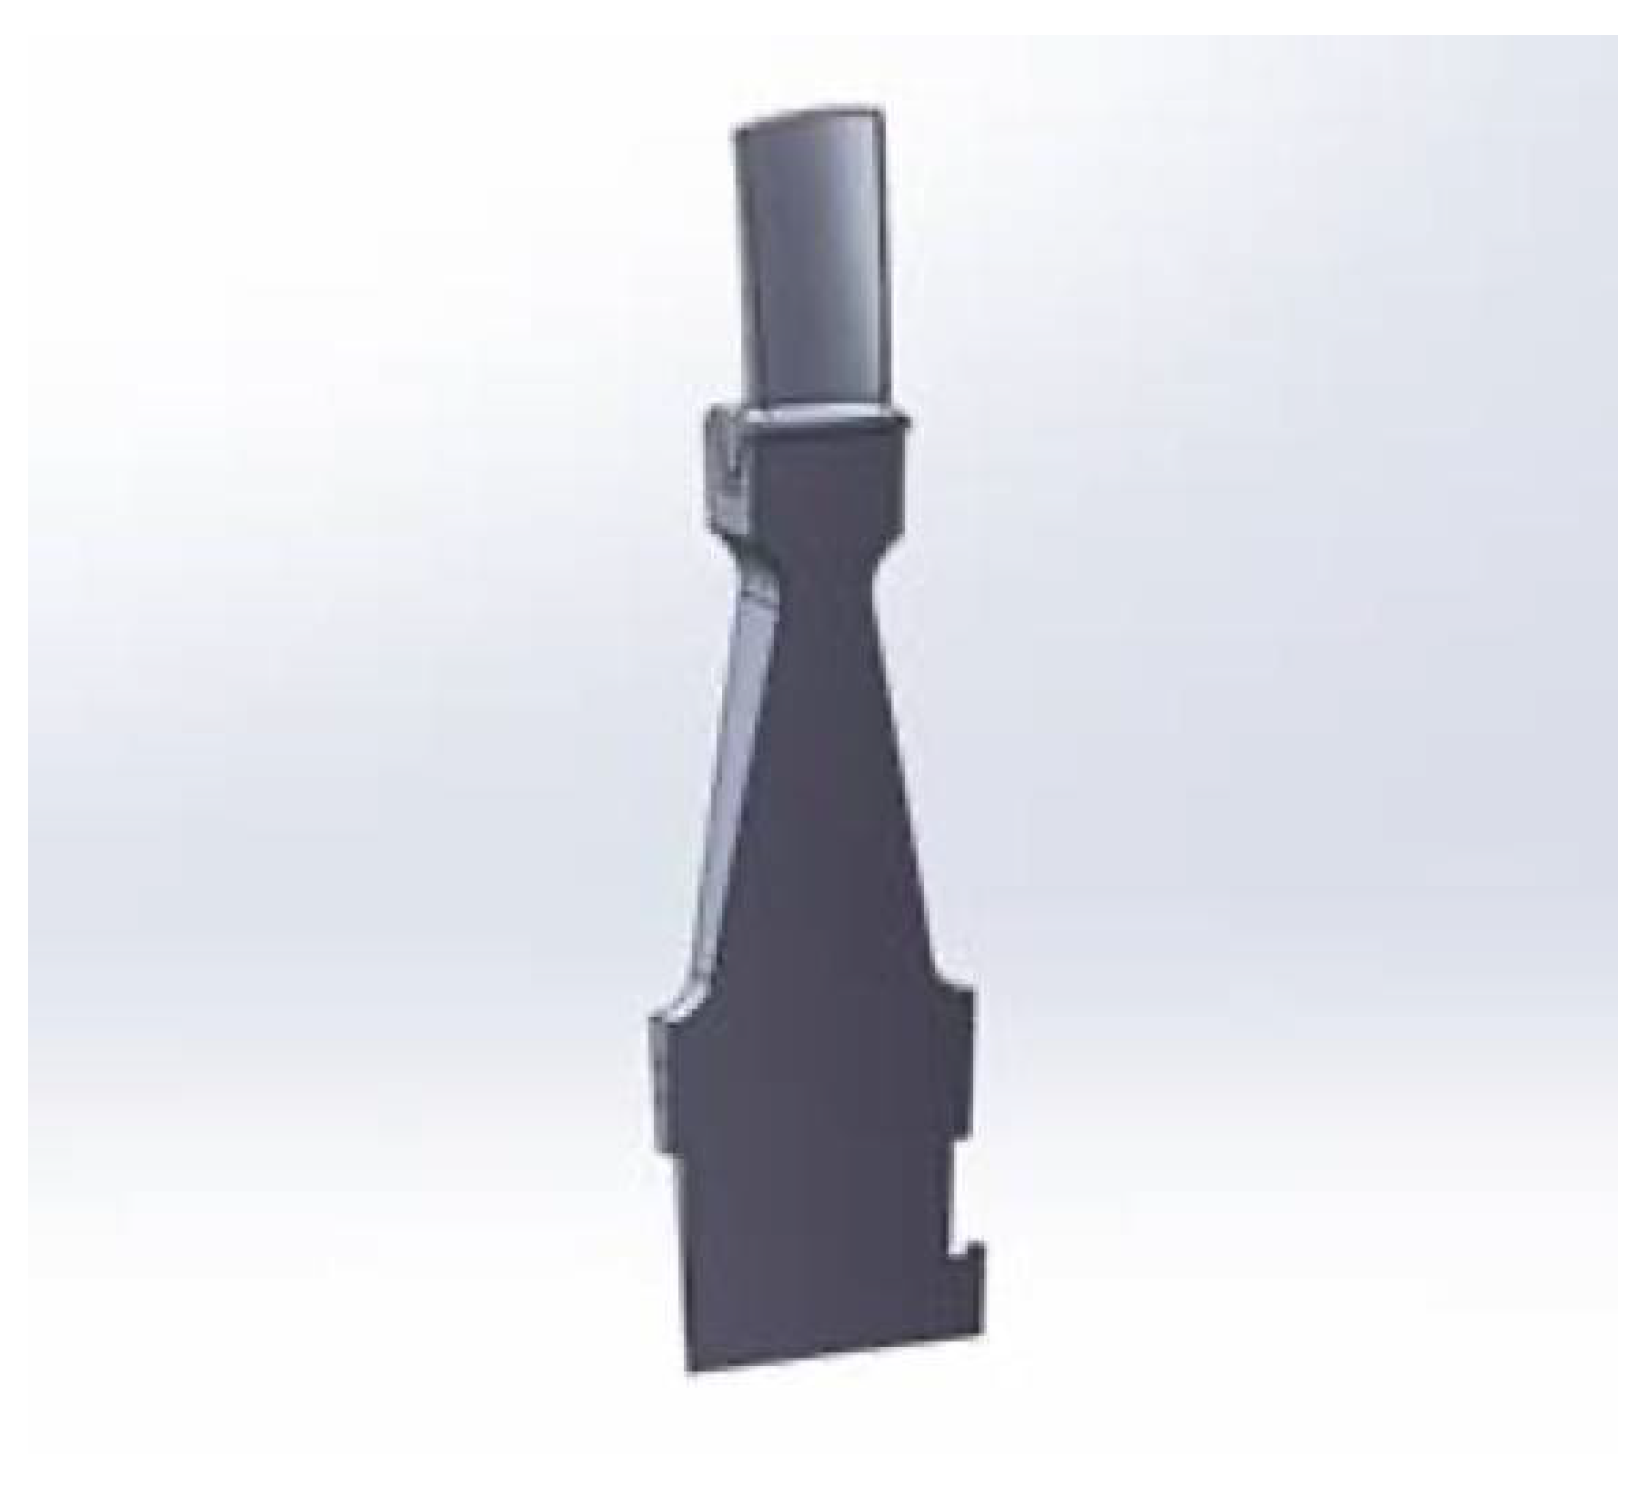
One gas turbine studied in this research is a single-stage disc structure with 57 rotor blades installed on the disc. Neglecting the influence of bolt holes, the blade and disc structure can be regarded as a circular symmetrical structure. This work takes 1/57th of the blade and disc as the calculation domain of cyclic symmetry, as shown in Figure 5.
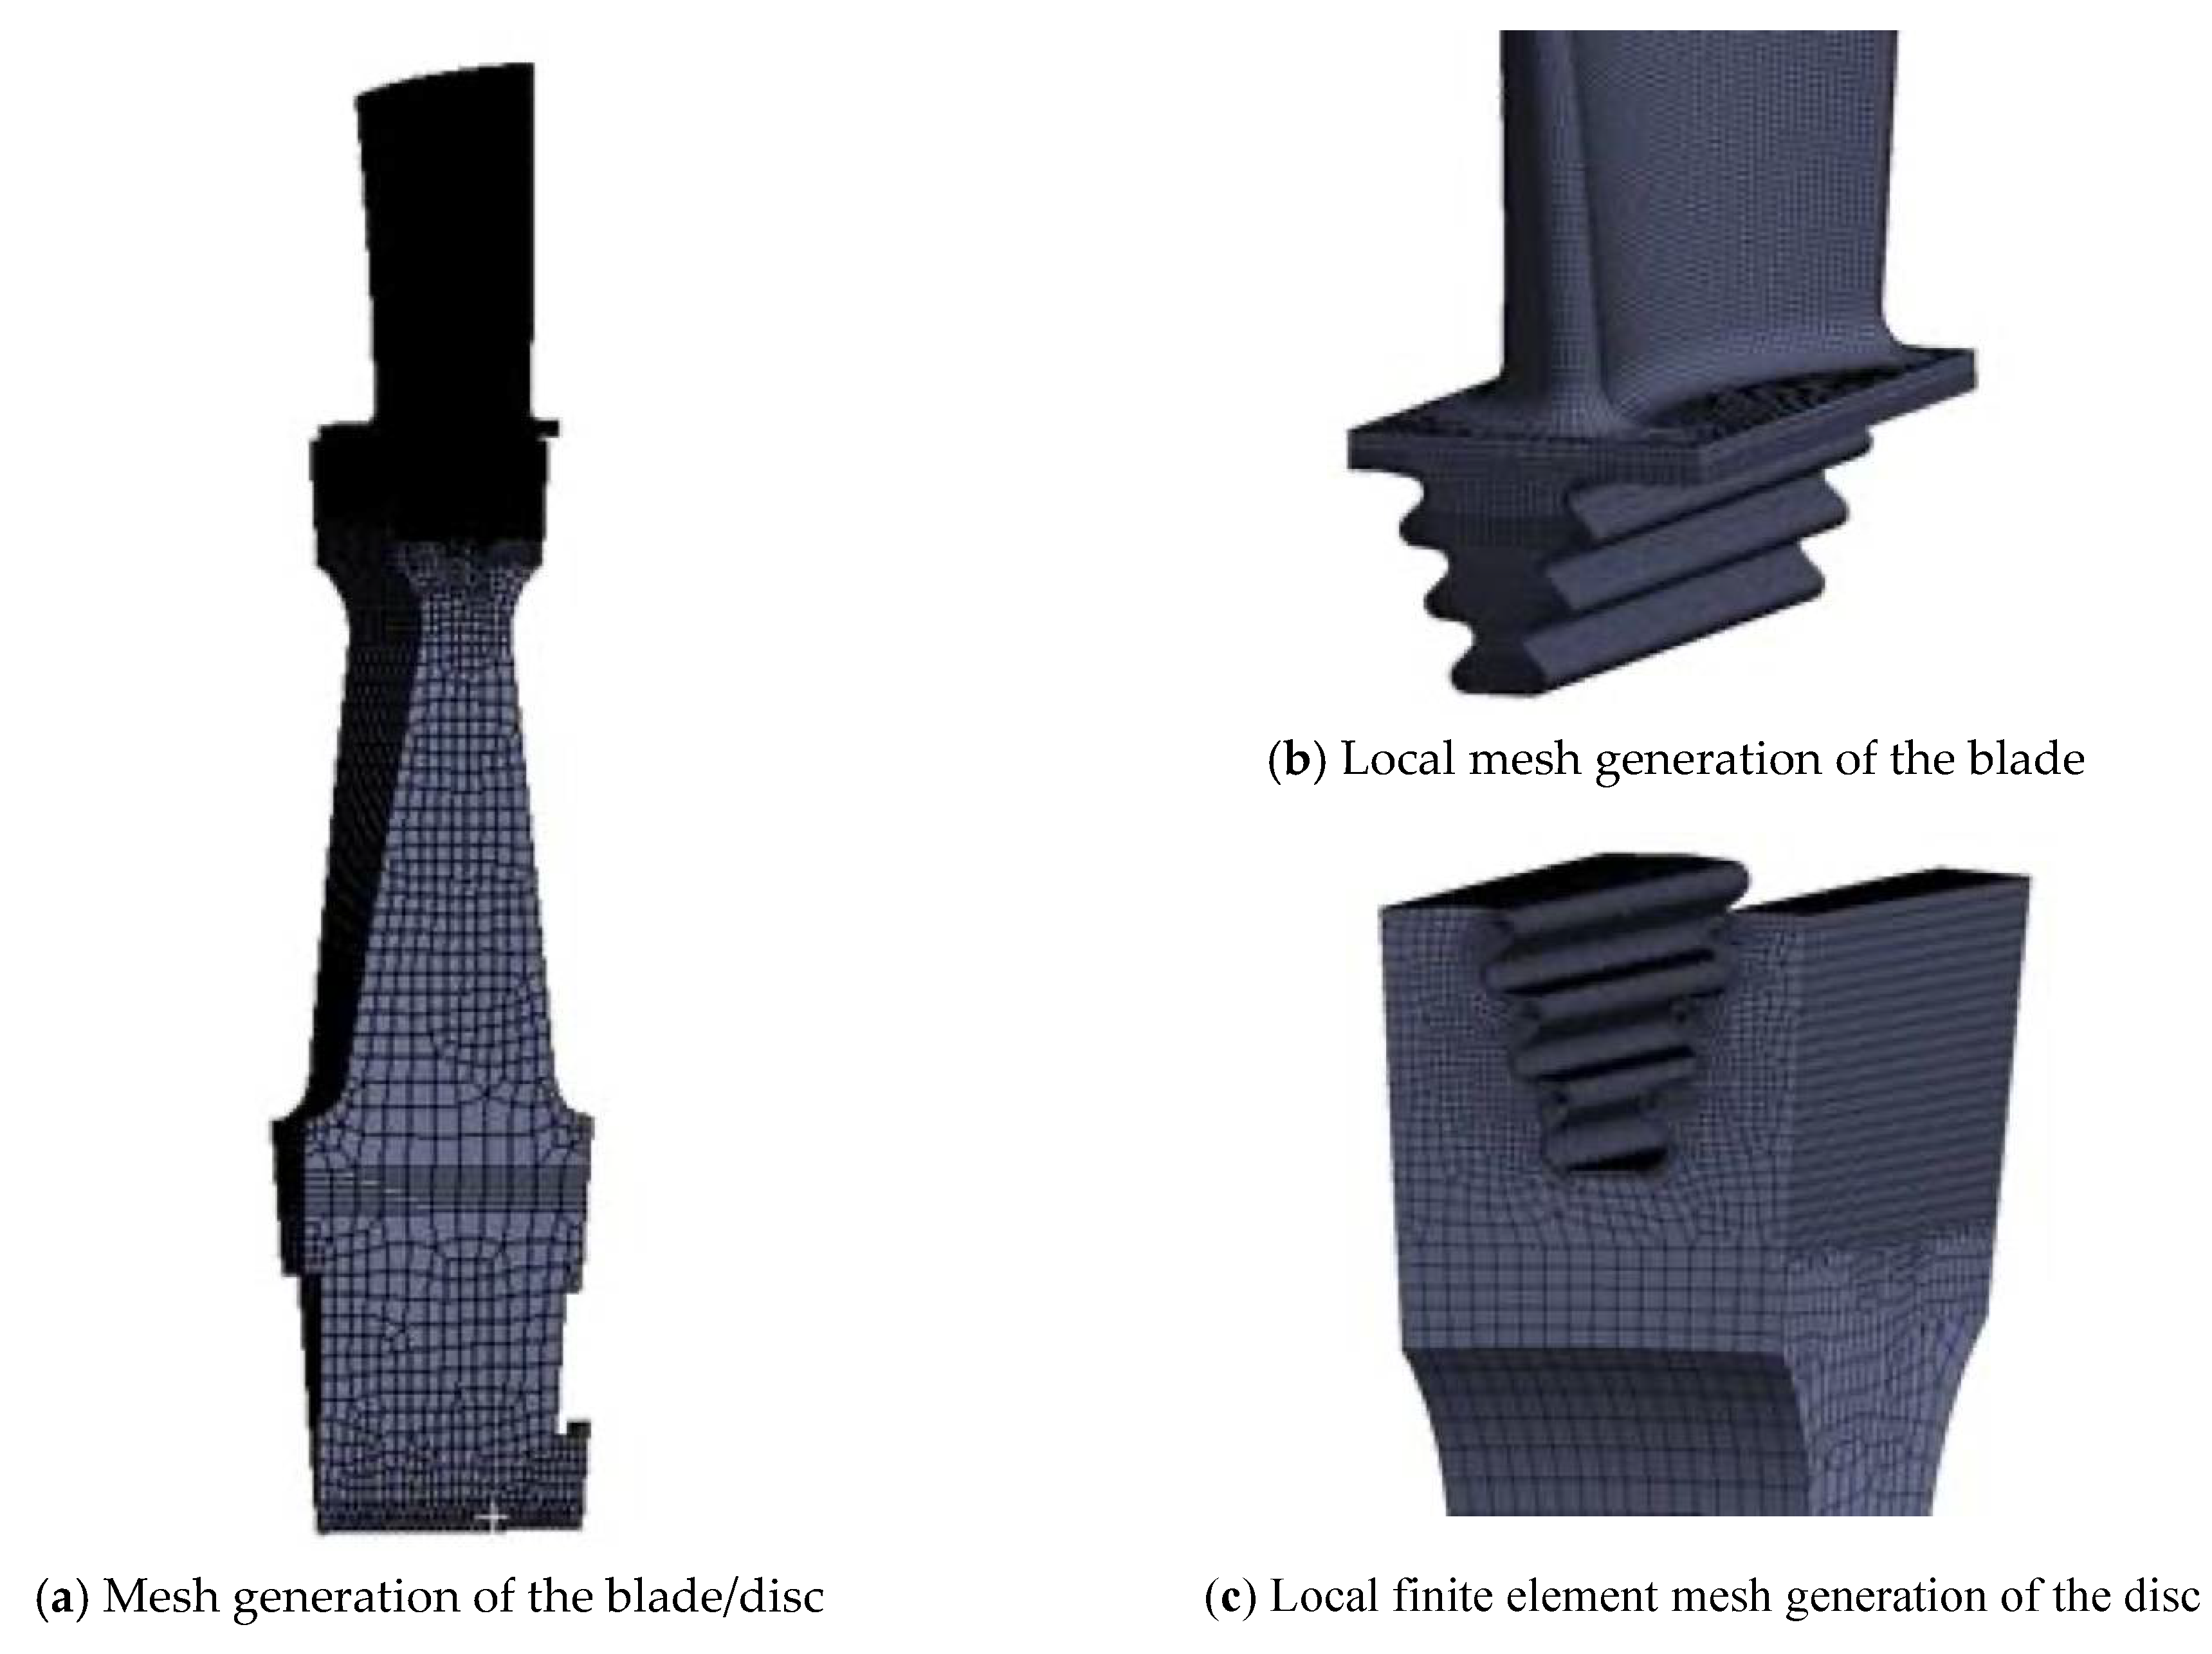
According to the parameters of the numerical finite element analysis, the quality and quantity of a mesh considerably influence the results. In this analysis model using the professional mesh preprocessing tool ANSYS, the tenon, mortise, and other areas are divided and refined into hexahedral meshes with intermediate nodes (Figure 6). The entire 3D model is divided into 266,403 units and 1,156,183 nodes.
2.3. Boundary and Working Conditions
2.3.1. Flow Field in the Gas Turbine
The numerical simulation adopts the “Density-Based Solver” which can obtain high calculation accuracy, and the solution method adopts an implicit solution. The working medium is a high-temperature fume with an inlet temperature of 943 °C. The rotor speed of the gas turbine is 6263 R/min, and the catalyst particle size is 1.5 × 10⁻⁶ m. According to the rated flow rate, the flow field changes and catalyst erosion caused by the flow field changes are investigated when the flow rates are 85%, 100%, 115%, and 130%. In the numerical simulation of gas–solid two-phase flow field in the flue gas turbine, the Reynolds number at the inlet is 1.24 × 10⁶~1.65 × 10⁶ for four different flow conditions. Table 2 presents the specific simulation parameters.
2.3.2. Gas Turbine Rotor
The domestic brand of the blade material is GH864, and its material properties are shown in Table 3. The alloy has good strength, toughness, heat resistance, and corrosion resistance.
In its usual working conditions, the rotor blade is mainly affected by centrifugal force, aerodynamic load, and thermal load. The aerodynamic load is a kind of surface-distributed pressure which acts on each surface of the blade. In the calculation, the aerodynamic load on the blade is ascertained by homogenizing the pressure difference between the pressure and the suction surfaces at different height sections of the blade. As the temperature distribution of the blade is relatively uniform, the influence of the thermal load is ignored in the stress analysis. The mortise and tenon set the friction contact relationship, and the friction coefficient is 0.1.
3. Influence of the Fume Flow Rate on the Flow Field in the Gas Turbine
3.1. Influence of the Fume Flow Rate on the Flow Field Pressure in the Gas Turbine
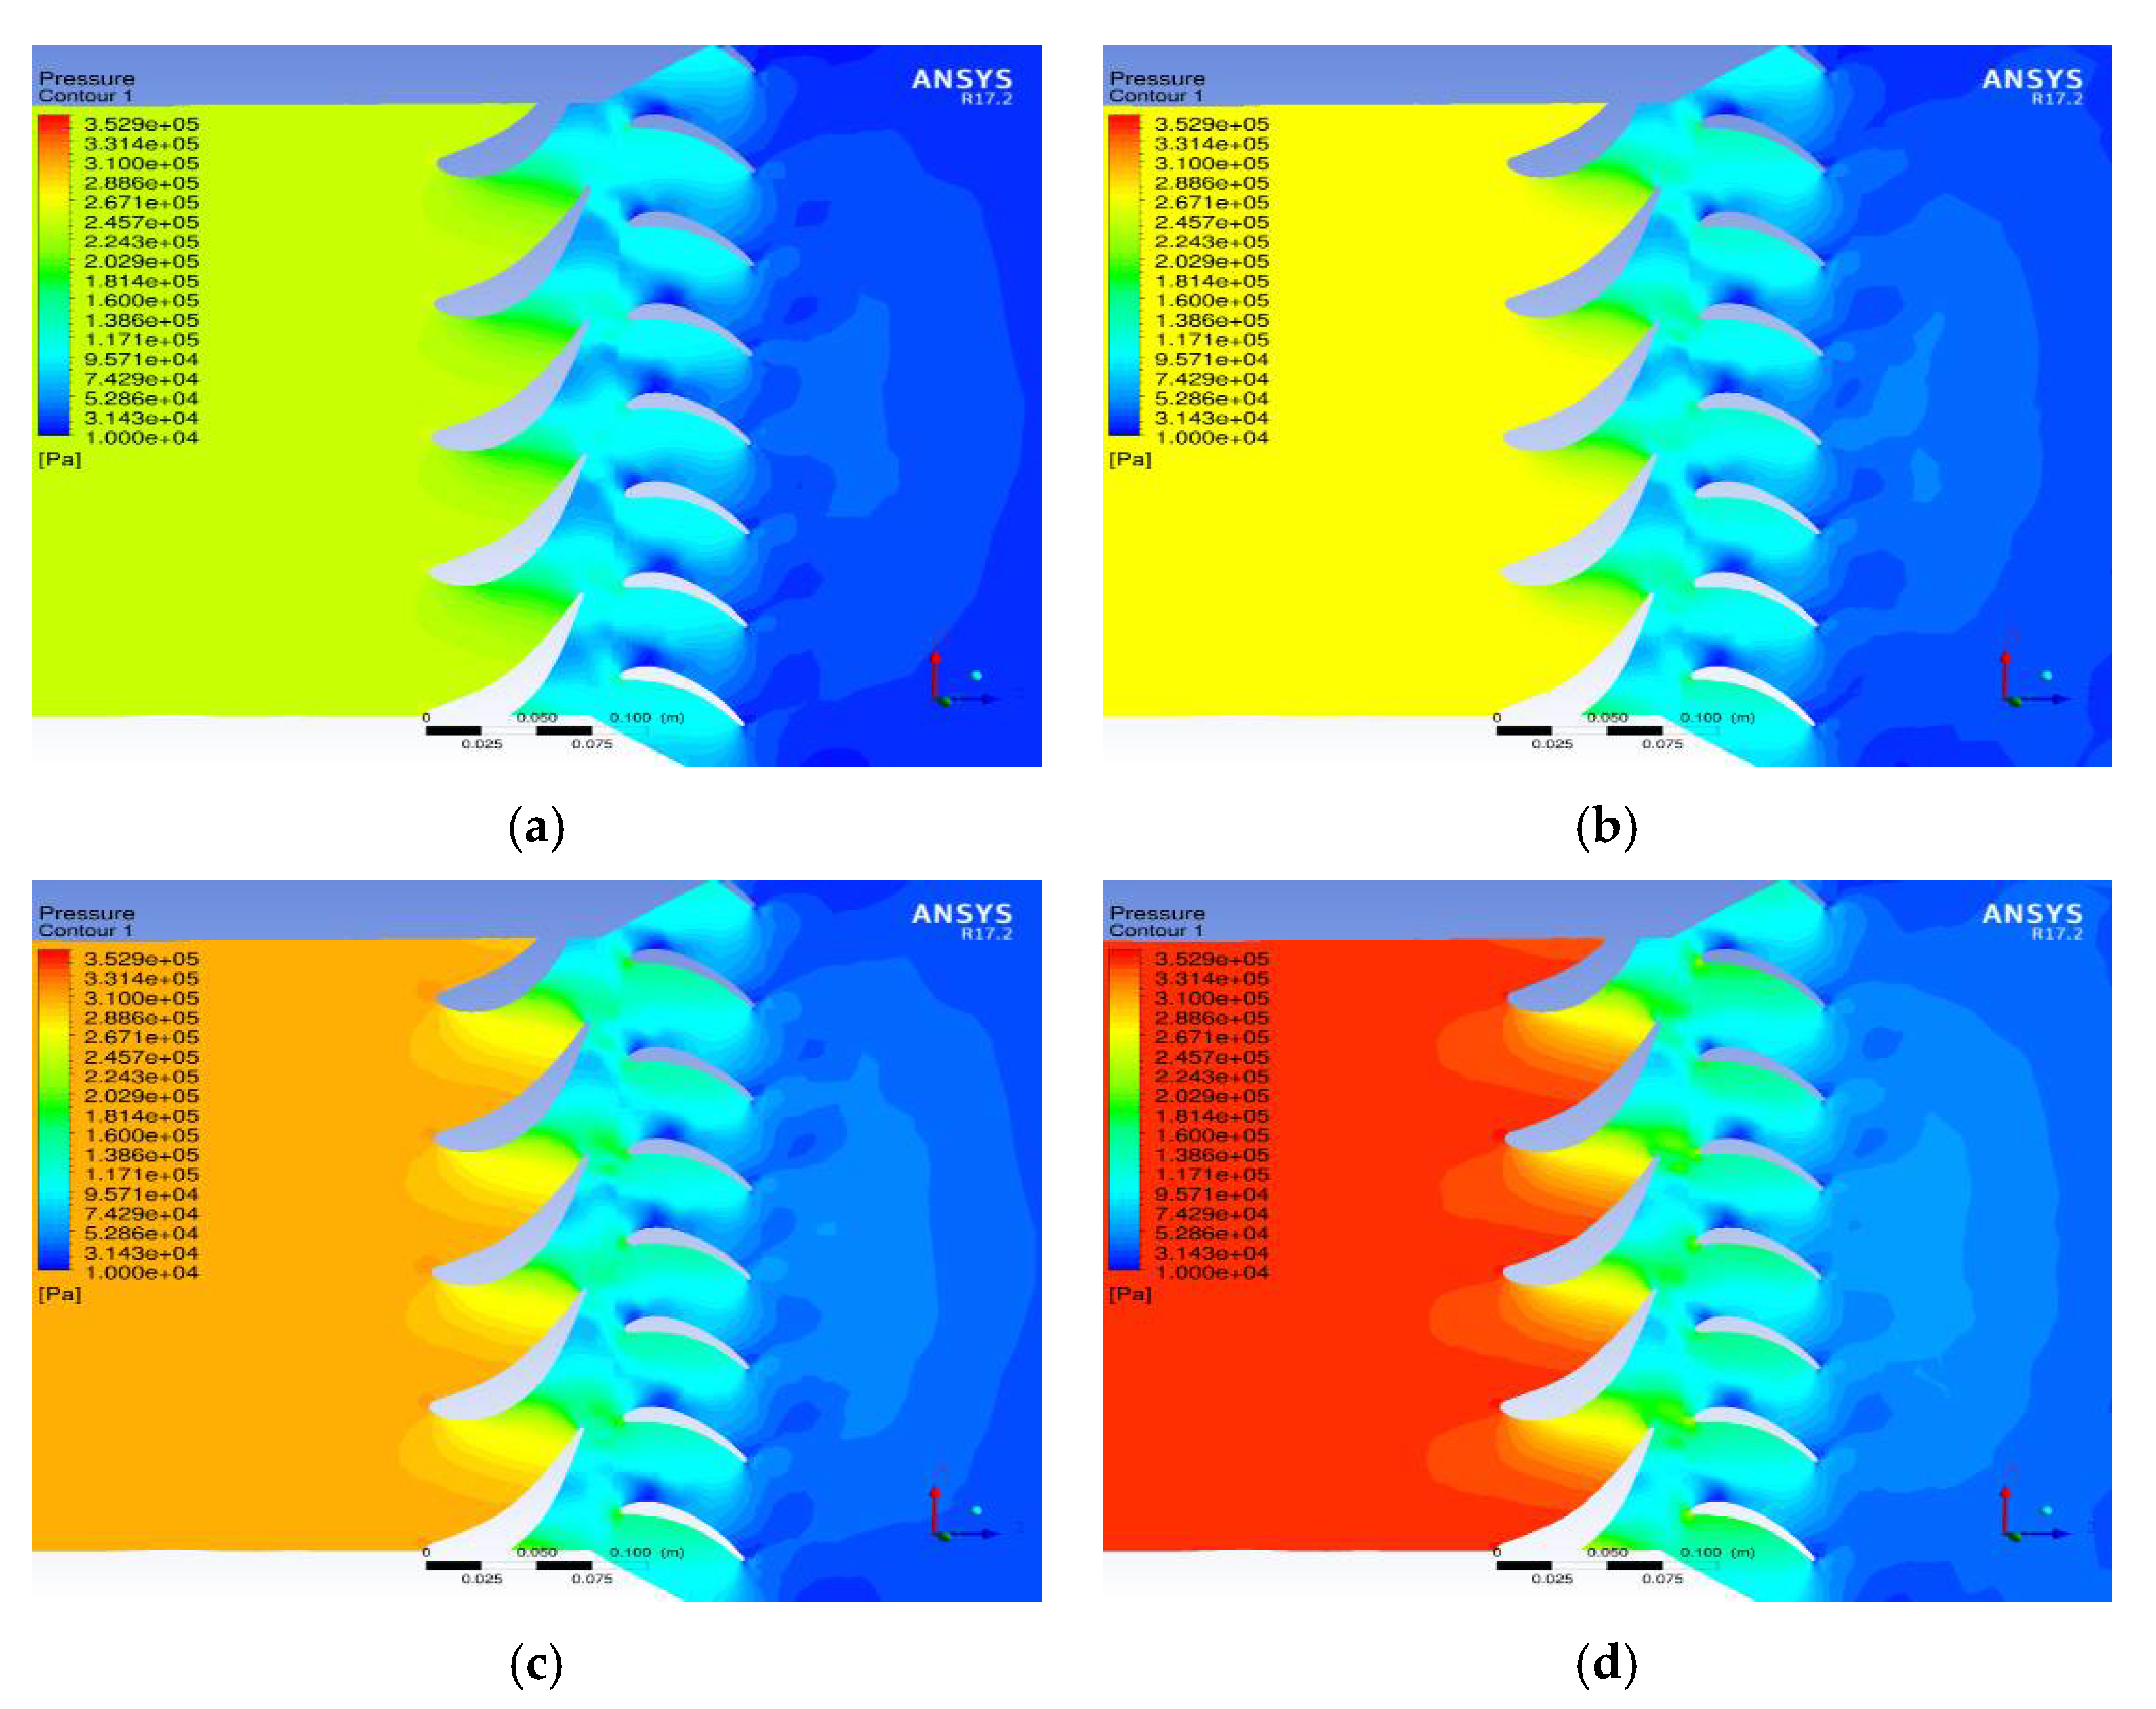
The flow direction of the high-temperature fume in all flow field images in this paper is from left to right, with the gas turbine inlet on the left and the outlet on the right. Figure 8 shows the pressure distribution of the blade pitch diameter section (50% blade height) under different flow rates. The numerical simulation results show that the variation trend of the pressure gradient in the calculation domain is essentially the same under different flow rates. The pressure distribution cloud image indicates that the high-temperature fume enters from the inlet section and passes through the stator blade. The fume expands in the stator blade and transforms its own pressure energy into kinetic energy. After flowing out of the stator blade, the fume impacts the rotor blade at a higher speed and transforms its own kinetic energy into the kinetic energy of the impeller. After flowing out of the rotor blade runner, the pressure of the fume further decreases. As shown in Figure 8, the working face of the rotor blade bears large pressure, while the non-working face exists in a low-pressure area. After the fume flows into the rotor blade runner, its uneven flow is caused by the impact effect, a circumstance which leads to the increase of the pressure gradient. The uneven flow of the fume will also aggravate the erosion of the catalyst particles on the rotor blade.
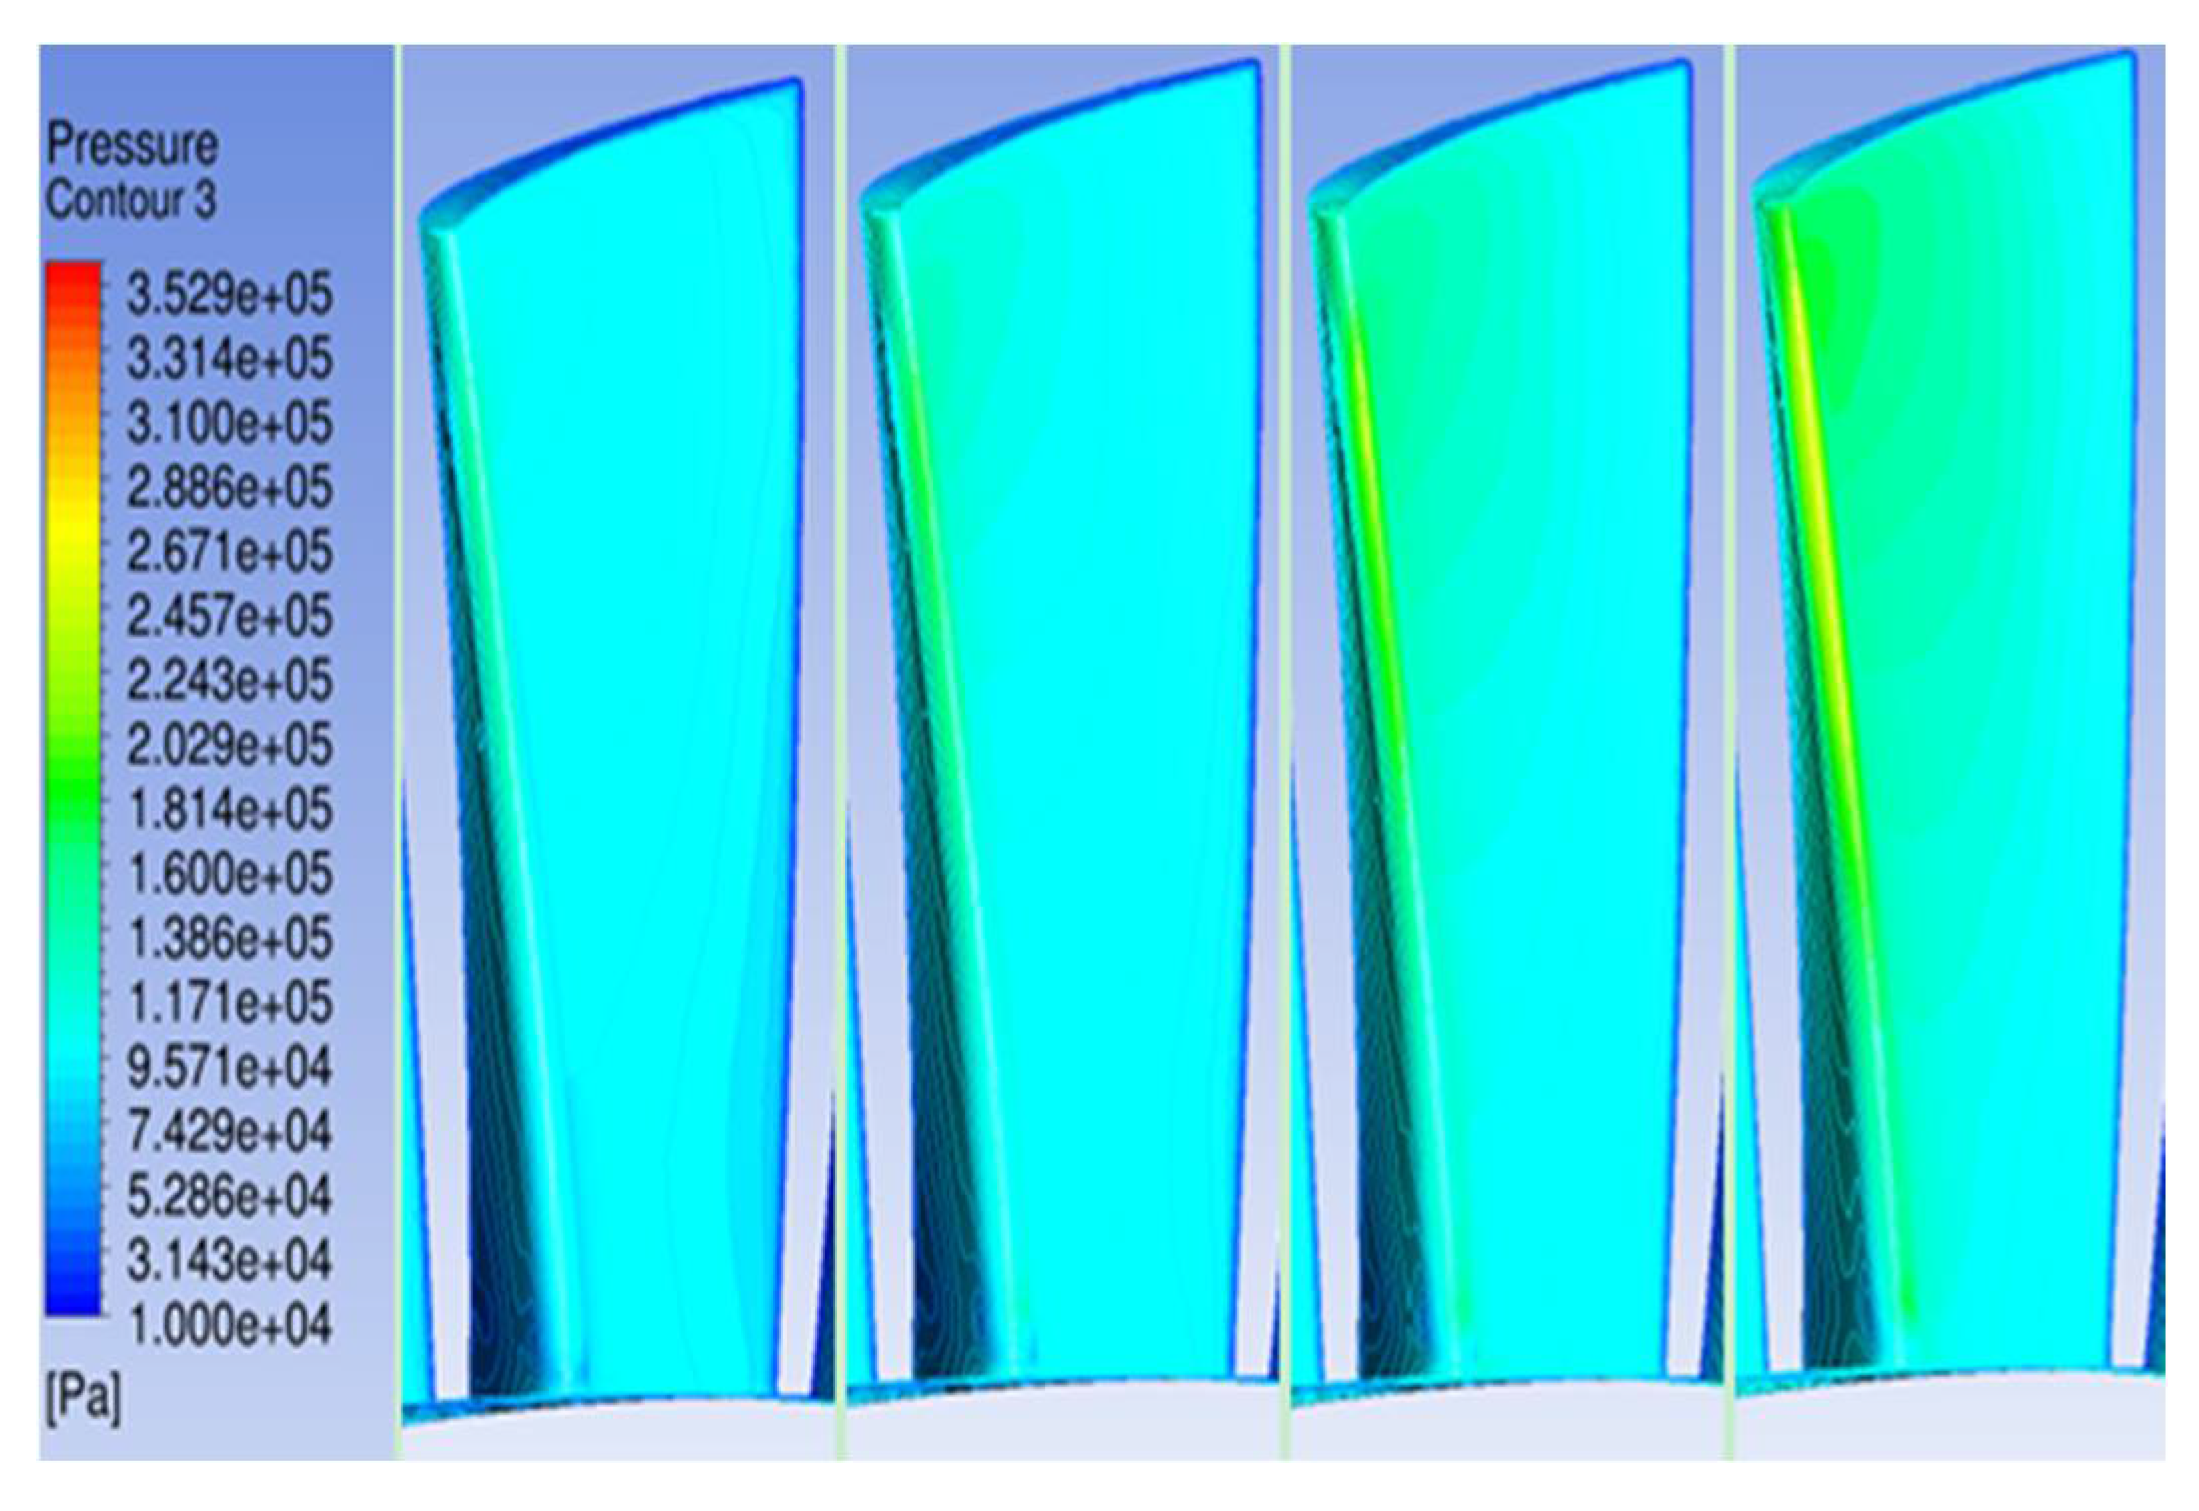
3.2. Influence of the Fume Flow Rate on the Gas Turbine Blade Pressure
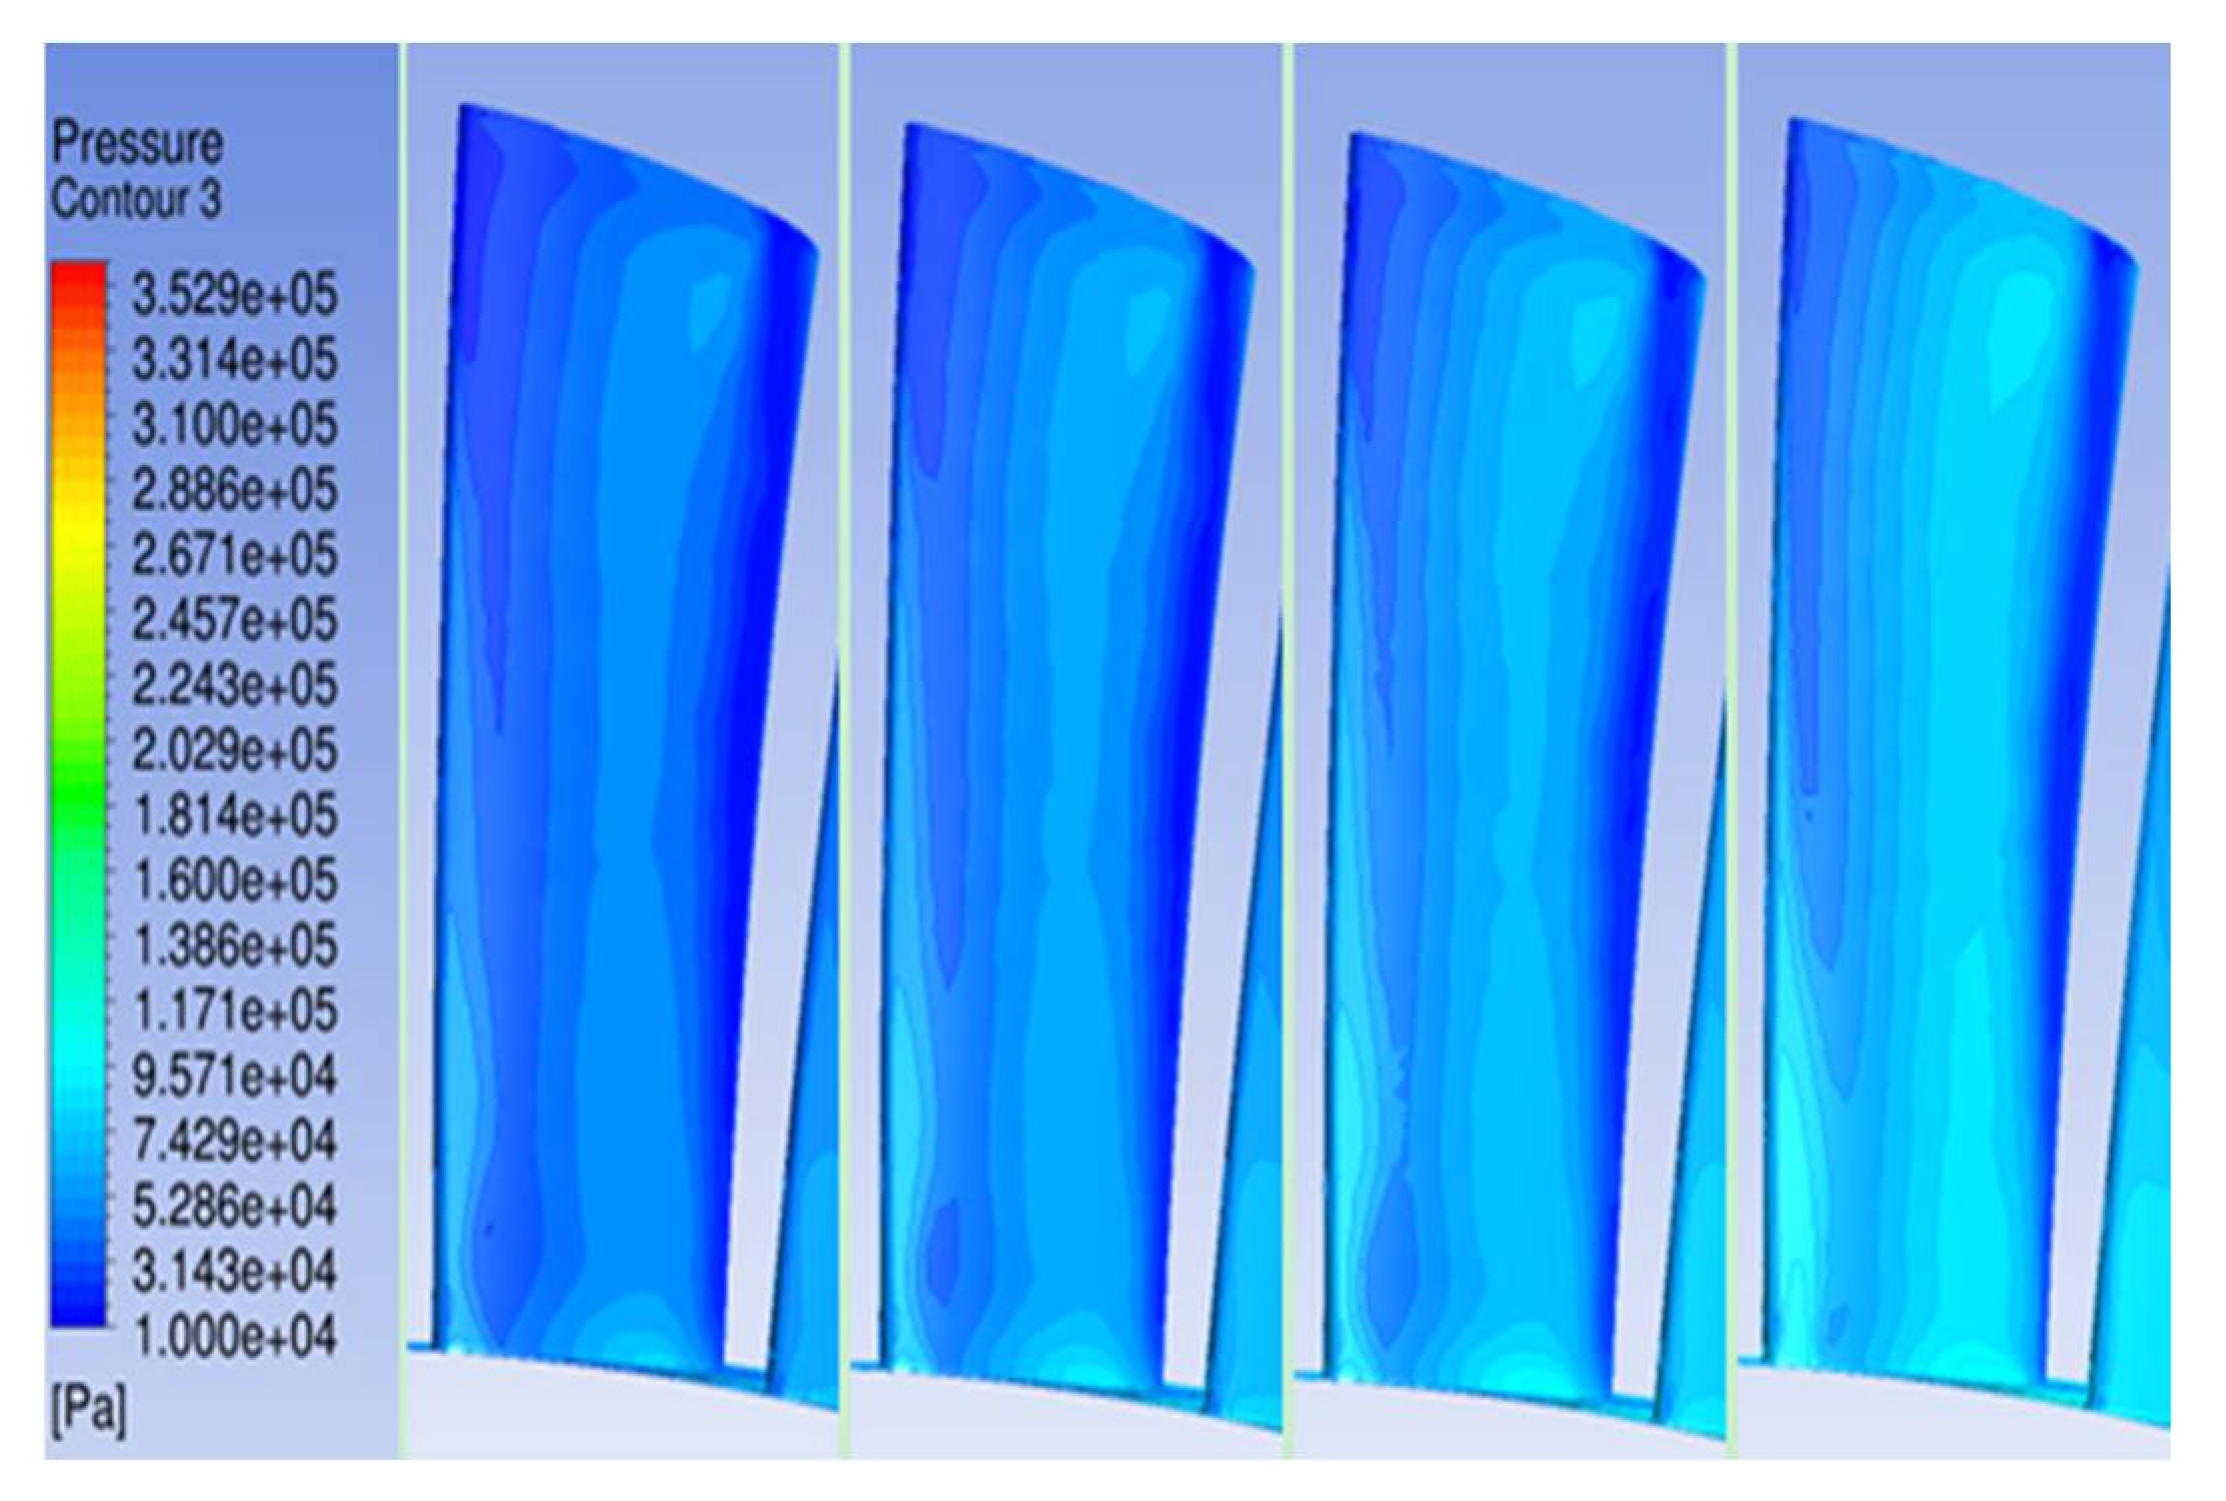
Figure 9 and Figure 10 are the pressure cloud images of the working and non-working faces. The numerical simulation results show that the pressure of the working face decreases gradually along the flow direction of the high-temperature fume. Meanwhile, with the increase of radius, the pressure of the working face increases, and the highest pressure appears near the sharp corner with a large radius in front of the working face. Given the large pressure gradient in the radial direction of the rotor blade, the secondary flow readily forms. The existence of the secondary flow will affect the trajectory of the catalyst, making the catalyst particles move toward the blade root and increasing the erosion wear near that root. The pressure at the non-working front edge of the rotor blade is low and gradually increases along the direction of the fume flow. The pressure reaches the high value of the non-working front pressure in the middle of the blade and gradually decreases after passing through the middle of the blade.
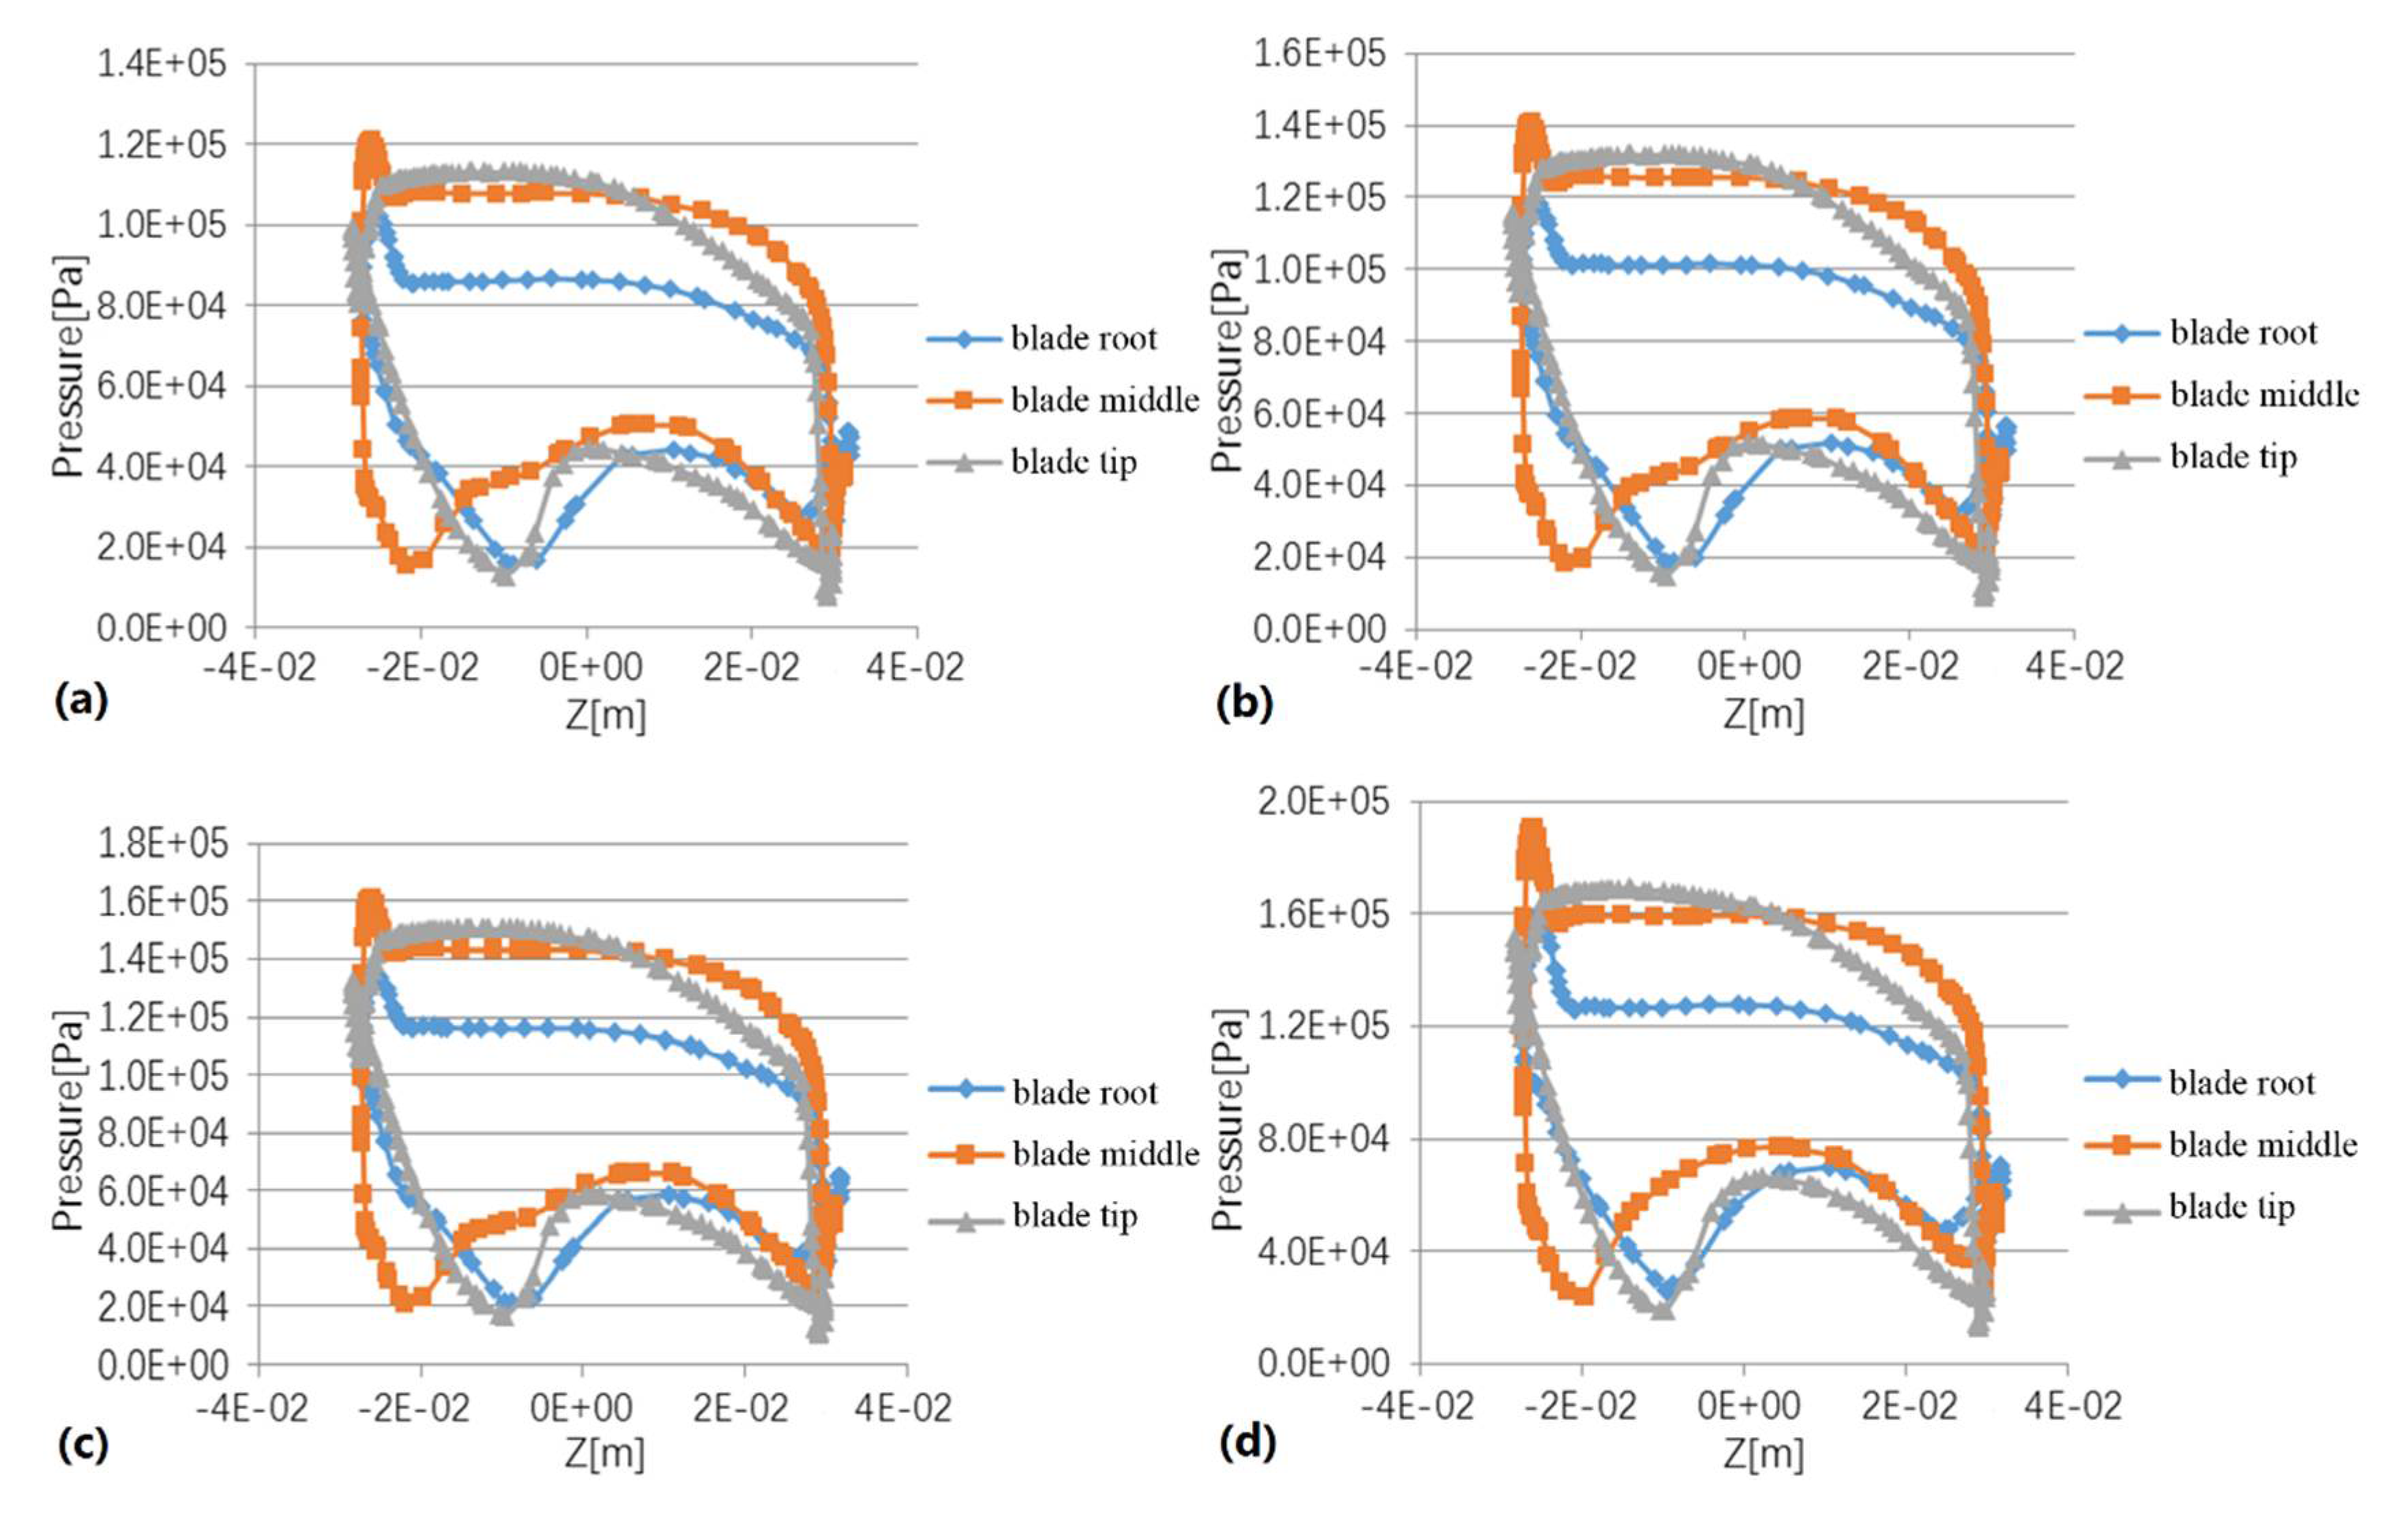
Figure 11 shows the working conditions Q_1 to Q_4 and the pressure distribution curve of the blade root, pitch diameter, and tip along the blade profile. The numerical simulation results show that with the increase of the high-temperature fume flow rate, the blade surface pressure increases, but the pressure change trend is essentially the same. The pressure at the root of the blade working face is relatively low, and the pressure at the pitch diameter and tip of blade is relatively high (Figure 11). Moreover, the pressure value is approximate. The tip pressure at the leading edge of the blade is greater than that at the pitch diameter. By contrast, the tip pressure at the pitch diameter is greater than that at the trailing edge of the blade. The pressure of the working face decreases gradually along the flow direction. However, the overall pressure of the non-working face initially increases and then decreases. The pressure distribution at the leading edge of the blade in the non-working face is relatively high, and the pressure distribution at the root and tip is similar. The pressure difference at the trailing edge of the blade is relatively small. Similar to the situation of the working face, the pressure at the pitch diameter is greater than that at the blade root and tip.
3.3. Influence of the Fume Flow Rate on the Temperature and Velocity of the Flow Field in Gas Turbine
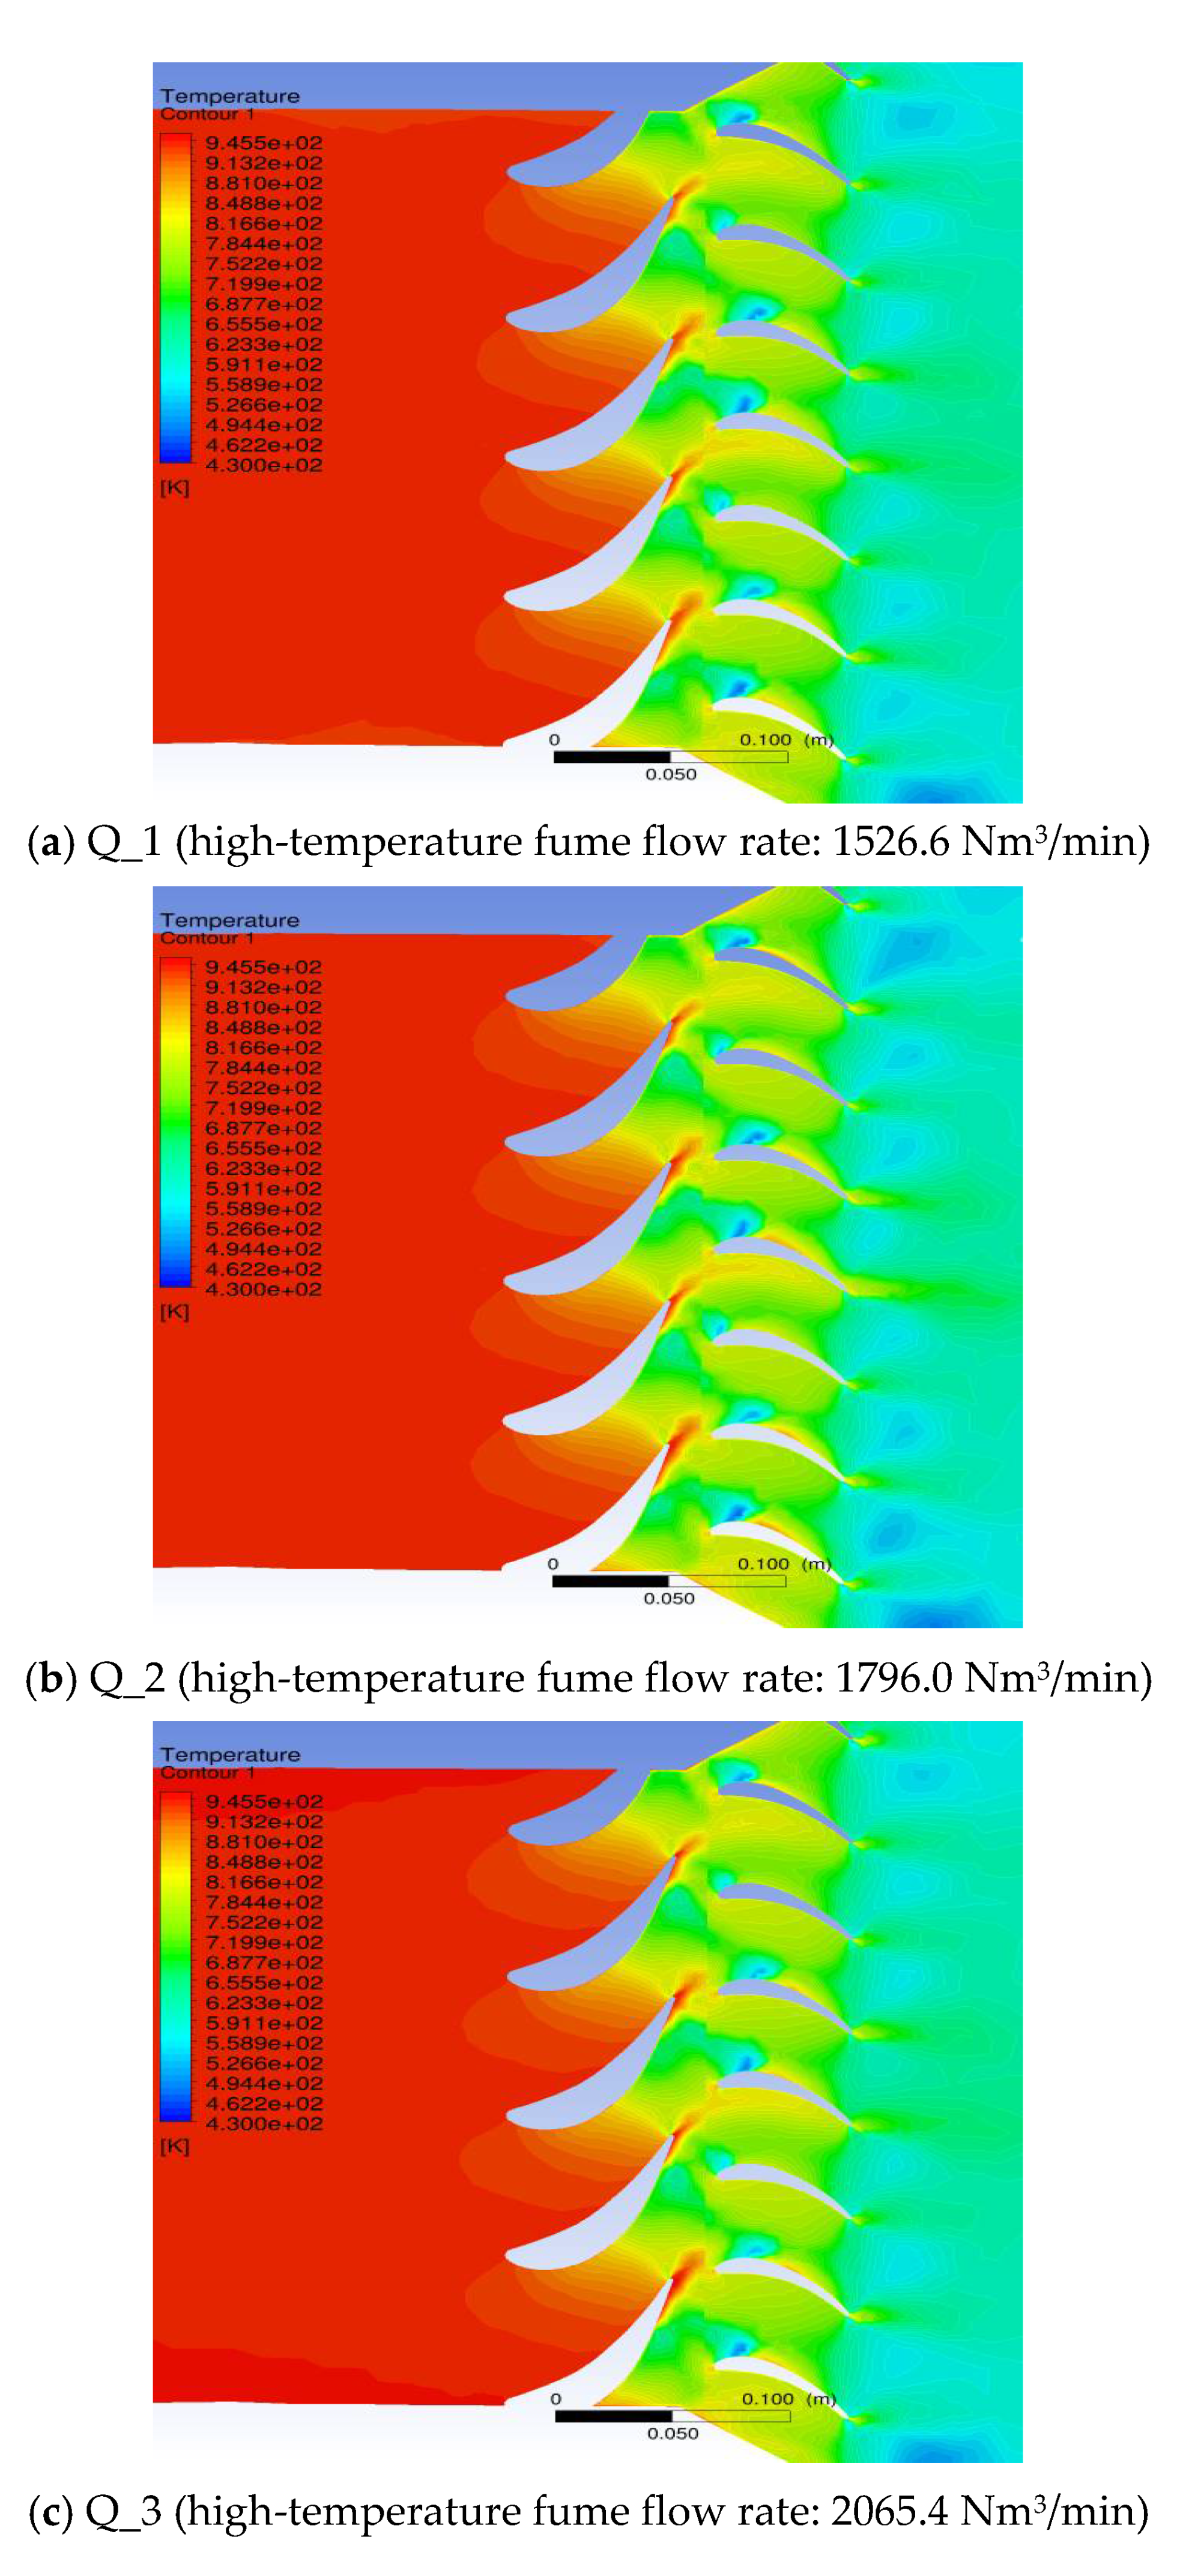
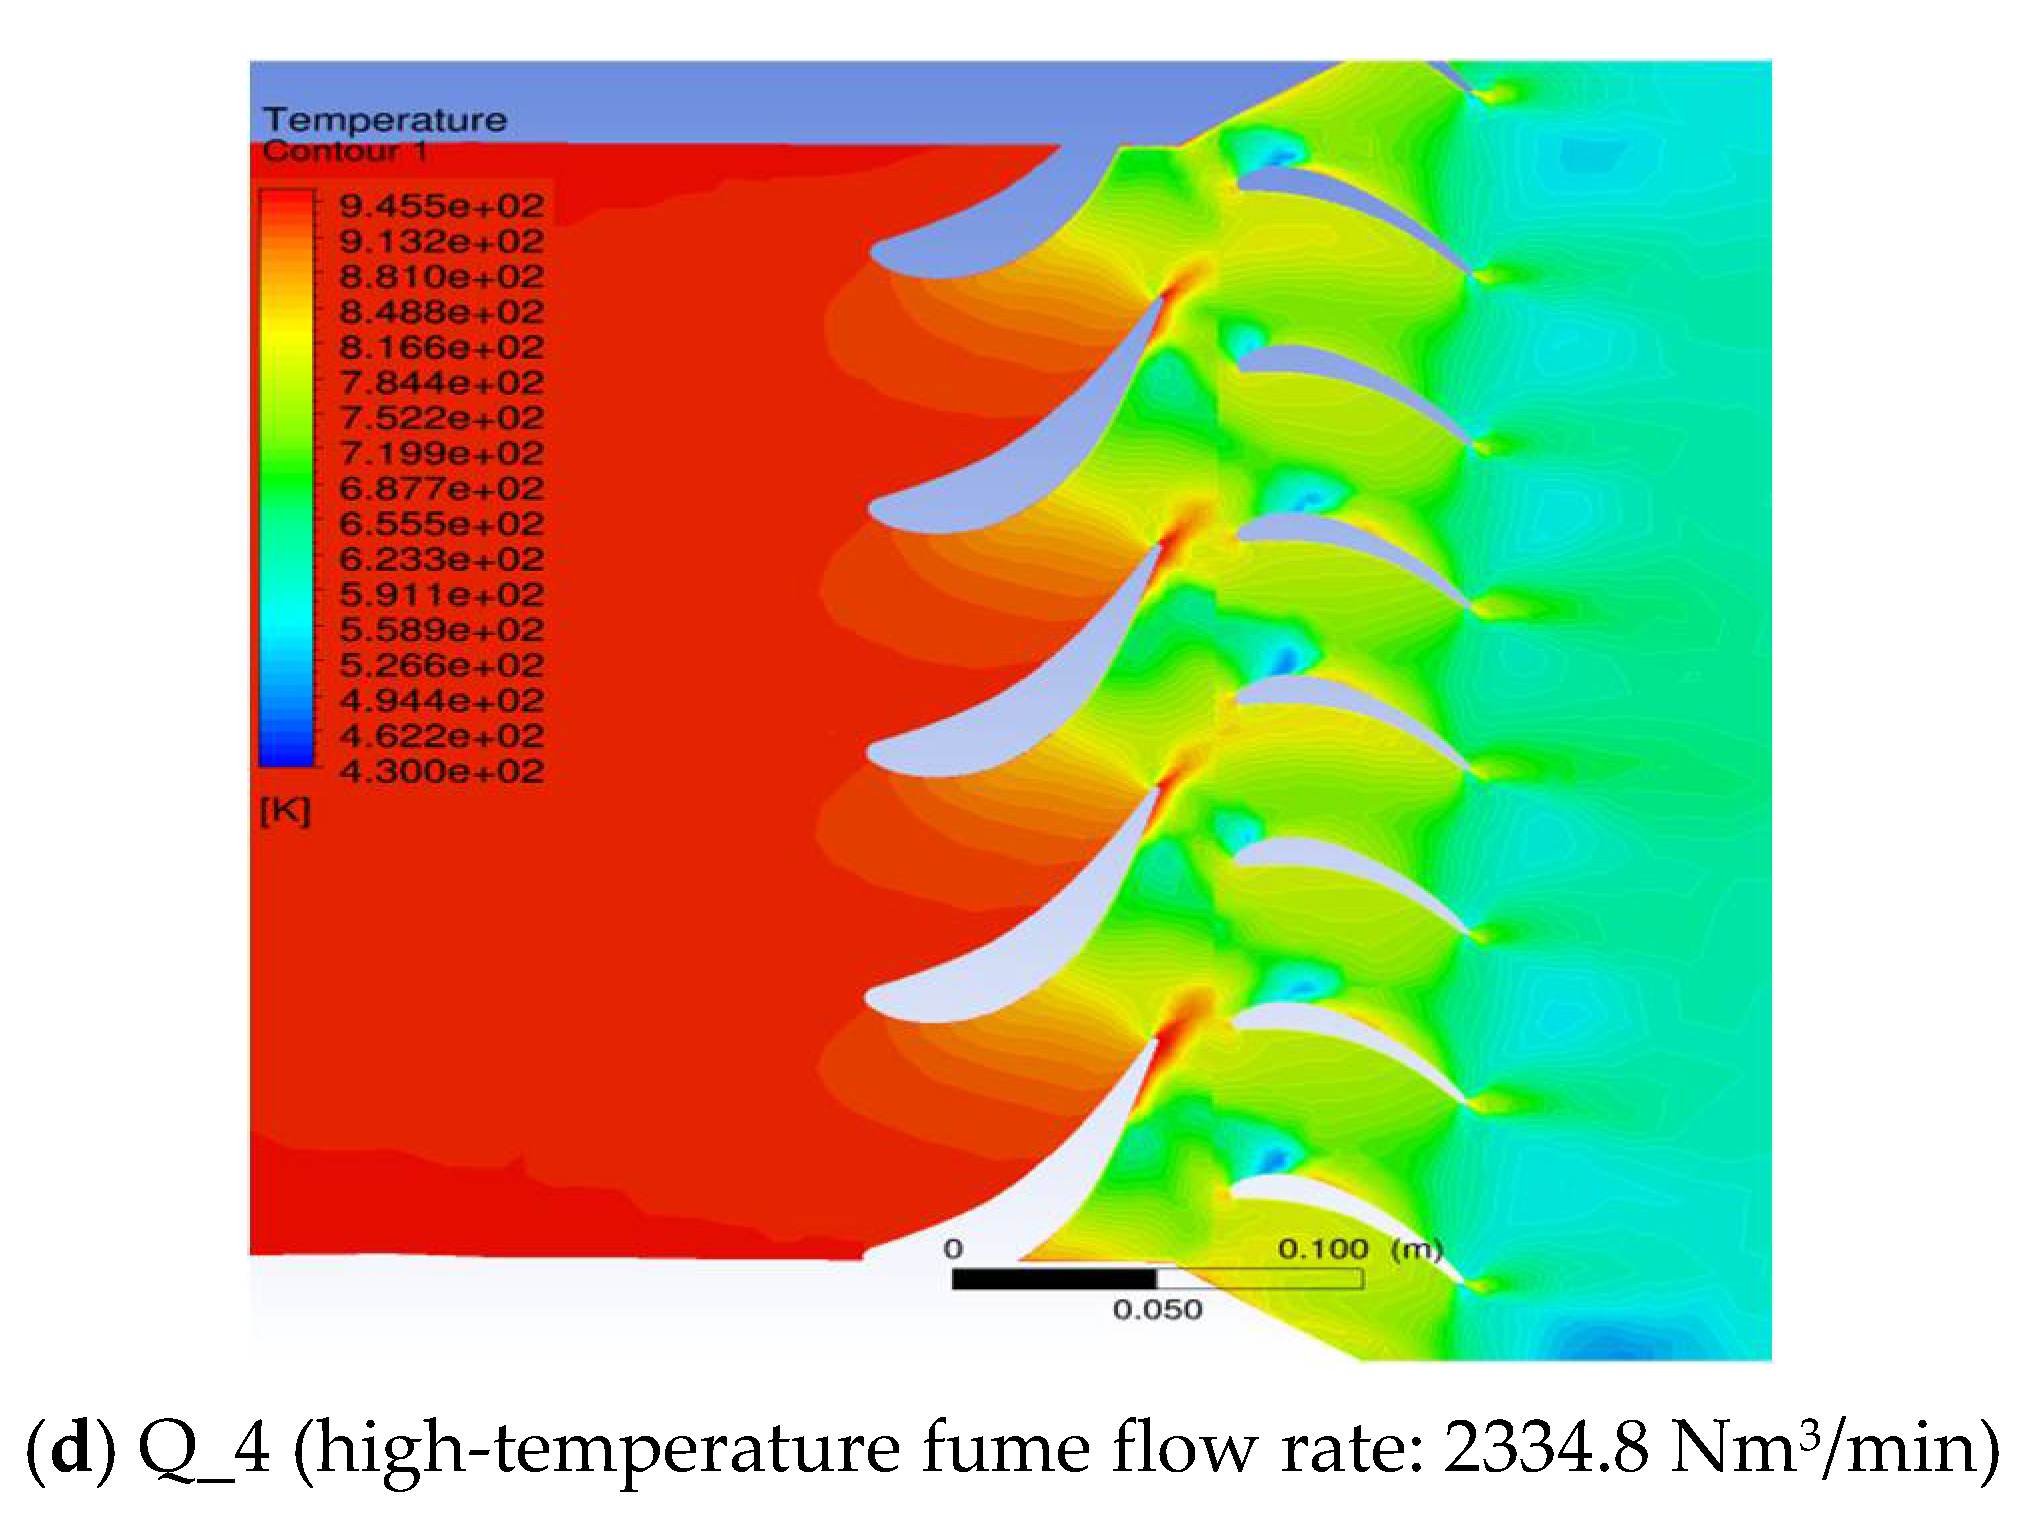
Figure 12 shows that the temperature and temperature gradient change trend of the flow field in the calculation domain are consistent under different flow rates. The change of the flow rate has little effect on the change of the temperature field. The temperature distribution cloud image indicates that the high-temperature fume enters from the inlet section, passes through the stator blade, and expands in the stator blade to convert its own thermal energy into kinetic energy. After flowing out of the stator blade, the high-temperature fume impacts the rotor blade at a higher speed and convert its own kinetic energy into the kinetic energy of the impeller. The temperature further drops after the said fume flows out of the rotor blade. A large temperature gradient of the high-temperature fume occurs at the interface between the stator and rotor blade. After entering the rotor blade passage, the temperature of the working face at the leading edge of the blade increases, and the temperature of non-working face at the leading edge of the blade obviously decreases. Therefore, a larger fume velocity is inevitable. The temperature cloud image of the calculation domain reveals that when the temperature of the high-temperature fume at the inlet exceeds 900 K, the high temperature in the blade will promote the formation of low melting point eutectic products which, in turn, are the main components of blade scaling.
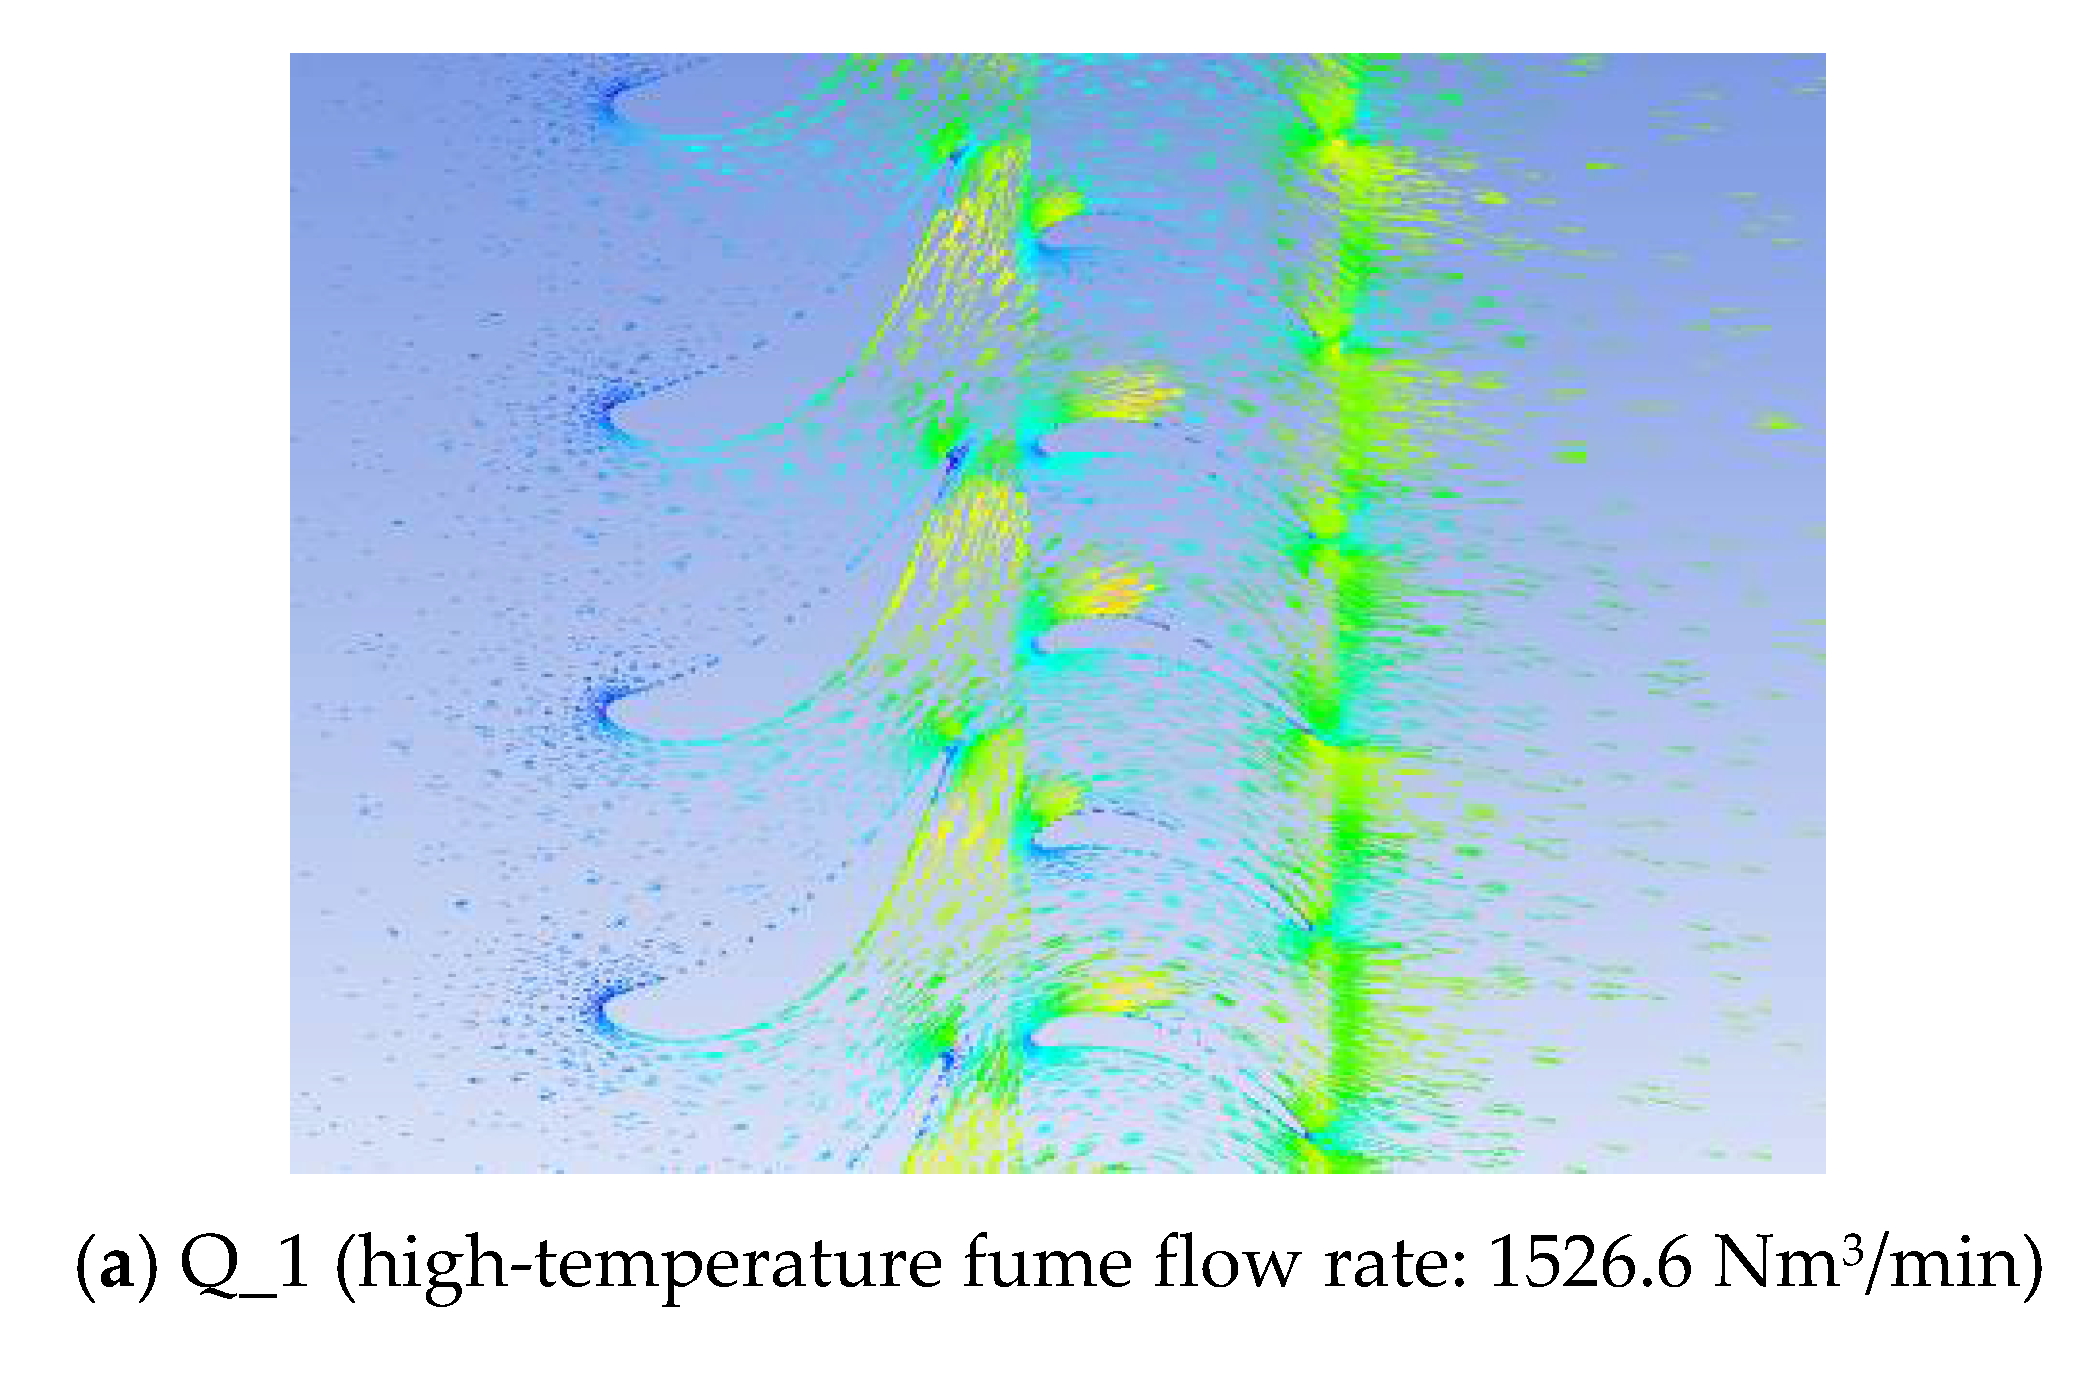
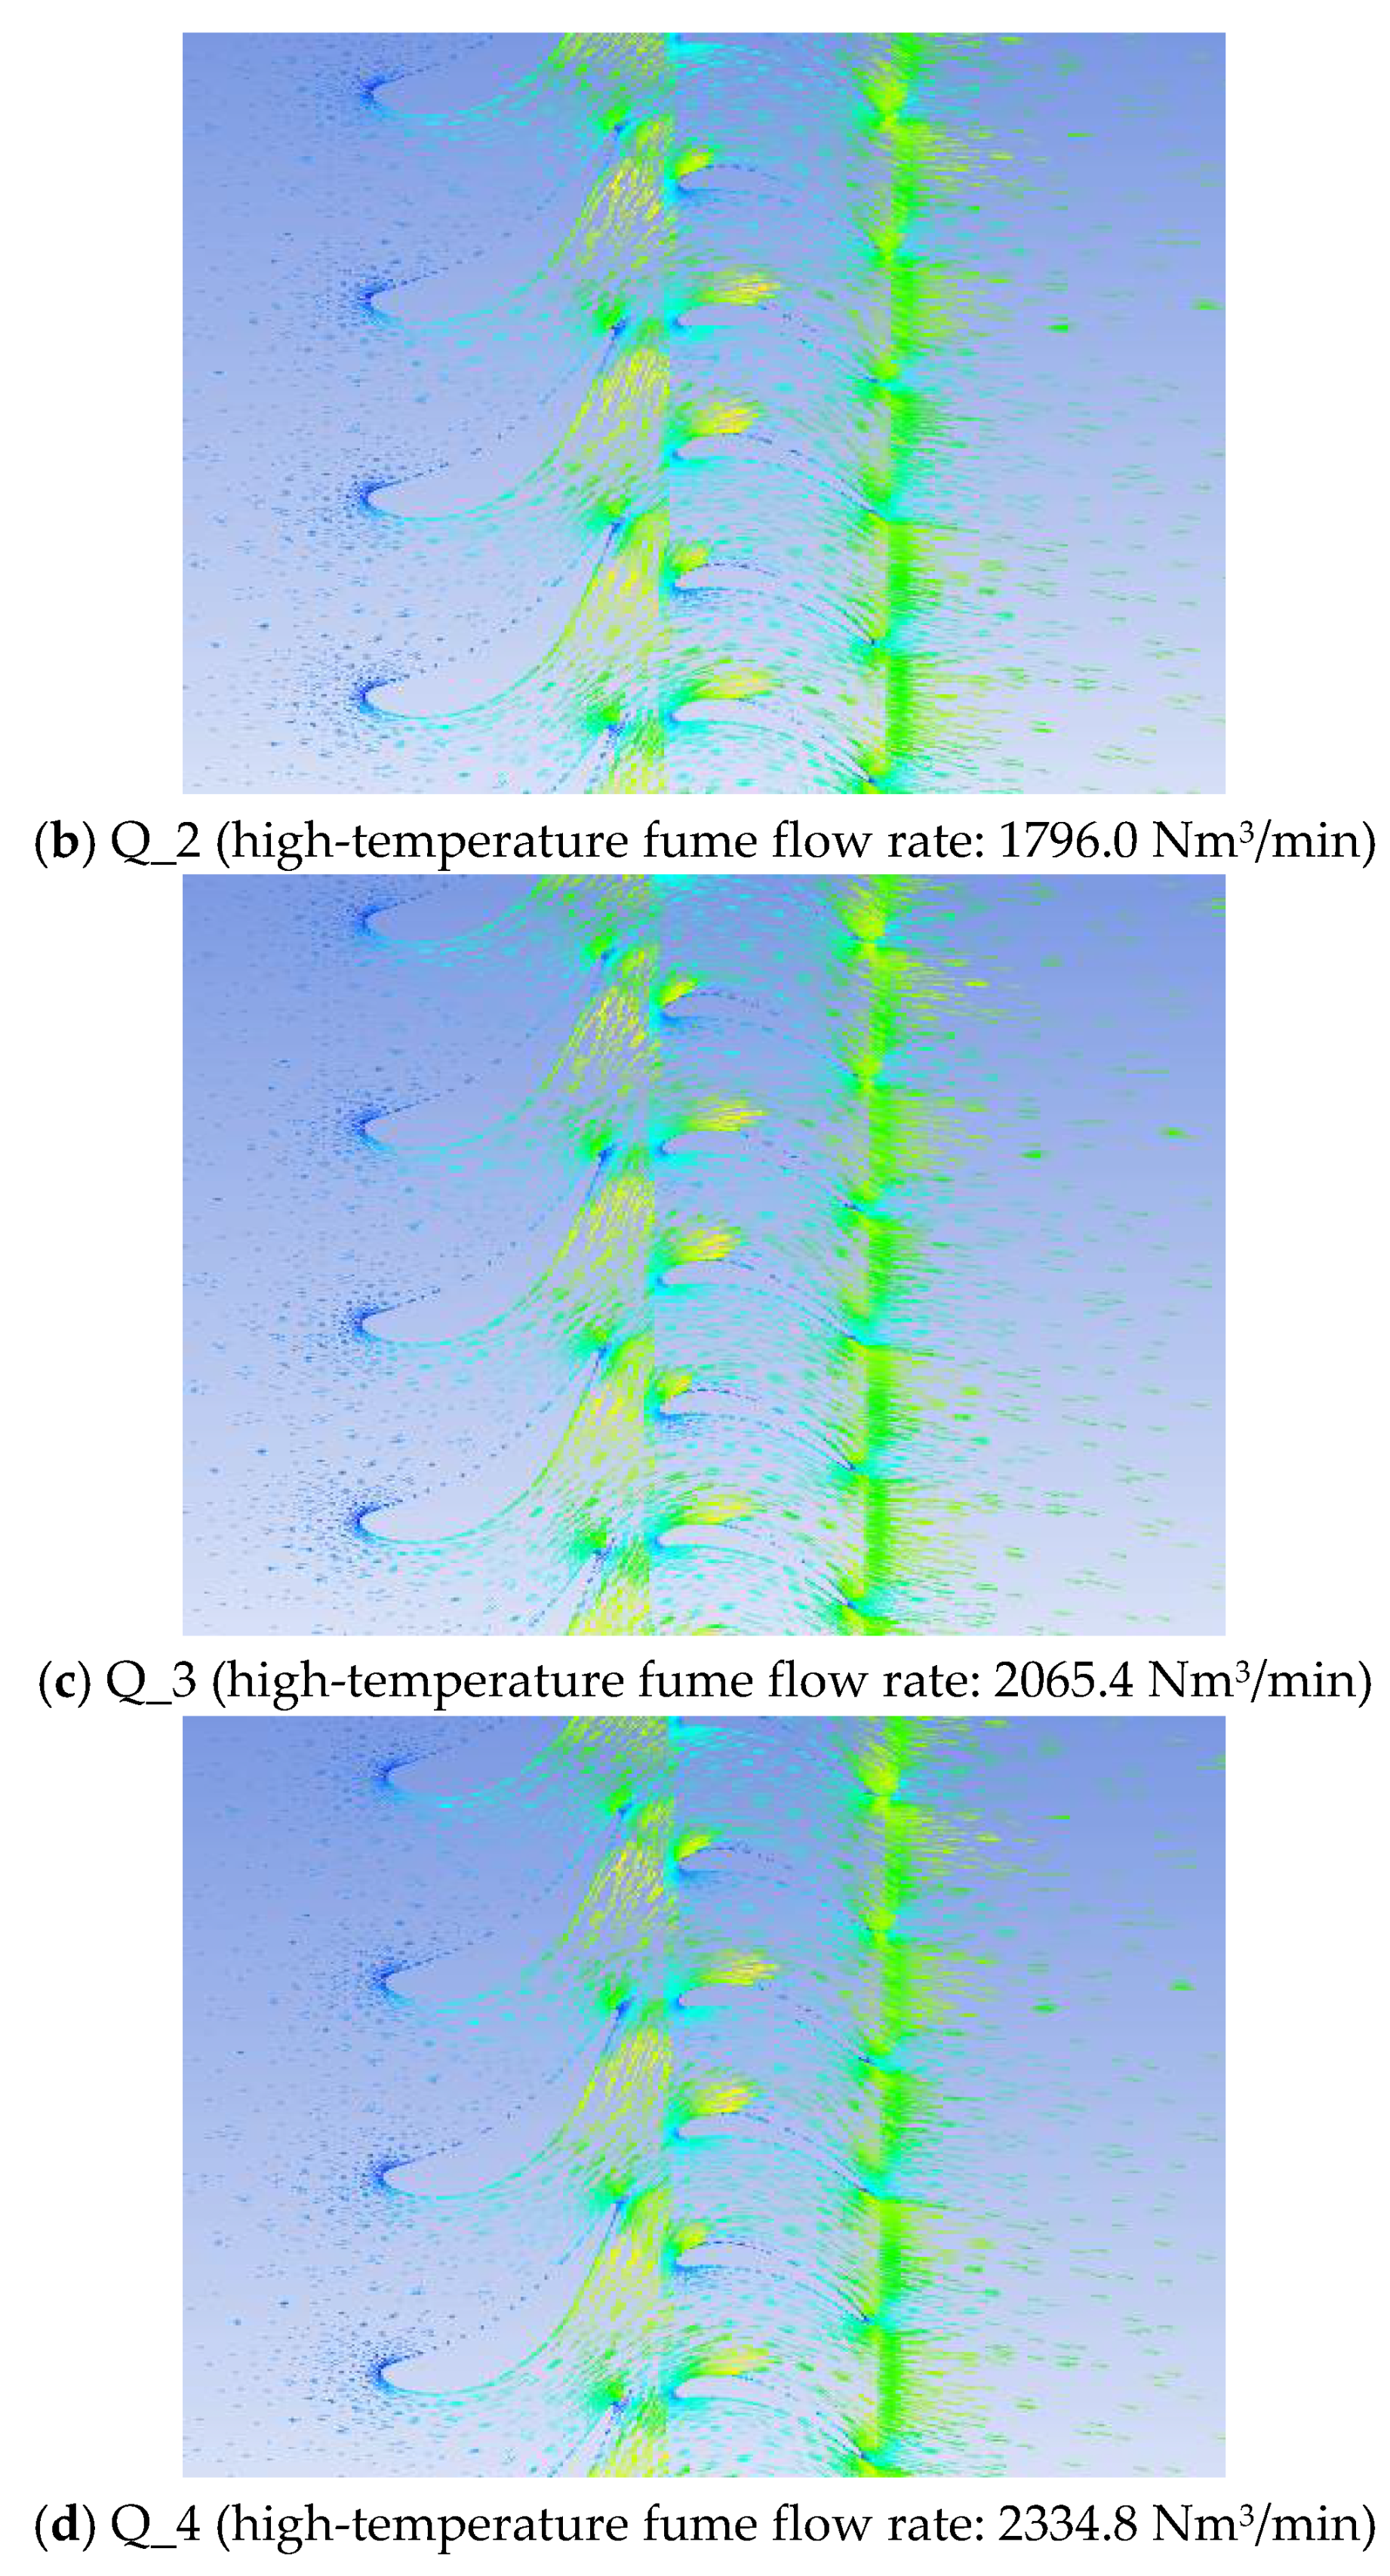
Figure 13 shows the velocity distribution of the flow field at the pitch diameter (50% blade height) of the stator and rotor of the gas turbine. The numerical simulation shows a low velocity of the high-temperature fume before it enters the stator blade. After passing through the stator blade, the high-temperature fume expands rapidly (cooling and depressurizing). The fume transforms its own heat energy and pressure energy into kinetic energy. The velocity of the gas flow at the exit of the stator blade can reach 510 m/s. After the fume enters the runner of the rotor blade, the velocity near the inlet of the non-working face of the rotor blade reaches the maximum of approximately 570 m/s while the velocity of the high-temperature fume at the working face of the blade is about 225 m/s. After the high-temperature fume impacts the rotor blade at the highest speed, the speed decreases rapidly and the fume transforms its kinetic energy into the mechanical energy of impeller rotation. The numerical simulation results reveal that the fume has an obvious acceleration process when it flows out of the rotor blade runner because the energy loss in the accelerated gas flow is smaller than that in the non-accelerated gas flow. Therefore, fume design requires a certain acceleration process when it flows out of the rotor blade. In this way, when the fume is accelerated to flow out of the rotor runner, it will produce an accelerating air flow similar to that at the tail nozzle of the jet engine and which will generate thrust and push the rotor to rotate. The accelerated flow of the fume in the tail of the rotor blade can improve not only the flow, but also the work capacity of the fume, thereby improving efficiency.
3.4. Effect of the Fume Flow Rate on the Movement of Catalyst Particles
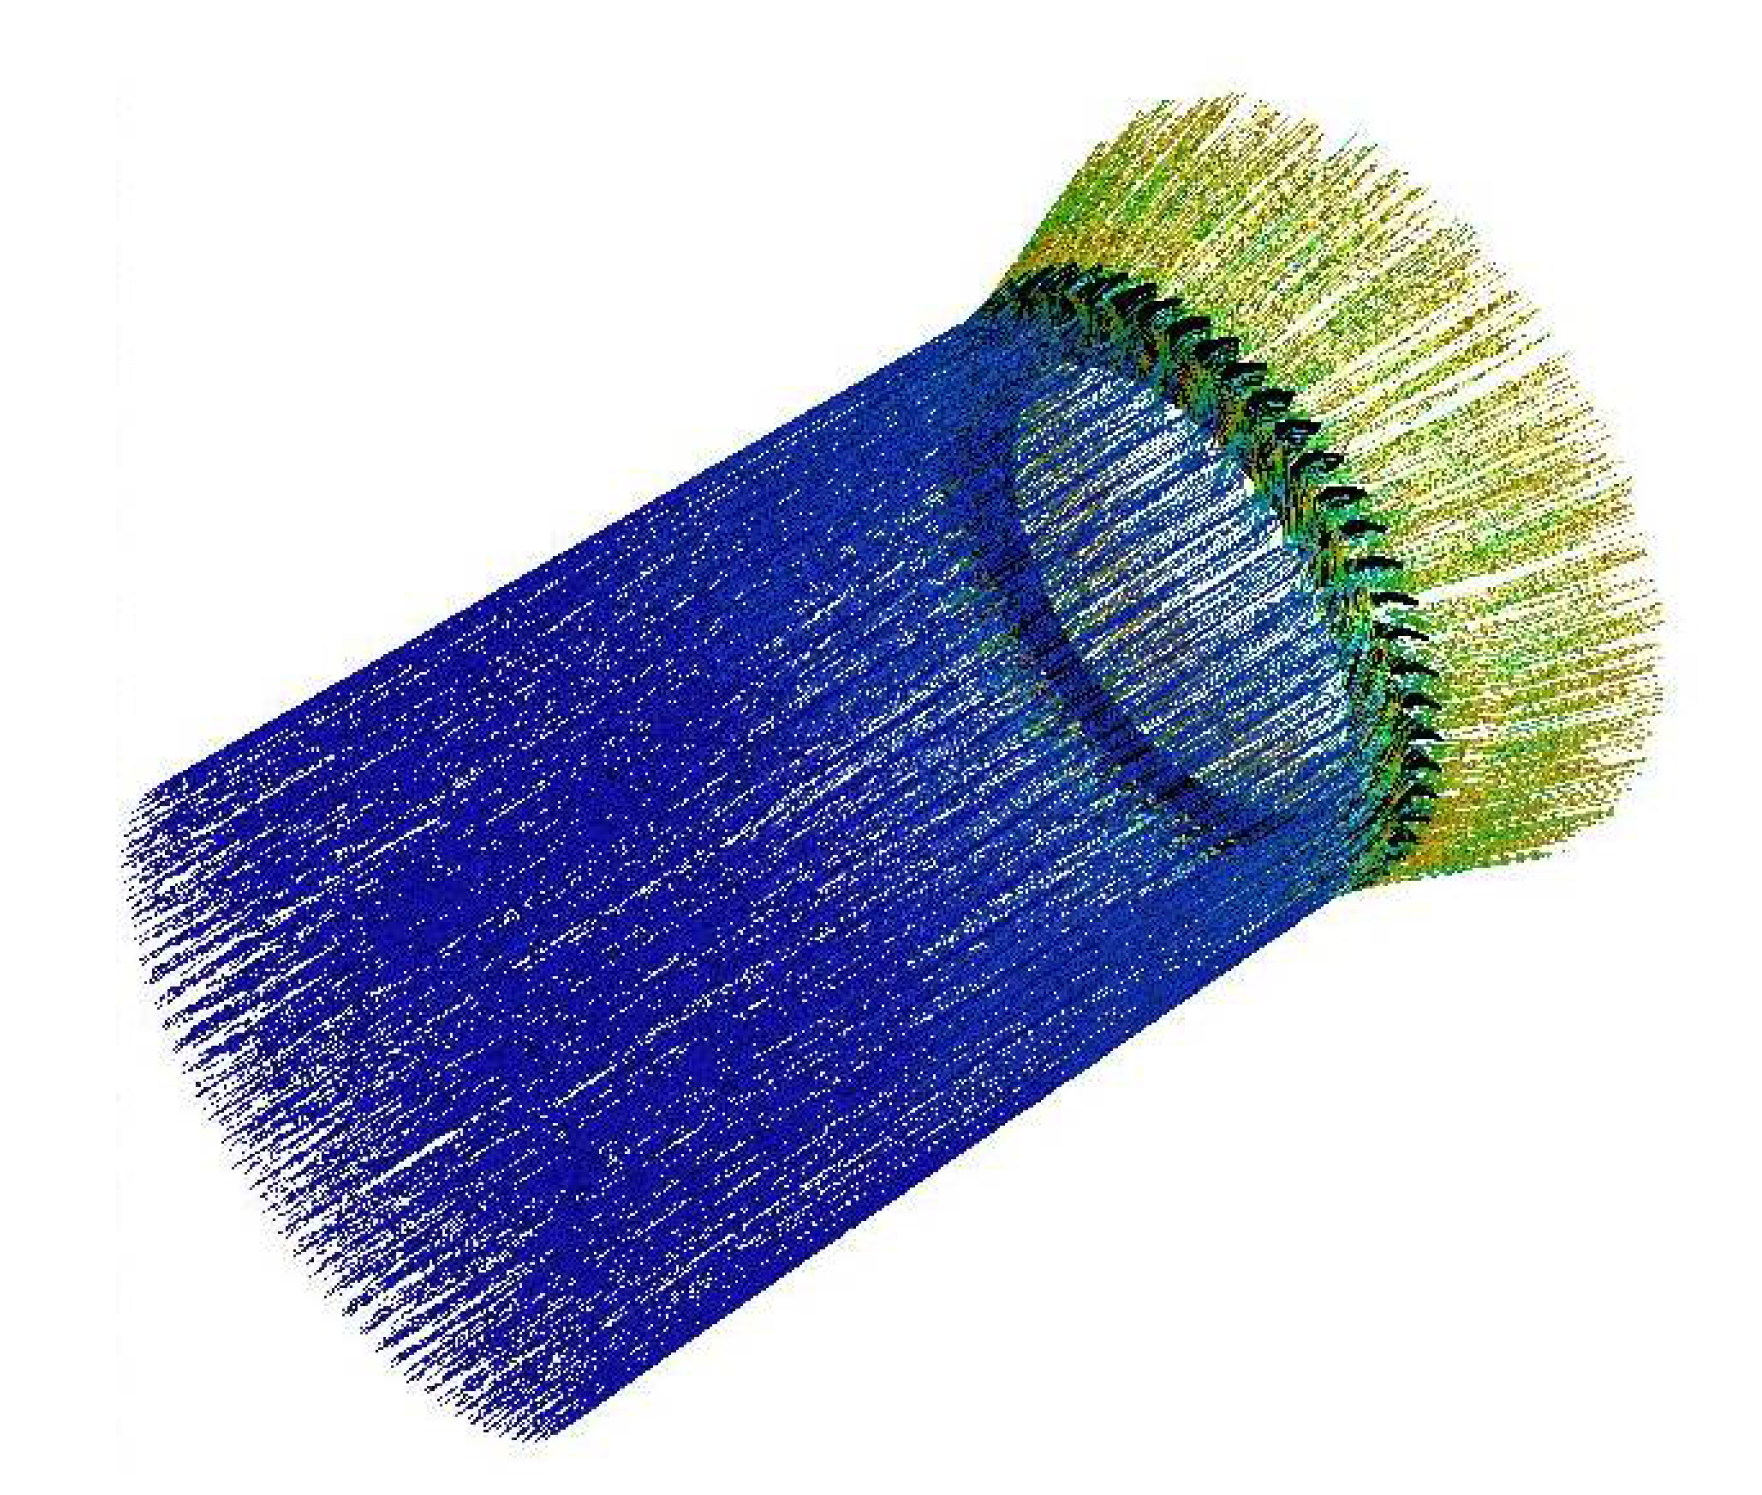
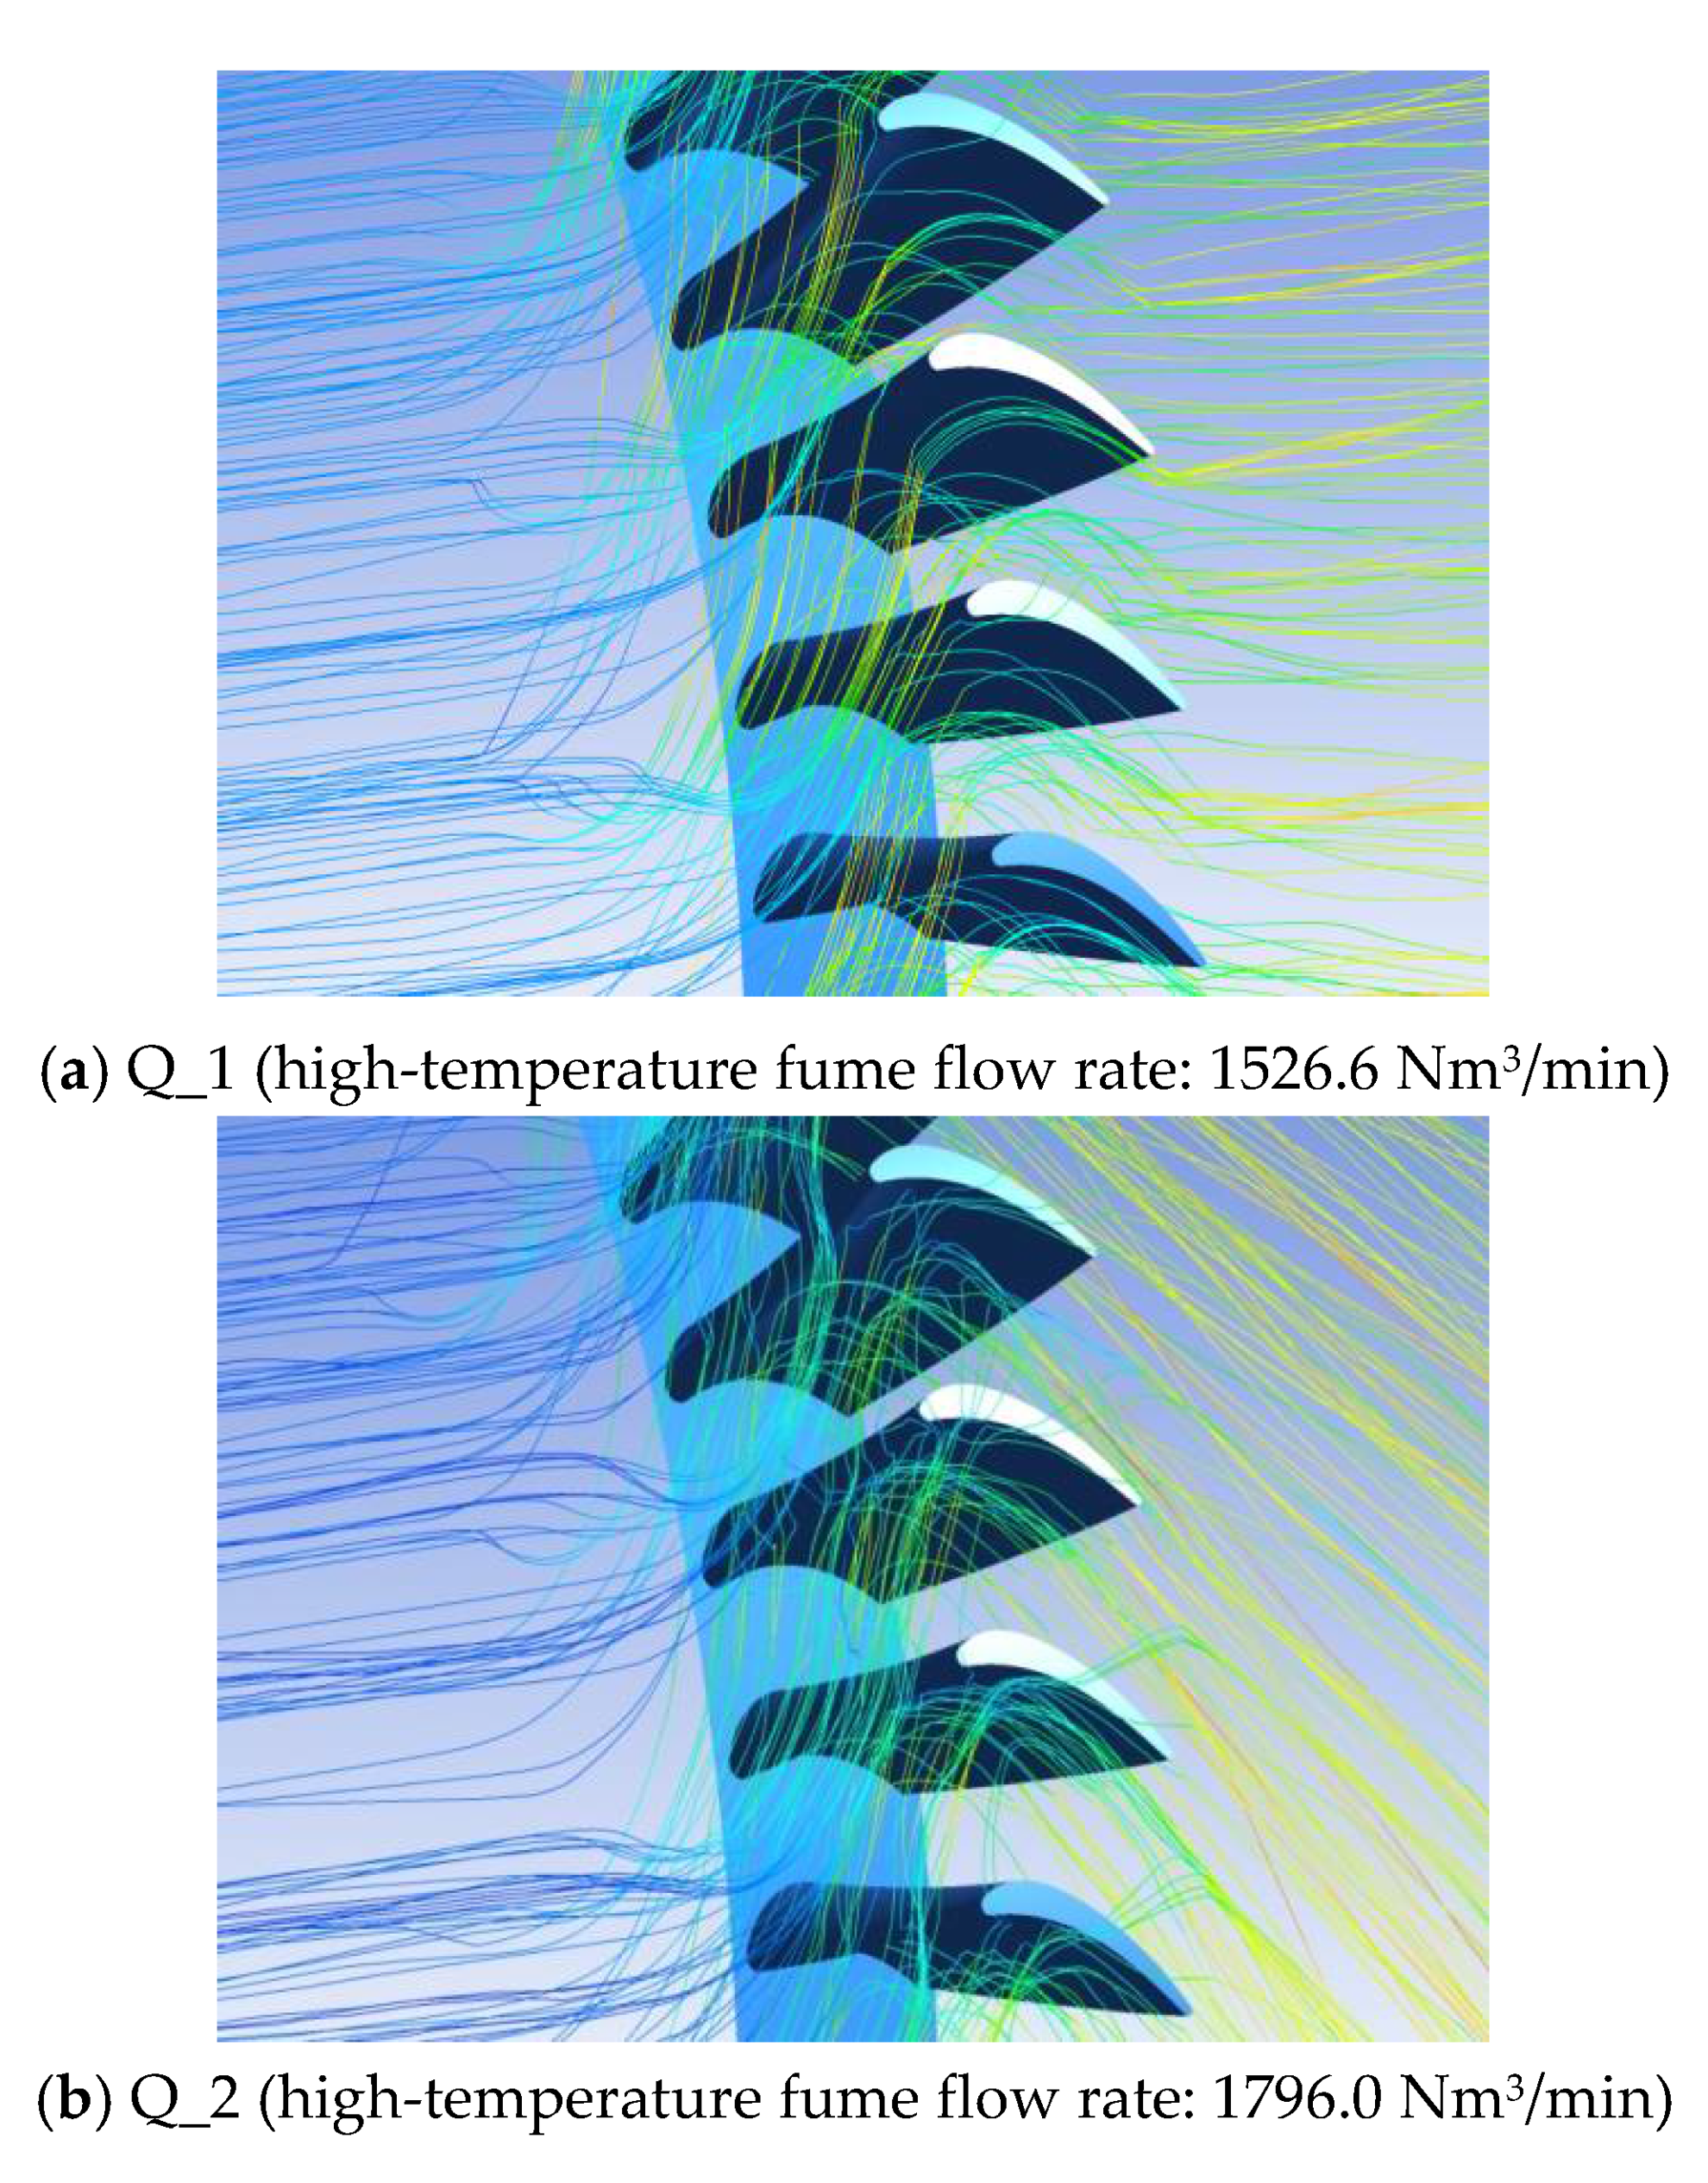
Figure 14 shows the trajectory of the catalyst particles in the entire machine under rated working conditions. The trajectory of catalyst particles under other working conditions is similar to the following figure, so it is not repeated.
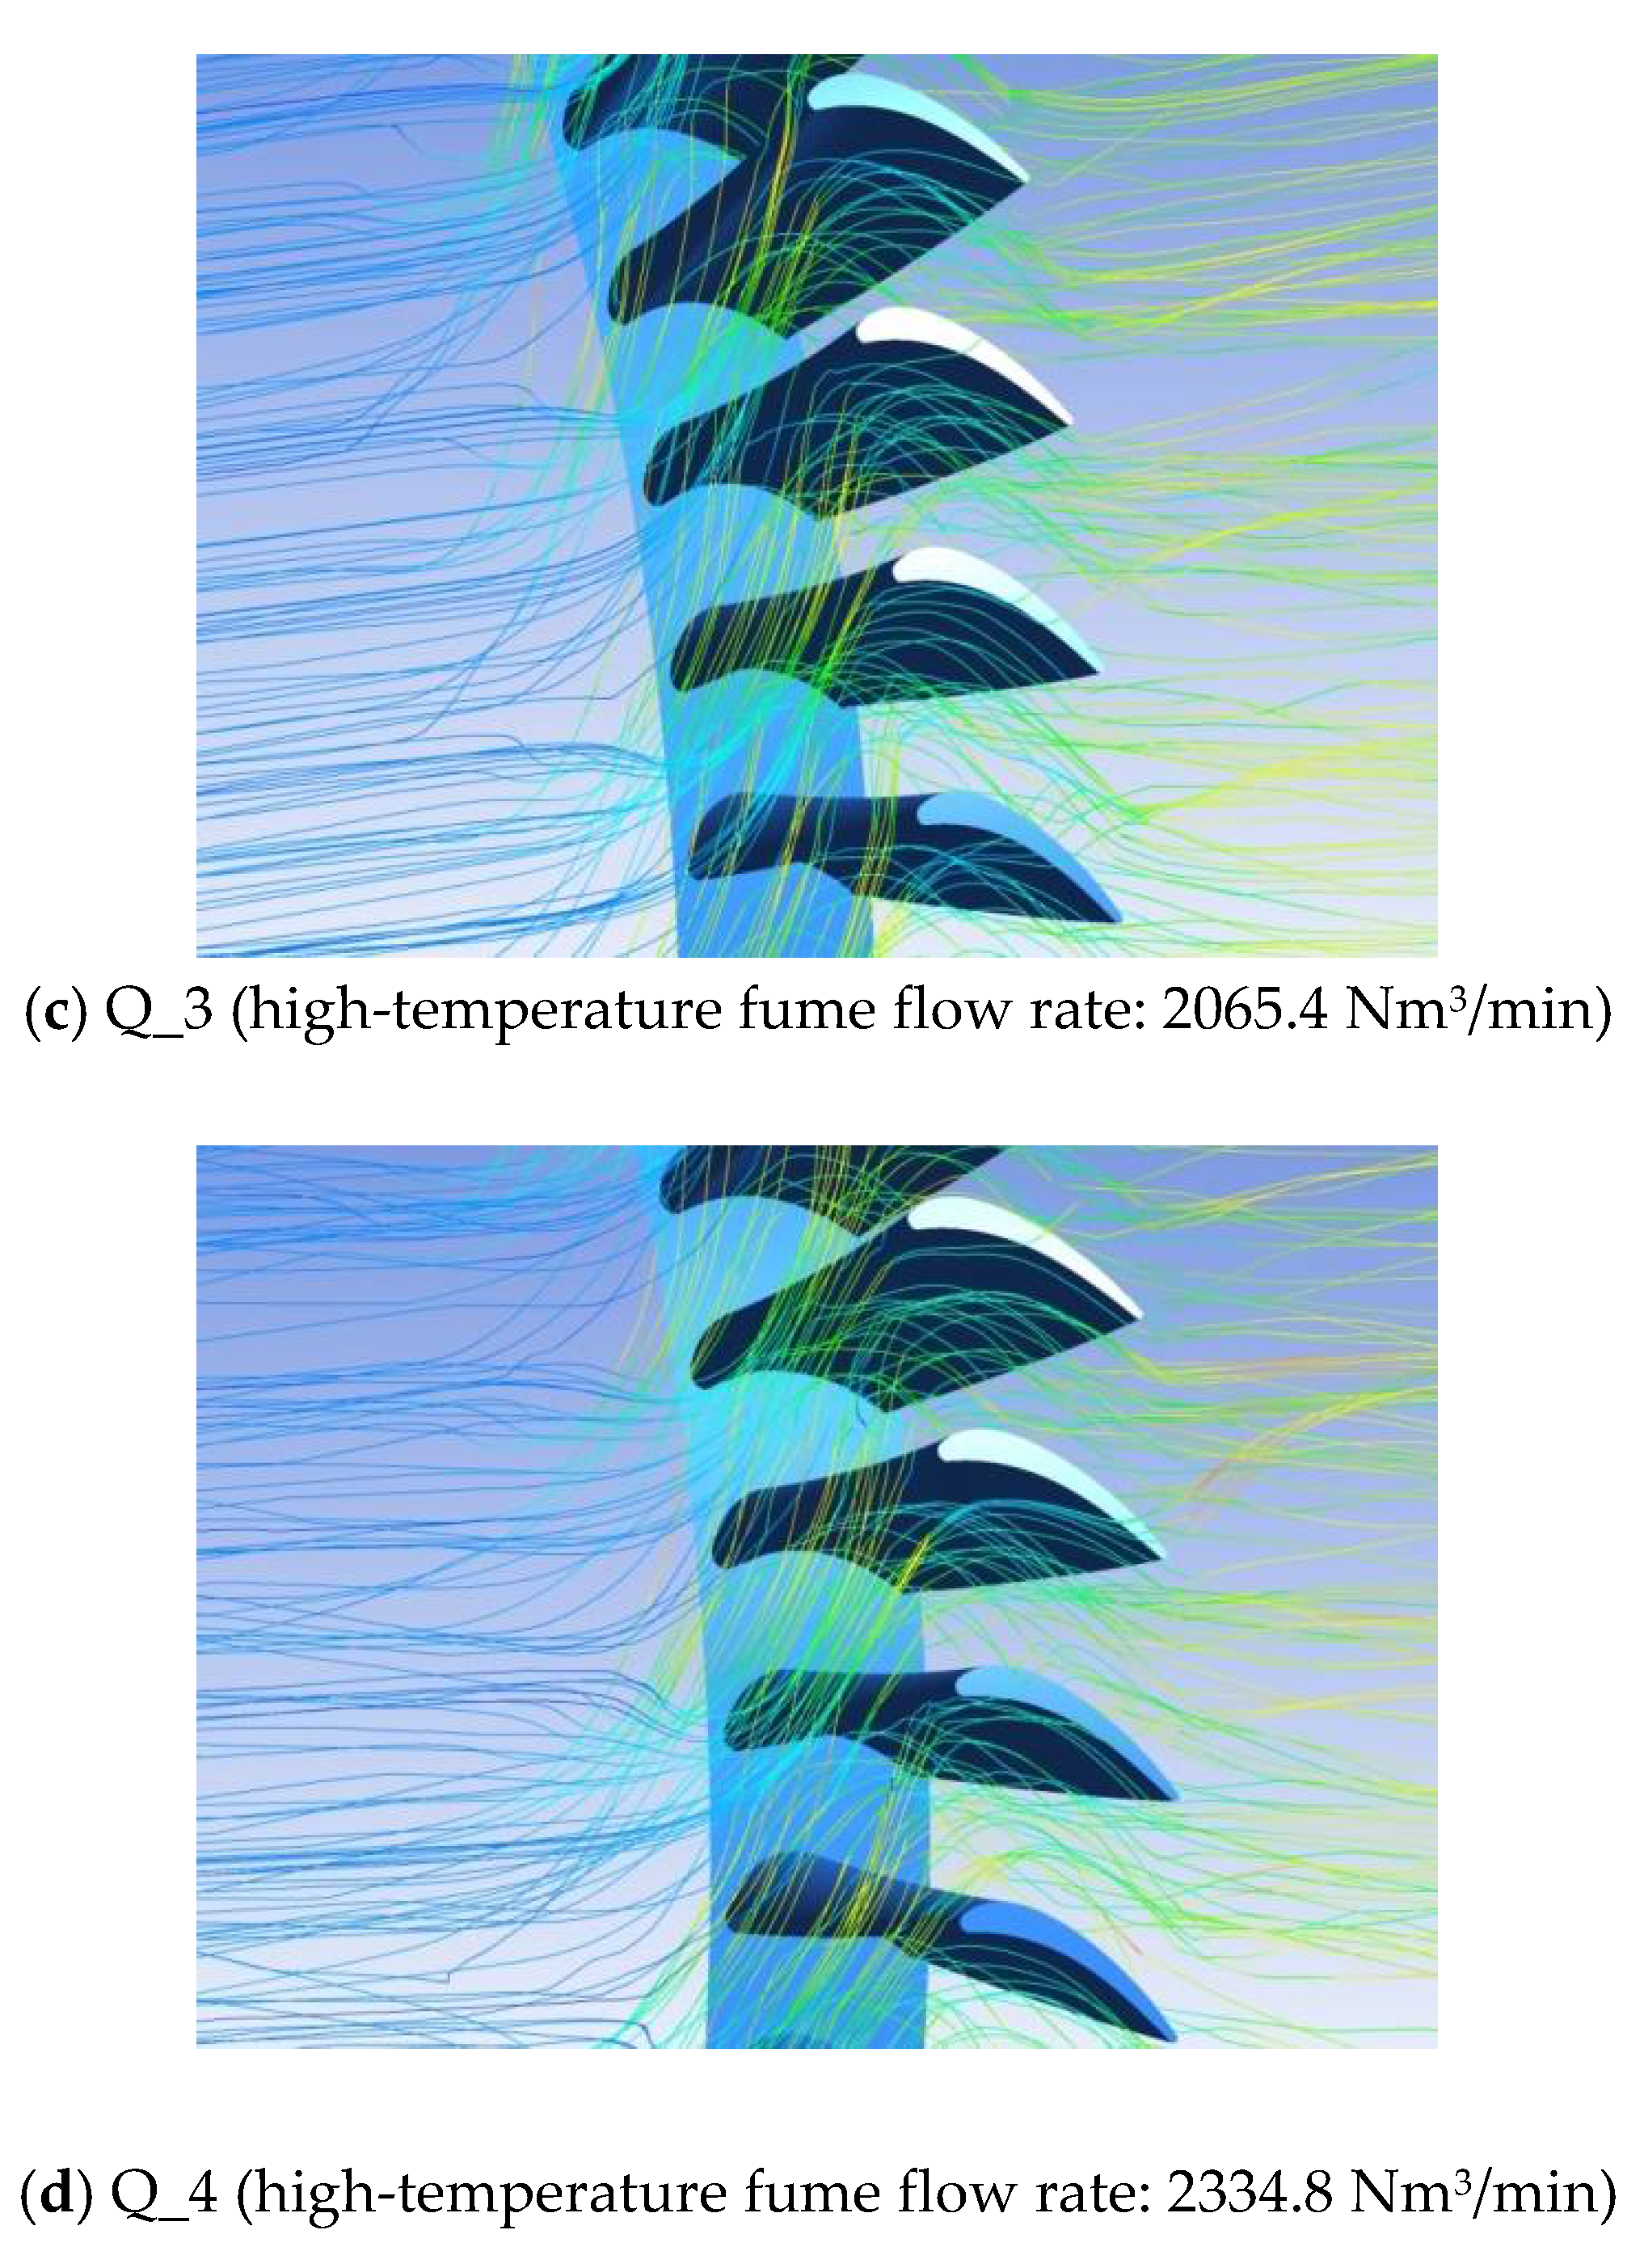
Figure 15 shows a partial enlarged view of the catalyst particle trajectory at the rotor blade under different flow rate conditions. Under the combined action of high-temperature fume turbulence, inertia force, thermophoresis force, and other factors, the catalyst particles impact the rotor blade (Figure 15). The catalyst particles in this study have small particle size, and the effect of high-temperature fume turbulence is much greater than that of inertial force. The catalyst particles flow through the stator blade with the high-temperature fume. Under the action of the stator blade, a higher velocity is obtained with the fume, and the rotor blade is impacted with high velocity. After entering the rotor blade runner, some of the catalyst particles collide with the rotor blade at a reduced speed. After collision and reflection, they will follow the high-temperature fume to accelerate and leave the rotor blade. The numerical simulation shows that the distribution of the erosion position of the catalyst particles on the rotor blade varies under different flow rates. However, the erosion mostly occurs near the leading and trailing edges of the blade and tends to occur at the large radius along the radial direction.
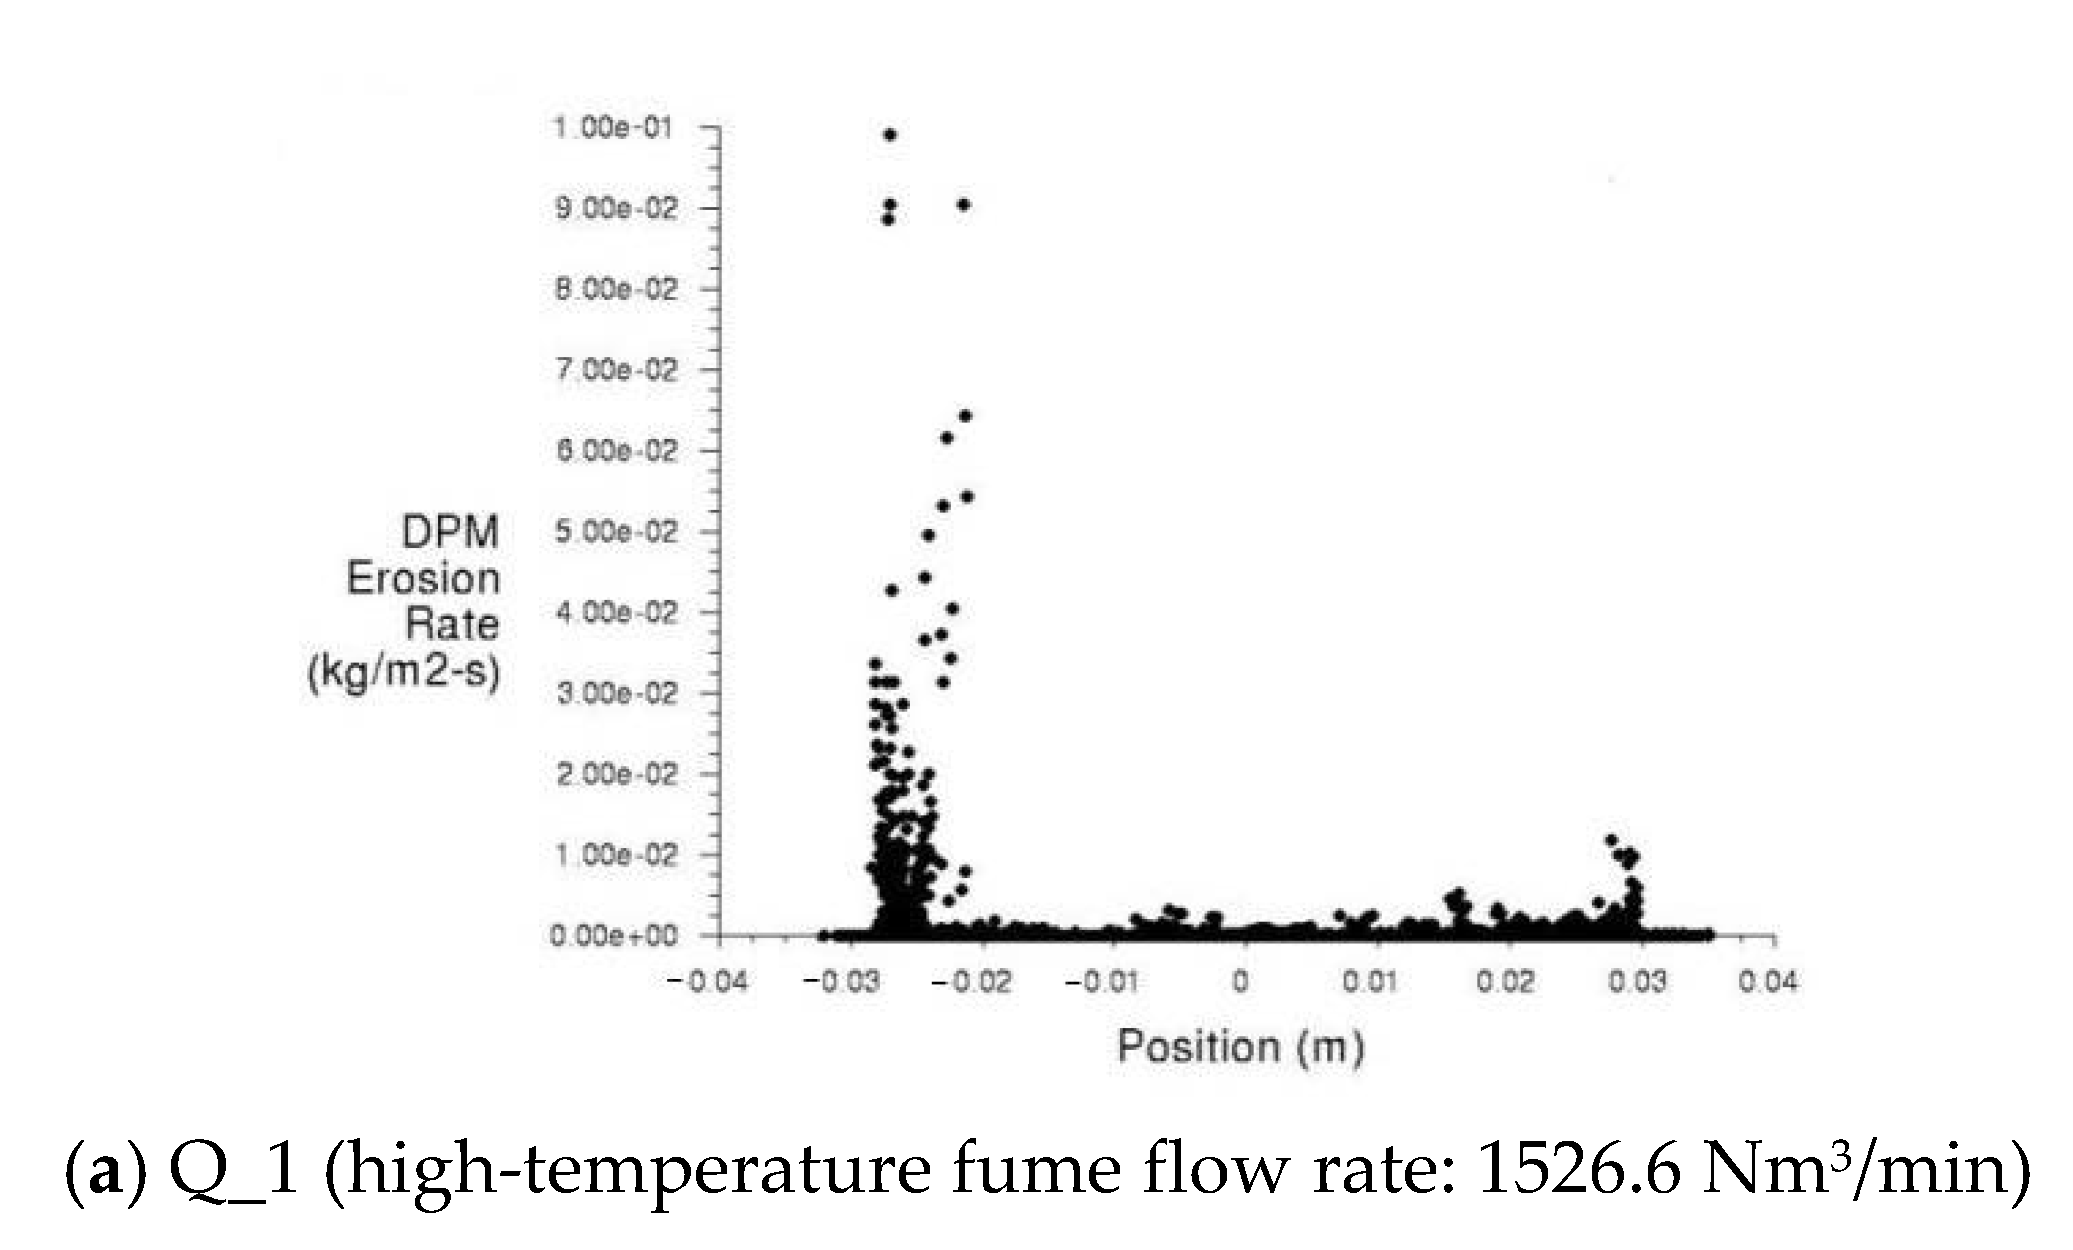
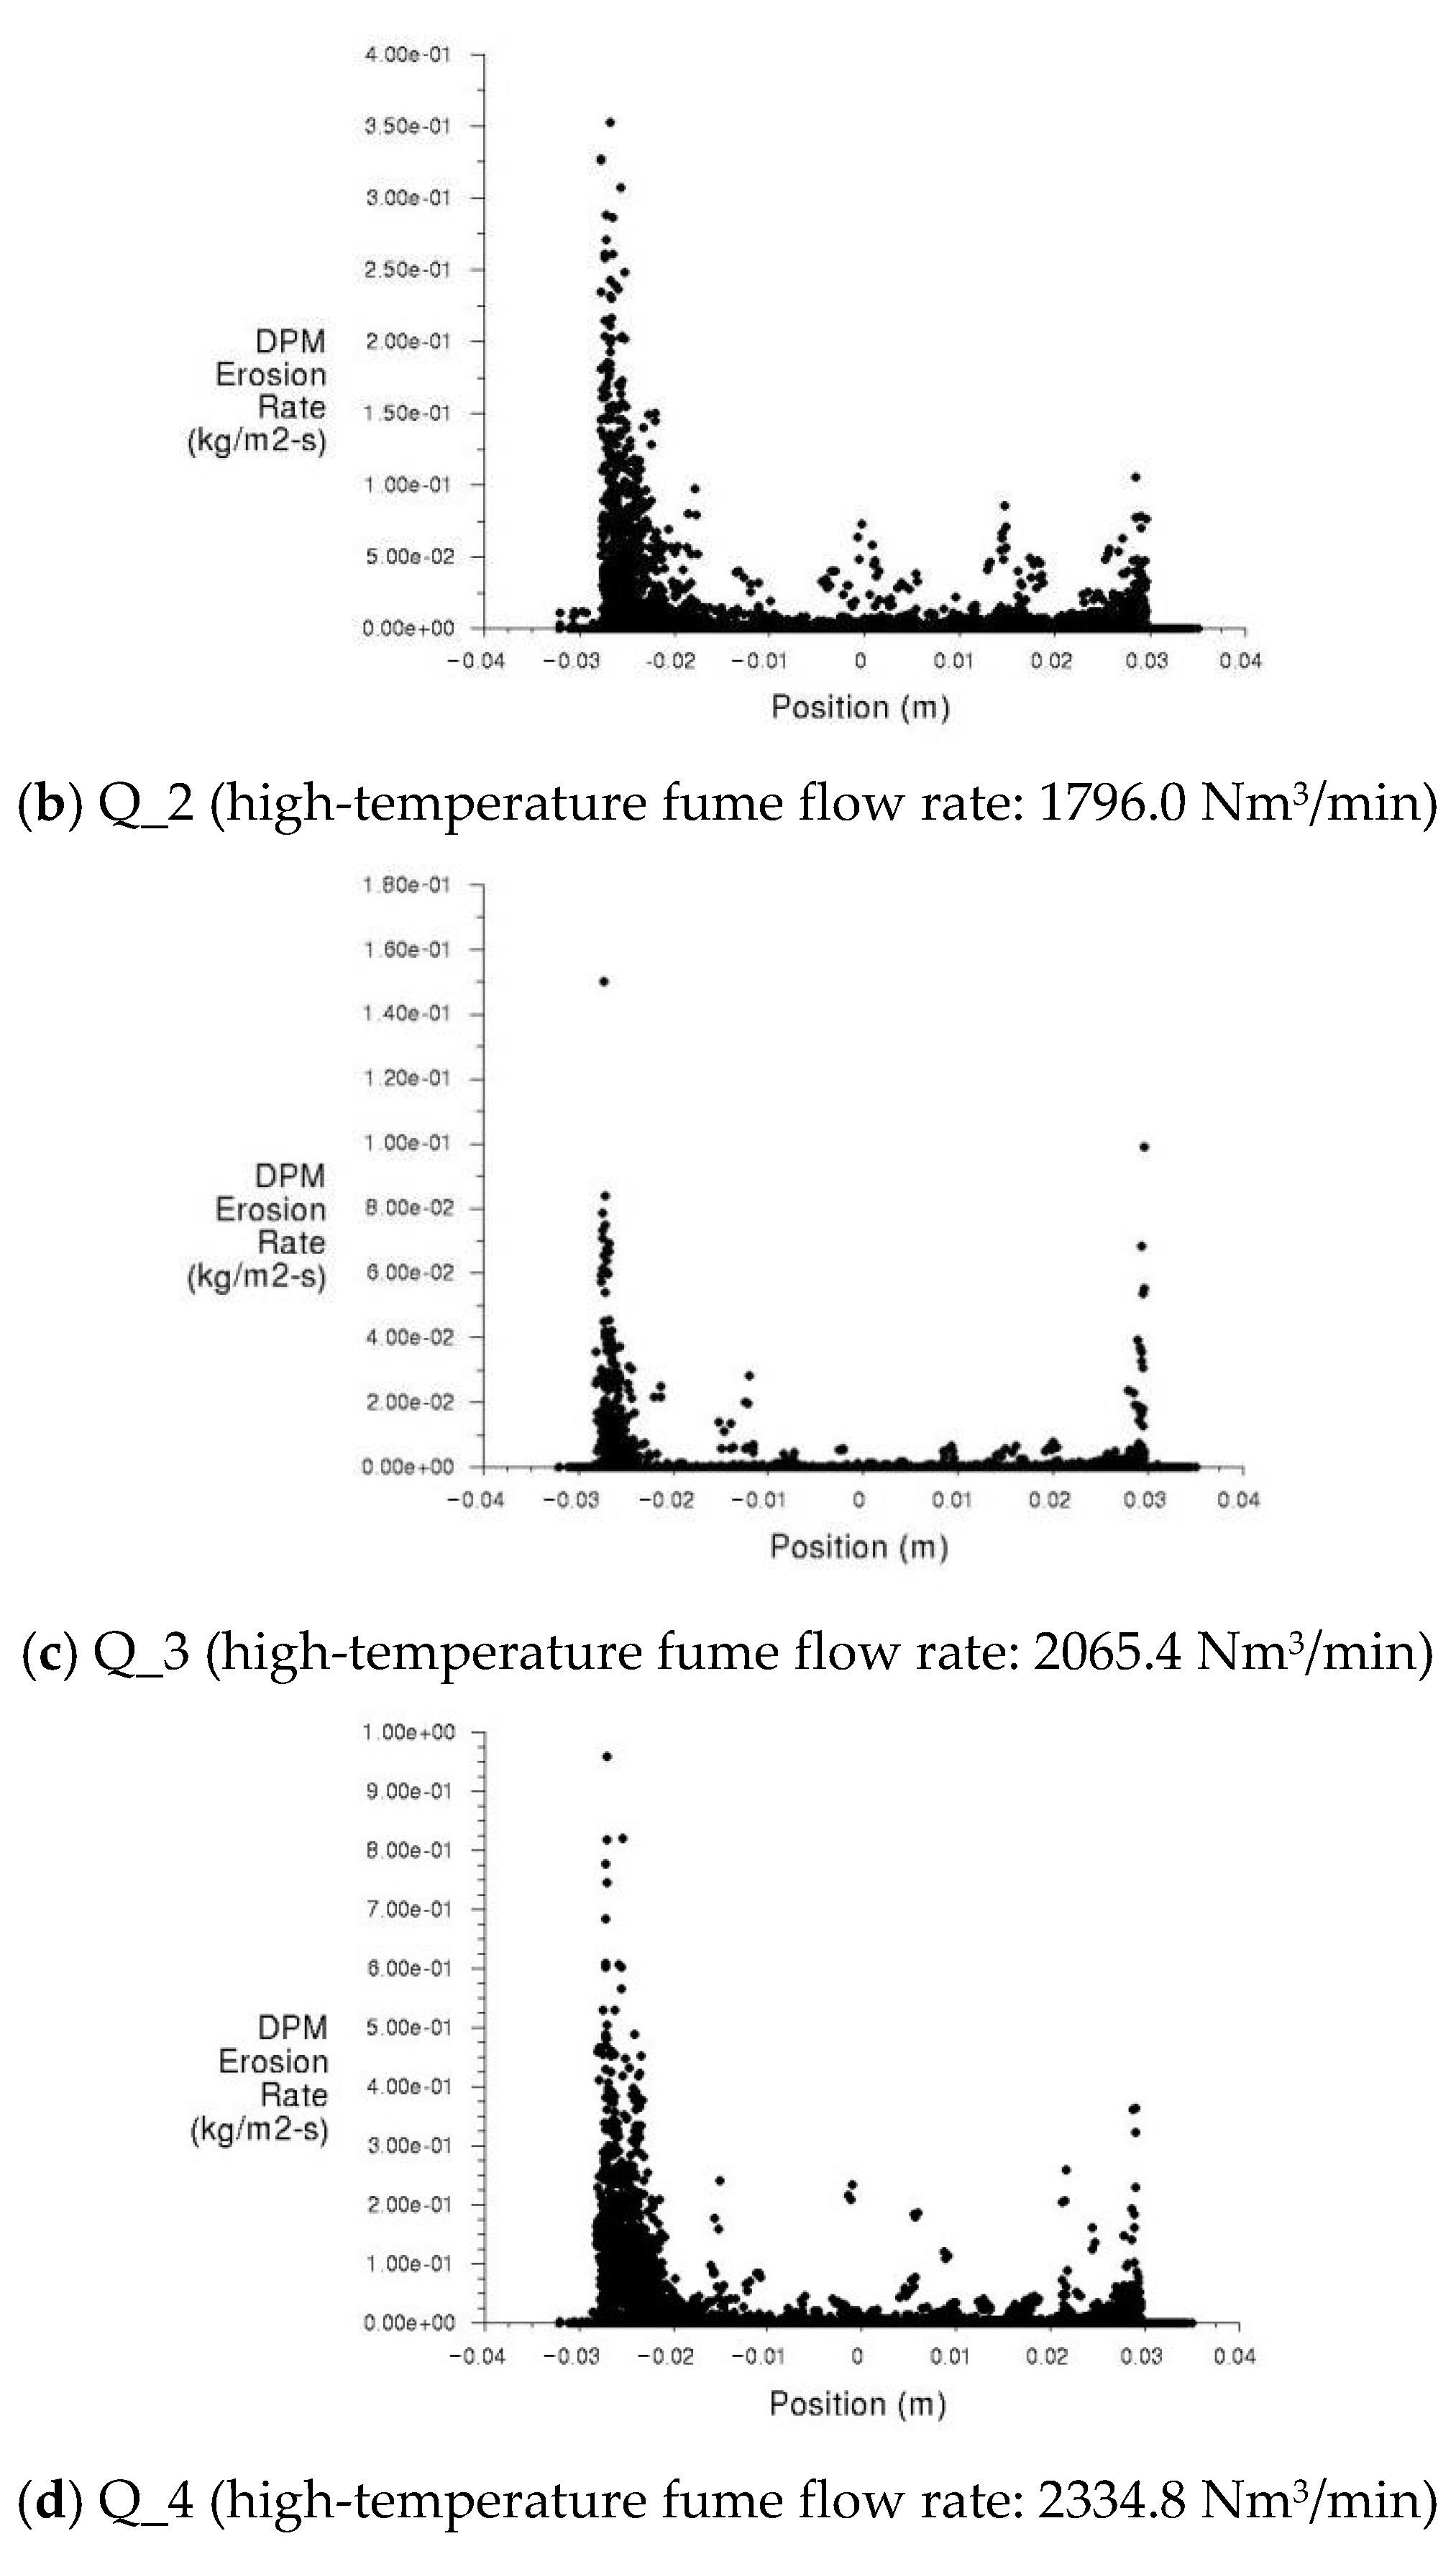
Figure 16 shows the axial distribution of the erosion wear of the high-temperature fume catalyst particles on the rotor blades under variable flow rate conditions. The numerical simulation results show that the erosion wear of the rotor blade mainly occurs near the leading and trailing edges. The erosion wear of the leading edge is more serious than that of the trailing edge. As shown in Figure 16, when the catalyst concentration, particle size, and related properties remain unchanged and only the fume flow rate is changed, the axial erosion wear of the rotor blade will change. Moreover, the corresponding wear under the condition of Q_2 (rated flow rate) is higher than that in other conditions.
4. Influence of the Fume Flow Rate on Rotor Stress
The working blade is one of the most important parts of the gas turbine and mainly consists of the blade body and tenon. While the unit works, considerable centrifugal force, gas force, and other loads act on the working blade. The blade is connected to the tenon of the outer edge of the disc through the tenon which, in turn, can transfer the load on the blade to the disc. Therefore, under the condition of light weight and small size (especially circumferential size), the mortise tenon joint structure should have enough strength and appropriate stiffness to avoid excessive stress concentration.
4.1. No-Load Condition
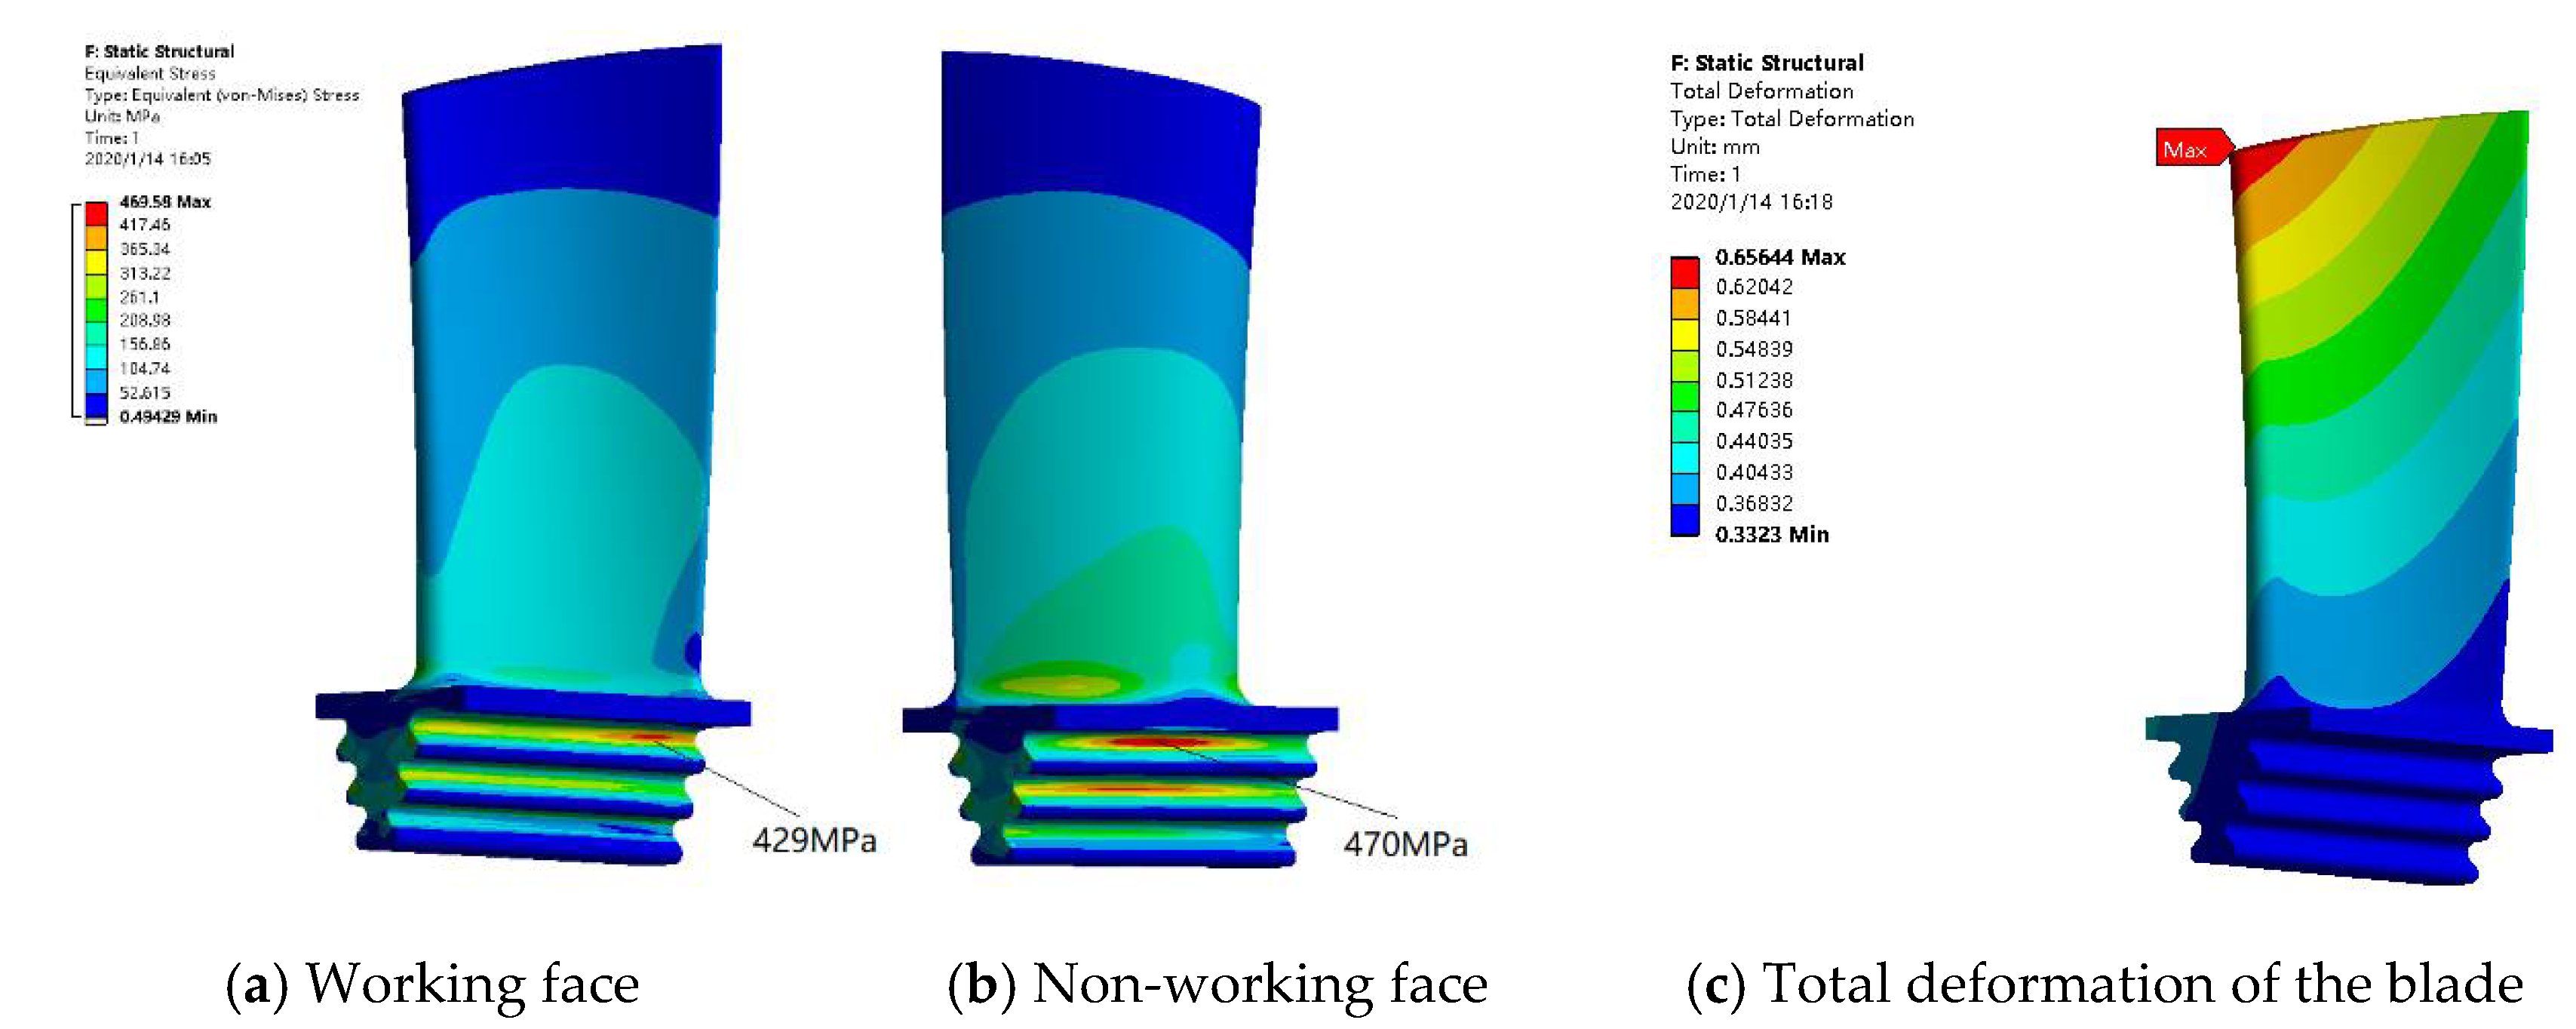
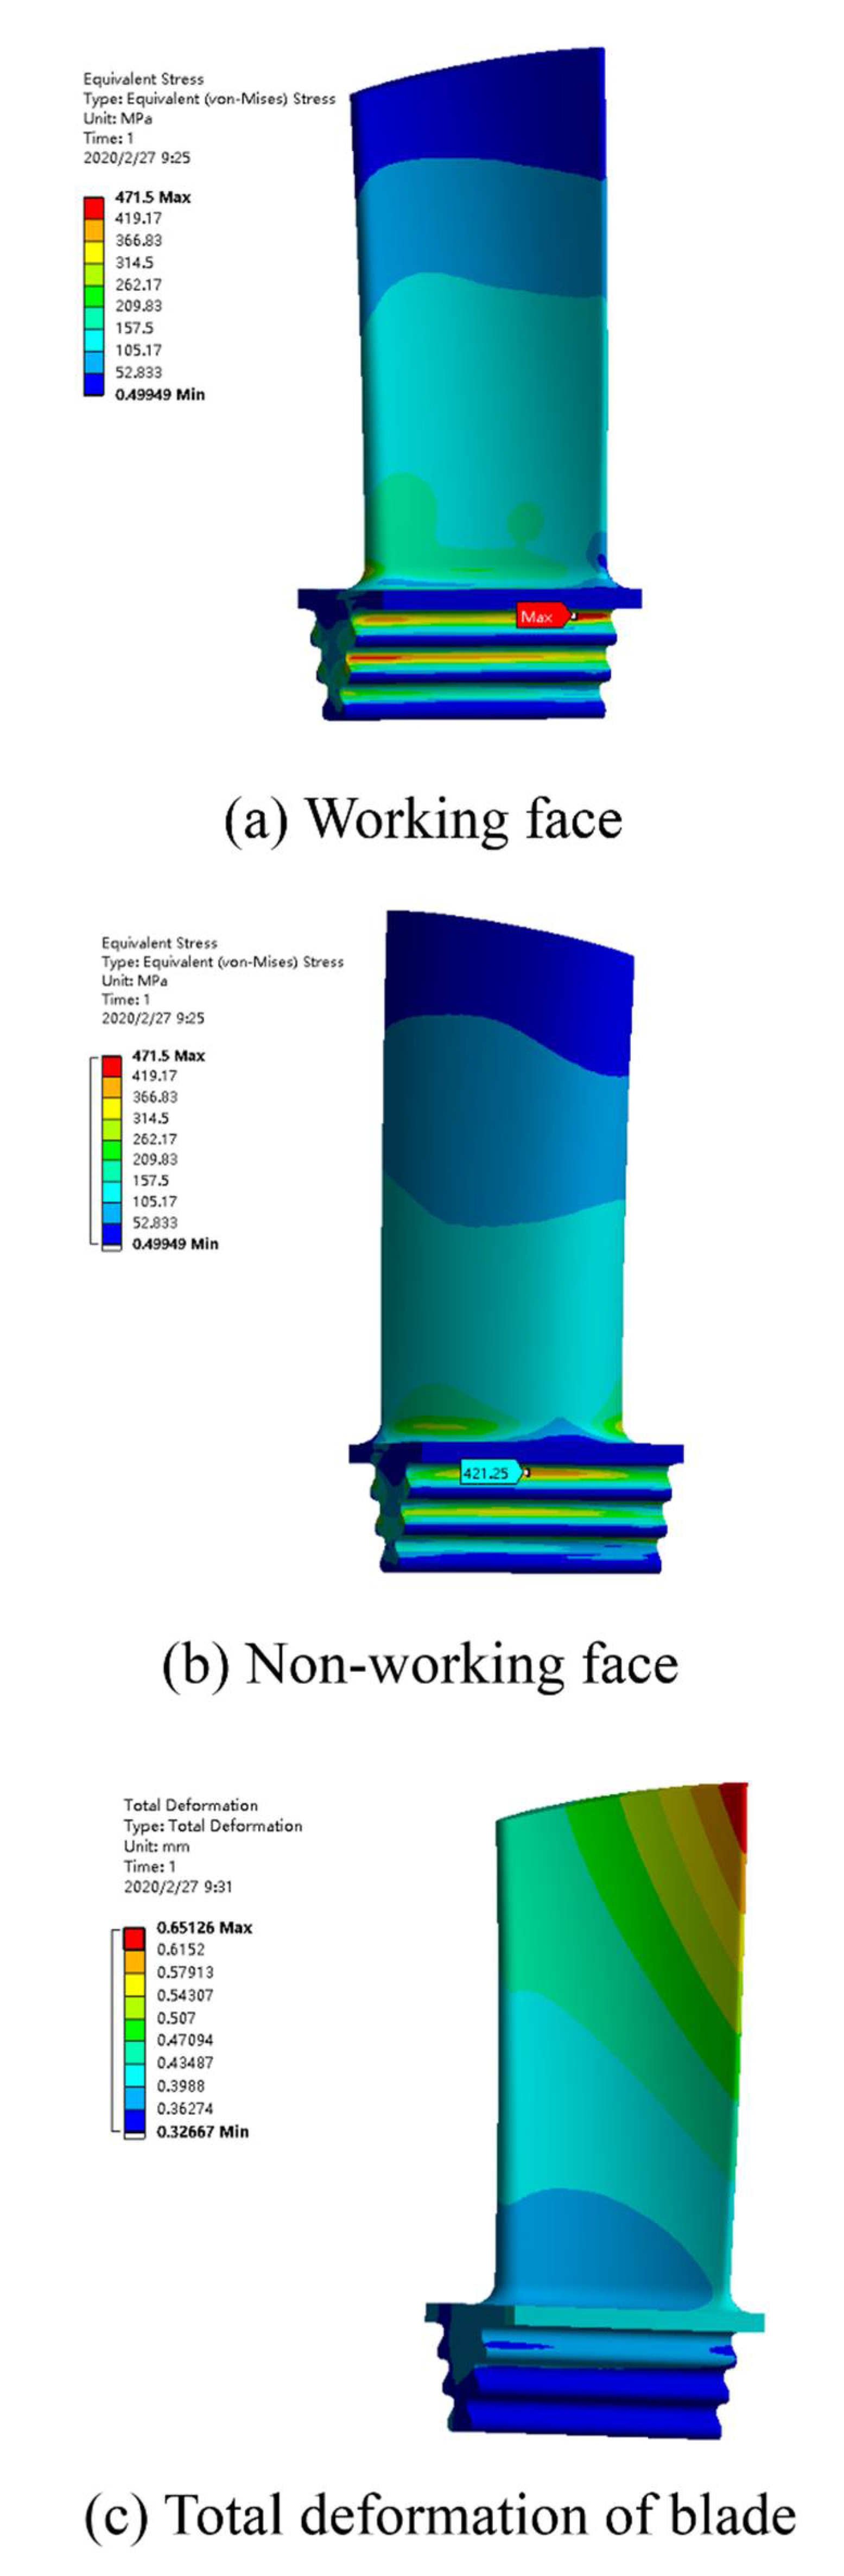
Figure 17a,b displays the cloud images of the equivalent force distribution of the blade. The maximum equivalent stress is 470 MPa, located at the large fillet of the first pair of tenon teeth, and is less than the material yield strength of 720 MPa. The stress level of the rotor blade body is low at no more than 360 MPa. As the tensile angle of the blade root is not zero, the tenon is not a completely symmetrical structure, and the contact state of each point is not consistent when coming into contact with the tenon. Thus, the stress level is not completely symmetrical. The stress shows a downward trend from the first to the third tooth, and the maximum stress of each tooth appears at the large fillet of the tenon teeth. The stress at the tooth tip of each tooth is relatively small, an occurrence which is due to the effect of the fillet. Therefore, the contact range between the tip of the tenon and the root of the tenon and groove is relatively small. Figure 17c shows the distribution of the total deformation of the blade. The maximum total deformation is approximately 0.66 mm.
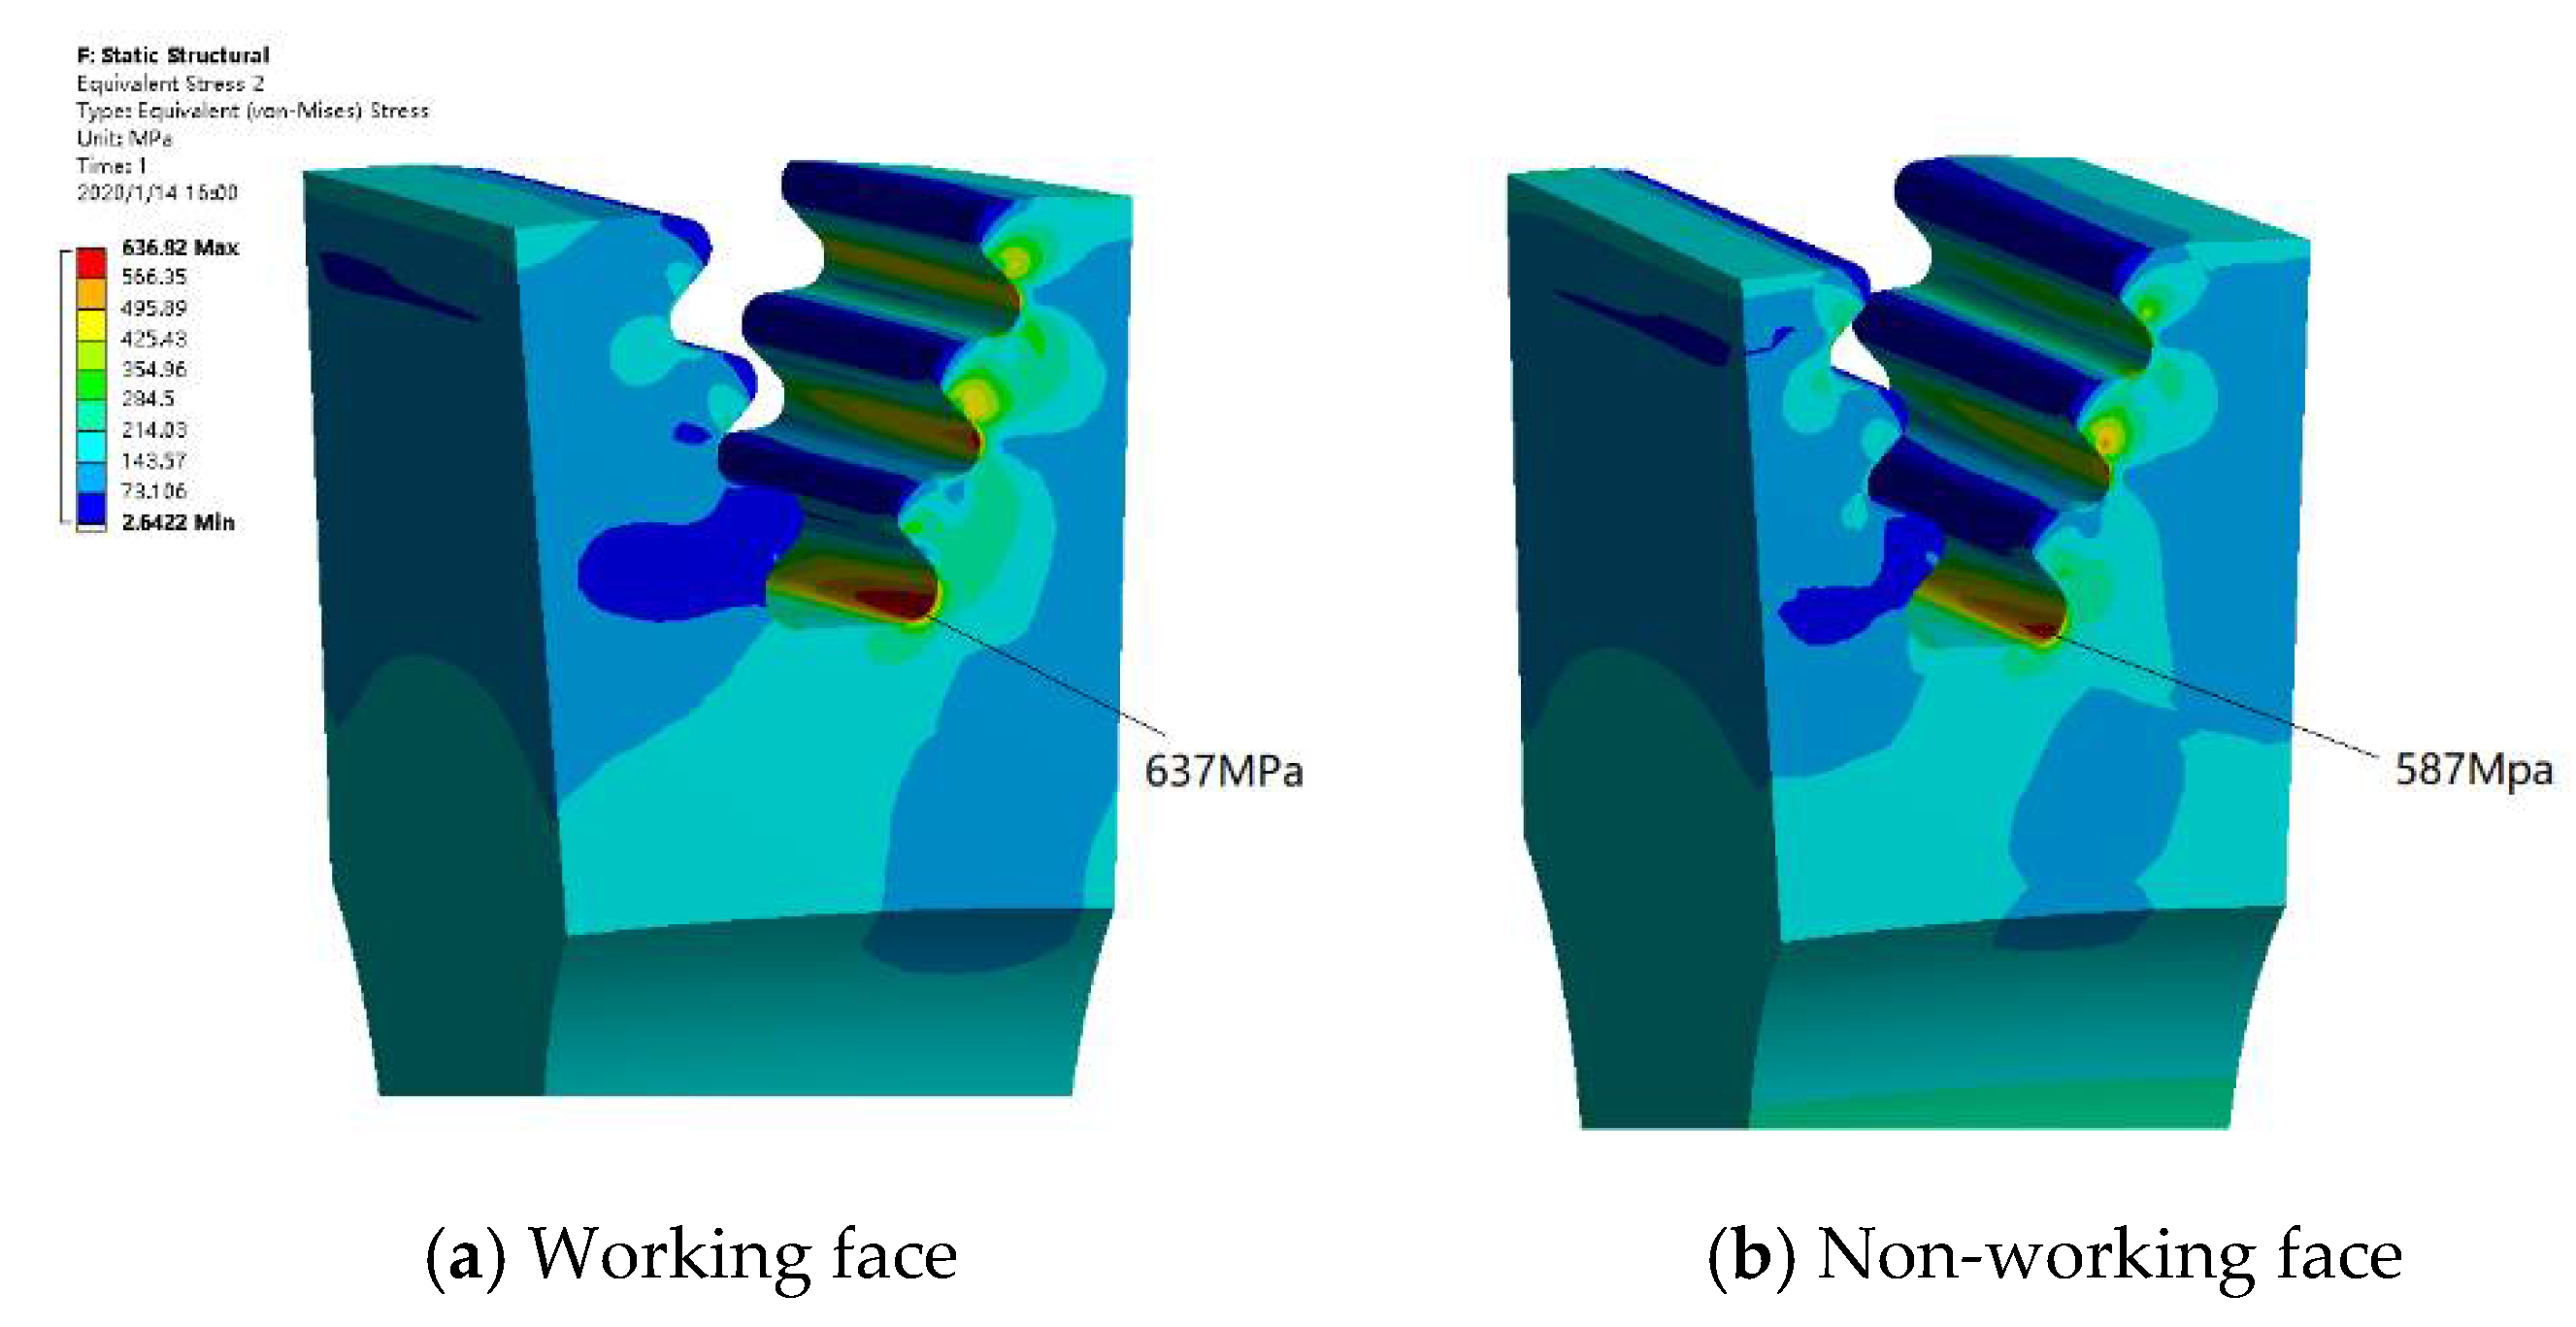
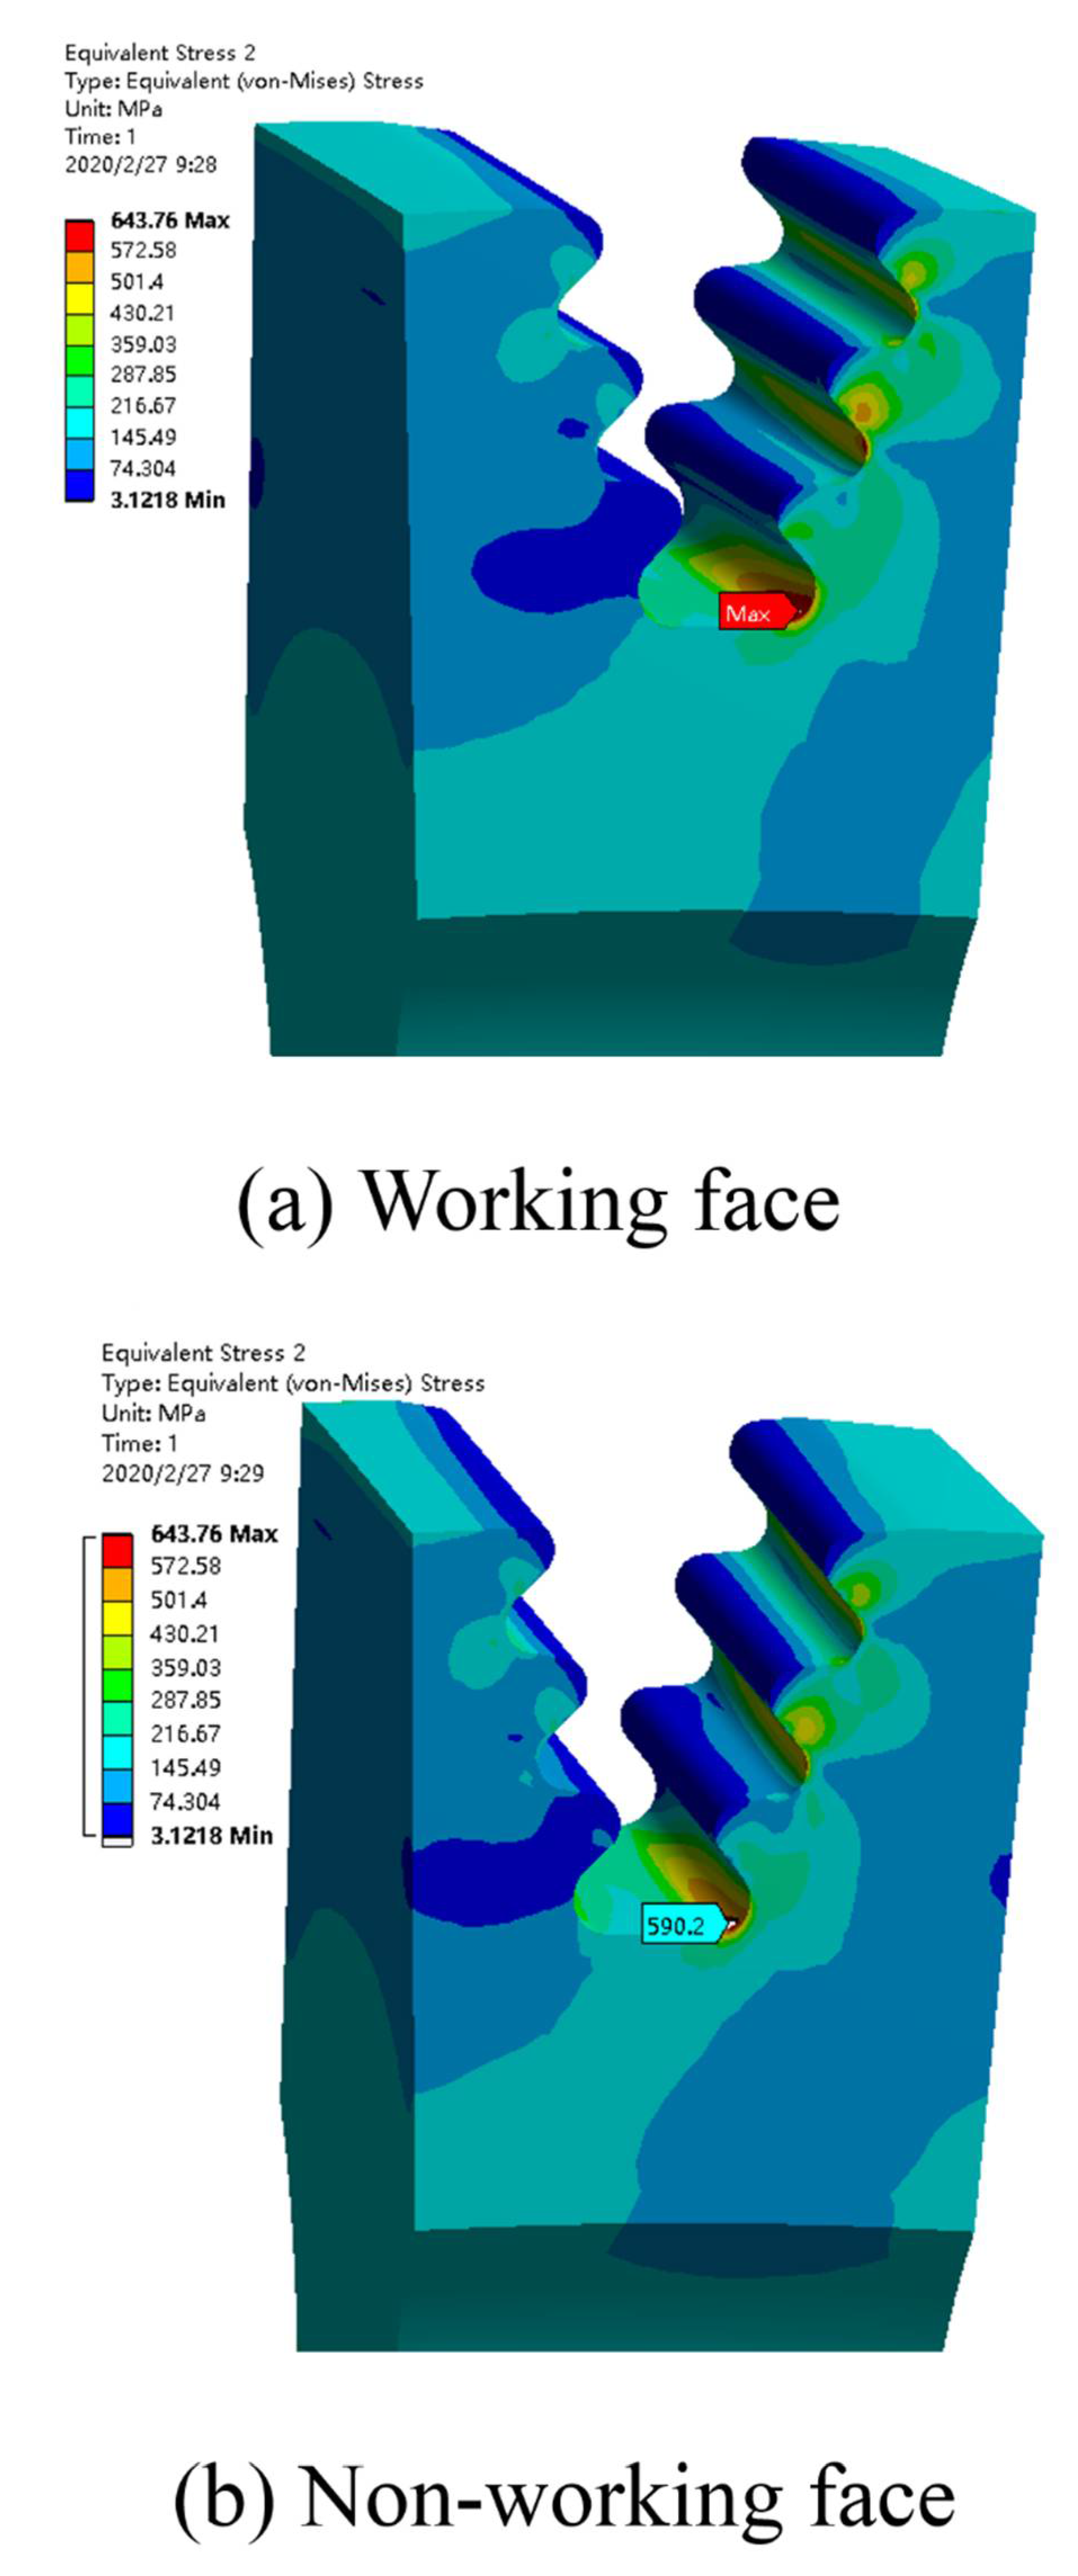
Figure 18 shows the equivalent force distribution nephograms of the roulette wheel. The maximum equivalent stress is 637 MPa, located at the large fillet of the third pair of tenon teeth in the mortise, and is less than the material yield strength of 720 MPa. The high stress area on the disc is concentrated on the mortise. The stress level at the large fillet increases gradually from the first to the third tooth.
4.2. Rated Flow Rate Condition
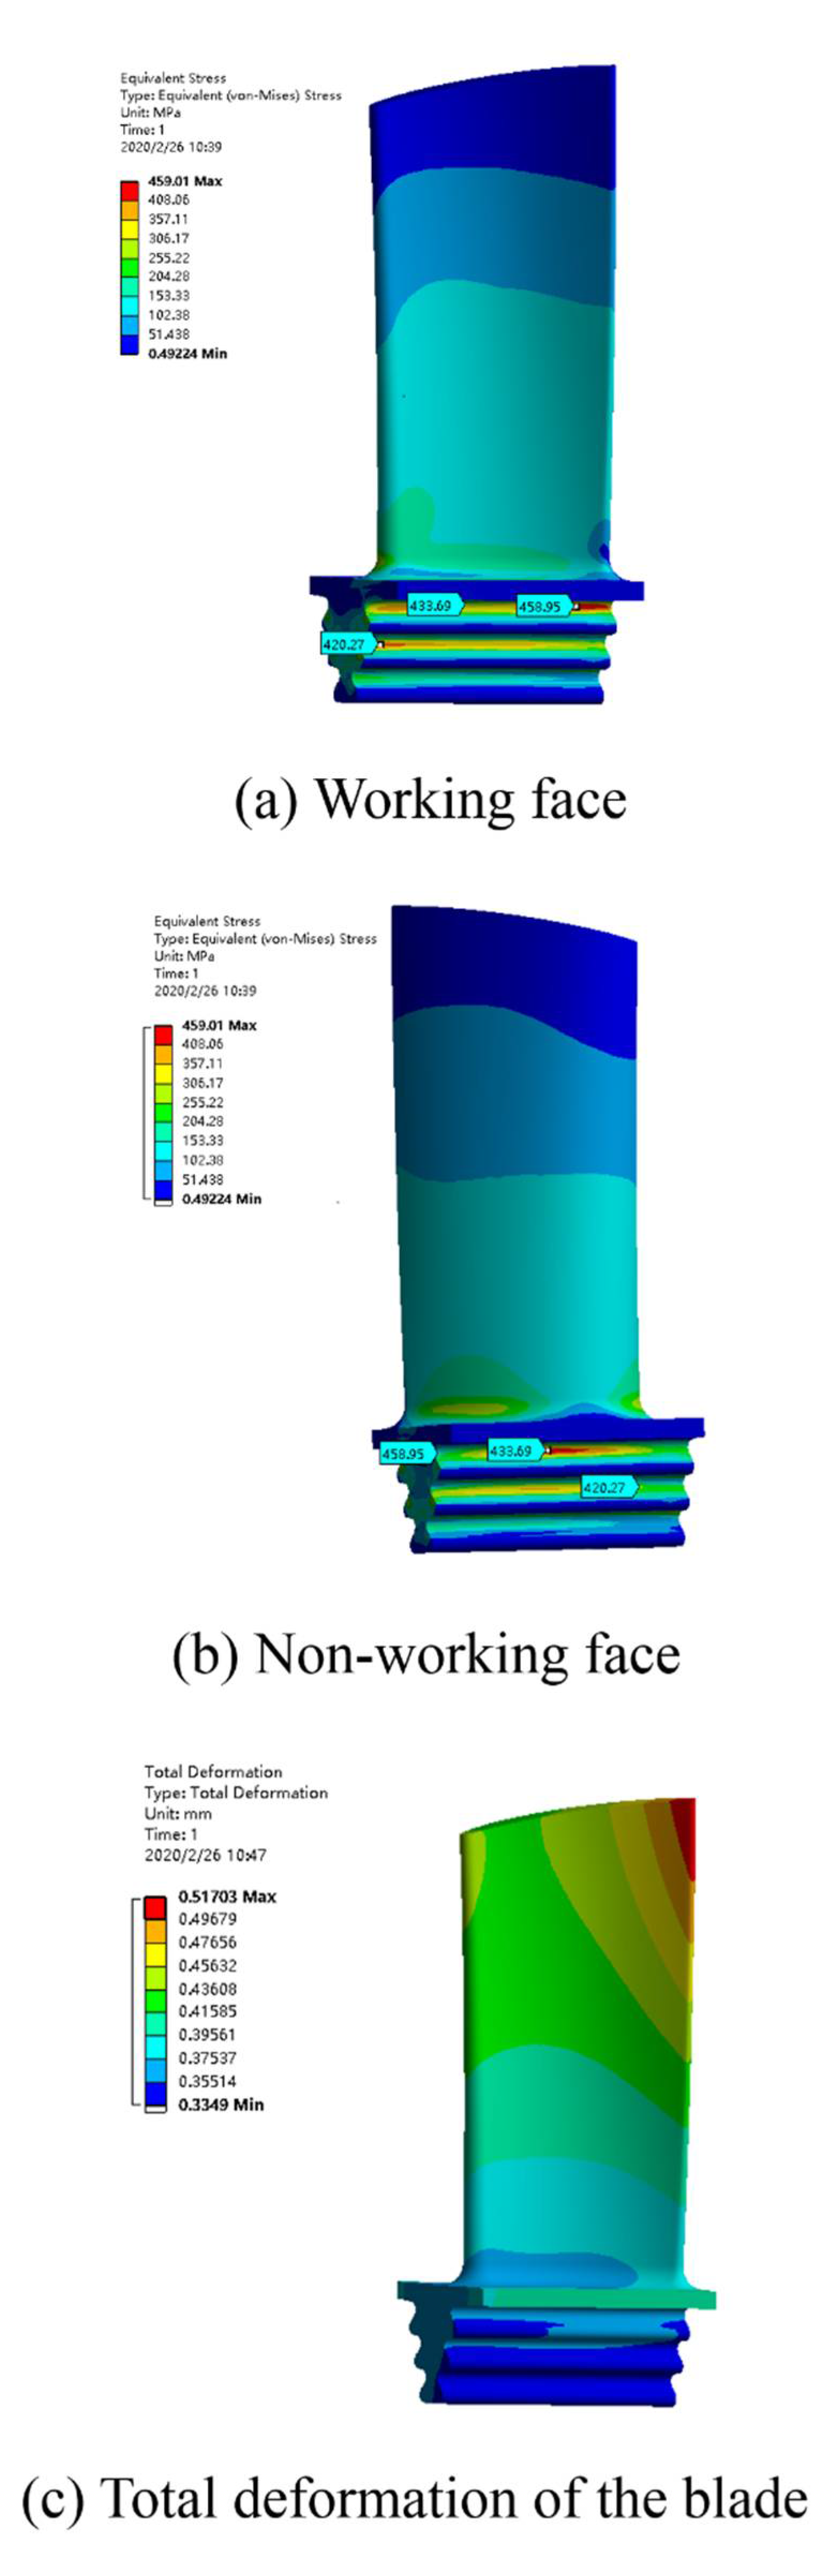
Figure 19a,b shows the cloud images of the equivalent force distribution of the blade. The maximum equivalent stress is 459 MPa, located at the large fillet of the first pair of tenon teeth, and is less than the material yield strength of 720 MPa. The stress level of the rotor blade body is low at no more than 360 MPa. As the stretching angle of the root is not zero, the tenon is not completely symmetrical. When contacting the tongue and groove tooth, the contact state of each point is not consistent, so the stress level is not completely symmetrical. The stress shows a downward trend from the first to the third tooth, and the maximum stress of each tooth essentially appears at the large fillet of the tenon teeth. The stress at the tooth tip of each tooth is relatively small and is due to the effect of the fillet. The contact range between the tooth tip of the mortise and tenon teeth and the root of the mortise and tenon teeth are relatively small. Figure 19c depicts the distribution of the total deformation of the blade. The maximum total deformation is approximately 0.52 mm.
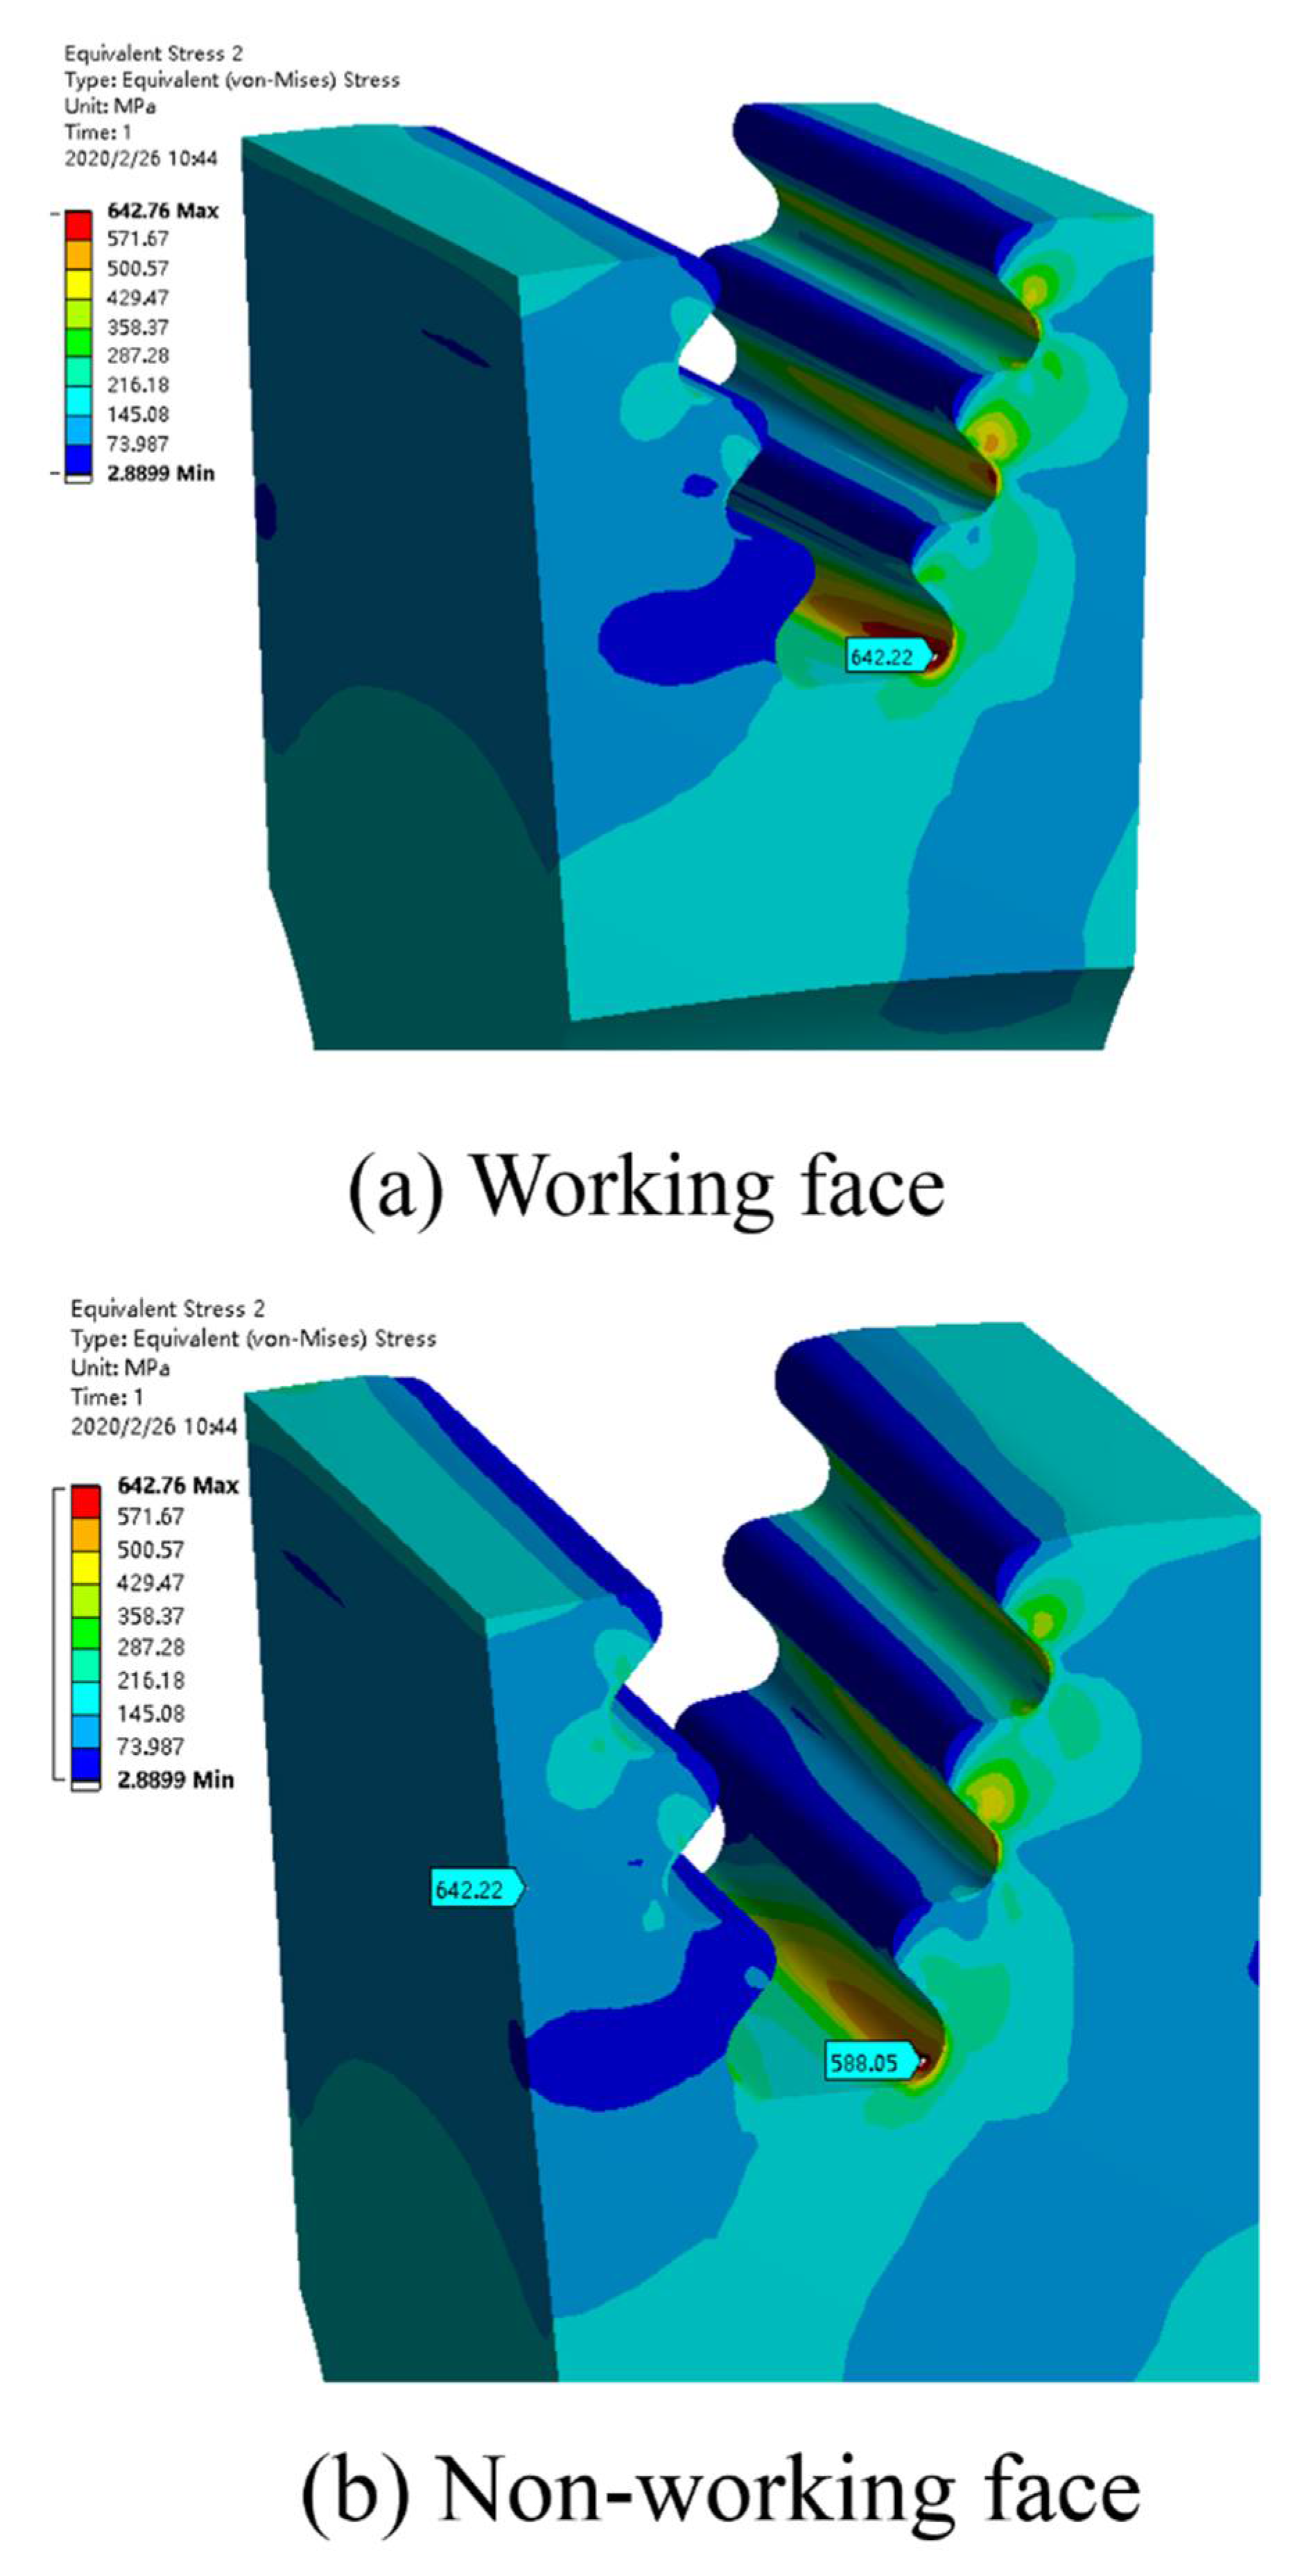
Figure 20 shows the equivalent force distribution cloud diagrams of the roulette wheel. The maximum equivalent stress is 643 MPa, located at the large fillet of the third pair of tenon teeth in the mortise, and is less than the material yield strength of 720 MPa. The high stress area on the disc is concentrated on the mortise. The stress level at the large fillet increases gradually from the first to the third tooth.
4.3. Large Flow Rate Condition
Figure 21a,b shows the cloud images of the equivalent force distribution of the blade. The maximum equivalent stress is 472 MPa, located at the large fillet of the first pair of tenon teeth, and is less than the material yield strength of 720 MPa. The stress level of rotor blade body is low at no more than 360 MPa. As the stretching angle of the root is not zero, the tenon is not completely symmetrical. When contacting the tongue and groove tooth, the contact state of each point is not consistent, so the stress level is not completely symmetrical. The stress shows a downward trend from the first to the third tooth, and the maximum stress of each tooth appears at the large fillet of the tenon teeth. Given the role of the fillet, the stress at the tip of each tooth is relatively small. Therefore, the contact range between the tip of the tenon and the root of the tenon and groove tooth is relatively small. Figure 21c depicts the distribution of the total deformation of the blade. The maximum total deformation is approximately 0.65 mm.
Figure 22 shows the equivalent force distribution nephograms of the roulette wheel. The maximum equivalent stress is 644 MPa, located at the large fillet of the third pair of tenon teeth in the mortise, and is less than the material yield strength of 720 MPa. The high stress area on the disc is concentrated on the mortise. The stress level at the large fillet increases gradually from the first to the third tooth.
4.4. Small Flow Rate Condition
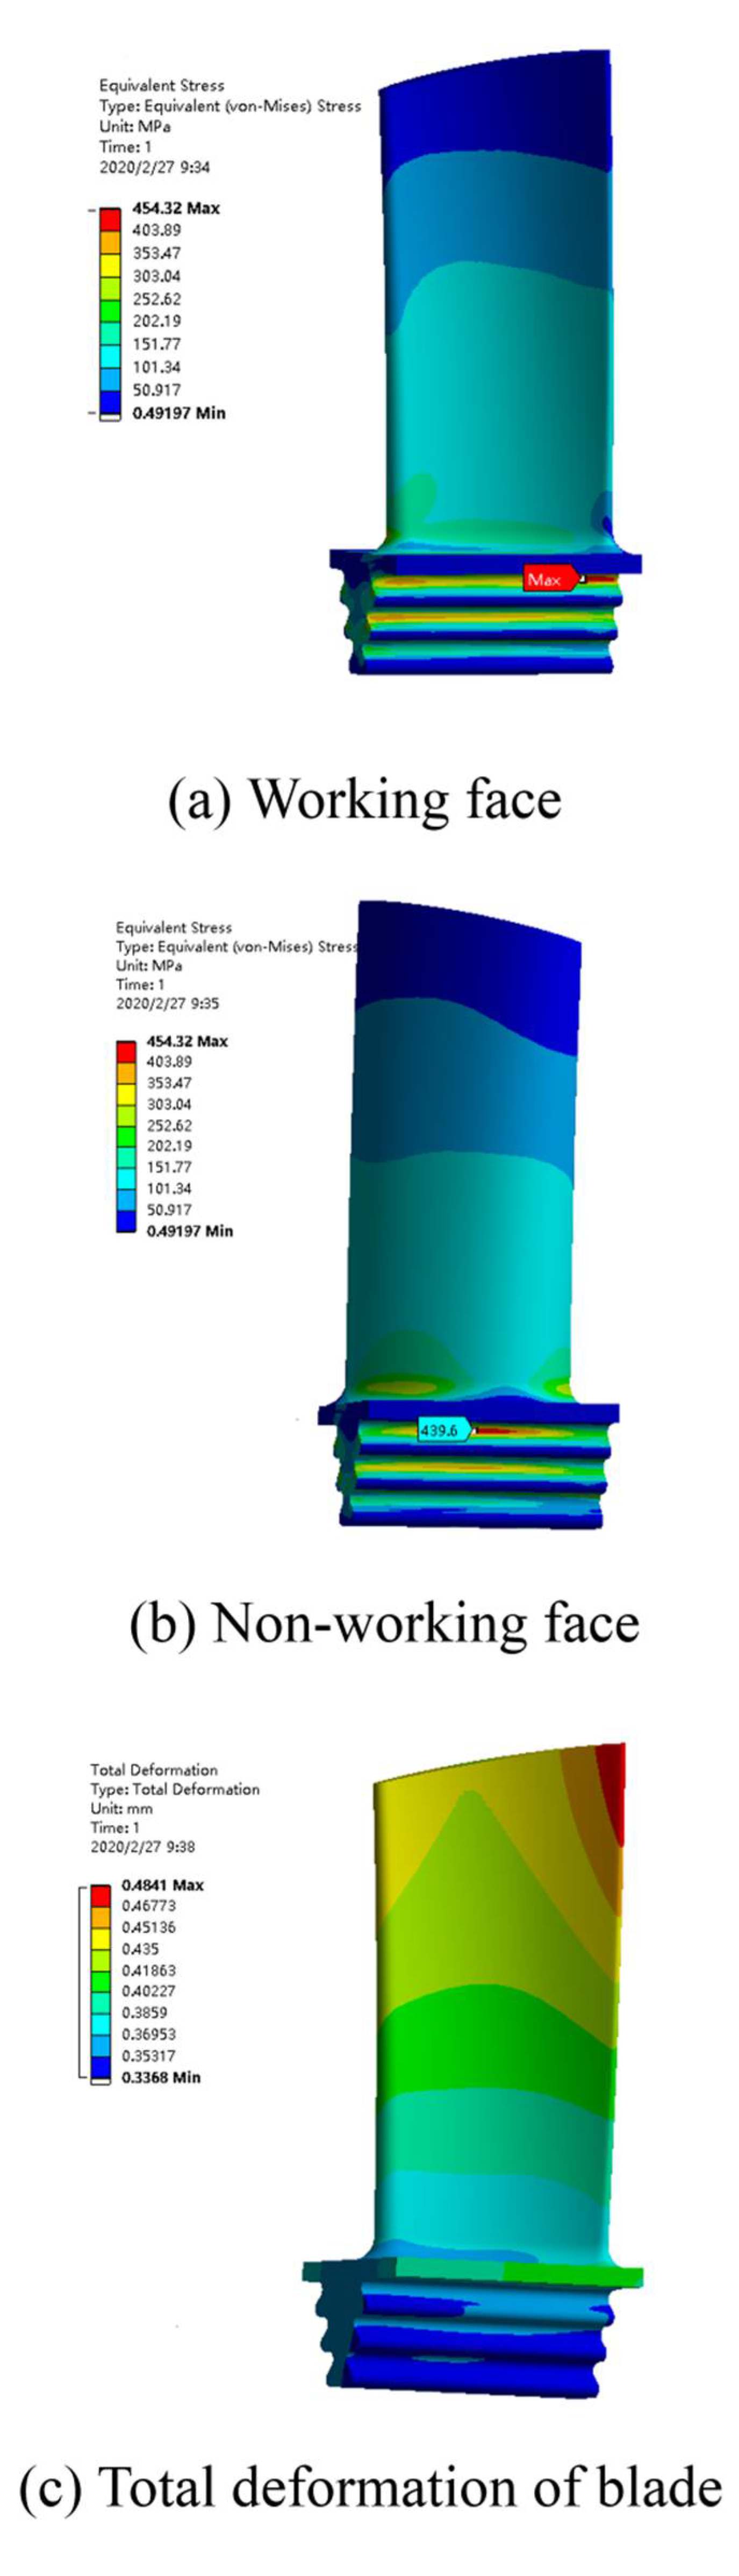
Figure 23a,b shows the cloud images of the equivalent force distribution of the blade. The maximum equivalent stress is 454 MPa, located at the large round of the first pair of tenon teeth, and is less than the material yield strength of 720 MPa. The stress level of the rotor blade body is low at no more than 360 MPa. As the tensile angle of the blade root is not zero, the tenon does not have a completely symmetrical structure, and the contact state of each point is not consistent when contacting the tenon. Thus, the stress level is not completely symmetrical. The stress shows a downward trend from the first to the third tooth, and the maximum stress of each tooth basically appears at the large fillet of the tenon teeth. Given the role of the fillet, the stress at the tip of each tooth is relatively small. Therefore, the contact range of the tooth tip of the tenon and the tooth root of the tenon and groove tooth is relatively small. Figure 23c depicts the distribution of the total deformation of the blade, and the maximum total deformation is approximately 0.48 mm.
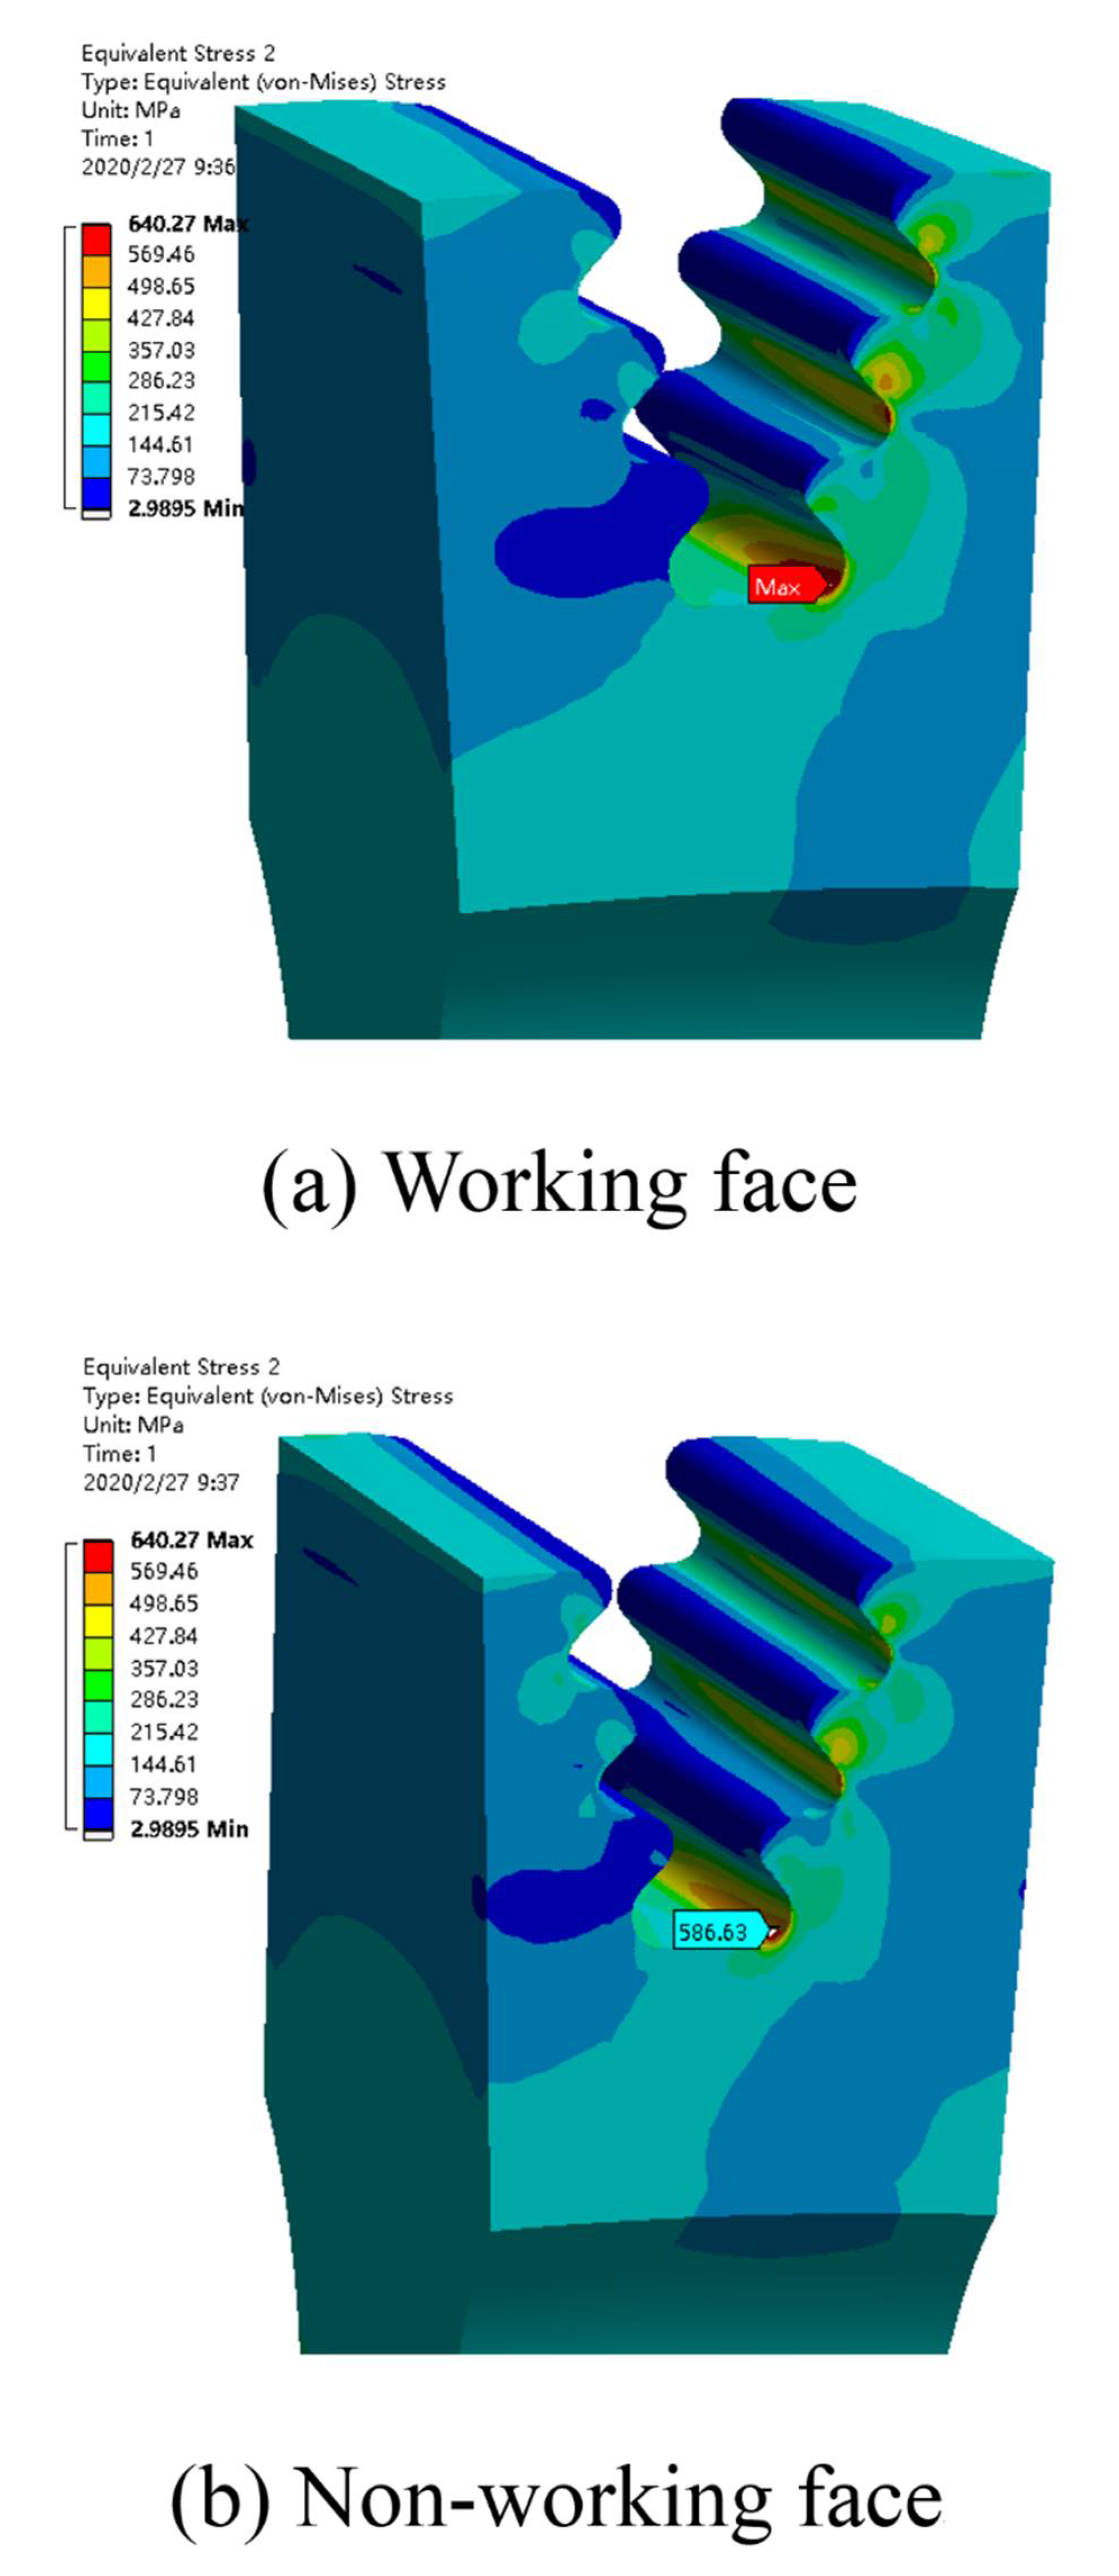
Figure 24 shows the equivalent force distribution nephograms of the roulette wheel. The maximum equivalent stress is 640 MPa, located at the large fillet of the third pair of tenon teeth in the mortise, and is less than the maximum yield strength of 720 MPa. The high stress area on the disc is concentrated on the mortise. The stress level at the large fillet increases gradually from the first to the third tooth.
5. Conclusions
Through the numerical simulation of the gas–solid two-phase flow field in the gas turbine, the effects of the fume flow rate on the gas–solid flow characteristics and rotor stress in the gas turbine are investigated, as well as the effects of the catalyst particle trajectory and its impact on rotor blade erosion. The numerical analysis herein provides theoretical support and guidance for fault analysis and the optimization direction of the gas turbine. The specific conclusions are as follows:
- (1)
- The variation trend of the pressure gradient in the calculation domain of the gas turbine is essentially the same under different fume flow rates. After the fume enters the stator blade through the inlet section, the pressure energy is converted into kinetic energy and impacts the rotor blade to do work. The impact will cause the uneven flow of the fume and intensify the erosion of the catalyst particles on the rotor blade.
- (2)
- With the increase of the radius, the pressure of the working face increases. The highest pressure appears near the tip with a large radius in front of the working face. With the increase of the high-temperature fume flow, the blade surface pressure increases, but the pressure change trend is basically the same.
- (3)
- The simulation results of the temperature field in the gas turbine show that the temperature and the temperature gradient change trend of the flow field in the calculation domain are consistent under different fume flow rates. The change of the fume flow has little influence on the temperature field of the entire machine. The simulation results of the velocity field reveal that the fume has an obvious acceleration process when it flows out of the rotor runner, and the high-temperature fume has low velocity before it enters the stator. After passing through the stator, the high-temperature fume expands rapidly (cooling and depressurizing), and the fume transforms its own heat energy and pressure energy into kinetic energy.
- (4)
- The distribution of the erosion location of catalyst particles on the rotor blade varies with different flow rates, but most of the erosion occurs near the leading and trailing edges of the blade and tends to occur at the large radius along the radial direction. The erosion wear of the rotor blade mainly appears near the leading and trailing edges, and the erosion wear of the leading edge is more serious than that of the trailing edge.
- (5)
- The static strength analysis of the gas turbine indicates that the maximum equivalent stress of the blade is 470, 459, 472, and 454 MPa, respectively, under the no-load, rated flow rate, large flow rate, and small flow rate conditions. The corresponding maximum stress values of the disc under those conditions are 637, 643, 644, and 640 MPa. The respective total maximum blade deformations are 0.66, 0.52, 0.65, and 0.48 mm. Under the four conditions, the maximum stress points of the blade are all located at the large fillet of the first pair of tenon teeth, and the maximum stress points of the disc are all located at the large fillet of the third pair of tenon teeth.
Author Contributions
Methodology, S.S.; software, Q.W.; formal analysis, S.S.; resources, D.A.; data curation, K.L.; writing—original draft preparation, G.L.; writing—review and editing, X.R.; project administration, X.Y.; funding acquisition, G.L. All authors have read and agreed to the published version of the manuscript.
Funding
This research was funded by the National Key R&D Program of China, grant number 2016YFF0203301.
Institutional Review Board Statement
Not applicable.
Informed Consent Statement
Not applicable.
Data Availability Statement
Not applicable.
Acknowledgments
This work was supported by the National Key R&D Program of China (2016YFF0203301).
Conflicts of Interest
The authors declare no conflict of interest.
References
- Lu, P.; Ji, J.; Yang, L. A Review of Chinese Achievements in Developing FCC Flue Gas Turbines over the Past 30 Years. Sino-Glob. Energy 2008, 13, 8–10. [Google Scholar]
- Ji, J.; Ma, K.; Zhou, T. Innovation Creates Success—The Evolution of YL Type FCC Flue Gas Turbine over the Past 30 Years. Sino-Glob. Energy 2008, 13, 1–7. [Google Scholar]
- Lin, F.; Wang, W.; Li, M.; Li, Y. Experimental Study on the Combustion Oscillation Characteristics of Gas Turbine Combustor. J. Eng. Therm. Energy Power 2017, 32, 62–68. [Google Scholar]
- Vierling, M.; Moliere, M.; Glaser, P.; Denolle, R.; Montagne, P. Efficient Smoke Suppressant Reduces the Particulate Matter Emissions of Crude Oil Fired Gas Turbines. In Proceedings of the ASME Turbo Expo 2019: Turbomachinery Technical Conference and Exposition, Phoenix, AZ, USA, 17–21 June 2019. [Google Scholar]
- Marin, G.E.; Mendeleev, D.I.; Akhmetshin, A.R. Analysis of Changes in the Thermophysical Parameters of the Gas Turbine Unit Working Fluid Depending on the Fuel Gas Composition. In Proceedings of the 2019 International Multi-Conference on Industrial Engineering and Modern Technologies (FarEastCon), Vladivostok, Russia, 1–4 October 2019. [Google Scholar]
- Xu, W.; Zhu, K.; Wang, J.; Lin, Y.; Li, Q. Modeling and numerical analysis of the effect of blade roughness on particle deposition in a flue gas turbine. Powder Technol. 2019, 347, 59–65. [Google Scholar]
- Pan, J.; Wang, J.; Chen, S.; Zhang, X.; Liu, S. Numerical study of inlet Reynolds number in fine particles deposition processes in a flue gas turbine. Powder Technol. 2018, 339, 506–520. [Google Scholar] [CrossRef]
- Du, Y.; Zhao, H.; Yang, C.; Zhang, Y.; Hu, R. Catalyst fines behavior among FCC flue gas turbine blade rows—Erosion and fouling on blades. Chem. Eng. (China) 2012, 40, 52–55. [Google Scholar]
- Tanaka, T. Numerical Simulation of Gas-solid Two-phase Flow in a Vertical Pipe: On the Effect of Inter-particle Collision in Gas-solid Flows. Trans. ASME J. Fluids Eng. 1991, 121, 123–128. [Google Scholar]
- Gómez, L.C.; Milioli, F.E. Numerical study on the influence of various physical parameters over the gas–solid two-phase flow in the 2D riser of a circulating fluidized bed—ScienceDirect. Powder Technol. 2003, 132, 216–225. [Google Scholar] [CrossRef]
- Du, Y.; Zhao, H.; Yang, C.; Hu, R.; Zhang, Y. Catalyst fines behavior among FCC flue gas turbine blade rows—Effect of gaseous phase flow field distribution. Chem. Eng. (China) 2012, 40, 57–60. [Google Scholar]
- Yu, Y.; Wang, X.; Xie, R.; Wang, Z. Numerical Investigation on the effect of cooling steam on the erosion to the flue gas turbine impeller based on CFD. In Proceedings of the Asia-Pacific Power and Energy Engineering Conference, Chengdu, China, 28–31 March 2010. [Google Scholar]
- Wang, J.; Guo, Y.; Chen, S.; Jin, Y.; Ding, J.; Han, Z. Visualization of particle movement in flow path of flue gas turbine. CIESC J. 2018, 69, 1454–1460. [Google Scholar]
- Finnie, I.; Mcfadden, D.H. On the velocity dependence of the erosion of ductile metals by solid particles at low angles of incidence. Wear 1977, 48, 181–190. [Google Scholar] [CrossRef] [Green Version]
- Bitter, J. A study of Erosion Phenomena Part I. Wear 1963, 6, 5–21. [Google Scholar] [CrossRef]
- Bitter, J. A Study of Erosion Phenomena: Part II. Wear 1963, 6, 169–190. [Google Scholar] [CrossRef]
- Adam Khan, M.; Sundarrajan, S.; Natarajan, S.; Parameswaran, P.; Mohandas, E. Oxidation and Hot Corrosion Behavior of Nickel-Based Superalloy for Gas Turbine Applications. Mater. Manuf. Process. 2014, 29, 832–839. [Google Scholar] [CrossRef]
- Shangguan, W.; Mo, W.; Shu, H.; Yu, N.; He, P.; Zhu, F. Study on the Effect of Structure and Parameters of Engine Annular Cooling Fans on Aerodynamic Performances. Chin. Intern. Combust. Engine Eng. 2017, 38, 56–62. [Google Scholar]
- Chen, S.; Wang, J.; Jin, Y. Numerical study of movement rule of different size particles in flue gas turbine. China Powder Sci. Technol. 2018, 24, 64–68. [Google Scholar]
- Tan, H.; Wang, J.; Jin, Y. Numerical Simulation of Gas-solid Two-phase Flows in Stage Cascade of Flue Gas Turbine Used for Fcc Unit. Turbine Technol. 2012, 54, 437–441. [Google Scholar]
- Zhu, G.; Chow, T.T.; Fong, K.F.; Lee, C.K. Investigation on humidified gas turbine cycles with Maisotsenko-cycle-based air saturator. Energy Procedia 2019, 158, 5195–5200. [Google Scholar]
- Wang, J.; Lin, Y.; Xu, W.; Li, Q.; Dandekar, A. Effects of blade roughness on particle deposition in flue gas turbines. Powder Technol. 2019, 353, 426–432. [Google Scholar]
- Mayle, R.E. The Role of Laminar-Turbulent Transition in Gas Turbine Engines. Asme J. Turbomach. 1991. [CrossRef] [Green Version]
- Mashayek, F.; Pandya, R. Analytical description of particle/droplet-laden turbulent flows. Prog. Energy Combust. Sci. 2003, 29, 329–378. [Google Scholar] [CrossRef]
- Hamed, A.; Tabakoff, W.C.; Wenglarz, R.V. Erosion and Deposition in Turbomachinery. J. Propuls. Power 2006, 22, 350–360. [Google Scholar] [CrossRef] [Green Version]
- Tabakoff, W.C. Review—Turbomachinery Performance Deterioration Exposed to Solid Particulates Environment. J. Fluids Eng. 1984, 106, 125–134. [Google Scholar] [CrossRef]
- Tabakoff, W.C.; Hamed, A.; Metwally, M. Effect of Particle Size Distribution on Particle Dynamics and Blade Erosion in Axial Flow Turbines. J. Eng. Gas Turbines Power 1990, 113, 607–615. [Google Scholar] [CrossRef]
- Han, B.; Li, Y.; Jin, Y. Effect of Different Flow Rates on Gas-Solid Two-phase Flow in Fluid Catalytic Cracking Gas Turbine. China Powder Ence Technol. 2014, 20, 11–15. [Google Scholar]
- Dong, X.; Zhang, H.; Cai, X.; Wang, L. Numerical study on the erosion and abrasion behavior of the high temperature alloy material of flue gas turbine blade. J. Plast. Eng. 2014, 21, 122–127. [Google Scholar]
- Schiele, R.; Wittig, S. Gas Turbine Heat Transfer: Past and Future Challenges. J. Propuls. Power 2015, 16, 583–589. [Google Scholar] [CrossRef]
- Evans, J.; Stevens, L.M.; Bodily, C.; Kang, M.B. Prediction of Velocities and Heat Transfer Coefficients in a Rotor—Stator Cavity. In Proceedings of the ASME Turbo Expo 2004—Power for Land, Sea, and Air, Vienna, Austria, 14–17 June 2004. [Google Scholar]
- Martin, T.J.; Dulikravich, G.S. Analysis and Multidisciplinary Optimization of Internal Coolant Networks in Turbine Blades. J. Propuls. Power 2014, 18, 896–906. [Google Scholar] [CrossRef]
Figure 1.
Structure of the gas turbine.

Figure 2.
Fluid domain model of the gas turbine.

Figure 3.
Relationship between the inlet pressure of the rotor blade and number of mesh nodes.

Figure 4.
Mesh generation results of the geometric model.

Figure 5.
Solid model of the blade and disc (sector model).

Figure 6.
Blade/disc mesh generation.

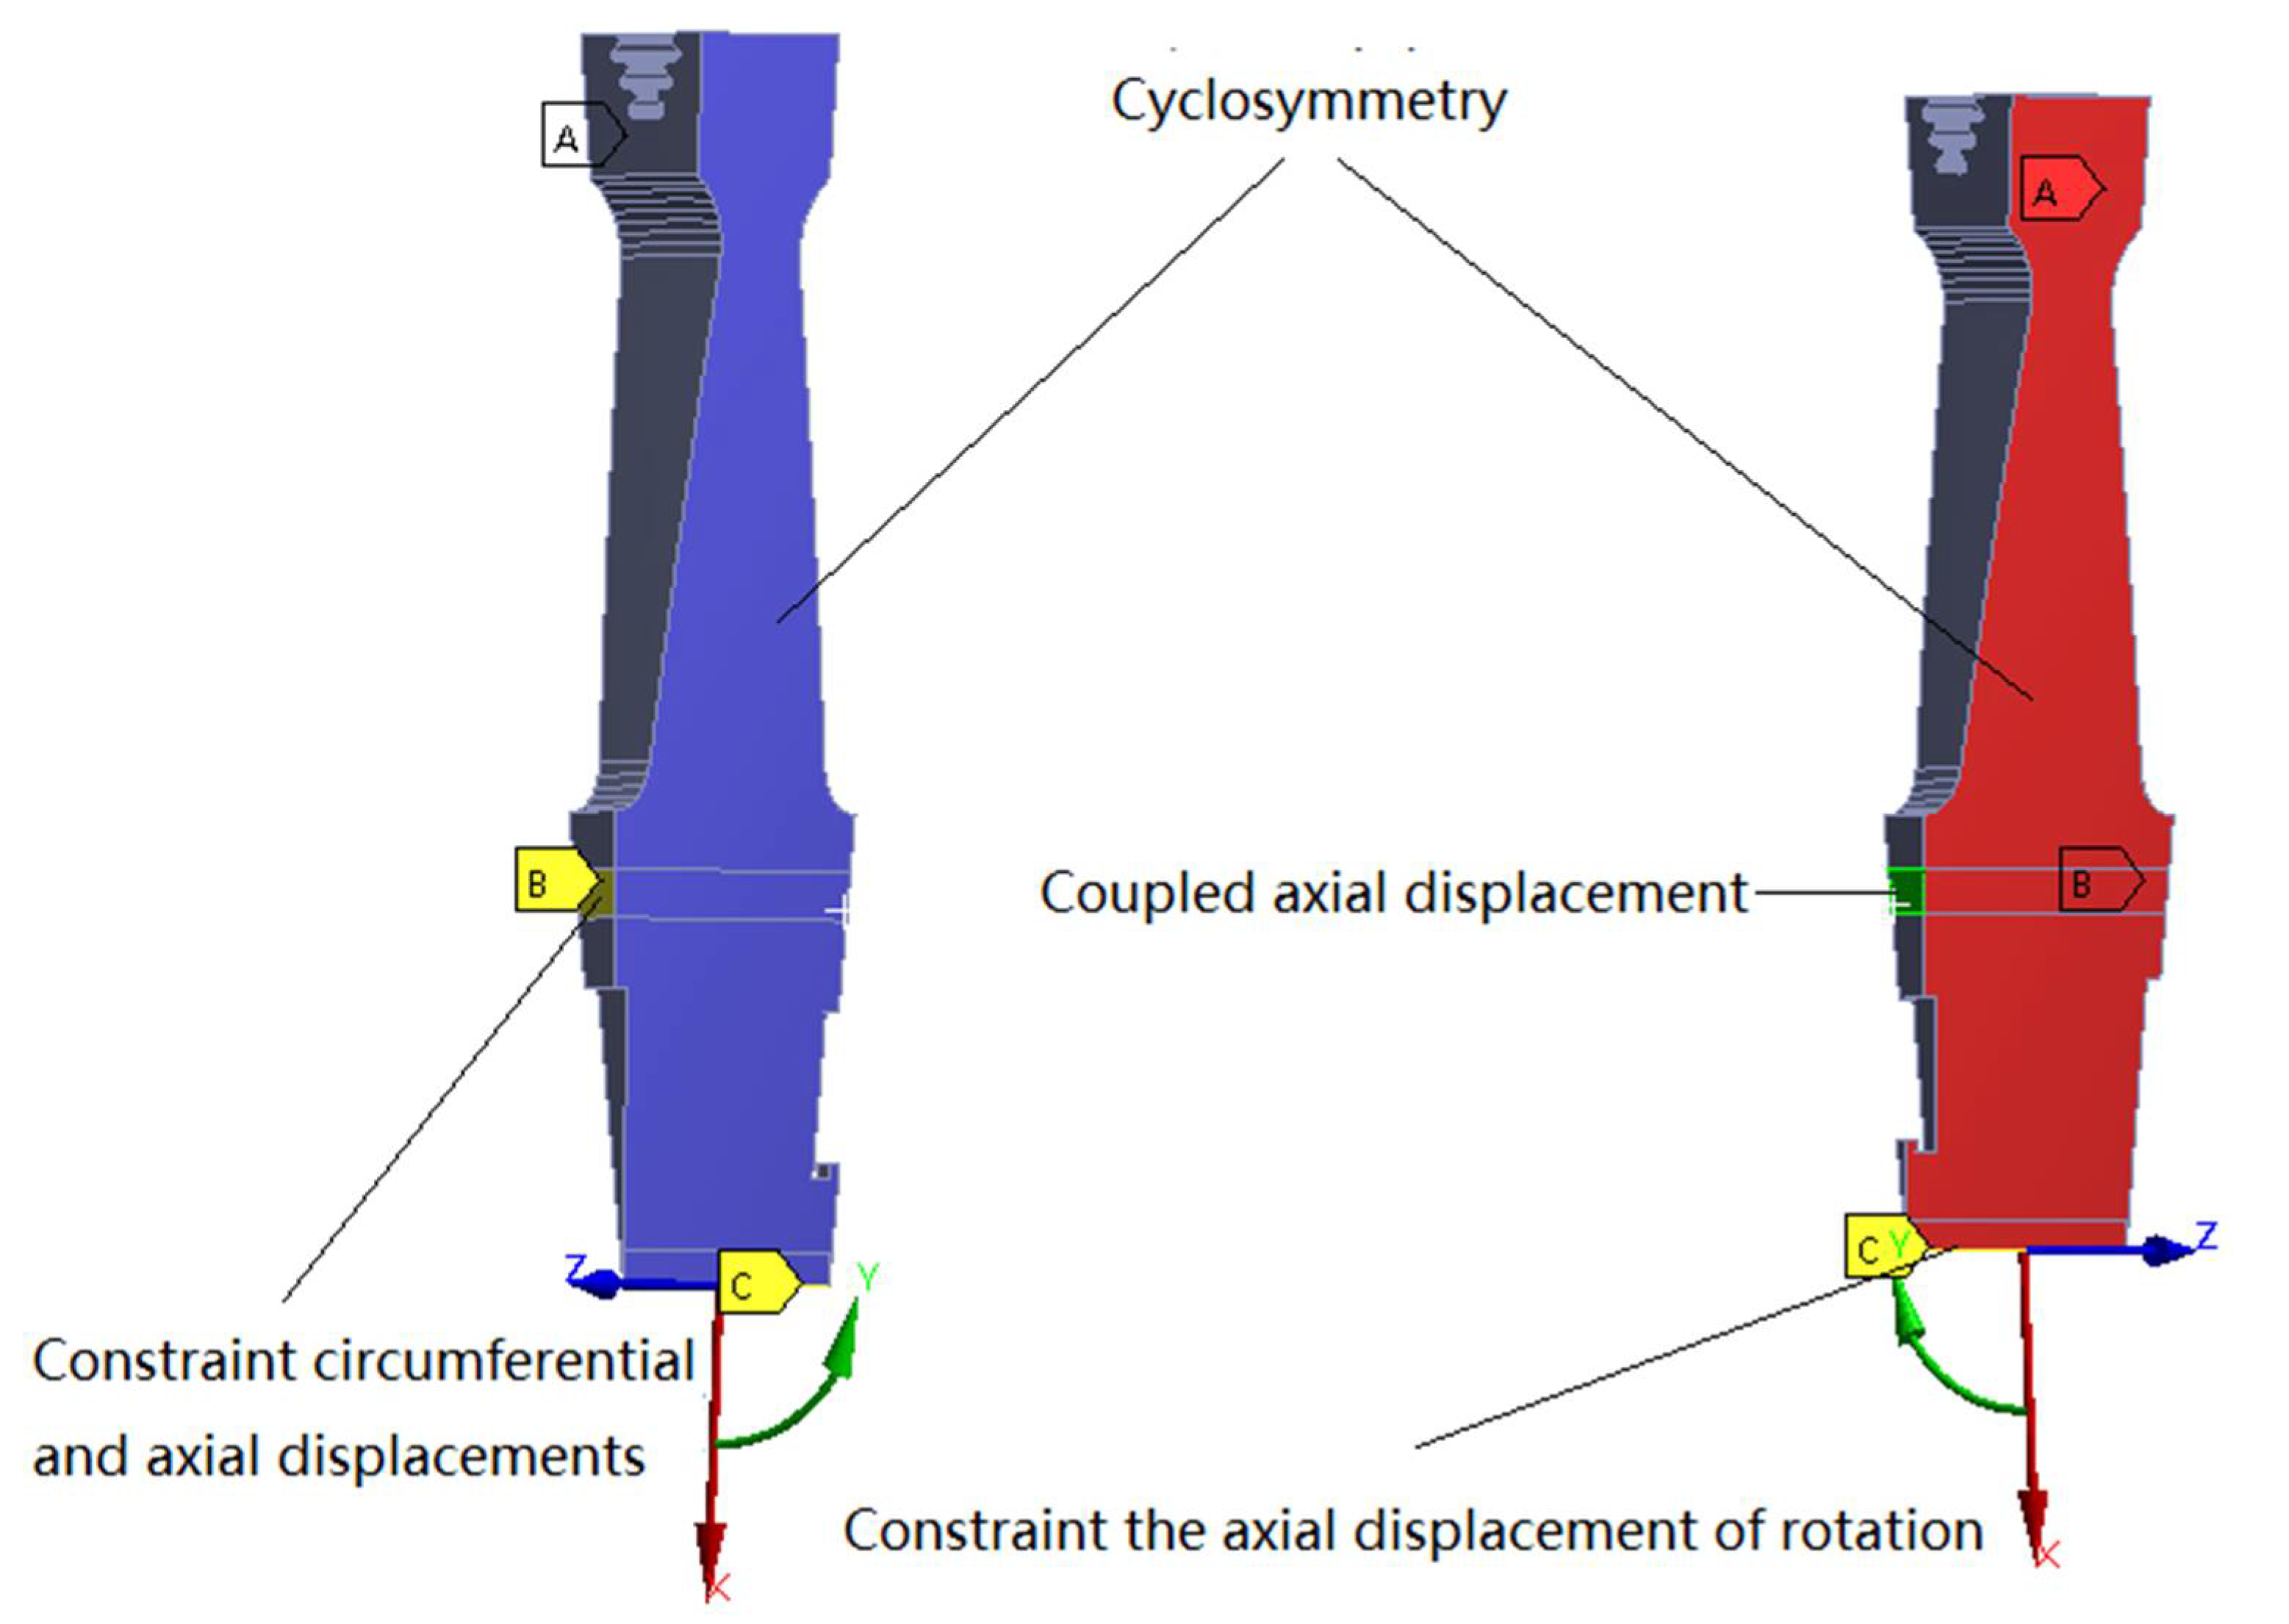
Figure 7.
Boundary conditions for static strength and natural frequency analysis.

Figure 8.
Cloud image of the fume pressure (P) distribution in the pitch diameter section: (a) Q1 (high-temperature fume flow rate: 1526.6 Nm3/min); (b) Q2 (high-temperature fume flow rate: 1796.0 Nm3/min); (c) Q3 (high-temperature fume flow rate: 2065.4 Nm3/min); (d) Q4 (high-temperature fume flow rate: 2334.8 Nm3/min). Note: “##e+**” means “## × 10**, such as “3.529e + 05” means “3.529 × 10⁵”.

Figure 9.
Pressure (P) distribution cloud image of the rotor blade working face in working conditions Q_1 to Q_4.
Figure 9.
Pressure (P) distribution cloud image of the rotor blade working face in working conditions Q_1 to Q_4.

Figure 10.
Pressure (P) distribution cloud image of the rotor blade non-working face in working conditions Q_1 to Q_4.
Figure 10.
Pressure (P) distribution cloud image of the rotor blade non-working face in working conditions Q_1 to Q_4.

Figure 11.
Pressure distribution of the rotor blade root, pitch diameter, and tip. (a) Q_1 (high-temperature fume flow rate: 1526.6 Nm3/min) (b) Q_2 (high-temperature fume flow rate: 1796.0 Nm3/min) (c) Q_3 (high-temperature fume flow rate: 2065.4 Nm3/min) (d) Q_4 (high-temperature fume flow rate: 2334.8 Nm3/min).

Figure 12.
Cloud images of the fume temperature (T) distribution in the diameter section.


Figure 13.
Fume velocity (V) distribution at the medium diameter section.


Figure 14.
Trajectory of the catalyst particles.

Figure 15.
Trajectory of the fume catalyst particles.


Figure 16.
Axial distribution of the fume catalyst particle erosion wears.


Figure 17.
Cloud images of the equivalent stress and total deformation of the blades.

Figure 18.
Cloud images of the equivalent stress distribution of disc.

Figure 19.
Cloud images of the equivalent stress and total deformation of the blades at rated flow.

Figure 20.
Cloud images of the equivalent stress distribution of the roulette disc.

Figure 21.
Cloud images of the equivalent stress and total deformation of the blades at 130% rated flow.
Figure 21.
Cloud images of the equivalent stress and total deformation of the blades at 130% rated flow.

Figure 22.
Cloud images of the equivalent stress distribution of the disc.

Figure 23.
Cloud images of the blade equivalent stress and total deformation at 85% rated flow.

Figure 24.
Cloud images of equivalent stress distribution of the disc.


Table 1.
Grid parameters of grid independence verification schemes.
| Schemes | One | Two | Three | Four |
|---|---|---|---|---|
| Grid data | 2,400,678 | 9,424,326 | 15,701,183 | 21,595,362 |
Table 2.
Numerical simulation parameters of the catalyst particle diameter study.
| High Temperature Fume Flow Rate [Nm3/min] | Inlet Temperature of the High Temperature Fume [K] | Speed of the Gas Turbine [r/min] | Catalyst Particle Concentration [g/m3] | Catalyst Particle Size [m] | |
|---|---|---|---|---|---|
| Q_1 | 1526.6 | 943.0 | 6263 | 0.13 | 1.5 × 10⁻⁶ |
| Q_2 | 1796.0 | 943.0 | 6263 | 0.13 | 1.5 × 10⁻⁶ |
| Q_3 | 2065.4 | 943.0 | 6263 | 0.13 | 1.5 × 10⁻⁶ |
| Q_4 | 2334.8 | 943.0 | 6263 | 0.13 | 1.5 × 10⁻⁶ |
Table 3.
Material properties of the gas turbine rotor.
| Structure Name | Material Grade | Working Temperature [°C] | Density [kg/m3] | Elastic Modulus [GPa] | Poisson’s Ratio | Yield Strength |
|---|---|---|---|---|---|---|
| Blade/disc | GH864 | 670 | 8220 | 186 | 0.300 | 720 |
Table 4.
Loading and boundary conditions.
| Analysis Type | Inclusion Model | Load Composition | Boundary Conditions |
|---|---|---|---|
| Static strength | Blade disc | Speed: 6263 rpm aerodynamic load | 1. The circumferential and axial displacements of the upstream side face of the bolt hole region of the constrained disc; 2. The axial displacement of the downstream side face of the bolt hole region of the coupling disc; 3. The radial displacement of the rotating shaft of the constrained disc; 4. The circular symmetry condition in the disc sector. |
Note: According to the aerodynamic load, the static strength analysis can be divided into four working conditions: 1 (no load), 2 (rated flow rate), 3 (large flow rate), and 4 (small flow rate).
Publisher’s Note: MDPI stays neutral with regard to jurisdictional claims in published maps and institutional affiliations. |
© 2021 by the authors. Licensee MDPI, Basel, Switzerland. This article is an open access article distributed under the terms and conditions of the Creative Commons Attribution (CC BY) license (https://creativecommons.org/licenses/by/4.0/).
Share and Cite
MDPI and ACS Style
Liu, G.; Sun, S.; Liang, K.; Yang, X.; An, D.; Wen, Q.; Ren, X. Simulation Study on the Effect of Flue Gas on Flow Field and Rotor Stress in Gas Turbines. Energies 2021, 14, 6135. https://0-doi-org.brum.beds.ac.uk/10.3390/en14196135
AMA Style
Liu G, Sun S, Liang K, Yang X, An D, Wen Q, Ren X. Simulation Study on the Effect of Flue Gas on Flow Field and Rotor Stress in Gas Turbines. Energies. 2021; 14(19):6135. https://0-doi-org.brum.beds.ac.uk/10.3390/en14196135
Chicago/Turabian StyleLiu, Guangkui, Sicong Sun, Kui Liang, Xisheng Yang, Dong An, Qi Wen, and Xiaohan Ren. 2021. "Simulation Study on the Effect of Flue Gas on Flow Field and Rotor Stress in Gas Turbines" Energies 14, no. 19: 6135. https://0-doi-org.brum.beds.ac.uk/10.3390/en14196135
Note that from the first issue of 2016, this journal uses article numbers instead of page numbers. See further details here.