Article

Sampling Rate Impact on Electrical Power Measurements Based on Conservative Power Theory

Electrical Engineering Department, Faculty of Engineering, Architecture and Urbanism and Geography—FAENG, Federal University of Mato Grosso do Sul—UFMS, Costa e Silva Avenue, Campo Grande 79070-900, MS, Brazil
*
Author to whom correspondence should be addressed.
Submission received: 24 June 2021 / Revised: 22 July 2021 / Accepted: 29 July 2021 / Published: 2 October 2021

Abstract

:
This article presents a study of the sampling rate effect on electrical power measurements whose definitions are based on the Conservative Power Theory (CPT). The definitions of active power and reactive power of the CPT were applied in the MATLAB® software by varying the sampling rate and using a digital power meter as a reference. The measurements were performed in scenarios with linear and non-linear loads. Due to the usage of an integral in the CPT calculus, an error was verified associated with the reactive power being inversely proportional to the sampling rate. From the present study, it is possible to conclude that depending on the sample rate, the errors associated with the reactive power measurements are unacceptable and make the CPT implementation unfeasible. The results also presented effective information about the minimal sampling rate needed to make these errors neglected and to assist in choosing suitable microprocessors for the digital implementation of the CPT. It is worth mentioning that this paper was limited to assess how accurate the measurements of active and reactive powers were and important to highlight that the CPT has the additional contribution of dealing with distortion currents and consequently new portions of powers. For the latter, the influence of sampling rate may be crucial and new lines of investigation are motivated.

Graphical Abstract

1. Introduction

The spread of non-linear loads in residential and industrial environments in recent years has had a considerable impact on electrical distribution grids since such loads cause harmonic distortions in current and/or voltage waveforms and imbalance in polyphase systems. Thus, the classical power theory, whose definitions apply exclusively to purely sinusoidal waveforms, has become inadequate to deal with the current and future scenarios.
Therefore, modern power theories have been proposed with the purpose of correctly analyze linear and non-linear loads, as proposed by Budeanu [1], Fryze [1], Buchholz [2], Depenbrock [2], Akagi [3], and Tenti [4]. Although Budeanu and Fryze developed contributions to single-phase systems, they noticed power portions linked to harmonic components, making compensation difficult. Buchholz extended Fryze’s theory to polyphase systems. From the works of Fryze and Buchholz, Depenbrock presented the first attempt to decompose current parcels in polyphase systems; however, their variables have no physical meaning. Akagi’s theory is based on the Clarke transform and was developed for three-phase systems in general. Such theory does not present a physical meaning to each portion of power or current; conversely, it can be very efficient to compensations with active power filters. The Conservative Power Theory (CPT) presented by Tenti, Matavelli, and Paredes [4], the focus of this work, proposes current decomposition in different quantities that contain specific physical meaning and can be applied to the obtainment of power and energy. This allows to correctly characterize loads and makes it possible to compensate the undesirable components of current.
The application of a power theory capable of dealing with distorted currents and voltages is significant; through more accurate power measurements and the detection of harmful electric current components, it is possible to perform corrective actions that assist in the efficient performance of the electrical system.
The CPT definitions can be used in shunt active power filters (SAPF) applications for any electrical systems, including in three-wire two-phase systems [5] and four-wire three-phase systems [6]. Ref. [7] proposes the application of a single-phase asymmetrical cascaded H-bridge multilevel inverter (ACHMI) in microgrids with non-linear loads, where the CPT is used to generate current references for the mitigation of disturbances.
The CPT is also used to compensate the distortion current and the reactive current of a single-phase system [8]. The used converter of a photovoltaic power generation system connected to the grid also acts as a shunt active filter using current portions obtained through the CPT. In Ref. [9], CPT is used for the same purpose as [8], but in a three-phase system. Ref. [10] proposes the application of CPT to identify and quantify different current references for disturbance mitigation through a grid-connected wind turbine system converter.
Besides that, CPT can be applied in load-sharing strategies between converters of a microgrid. Ref. [11] proposes an application of four-arm converters in a microgrid with a distributed communication network, where the theory is used to identify harmonic and unbalance components. Through the control algorithm and the communication network, it is possible to feed the converters with distortion and unbalance components requested by the loads, according to the capacity of each converter, avoiding the overload of one or more converters.
A load-sharing strategy based on a decision algorithm among two distributed energy sources connected to the grid was proposed in [12], where the CPT is applied to decompose the current into portions serving as a reference for the control system.
CPT definitions can be used to generate current references to be compensated by grid-connected multifunction inverters (MFGTIs) [13]. Ref. [13] proposes a platform composed of a control center and inverters with communication capability. The centralized control can send and receive data from the inverters remotely, allowing the microgrid operator to define and adjust inverter parameters indicating their functionality in each situation. The control center can send the distortion current and/or reactive current references to the inverters to carry out the compensation, which enables cooperation between the converters and between these and the passive compensators present in the network.
Ref. [14] proposes a “multi-master-slave” control strategy in an isolated microgrid where the current reference of the “slave” converter units is generated from the load currents. “Master” and “slave” converters are connected to a common bus, where the “slaves” inject their available energy to locally compensate for unwanted current components originating from non-linear and/or unbalanced local loads, and the “master” units share the remaining charge with distant groups.
Ref. [15] proposes the usage of load compliance factors calculated through CPT and the application of the pattern recognition method (K-Nearest Neighbor) to determine the most suitable compensators to improve the power factor and reduce losses on the network.
Refs. [16,17] used some of the modern power theories to analyze the error of the reactive power obtained from digital power meters and the power theories. In Ref. [16], there is no mention of sampling rate, and in [17] the authors adopted a 250 kHz sampling rate. The work in [18] used a sampling rate of 6 kHz to better reproduce the 25th harmonics of the load current. Ref. [19] proposes a three-phase power meter based in Fourier analysis. These papers do not focus on how the chosen sampling rate could affect the measurement errors. Additionally, the higher is the sampling rate, greater is the number of harmonics included in the calculus [20], and less error is achieved but without proper analysis.
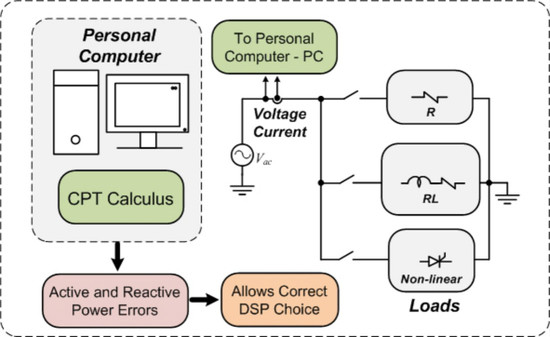
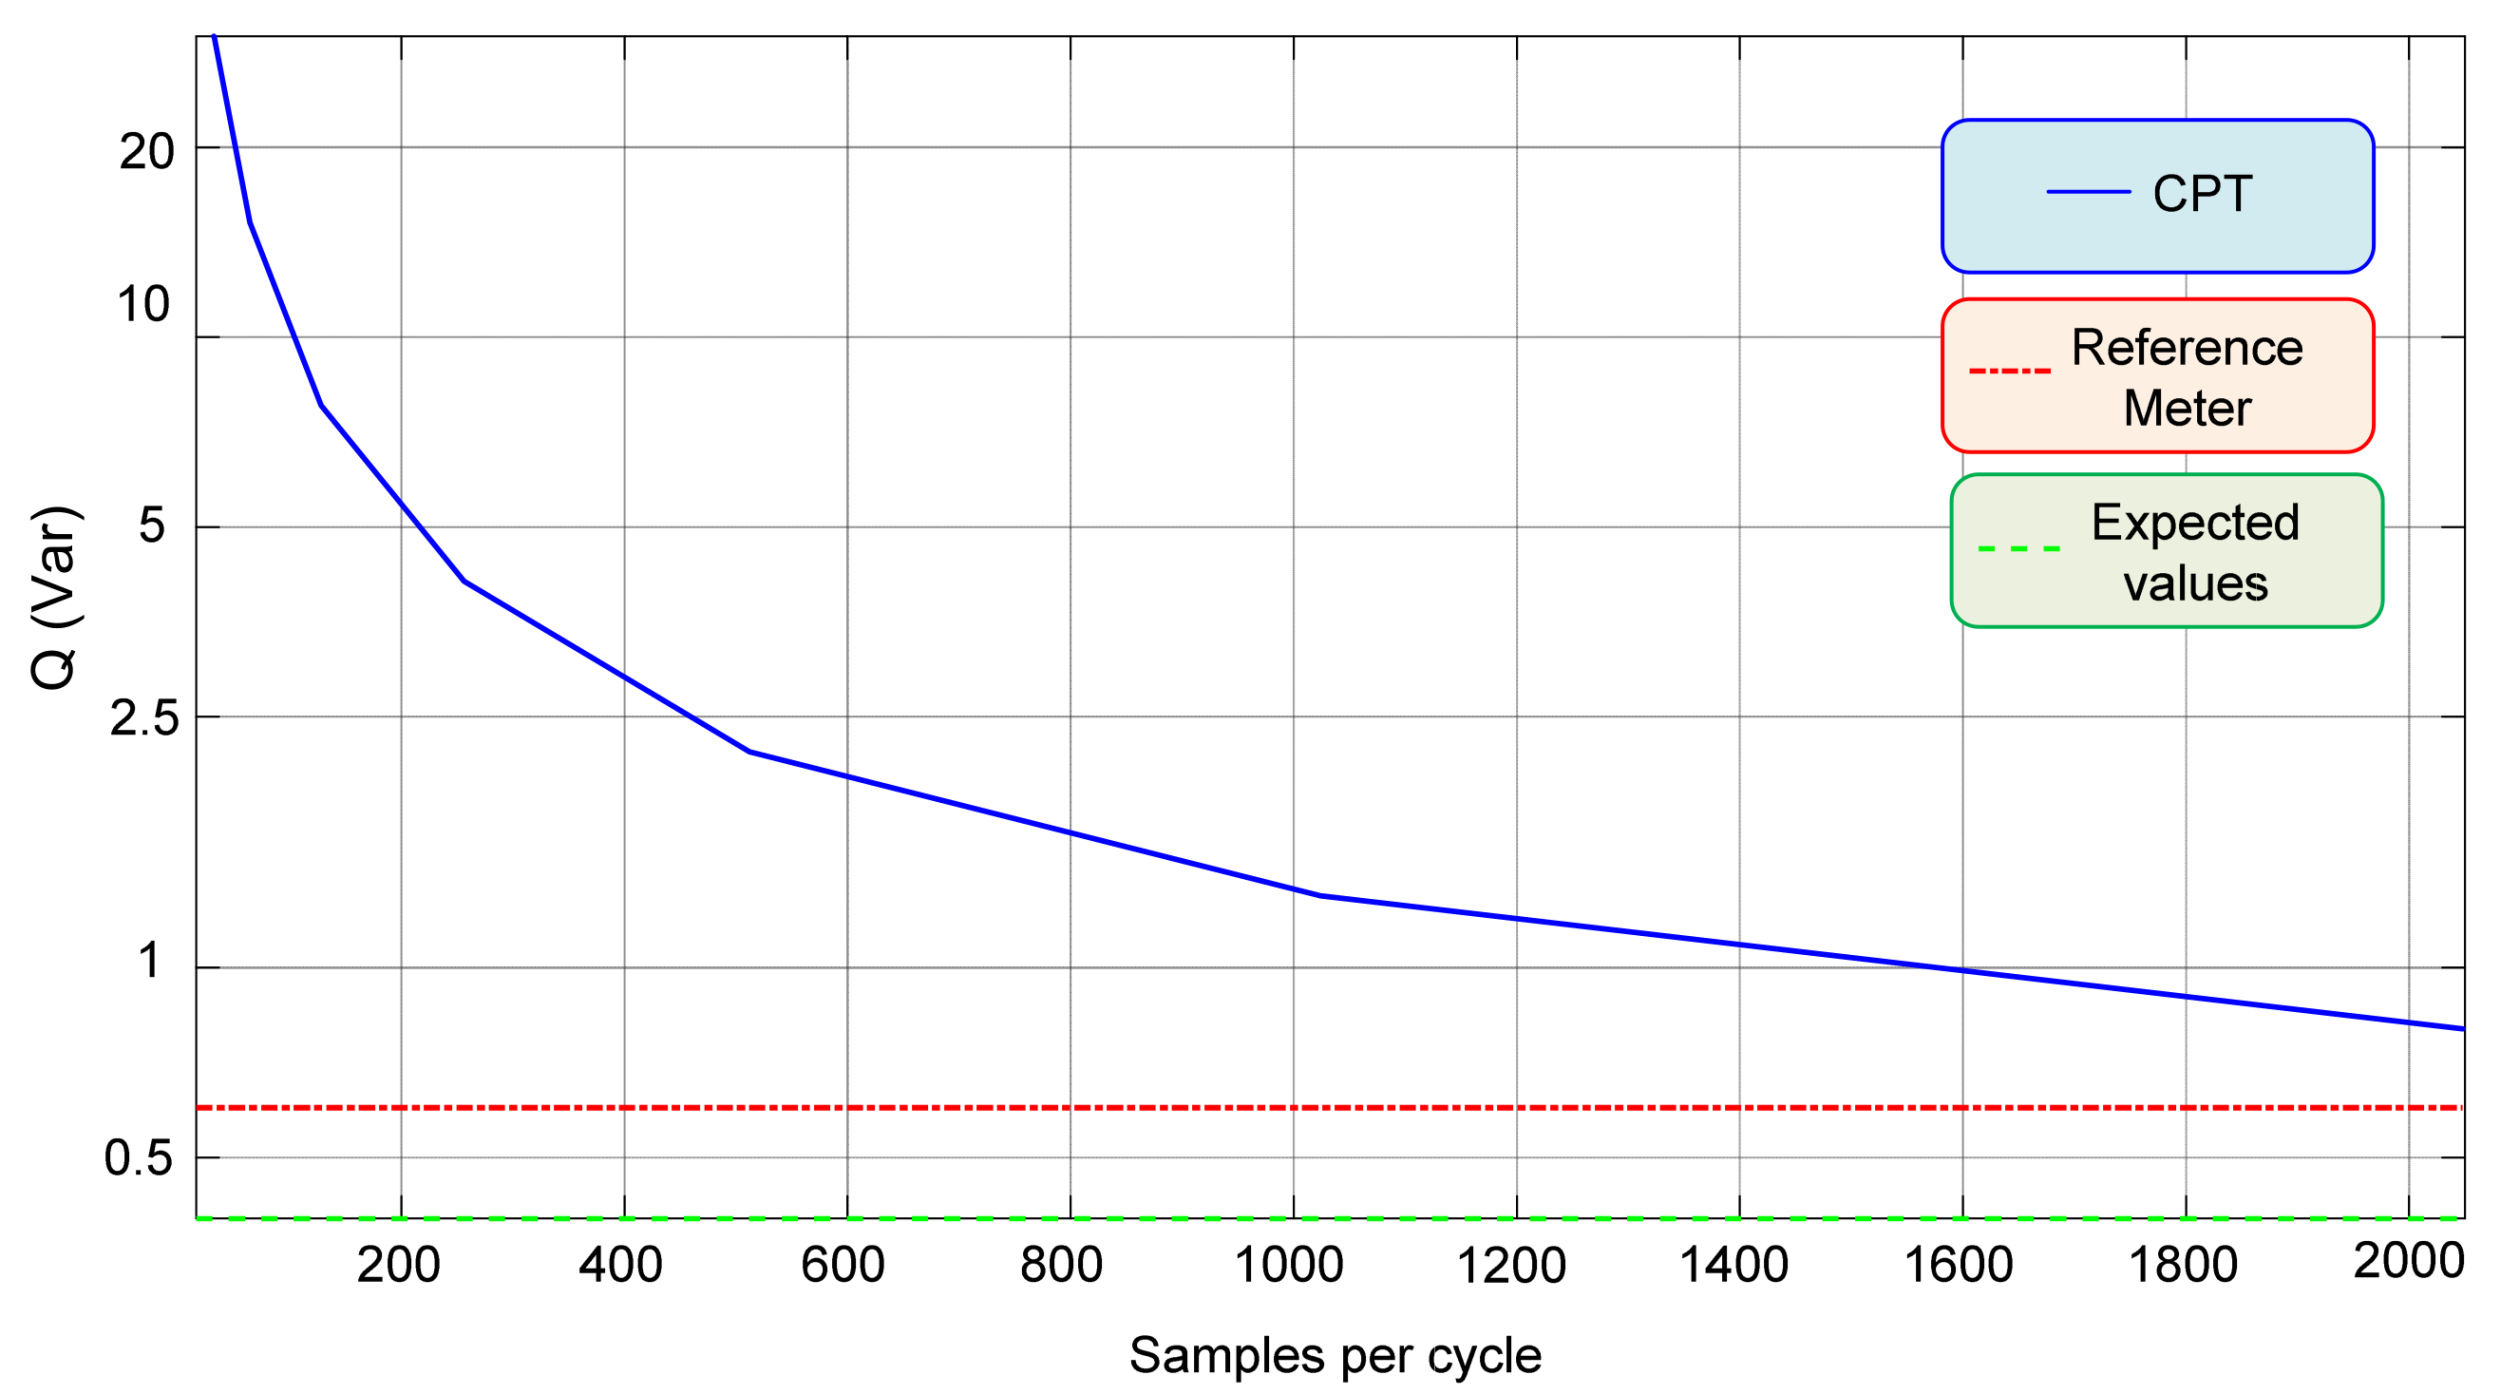
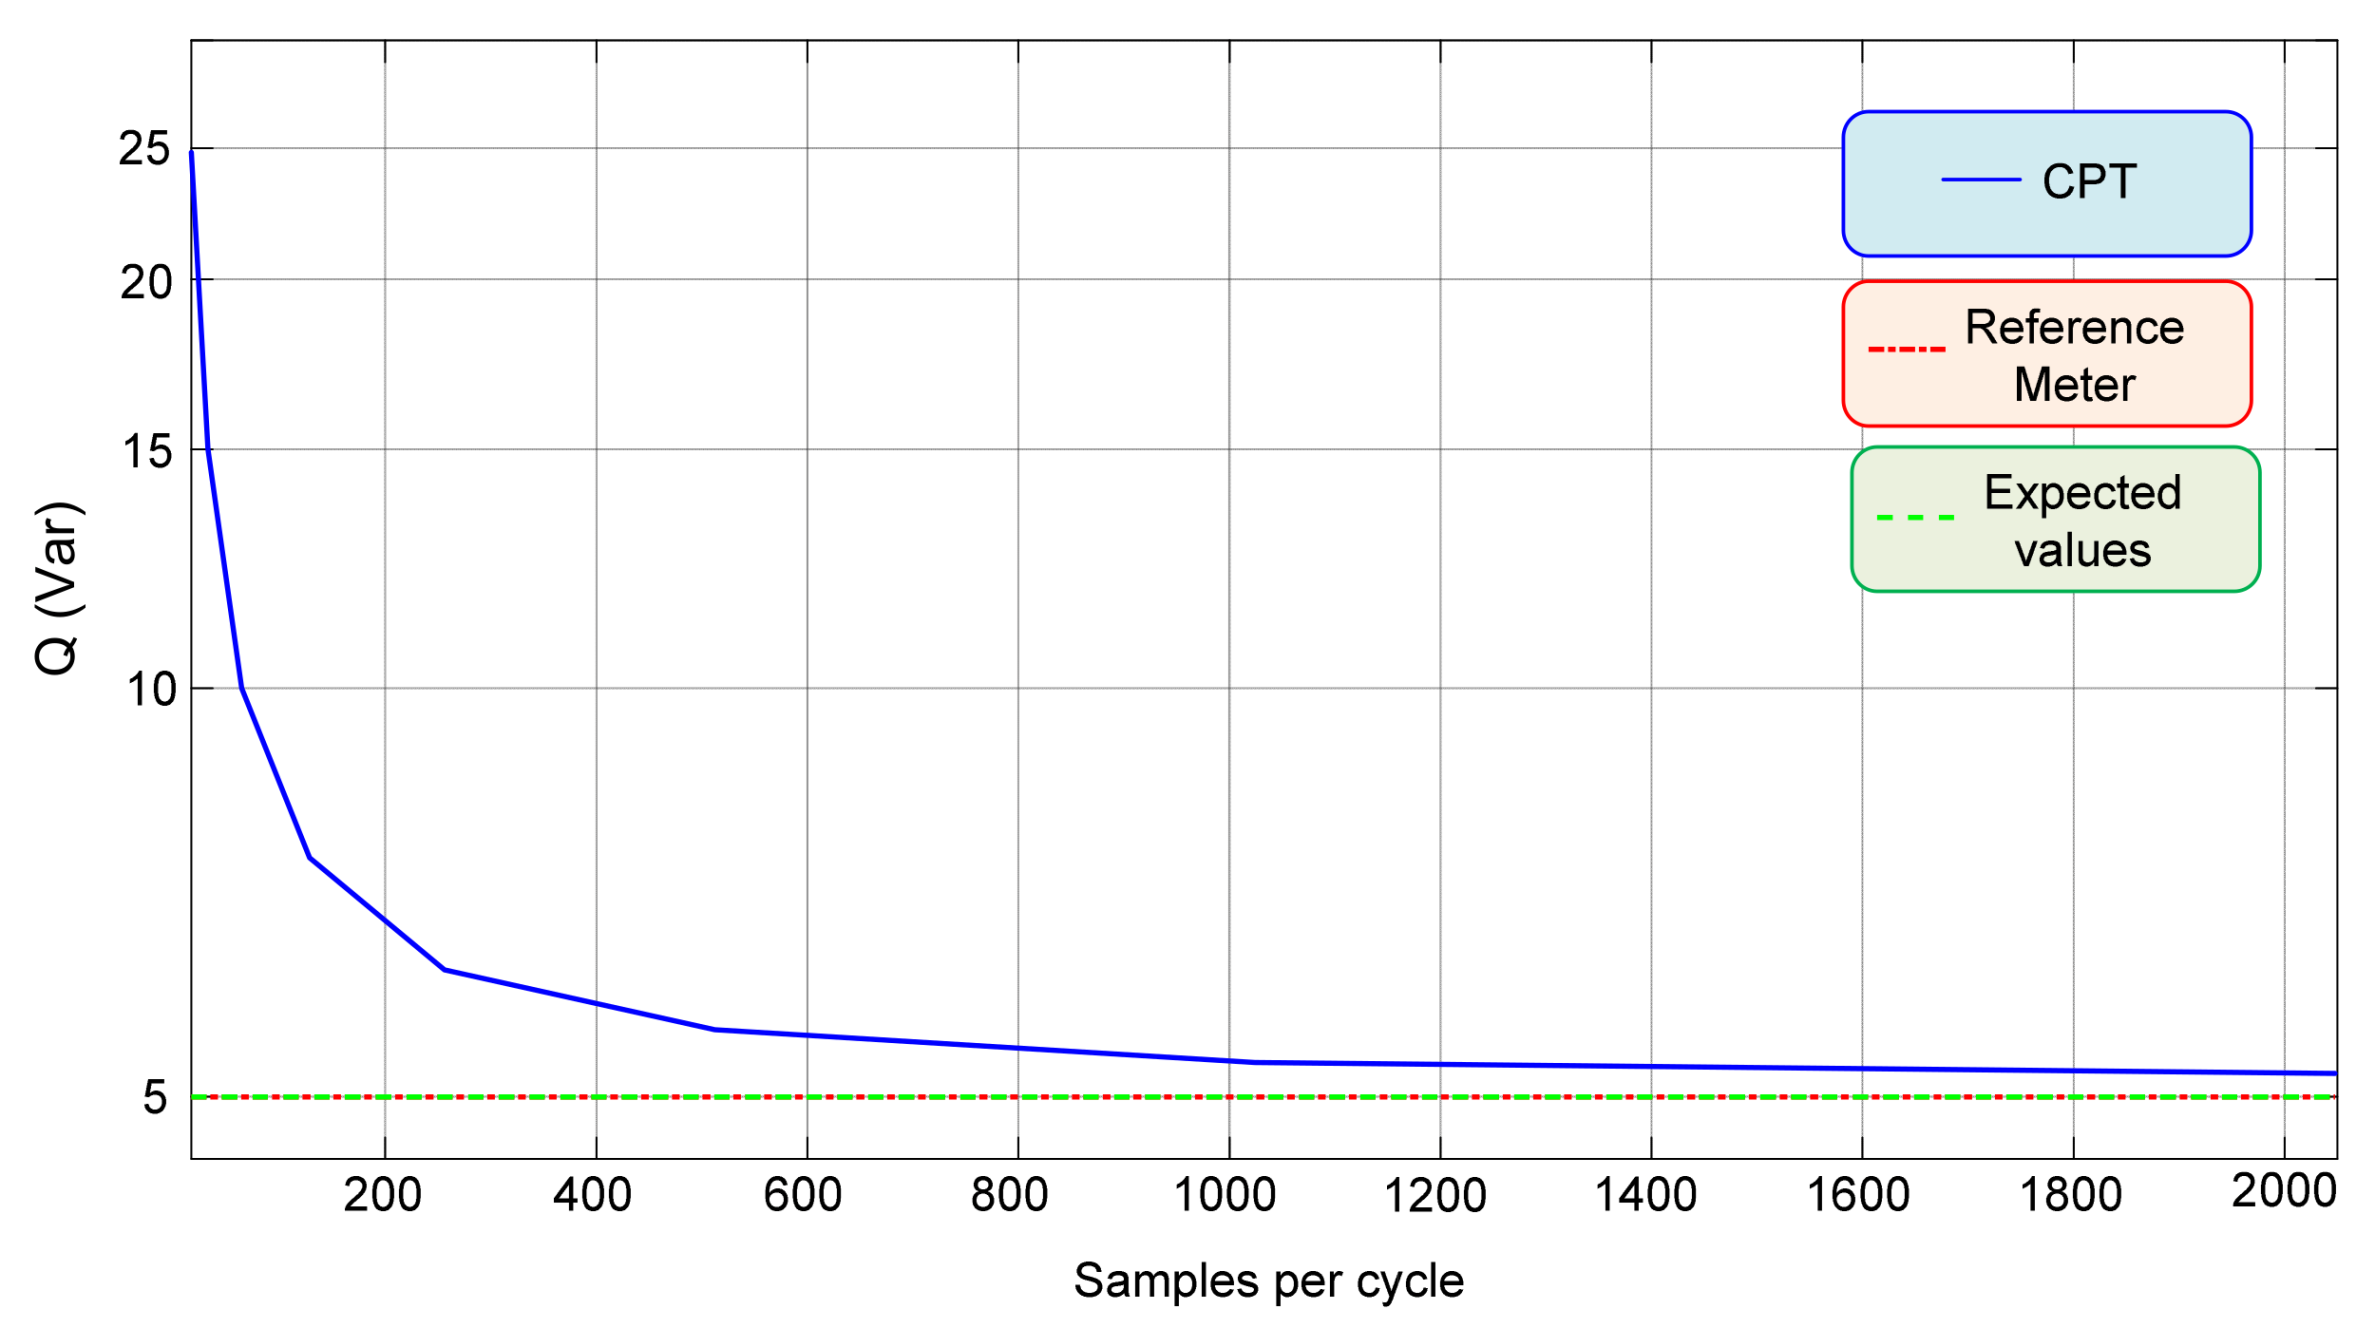
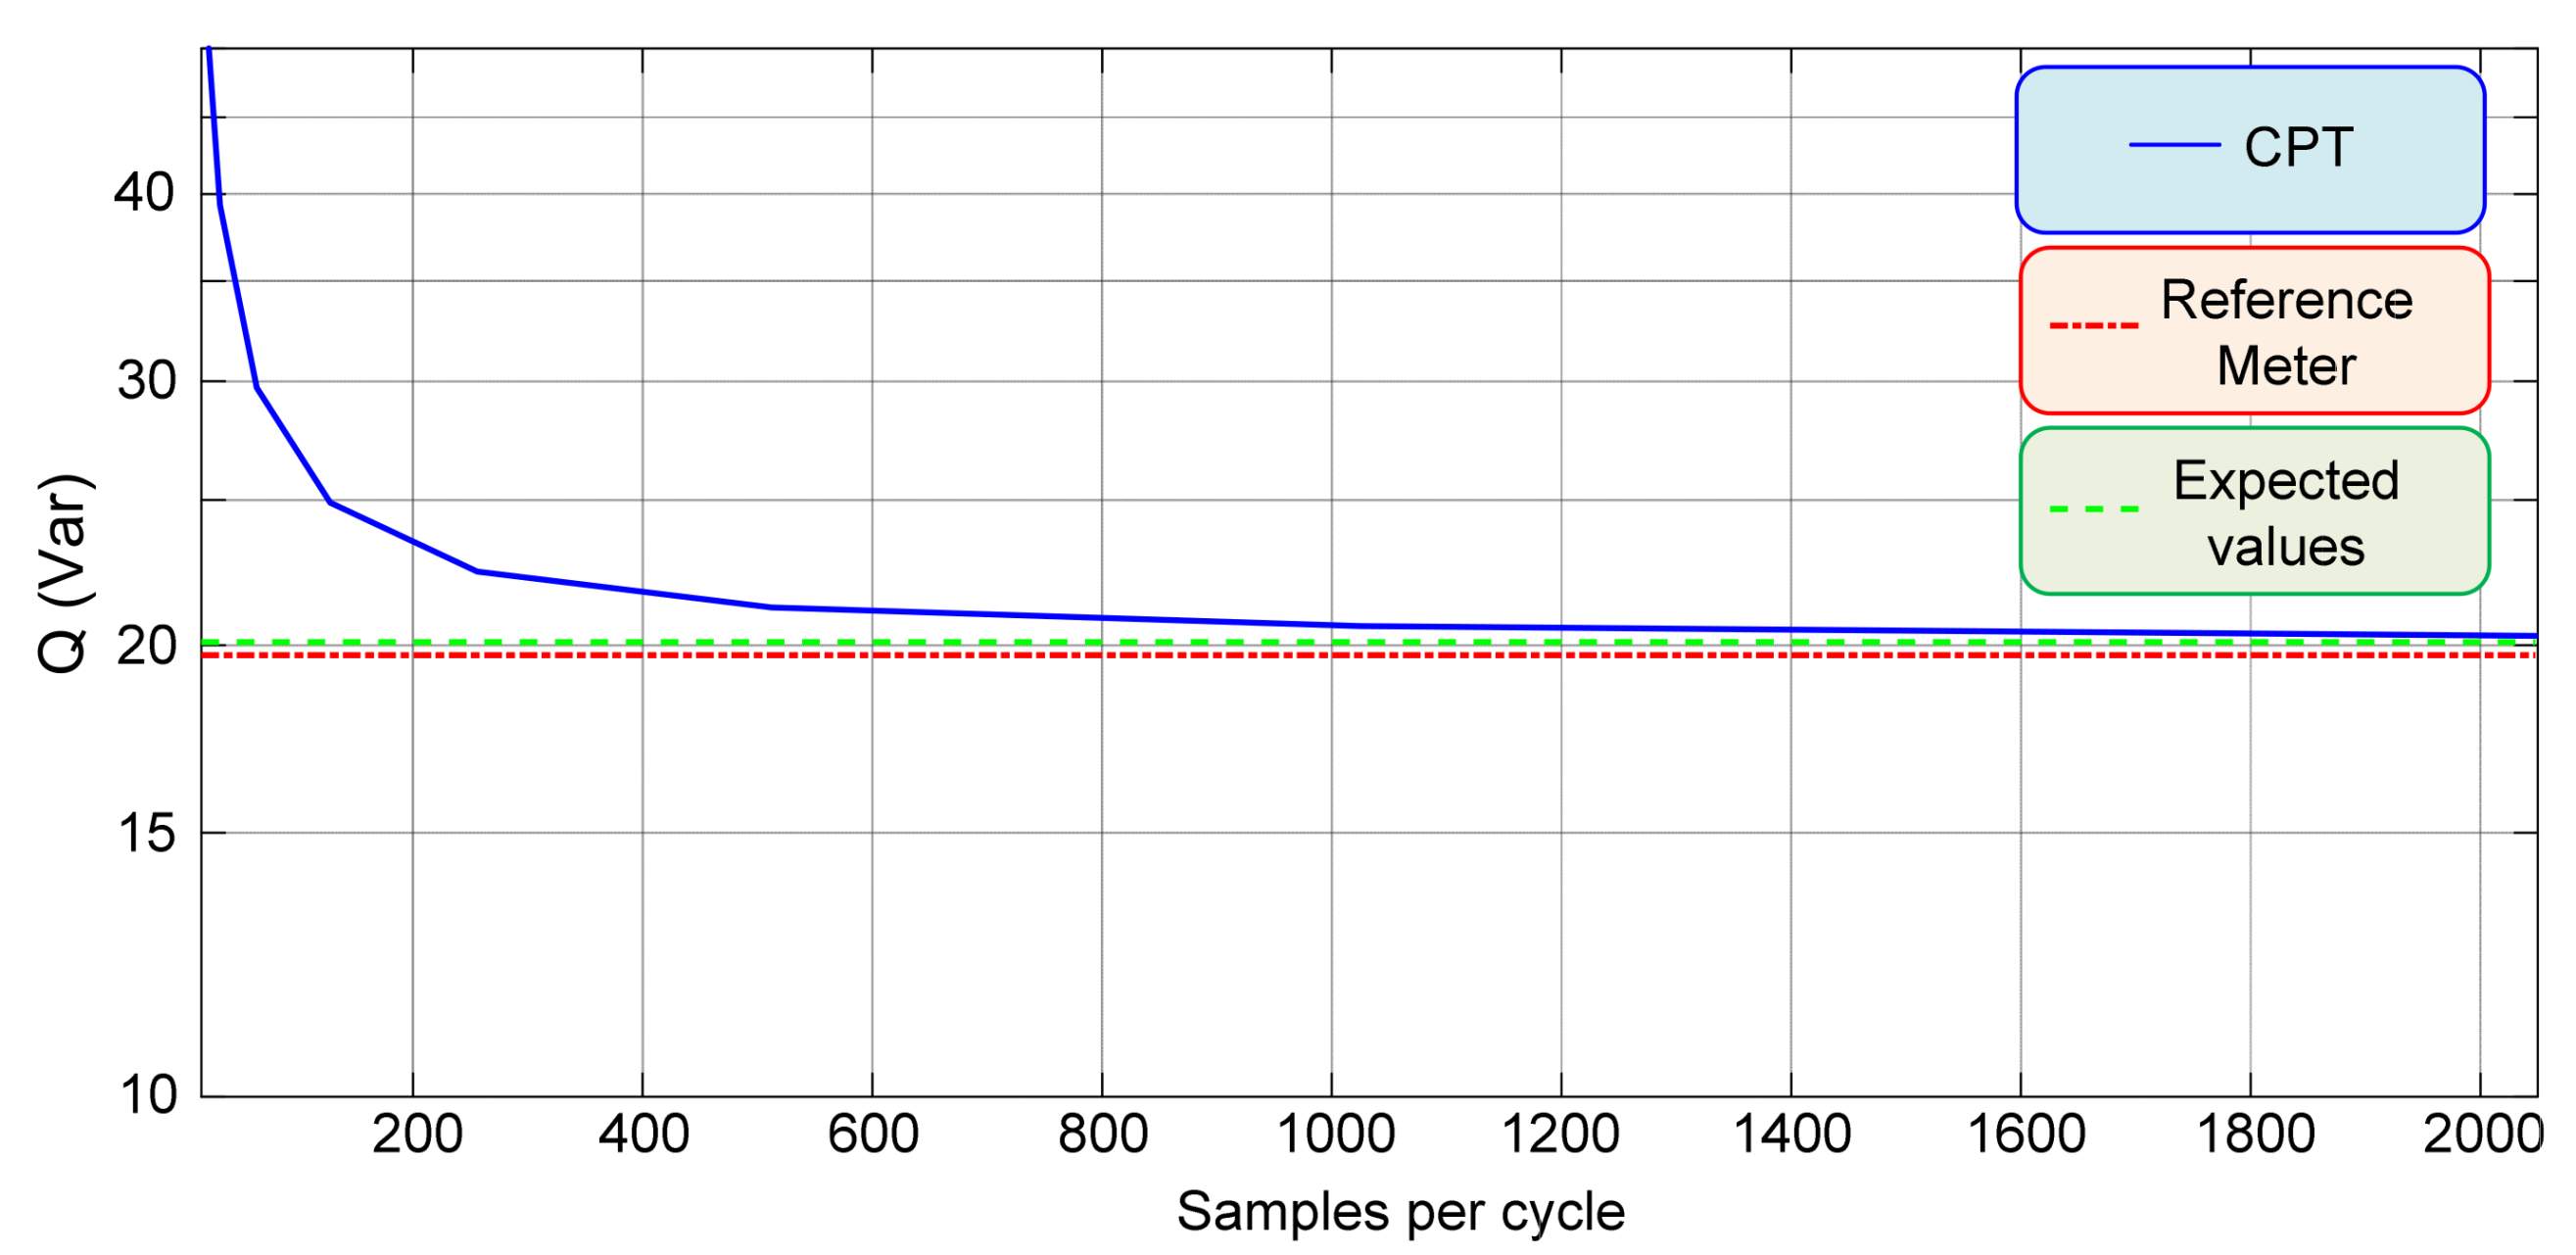
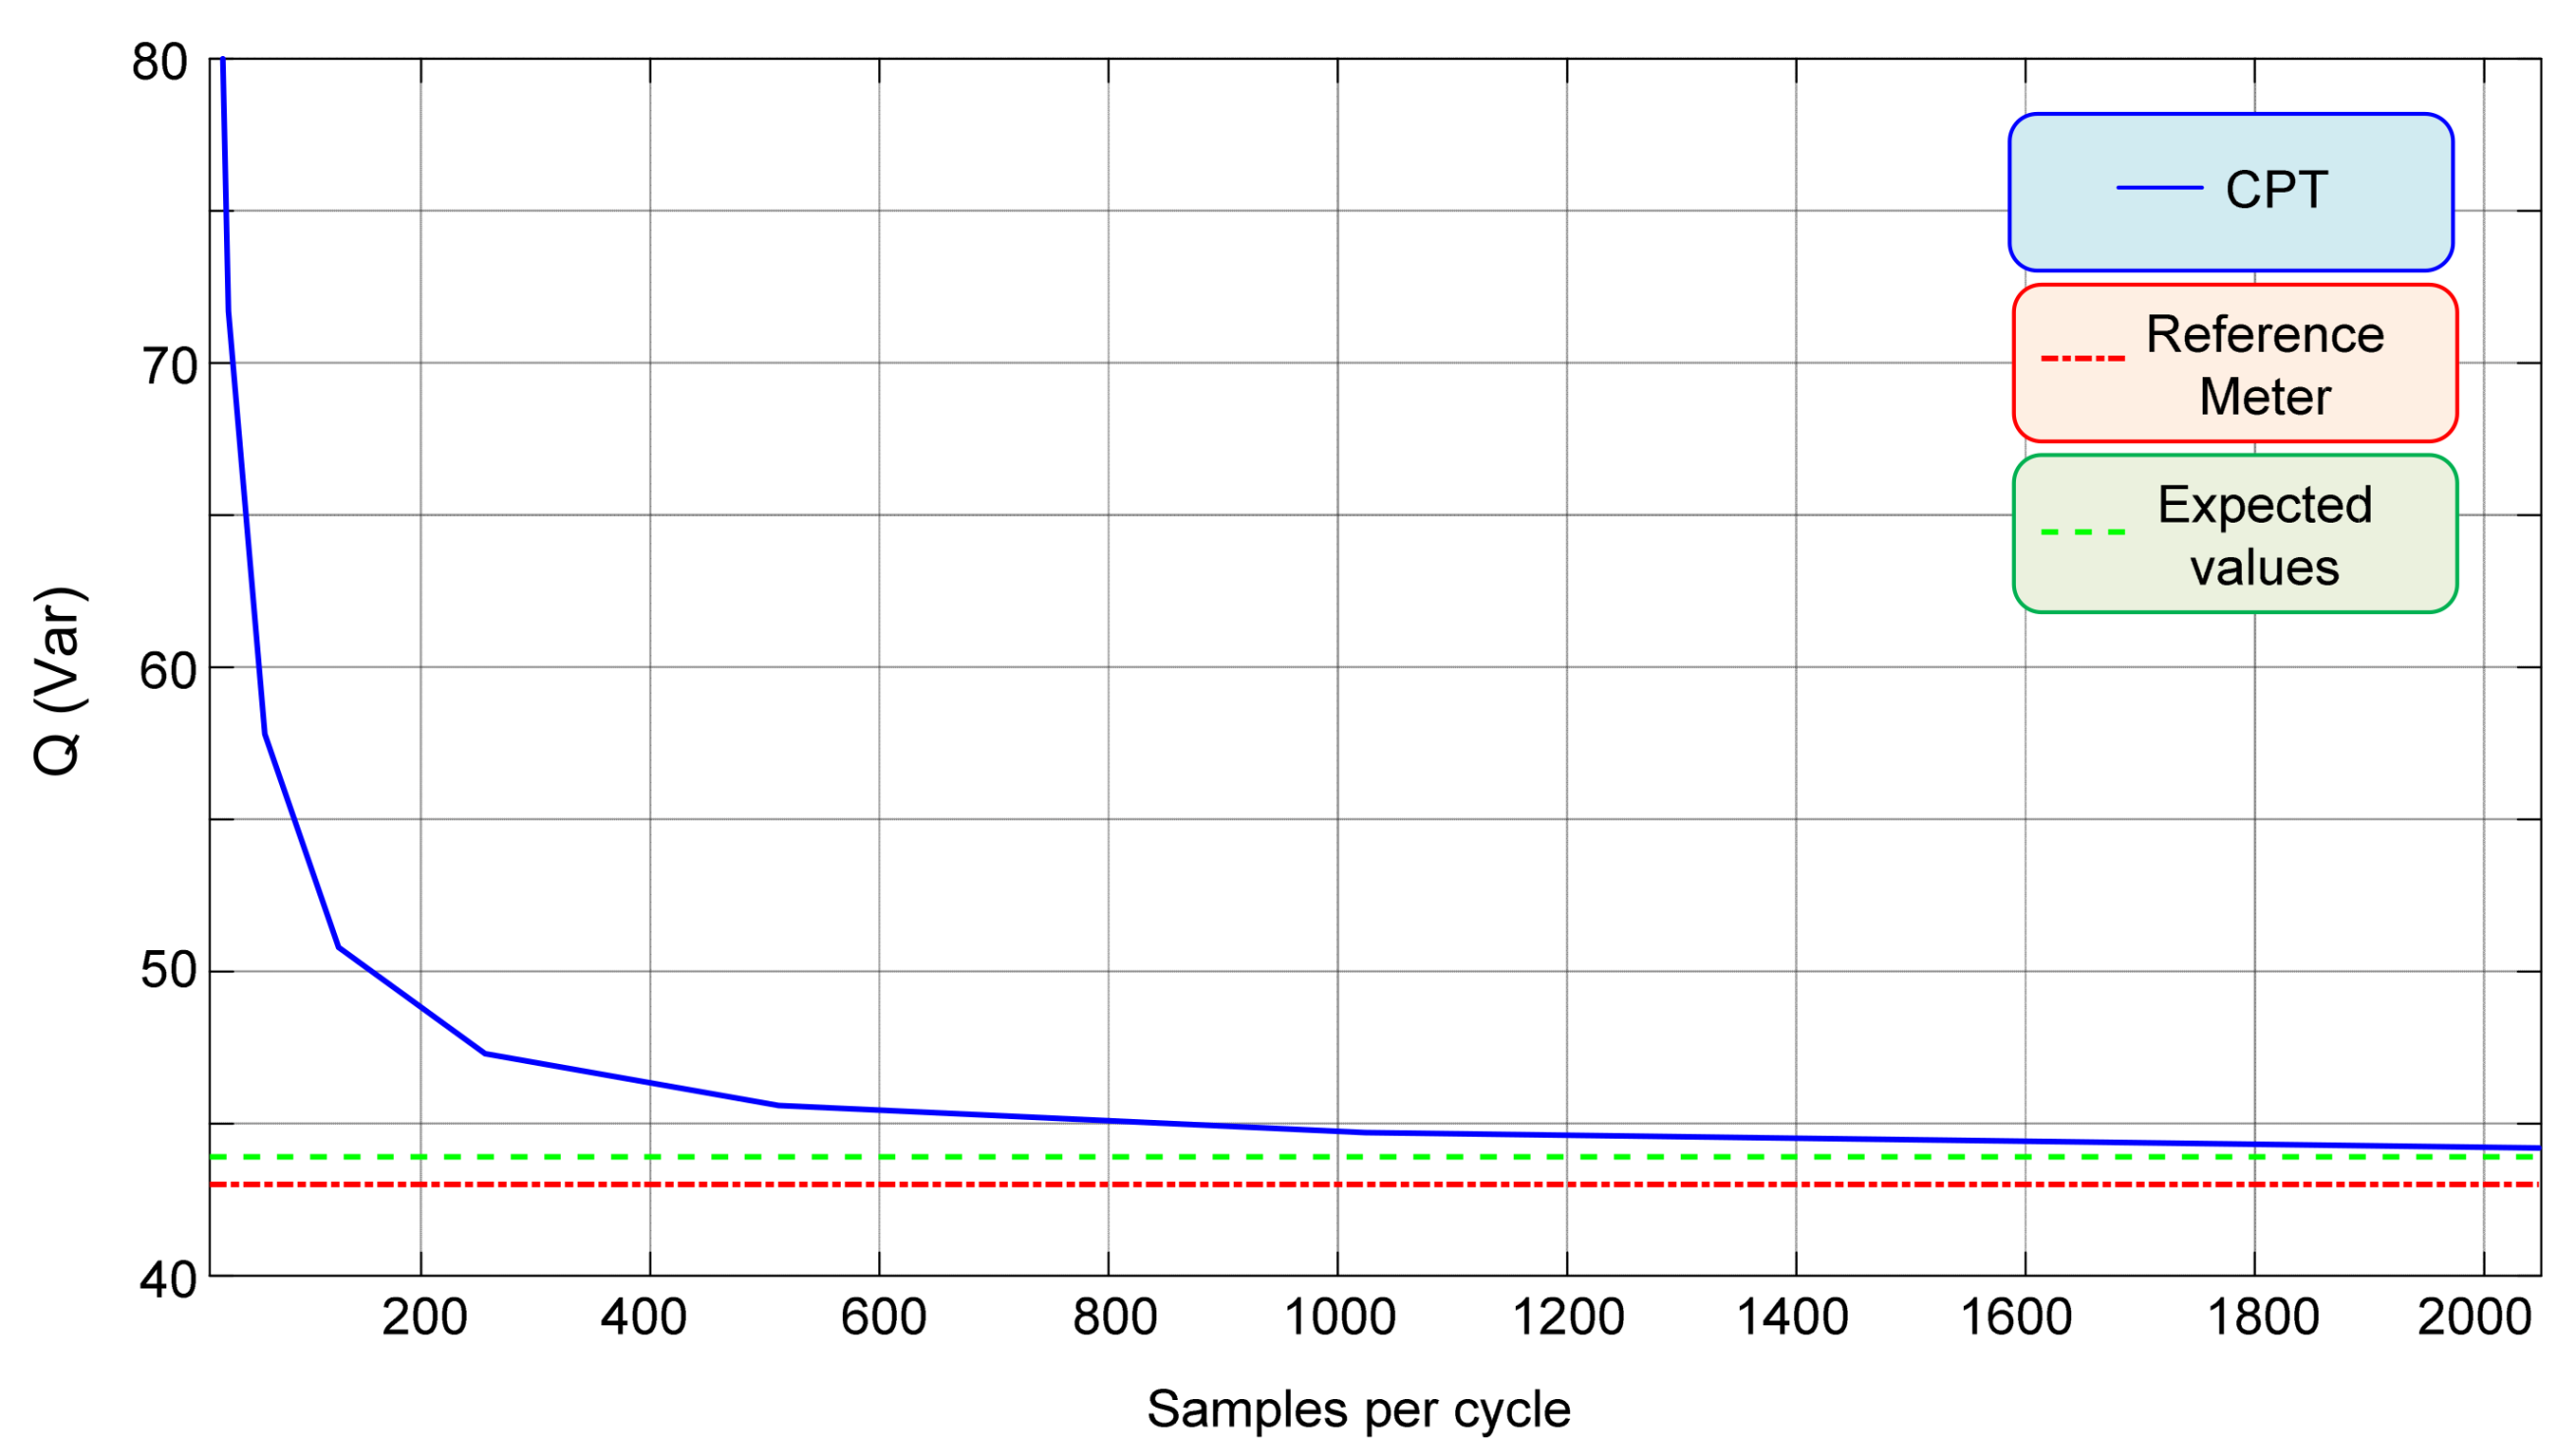
For the application of CPT in digital systems, it is necessary to define the sampling rate that will be used to perform the mathematical calculus. Based on this fact, this article assesses the influence of the sampling rate on the measurements of active power and reactive power with definitions based on CPT. The authors would like to highlight that this analysis is very important since it influences the choice of the most suitable microprocessor for the implementation of CPT. It is the first article in the literature that deals with the analysis of the sampling rate impact on the CPT measurements and, thus, its archival value.
This article is summarized as follows. In 
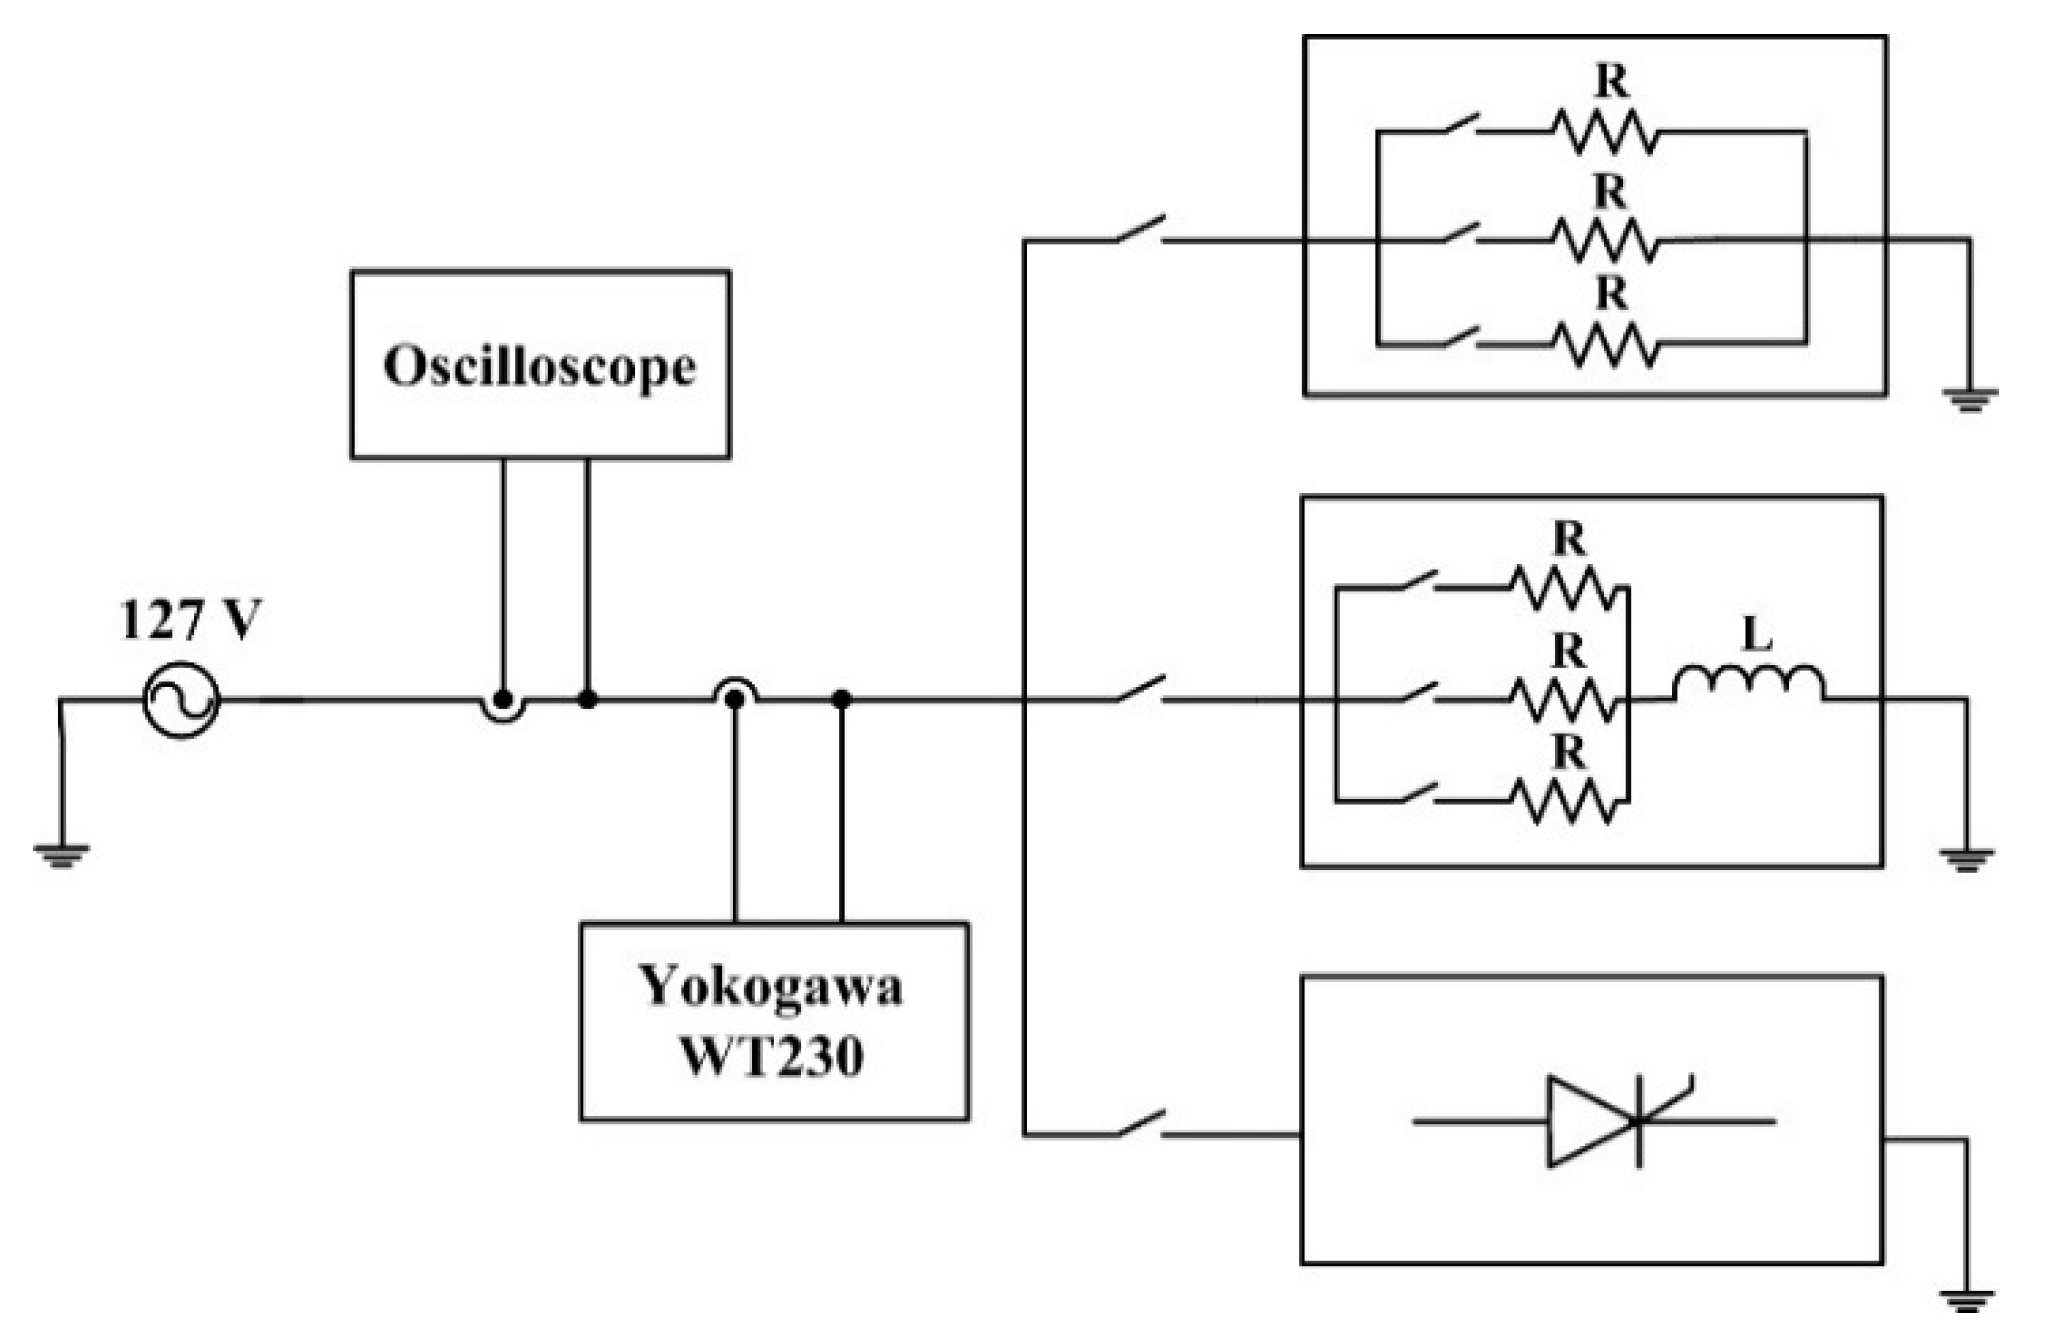
Section 2, the theoretical background of CPT is presented and the experimental arrangement is described. In Section 3, the obtained results are presented and discussed. Finally, Section 4 concludes the work.

2. Materials and Methods

2.1. Theoretical Background of CPT

CPT is called conservative, as it proves that even in non-sinusoidal conditions and in unbalanced polyphase systems, the terms of active power and reactive energy are conservative. Such theory defines its variables based on derivatives and integrals. The mathematical concepts used in the CPT are presented in sequence. To understand the definitions of CPT, some mathematical concepts defined under periodic hypothesis are made. Thus, operations are defined considering the period T, the fundamental frequency f, and the angular frequency ω. Table 1 presents a summary of the mathematical operations that define the main variables [4].
If the inner product of the periodic quantities x(t) and y(t) is null, it can be said that such quantities are orthogonal as Equation (1):
x , y = 0
The properties of the impartial integral and the time derivative are presented through Equations (2)–(6):
x , x ˘ = 0
x , x ^ = 0
x , y ˘ = x ˘ ,   y
x , y ^ = x ^ ,   y
x , y = x ˘ , y ^ = x ^ , y ˘  

2.2. Power, Energy and Current Terms

The instantaneous values of voltage and current used in the calculations of power and energy are represented by u and i, respectively. Additionally, U represents the effective (RMS) value of voltage and U ^ represents the RMS value of the impartial integral of voltage.
The single-phase instantaneous power is defined by the product between voltage and current as Equation (7):
p ( t ) = u ( t ) i ( t )
The single-phase reactive instantaneous energy is defined by the product between the impartial integral of voltage and current. It can be expressed by Equation (8):
w ( t ) = u ^ ( t ) i ( t )
The average value of single-phase active power is represented by Equation (9), being defined by the inner product between voltage and current.
P = p ¯ = u , i
The average value of single-phase reactive energy is defined by the inner product between the impartial integral of voltage and current, as Equation (10):
W = w ¯ = u ^ , i
According to [4], the reactive power is only conservative in situations of constant frequency and sinusoidal voltages, because it is associated with the line frequency ω and the voltage total harmonic distortion THD(u).
Q = U U ^ W = W U f   1 + ( T H D ( u ) ) 2 U ^ f   1 + ( T H D ( u ^ ) ) 2 = ω W 1 + ( T H D ( u ) ) 2 1 + ( T H D ( u ^ ) ) 2
According to [4], from the definitions of active power and reactive energy it is possible to decompose the current of a system with sinusoidal operation or not in different terms with physical meaning. Since the purpose of this article is limited to single-phase systems, the current decompositions will be restricted to this scenario.
The active current i a is the minimum current required for the supply of active power and is defined as Equation (12), where Ge is the equivalent conductance.
i a = u , i u 2 u = P U 2 u = G e u
The reactive current i r is the minimum current required for the supply of reactive energy and can be expressed by (13), where Be is the equivalent susceptance and U ^ is the effective value of the impartial integral of voltage.
i r = u ^ , i u ^ 2 u ^ = W U ^ 2 u ^ = B e u ^
The residual current i v is obtained from the total current by subtracting the portions of active and reactive current according to (14). This component does not transfer active power or reactive energy.
i v = i i a i r
Finally, considering the components orthogonality, Equation (15) is obtained from the effective current values:
I 2 = I a 2 + I r 2 + I v 2

2.3. Experimental Arrangement

With the aim of ascertaining the sampling rate effects, an experimental set consisting of linear and non-linear loads was constructed to verify the results in different scenarios. Thus, the system currents could be acquired at different sampling rates to perform power calculations based on CPT. Figure 1 represents the arrangement for data acquisition. The system effective supply voltage is 127 V, i.e., standard voltage at Brazil for single-phase loads. In the first scenario, only resistive loads are used in which the approximate value of each resistance is 138 Ω. The second scenario consists of an inductance with an approximate value of 20 mH which is series-connected with an array of resistive loads equivalent to those previously described. It is important to note that these values may vary mainly because of temperature variations and, thus, the importance of acquiring the loads’ data to perform the analysis. A non-linear load is applied in the last scenario, where a semi-controlled rectifier is used.
It is important to emphasize that the model was evaluated experimentally, and the results were validated based on statistical analysis. This content will be discussed in Section 3.
As a means to examine the interference of the sampling rate in the power calculus, the voltage and current samples were acquired from the oscilloscope, Agilent Technologies®, DSO7034A model. Six cycles of voltage and current were sampled. For CSV acquiring format, sampling is limited to 1000 points, so approximately 167 samples per cycle were acquired, which corresponds to 10 kHz sampling rate. The number of samples per cycle was computationally increased using linear interpolation performed by the Repeating Sequence block in MATLAB/Simulink®. Later, the high-frequency data were resampled at different frequencies to evaluate the power calculations in accordance with the CPT definitions.
As a reference comparison for the powers obtained from CPT, Yokogawa®-WT230, a digital power meter, was adopted. It presents power basic accuracy of 0.2% of reading, with the frequency ranging from DC, 0.5 Hz to 100 kHz, and the accuracy is assured from 5 mA to 26 A. The Yokogawa meter acquired the voltage and the current signals simultaneously with 51 kHz and 16-bit resolution.

3. Results and Discussions

3.1. Scenario 1—Resistive Load

The first test was carried out with resistive loads that were parallelized to vary the drained power. To obtain a standard as a reference measurement, the voltage and current load samples, for each situation, were acquired through the abovementioned oscilloscope. In the same way, as described in Section 2.3, 167 samples were collected per cycle. Using MATLAB/Simulink® the number of samples per cycle was increased as previously addressed, and subsequently, the data were used in the power calculations based on the calculation method used by the Yokogawa® meter [21], considering the harmonic spectrum up to the 15th order. It is worth mentioning that, for this scenario, the Fourier analysis demonstrated that the voltage harmonics, and consequently, the current harmonics are negligible. Therefore, the expected power values are shown in Table 2. The first table line indicates the use of a resistive load (R), and the subsequent lines indicate the usage of two (R/2) and three resistive loads (R/3) in parallel.
Table 3 shows the values of active power P and reactive power Q measured by the reference meter. Comparable with Table 2, the first line indicates the use of a resistive load, and the following lines show the respective use of two and three resistive loads in parallel. Table 3 also shows the mean power error regarding the reference meter in relation to the expected value, as well as the standard deviation of the error. Such values are used for the statistical analysis presented in Section 3.1.1.
Comparing Table 2 and Table 3, it is possible to observe that the maximum error of reactive power of the Yokogawa® meter was 0.2 VAr, and with respect to the active power, the maximum error was—6.9 W.
Table 4 and Table 5 show the results of active and reactive power obtained from the CPT calculations performed in MATLAB®. The first two lines of the tables indicate, respectively, the number of samples per cycle and the sampling frequency. Such as the previous tables, the first three lines indicate, respectively, the use of one, two, and three resistive loads in parallel. The last lines show the mean error of the CPT power in relation to the expected value, and the standard deviation of the error between the power of the CPT and the expected value.
The reactive power values approximate the measured and the expected references when the sampling rate is increased. The sampling rate significantly interferes with the calculation of Q due to the impartial integral. On the other hand, it appears that the values of active power are not influenced by the sampling rate. The convergence of reactive power can be visualized employing Figure 2, Figure 3 and Figure 4, where the graphs of the values calculated by the CPT and the measured and expected references are presented.

3.1.1. Statistical Analysis—Resistive Load

With a view to compare the mean error of the CPT with the mean error of the reference meter, it was proposed to carry out a hypothesis test for all sampling frequencies. For that, the null H 0 and alternative H 1 hypotheses presented in Equation (12) were tested. μ 1 corresponds to the mean error of the CPT and μ 2 represents the mean error of the reference meter.
{ H 0   :   μ 1 = μ 2 H 1   :   μ 1 > μ 2
It is assumed that unknown populations are normally distributed with variances σ 1 2 and σ 2 2 unknown. Thus, the t-statistic is applied to test the hypotheses. First, it is necessary to test the equality of the population variances; therefore, the hypothesis test was performed according to (13) for all frequency conditions, assuming a significance level α of 5% [22].
{ H 0   :   σ 1 2 = σ 2 2 H 1   :   σ 1 2   σ 2 2
The null hypothesis was rejected in most of the tests; consequently, it is assumed that the population variances are not equal, and the t-statistic is applied for this condition.
The calculation of t0 can be performed according to Equation (14) [22]. X ¯ 1 represents the sample mean of the CPT error and X ¯ 2 represents the sample mean of the reference meter error. 0 is the difference between μ 1 and μ 2 , which is equal to zero. S 1 2 refers to the sample variance of the CPT error and S 2 2 refers to the sample variance of the reference power meter error. n 1 and n 2 are the number of samples referring to the CPT error and the reference meter error.
t 0 = X ¯ 1 X ¯ 2 0 S 1 2 n 1 + S 2 2 n 2
The degree of freedom can be calculated according to Equation (15):
v = ( S 1 2 n 1 + S 2 2 n 2 ) 2 ( S 1 2 / n 1 ) 2 n 1 1 + ( S 2 2 / n 2 ) 2 n 2 1
Adopting α equal to 5%, the critical region, and the acceptance region are obtained for the hypotheses defined in Equation (12). H0 is rejected if t0 > tα, where v is the degree of freedom. Table 6 presents the degrees of freedom, the H 0 rejection criteria, the t0 values and the test conclusions for all frequency situations. The tests showed that with a 5% significance level, the mean error of active power calculated by the CPT via MATLAB® cannot be considered greater than the mean error of the reference meter in all cases. For reactive power, the null hypothesis cannot be rejected only from 512 samples per cycle, meaning that below 256 samples per cycle, the mean error of the CPT is greater than the reference, with 5% of significance.

3.2. Scenario 2—Resistive-Inductive Load

Equal to the previous scenario, the test was carried out differing only by inserting a 20 mH inductance in series with the resistive loads. To obtain the power reference measurements, procedures identical to those described for scenario 1 were performed. The expected power values are shown in Table 7 and the measurements referring to the reference meter, as well as the mean error and the standard deviation of the error between the reference meter and the expected values, are shown in Table 8.
Comparing Table 7 and Table 8, one may verify that the maximum reactive power error of the meter was—0.9 VAr. Table 9 and Table 10 show the results of active and reactive power calculated according to the CPT via MATLAB® with varying sampling frequency. The values of mean error and the standard deviation of the CPT in relation to the expected values are also presented.
It is noticed that similarly to the first scenario, the sampling rate has no influence on the results of active power and, it is proved that the calculated values of reactive power are close to the expected values with the increase of the sampling rate. The convergence of power as a function of the sampling rate is shown in Figure 5, Figure 6 and Figure 7.

Statistical Analysis—Resistive-Inductive Load

For the resistive-inductive load, a procedure similar to that described in Section 3.1.1 was performed to test the hypotheses according to (12). Like scenario 1, an unknown population with normal distribution, unknown and unequal variances is assumed. Table 11 shows the degrees of freedom, the H 0 rejection criteria, the t0 results, and the test conclusions for all sampling frequency conditions.
The tests indicate that for the active power, the null hypothesis cannot be rejected in any frequency situation with a 5% significance level. It is also verified that the mean error of reactive power of the CPT is greater than the mean error of the reference meter for sampling frequencies less than 122.88 kHz.

3.3. Scenario 3—Non-linear Load

For this scenario, the test was performed using a semi-controlled rectifier as a load supplying a resistive load at the output. The experiment was carried out by varying the firing angle and monitoring the active and reactive powers. To demonstrate the waveforms that feed the rectifier, Figure 8 depicts the voltage and current for a 90° firing angle.
Table 12 presents the results of the harmonic spectrum of the current corresponding to Figure 8. There is a phase lag of 29.8° in the fundamental current component. This means that although the load is not reactive, the firing angle causes the fundamental of current to lag in relation to the supply voltage.
Similar to what was done in the previous scenarios, from the voltage and current signals, the values of the active and reactive powers were calculated by applying the power calculation method used by the Yokogawa® meter in MATLAB/Simulink®, considering harmonics up to the 15th order. The expected values for the non-linear load with different thyristor firing angles are shown in Table 13.
As the distortions in the voltage waveform are negligible, it is concluded that the reactive energy will depend exclusively on the fundamental parts of voltage and current. Thus, to obtain a second reference measurement, it was decided to use a method common to low-cost meters, which does not deal with harmonic distortions in the voltage and current waveforms. These power calculations were performed by a specific block in MATLAB/Simulink®. Table 14 shows the calculated values, as well as the mean error between the calculated and the expected values and the standard deviation of the error.
Table 15 and Table 16 show the results of active and reactive power of the CPT obtained from MATLAB®. The first lines of the tables indicate the number of samples per cycle and the sampling frequency. The lines in the first column indicate the firing angle of the rectifier thyristors. The mean error and the standard deviation of the error of the CPT in relation to the expected value are also presented.
Due to the increase in the firing angle, the fundamental component of the current is lagged in relation to the voltage, which justifies the high values of reactive power even though the load is not reactive. Although it is not the purpose of the article, it is interesting to highlight the presence of reactive energy due to the non-linearity of the load, which justifies the usage of power theories capable of attributing physical meaning to the loads and dealing with voltage and current distortions. Table 15 and Table 16 also confirm the great interference of the sampling rate in the calculation of reactive power.
The reactive power in relation to the number of samples per cycle for the non-linear load with firing angles of 0°, 30°, 60° and 90° are shown in Figure 9.

Statistical Analysis—Non-Linear Load

The same process detailed in the previous scenarios was carried out for the hypotheses indicated in Equation (12). However, the mean error of the CPT will be compared to the mean error of the calculated values with the fundamental components. Therefore, μ 1 represents the mean power error calculated by the CPT in relation to the expected values, and μ 2 corresponds to the mean error calculated only with the fundamental components in relation to the expected values. The results of the hypothesis test for the non-linear load are shown in Table 17.
Like the previous scenarios, the mean error values of the active power can be considered equal regardless of the frequency. For the reactive power, with a 5% significance level, the hypothesis can be rejected for sampling frequencies below 122.88 kHz, corresponding to 2048 samples per cycle.

4. Conclusions

This article presented as the main contribution the analysis of the sampling rate as an influence factor in electrical power measurements based on the Conservative Power Theory.
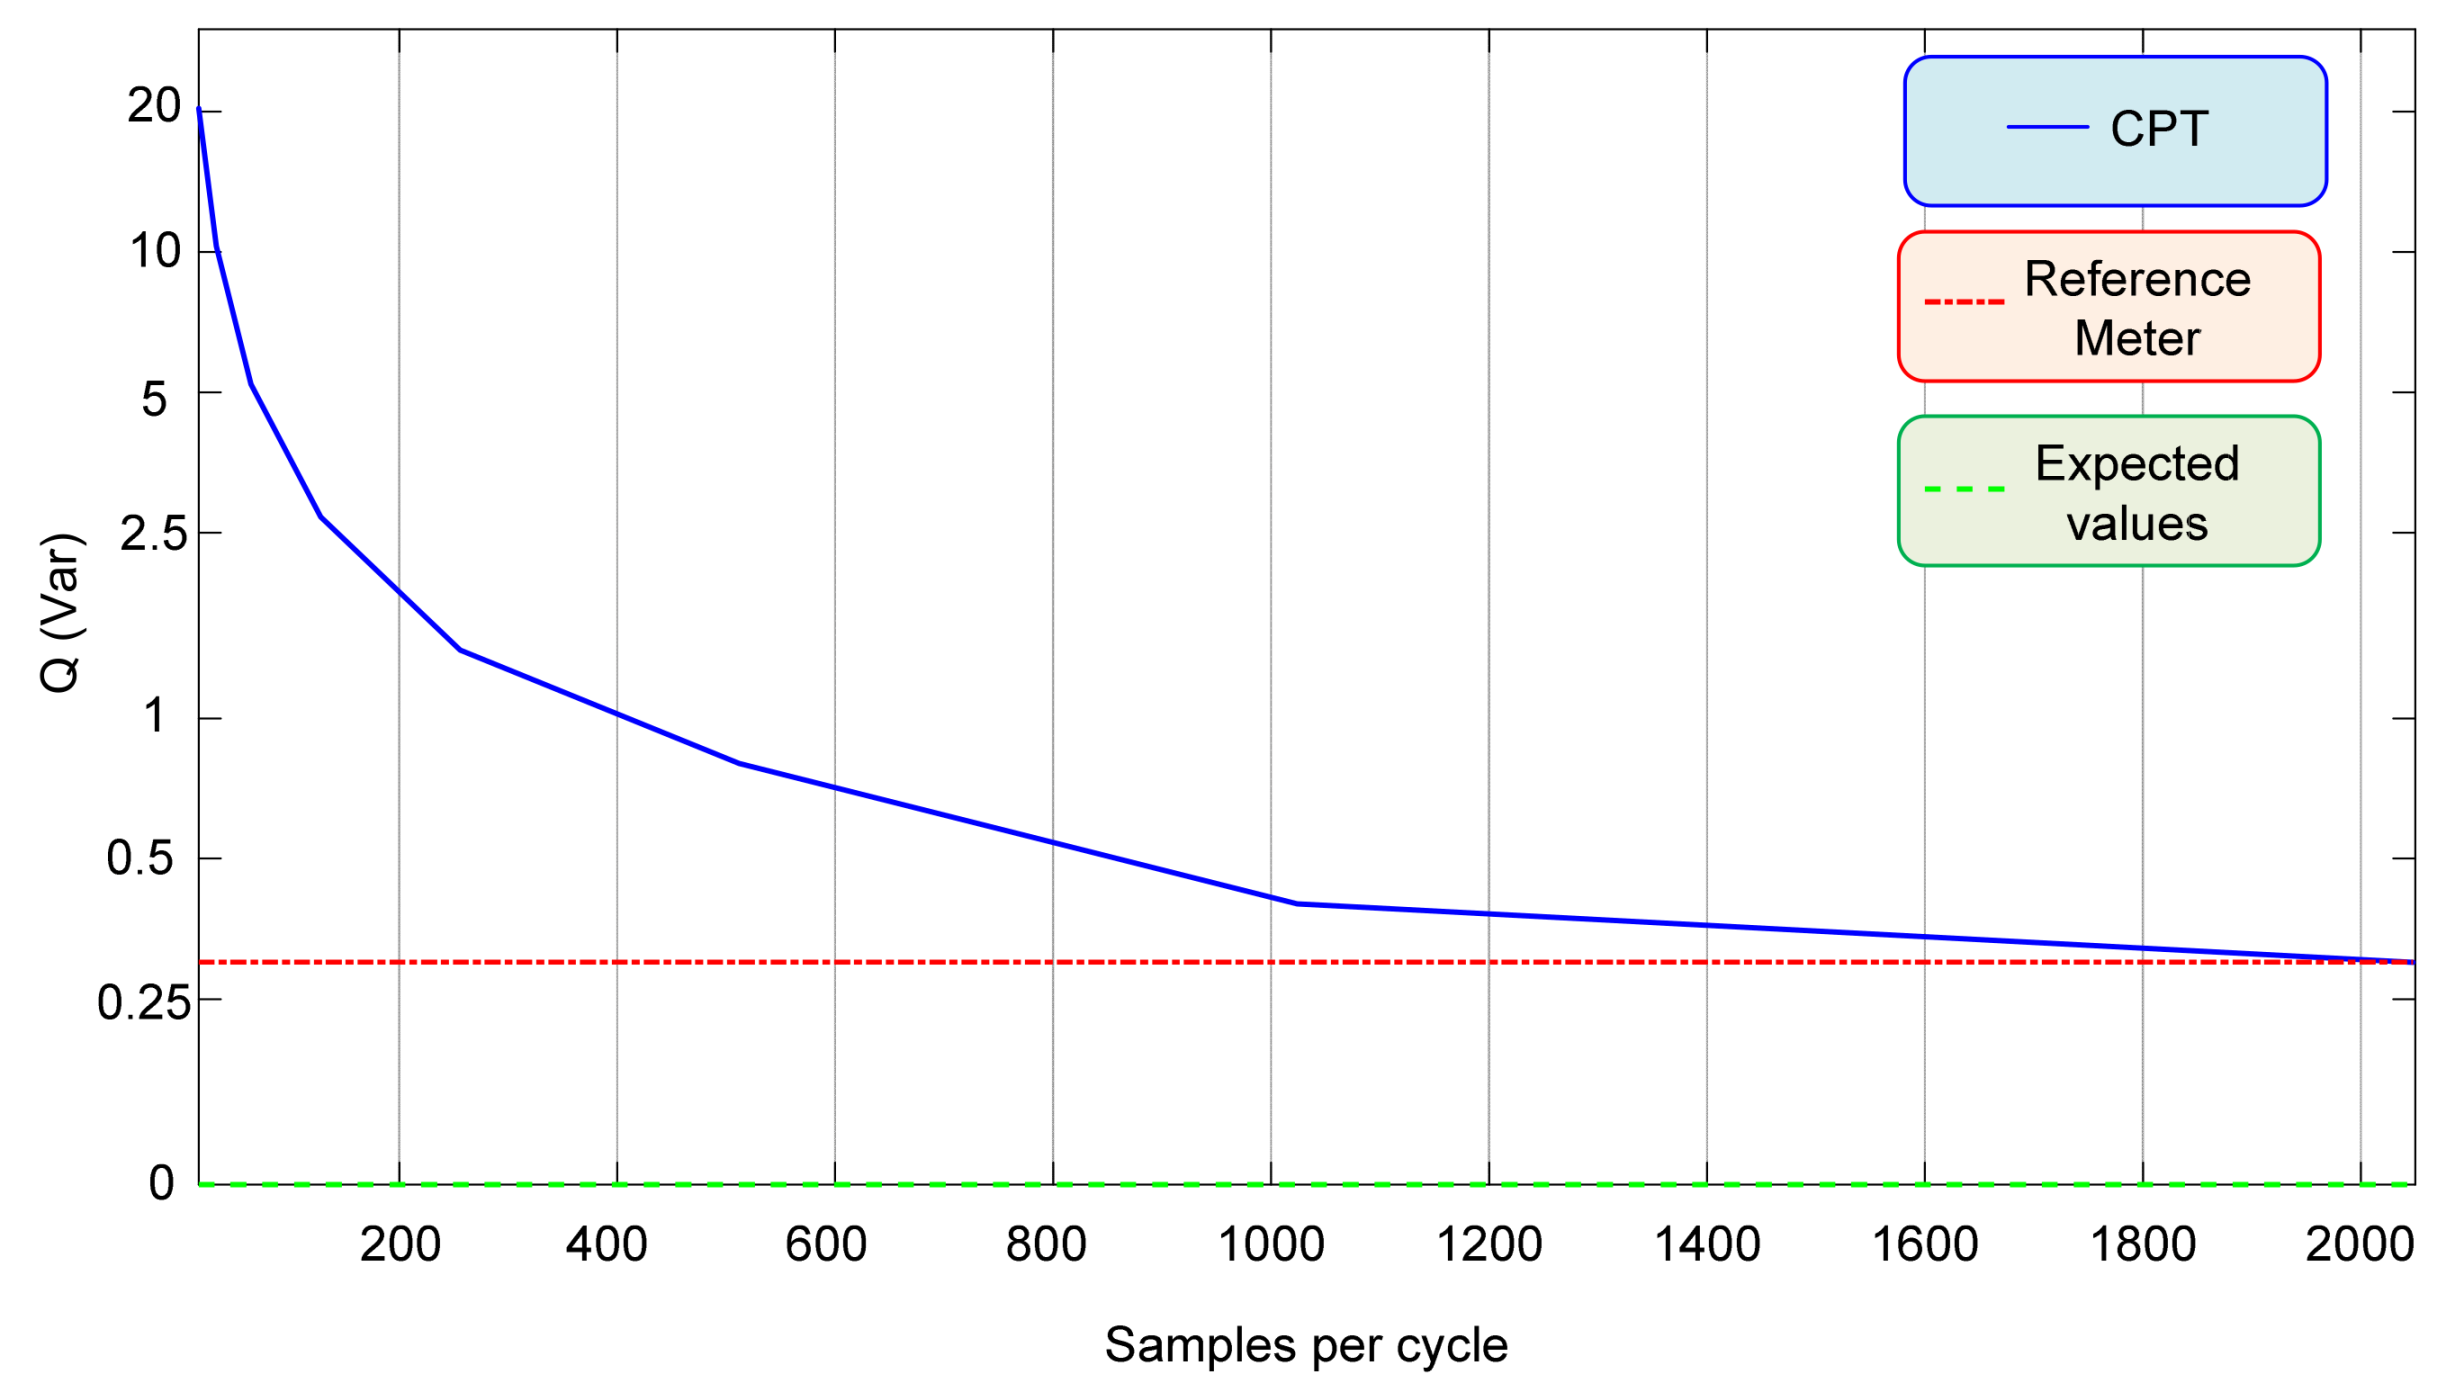
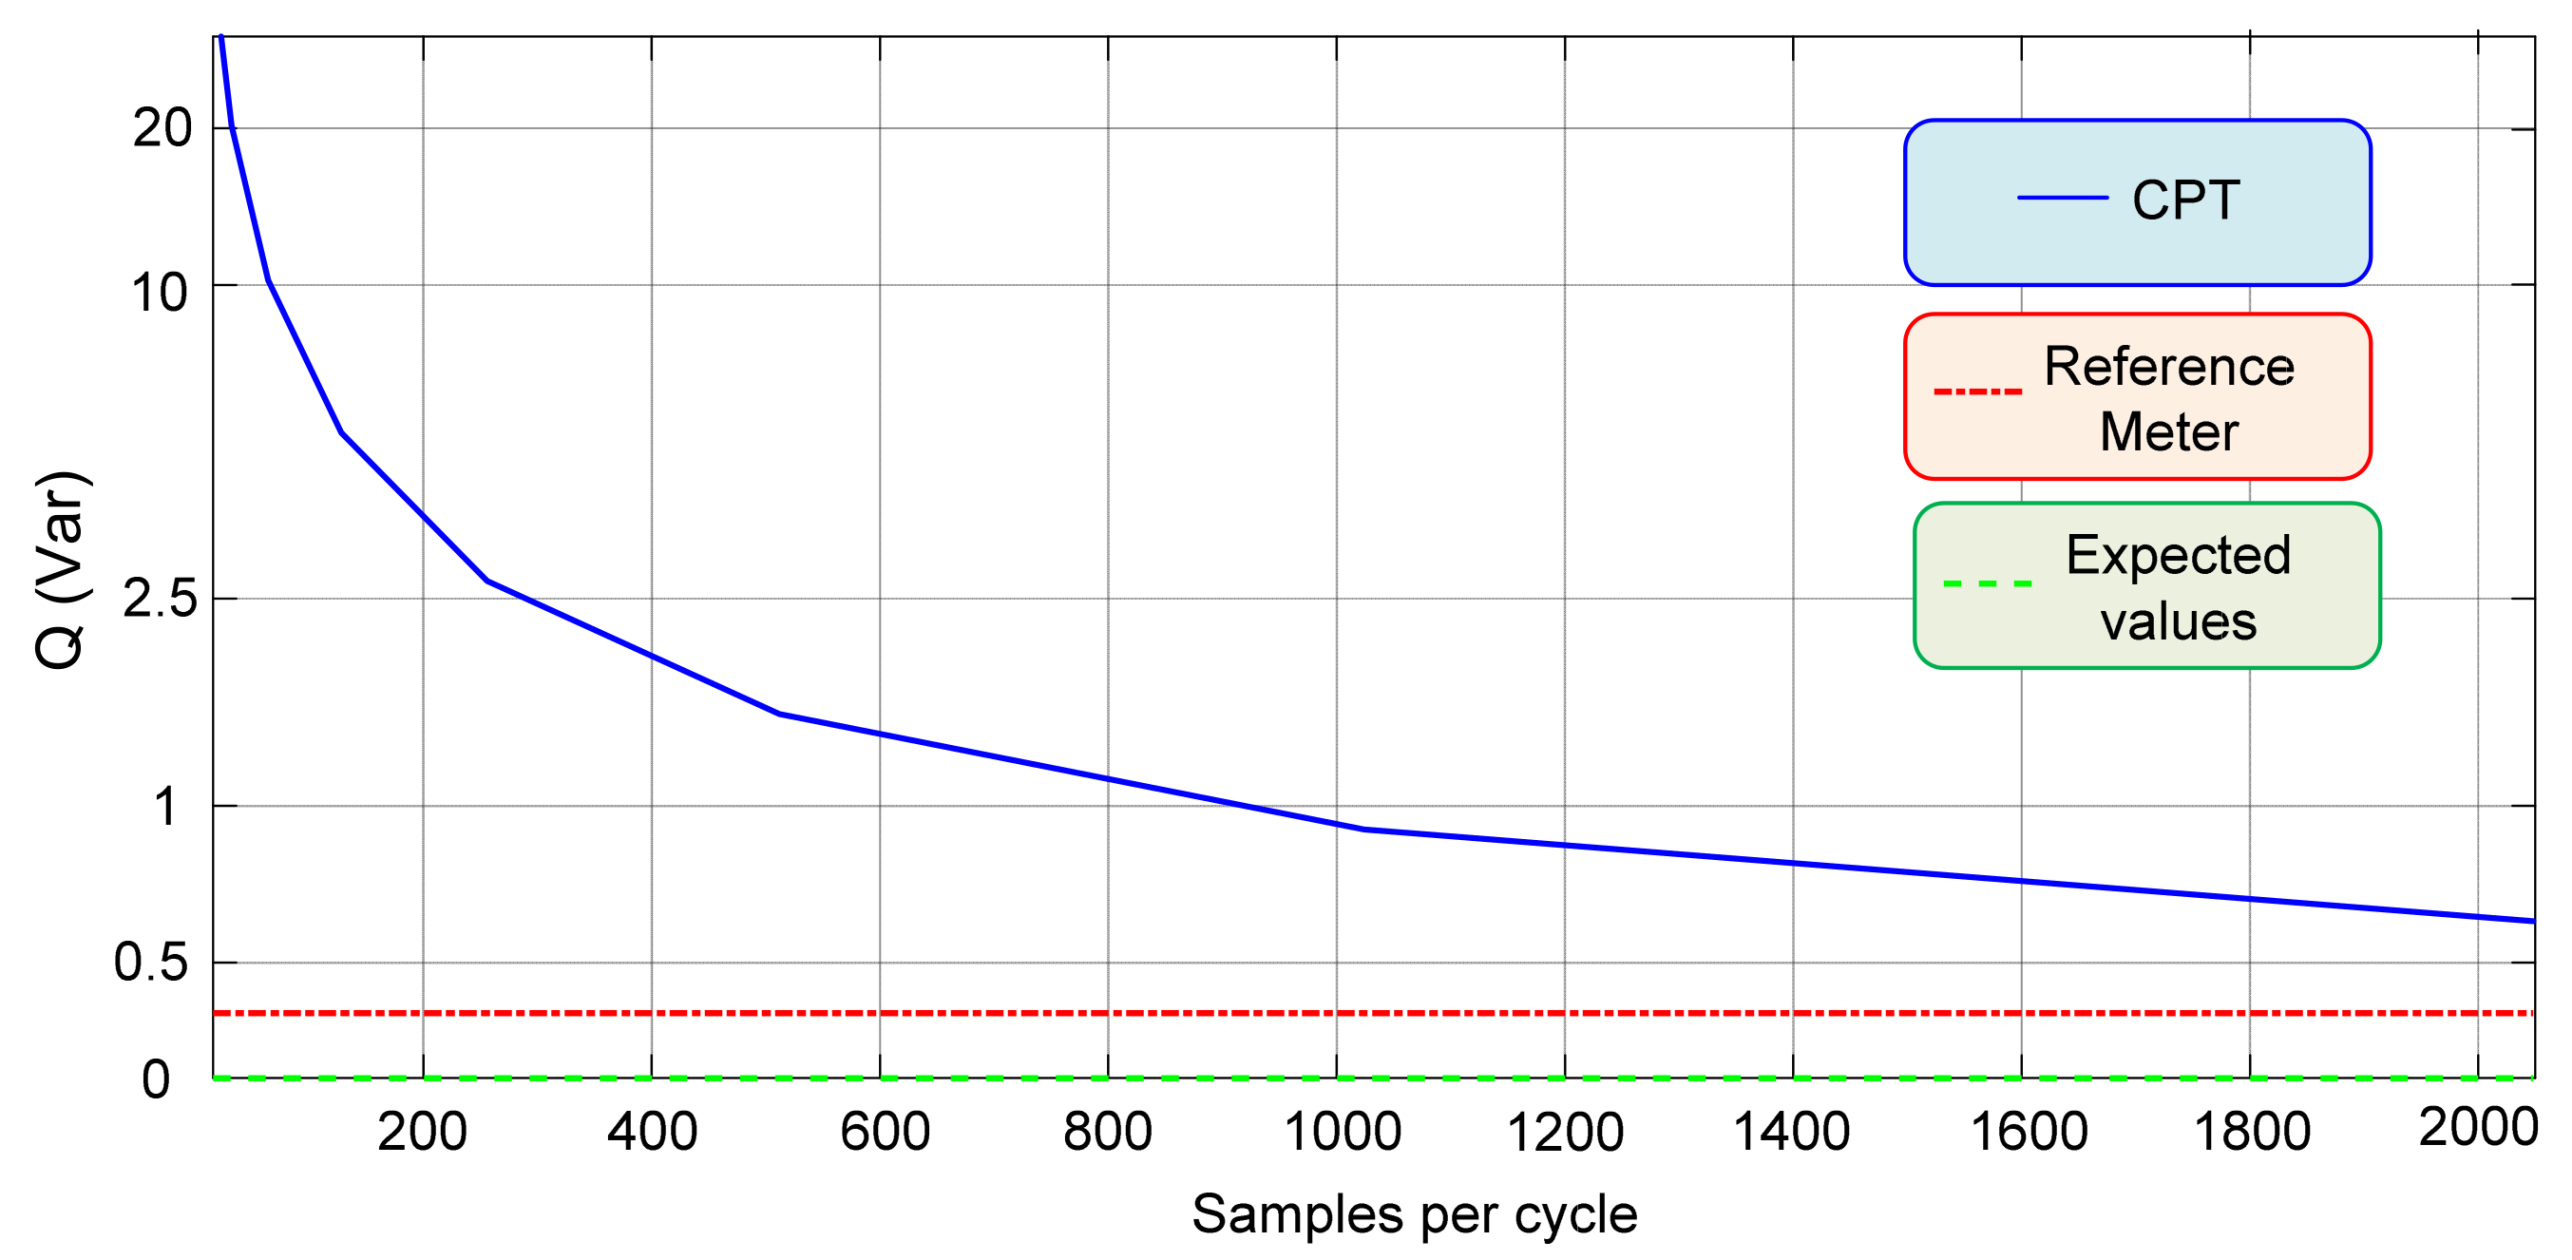
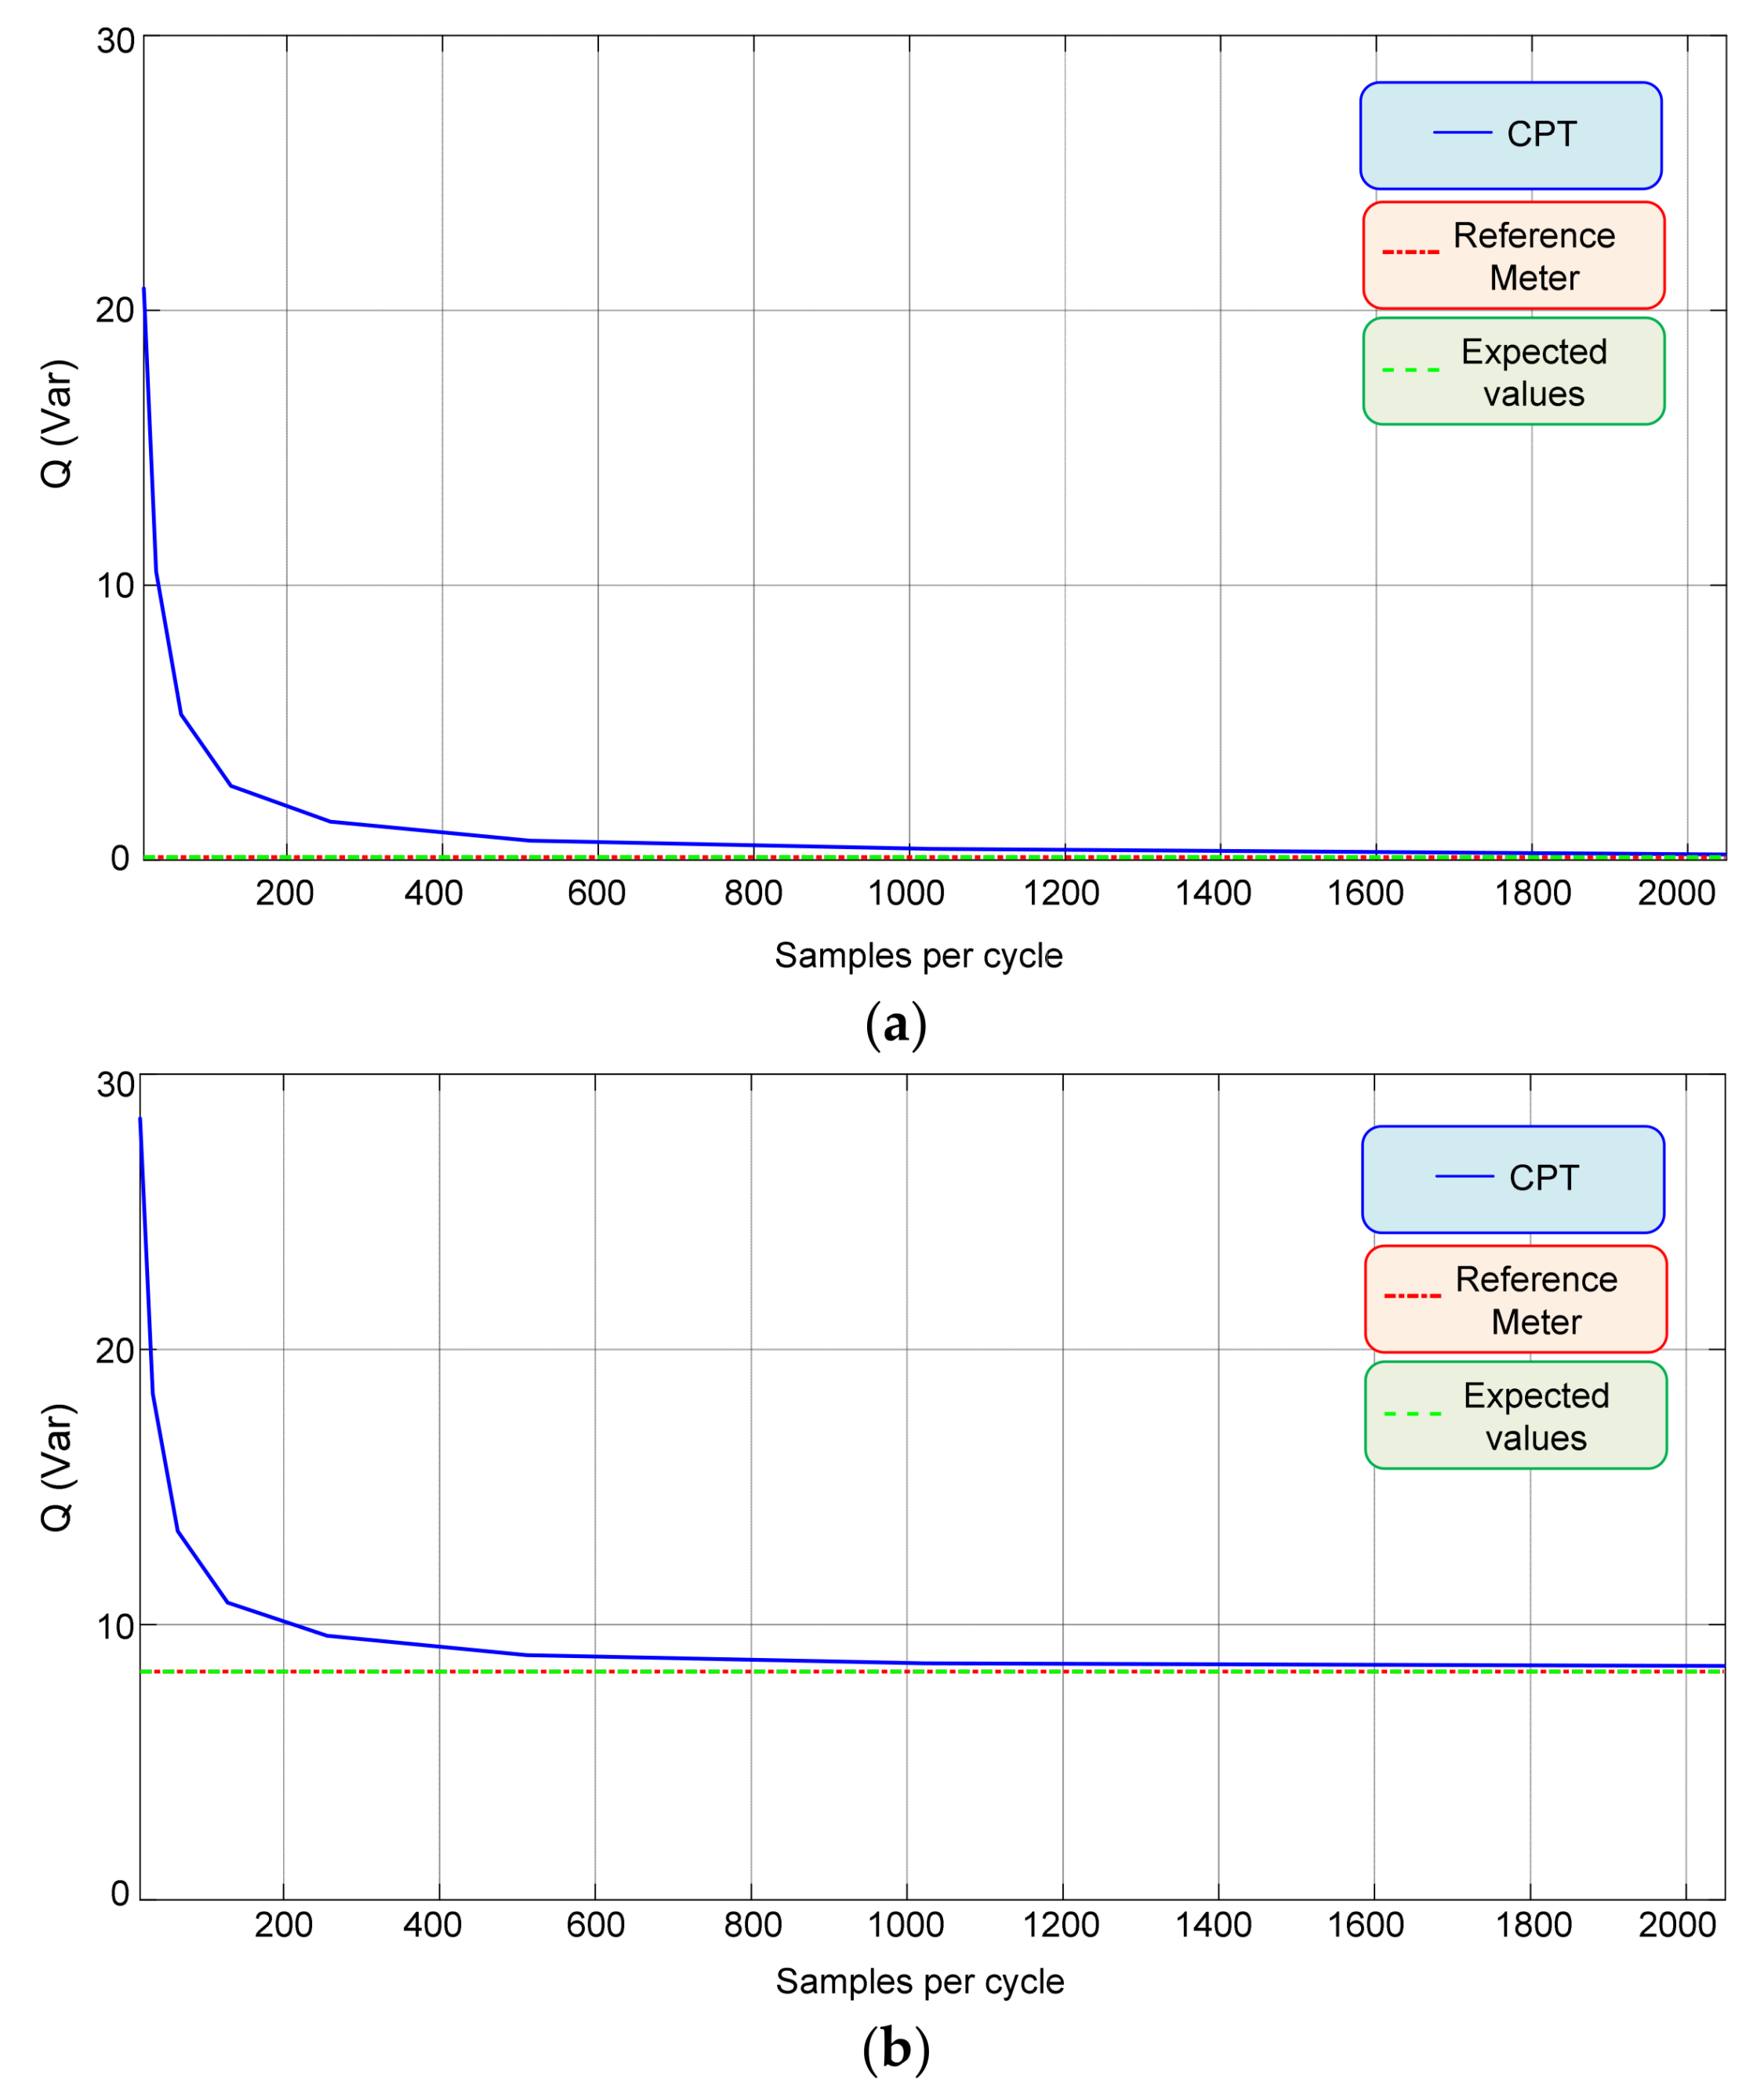
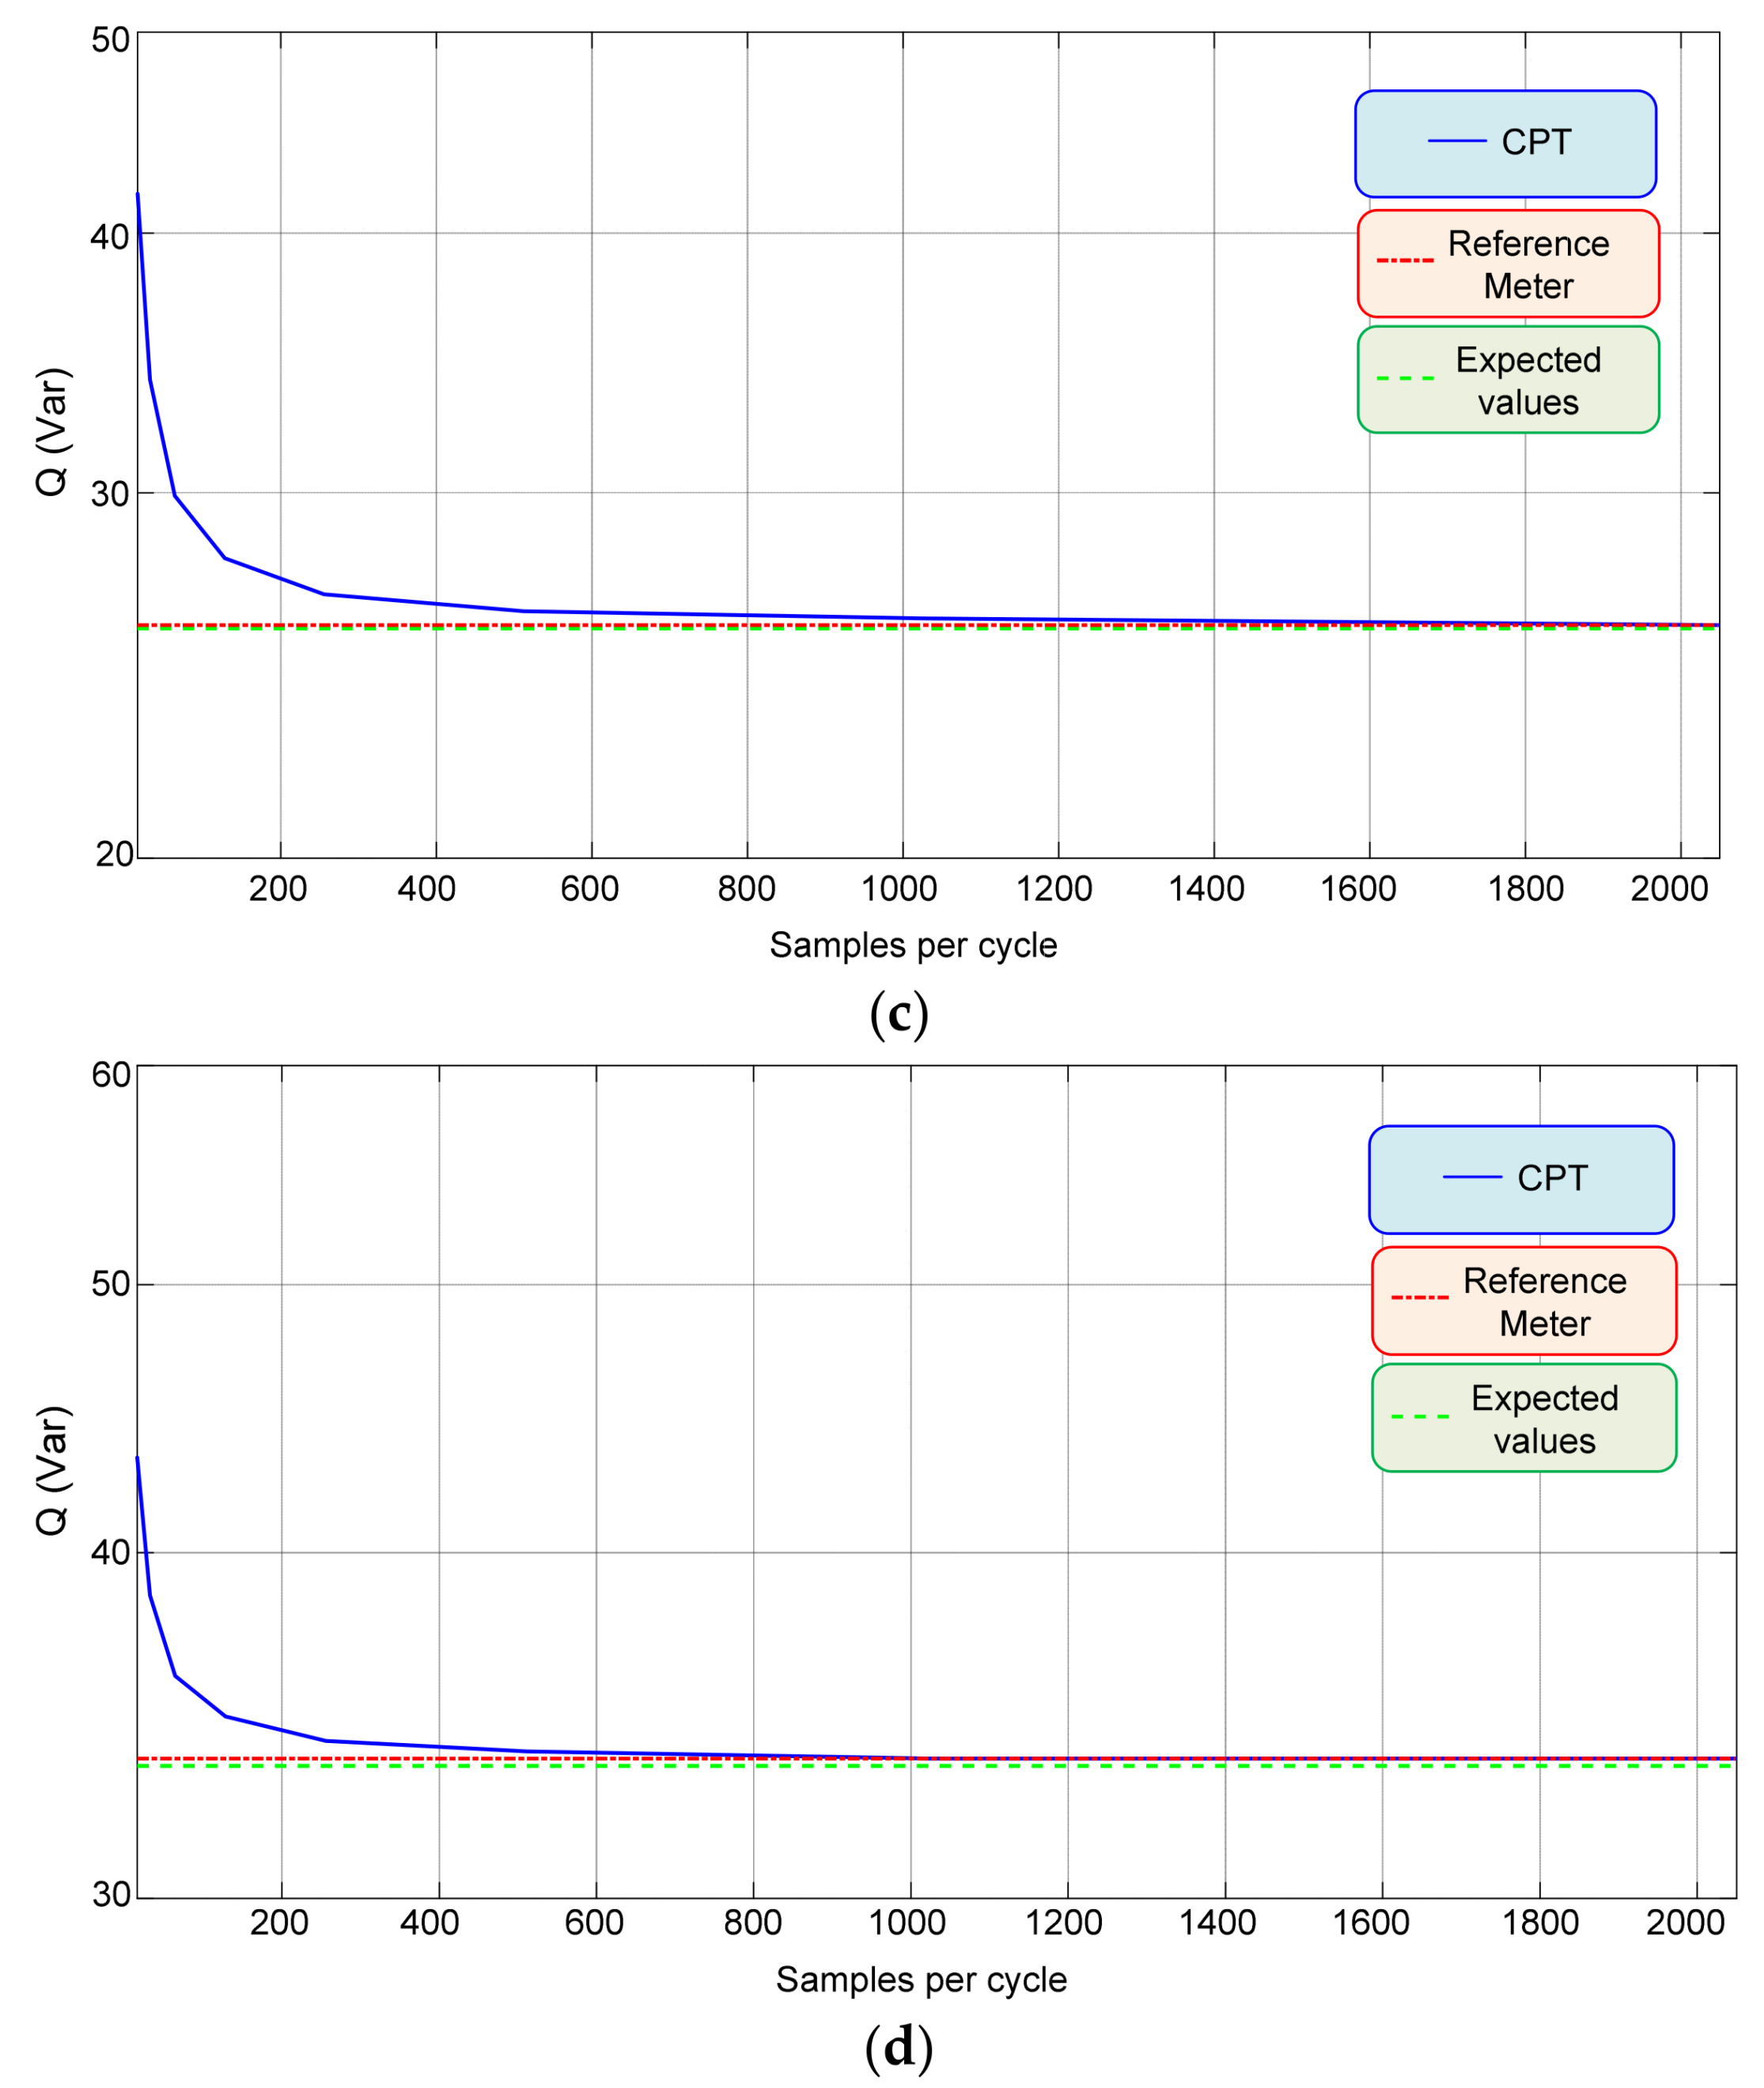
It was observed, by means of statistical analysis, that the reactive power mean error is inversely proportional to the sampling frequency, since the CPT uses the impartial integral, which in the discrete domain accumulates certain amount of error depending on the sampling rate. On the other hand, it was also confirmed that the sampling rate influences are neglectable for active power measurements.
The present study contributes with the valuable information of the sampling frequency for which the error added to the reactive power can be considered acceptable. This information becomes decisive when the intention of digital implementation is in question, and it can assist in the choice of an appropriate device for the implementation.
In summary, it is possible to conclude that, although CPT has great potential for power calculations, it demands favorable processing and memory resources, since the sample rate must be adequate to avoid accuracy errors in the reactive power.
Based on the literature review, the CPT has notorious capability of dealing with distorted currents and, consequently, adds new power quantities resulted from these phenomena. For these situations, the sampling rate can influence the distorted power measurements both for the errors associated with the reactive portion and for the harmonics of higher order present in the signals of voltages and currents.
Despite the importance of the tests of accuracy performed in this paper and the relevant information about the minimal sampling rate to minimize errors, it is noted that the study must be complemented with tests of hypotheses on the values of standard deviation aiming to conclude about the precision reached with the measurement results.

Author Contributions

Conceptualization, R.B.G.; methodology, R.B.G. and L.R.S.; software, L.R.S. and M.A.d.S.; validation, R.B.G.; L.R.S. and M.A.d.S.; formal analysis, R.B.G.; L.R.S.; M.A.G.d.B. and L.G.J.; investigation, L.R.S. and L.G.J.; writing—original draft preparation, R.B.G.; L.R.S. and M.A.G.d.B.; review and editing M.A.G.d.B. All authors have read and agreed to the published version of the manuscript.

Funding

This study was financed in part by the Coordenação de Aperfeiçoamento de Pessoal de Nível Superior—Brasil (CAPES)—Finance Code 001.

Institutional Review Board Statement

Not applicable.

Informed Consent Statement

Not applicable.

Acknowledgments

The authors would like to thank Federal University of Mato Grosso do Sul—UFMS.

Conflicts of Interest

The authors declare no conflict of interest.

Nomenclature

SymbolVariableUnit
tTimeSecond (s)
fFrequencyHertz (Hz)
TPeriodSecond (s)
ωAngular frequencyRadians per second (rad/s)
uInstantaneous voltageVolts (V)
UEffective voltageVolts (V)
iInstantaneous currentAmpere (A)
iaInstantaneous active currentAmpere (A)
irInstantaneous reactive currentAmpere (A)
ivInstantaneous void currentAmpere (A)
IEffective currentAmpere (A)
IaEffective active currentAmpere (A)
IrEffective reactive currentAmpere (A)
IvEffective void currentAmpere (A)
PActive powerWatts (W)
pInstantaneous active powerWatts (W)
WReactive energyJoules (J)
wInstantaneous reactive energyJoules (J)
QReactive powerVolt-ampere reactive (VAr)
GeEquivalent conductanceSiemens (S)
BeEquivalent susceptanceSiemens (S)
RResistanceOhm (Ω)
LInductanceHenry (H)

References

  1. Balci, M.E.; Hocaoglu, M.H. Comparison of Power Definitions for Reactive Power Compensation in Nonsinusoidal Conditions. In Proceedings of the 2004 11th International Conference on Harmonics and Quality of Power (IEEE Cat. No.04EX951), Lake Placid, NY, USA, 12–15 September 2004; pp. 519–524. [Google Scholar] [CrossRef]
  2. Depenbrock, M. The FBD-Method, a Generally Applicable Tool for Analyzing Power Relations. IEEE Trans. Power Syst. 1993, 8, 381–387. [Google Scholar] [CrossRef]
  3. Akagi, H.; Kanazawa, Y.; Nabae, A. Instantaneous Reactive Power Compensators Comprising Switching Devices without Energy Storage Components. IEEE Trans. Ind. Appl. 1984, IA-20, 625–630. [Google Scholar] [CrossRef]
  4. Tenti, P.; Mattavelli, P.; Paredes, H.K.M. Conservative Power Theory, Sequence Components and Accountability in Smart Grids. In Proceedings of the 2010 International School on Nonsinusoidal Currents and Compensation, Lagow, Poland, 15–18 June 2010; pp. 37–45. [Google Scholar] [CrossRef]
  5. Alonso, A.M.S.; Paredes, H.K.M.; Olímpio Filho, J.A.; Bonaldo, J.P.; Brandão, D.I.; Marafão, F.P. Selective Power Conditioning in Two-Phase Three-Wire Systems Based on the Conservative Power Theory. In Proceedings of the 2019 IEEE Industry Applications Society Annual Meeting, Baltimore, MD, USA, 29 September–3 October 2019; pp. 1–6. [Google Scholar] [CrossRef] [Green Version]
  6. Burgos-Mellado, C.; Hernández-Carimán, C.; Cárdenas, R.; Sáez, D.; Sumner, M.; Costabeber, A.; Paredes, H.K.M. Experimental Evaluation of a CPT-Based Four-Leg Active Power Compensator for Distributed Generation. IEEE J. Emerg. Sel. Top. Power Electron. 2017, 5, 747–759. [Google Scholar] [CrossRef] [Green Version]
  7. Mortezaei, A.; Simões, M.G.; Bubshait, A.S.; Busarello, T.D.C.; Marafão, F.P.; Al-Durra, A. Multifunctional Control Strategy for Asymmetrical Cascaded H-Bridge Inverter in Microgrid Applications. IEEE Trans. Ind. Appl. 2017, 53, 1538–1551. [Google Scholar] [CrossRef] [Green Version]
  8. Taher, S.A.; Alaee, M.H.; Arani, Z.D. Model Predictive Control of PV-Based Shunt Active Power Filter in Single Phase Low Voltage Grid Using Conservative Power Theory. In Proceedings of the 2017 8th Power Electronics, Drive Systems & Technologies Conference (PEDSTC), Mashhad, Iran, 14–16 February 2017; pp. 253–258. [Google Scholar] [CrossRef]
  9. Mortezaei, A.; Hou, X.; Simões, M.G.; Tiago, D.C.B.; Marafão, F.P. Three-Phase Smart Inverter for Flexible Power Conditioning in Low Voltage Distribution Systems. In Proceedings of the 2017 IEEE Industry Applications Society Annual Meeting, Cincinnati, OH, USA, 1–5 October 2017; pp. 1–8. [Google Scholar] [CrossRef]
  10. Bubshait, A.S.; Mortezaei, A.; Simões, M.G.; Busarello, T.D.C. Power Quality Enhancement for a Grid Connected Wind Turbine Energy System. IEEE Trans. Ind. Appl. 2017, 53, 2495–2505. [Google Scholar] [CrossRef]
  11. Burgos-Mellado, C.; Llanos, J.J.; Cárdenas, R.; Saez, D.; Olivares, D.E.; Sumner, M.; Costabeber, A. Distributed Control Strategy Based on a Consensus Algorithm and on the Conservative Power Theory for Imbalance and Harmonic Sharing in 4-Wire Microgrids. IEEE Trans. Smart Grid 2020, 11, 1604–1619. [Google Scholar] [CrossRef]
  12. Busarello, T.D.C.; Mortezaei, A.; Péres, A.; Simões, M.G. Application of the Conservative Power Theory Current Decomposition in a Load Power-Sharing Strategy among Distributed Energy Resources. IEEE Trans. Ind. Appl. 2018, 54, 3771–3781. [Google Scholar] [CrossRef]
  13. Paredes, H.K.M.; Bonaldo, J.P.; Pomilio, J.A. Centralized Control Center Implementation for Synergistic Operation of Distributed Multifunctional Single-Phase Grid-Tie Inverters in a Microgrid. IEEE Trans. Ind. Electron. 2018, 65, 8018–8029. [Google Scholar] [CrossRef] [Green Version]
  14. Mortezaei, A.; Simões, M.; Savaghebi, M.; Guerrero, J.; Al-Durra, A. Cooperative Control of Multi-Master-Slave Islanded Microgrid with Power Quality Enhancement Based on Conservative Power Theory. IEEE Trans. Ind. Electron. 2017, 9, 2964–2975. [Google Scholar] [CrossRef] [Green Version]
  15. Moreira, A.C.; Paredes, H.K.M.; De Souza, W.A.; Marafão, F.P.; Da Silva, L.C.P. Intelligent Expert System for Power Quality Improvement under Distorted and Unbalanced Conditions in Three-Phase AC Microgrids. IEEE Trans. Smart Grid 2018, 9, 6951–6960. [Google Scholar] [CrossRef]
  16. Fazio, A.; Sampaio, L.P.; de Brito, M.A.G.; e Melo, G.A.; Canesin, C.A. Comparative Analysis for Reactive Energy Measurement Methodologies, under Non-sinusoidal Conditions in Three-Phase Four-wire Circuits. In Proceedings of the XI Brazilian Power Electronics Conference, Natal, Brazil, 11–15 September 2011; pp. 494–501. [Google Scholar] [CrossRef]
  17. Moreira, A.C.; Deckmann, S.M.; Marafão, F.P.; Lima, E.G.; Bini, M.A. Virtual Instrumentation Applied to the Implementation of IEEE-STD 1459-2000 Power Definitions. In Proceedings of the 2005 IEEE 36th Power Electronics Specialists Conference, Dresden, Germany, 16 June 2005; pp. 1712–1718. [Google Scholar] [CrossRef]
  18. Souza, W.A.; Liberado, E.V.; da Silva, L.C.P.; Paredes, H.K.M.; Marafão, F.P. Load Analyser Using Conservative Power Theory. In Proceedings of the International School on Nonsinusoidal Currents and Compensation (ISNCC), Zielona Gora, Poland, 20–21 June 2013; pp. 1–6. [Google Scholar] [CrossRef] [Green Version]
  19. Smith, S.C.; Devaney, M.J. Fourier Based Three Phase Power Metering System. In Proceedings of the 17th IEEE Instrumentation and Measurement Technology Conference [Cat. No. 00CH37066], Baltimore, MD, USA, 1–4 May 2000; Volume 1, pp. 30–35. [Google Scholar] [CrossRef] [Green Version]
  20. Bucci, G.; Landi, C. On-line Digital Measurement for the Quality Analysis of Power Systems under Nonsinusoidal Conditions. IEEE Trans. Instrum. Meas. 1999, 48, 853–857. [Google Scholar] [CrossRef]
  21. Yokogawa®. WT210/WT230 Digital Power Meter—User’s Manual; IM 760401-01E; Revised June 2013. Available online: https://cdn.tmi.yokogawa.com/IM760401-01E.pdf (accessed on 29 July 2021).
  22. Montgomery, D.C.; Runger, G.C. Applied Statistics and Probability for Engineers; Wiley: New York, NY, USA, 2013; Chapter 10; pp. 337–342, 357–358. [Google Scholar]
Figure 1. Experimental arrangement.
Energies 14 06285 g001
Figure 2. Reactive power for one resistive load.
Energies 14 06285 g002
Figure 3. Reactive power for two parallel loads.
Energies 14 06285 g003
Figure 4. Reactive power for three resistive loads in parallel.
Energies 14 06285 g004
Figure 5. Reactive power for the inductive load with one resistive load.
Energies 14 06285 g005
Figure 6. Reactive power for the inductive load with two resistive loads in parallel.
Energies 14 06285 g006
Figure 7. Reactive power for the inductive load with three resistive loads in parallel.
Energies 14 06285 g007
Figure 8. Voltage and current waveforms at the rectifier input.
Energies 14 06285 g008
Figure 9. Non-linear load reactive power. (a) Firing angle of 0°, (b) Firing angle of 30°, (c) Firing angle of 60°, (d) Firing angle of 90°.
Energies 14 06285 g009aEnergies 14 06285 g009b
Table 1. Variables and mathematical operators.
Mean value x ¯ = x = 1 T   0 T x ( t ) d t
Instantaneous time derivative x ˘ ( t ) = d x ( t ) d t
Instantaneous time integral x ʃ ( t ) = 0 t x ( τ ) d τ
Impartial integral x ^ ( t ) = x ʃ ( t ) x ʃ ¯
Inner product x , y = 1 T   0 T x ( t ) y ( t ) d t
Effective value X = x = x , x
Table 2. Expected values for resistive loads from the acquired voltage and current signals.
LoadP (W)Q (VAr)
R103.50.1
R/2204.10.3
R/3302.10.4
Table 3. Powers obtained by Yokogawa® for scenario 1.
VariableP (W)Q (VAr)
R103.50.1
R/2204.10.3
R/3302.10.4
Mean error−4.40.2
Standard deviation2.60.1
Table 4. CPT powers for resistive loads for 16, 32, 64 and 128 samples per cycle.
Samples163264128
Frequency (kHz)0.961.923.847.68
VariableP(W)Q(VAr)P(W)Q(VAr)P(W)Q(VAr)P(W)Q(VAr)
R103.320.3103.310.3103.35.2103.32.7
R/2201.340.0203.620.2203.610.2203.65.2
R/3301.459.2301.429.9301.415.2301.47.8
Mean
error
−1.239.6−0.519.9−0.59.9−0.55.0
Standard deviation1.419.30.39.70.34.90.32.4
Table 5. CPT powers for resistive loads for 256, 512, 1024 and 2048 samples per cycle.
Samples25651210242048
Frequency (kHz)15.3630.7261.44122.88
VariableP(W)Q(VAr)P(W)Q(VAr)P(W)Q(VAr)P(W)Q(VAr)
R103.31.4103.30.8103.30.4103.30.3
R/2203.62.7203.61.5203.60.9203.60.6
R/3301.44.1301.42.2301.41.3301.40.8
Mean
error
−0.52.5−0.51.2−0.50.6−0.50.3
Standard deviation0.31.20.30.60.30.30.30.1
Table 6. Hypothesis test for resistive loads.
SamplesFrequency (kHz)PowervRejection Criteriat0Conclusion
160.96P3t0 > 2.41.9Do not reject H0
160.96Q2t0 > 2.93.5Reject H0
321.92P2t0 > 2.92.6Do not reject H0
321.92Q2t0 > 2.93.5Reject H0
643.84P2t0 > 2.92.6Do not reject H0
643.84Q2t0 > 2.93.4Reject H0
1287.68P2t0 > 2.92.6Do not reject H0
1287.68Q2t0 > 2.93.5Reject H0
25615.36P2t0 > 2.92.6Do not reject H0
25615.36Q2t0 > 2.93.3Reject H0
51230.72P2t0 > 2.92.6Do not reject H0
51230.72Q2t0 > 2.92.9Do not reject H0
102461.44P2t0 > 2.92.6Do not reject H0
102461.44Q2t0 > 2.92.2Do not reject H0
2048122.88P2t0 > 2.92.6Do not reject H0
2048122.88Q4t0 > 2.11.2Do not reject H0
Table 7. Expected power values—RL loads.
LoadP (W)Q (VAr)
R102.15.0
R/2198.420.1
R/3287.243.9
Table 8. Powers from Yokogawa® for RL loads.
VariableP (W)Q (VAr)
R100.55.0
R/2194.319.7
R/3281.043.0
Mean error−4.0−0.4
Standard deviation2.30.5
Table 9. Powers evaluated by CPT for RL loads considering 16, 32, 64, and 128 samples.
Samples163264128
Frequency (kHz)0.961.923.847.68
VariableP(W)Q(VAr)P(W)Q(VAr)P(W)Q(VAr)P(W)Q(VAr)
R101.824.8101.815.0101.810.0101.87.5
R/2197.958.3197.939.3197.929.7197.924.9
R/3286.598.9286.571.7286.557.8286.550.8
Mean
error
−0.537.7−0.519.0−0.59.5−0.54.7
Standard deviation0.217.60.28.90.24.50.22.2
Table 10. Powers evaluated by CPT for RL loads considering 256, 512, 1024, and 2048 samples.
Samples25651210242048
Frequency (kHz)15.3630.7261.44122.88
VariableP(W)Q(VAr)P(W)Q(VAr)P(W)Q(VAr)P(W)Q(VAr)
R101.86.2101.85.6101.85.3101.85.2
R/2197.922.4197.921.2197.920.6197.920.3
R/3286.547.3286.545.6286.544.7286.544.2
Mean
error
−0.52.3−0.51.1−0.50.5−0.50.2
Standard deviation0.21.10.20.60.20.30.20.1
Table 11. Hypothesis test for resistive loads.
SamplesFrequency (kHz)PowervRejection Criteriat0Conclusion
160.96P2t0 > 2.42.6Do not reject H0
160.96Q2t0 > 2.93.8Rejct H0
321.92P2t0 > 2.92.6Do not reject H0
321.92Q2t0 > 2.93.8Reject H0
643.84P2t0 > 2.92.6Do not reject H0
643.84Q2t0 > 2.93.8Reject H0
1287.68P2t0 > 2.92.6Do not reject H0
1287.68Q2t0 > 2.93.9Reject H0
25615.36P2t0 > 2.92.6Do not reject H0
25615.36Q2t0 > 2.93.9Reject H0
51230.72P2t0 > 2.92.6Do not reject H0
51230.72Q3t0 > 2.43.3Reject H0
102461.44P2t0 > 2.92.6Do not reject H0
102461.44Q3t0 > 2.42.7Reject H0
2048122.88P2t0 > 2.92.6Do not reject H0
2048122.88Q2t0 > 2.92.0Do not reject H0
Table 12. Spectrum analysis of the rectifier current.
QuantityValue
Sample rate1 μs
Samples per cycle16667
DC component0.02791 A
Fundamental0.7346 Vpeak
THD64.51%
Harmonics
ComponentDHTPhase
DC3.80%90.0°
60 Hz100.00%−29.8°
120 Hz1.24%269.3°
180 Hz54.51%98.0°
240 Hz1.18%98.3°
300 Hz18.55%−79.8°
360 Hz1.14%−79.2°
420 Hz18.03%105.1°
480 Hz1.21%108.5°
540 Hz10.57%−71.7°
600 Hz1.27%−69.9°
Table 13. Power reference values for the resistive load.
Firing Angle (°)P (W)Q (VAr)
0106.50.1
30103.78.3
6084.525.8
9053.033.5
Table 14. Calculated values with fundamental components for the non-linear load.
Firing Angle (°)P (W)Q (VAr)
0106.40.1
30103.68.3
6084.625.9
9052.733.7
Mean error−0.10.1
Standard deviation0.20.1
Table 15. Powers evaluated by CPT for the non-linear load considering 16, 32, 64, and 128 samples.
Samples163264128
Frequency (kHz)0.961.923.847.68
Firing angles (°)P(W)Q(VAr)P(W)Q(VAr)P(W)Q(VAr)P(W)Q(VAr)
0106.220.8106.310.5106.35.3106.32.7
30103.428.4103.418.4103.413.4103.410.8
6084.141.884.334.084.329.984.327.9
9053.043.352.838.652.836.152.834.9
Mean
error
−0.316.7−0.28.5−0.24.3−0.22.2
Standard deviation0.25.00.02.40.01.20.00.5
Table 16. Powers evaluated by CPT for the non-linear load considering 256, 512, 1024, and 2048 samples.
Samples25651210242048
Frequency (kHz)15.3630.7261.44122.88
Firing angle (°)P(W)Q(VAr)P(W)Q(VAr)P(W)Q(VAr)P(W)Q(VAr)
0106.31.4106.30.7106.30.4106.30.2
30103.49.6103.48.9103.48.6103.48.5
6084.326.884.326.384.326.184.325.9
9052.834.252.833.952.833.752.833.7
Mean
error
−0.21.1−0.20.5−0.20.3−0.20.2
Standard deviation0.00.30.00.10.00.00.00.1
Table 17. Hypothesis test for the non-linear load.
SamplesFrequency (kHz)PowervRejection Criteriat0Conclusion
160.96P6t0 > 1.9−1.4Do not reject H0
160.96Q3t0 > 2.46.6Reject H0
321.92P3t0 > 2.4−1.0Do not reject H0
321.92Q3t0 > 2.47.0Reject H0
643.84P3t0 > 2.4−1.0Do not reject H0
643.84Q3t0 > 2.47.0Reject H0
1287.68P3t0 > 2.4−1.0Do not reject H0
1287.68Q3t0 > 2.48.2Reject H0
25615.36P3t0 > 2.4−1.0Do not reject H0
25615.36Q3t0 > 2.46.3Reject H0
51230.72P3t0 > 2.4−1.0Do not reject H0
51230.72Q6t0 > 1.95.7Reject H0
102461.44P3t0 > 2.4−1.0Do not reject H0
102461.44Q3t0 > 2.44.0Reject H0
2048122.88P3t0 > 2.4−1.0Do not reject H0
2048122.88Q6t0 > 1.91.4Do not reject H0
Publisher’s Note: MDPI stays neutral with regard to jurisdictional claims in published maps and institutional affiliations.

