
Carbon Footprint Reduction through Residential Building Stock Retrofit: A Metro Melbourne Suburb Case Study


1
Department of Architecture, Faculty of Art Design & Architecture, Monash University, Caulfield East, VIC 3145, Australia
2
Department of Infrastructure Engineering, The University of Melbourne, Parkville, VIC 3010, Australia
*
Author to whom correspondence should be addressed.
Energies 2021, 14(20), 6550; https://0-doi-org.brum.beds.ac.uk/10.3390/en14206550
Submission received: 13 September 2021
/
Revised: 29 September 2021
/
Accepted: 6 October 2021
/
Published: 12 October 2021
(This article belongs to the Special Issue Life Cycle Assessment (LCA) in Building Construction: Focus on Embodied Carbon and Energy)
Abstract
:Since existing residential buildings are a significant global contributor to energy consumption and greenhouse gas (GHG) emissions, any serious effort to reduce the actual energy and carbon emissions of the building sector should explicitly address the carbon mitigation challenges and opportunities in the building stock. This research investigates environmentally and economically sustainable retrofit methods to reduce the carbon footprint of existing residential buildings in the City of Greater Dandenong as a case study in Metropolitan Melbourne, Australia. By categorizing energy use into various building age brackets and dwelling types that align with changes in energy regulations, we identified various retrofit prototypes to achieve a targeted 6.5-star and 8-star energy efficiency rating (out of a maximum 10-star rating system). The corresponding operational energy savings through different retrofit options are examined while also considering the quantity of materials required for each option, along with their embodied energy and GHG emissions, thus allowing a more comprehensive lifecycle carbon analysis and exploration of their financial and environmental payback times. Results show that when buildings are upgraded with a combination of insulation and double-glazed windows, the environmental benefits rise faster than the financial benefits over a dwelling’s lifecycle. The size or percentage of a particular dwelling type within the building stock and the remaining lifecycle period are found to be the most important factors influencing the payback periods. Retrofitting the older single detached dwellings shows the greatest potential for lifecycle energy and carbon savings in the case suburb. These findings provide households, industry and governments some guidance on how to contribute most effectively to reduce the carbon footprint of the residential building sector.
1. Introduction
Since 38% of the world’s greenhouse gas (GHG) emissions come from buildings [1], government and industry groups around the world have been spending considerable efforts to reduce their carbon footprint. The European Commission [2], for example, proposed a near-complete decarbonization of the building sector as a long-term strategy for 2050. The United Kingdom government has announced for all new houses a ‘zero carbon ready’ by 2025 goal [3]. This is a plan to apply the most energy efficient measures for new houses, reducing their carbon footprint by about 80% by 2025.
The net zero carbon building commission, launched at the 2018 Global Climate Action Summit in San Francisco, CA, USA, currently has 98 businesses and organizations and 28 municipalities that have committed to reduce carbon emissions from buildings related to their business or municipality by 2030. Calculating the operating portfolio emissions of these signatory organizations can save about 3.4 million t of carbon dioxide equivalent, (tCO2e), which corresponds to the amount of energy used to power 400,000 households per year [4].
However, most of these are focused on new construction. Half of European residential buildings were built before 1970, i.e., before thermal regulation was introduced in Europe [5], and nearly 90% of these are expected to be used by 2050 [6]. In the United States, residential buildings that are more than 30 years old account for more than 60% of the total [7], and energy consumption is reported to account for 41% of the total [8]. Many of these existing buildings will likely still be in operation in 2050 and beyond. In other words, it would not be easy to achieve the building sector’s zero carbon emission goal in 2050 without also improving the energy performance and reducing the carbon emissions of the existing building stock.
This has naturally led to interests in not only building new net-zero emissions houses but also in converting or retrofitting existing houses towards net-zero emissions. The WorldGBC [9] has joined the push to retrofit existing buildings to achieve the sector’s net-zero carbon goals by 2050 in order to maintain global warming below 2 degrees. This means that the current 1% renovation rate must be increased to 3% from 2017 onwards. Many studies have been conducted to increase the energy efficiency and reduce the GHG emissions of existing buildings. Many are related to the upgrade of space conditioning [10,11,12,13,14], hotwater systems [15,16,17], lighting systems [18,19,20,21], electronic appliances [22,23,24] or plug load [25,26,27]. These studies have analyzed the overall energy consumption reduction effect by upgrading major building systems using representative residential buildings by region. In addition, research on the development of computer modelling tools for building retrofit also followed. Seyedzadeh et al. [28] developed a decision support model that predicts the energy performance of old buildings to help deep energy renovation of buildings using machine learning, which evaluates 3000 retrofit variants for the case study building, searching for the “best” option. Piselli et al. [29] developed Historical Building Information Modeling (HBIM) for energy retrofit of historic buildings and analyzed the application effect of new and renewable energy (e.g., geothermal HVAC system) to historic buildings in Italy. These studies show, for each case building, which retrofit options can reduce energy or carbon more effectively under given conditions. These retrofit studies were not focused only on the case analysis of each building but also on the retrofit effect on the entire existing building stock in a region or city. Pallonetto et al. [30] analyzed the energy reduction effect of retrofit for existing residential building stocks in Ireland (Dublin County subdivided into Fingal and Dublin). They found that the introduction of solar PV, geothermal heat pumps and fabric upgrades in existing buildings could reduce the total energy consumption by about 45% compared to other buildings that did not. Krarti et. al. [31] analyzed the energy retrofit effect on residential building stocks in the Kingdom of Saudi Arabia. After dividing the entire residential building stock into 54 prototypes, they found a retrofit option suitable for each prototype and applied it to the entire building stock in reverse to analyze the energy saving effect of the retrofit in the entire KSA area.
While these studies show the significant reduction in energy consumption and GHG emissions by targeting entire building stocks (instead of one building at a time), most of these have only accounted for the impacts of retrofit on the building operation stage (B6 in EN15978 [32]). The building product manufacturing (A1–A3 in EN15978 [32]), transportation and installation or the building renovation process (A4–A5 in EN15978 [32]) for these energy retrofits and the impact of replacement (B4, B5 in EN15978 [32]) over the life of the building were not considered. The increased energy efficiency through retrofit may be neutralized by the impact of embodied energy and embodied carbon from the other stages (i.e., product manufacturing, transportation, installation, replacement, etc.) of the building’s life cycle. In new buildings, improved guidance towards a more systematic approach to explicitly account for embodied energy and embodied carbon together with those associated with operational building use has become more accessible (e.g., [33]), especially through the efforts of two successive International Energy Agency (IEA) Annexes 57 and 72 (e.g., [34,35,36]).
Shirazi and Ashuri [37] analyzed the impact of the building’s energy retrofit through the entire process for single family houses in Atlanta, USA. They evaluated tentative retrofit options to increase energy efficiency for existing buildings and analyzed their effects by calculating the embodied impacts. Shadram et al. [38] compared the effects of each of the two scenarios in terms of the life cycle, taking the case of a general multi-family residential building in the 1980s in Sweden. One is the case of applying the optimal retrofit option to satisfy new building standard and the other is the case of meeting a nearly zero emissions objective. As a result, there was a difference of about 1862 GJ between the two options, with the retrofit to reduce this gap somewhat limited due to the increase in embodied energy. This result is consistent with the study of O’Hegarty et al. [39], which compared the operational energy reduction and the increase of embodied energy by applying deep retrofit to existing residential buildings to satisfy Ireland’s nearly zero energy building standard.
In addition, there are studies that analyze the embodied effects that occur when the existing buildings are retrofitted to achieve net zero emissions [40,41,42,43], and studies that analyze life cycle costs and energy [44,45,46,47].
However, most of these studies have focused on only one representative building in a specific area [38,40,41,47,48] or the entire city [42,43]. Although the building stock in a city or region was included, there are studies [44,45,46] that did not properly consider the replacement of systems or products required in the life cycle of the building.
The present work aims to analyze the environmental and economic efficiency of an ambitious energy retrofit program of existing residential building stocks in a local government area to significantly reduce their carbon footprint, considering both operating energy and carbon (B6 in EN15978 [32]) and the embodied energy and carbon associated with the retrofit options (A1–A4 and B5 in EN15978 [32]). For residential buildings in Australia, the current building code requirement for energy efficiency of new housing is 6 stars (out of a maximum of 10), while the older existing houses, depending on age and construction type, have a 1-star to 5-star rating. A retrofit target performance of 6.5-star and 8-star energy rating for existing houses will be higher than the current 6-star requirement for new houses. The case suburb is the City of Greater Dandenong, which is a typical but growing city in the south-eastern area of Metropolitan Melbourne in Victoria, Australia.
This paper has been divided into four sections. Section 2 describes the energy efficiency of existing buildings in Australia, Section 3 is the methodology, which explains boundary of this study, classification of building stocks and energy and GHG modeling of building retrofits, Section 4, the results and discussion, provide preliminary results of this study and a discussion of its implications and the conclusion summarizes the findings of this study and provides recommendations for future work.
2. Energy Efficiency of Existing Buildings
2.1. Building Energy Demand in Australia
Building energy consumption is responsible for 25% of national GHG emissions in Australia and half of these emissions are from residential buildings [49,50,51]. The Australian government introduced energy efficiency regulations in 2005 requiring energy efficiency compliance to at least a 5-star energy rating–out of a possible 10-star rating based on the Nationwide House Energy Rating Scheme (NatHERS) [52]. Since 2011, this has been increased to 6-star energy efficiency [53]. As a result, there has been a 29% drop in energy demand for residential buildings (280 MJ/m2/year in 1986 to 200 MJ/m2/year of floor area in 2010), which continues to steadily improve [54]. Although the current building energy efficiency regulations do not cover the existing buildings, there are renewed initiatives to address both existing buildings and raise the minimum energy efficiency rating of new houses to 7-star by 2022 [55]. More than 71% of residential buildings were built before 1990 [56], and most have not upgraded their energy performance. The main sources of residential building energy consumption are heating and/or cooling, lighting, hot water and appliances. Out of these, heating/cooling is the highest energy contributor in residential buildings in Australia, comprising more than 40% of the total energy consumption [57]. According to Sustainability Victoria [58,59], existing residential buildings have poor energy efficiency with an average 1.5 energy star rating, which require 348 MJ/m2 more heating and cooling energy every year compared to current mandatory regulations for new houses (114 MJ/m2 per year for a 6-star house in Melbourne). Considering the current annual production of new housing stock in Australia (≈1%, [60]), roughly more than 70% of the current residential building stocks will still be in use by 2050.
For the above reasons, building retrofit is a key focus of a number of energy retrofit programs that are underway across the country with governmental support (Victorian Energy Upgrades, Environmental Upgrade Finance, Small Scale Technology Certificate, etc.). In the State of Victoria, more than 241,800 residential households have undertaken energy efficiency upgrades [61]. Out of these retrofit activities, 75% occurred in the Melbourne Metropolitan region. The total housing stock in the Melbourne Metropolitan region comprises 17% of the whole Victorian housing stock. Unfortunately, most of these retrofit activities are lighting upgrades, accounting for more than 90% of total retrofit activities in Victoria [61]. By energy end-use, lighting accounts for only 7% of the total energy in Australian residential buildings [62]. Other major residential energy efficiency upgrades include space heating and/or cooling (40%), water heating (23%), electric appliances (25%), etc. Moreover, the energy and carbon reduction in existing building retrofits only account for the operating phase of building. Even though a retrofit option can reduce energy and carbon during their building operation, this may be neutralized if the retrofit work consumes lot of energy and releases GHGs during their manufacturing and transport; further, some materials may require frequent replacement during a building’s operation.
2.2. Upgrading the Existing Housing Stock
Whilst much research has been completed to show how new houses can be built to achieve net zero emissions [63,64,65,66,67,68] or at least reduce their energy demand significantly [69,70], less has been undertaken related to retrofitting and upgrading the existing housing stock, which makes up 95% of the residential housing stock in Australia [51] and a large majority of the housing stocks overseas. Given the major proportion of houses being built before advancements in energy efficiency technologies and the relatively short timeline in which nations across the world have set for themselves to reduce their GHG emissions, it is necessary to determine ways in which the energy demand of the existing housing stocks can be significantly reduced.
Much of the literature written about near-zero energy or ultra-energy efficient housing in Australia references the development at Lochiel Park Green in Lochiel Park, South Australia, where the houses have an average energy rating of 7.5 stars (<58 MJ/m2 per annum of the thermal energy load) and minimum solar panel installation requirements based on the floor area of each of the houses in the development [71]. Whilst Lochiel Park Green proves as a good case study for the application of ultra-energy-efficient housing in Australia, the houses were all built new. Many studies that reference the Lochiel Park Green development also fail to consider the embodied energy of the houses and instead consider only the operational energy requirements [71]. The first net-zero emissions house from a mainstream volume builder (i.e., built new) and the first net-zero emission house retrofit of a 40-year-old existing house in Australia, as part of the CSIRO Australian Zero Emissions House (AusZEH) research program, considered life cycle carbon emissions; that is, accounting for both embodied and operating emissions from the energy consumed over its expected life cycle [63,64,72].
2.3. Energy Efficiency in Victoria and the City of Greater Dandenong
In Australia, the State of Victoria has the highest population growth rate of 2.3% in recent years [73]. The rise in the national population has also led to a rise in energy consumption. From 2017 to 2018, Australia’s total energy consumption increased by 1% [74]. As part of the Paris Agreement, brokered by the United Nations Framework Convention on Climate Change [75], all parties declare their target emissions reductions and report their progress towards reducing the risks and impacts of climate change.
The Victorian Government [59] has recognized that the majority of Victorian houses built before energy efficiency regulations were introduced in 1991 have very low thermal efficiency and determined that houses built before 2005 have an average energy efficiency rating of 1.81 stars. The residential building thermal performance in Australia is measured using NatHERS [52], which has been adopted in the Building Code of Australia and has an energy-star band (from 1-star to 10-star) shown in Table 1 for the major capital cities in Australia. In 2005, a minimum 5-star rating for new houses was introduced, and in 2011, the minimum requirement was raised to a 6-star rating [52,53]. The star-band is set for 69 climate zones across the country. The current 6-star minimum standard for new houses will likely increase to 7 stars.
Seo et al. [51] incorporated NatHERS-graduated ratings for dwellings built prior to 2005 by local government areas in Victoria by categorizing the residential building stock according to the construction date and dwelling type. This study highlighted that there is a proportionally low replacement rate of existing buildings. As in commercial buildings, less than 1% of existing buildings are demolished each year [76]. Similarly, the Victorian Government [59] argues that Victorians are more likely to renovate houses than build brand-new. Moving forward, it is expected that a large proportion of the current building stock will remain in Victoria. As a result, a substantial amount of modern research is aimed at retrofitting options targeting existing building stocks.
The need for energy reductions is a valid and widespread issue. However, to make efficient improvements, it is equally important to understand where these developments should best be targeted.
The Victorian Government [77] found that the residential sector contributes 16% of Victoria’s GHG emissions, and the Australian Energy Update found that 60% of energy consumption within building operations are attributed to the residential sector [74]. Seo et al. [51] built on these facts, noting that 95% of residential buildings were built prior to the introduction of energy efficiency regulations. Therefore, it is justified to target existing residential dwellings, as there is large potential for energy improvements.
Understanding the primary dwelling types in the existing residential stock will indicate the scope of opportunities for energy improvements and carbon footprint reductions. The City of Greater Dandenong is one of the local governments within Metropolitan Melbourne in Victoria, Australia. The Australian Bureau of Statistics (ABS) census data show that the most abundant private dwelling types in the City of Greater Dandenong are stand-alone (detached) houses and semi-detached houses, making up 71.5% and 16.7% of the building stock, respectively, or 88.2% (combined) of the total building stock [78]. Further, 46.9% of occupied private dwellings in the city have three bedrooms. Thus, it will be reasonable to consider a 3-bedroom stand-alone or semi-detached house as a prototypical house type in the city.
2.4. Retrofit Options to Improve the Thermal Performance of Buildings
The State of Victoria is divided into three major climatic conditions (hot dry summer and warm winter, mild temperate and cool temperate), and the capital city, Melbourne, has mild summers and cold winters [79]. This means that heating during the winter season accounts for most of the energy consumption in existing dwellings in Melbourne. Seo et al. [76] explored two methods of reducing building emissions by changing end-use behaviors and/or installing on-site renewable energy. Similarly, a key goal of Sustainability Victoria is to incorporate energy efficient improvements into house retrofit upgrades and renovations [59]. A range of retrofit options at different price points are currently on the market, with varied success in reducing GHG emissions and energy consumption.
Retrofitting options can be incorporated into the building shell as a whole or into standalone appliances, with each displaying varied effectiveness in terms of financial and energy savings. Sustainability Victoria’s Pilot Project [58] organized these various retrofitting preferences into three ‘basic upgrade options’ and five ‘advanced upgrade options’, which include insulation on the ceiling, wall and floor or window upgrades (e.g., double glaze). Whitehouse et al. [80] reported various retrofit options of existing residential buildings considering building types and climate conditions across Australia. Table 2 shows the retrofit options considering Victorian climate conditions and the age brackets of residential building archetypes to improve building thermal energy performance.
The priority order of these upgrades is based on an assumed cost effectiveness and provides a useful starting point for further studies that predict the expected return and efficiency. However, in reality, due to the nature of the building stock, not all options could be readily installed. Sustainability Victoria’s report [59] found that draught sealing, wall insulation and double-glazing are the most influential upgrade options as “low hanging fruits”. Together, they account for around 70% of the increase in ‘House Energy Rating’ across Victorian dwellings [59].
2.5. Embodied Impacts of Retrofitting
Previous research predominantly focused on specific retrofit options rather than examining a more comprehensive set of options that can be considered for different building types across the building stock. Anastaselos et al. [81] developed an assessment tool for the energy, environmental and economic evaluation of thermal insulation solutions. However, this framework favors product scale solutions and lacks building scale analysis capability, which is required for larger scale studies involving building stock. Past research also focused mostly on a bottom-up approach that uses individual components to represent a whole, where several prototypes are developed to represent a local government area [51,76,82].
Sustainability Victoria’s [59] report on the potential of house retrofit upgrades and renovations built upon its previous pilot study from 2010. The pilot project’s methodology involved estimating the energy savings based on data collected from sixty houses and estimating the effects of retrofitting with eleven different building shell upgrade options through modelling. Subsequently, a cost-benefit analysis was conducted on these various energy efficiency upgrades. The methodology successfully analyzed the impacts of considering an entire building stock rather than an individual house. However, the study did not associate the value of energy use with the life cycle embodied energy and embodied carbon components. Furthermore, a local government area can be examined even more closely if the energy consumption is broken up at a block-by-block level (e.g., [76]).
To address the gaps in the above report, two different approaches were used in Seo et al.’s study [51], which initially used the input–output method to quantify the embodied energy and GHG impacts from retrofitting. Subsequently, the study was based on quantifying the unit energy and GHG emissions based on economic and national energy performance data for different energy star ratings. This methodology was limited to only the heating and cooling, rather than analyzing all types of energy uses in the residential domain. However, they found retrofit upgrades that focused on heating and cooling energy consumption as the most effective method of increasing the overall energy efficiency. In addition, this approach was highly effective in taking the service life and embodied energy into consideration. A similar recapitulated integrated framework is described by Schmidt and Crawford [82] that draws particular focus to the significant embodied and lifecycle components.
The present research addresses the key gaps and findings found in previous studies on incorporating more ambitious energy efficiency improvements to existing stand-alone and semi-detached dwellings in the residential building stock in the City of Greater Dandenong as a case study, with an explicit consideration of lifecycle operational and embodied impacts and their financial implications.
3. Methodology
We adopt herein a bottom-up modelling approach to allow for a more granular investigation of retrofit options for different dwelling types in a building stock. Although this approach is highly dependent on the availability and accuracy of data, it is used in preference over a top-down approach that predominantly focuses on broader econometric impacts [76].
Both the operational and embodied energy and GHG emissions are considered for a lifecycle investigation (cradle to use) of the targeted residential buildings in the City of Greater Dandenong. This process reflects a bottom-up approach using energy modelling of buildings and stocks in the City of Greater Dandenong. For energy modelling (building operation phase), we used the energy efficiency rating software known as AccuRate [83,84], which is a national rating and benchmark tool in NatHERS [52,85]. This software tool enables dwellings to be modelled with a fine level of detail and various energy efficiency measures to be assessed without undertaking the actual physical retrofit.
Figure 1 shows the boundary considered for evaluating the impact of energy and GHG emissions due to the retrofit of existing residential building stocks in the City of Greater Dandenong. The “carbon footprint” in the present study consists of the GHG emissions embodied in building product manufacturing (A1–A3 in EN15978 [32]), transportation (A4) and product replacement (B5) over the life of the building together with the GHG emissions associated with the operating energy (B6). GHG emissions associated with retrofit installation (A5) are not considered because the use of equipment is relatively insignificant in this study.
The methodology is described in four sub-sections: (a) Building stocks and prototypes, (b) Operational energy and GHGs for building stocks, (c) Retrofits/upgrade of existing stocks, and (d) Net lifecycle energy, GHG and cost analysis. We compare two cases (with retrofits and no retrofit) of the existing residential building stocks in the selected local government area.
3.1. Existing Residential Building Stocks and Prototypes in the Greater Dandenong Area
3.1.1. Existing Building Stock
The City of Greater Dandenong is a typical local government area in the south-eastern suburbs of Melbourne in Victoria, Australia. This city had about 152,000 residents in 2016 [73]. Figure 2 shows the building stock (as total floor area, m2) proportions in the City of Greater Dandenong based on the National Exposure Information System (NEXIS) database [86]. The existing residential building stock number was about 46,460 (or 98% of the total) in 2017, mostly a combination of stand-alone (86%) and semi-detached dwellings (12%). Many of these were built in the 1970s and 1980s [86] before the introduction of building thermal energy regulation in Australia. This was about 10% higher than the proportion of dwelling numbers (stand-alone and unit) based on the 2016 census survey (88.2% in total, shown in chapter 2.3). There is small number of apartments (1066) with less than 2% of the total floor area (m2) of the whole residential building stocks. Thus, this was not considered in this study.
The first-level categories of the building stock are stand-alone and semi-detached residential dwellings. The next level is categories by age-band to match the historical changes in energy regulations in Victoria [59]. This leads to five different ‘dwelling brackets’ as shown in Table 3. Each age-band is assumed to begin on 1 January, so that the label ‘Post’ is inclusive of that given year whilst the label ‘Pre’ is not inclusive.
The NEXIS database was used to find the number of stand-alone and semi-detached dwellings in Greater Dandenong. Subsequently, the building stocks from the Greater Melbourne Area were used to show the percentages of all buildings erected in proportion to their age-bracket [73]. From this, the proportions of each age-bracket were applied to the building stock in Greater Dandenong to determine the number of houses per dwelling-bracket.
3.1.2. Prototypes of the Existing Building Stock
Since the 1990s, many countries have begun to develop building performance energy rating systems. In addition, the Australian government began to pay attention to the national energy rating system in the 1990s [87]. In 2003, the Australian Building Code introduced minimum energy efficiency standards for new houses and these became mandatory for new houses since 2006 (5-energy star); after 2010, it has become more strict (6 stars) [88]. Therefore, the energy efficiency of building is closely related to the year in which the building was built, which can also affect the building materials (elements) used to meet energy efficiency regulations. The results of a Victorian government survey of the energy efficiency of existing homes support this well. According to the SV report [58], in the case of houses that were not retrofitted to increase energy efficiency, the average energy efficiency of houses built prior to 1990 was 1.5 stars, whereas those built after 1990 increased to about 3 stars [89]. This shows that residential buildings built before the 1990s, which did not implement energy retrofitting, are relatively less energy efficient, and the energy efficiency of buildings started to increase due to the increasing interest in energy since the 1990s. After 2005, due to the mandatory thermal energy efficiency, residential buildings have an energy efficiency of at least 5-stars.
In this study, the prototypes of the existing building stock in Greater Dandenong are divided into five dwelling types based on the construction year considering the building energy efficiency. Table 3 shows the five dwelling prototypes matched to the main five dwelling brackets considering building energy efficiency, and Table 4 shows the related building type, floor area and energy efficiency for each prototype. In this study, the historical/heritage buildings are not considered. This is because the historical/heritage buildings are low in number relative to the total housing stock (2400 across the whole of Victoria [90]) and the number is considered to be insignificant when considering actual residential purposes.
‘Type 1’ represents the largest proportion of houses, representing the 35,665 detached houses built up to 1990 [86]. Buildings built before 1990 are houses before energy regulations were implemented in Victoria. These houses have an average energy efficiency rating of 1.5 energy stars (501 MJ/m2/year for heating and cooling) [59]. Some of the building stock that were built prior to 1990 might have some upgrades but these are, for the most part, focused on kitchen and bathroom updates and minor extensions, and are not usually motivated by improving their thermal efficiency. Besides, there are no accurate data for prior renovations. Thus, in the present study, we assumed that this cohort of dwellings has a 1.6-star energy efficiency rating.
‘Type 2’ represents detached houses built between 1991 and 2005 after insulation was made mandatory for new houses in 1990. According to the NEXIS database [86], there are about 1814 Type 2 houses in the City of Greater Dandenong. The average energy efficiency of houses built during this period is about 3.0 energy stars (316 MJ/m2/year for heating and cooling). In the present study, we adopted an average 3-star energy efficiency rating for Type 2.
‘Type 3’ represents detached houses built after 2006, which number around 2299 in Greater Dandenong [86]. This is the time when 6-star energy efficiency regulation was introduced, so the energy efficiency of Type 3 is set at 6 stars (123 MJ/m2/year).
‘Type 4’ represents semi-detached houses built before 2005. There are 4979 semi-detached houses in Greater Dandenong [86]. According to Sustainability Victoria [59], Type 4 houses have an energy efficiency of 3 stars (269 MJ/m2/year).
‘Type 5’ represents semi-detached houses built after 2005. There are about 637 semi-detached houses in Greater Dandenong [86]. Type 5 is also set at 6 stars (123 MJ/m2/year).
3.2. Energy and GHG Modelling of Existing Buildings
Since the energy efficiency building code requirements for residential buildings in Australia regulate heating and cooling energy only, in the present study, we also considered only the heating and cooling components of the buildings’ operating energy (B6 in Figure 1). These are modelled using AccuRate software [83,84].
Table 4 shows the energy star ratings for Type 1 to Type 5 houses before retrofitting and the corresponding characteristics of the building envelopes (exterior wall, window, floor area and ceiling dimensions typical for each type).
AccuRate was used to evaluate the reduction in the annual cooling and heating operating energy of the dwellings obtained by improving the annual operating energy efficiency of existing building stocks in Greater Dandenong to 8 energy stars (nearly zero; see Table 1). AccuRate assesses the energy requirements and determines an energy load and energy rating (between 0 to 10 stars) for both new and existing dwellings, taking into account factors such as climate zones, total cooling and heating energy load, construction types, window types and glazing, insulation details, etc. [52,91].
We assumed that the living and bedroom spaces have to be maintained within a certain range of thermal comfort by using an artificial heating or cooling appliance, if needed. Based on NatHERS [74], the required conditioned time and thermostat setting for space heating and cooling for each location are shown in Table 5.
3.3. Upgrade of Existing Buildings
Effective retrofit measures to reduce the energy consumption and the corresponding GHG emissions include upgrading the energy performance of building dwelling by increasing ceiling insulation, replacing single-glazed windows with double-glazed windows and the installation of thermal curtains [92]. At the same time, improving wall insulation and the heating system can also effectively reduce energy consumption, along with other potential retrofit options listed in Table 2. While draught sealing is one of the most efficient ways of improving the efficiency of a building shell, it is already common across the majority of the building stock; drapes and pelmets did not make significant impacts and are difficult to model. Therefore wall, ceiling and floor insulation and double-glazed windows were the only retrofits modelled across the prototypes. These retrofits were added to the ‘building prototype modelling’ to achieve the target NatHERS ratings of 8 stars for the different prototypes. The exception is a target of 6.5 stars for the pre-1990 stand-alone dwelling bracket (Type 1) because it will not be economically worthwhile to improve this building stock from 1.5 stars to 8 stars.
The target energy star ratings and upgrade options for each prototype are summarised in Table 6.
3.4. Lifecycle Analysis of Upgrading the Existing Building Stock
3.4.1. Lifecycle Energy and GHG Emissions of Upgrading Existing Buildings
In analysing the lifecycle energy and GHG emissions of the retrofitted building stocks in Greater Dandenong, the operating energy reductions and avoided GHG emissions that result from the retrofits and the embodied energy and GHG emissions associated with the retrofits needed to be calculated and balanced. Lifecycle energy can be obtained by summation of embodied energy, which is consumed for manufacturing material (A1–A3), transportation to site (A4) and any product replacement during the whole life of the building (B5) and the upgraded operational energy (B6). Energy savings are calculated for each prototype as the difference between operational energy requirements before and after the installation of retrofits, which included embodied components as shown in Equation (2). Therefore, the total energy savings resulting from the retrofit of buildings in a local government area can be obtained by multiplying the energy savings for each prototype obtained by Equation (2) by the total building stock for each prototype in the area, as shown in Equation (3).
where Energy Saving,i is the annual energy saving due to the upgrade of building Type i (MJ/m2/year), Building Stocki is the existing residential building stock of Type i (m2), Energybase,i and Energyret,i are the annual energy use before and after retrofits of building Type i (MJ/ m2/year for Type i). Embodied energyi is the energy associated with the building products due to the upgrade of Type i during the life cycle (production (A1–A3), transport to site (A4)) and use stage (replacement, B5 in Figure 1). Total Energy SavingCity j is the total energy savings due to the upgrade of the whole residential building stocks in a given area j.
The avoided GHG emissions are quantified in a similar way (as shown in Equations (4) and (5)) except for the needed separation in operational heating and cooling requirements to account for gas and electricity savings. Percentages of gas and electricity use for heating and cooling are determined from information in the Victorian Households Energy Report [59] and the total amount of gas and electricity savings per year summed for each prototype. The quantity of GHG emission reductions per year as a result of the retrofits are then measured for each prototype as the product of the gas/electricity savings in MJ and the GHG emission factors. The sum of these gives the total GHG emission savings per year in kg-CO2eq emissions saved per year. As mentioned previously, the GHG reductions per year are summed for each prototype, multiplied by the number of each prototype in the City of Greater Dandenong and then summed to give a total weight of potential CO2eq savings per year.
To quantify the embodied energy of the retrofits and their installation, the total quantities of each of the different retrofits used are obtained for each of the five prototypes. The embodied energy, embodied GHG emissions and installation costs of each material used for building retrofit are shown in Table 7. The densities of the cellulose fibre and glass fibre batt insulations used are 30 kg/m3 [93] and 20 kg/m3 [94], respectively, irrespective of insulation R-values (which define the insulation thickness). The product of the densities and the corresponding insulation volume gives the weight of insulation used which is then multiplied by an embodied energy factor ([95,96] as shown in Table 7) to calculate the total amount of embodied energy in MJ. The embodied energy of retrofit construction materials is calculated by Equation (6).
where
- EFn: embodied energy factor for material n in MJ/quantity of construction material
- Qi,n: material consumption for upgrading of building Type i,
- i: building Type (1–5 as shown in Table 6)
The total embodied energy due to retrofitting was obtained by multiplying the total floor area (m2) of existing residential buildings for each prototype in the City of Greater Dandenong by the embodied energy (MJ/m2) of the retrofit per unit floor area applied to each prototype. The total embodied GHG was calculated in similar way as the total embodied energy but as the product of the volumes of the retrofit construction materials and their respective embodied GHG factors for Australian building products [96,97] from the ecoinvent LCI database (v. 3.0).
In addition, this study quantified the energy recovery period (payback time, year), i.e., the time it takes to recover the total energy used in retrofits as saved energy. This was quantified using Equation (7).
The lifecycle GHG emission analysis mirrors this method by using the embodied GHG requirements and the avoided operational GHG emissions, followed by determination of the time taken to balance the two.
3.4.2. Lifecycle Cost Analysis of Retrofitting Existing Buildings
In addition to the energy and carbon savings due to the retrofits, the payback period (i.e., how long it will take to financially recoup the entire retrofit investment) is one of the key factors that determines whether a retrofit is implemented. Retrofit costs are quantified using rates in $/m2 for construction work [98] multiplied by the area of the corresponding retrofit in m2. Then, the total costs for each prototype are summed for all retrofits. Savings per year due to reduced gas and electricity requirements for heating and cooling are quantified according to the change in operational gas and electricity usage per year (as found when quantifying operational GHG emissions) using the conversion factors in Table 8 and their respective tariffs from the most recent local energy bills.
A payback period (the number of years required to balance the capital expenditure and the annual savings) is calculated as the capital costs of installing the retrofits, divided by the net operational energy savings per year, similar to the previous payback periods [in the form of Equation (7)] calculated for energy and GHG emissions.
4. Results and Discussion
4.1. Lifecycle Energy Impacts
4.1.1. Individual Prototype Energy Reduction
Figure 3 shows the energy consumption (operational and embodied, including A1–A3, A4, B5 and B6) before and after retrofitting for each prototype. The left side (denoted ‘Typical’) for each prototype shows the annual heating and cooling energy demand before the retrofit, and the right bar (denoted ‘Upgraded’) shows the annual cooling and heating energy reduced through the retrofit and the sum of embodied energy used for the retrofit (A1–A3, A4 and B5).
Recall that a Type 1 stand-alone house built pre 1990 consumes 501 MJ/m2/year (1.5 stars). Due to cold and dry weather in the City of Greater Dandenong, more than 96% of this energy consumption is used for heating energy.
Some building stocks in this group are much older (even more than 50 years) but most are probably at least 30 years old. An average age of 44 years was assumed (i.e., built in 1977). To upgrade a Type 1 dwelling’s energy efficiency rating to 8 stars was not going to be cost-effective, so the target performance was adjusted to 6.5 stars, as shown in Table 6, which is slightly higher than the current 6-star building energy regulation for new dwellings. This retrofit means an operating energy consumption reduction that is 80% less than that for the original case (and a savings of 404 MJ/m2/year). However, the retrofit effort accounts for 570 MJ of the embodied energy consumed for the wall and ceiling insulation and double glazing of windows. Residential buildings have different life spans depending on their usage, climatic conditions and user behaviour. However, it is generally accepted in Australia that they last at least 60 years [102]. Therefore, the average life span of residential buildings was assumed to be 60 years. This means that the residual life of a Type 1 dwelling in the existing stock is 14 years (obtained by subtracting the service life from the average life to the present year 2021). Dividing the embodied energy (570 MJ/m2) by the residual life (14 years) yields the annual embodied energy per year for Type 1 (40.7 MJ/m2/year). This annual embodied energy includes initial (33.3 MJ/m2/year for A1–A3) and transportation energy (7.4 MJ/m2/year for A4) to the site (Figure 3). Since the average life of the materials (insulation and double glazing) used for retrofitting is longer than the residual life of Type 1, the embodied energy due to replacement (B5) in the use stage was not included. The total annual energy of the upgraded Type 1 is 138 MJ/m2/year, which is 40.7 MJ/m2/year of embodied energy plus the annual operational energy of 97 MJ/m2/year (Figure 3). Thus, considering the annual embodied energy, the net lifecycle energy reduction due to the upgrade of a Type 1 dwelling from 1.5 stars to 6.5 stars in the Greater Dandenong suburb is 363 MJ/m2/year.
A Type 2 stand-alone house built between 1990 and 2005, originally rated 2.9 stars on average, consumes 316 MJ/m2 for heating and cooling per year. The energy reduction of Type 2 when retrofitted to 8 stars is 259 MJ/m2 per year, which is 82% less before the upgrade (Figure 3). However, the retrofit consumes 306 MJ/m2 of embodied energy (254 MJ/m2 for A1–A3 and 52 MJ/m2 of transportation to the site, A4). A Type 2 house has been assumed to be on average built in 1990. Thus, the residual life of this building is 29 years. Since the service life of double-glazed windows is assumed to be 20 years (Table 7), they require one replacement after the upgrade during the life span of a Type 2 dwelling. The embodied energy from the replacement of the double glaze is 93 MJ/m2 (including 50 km of transport distance). Thus, the total embodied energy is 398 MJ/m2, and the annual embodied energy for the retrofit is 13.7 MJ/m2/year (64% for A1–A3, 13% for A4, and 23% for B5 to replace the windows). Thus, the net life cycle energy reduction is 246 MJ/m2/year (Figure 3).
A Type 3 stand-alone house built after 2005, with a minimum 6-star energy efficiency rating, consumes 123 MJ/m2 for heating and cooling a year. The upgrade to 8-star efficiency attained by increasing the insulation in the ceilings and walls and replacing current glazing with double glazing results in 55 MJ/m2 of heating and cooling per year (Table 6). This means an energy savings of 55 MJ/m2 per year through retrofitting, or 56% of energy savings without retrofit. This is relatively less effective than for Type 1 (72% reduction) and Type 2 (78% reduction) dwellings because the latter had poor energy efficiency ratings originally before the upgrade. The retrofit of Type 3, assumed to have been built in 2006 on average, also shows less embodied energy, which is 232 MJ/m2 in total or 5.2 MJ/m2/year. Deducting this annual embodied energy from the total annual energy reduction, the net life cycle energy saving is 63 MJ/m2/year.
A Type 4 semi-detached house built pre-2005, with a 3-star rating (Table 4 and Table 6, [59] SV, 2015), consumes 299 MJ/m2/year for heating and cooling. When retrofitted to 8-star, the energy consumption is reduced to 54 MJ/m2 per year (i.e., 82% less). The retrofit’s (see Table 6) total embodied energy is 330 MJ/m2 (for A1–A3, A4 and B5). Assuming 29 years of residual life, the annual embodied energy is 10.3 MJ/m2/year. Thus, the life cycle net energy saving is 235 MJ/m2/year (Figure 3).
A Type 5 semi-detached house built after the introduction of mandatory energy efficiency regulation (6 stars), assumed to be built in 2005 and with a residual life of 44 years, requires 123 MJ/m2/year. By applying the retrofit options in Table 6, the heating and cooling energy is reduced by 53 MJ/m2/year (53% less than that for the original house). The total embodied energy associated with the retrofit is 363 MJ/m2. The annual embodied energy is 8.2 MJ/m2/year, which is 20% less than that for Type 4 but 60% higher than that for Type 3. The total life cycle net energy saving by upgrading the energy efficiency to 8 stars is 61 MJ/m2/year (Figure 3).
4.1.2. Building Stock Energy Reduction
The sum of the embodied energies of each prototype is shown in Table 9 (Part A). The second column shows the sum of the annual embodied energy consumed to upgrade each prototype as described earlier. This shows that 77 MJ/m2/year of embodied energy is required to improve the energy efficiency of 1 m2 of prototype buildings. Since Type 1 has the lowest original energy efficiency of 1.6 stars (Table 4 and Table 6), it requires the most effort to retrofit and thus also the highest embodied energy (53% of the total, 2nd column in Table 9, Part A).
The third column of Table 9 (Part A) is the embodied energy per unit floor area multiplied by the total floor area of each type in the City of Greater Dandenong. Given the current building stocks, a total embodied energy of 29 TJ/year is required to improve the energy efficiency of all existing housing stocks to 6.5 or 8 stars (3rd column, Table 9). In particular, 98% of this relates to the retrofit of Type 1 dwellings. The share of other dwelling types individually only accounts for 1% or less of the total annual embodied energy. By multiplying the annual embodied energy by the remaining residual life of each type, the total embodied energy during the lifespan of whole residential building stocks in the City of Greater Dandenong is obtained as 421 TJ (4th column, Table 9). Similar to the annual embodied energy (2nd column), most of the embodied energy is attributed to Type 1 (95% of the total), while the annual embodied energy for all other types accounts for a significantly lower share of the total.
The net energy savings are obtained by subtracting the embodied energy required to improve energy efficiency from the operational energy reduction due to retrofitting for each type. The second column in Part B, Table 9, shows a pronounced pattern for the energy reduction effects. The net energy saving effects in the City of Greater Dandenong are obtained by multiplying the annual net energy saving per unit floor area of a prototype (MJ/m2/year, 1st column of Part B in Table 9) by the total residential building stocks in Greater Dandenong. By upgrading the existing housing stock, 3937 TJ of heating and cooling energy could be saved every year. Although the energy efficiency improvement of Type 1 is relatively low compared to the other dwelling types (only up to 6.5 stars for Type 1 compared to 8 stars for the others), most of the annual energy saving are attributed to Type 1. When we consider the residual life of the existing building stocks, the total energy savings increase to 69,287 TJ, again with the net energy savings from Type 1 dwellings dominating, accounting for 82% of the total energy reduction (3rd column of Part B in Table 9).
4.2. Lifecycle GHG Emission Impacts
4.2.1. Individual Prototype Carbon Reduction
The GHG impacts from upgrading each dwelling type considering the emissions from both the operational (B6) and embodied components (A1–A3, A4 and B5 for replacement) over their lifecycle are shown in Figure 4.
A Type 1 dwelling’s annual carbon emissions due to heating and cooling are significantly reduced to 10.5 kg CO2eq/m2/year due to the retrofit. However, 6.5 kg CO2eq/m2/year of embodied carbon is emitted in the retrofitting process. With an average remaining residual life of 14 years (out of an assumed 60-year service life), the replacement of materials used in the retrofit is not considered during the remaining period of Type 1. Thus, a Type 1 dwelling has 6.8 kg of CO2eq/m2/year of embodied and 10.5 kg of CO2eq/m2/year of operational GHG emissions. Considering the carbon emissions of these two components (embodied and operational), the total carbon emissions after retrofit is 34 kg CO2eq/m2, a 66% net reduction.
In the case of Type 2 and Type 4 dwellings, the difference in GHG emissions before and after retrofit is significant even when considering the embodied carbon emissions due to the retrofit. The annual carbon reductions for Type 2 and Type 4 are 23 kg CO2eq/m2/year and 22 kg CO2eq/m2/year, respectively. In absolute terms, the carbon reduction figures are less than those in Type 1, but the reduction rates of 74% and 75% before and after retrofitting, respectively, are better compared to Type 1′s 66% reduction rate.
On the other hand, for Type 3 or Type 5 dwellings, the carbon reduction effects are much smaller compared to the other types (Figure 4). This is explained by the fact that the energy retrofit upgrade to 8 stars is based on the starting energy rating of these dwelling types of 6 stars.
Table 10 shows the relative contributions of each dwelling type to the total embodied GHG emissions (1st column under Part A) and the net GHG emissions reduction (1st column under Part B) by upgrading each type as summarised in Table 6. In both Part A and Part B, Type 1 reductions account for the largest percentage of the total of the five dwelling types: 61% of the total embodied GHG emissions per unit of floor area and 34% of the total net GHG emissions reduction. Types 2, 4 and 5 show higher total embodied GHG emissions per unit floor area while Type 3 accounts for the minimum embodied GHG emissions with 0.3 kg CO2/m2/year (3% of the total embodied GHG emissions). Types 3 and 5 show the lowest net GHG emissions reduction of 6% and 4%, respectively.
4.2.2. Building Stock Carbon Reduction
The total embodied GHG emissions in the City of Greater Dandenong, obtained by multiplying the total embodied GHG emissions of a prototype (2nd column under Part A in Table 10) by the total building stocks (Figure 2), are 4272 t CO2eq/year. Similar to the embodied energy in the previous sub-section, Type 1 dwellings contribute most to the overall embodied GHG emissions, accounting for 98% (4204 t CO2eq/year) of the total. This is because, similar to most other established cities in Australia, Type 1 dwellings account for the largest slice of the total residential building stock (Figure 2).
The net GHG emissions reductions resulting from the retrofit of the residential building stock in Greater Dandenong are shown in Part B of Table 10. The city could avoid 0.372 million t of GHG emissions every year through the retrofitting of the existing residential building stocks, and a total of 6.541 million t of GHG emissions can be avoided when the remaining life of each dwelling type is taken into account. Since the dwelling stocks of Type 3 and Type 5 have at least a 6-star energy efficiency rating, even if their efficiency is improved to 8 stars, their collective impacts are not significant. On the other hand, the retrofitting of Type 1 dwellings leads to a significant amount of avoided net GHG emissions: 91% of the GHG emissions avoided every year and 83% of GHG emissions considering their lifespans.
4.3. Financial Impacts
4.3.1. Lifecycle Cost
The costs of retrofitting each typical prototype include the upfront, operational and maintenance costs across each dwelling’s lifecycle, indicating the financial impact experienced by the house owner. Figure 5a shows the lifecycle costs considering the residual life for each dwelling type; Figure 5b shows the lifecycle costs considering the total residential building stock in Greater Dandenong. The insulation or double-glazing considered in this study does not require maintenance costs. Thus, the maintenance costs were not considered in this study. However, due to the retrofitting of the existing facility, the cost of facility replacement was included for double-glazed windows.
The first column of each prototype in Figure 5a shows the lifecycle cost before the retrofit (annual heating and cooling energy cost [$/m2/year × remaining life in years]), and the second column is the cooling and heating cost after the retrofit plus the retrofit cost. In all cases (and each dwelling type), the overall lifecycle costs are reduced after the retrofit.
Looking at cost savings by dwelling type, Type 4 (semi-detached built pre-2005) has the largest lifecycle cost reduction due to the retrofit. In particular, $448/m2 of heating and cooling energy will be consumed in the remaining period of 31 years. With improved 8-star energy efficiency after the retrofit, the cost of cooling and heating energy during the same period will be reduced to $86.2/m2, while the cost of the retrofit itself is $72/m2. Thus, the total lifecycle energy cost of the Type 4 retrofit is $158/m2, which is a savings of $289 compared to the lifecycle cost without the retrofit. Type 2 follows this by a savings of $253/m2, then Type 1 with a saving of $200/m2. On the other hand, Type 3 and Type 5 showed relatively little reduction in the lifecycle energy cost.
Figure 5b shows the results obtained by applying the above lifecycle cost reductions for each dwelling type to the entire existing residential building stock in the Greater Dandenong suburb. The lifecycle cost reduction for retrofitting all Type 1 dwellings is 51% of the original heating and cooling energy costs, with an absolute amount of $834 million saved. The retrofit of all Type 4 and Type 2 dwellings shows 65% and 54% cost savings, respectively. This means absolute savings of $241 million and $127 million, respectively.
Retrofitting the residential building stocks in the City of Greater Dandenong will save $2368 million in heating and cooling energy costs. Retrofitting Type 1 building stocks from an average energy efficiency rating of 1.5 stars to 6.5 stars accounts for more than 83% of these savings. Retrofitting Type 2 and Type 4 building stocks to 8-star energy efficiency will contribute about 5% to 10% of the total lifecycle cost savings. However, retrofitting Type 3 and Type 5 building stocks accounts for less than 1% of the overall life cycle energy cost savings.
4.3.2. Payback Period
A key factor in the feasibility of retrofitting residential buildings is the time taken to financially break even on the investment. A shorter payback period will make it more attractive to many householders. Table 11 presents the total energy consumption, GHG emissions and upfront cost to upgrade each dwelling type in the City of Greater Dandenong.
Table 11 shows the environmental and financial balance for each dwelling type in Greater Dandenong. The first row from the top indicates the residual life for each type in the City of Greater Dandenong. For example, Type 1, assumed to have been built in 1975 on average, has a remaining life of 14 years obtained by subtracting the current age of Type 1 (1975–2021) from the average lifespan of 60 years. The following set of three rows from the top shows how much energy was consumed (embodied energy) and saved (operating energy) as buildings are upgraded and how long the energy payback is due to this balance. The middle set of three rows shows the GHG balance emitted and avoided by upgrading the existing residential buildings and the corresponding payback time for each type of residential building stock. The last set of three rows shows the retrofit cost, energy cost savings obtained through the retrofit and the breakeven year when the retrofit cost is compensated by the energy savings.
The energy payback time shows that all of the energy used for the retrofit (embodied energy) of Type 1, Type 2 and Type 4 building stocks could be recovered within 1.5 years. However, Type 3 and Type 5 building stocks will take 3.4 and 5.2 years longer than these three types. Altogether, if the whole residential building stock is retrofitted based on Table 6, the energy payback time will only be 1.4 years.
The carbon period time for all dwelling types, with the exception of Type 5, to offset all GHG emissions from the retrofit is three years or less. Type 5 buildings will need more than 11 years of avoided emissions to offset the embodied GHG emissions for the retrofit.
The financial payback time is different from the energy and carbon payback times. The stock of Type 1 and Type 4 dwellings shows a similar pattern of short payback periods in energy and carbon. However, it will take 33.8 to 35 years to recover the cost invested in upgrading Type 3 and Type 5 dwellings built after 2005. As previously noted, the environmental impacts of the upgrade of these dwelling types from 6 stars to 8 stars through retrofitting is relatively insignificant, and the costs are significant. Moreover, as shown in Figure 2, these two types of building stock are relatively small at 5% and 2% of the citywide residential building stock, so the return on investment from these types of upgrades will take much longer. However, even if all dwelling types in the residential stock are upgraded, the financial payback period for the whole effort will only be 6.4 years.
4.4. Implications
The City of Greater Dandenong in the Metropolitan Melbourne suburbs in Australia has the potential to save around 4363 TJ/year of operational heating and cooling energy if the entire residential building stock in the city is retrofitted to upgrade the primary dwelling types in Table 3 and Table 4 as indicated in Table 6. This translates to avoided operational GHG emissions of nearly 442.1 kt CO2eq per year. Since the embodied carbon associated with the retrofit process is relatively small (4.27 kt CO2eq per year as shown Table 10), when this is taken into account, the lifecycle (net) GHG emissions that can be avoided amount to 372.6 kt CO2eq per year (Table 10). Considering the remaining life of the current dwellings, the overall carbon footprint reduction from retrofitting the existing dwellings in Greater Dandenong, compared to the default non-retrofitted dwellings, will be about 6541.3 kt of CO2eq (Table 10). Considering that Australia’s annual GHG emissions per household are about 15 t CO2eq per year [103], this is equivalent to about 24,800 households being carbon-free each year in Victoria.
Reducing the actual GHG emissions from the building and construction sector into the atmosphere requires the explicit consideration of embodied energy and embodied GHG emissions in carbon calculations and reporting. Compared to the more common practice of demolishing old dwellings and building new ones, extending the life of existing dwellings and improving their energy efficiency contribute to climate mitigation efforts through avoided GHG emissions and also minimise the adverse impacts of construction waste and the use of natural resources that would otherwise be needed for new products and house construction.
The total energy reduction and the avoided GHG emissions for the entire residential building stock are significant, and the environmental breakeven point is relatively low for all dwelling types. However, this can be attributed primarily to the energy efficiency upgrade of the stand-alone pre-1990 Type 1 dwellings–which account for 91% of the avoided GHG emissions–because of (a) the massive energy performance improvements from their original 1.5-star to 6.5-star rating and (b) the proportionately large quantity of Type 1 dwellings in Greater Dandenong (82% of the existing housing stock, Figure 2). These have also been observed in past studies [51,76].
The other dwelling types account for a much smaller proportion of the existing housing stock (between 2% to 7%, Figure 2). Thus, their overall impacts are small even though, for example, Type 2 (standalone house built between 1991–2005) and Type 4 (semi-detached house built pre-2005) show the largest avoided GHG emissions per unit floor area, which are 74% and 75%, respectively, less than before the upgrade (Figure 4).
This means that from a government or industry perspective, they can develop and implement a highly targeted and very cost-effective policy and/or program initiative that could have widespread and significant impacts. For example, they can address the mass Type 1 dwelling decarbonisation opportunities as demonstrated in the present study. At the same time, they can also initiate, on their own or in partnership with other stakeholders including the community or eligible householders themselves, programs that incentivise or support individual households to undertake effective energy retrofitting of their own dwellings (e.g., those in Type 2 and Type 4 dwellings). Meanwhile, the program (s) to support the households in Type 3 and Type 5 dwellings may be more focused on low- or zero-emissions energy supply systems rather than energy efficiency upgrades. Of course, any programs focused on the uptake of cleaner and renewable energy supply and storage systems should or could also be accessible to the households in other dwelling types.
Costs associated with energy saving retrofits play a major role in determining the feasibility of upgrading existing houses. While insulation costs are not significantly large, the cost of installing double-glazed windows may be prohibitive, if not downright outside the feasible options, for most householders. Despite this, the financial payback period for Type 1, Type 2 and Type 4 dwelling retrofits are 5.9 years, 6.2 years and 10.6 years, respectively. Many individual householders may find the lower range of these to be reasonable. However, as Table 11 shows, despite the very long unreasonable payback period of greater than 30 years for Type 3 and Type 5 dwellings, especially from the perspective of an individual household, the payback period for the retrofit of the entire housing stock in Greater Dandenong is only 6.4 years. For a state government body, this may look like a very reasonable investment in decarbonisation.
The outcomes of these types of city-wide retrofit programs will not only have broad community and significant environmental benefits, but will also contribute to state and/or federal government efforts and commitments towards their “net zero” goals.
Despite the present study’s various limitations, simplifications and assumptions, we can already use these observations and findings to consider potentially cost-effective approaches to reduce the carbon footprint of the residential building sector and to explore the roles of a selected number of actors or stakeholders. More detailed and comprehensive research that deals with a broader set of factors at a more granular level including those from both sides of the energy supply and demand equation (e.g., more retrofit package options alone and with renewable supply and storage packages) and that considers the types and range of uncertainties will lead to even more tailored and cost-effective programs.
5. Conclusions
Carbon footprint assessment and reporting in the building sector should explicitly include and account for embodied impacts–and not just focus on operating energy and related GHG emissions–and should especially explore the climate mitigation contributions of, and opportunities in, the existing building stock. The latter’s environmental and climate impacts overwhelmingly dominate the overall contributions of the sector to these impacts–compared to those from new house construction–and will last as long as their remaining service life.
Considering the case of the City of Greater Dandenong, a typical middle-class suburb within Metropolitan Melbourne in Australia, we showed that implementing a suite of basic energy retrofitting of the housing stock can be cost-effective in significantly reducing the stock’s energy and carbon footprints. The city has the potential to save lifecycle energy of around 3937 TJ per year and achieve lifecycle avoided GHG emissions of 372.6 kt CO2eq per year. Across the total remaining life of the current dwelling stock, the overall carbon footprint reduction from retrofitting the existing dwellings in the city–compared to the default non-retrofitted dwellings–is about 4421 kt of CO2eq.
The components of the carbon footprint considered herein included the operating carbon (B6 in EN15978 [32]) and the embodied carbon associated with the retrofit options (A1-A4 and B5). The energy use reduction and carbon mitigation opportunities of the entire residential building stock in the Greater Dandenong suburb were analysed based on five primary dwelling types through an energy retrofit program that targeted a 6.5-star energy efficiency rating for the oldest dwelling type (Type 1) and an 8-star energy rating for the other dwellings (Type 2, Type 3, Type 4 and Type 5). Both of these retrofit targets are higher than the current 6-star energy efficiency requirement for new houses in Australia.
We highlight the following findings:
- Because Type 1 dwellings (stand-alone built pre-1990) comprise 82% of the existing housing stock in Greater Dandenong, when retrofitted from their original 1.5 stars to 6.5 stars energy rating, they account for 91% of the total avoided GHG emissions every year if all dwelling types in the existing stock are also upgraded and 83% of the total avoided GHG emissions considering their remaining lifespans.
- The embodied energy associated with the retrofits remained within acceptable limits for all the five prototypical dwellings analysed and was balanced with operational energy savings resulting from the retrofits in a short period of time (ranging from 1.4 to 5.2 years).
- The embodied GHG emissions associated with the retrofits also balanced the avoided operational GHG emissions resulting from the retrofits within a short period of time (between 1.5 and 2.6. years) except for the Type 5 semi-detached house (built after 2005), which achieved the balance in 11.3 years.
- The financial payback periods for the Type 1, Type 2 and the Type 4 dwelling retrofits are 5.9 years, 10.6 years and 6.2 years, respectively. However, the payback periods for the retrofit of the more recently built Type 3 and Type 5 dwellings (built after 2005) are more than 30 years. Their starting energy efficiency rating is high at 6 stars, and these dwellings have relatively larger floor areas than the older ones.
These and the other findings discussed in the paper provide valuable information and guidance for key stakeholders in developing and implementing cost-effective and carefully targeted policy and/or program initiatives that could have widespread and significant impacts. For example, the retrofit of Type 1 dwellings at the city level can be prioritised for decarbonisation efforts through government policy and financial investments. To complement this, the community and/or eligible householders can be incentivised and supported to undertake effective energy retrofit of their own dwellings (e.g., especially those in Type 2 and Type 4 dwellings). Meanwhile, the program (s) to support the households in Type 3 and Type 5 dwellings may be focused more on low- or zero-emissions energy supply systems rather than energy efficiency upgrades.
The approach demonstrated in the paper can be undertaken for other Australian cities and/or for other jurisdictions such as at the state, province or territory level. Depending on the analysis objectives and desired level of granularity and details, the representative existing dwelling typologies can be expanded, say from five to twenty-five, and the retrofit package options for different representative dwelling types can also be expanded. Because of the nature of the NatHERS system, in this study, the retrofit of the dwellings focused only on improvements in the thermal envelope that directly affects the cooling and heating energy.
Future work should expand on the simplifications and assumptions in the present paper and consider the impacts of various other factors that might influence one or both sides of the energy supply and demand equation, including household or occupant behaviours, role of technology, low-or zero-carbon energy supply and storage systems, standards and regulations, impacts of climate change on energy demand and system resilience, etc. Buildings built before 1990, which account for a significant portion (92%) of all building stocks, were grouped into a single category. However, it is necessary to analyze the energy retrofit effect for each by dividing them in more detail. It will also be important to take into account the types and range of uncertainties around these factors with respect to potential outcomes (e.g., [104]). Additional in-depth research and better data will be needed to inform future scenarios analysis, especially in the estimates of the remaining life of different dwelling prototypes representative of the residential stock in the study city and the inclusion of more lifecycle stages in the calculation of carbon footprints such as construction for retrofitting (A5) and disposal of waste generated during construction and replacement. Furthermore, the critical roles and contributions of key actors or stakeholders to influence outcomes (e.g., [105]) need to be further investigated.
Author Contributions
S.S. and G.F. conceptualized the study, collected the data, performed the empirical calculations, designed the methodology, validated the results and edited the paper. All authors have read and agreed to the published version of the manuscript.
Funding
This research received no external funding.
Institutional Review Board Statement
Not applicable.
Informed Consent Statement
Not applicable.
Data Availability Statement
The data presented in this study are available on request from the corresponding author. The data are not publicly available due to formatting and processing reasons.
Conflicts of Interest
The authors declare no conflict of interest.
References
- UN Environment Programme. 2020 Global Status Report for Buildings and Construction: Towards a Zero Emissions, Efficient and Resilient Buildings and Construction Sector; United Nations: Nairobi, Kenya, 2020. [Google Scholar]
- European Commission. A Clean Planet for All: A European Long-Term Strategic Vision for a Prosperous, Modern, Competitive and Climate Neutral Economy; European Union: Brussels, Belgium, 2018. [Google Scholar]
- UK Government. Rigorous New Targets for Green Building Revolution, Ministry of Housing, Communities & Local Government. Available online: https://www.gov.uk/government/news/rigorous-new-targets-for-green-building-revolution (accessed on 25 February 2021).
- WorldGBC. The Net Zero Carbon Buildings Commitment. Available online: https://www.worldgbc.org/thecommitment#_ftn1 (accessed on 25 February 2021).
- European Commission. Most Residential Buildings Were Built before Thermal Standard Were Introduced. 2014. Available online: https://ec.europa.eu/energy/content/most-residential-buildings-were-built-thermal-standards-were-introduced_en (accessed on 26 September 2021).
- International Energy Agency (IEA). Technology Roadmap. Energy Efficient Building Envelopes; OECD: Paris, France, 2013; p. 68. [Google Scholar]
- Jafari, A.; Valentin, V.; Russell, M. Sensitivity analysis of factors affecting decision-making for a housing energy retrofit: A case study. Constr. Res. Congr. 2016, 1254–1263. [Google Scholar] [CrossRef]
- Jafari, A.; Valentin, V. An investment allocation approach for building energy retrofits. Constr. Res. Congr. 2016, 1061–1070. [Google Scholar] [CrossRef]
- WorldGBC. From Thousands to Billions. World Green Building Council: USA, 2017. Available online: https://www.worldgbc.org/news-media/thousands-billions-coordinated-action-towards-100-net-zero-carbon-buildings-2050 (accessed on 8 September 2021).
- Felius, L.C.; Hamdy, M.; Dessen, F.; Hrynyszyn, B.D. Upgrading the smartness of retrofitting packages towards energy-efficient residential buildings in cold climate countries: Two case studies. Buildings 2020, 10, 200. [Google Scholar] [CrossRef]
- Huang, H.; Nazi, W.I.B.W.M.; Yu, Y.; Wang, Y. Energy performance of a high-rise residential building retrofitted to passive building standard—A case study. Appl. Therm. Eng. 2020, 181, 115902. [Google Scholar] [CrossRef]
- Li, Y.L.; Han, M.Y.; Liu, S.Y.; Chen, G.Q. Energy consumption and greenhouse gas emissions by buildings: A multi-scale per-spective. Build. Environment. 2019, 151, 240–250. [Google Scholar] [CrossRef]
- Li, X.; Yao, R. Modelling heating and cooling energy demand for building stock using a hybrid approach. Energy Build. 2021, 235, 110740. [Google Scholar] [CrossRef]
- Hart, R.; Selkowitz, S.; Curcija, C. Thermal performance and potential annual energy impact of retrofit thin-glass triple-pane glazing in US residential buildings. Build. Simul. 2019, 12, 79–86. [Google Scholar] [CrossRef]
- Hosseinpour, M.; Hajialirezaei, A.H.; Soltani, M.; Nathwani, J. Thermodynamic analysis of in-situ hydrogen from hot com-pressed water for heavy oil upgrading. Int. J. Hydrog. Energy 2019, 44, 27671–27684. [Google Scholar] [CrossRef]
- Katsaprakakis, D. Introducing a solar-combi system for hot water production and swimming pools heating in the Pancretan Stadium, Crete, Greece. Energy Procedia 2019, 159, 174–179. [Google Scholar] [CrossRef]
- Asim, M.; Kumar, N.U.; Martin, A.R. Feasibility analysis of solar combi-system for simultaneous production of pure drinking water via membrane distillation and domestic hot water for single-family villa: Pilot plant setup in Dubai. DESALINATION Water Treat. 2015, 57, 21674–21684. [Google Scholar] [CrossRef]
- Liu, L.; A. Keoleian, G.; Saitou, K. Replacement policy of residential lighting optimized for cost, energy, and greenhouse gas emissions. Environ. Res. Lett. 2017, 12, 114034. [Google Scholar] [CrossRef]
- Islam, G.; Darbayeva, E.; Rymbayev, Z.; Dikhanbayeva, D.; Rojas-Solórzano, L. Switching-off conventional lighting system and turning-on LED lamps in Kazakhstan: A techno-economic assessment. Sustain. Cities Soc. 2019, 51, 101790. [Google Scholar] [CrossRef]
- Enongene, K.; Murray, P.; Holland, J.; Abanda, F. Energy savings and economic benefits of transition towards efficient lighting in residential buildings in Cameroon. Renew. Sustain. Energy Rev. 2017, 78, 731–742. [Google Scholar] [CrossRef] [Green Version]
- Barkhordar, J.A. Evaluating the economy-wide effects of energy efficient lighting in the household sector of Iran. Energy Policy 2019, 127, 125–133. [Google Scholar] [CrossRef]
- Smith, C.N.; Hittinger, E. Using marginal emission factors to improve estimates of emission benefits from appliance efficiency upgrades. Energy Effic. 2018, 12, 585–600. [Google Scholar] [CrossRef]
- Guo, Y.; Zheng, G. How do firms upgrade capabilities for systemic catch-up in the open innovation context? A multiple-case study of three leading home appliance companies in China. Technol. Forecast. Soc. Chang. 2019, 144, 36–48. [Google Scholar] [CrossRef]
- Pereira, A.A.K.; Menezes, R.J.A.; Jadidi, A.; De Jong, P.; Lima, A.C.D.C. Development of an electronic device with wireless interface for measuring and monitoring residential electrical loads using the non-invasive method. Energy Effic. 2020, 13, 1281–1298. [Google Scholar] [CrossRef]
- George, D.; Swan, L.G. A method for distinguishing appliance, lighting and plug load profiles from electricity ‘smart meter’ datasets. Energy Build. 2017, 134, 212–222. [Google Scholar] [CrossRef]
- Krishnan, K.; Chinh, H.D.; Gupta, M.; Panda, S.; Spanos, C.J. Context-Aware Plug-Load Identification Towards Enhanced Energy Efficiency in the Built Environment; IEEE: Boston, MA, USA, 2018; pp. 1–6. [Google Scholar] [CrossRef] [Green Version]
- Alden, R.E.; Han, P.; Ionel, D.M. Smart Plug and Circuit Breaker Technologies for Residential Buildings in the US; IEEE: Boston, MA, USA, 2019; pp. 1018–1021. [Google Scholar] [CrossRef]
- Seyedzadeh, S.; Pour Rahimian, F.; Oliver, S.; Rodriguez, S.; Glesk, I. Machine learning modelling for predicting non-domestic buildings energy performance: A model to support deep energy retrofit decision-making. Appl. Energy 2020, 279, 115908. [Google Scholar] [CrossRef]
- Piselli, C.; Romanelli, J.; Di Grazia, M.; Gavagni, A.; Moretti, E.; Nicolini, A.; Cotana, F.; Strangis, F.; Witte, H.J.L.; Pisello, A.L. An integrated HBIM simulation approach for energy retrofit of historical buildings implemented in a case study of a medieval fortress in Italy. Energies 2020, 13, 2601. [Google Scholar] [CrossRef]
- Pallonetto, F.; De Rosa, M.; Finn, D.P. Environmental and economic benefits of building retrofit measures for the residential sector by utilizing sensor data and advanced calibrated models. Adv. Build. Energy Res. 2020, 1–29. [Google Scholar] [CrossRef]
- Krarti, M.; Aldubyan, M.; Williams, E. Residential building stock model for evaluating energy retrofit programs in Saudi Arabia. Energy 2020, 195, 116980. [Google Scholar] [CrossRef]
- CEN. EN Sustainability of Construction Works-Assessment of Environmental Performance of Buildings-Calculation Method; European Committee for Standardization: Brussels, Belgium, 2012. [Google Scholar]
- Lützkendorf, T.; Foliente, G.; Balouktsi, M.; Wiberg, A.H. Net-zero buildings: Incorporating embodied impacts. Build. Res. Inf. 2014, 43, 62–81. [Google Scholar] [CrossRef]
- Birgisdottir, H.; Moncaster, A.; Houlihan Wiberg, A.; Chae, C.; Yokoyama, K.; Balouktsi, M.; Seo, S.; Oka, T.; Lützkendorf, T.; Malmqvist, T. IEA EBC annex 57 ‘evaluation of embodied energy and CO2eq for building construction. Energy Build. 2017, 154, 72–80. [Google Scholar] [CrossRef] [Green Version]
- Röck, M.; Saade, M.R.M.; Balouktsi, M.; Rasmussen, F.N.; Birgisdottir, H.; Frischknecht, R.; Habert, G.; Lützkendorf, T.; Passer, A. Embodied GHG emissions of buildings—The hidden challenge for effective climate change mitigation. Appl. Energy 2019, 258, 114107. [Google Scholar] [CrossRef]
- Lützkendorf, T.; Frischknecht, R. (Net-) zero-emission buildings: A typology of terms and definitions. Build. Cities 2020, 1, 662–675. [Google Scholar] [CrossRef]
- Shirazi, A.; Ashuri, B. Embodied Life Cycle Assessment (LCA) comparison of residential building retrofit measures in Atlanta. Build. Environ. 2020, 171, 106644. [Google Scholar] [CrossRef]
- Shadram, F.; Bhattacharjee, S.; Lidelöw, S.; Mukkavaara, J.; Olofsson, T. Exploring the trade-off in life cycle energy of building retrofit through optimization. Appl. Energy 2020, 269, 115083. [Google Scholar] [CrossRef]
- O’Hegarty, R.; Colclough, S.; Kinnane, O.; Lennon, D.; Rieux, E. Operational and embodied energy analysis of 8 single-occupant dwellings retrofit to NZEB standard. Civ. Eng. Res. Irel. 2020, 4. Available online: https://sword.cit.ie/ceri/2020/14/4 (accessed on 10 September 2021).
- Chastas, P.; Theodosiou, T.; Bikas, D.; Tsikaloudaki, K. Integrating embodied impact into the context of EPBD recast: An assessment on the cost-optimal levels of nZEBs. Energy Build. 2020, 215, 109863. [Google Scholar] [CrossRef]
- Koezjakov, A.; Urge-Vorsatz, D.; Crijns-Graus, W.; Broek, M.V.D. The relationship between operational energy demand and embodied energy in Dutch residential buildings. Energy Build. 2018, 165, 233–245. [Google Scholar] [CrossRef]
- Kneifel, J.; O’Rear, E.; Webb, D.; O’Fallon, C. An exploration of the relationship between improvements in energy efficiency and life-cycle energy and carbon emissions using the BIRDS low-energy residential database. Energy Build. 2017, 160, 19–33. [Google Scholar] [CrossRef]
- Opher, T.; Duhamel, M.; Posen, I.D.; Panesar, D.K.; Brugmann, R.; Roy, A.; Zizzo, R.; Sequeira, L.; Anvari, A.; MacLean, H.L. Life cycle GHG assessment of a building restoration: Case study of a heritage industrial building in Toronto, Canada. J. Clean. Prod. 2020, 279, 123819. [Google Scholar] [CrossRef]
- Robati, M.; Oldfield, P.; Nezhad, A.A.; Carmichael, D.G.; Kuru, A. Carbon value engineering: A framework for integrating embodied carbon and cost reduction strategies in building design. Build. Environ. 2021, 192, 107620. [Google Scholar] [CrossRef]
- Almeida, M.; Barbosa, R.; Malheiro, R. Effect of Embodied Energy on Cost-Effectiveness of a Prefabricated Modular Solution on Renovation Scenarios in Social Housing in Porto, Portugal. Sustainability 2020, 12, 1631. [Google Scholar] [CrossRef] [Green Version]
- Tahsildoost, M.; Zomorodian, Z. Energy, carbon, and cost analysis of rural housing retrofit in different climates. J. Build. Eng. 2020, 30, 101277. [Google Scholar] [CrossRef]
- Trovato, M.R.; Nocera, F.; Giuffrida, S. Life-cycle assessment and monetary measurements for the carbon footprint reduction of public buildings. Sustainability 2020, 12, 3460. [Google Scholar] [CrossRef] [Green Version]
- Zhang, Y.; Yan, D.; Hu, S.; Guo, S. Modelling of energy consumption and carbon emission from the building construction sector in China, a process-based LCA approach. Energy Policy 2019, 134, 110949. [Google Scholar] [CrossRef]
- Li, X.; Yao, R.; Yu, W.; Meng, X.; Liu, M.; Short, A.; Li, B. Low carbon heating and cooling of residential buildings in cities in the hot summer and cold winter zone—A bottom-up engineering stock modeling approach. J. Clean. Prod. 2019, 220, 271–288. [Google Scholar] [CrossRef]
- Seifhashemi, M.; Capra, B.; Milller, W.; Bell, J. The potential for cool roofs to improve the energy efficiency of single storey warehouse-type retail buildings in Australia: A simulation case study. Energy Build. 2017, 158, 1393–1403. [Google Scholar] [CrossRef]
- Seo, S.; Foliente, G.; Ren, Z. Energy and GHG reductions considering embodied impacts of retrofitting existing dwelling stock in Greater Melbourne. J. Clean. Prod. 2018, 170, 1288–1304. [Google Scholar] [CrossRef]
- DEE. Nationwide House Energy Rating Scheme (NatHERS), Department of Environment and Energy. 2019. Available online: https://www.nathers.gov.au/ (accessed on 9 September 2021).
- MEF. Changes Associated with Efficient Dwellings Project—Final report for Department of the Environment and Energy; Moreland Energy Foundation: Sydney, Australia, 2017. [Google Scholar]
- Energy Use in the Australian Residential Sector 1986–2020, DEWHA, Commonwealth of Australia; Department of the Environment, Water, Heritage and the Arts: Canberra, Australia, 2009; ISBN 978-1-921298-14-1.
- The Fifth Estate. A Big Week for Energy Efficiency Standards in Australia. 1 September 2021. Available online: https://thefifthestate.com.au/innovation/residential-2/a-big-week-for-energy-efficiency-standards-in-australia/ (accessed on 3 September 2021).
- Dunford, M.A.; Power, L. National Exposure Information System (NEXIS) Building Exposure—Local Government Area (LGA); Geoscience: Australia, Canberra, 2014. [Google Scholar]
- Australian Government. Your Home: Australia’s Guide to Environmentally Sustainable Houses, 5th ed.; Heating and Cooling, Australian Government, 2013. Available online: www.yourhomoe.gov.au/energy/heating-and-cooling (accessed on 27 August 2021).
- On-Ground Assessment of the Energy Efficiency Potential of Victorian Homes; Sustainability Victoria: Victoria, Australia, 2010; p. 276.
- Energy Efficiency Upgrade Potential of Existing Victorian Houses; Sustainability Victoria: Victoria, Australia, 2015; 172p.
- Horne, R.; Baker, E.; Azpitarte, F.; Walker, G.; Willand, N.; Moore, T. The Other 99%: Retrofitting Is the Key to Putting More Australians into Eco-Houses, 21 February 2018. The Conversation. Available online: https://theconversation.com/the-other-99-retrofitting-is-the-key-to-putting-more-australians-into-eco-houses-91231 (accessed on 15 August 2021).
- ESC. VEET Performance Report 2016: Victorian Energy Efficiency Target Scheme; Essential Services Commission: Melbourne, Australia, 2017.
- DIS. Residential Energy Baseline Study: Australia; Department of Industry and Science: Canberra, Australia, 2015.
- Foliente, G.C.; Ambrose, M.; Chen, D.; Ren, Z. Australian zero emission demonstration house. Archit. Tech. 2011, 139–142. [Google Scholar] [CrossRef]
- Ren, Z.; Chan, W.Y.; Chen, D.; Foliente, G.; Syme, M. AusZEH design tool: Software for zero emission house design in Australia. In Proceedings of the Building Simulation Conference 2011, Sydney, Australia, 14–16 November 2011. [Google Scholar]
- Sparn, B.; Earle, L.; Christensen, C.; Norton, P. Net-Zero Energy House Grows Up: Lessons and Puzzles from 10 Years of Data; National Renewable Energy Lab.(NREL): Golden, CO, USA, 2016. [Google Scholar]
- Romero, R.L.; Roach, S.C.; Farrar, S.L.; Simon, J. Developing the Next Generation of Net Zero Professionals through the Race to Zero; National Renewable Energy Lab.(NREL): Golden, CO, USA, 2018. [Google Scholar]
- Gupta, R.; Gregg, M. Assessing energy use and overheating risk in net zero energy dwellings in UK. Energy Build. 2018, 158, 897–905. [Google Scholar] [CrossRef] [Green Version]
- Ren, Z.; Paevere, P.; Chen, D. Feasibility of off-grid housing under current and future climates. Appl. Energy 2019, 241, 196–211. [Google Scholar] [CrossRef]
- Stritih, U.; Tyagi, V.; Stropnik, R.; Paksoy, H.; Haghighat, F.; Joybari, M.M. Integration of passive PCM technologies for net-zero energy buildings. Sustain. Cities Soc. 2018, 41, 286–295. [Google Scholar] [CrossRef]
- Miller, W.; Liu, L.A.; Amin, Z.; Gray, M. Involving occupants in net-zero-energy solar housing retrofits: An Australian sub-tropical case study. Sol. Energy 2018, 159, 390–404. [Google Scholar] [CrossRef]
- Byrne, J.; Berry, S.; Eon, C. Transitioning to net zero energy houses-learnings from the CRC’s high-performance housing living laboratories. In Decarbonising the Built Environment; Newton, P., Prasad, D., Sproul, A., White, S., Eds.; DEWHA Department of the Environment, Water, Heritage and the Arts: Canberra, Australia, 2019. [Google Scholar]
- Ren, Z.; Foliente, G.; Chan, W.-Y.; Chen, D.; Ambrose, M.; Paevere, P. A model for predicting household end-use energy consumption and greenhouse gas emissions in Australia. Int. J. Sustain. Build. Technol. Urban. Dev. 2013, 4, 210–228. [Google Scholar] [CrossRef] [Green Version]
- ABS, Australian Bureau of Statistics Yearbook; ABS: Canberra, Australia. 1961. Available online: http://www.abs.gov.au/AUSSTATS/[email protected]/mf/3101.0 (accessed on 20 April 2021).
- DEE. Australian Energy Update2019, September, Department of the Environment and Energy, Australian Government. 2019. Available online: https://www.energy.gov.au/sites/default/files/australian_energy_statistics_2019_energy_update_report_september.pdf (accessed on 2 September 2021).
- UNFCCC. Paris Agreement: Essential Elements. 2016. Available online: http://unfccc.int/paris_agreement/items/9485.php (accessed on 10 September 2021).
- Seo, S.; Foliente, G.; Lipkin, F.; Yum, K.; Anticev, J.; Egan, S.; Reedman, L. Inner Melbourne Energy Consumption 2011-2026: Baseline and Future Scenarios Commercial Sectors; CSIRO: Melbourne, Australia, 2014. [Google Scholar]
- DELWP. Victorian Greenhouse Gas Emissions Report 2018, p.45, Victoria State Government: Department of Environment, Land, Water and Planning. Available online: www.climatechange.vic.gov.au (accessed on 15 August 2021).
- ABS. 2016 Census QuickStats, Australian Bureau Statistics. 2016. Available online: http://www.censusdata.abs.gov.au/census_services/getproduct/census/2016/quickstat/LGA22670 (accessed on 10 August 2021).
- DISER. Your Home: Australia’s Guide to Environmentally Sustainable Homes—Australia Climate Zones. Department of Industry, Science, Energy and Resources (DISER), Commonwealth of Australia. 2020. Available online: https://www.yourhome.gov.au/introduction/australian-climate-zones (accessed on 2 September 2021).
- Whitehouse, M.; Osmond, P.; Daly, D.; Kokogiannakis, G.; Jones, D.; Picard, B.A.; Cooper, P. Guide to Low Carbon Residential Buildings—Retrofit, Low Carbon Living; CRC: Boca Raton, FL, USA, 2018; 72p, ISBN 978-0-9923878-5-3. [Google Scholar]
- Anastaselos, D.; Giama, E.; Papadopoulos, A. An assessment tool for the energy, economic and environmental evaluation of thermal insulation solutions. Energy Build. 2009, 41, 1165–1171. [Google Scholar] [CrossRef]
- Schmidt, M.; Crawford, R.H. A framework for the integrated optimisation of the life cycle greenhouse gas emissions and cost of buildings. Energy Build. 2018, 171, 155–167. [Google Scholar] [CrossRef]
- Delsante, A. A Validation of the ‘AccuRate’ Simulation Engine Using BESTEST; The Australian Greenhouse Office: Canberra, Australia, 2004. [Google Scholar]
- Delsante, A. Is the new generation of building energy rating software up to the task?—A review of AccuRate. In Proceedings of the ABCB Conference ‘Building Australia’s Future 2005′, Surfers Paradise, Australia, 23–26 September 2005; pp. 11–15. [Google Scholar]
- COAG. National Strategy on Energy Efficiency; Council of Australian Governments: Canberra, Australia, 2009.
- National Exposure Information System (NEXIS) Building Exposure—Local Government Area (LGA); Geoscience Australia: Canberra, Australia, 2017.
- CSIRO. The History of Energy Rating. Available online: https://research.csiro.au/energyrating/csiros-energy-rating-research/history/ (accessed on 1 September 2021).
- NCC. National Constructions Code. Guide to Volume Two. Section J Energy Efficiency, National Construction Code. 2019. Available online: https://ncc.abcb.gov.au/ncc-online/ncc (accessed on 4 August 2021).
- Master Builders Victoria. Upgrading the Energy Efficiency of Existing Housing. Available online: https://www.mbav.com.au/news-information/news/sustainability/upgrading-energy-efficiency-existing-housing?sustainability (accessed on 26 August 2021).
- Environment, Land, Water and Planning. State Heritage Listing. Available online: https://www.heritage.vic.gov.au/heritage-listings/state-heritage-listing (accessed on 26 July 2021).
- Chen, D.; Ren, Z.; Chan, W. New Release of AccuRate Software, CSIRO Report Prepared for Australian Government Department of Climate Change and Energy Efficiency; Commonwealth Scientific and Industrial Research Organisation: Melbourne, Australia, 2011. [Google Scholar]
- Horne, R.; Hayles, C. Towards global benchmarking for sustainable homes: An international comparison of the energy per-formance of housing. J. Hous. Built Environ. 2008, 23, 119–130. [Google Scholar] [CrossRef]
- Connection Magazines. Cellulose Insulation. Available online: http://www.build.com.au/cellulose-insulation (accessed on 12 May 2020).
- iBatts. Fletcher Building Insulation. 2019. Available online: https://www.ibatts.com.au/fletcher-insulation (accessed on 3 August 2021).
- Grant, T. AusLCI Database Manual v1.26. 2016. Available online: http://auslci.com.au (accessed on 10 August 2021).
- Ecoinvent. Ecoinvent LCI Database ver 3.4. Available online: https://ecoinvent.org/the-ecoinvent-database (accessed on 12 April 2021).
- Development of an Embodied Emissions Module for AccuRate; Forest & Wood Products Australia (FWPA): Melbourne, Australia, 2010.
- Australian Construction Handbook, 31st ed.; Rawlinsons Publishing: Perth, Australia, 2018.
- MDG. How long Does Double Glazing Last? May, Maghull Double Glazing. 2019. Available online: https://maghulldoubleglazing.com/how-long-does-double-glazing-last/ (accessed on 2 September 2021).
- Cool Australia. Calculating Greenhouse Gas Emissions—Electrical Appliances. 2018. Available online: https://coolaustralia.org/wp-content/uploads/2013/12/Calculating-GHG-emissions.pdf (accessed on 29 August 2021).
- Iselect. Electricity and Gas Comparison. 2018. Available online: https://energy.iselect.com.au/results/ (accessed on 27 July 2021).
- Property registry. How Long Will A New House Last? Available online: https://propertyregistry.com.au/how-long-will-a-new-house-last/ (accessed on 3 March 2021).
- ABCNews. Households are Being Urged to Curb Their Carbon Emissions - But It’s Businesses and Governments that Can Make the Biggest Difference. Available online: https://www.abc.net.au/news/2021-05-30/carbon-neutral-households/100165072/ (accessed on 1 July 2021).
- Galimshina, A.; Moustapha, M.; Hollberg, A.; Padey, P.; Lasvaux, S.; Sudret, B.; Habert, G. What is the optimal robust environmental and cost-effective solution for building renovation? Not the usual one. Energy Build. 2021, 251, 111329. [Google Scholar] [CrossRef]
- Balouktsi, M.; Luetzkendorf, T.; Seo, S.; Foliente, G. Embodied energy and global warming potential in construction—Perspec-tives and interpretations. In Proceedings of the Central Europe Towards Sustainable Building 2016 (CESB16), Prague, Czech Republic, 22–24 June 2016. [Google Scholar]
Figure 1.
Overview of the system boundary in this study. The carbon footprint in the energy retrofit program consists of the GHG emissions embodied in building product manufacturing (A1–A3 in EN15978 [32]), transportation associated with the building renovation process (A4) and product replacement (B5) over the life of the building together with the GHG emissions associated with the energy used during the building operation stage (B6). (A5 is not included in this system).

Figure 2.
Number of dwellings in the Greater Dandenong building stock [86].
Figure 2.
Number of dwellings in the Greater Dandenong building stock [86].

Figure 3.
Comparison of lifecycle energy impacts of prototype buildings.

Figure 4.
Comparison of lifecycle GHG emissions of prototype buildings.

Figure 5.
Lifecycle costs of dwelling types with different age brackets (AUD$). (a) Lifecycle cost of each prototype (AUD$/m2); (b) Lifecycle cost of the whole stocks in the City of Greater Dandenong.
Figure 5.
Lifecycle costs of dwelling types with different age brackets (AUD$). (a) Lifecycle cost of each prototype (AUD$/m2); (b) Lifecycle cost of the whole stocks in the City of Greater Dandenong.


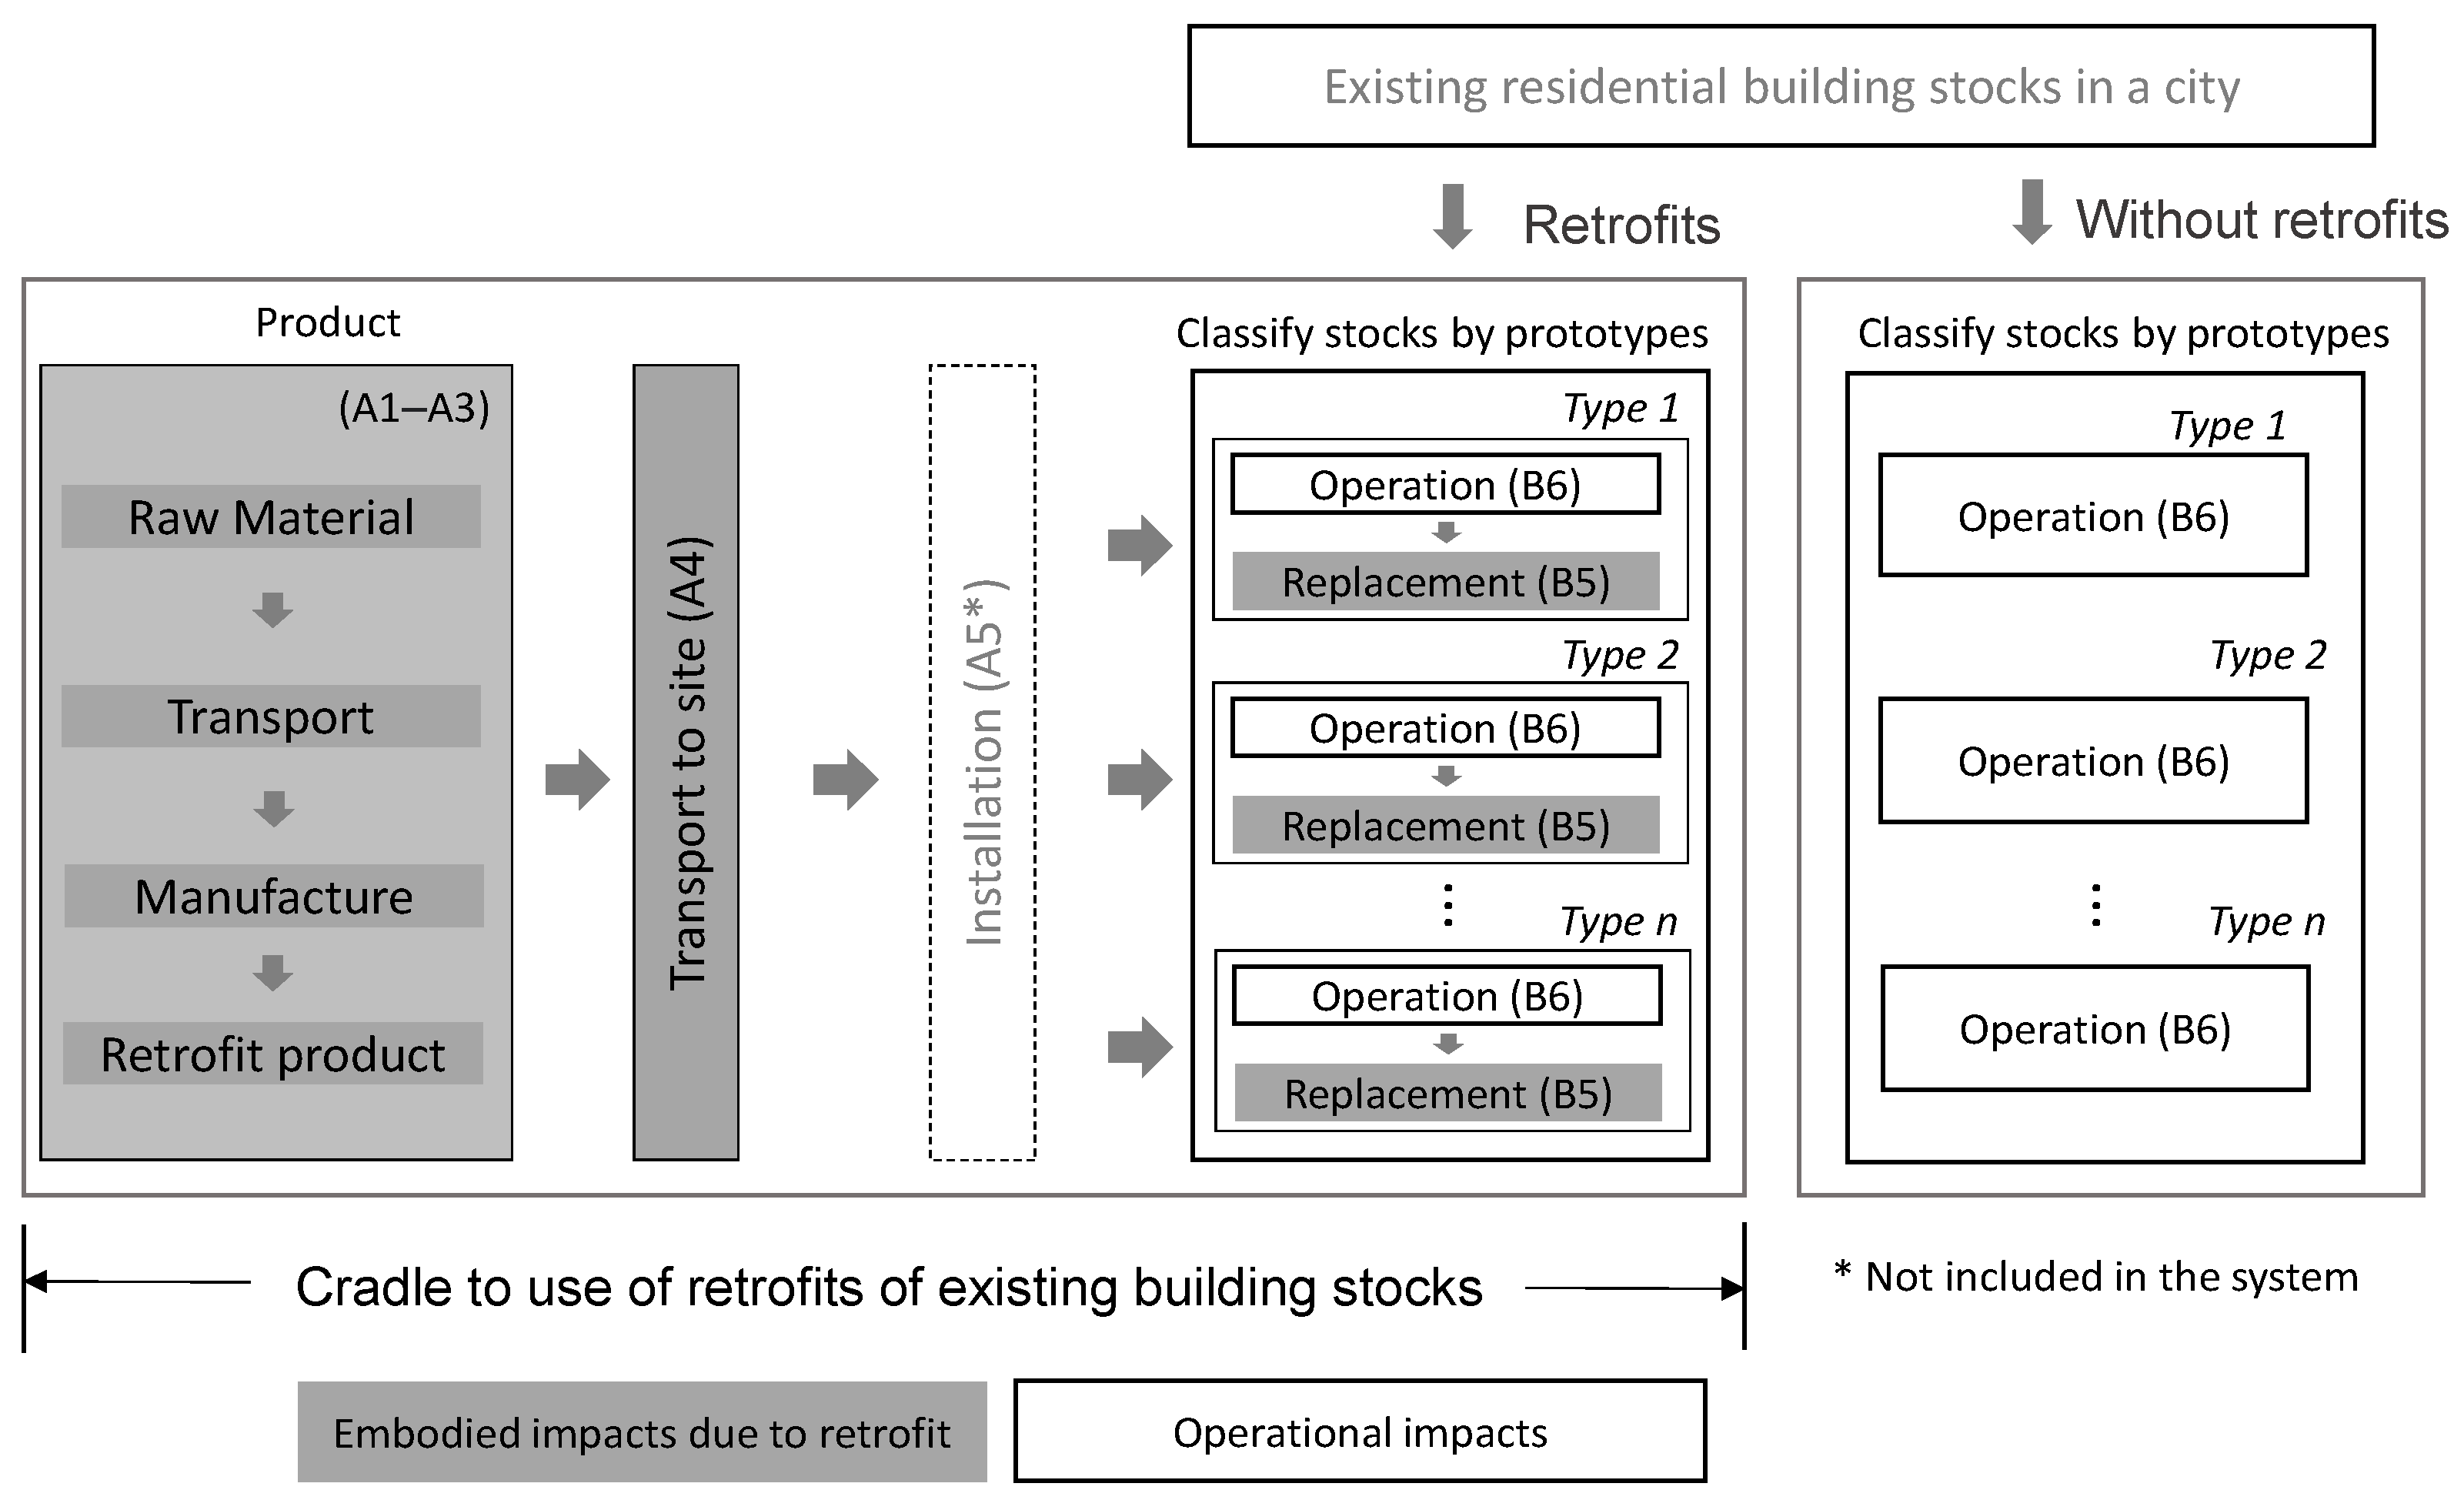
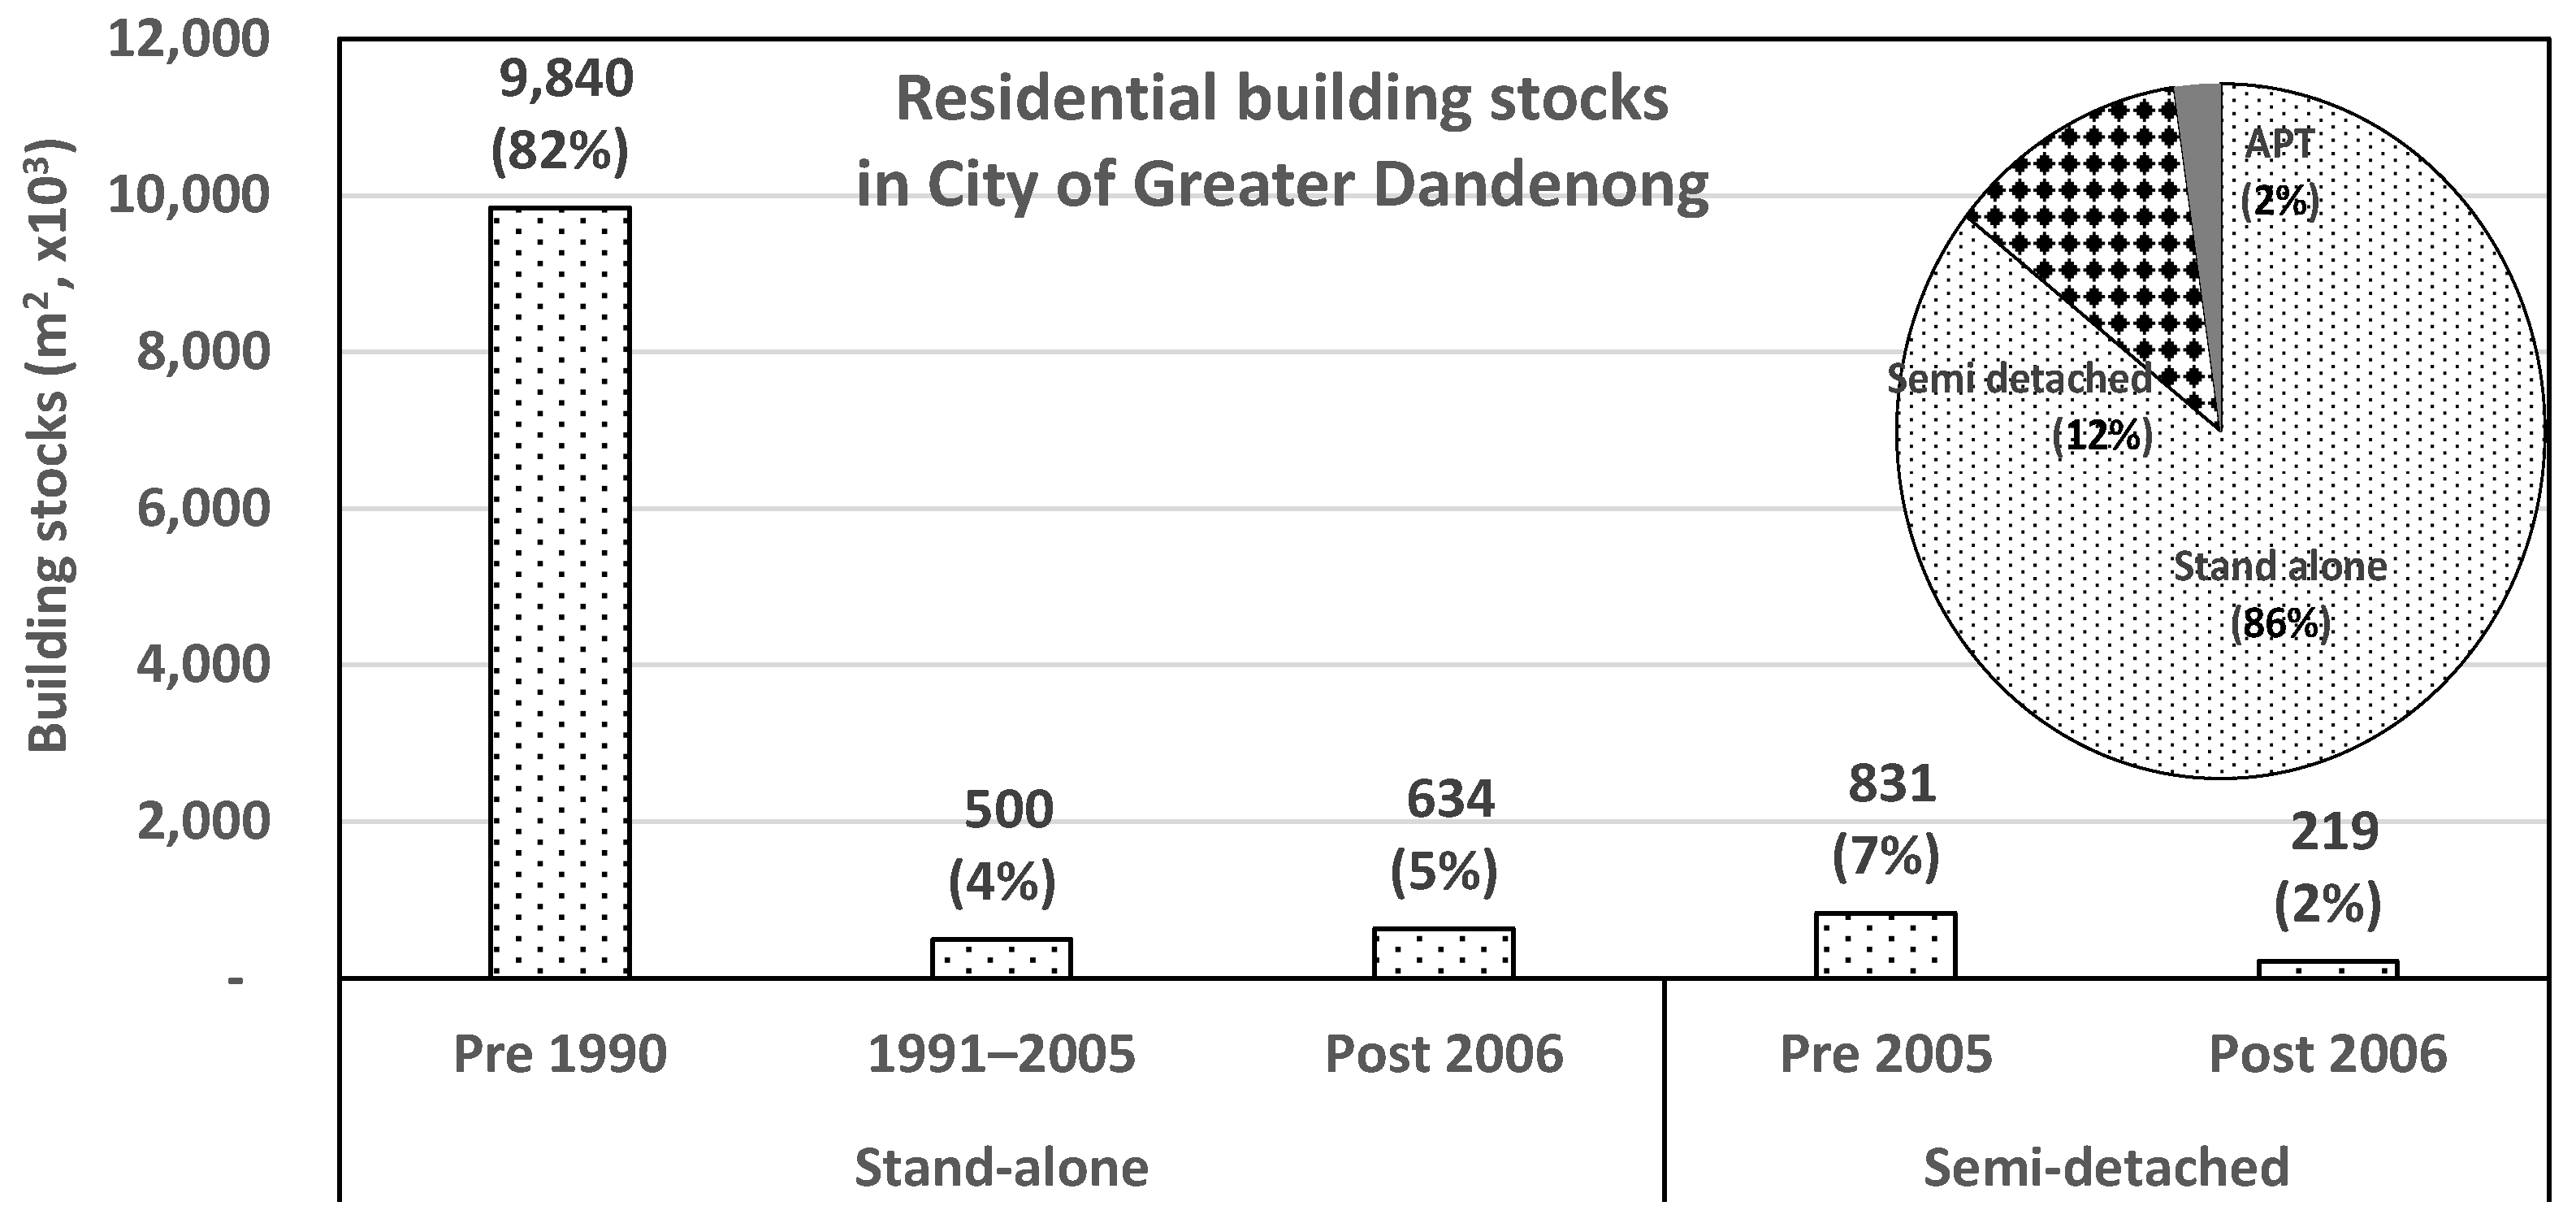
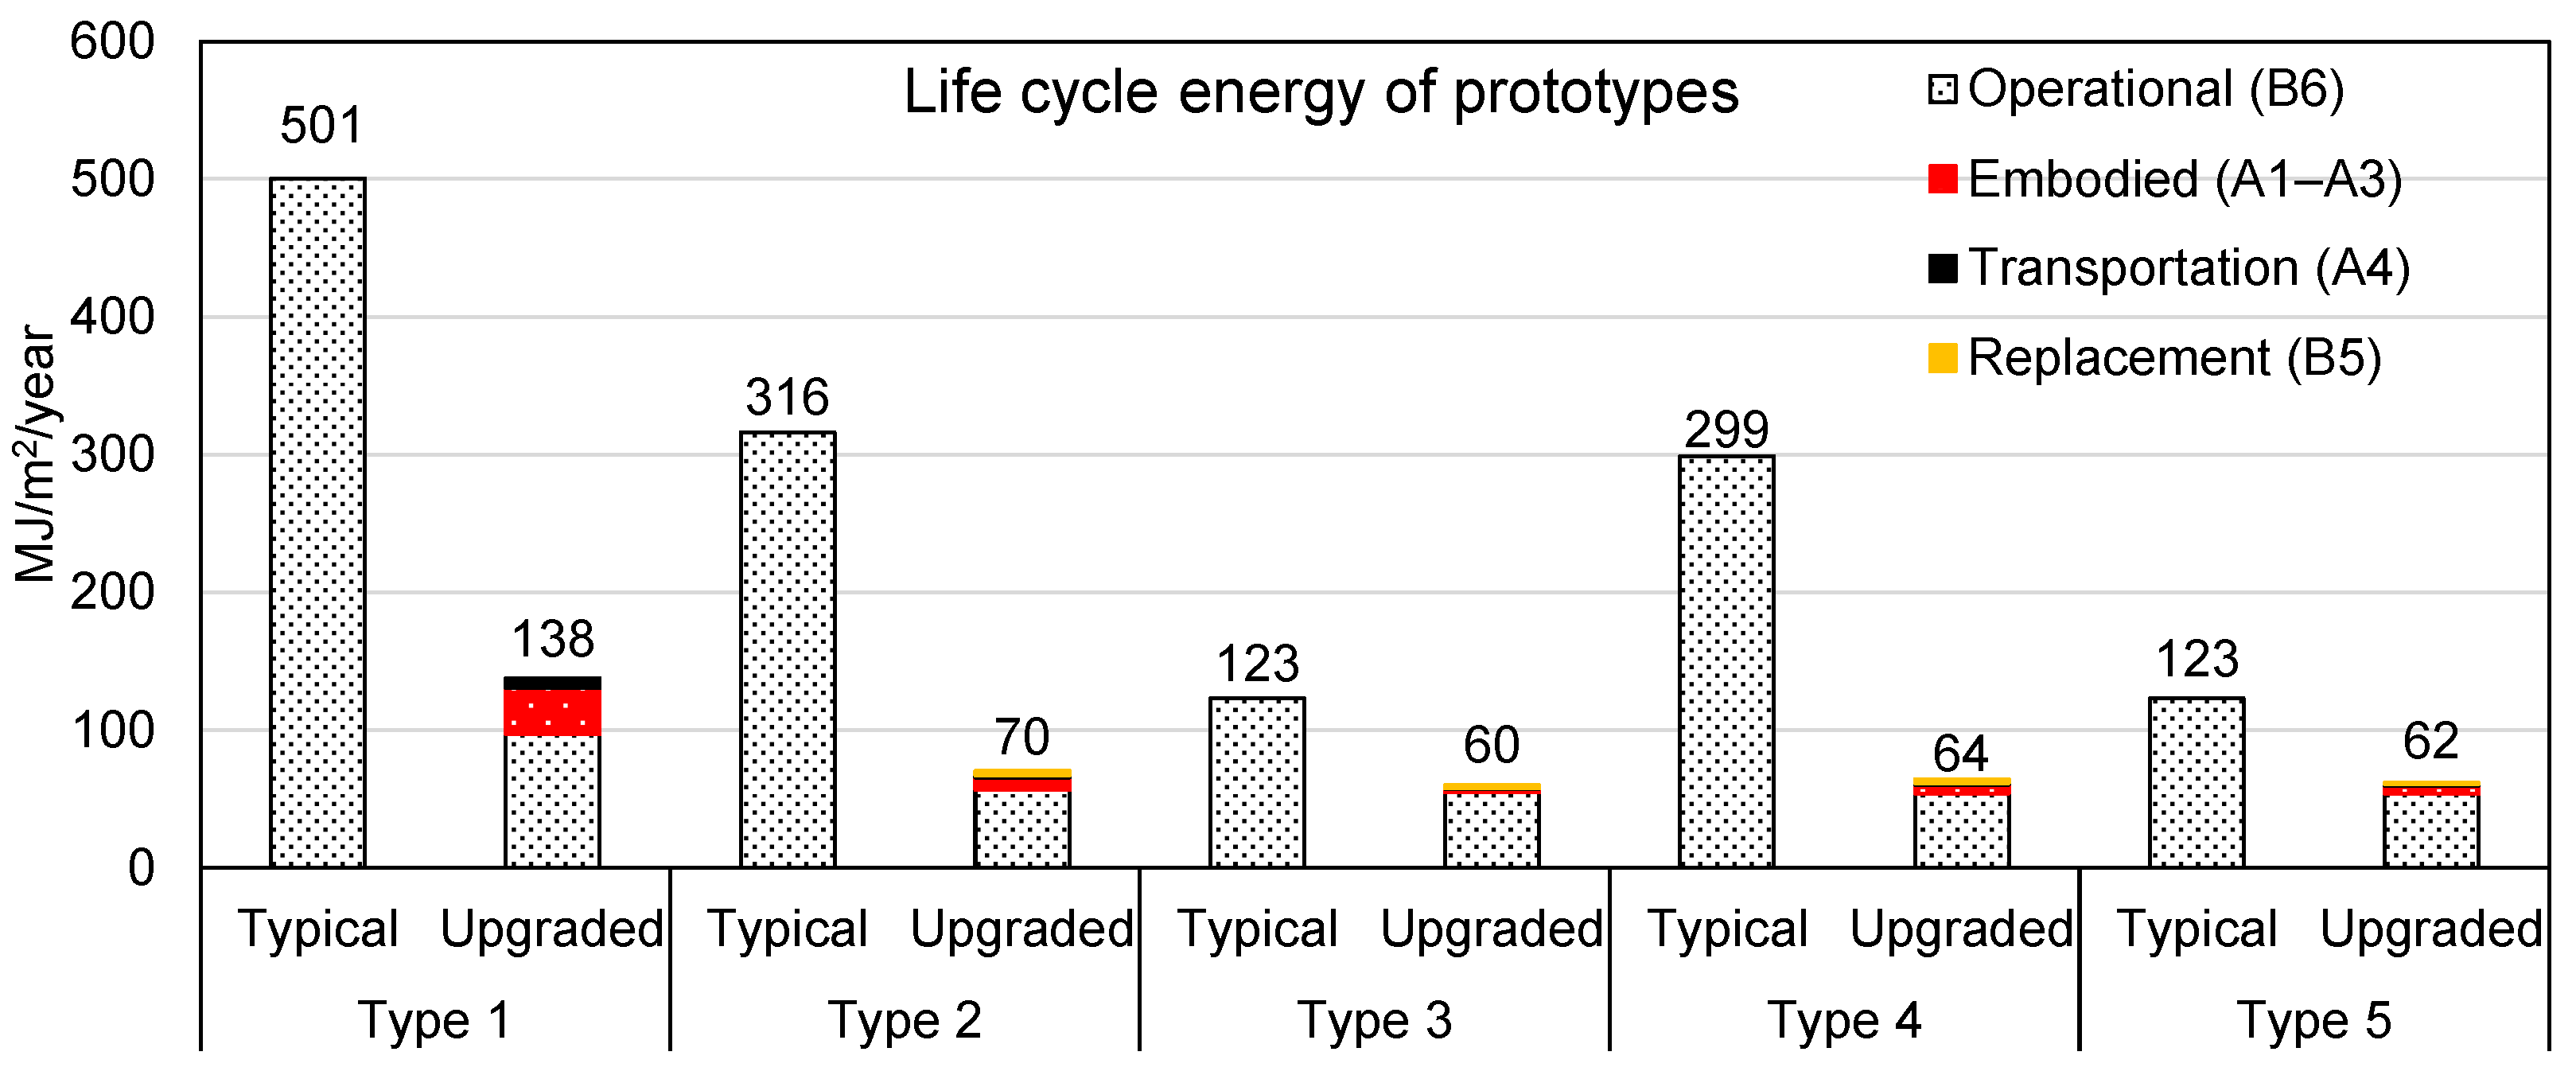
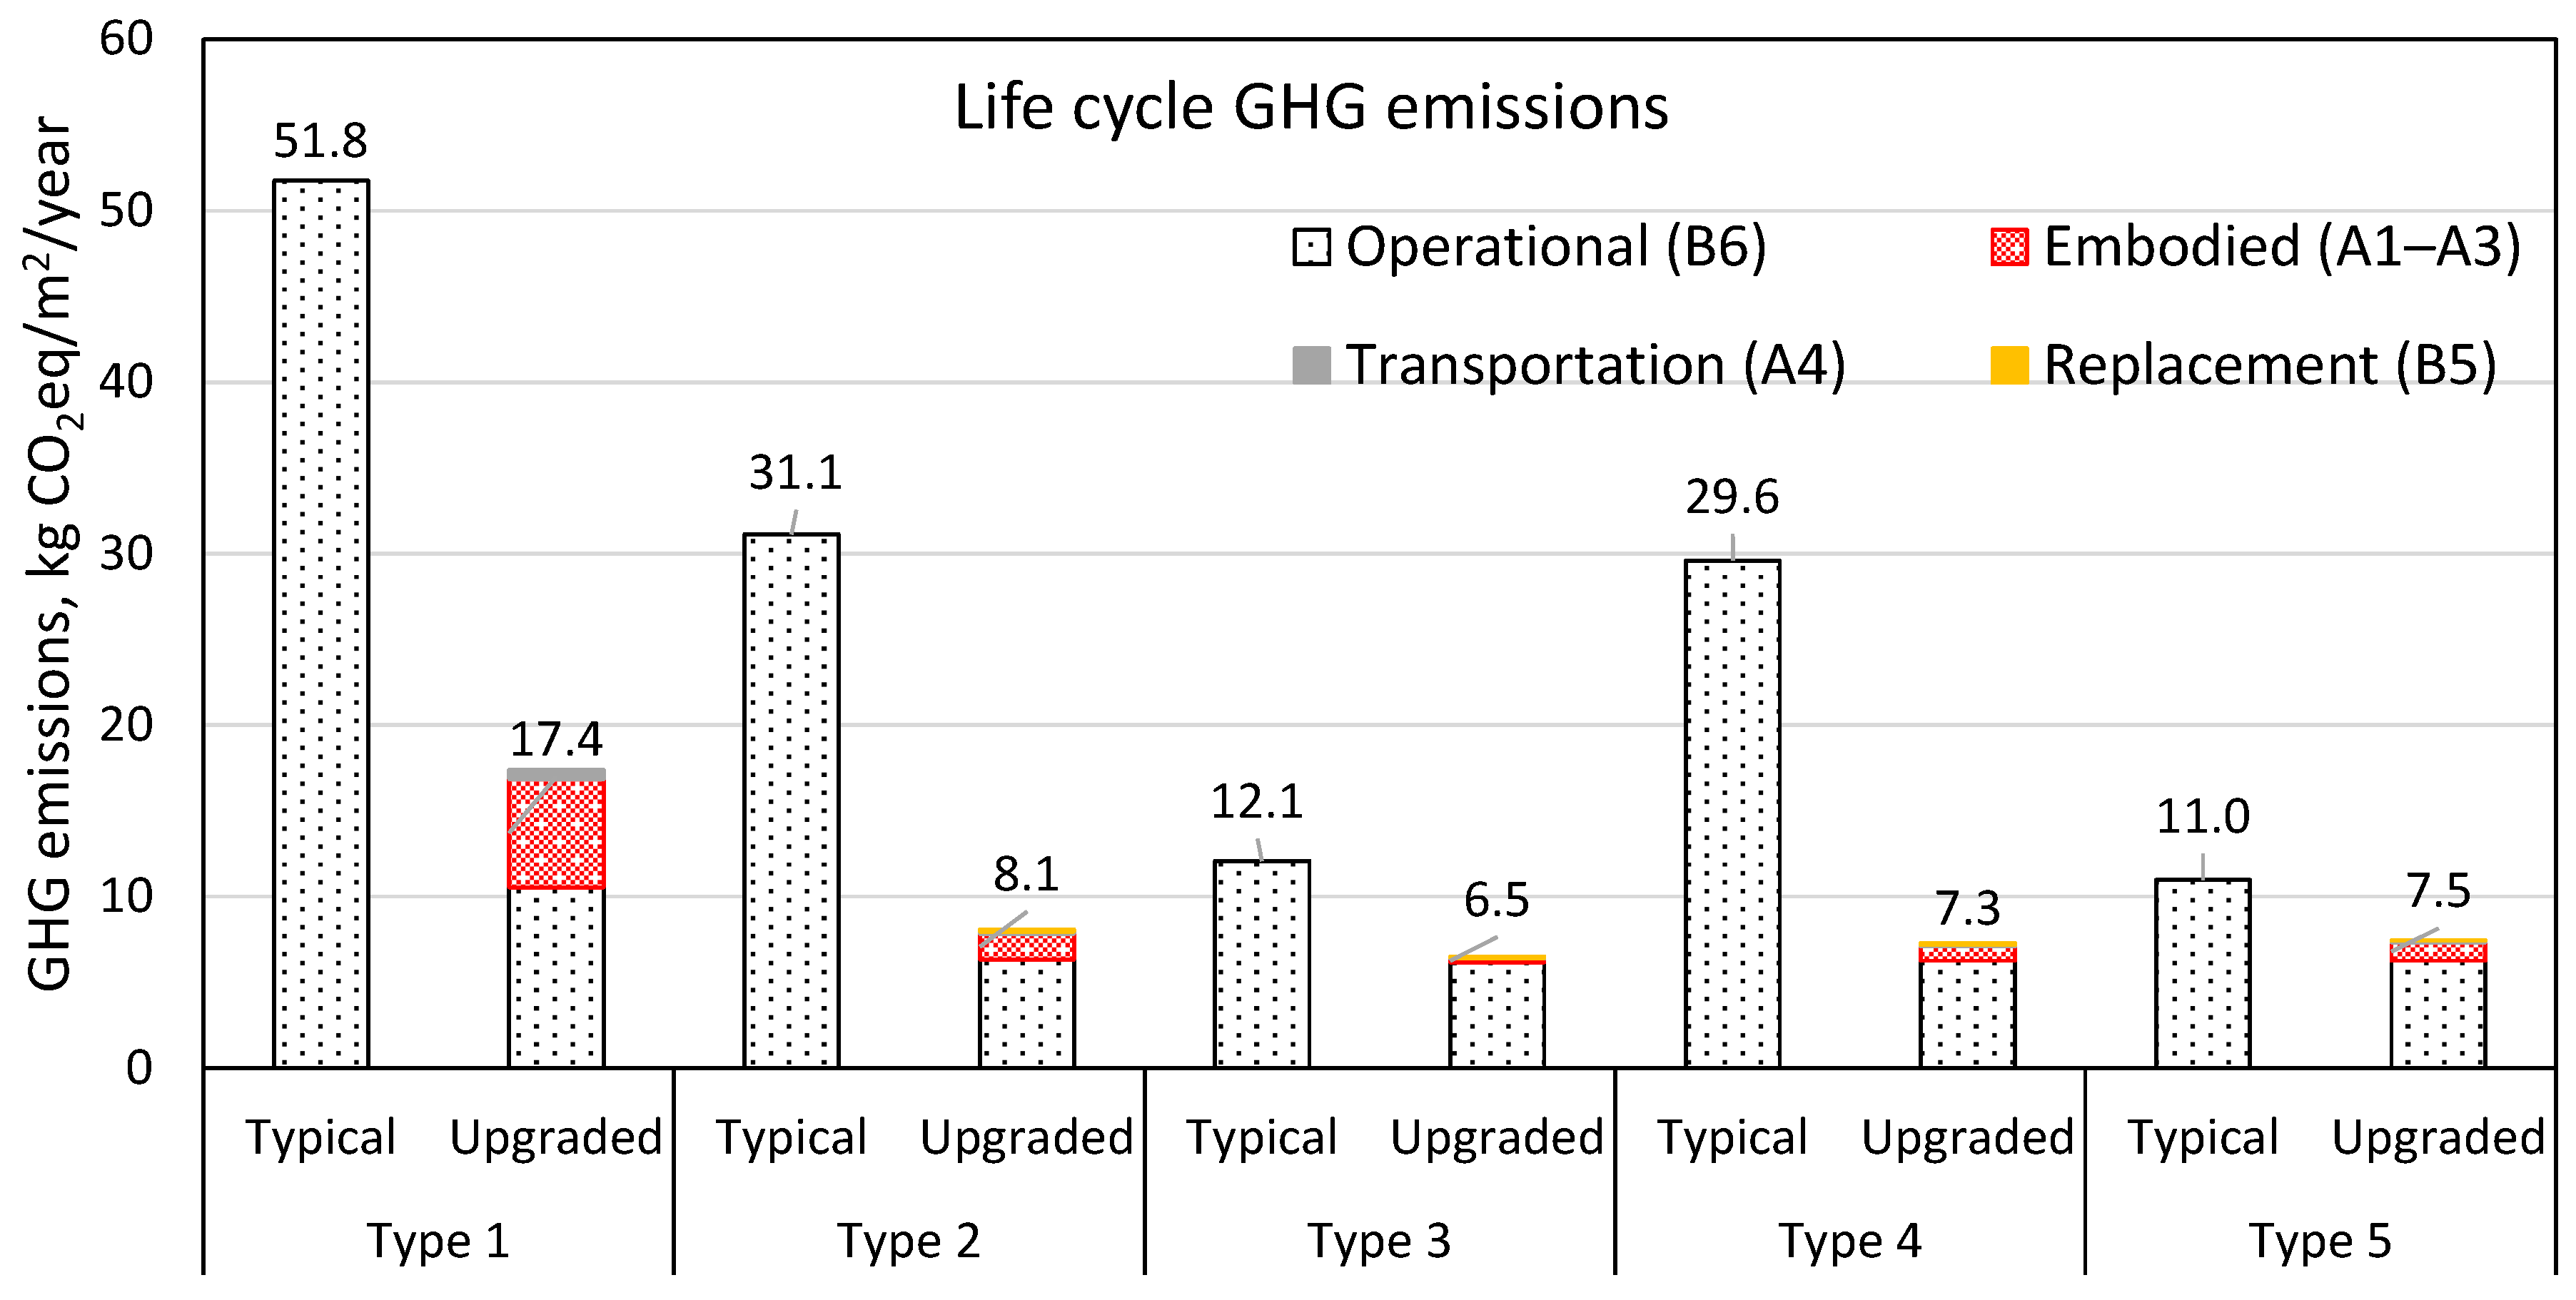
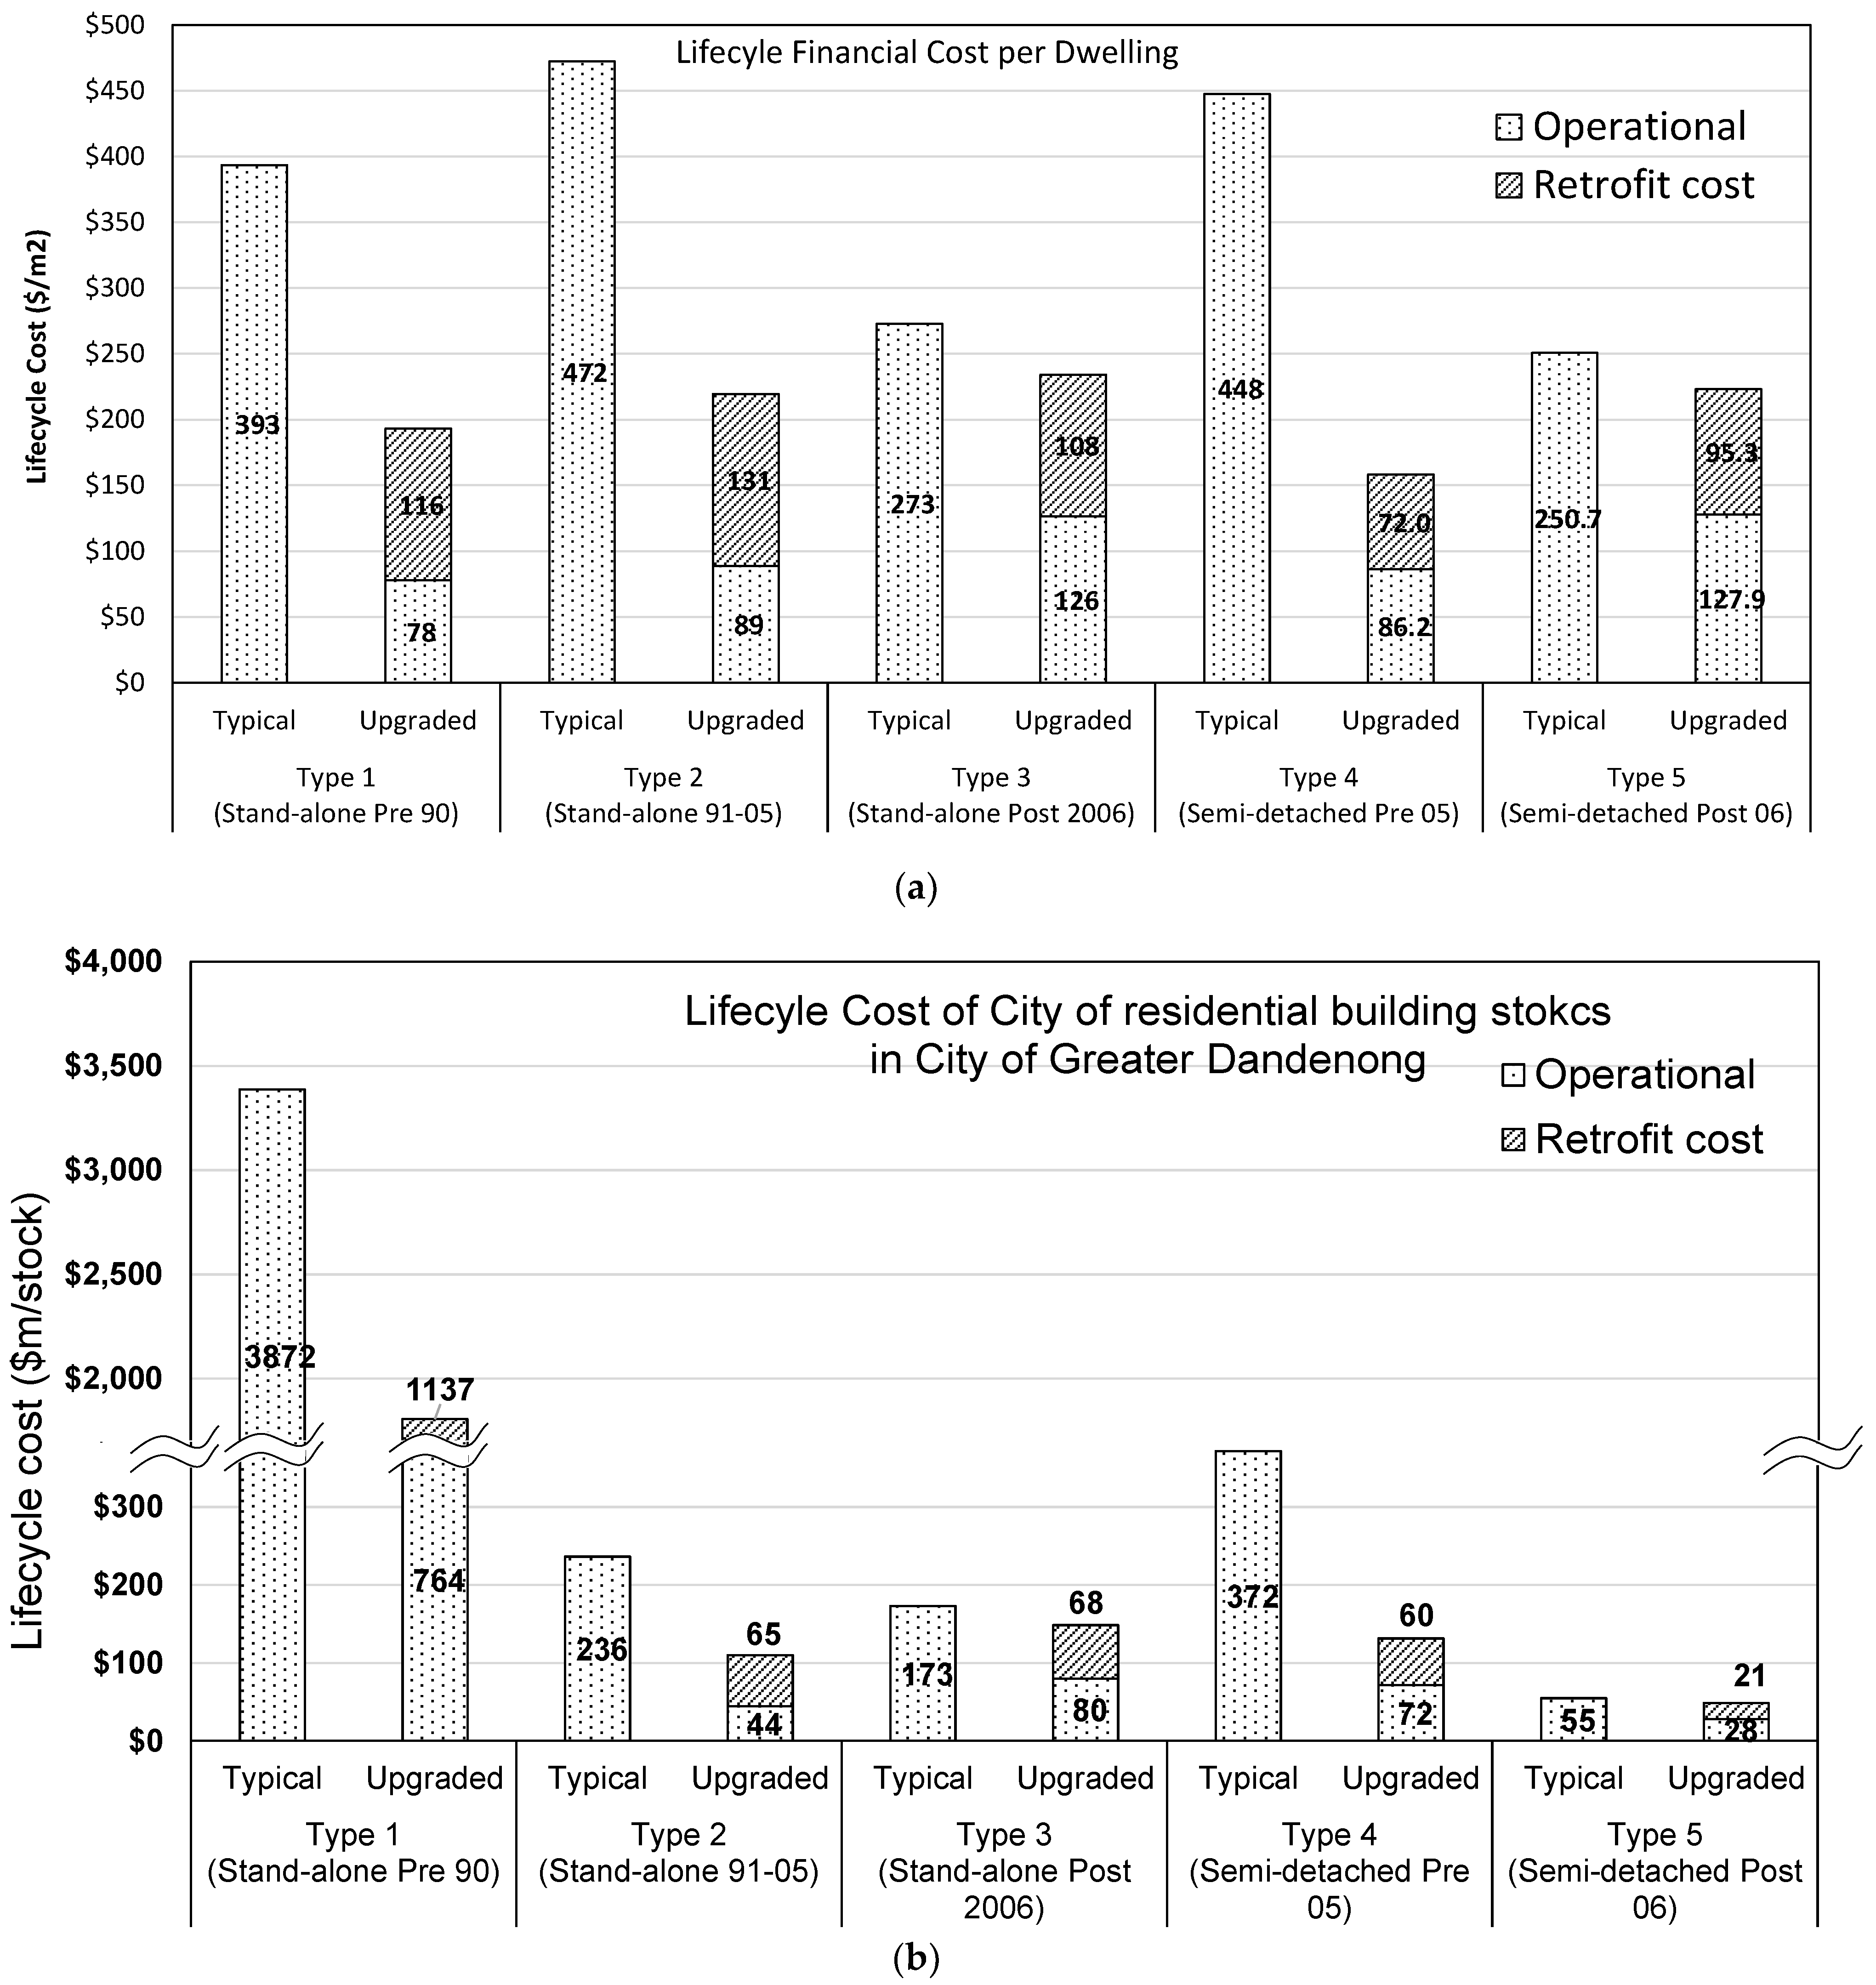
Table 1.
Australian housing’s NatHERS energy efficiency star band criteria (thermal load in MJ/m2/year).
Table 1.
Australian housing’s NatHERS energy efficiency star band criteria (thermal load in MJ/m2/year).
| Location (Key Capital Cities) | Energy Rating (Stars) | |||||||||
|---|---|---|---|---|---|---|---|---|---|---|
| 1 | 2 | 3 | 4 | 5 | 6 * | 7 | 8 ** | 9 | 10 | |
| Melbourne | 559 | 384 | 271 | 198 | 149 | 114 | 83 | 54 | 25 | 2 |
| Sydney East | 230 | 148 | 98 | 68 | 50 | 39 | 30 | 22 | 13 | 6 |
| Brisbane | 203 | 139 | 97 | 71 | 55 | 43 | 34 | 25 | 17 | 10 |
| Adelaide | 480 | 325 | 227 | 165 | 125 | 96 | 70 | 46 | 22 | 3 |
| Perth | 387 | 251 | 167 | 118 | 89 | 70 | 52 | 34 | 17 | 4 |
Source: DEE [52]. * Current standard for new houses, based on the building code (since 2000). ** Targeted for retrofitting existing houses in this study.
Table 2.
Potential retrofit options to reduce energy and GHG emissions in residential buildings in Victoria.
Table 2.
Potential retrofit options to reduce energy and GHG emissions in residential buildings in Victoria.
| Pre 1920 | 1920–1970 | 1970–2000 | Post 2000 | |
|---|---|---|---|---|
| Characteristics of building conditions | Poor air tightness, insulation and low window performance. Limited retrofitting due to heritage restrictions. | Poor airtightness and insulation and low window performance, etc. | Less insulated buildings and low window performance, etc. | Following minimum building energy regulations, which have insulation and window efficiency requirements. |
| Improved airtightness | v | v | v | v |
| Roof/ceiling insulation | v | v | v | - |
| Wall insulation | v | v | v | - |
| Internal window covering | v | v | v | v |
| Addition on exposure of thermal mass | v | - | - | - |
| Deciduous planting | v | v | v | v |
| Window upgrade | v | - | - | - |
| Under floor insulation | - | v | - | - |
Source: Whitehouse et al. [80].
Table 3.
Categorised dwelling prototypes of the residential building stock.
| Type Prototype | Note | |
|---|---|---|
| Detached (Standalone) dwelling | Type 1 | Stand-alone Pre-1990 (Stand-alone detached house built prior to 1990) |
| Type 2 | Stand-alone 1991-2005 (Stand-alone detached house built between 1991 and 2005) | |
| Type 3 | Stand-alone Post-2006 (Stand-alone detached house built after 2006) | |
| Semi-detached dwelling | Type 4 | Semi-detached Pre-2005 (Semi-detached house built prior to 2005) |
| Type 5 | Semi-detached Post 2005 (Semi-detached house built post 2005) | |
Table 4.
Prototype buildings in the City of Greater Dandenong.
| External Wall | Window | Floor | Ceiling | |||||||
|---|---|---|---|---|---|---|---|---|---|---|
| Star Rating (MJ/m2/yr) | Description | Area (m2) | Description | Area (m2) | Description | Area (m2) | Description | Area (m2) | ||
| Detached | Type 1 | 1.6 (501) | Brick veneer | 139 | Clear single glazed | 20 | concrete slab (100 mm) | 113 (85) * | plaster board | 113 |
| Type 2 | 2.9 (316) | Brick veneer | 136 | double glazed (clear) | 26 | concrete slab (100 mm) | 161 (149) * | plaster board | 161 | |
| Type 3 | 6.0 (123) | Brick veneer | 179 | Clear single glazed | 40 | concrete slab (100 mm) | 263 (207) * | plaster board (13 mm, R6 insulation) | 263 | |
| Semi-detached | Type 4 | 3.0 (269) | Brick veneer (uninsulated) | 54 | Clear single glazed | 10 | concrete slab (100 mm) | 68 (57) * | plaster board (13 mm, R6 insulation) | 68 |
| Type 5 | 6.0 (123) | Brick veneer (reflective foil) | 126 | double glazed (clear) | 13 | concrete slab (100 mm) | 168 (124) * | Cellular insulation | 168 | |
Type 1: Stand-alone built Pre 1990; Type 2: Stand-alone built 1991–2005; Type 3: Stand-alone built Post 2006; Type 4: Semi-detached built Pre 2005; Type 5: Semi-detached built post 2005. * Conditioned floor area.
Table 5.
Required condition time and thermostat setting.
| Living Space | Bedroom Space | ||
|---|---|---|---|
| Heating | Greater Dandenong | 20 °C | 15 °C (0:00–7:00) |
| Cooling | 24 °C | ||
| Conditioned time | 7:00–9:00 and 16:00–24:00 | 16:00–9:00 a.m. (following day) | |
Table 6.
Prototype energy efficiency star rating and applied upgrade options.
| Type 1: Pre-1990 Stand-Alone | Type 2: 1991-2005 Stand-Alone | Type 3: Post-2006 Stand-Alone | Type 4: Pre-2005 Semi-Detached | Type 5: Post-2005 Semi-Detached | ||
|---|---|---|---|---|---|---|
| Typical | Rating (Star) | 1.6 | 2.9 | 6.0 | 3.0 | 6.0 |
| Energy demand (MJ/m2/year) | 501 | 316 | 123 | 299 | 123 | |
| Upgraded | Rating (Star) | 6.5 | 8.0 | 8.0 | 8.0 | 8.0 |
| Energy demand (MJ/m2/year) | 97 | 57 | 55 | 54 | 53 | |
| Upgrade options | Insulation-Wall | v | v | v | v | v |
| Insulation-Floor/ceiling | v | v | v | v | v | |
| Double glazed | v | v | v | v | v | |
Table 7.
Embodied energy, GHG and cost of the retrofit material.
| Material * | Embodied Energy (MJ/kg) | Embodied GHG (kg CO2eq/m3) | Cost (AUD/m2) | Service Life (Year) |
|---|---|---|---|---|
| Wall insulation (R3, cellulose fibre) | 8.39 a | 76.4 b | 12.4 c | lifetime + |
| Wall insulation (R3, glass fibre bat) | 27.5 a | 38.3 b | 4.5 c | lifetime + |
| Ceiling insulation (R5, cellulose fibre) | 8.39 a | 76.4 b | 12.4 c | lifetime + |
| Ceiling insulation (R5, glass fibre bat) | 27.5 a | 38.3 b | 4.5 c | lifetime + |
| uPVC double glazed | 478.4 d (MJ/m2) | 21.1 d (CO2eq /m2) | 262 c | 20 e |
Table 8.
GHG emission factor and price for electricity and gas in Victoria.
| Electricity | Gas | |
|---|---|---|
| GHG emission factor + | 1.17 kg CO2eq/KWh | 0.05133 kg CO2eq/MJ |
| Cost ($) ++ | $0.319/KWh | $0.02/MJ |
Table 9.
Embodied energy and net energy reductions of building stocks in the City of Greater Dandenong.
Table 9.
Embodied energy and net energy reductions of building stocks in the City of Greater Dandenong.
Type * | Part A: Total Embodied Energy (A1–A3, A4, B5) by: | Part B **: Net Energy Reduction Considering Embodied Energy by: | ||||
|---|---|---|---|---|---|---|
| Prototype | Whole Stocks | Lifespan of Whole Building Stocks | Prototypes | Whole Stocks | Lifespan of Whole Building Stocks | |
| MJ/m2/Year | TJ/Year | TJ/Lifespan | MJ/m2/Year | TJ/Year | TJ/Lifespan | |
| Type 1 | 41 (53%) | 28.6 (98%) | 401 (95%) | 363 (38%) | 3571 (91%) | 57,133 (82%) |
| Type 2 | 14 (18%) | 0.2 (1%) | 7 (2%) | 246 (26%) | 123 (3%) | 3811 (6%) |
| Type 3 | 5 (7%) | 0.1 (0.2%) | 3 (0.8%) | 63 (7%) | 40 (1%) | 1842(3%) |
| Type 4 | 10 (13%) | 0.3 (1%) | 9 (2%) | 228 (24%) | 190 (5%) | 5882 (8%) |
| Type 5 | 7 (9%) | 0.04 (0.1%) | 2 (0.4%) | 61 (6%) | 13 (0.3%) | 618 (1%) |
| Sum | 77 (100%) | 29.2 (100%) | 421 (100%) | 961 (100%) | 3937 (100%) | 69,287 (100%) |
* Type 1: Stand-alone built pre-1990; Type 2: Stand-alone built between 1991–2005; Type 3: Stand-alone built after 2005; Type 4: Semi-detached built pre-2005; Type 5: Semi-detached built post 2005. ** Net energy reduction = operational energy saving due to upgrade-embodied energy for the upgrade.
Table 10.
Embodied GHG and net GHG emissions reduction of building stocks in the City of Greater Dandenong.
Table 10.
Embodied GHG and net GHG emissions reduction of building stocks in the City of Greater Dandenong.
Type * | Part A: Total Embodied GHG (A1–A3, A4, B5) by: | Part B **: Net GHG Reduction Considering Embodied GHG by: | ||||
|---|---|---|---|---|---|---|
| Prototype | Whole Stocks | Lifespan of Whole Building Stocks | Prototypes | Whole Stocks | Lifespan of Whole Building Stocks | |
| kg CO2eq/m2/Year | X103 t CO2eq/Year | X 103 t CO2eq/Lifespan | kg CO2eq/m2/Year | X103 t CO2eq/Year | X 103 t CO2eq/Year | |
| Type 1 | 6.8 (61%) | 4.20 (98%) | 67.3 (97%) | 34.4 (39%) | 338.3 (91%) | 5412.3 (83%) |
| Type 2 | 1.8 (16%) | 0.03 (0.7%) | 0.9 (1.3%) | 23.0 (26%) | 11.5 (3.1%) | 357.5 (5%) |
| Type 3 | 0.3 (3%) | 0.01 (0.1%) | 0.2 (0.3%) | 5.6 (6%) | 3.5 (1%) | 162.4 (2%) |
| Type 4 | 1.1 (9%) | 0.03 (0.7%) | 0.9 (1.3%) | 22.3 (25%) | 18.5 (5%) | 573.9 (9%) |
| Type 5 | 1.2 (11%) | 0.01 (0.1%) | 0.3 (0.4%) | 3.5 (4%) | 0.8 (0.2%) | 35.3 (1%) |
| Sum | 11.2 (100%) | 4.27 (100%) | 69.5 (100%) | 88.8 (100%) | 372.6 (100%) | 6541.3 (100%) |
* Type 1: Stand-alone built pre-1990; Type 2: Stand-alone built between 1991–2005; Type 3: Stand-alone built after 2005; Type 4: Semi-detached built pre-2005; Type 5: Semi-detached built post 2005. ** Net GHG reduction = operational GHG saving due to upgrade-embodied GHGs for upgrade.
Table 11.
Energy, GHG emissions and financial payback time considering the whole residential building stock in the City of Greater Dandenong.
Table 11.
Energy, GHG emissions and financial payback time considering the whole residential building stock in the City of Greater Dandenong.
| Residential Building Stocks in City of Greater Dandenong by Type | Sum | ||||||
|---|---|---|---|---|---|---|---|
| Type 1 | Type 2 | Type 3 | Type 4 | Type 5 | |||
| Remaining residual life * (year) | 14 | 29 | 44 | 29 | 44 | - | |
| Energy | Embodied Energy ** (TJ) | 5609 | 169 | 147 | 274 | 79 | 6279 |
| Annual energy saving *** (TJ) | 3971 | 130 | 43 | 204 | 15 | 4363 | |
| Energy payback time (year) | 1.4 | 1.5 | 3.4 | 1.3 | 5.2 | 1.4 | |
| GHG | Embodied GHG ** (103 t CO2eq) | 9418 | 258 | 97 | 283 | 117 | 10,172 |
| Annual GHG reduction *** (103 t CO2eq) | 4055 | 124 | 37 | 194 | 10 | 4421 | |
| GHG payback time (year) | 2.3 | 2.1 | 2.6 | 1.5 | 11.3 | 2.3 | |
| Cost | Retrofit cost ($million) | 1137 | 65 | 68 | 60 | 21 | 1352 |
| Annual energy bill saving + ($million) | 194 | 6 | 2 | 10 | 1 | 213 | |
| Financial payback time (year) | 5.9 | 10.6 | 33.8 | 6.2 | 35.7 | 6.4 | |
* Average life span (60 years)–current age of building (2021-construction year of prototype). ** Included A1–A3, A4, B5 of building type. *** annual operational heating and cooling energy only for whole residential building stocks in the City of Greater Dandenong. + Energy cost after the retrofit–(energy cost before the retrofit + retrofit cost).
Publisher’s Note: MDPI stays neutral with regard to jurisdictional claims in published maps and institutional affiliations. |
© 2021 by the authors. Licensee MDPI, Basel, Switzerland. This article is an open access article distributed under the terms and conditions of the Creative Commons Attribution (CC BY) license (https://creativecommons.org/licenses/by/4.0/).
Share and Cite
MDPI and ACS Style
Seo, S.; Foliente, G. Carbon Footprint Reduction through Residential Building Stock Retrofit: A Metro Melbourne Suburb Case Study. Energies 2021, 14, 6550. https://0-doi-org.brum.beds.ac.uk/10.3390/en14206550
AMA Style
Seo S, Foliente G. Carbon Footprint Reduction through Residential Building Stock Retrofit: A Metro Melbourne Suburb Case Study. Energies. 2021; 14(20):6550. https://0-doi-org.brum.beds.ac.uk/10.3390/en14206550
Chicago/Turabian StyleSeo, Seongwon, and Greg Foliente. 2021. "Carbon Footprint Reduction through Residential Building Stock Retrofit: A Metro Melbourne Suburb Case Study" Energies 14, no. 20: 6550. https://0-doi-org.brum.beds.ac.uk/10.3390/en14206550
Note that from the first issue of 2016, this journal uses article numbers instead of page numbers. See further details here.