
A Deterioration Diagnosis Circuit of a Lithium-Ion Battery Using Microcomputer Implementing Z-Transform Convolution †


1
Instruments, Analyzers & Electricals Group, Negishi Refinery, ENEOS Corporation, 1-1-2 Otemachi, Chiyoda-ku, Tokyo 100-8162, Japan
2
Department of Electrical Engineering, Doshisha University, 1-3 Miyakodani Tatara, Kyotanabe 610-0394, Japan
*
Authors to whom correspondence should be addressed.
†
This paper is an extended version of our paper published Deterioration Diagnosis Method for Li-Ion Battery Using a Transient Characteristic and Development of an Automatic Diagnosis Circuit. University Power Engineering Conference 50th International, Staffordshire, September 2015.
Energies 2021, 14(21), 6868; https://0-doi-org.brum.beds.ac.uk/10.3390/en14216868
Submission received: 30 August 2021
/
Revised: 11 October 2021
/
Accepted: 13 October 2021
/
Published: 20 October 2021
(This article belongs to the Special Issue Recent Progress and Current Challenges in Post Lithium-Ion Batteries and Solid State Batteries)
Abstract
:The deterioration of lithium-ion batteries has been detected by an increase in the battery impedance by means of an alternating current method or a battery capacity test. These methods require an interruption of the operation because the battery has to be removed. A method estimating equivalent circuit parameters of a lithium-ion battery during operation is proposed in this article. The increase in the internal impedance has a close relation to the deterioration of the battery. The circuit is expressed by a resister and an RC parallel circuit connected in series. The parameters can be estimated by applying a convolution technique to the voltage and current fluctuation of the battery during operation. A diagnosis circuit using a microcomputer is developed using a simple algorithm employing z-transformation in the parameter estimation. The estimated parameters depend on its state of charge (SOC) and ambient temperature. The SOC dependency is solved by estimating timing, and the temperature dependency is corrected by a function derived in this article. The deterioration diagnosis of the battery can be applied to a solar power generation system, and the feasibility is discussed in this article.
1. Introduction
Lithium-ion batteries are used with various apparatus due to their remarkable features, such as high energy density [1]. Recently, sustainable power generations using natural energies such as solar and wind have been introduced to prevent global warming. The lithium-ion battery is used with the power generation systems for stabilizing generated power [2,3]. However, its operating voltage, current, and temperature have to be kept within its specification. Otherwise, the battery is led to thermal runaway or over-charge/discharge, and it may result in a burst [4]. For a safety operation, almost all the lithium-ion batteries are used with BMS (battery management system), which monitors the voltage, current, and temperature of the battery [5,6]. However, most BMSs do not have the deterioration diagnosis feature.
The deterioration has been carried out by a capacity test or by detecting an increase in the battery’s internal impedance by means of an alternating current method [7,8,9,10]. The former method requires a charging/discharging system and a long observation time, and the latter method needs an expensive measuring instrument. In addition, both methods require an interruption of the operation of battery-driven equipment because the battery has to be removed [11]. It is not allowed in a system requiring high reliability, such as a large-scale solar power generation system. Therefore, a simple method to detect the deterioration of the battery is required for a safe operation.
This article proposes a deterioration diagnosis method for the lithium-ion battery during its operation. The method is implemented into a microcomputer. It is realized by the simplicity and availability of the proposed algorithm. It indicates that the proposed method can be implemented into BMS.
The proposed method can contribute not only to the safe operation of the batteries but also to the reduction in the environmental load by clarifying the appropriate replacing time of the battery.
2. Deterioration Diagnosis Method
2.1. Equivalent Circuit of Lithium-Ion Battery
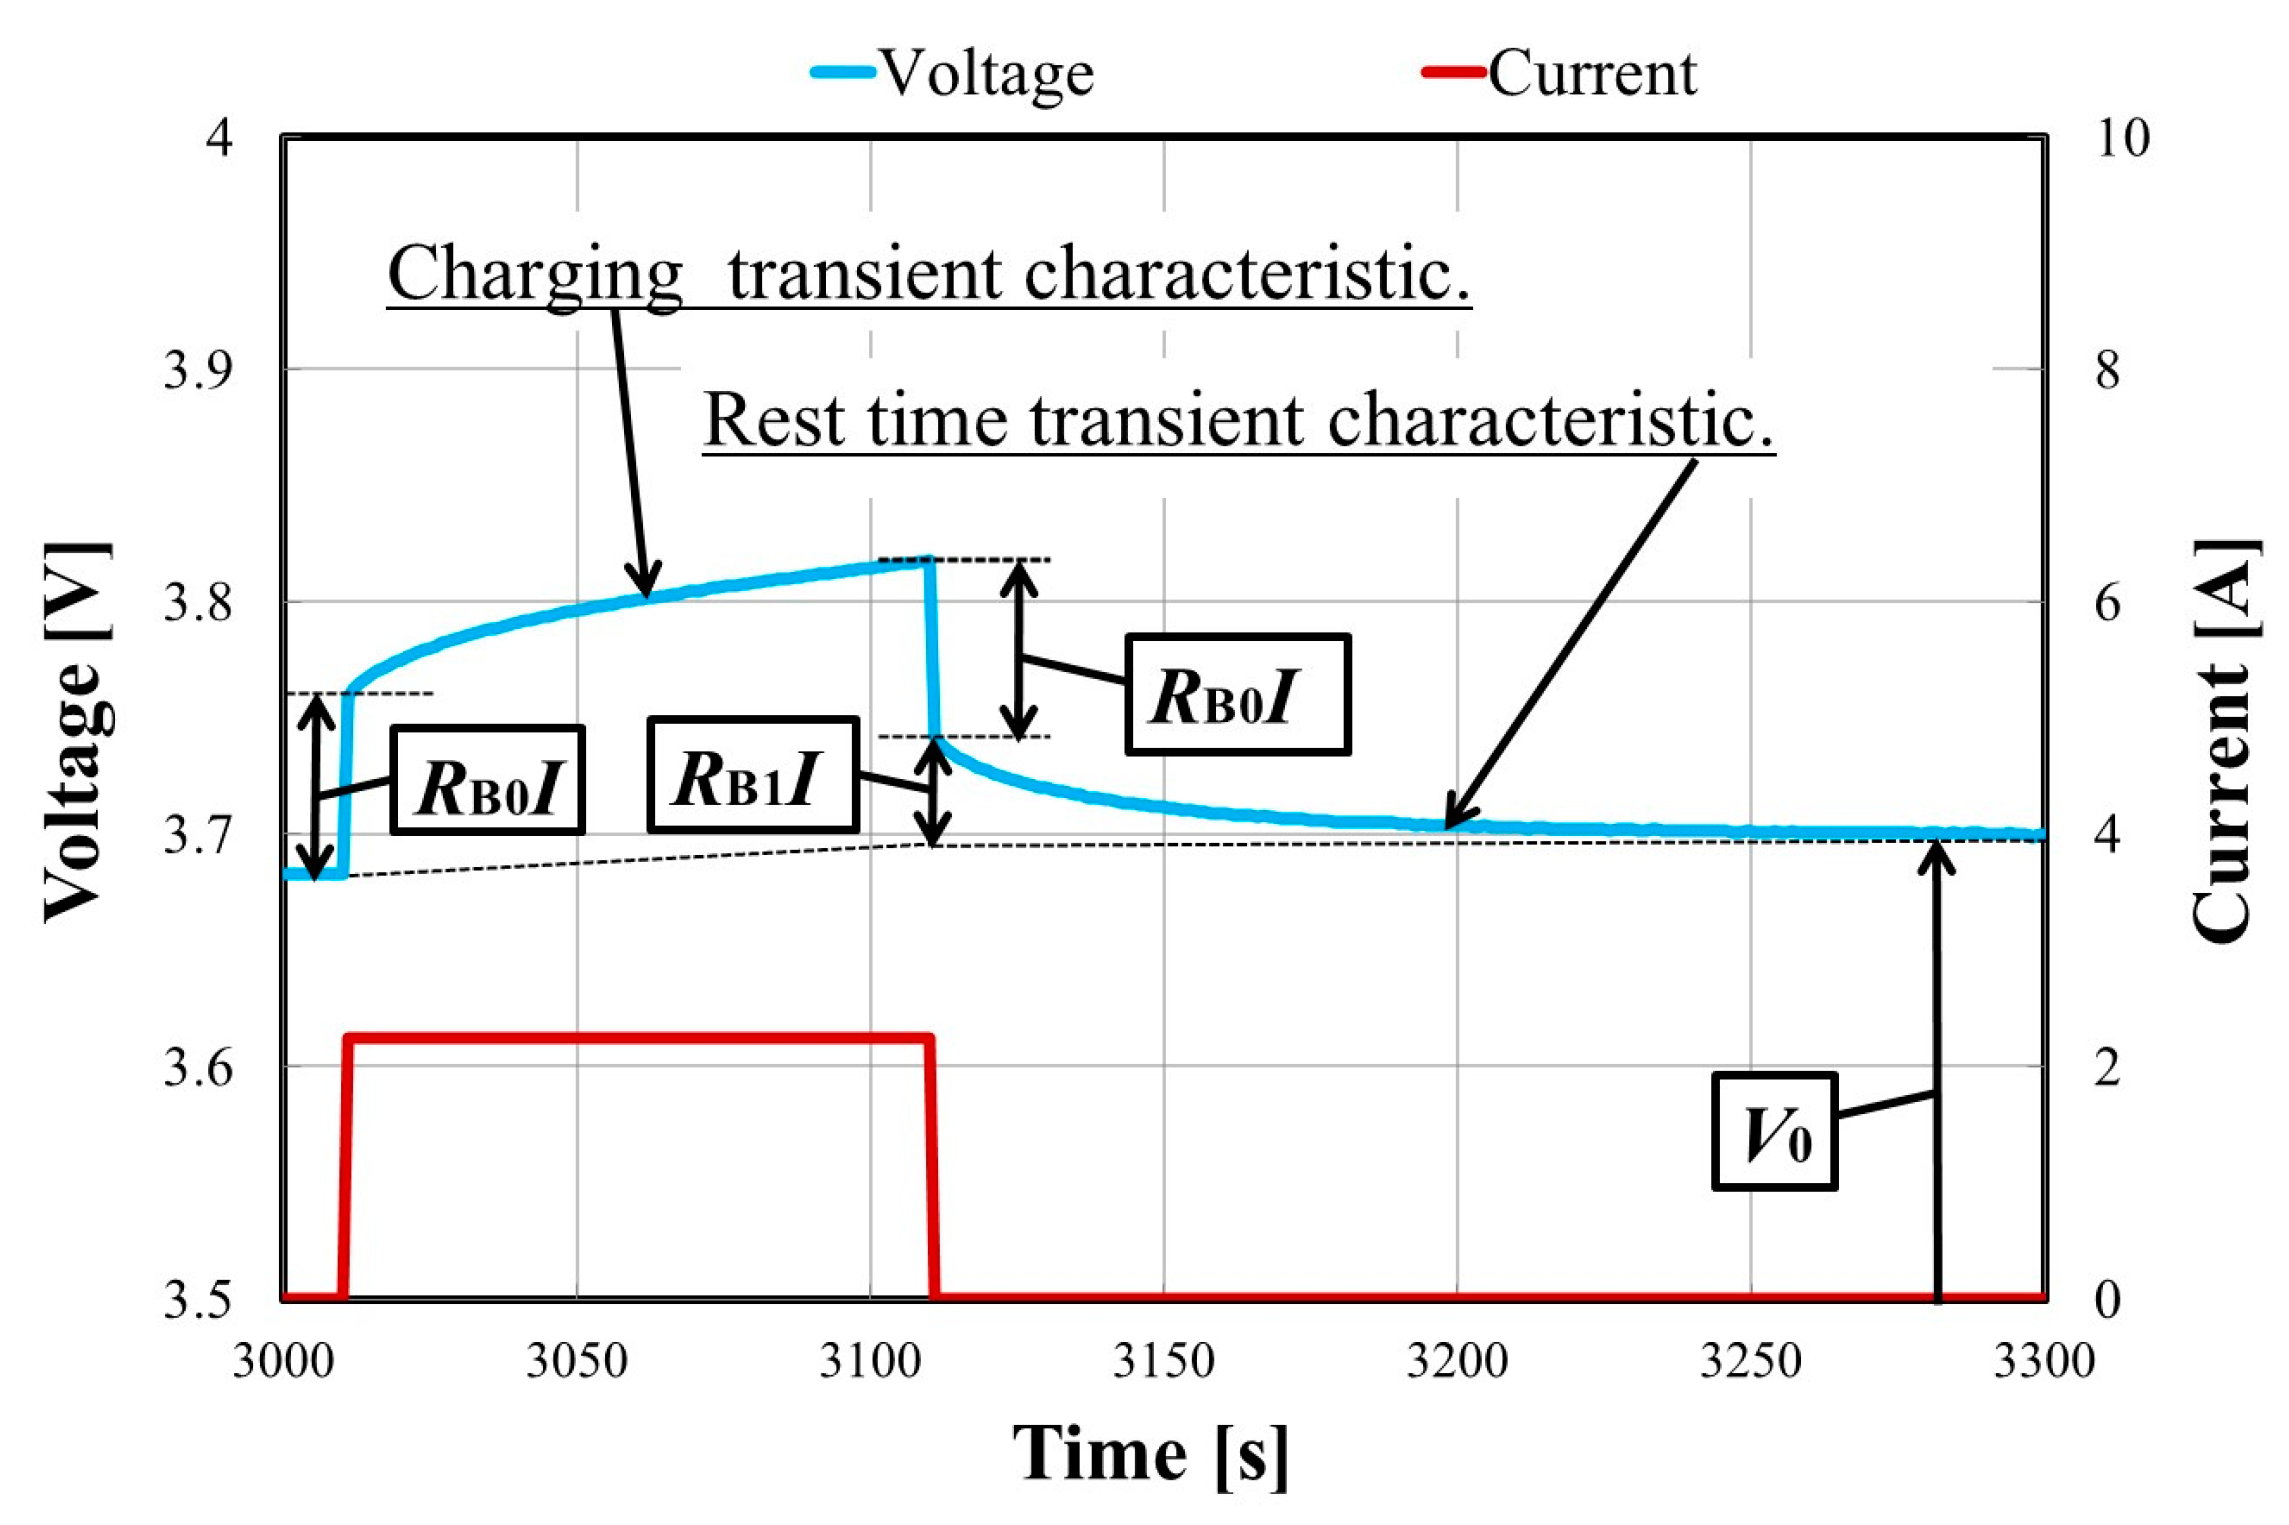
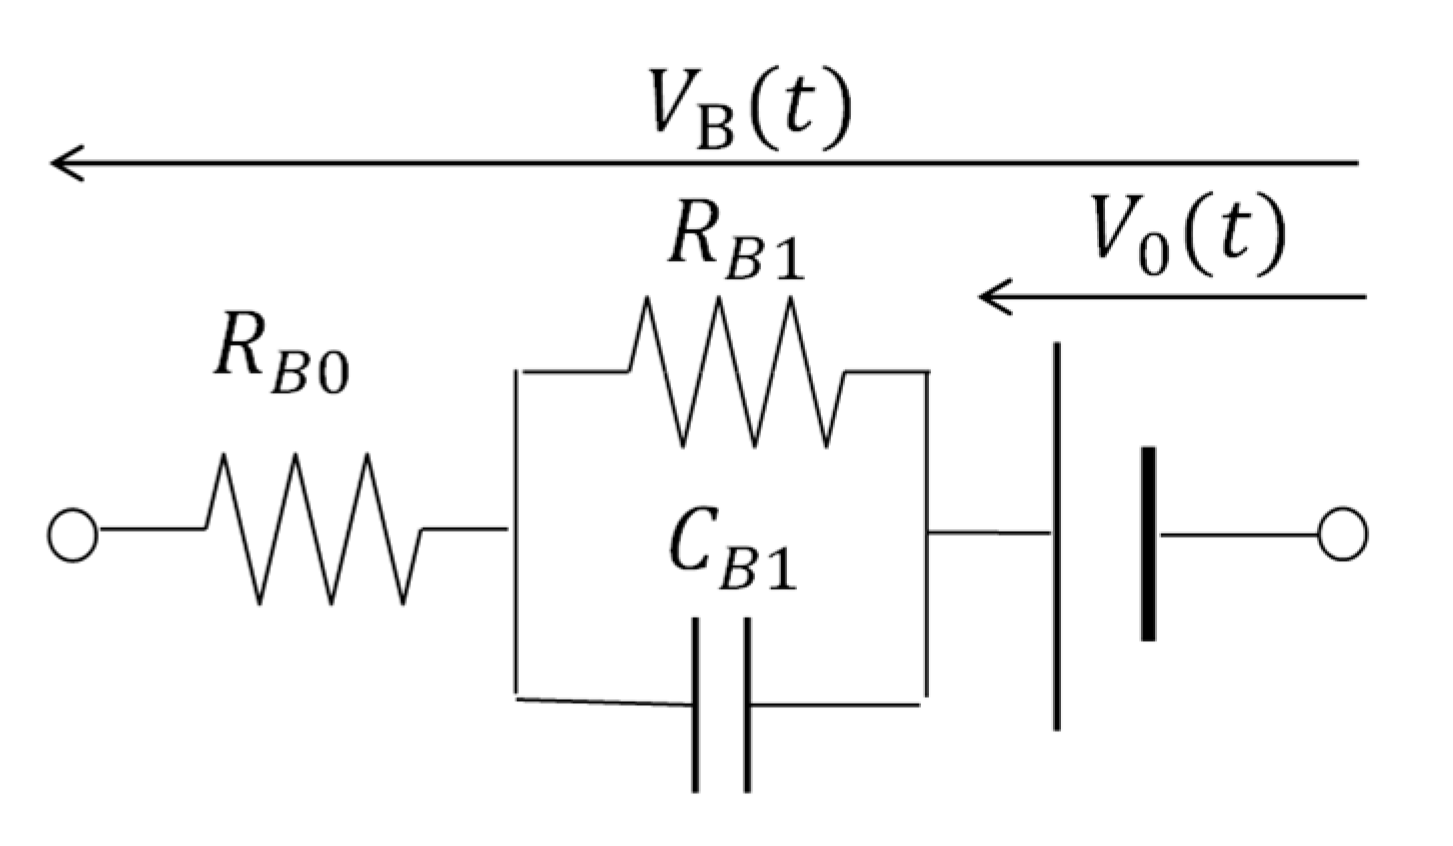
The lithium-ion battery has transient characteristics during charging and discharging. Figure 1 shows a voltage and a current waveform while charging the CGR18650CH cell with a constant current of 1 C (2.25 A). The voltage sharply increases at the beginning of the charging and gradually increases. Similarly, the voltage suddenly decreases at the end of the charging and decreases toward its internal voltage. These transient characteristics can be explained by an equivalent circuit illustrated in Figure 2. It consists of an internal voltage V0, a series resistor RB0, and a series-connected RC parallel circuit whose resistance and capacitance are RB1 and CB1. The voltage across terminals denoted by VB is divided into three parts. Both sudden voltage changes are determined by the series resistance RB0. The voltage increase during the charging is expressed by the increase in the internal voltage V0 and the voltage across the internal impedance. The gradual voltage decrease after the charging is due to the discharge of the internal capacitor CB1.
2.2. Deterioration Diagnosis Method Using a Convolution Technique and z-Transformation
A deterioration diagnosis method for lithium-ion batteries should be simple because its algorithm has to be installed into any BMS. Therefore, a deterioration diagnosis method using convolution technique and z-transformation is proposed in this article. The series resistance RB0 and the resistance RB1 in the RC parallel circuit increase with the deterioration of the battery [12]. The parallel resistance RB1 is an effective parameter to diagnose a deterioration of batteries because the series resistance RB0 depends on the contact resistance. A diagnosis of lithium-ion battery can be realized by deriving the parameter RB1.
The internal impedance Z(s) of the equivalent circuit shown in Figure 2 in a frequency domain is given by Equation (1).
where τ1 is the time constant given by the product of resistance RB1 and capacitance CB1. The voltage drop with the internal impedance of the battery in Figure 2 during charge or discharge by current I(t) is given by the convolution of the current and impulse response of the impedance as shown in Equation (2).
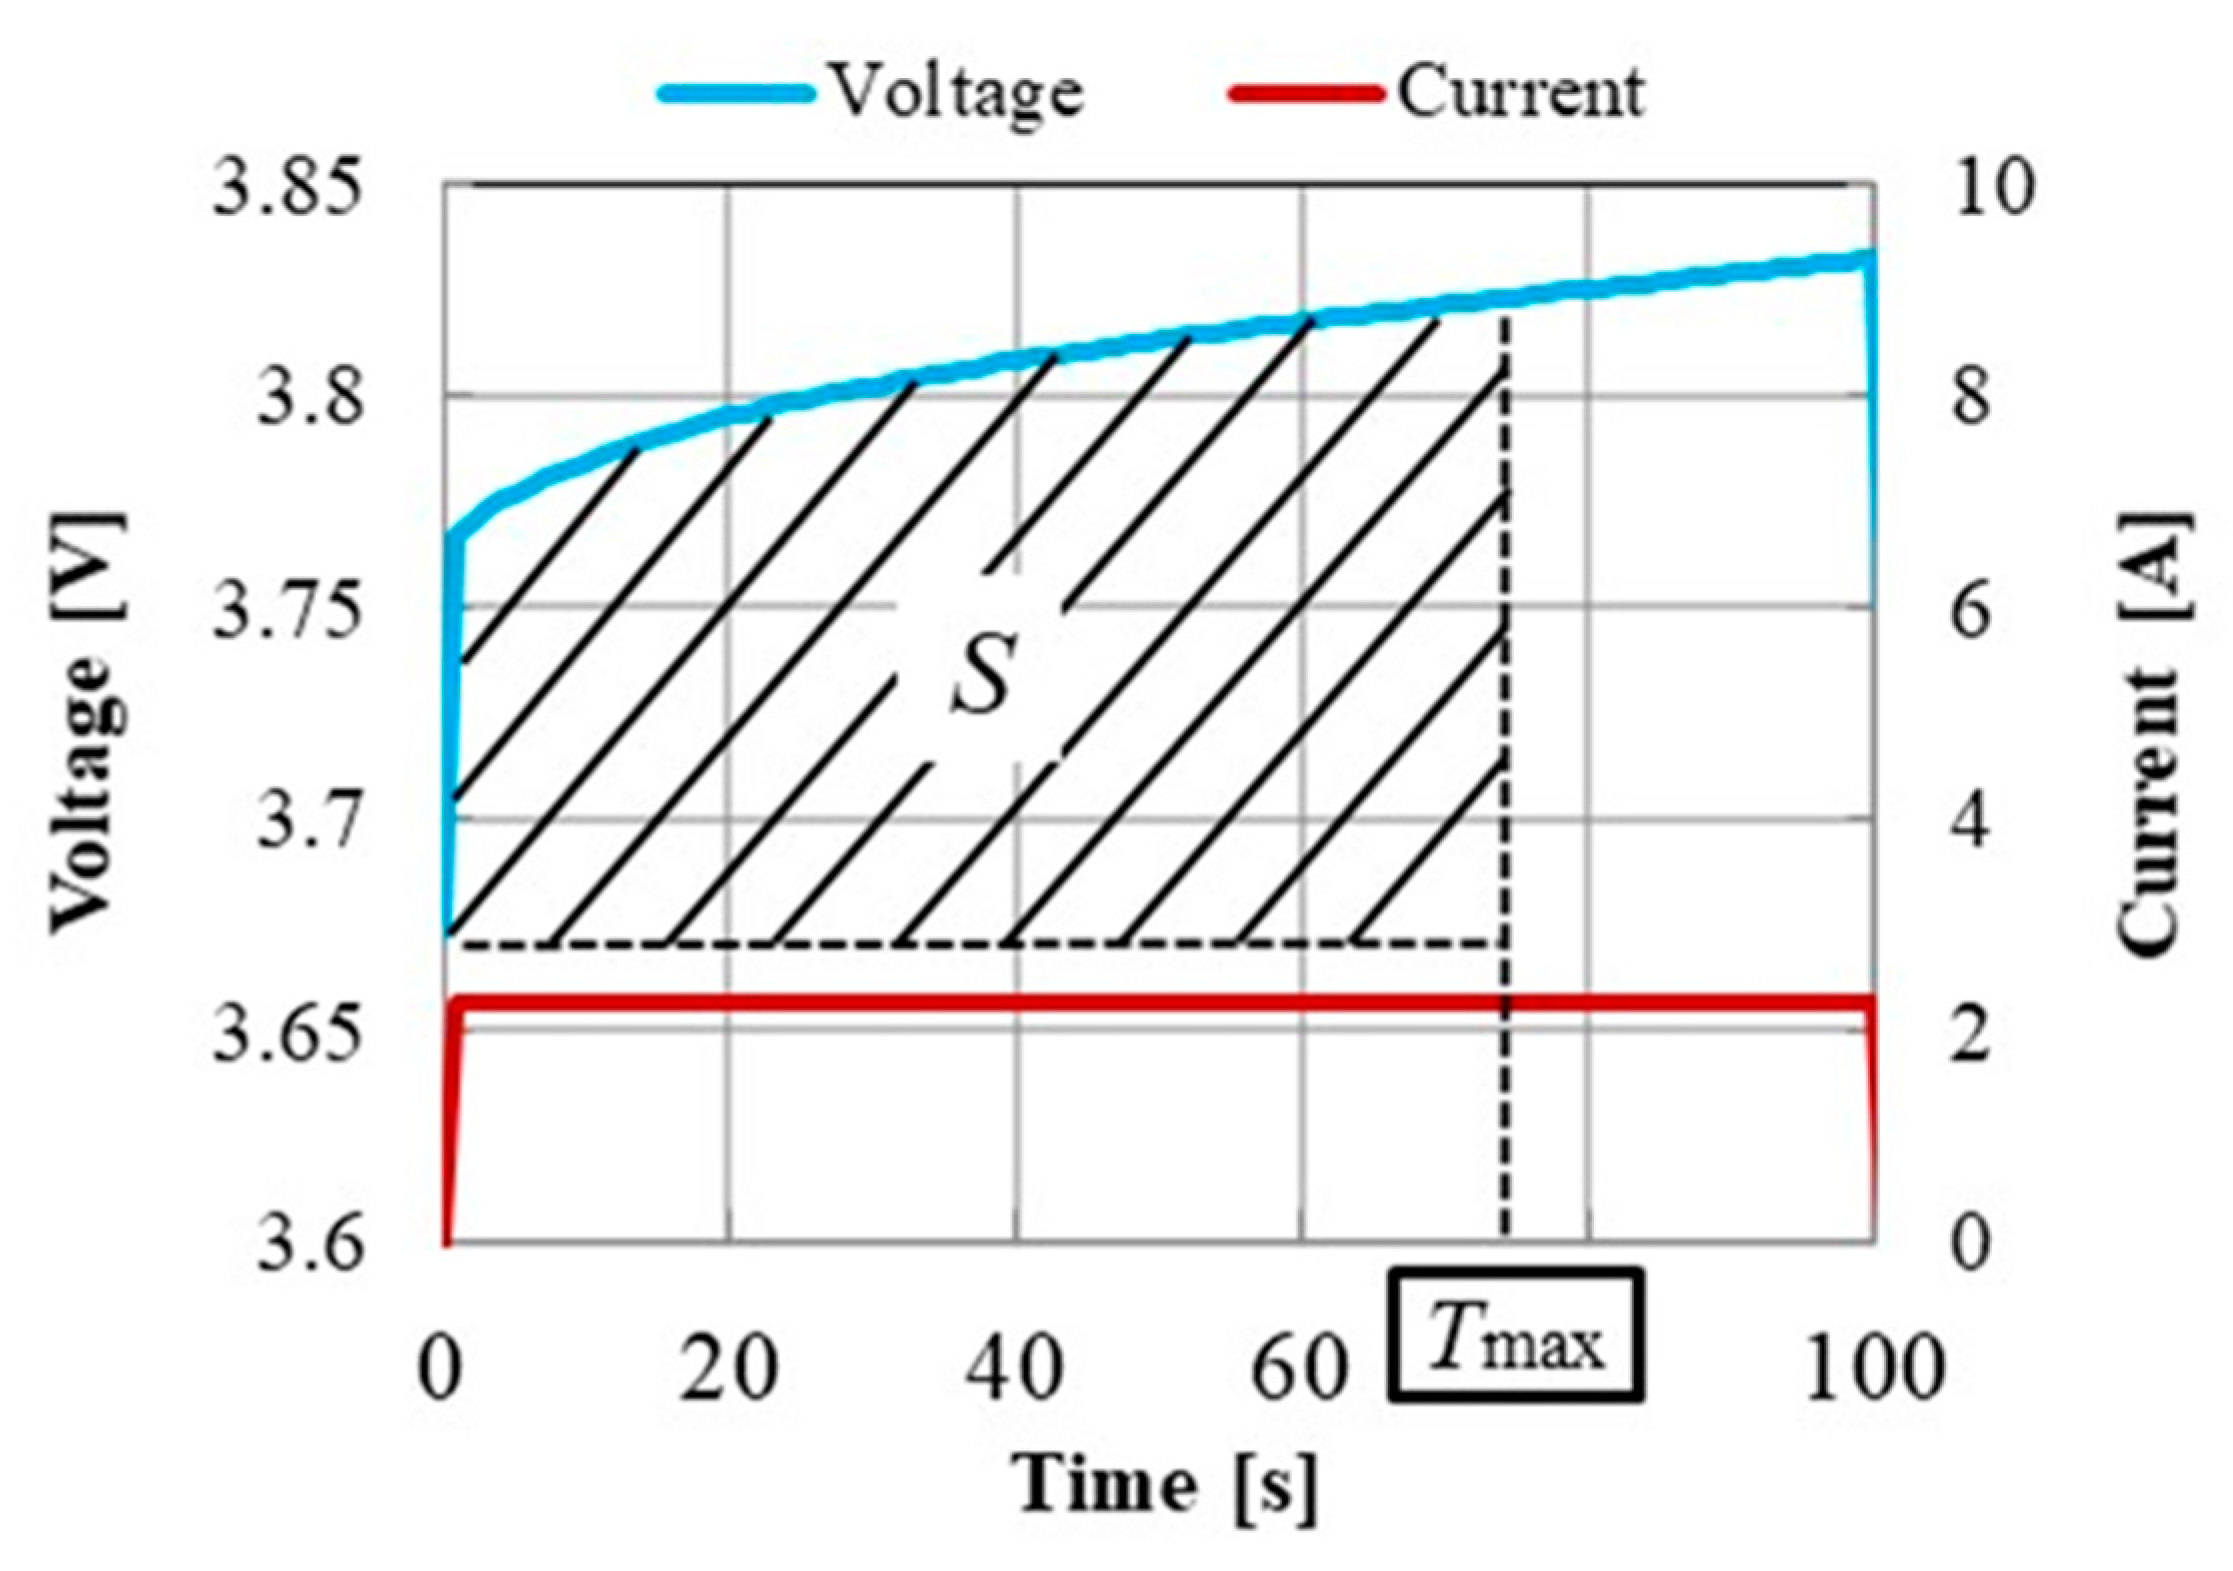
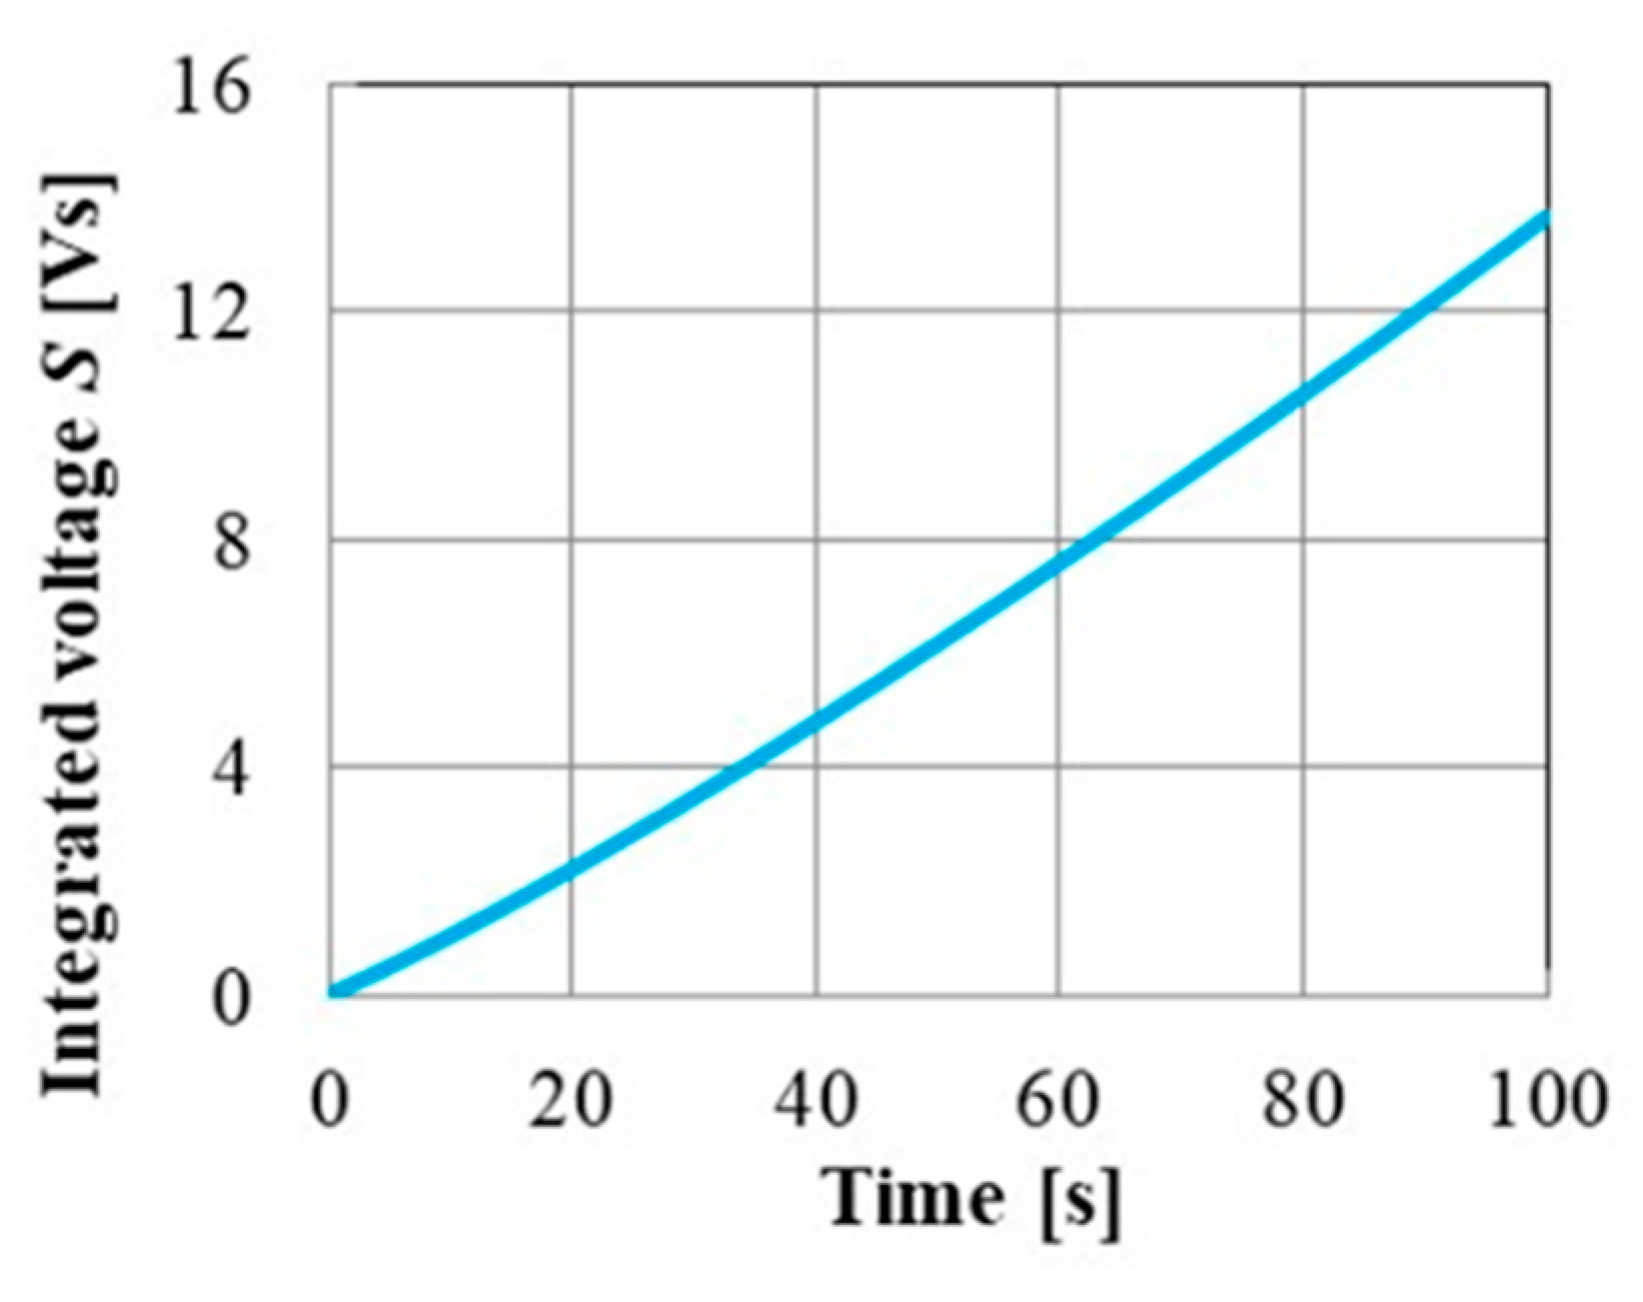
where Δt is sampling time, and n is an arbitrary positive integer. Figure 3 shows the magnified voltage and current waveforms just after starting the charging of the battery shown in Figure 1. The integrated voltage S shown in Figure 3 is given by Equation (3).
where Tmax is the maximum observation time. Figure 4 shows the integrated voltage waveform S. The parameter RB1 is calculated by applying a nonlinear least-squares method with Equation (3) to the measured integrated voltage S. However, this calculation load for the convolution is heavy, and it needs an initial value for the least-squares method. For these reasons, the method is not suitable from the viewpoint of installation into BMS. Therefore, a simple algorithm using z-transformation is proposed in this article.
The transfer function H(z) in z-domain in Equation (1) is given by Equations (4) and (5).
where Δt is sampling time. The voltage V(z) across the battery’s internal impedance in the z-domain is given by Equation (6).
where I(z) is a charging current in the z-domain. The integrated voltage S(z) by trapezoidal rule in z-domain is given by Equation (7)
Equation (8) shows the process of the conversion from z-domain to time-domain.
The coefficients a0, a1, and b1 can be determined from Equation (8). Equation (9) is the matrix representation of Equation (8) to be solved.
where l is the number of samples. The above equation can be represented by using column vectors (i), (i), (s), and (s).
The number of equations in Equation (10) is greater than the number of unknowns a0, a1, and b1. For solving the equation, the transposed coefficient matrix is multiplied on both sides of Equation (10).
The coefficients a0, a1, and b1 are obtained by solving Equation (11). This corresponds to the solution of Equation (10) by the least square error method. The parameters RB0, RB1, and CB1, are given by Equation (12) after transforming Equation (7) from z-domain to time-domain. This calculation method is approximately equal to the convolution in Equation (3). Thus, the diagnosis of a lithium-ion battery for BMS can be realized due to its simplicity.
3. Experimental Results
3.1. Diagnosis Method Using Convolution
The effectiveness of the deterioration diagnosis method using the time-domain convolution method shown in Equation (3) is described in this section. The battery CGR18650CH, whose capacity is 2.25 Ah, is used for the experiments. Some deteriorated batteries from 0 to 500 cycles are prepared.
3.1.1. Deterioration Dependence
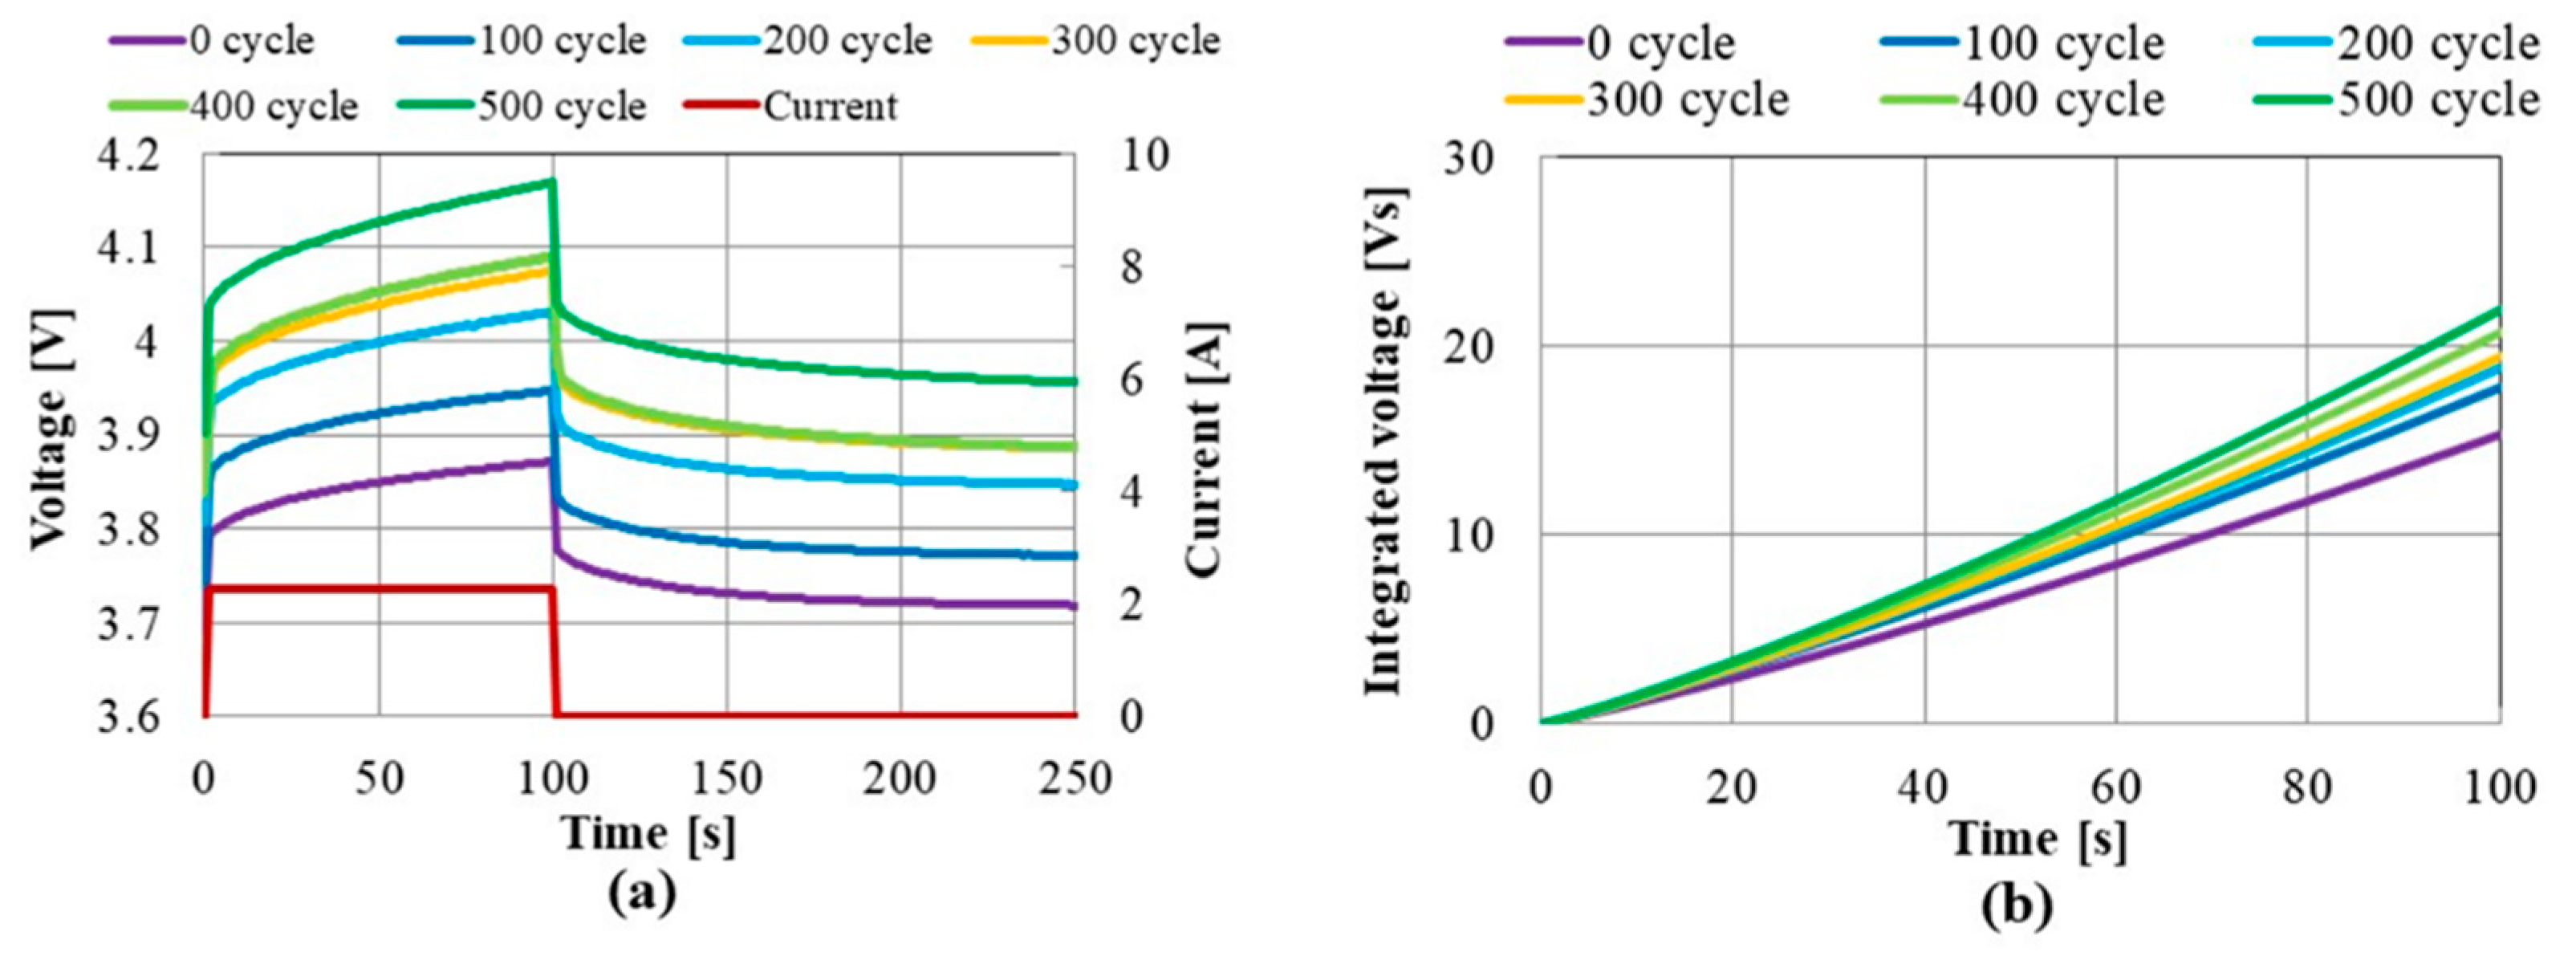
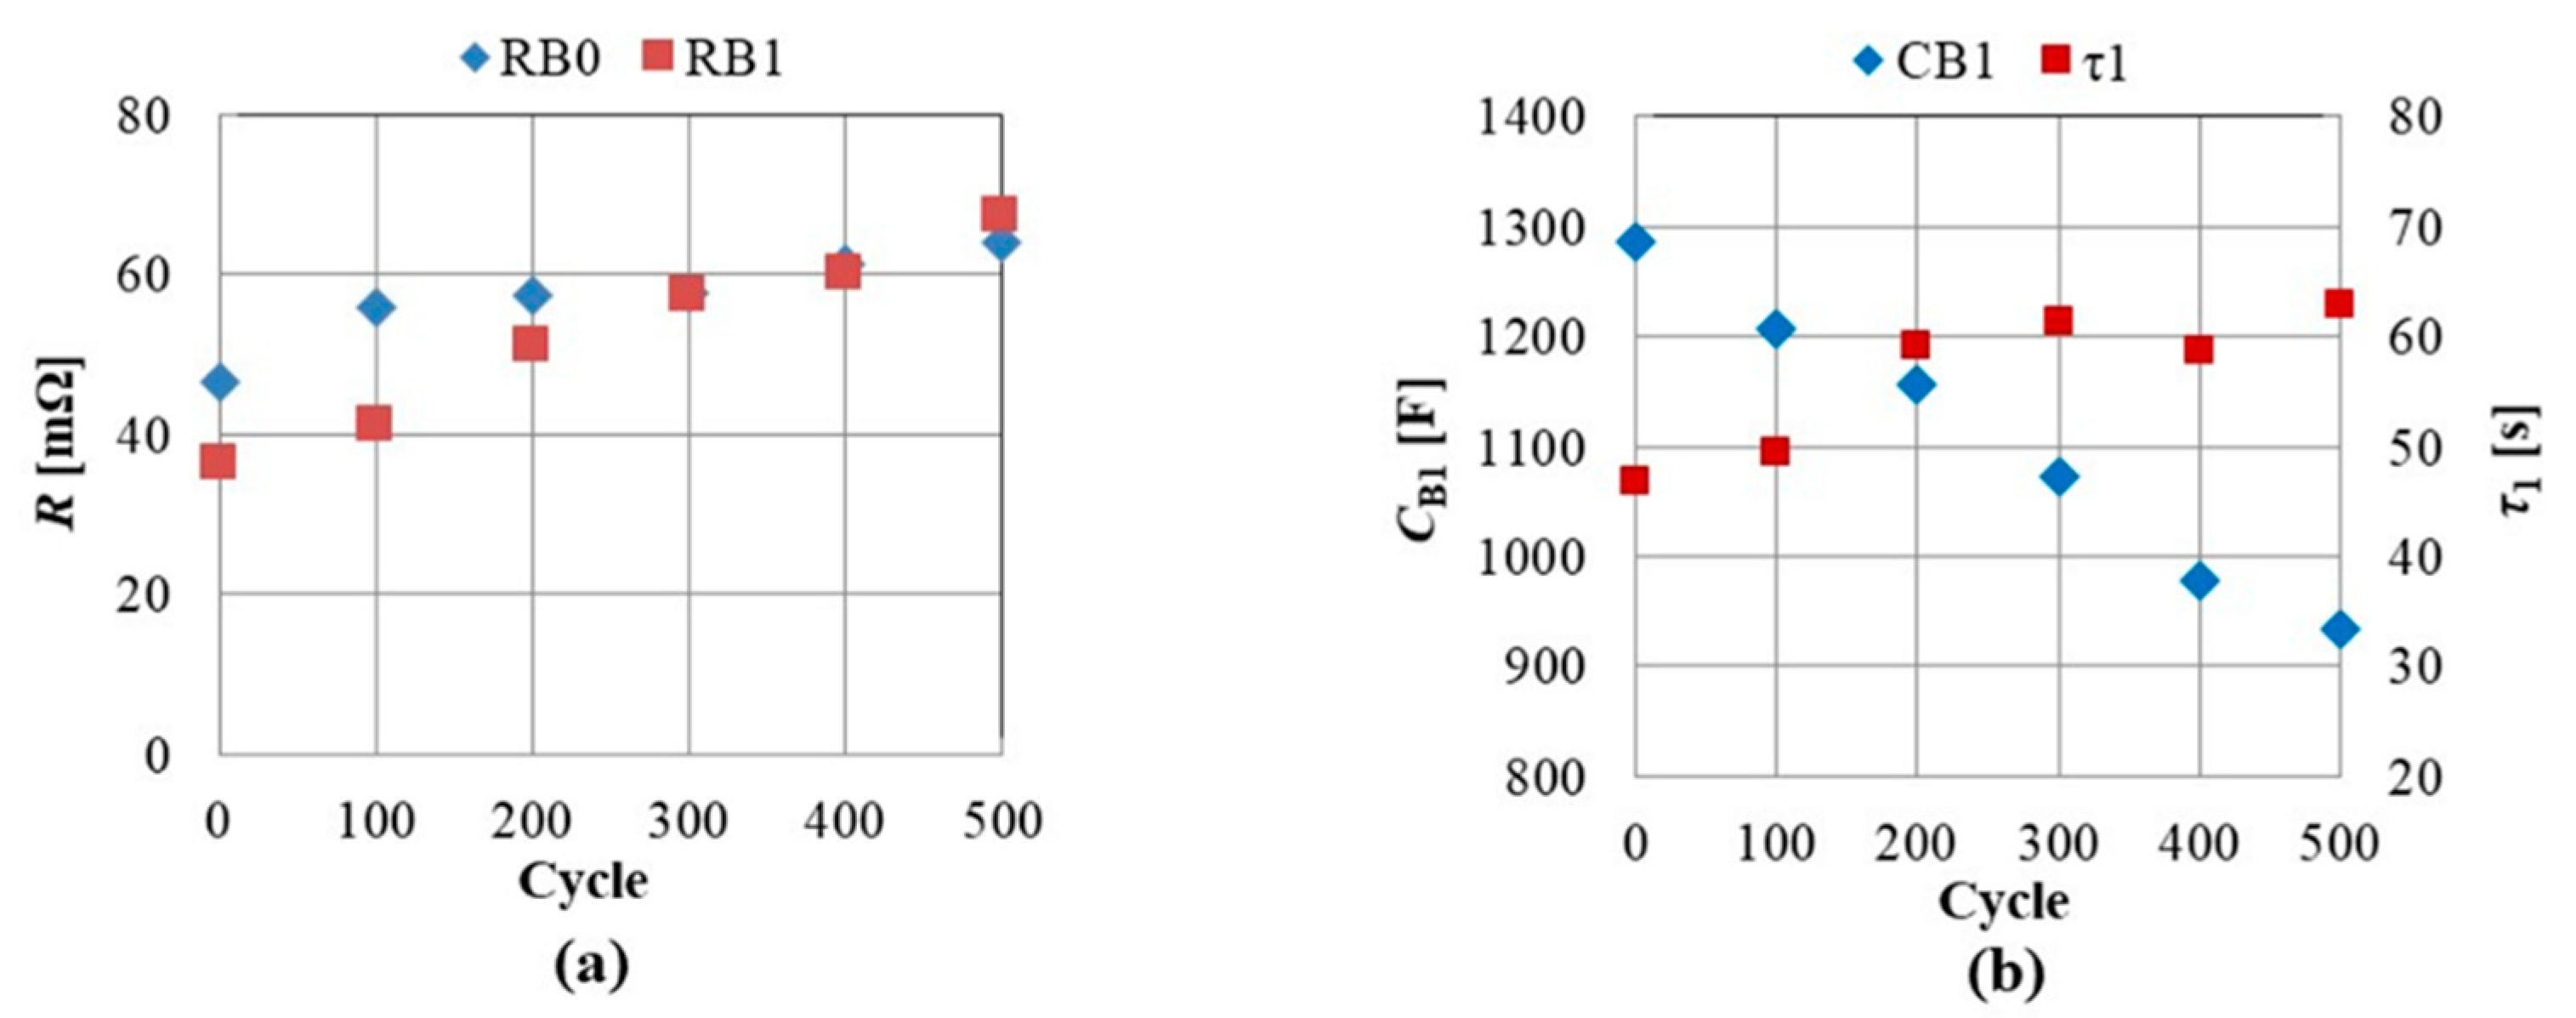
Figure 5a shows a voltage response to a charging current of 1 C (2.25 A) for 100 s. At the beginning of the charging, the SOC (state of charge) is 50%, and the ambient temperature around the battery is 25 °C. Figure 5b shows the characteristics of the integrated voltage S illustrated as a shaded area in Figure 3 versus time. The integrated voltage in Figure 5b increases with the deterioration of the battery. The equivalent circuit parameters obtained by applying the least-squares method to the integrated voltage waveforms in Figure 5b with Equation (3) are shown in Figure 6. The observation time Tmax in Equation (3) is 100 s, Δt is 1 s. The efficient parameter RB1 to detect deterioration increases with the deterioration of the battery. The results illustrated in Figure 6a show the method using convolution technique can be diagnosed the deterioration of the lithium-ion battery.
3.1.2. SOC Dependence
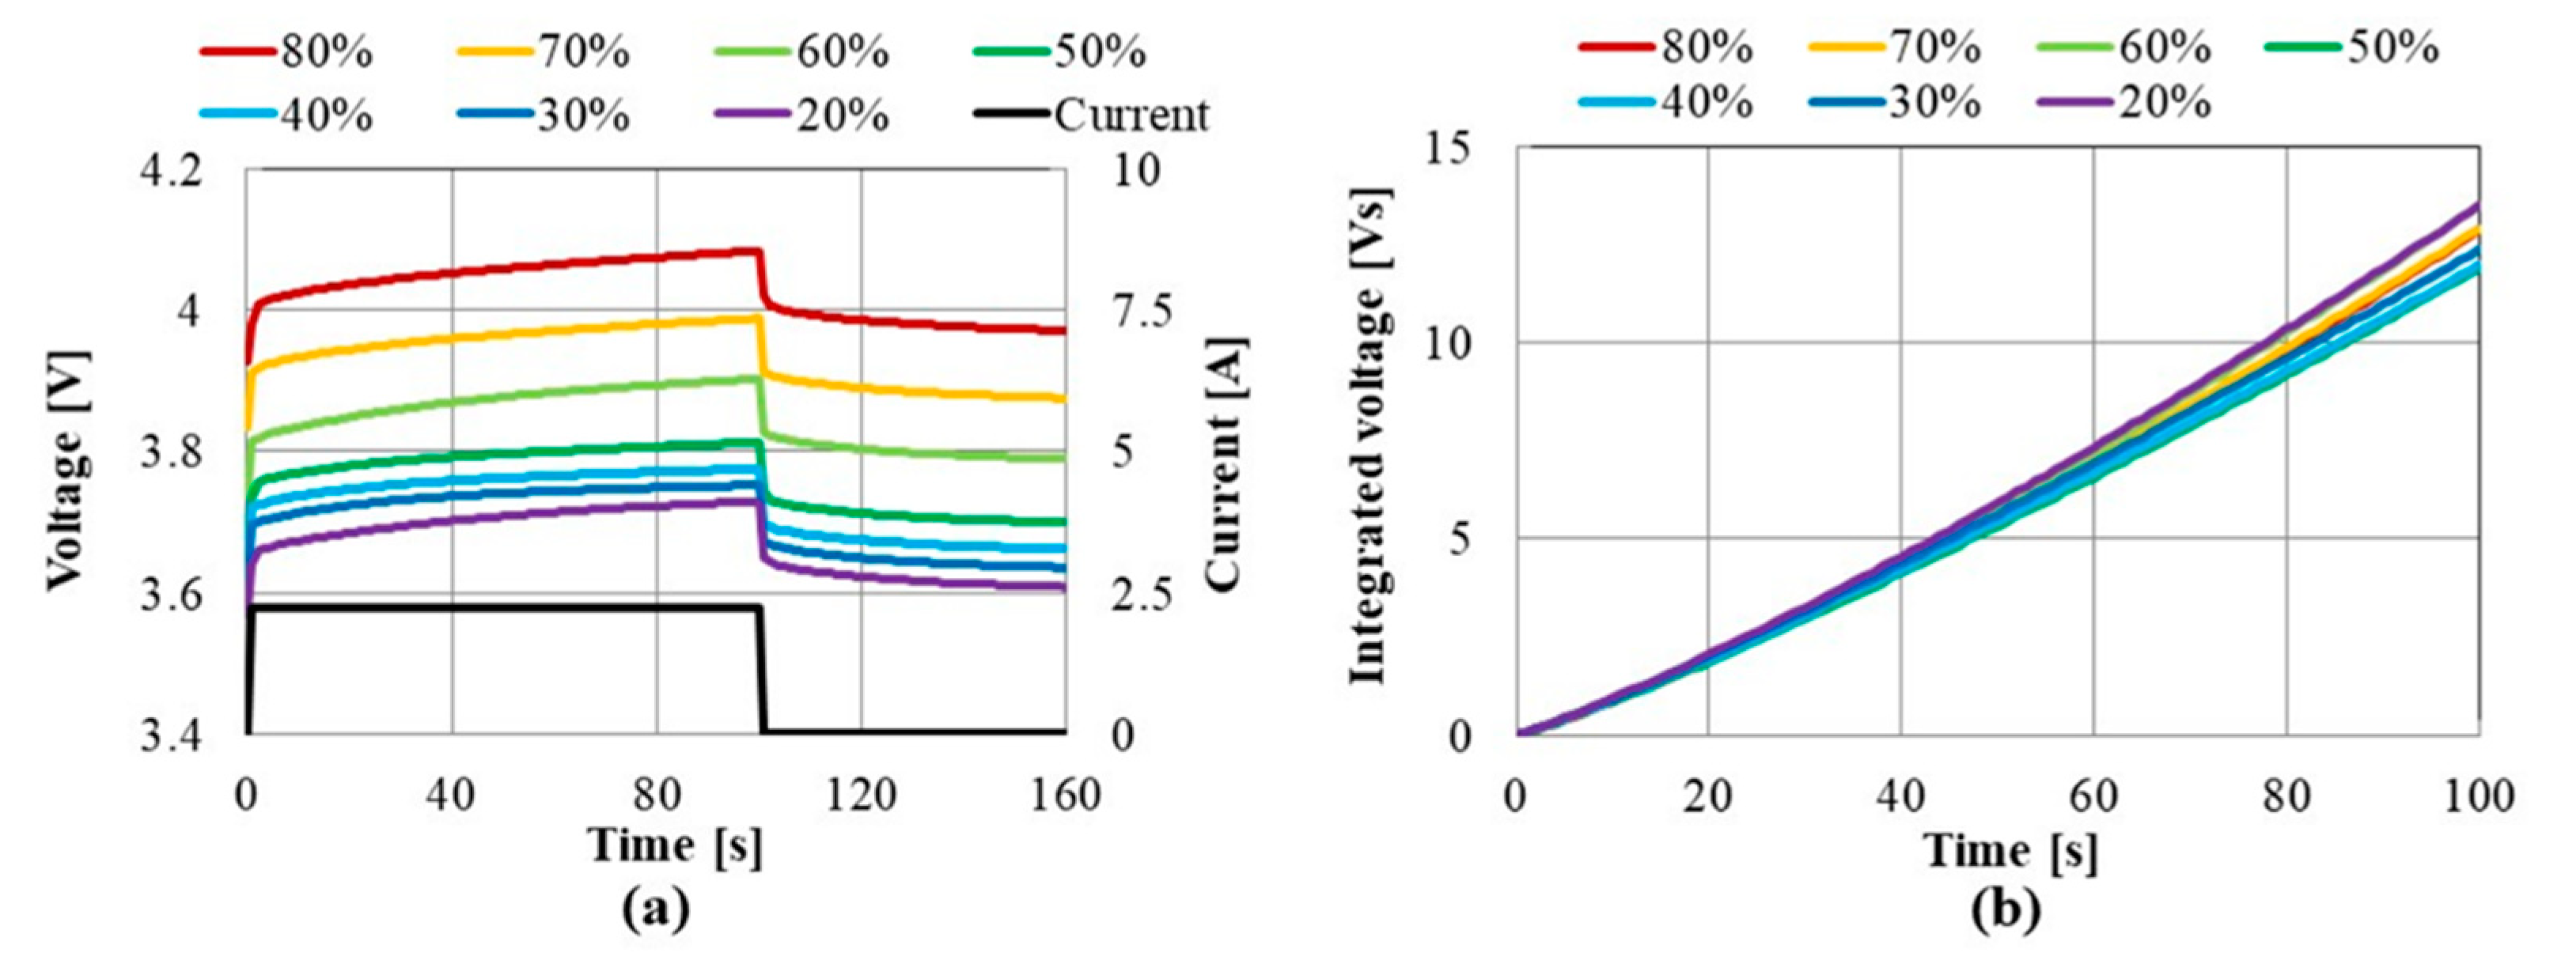
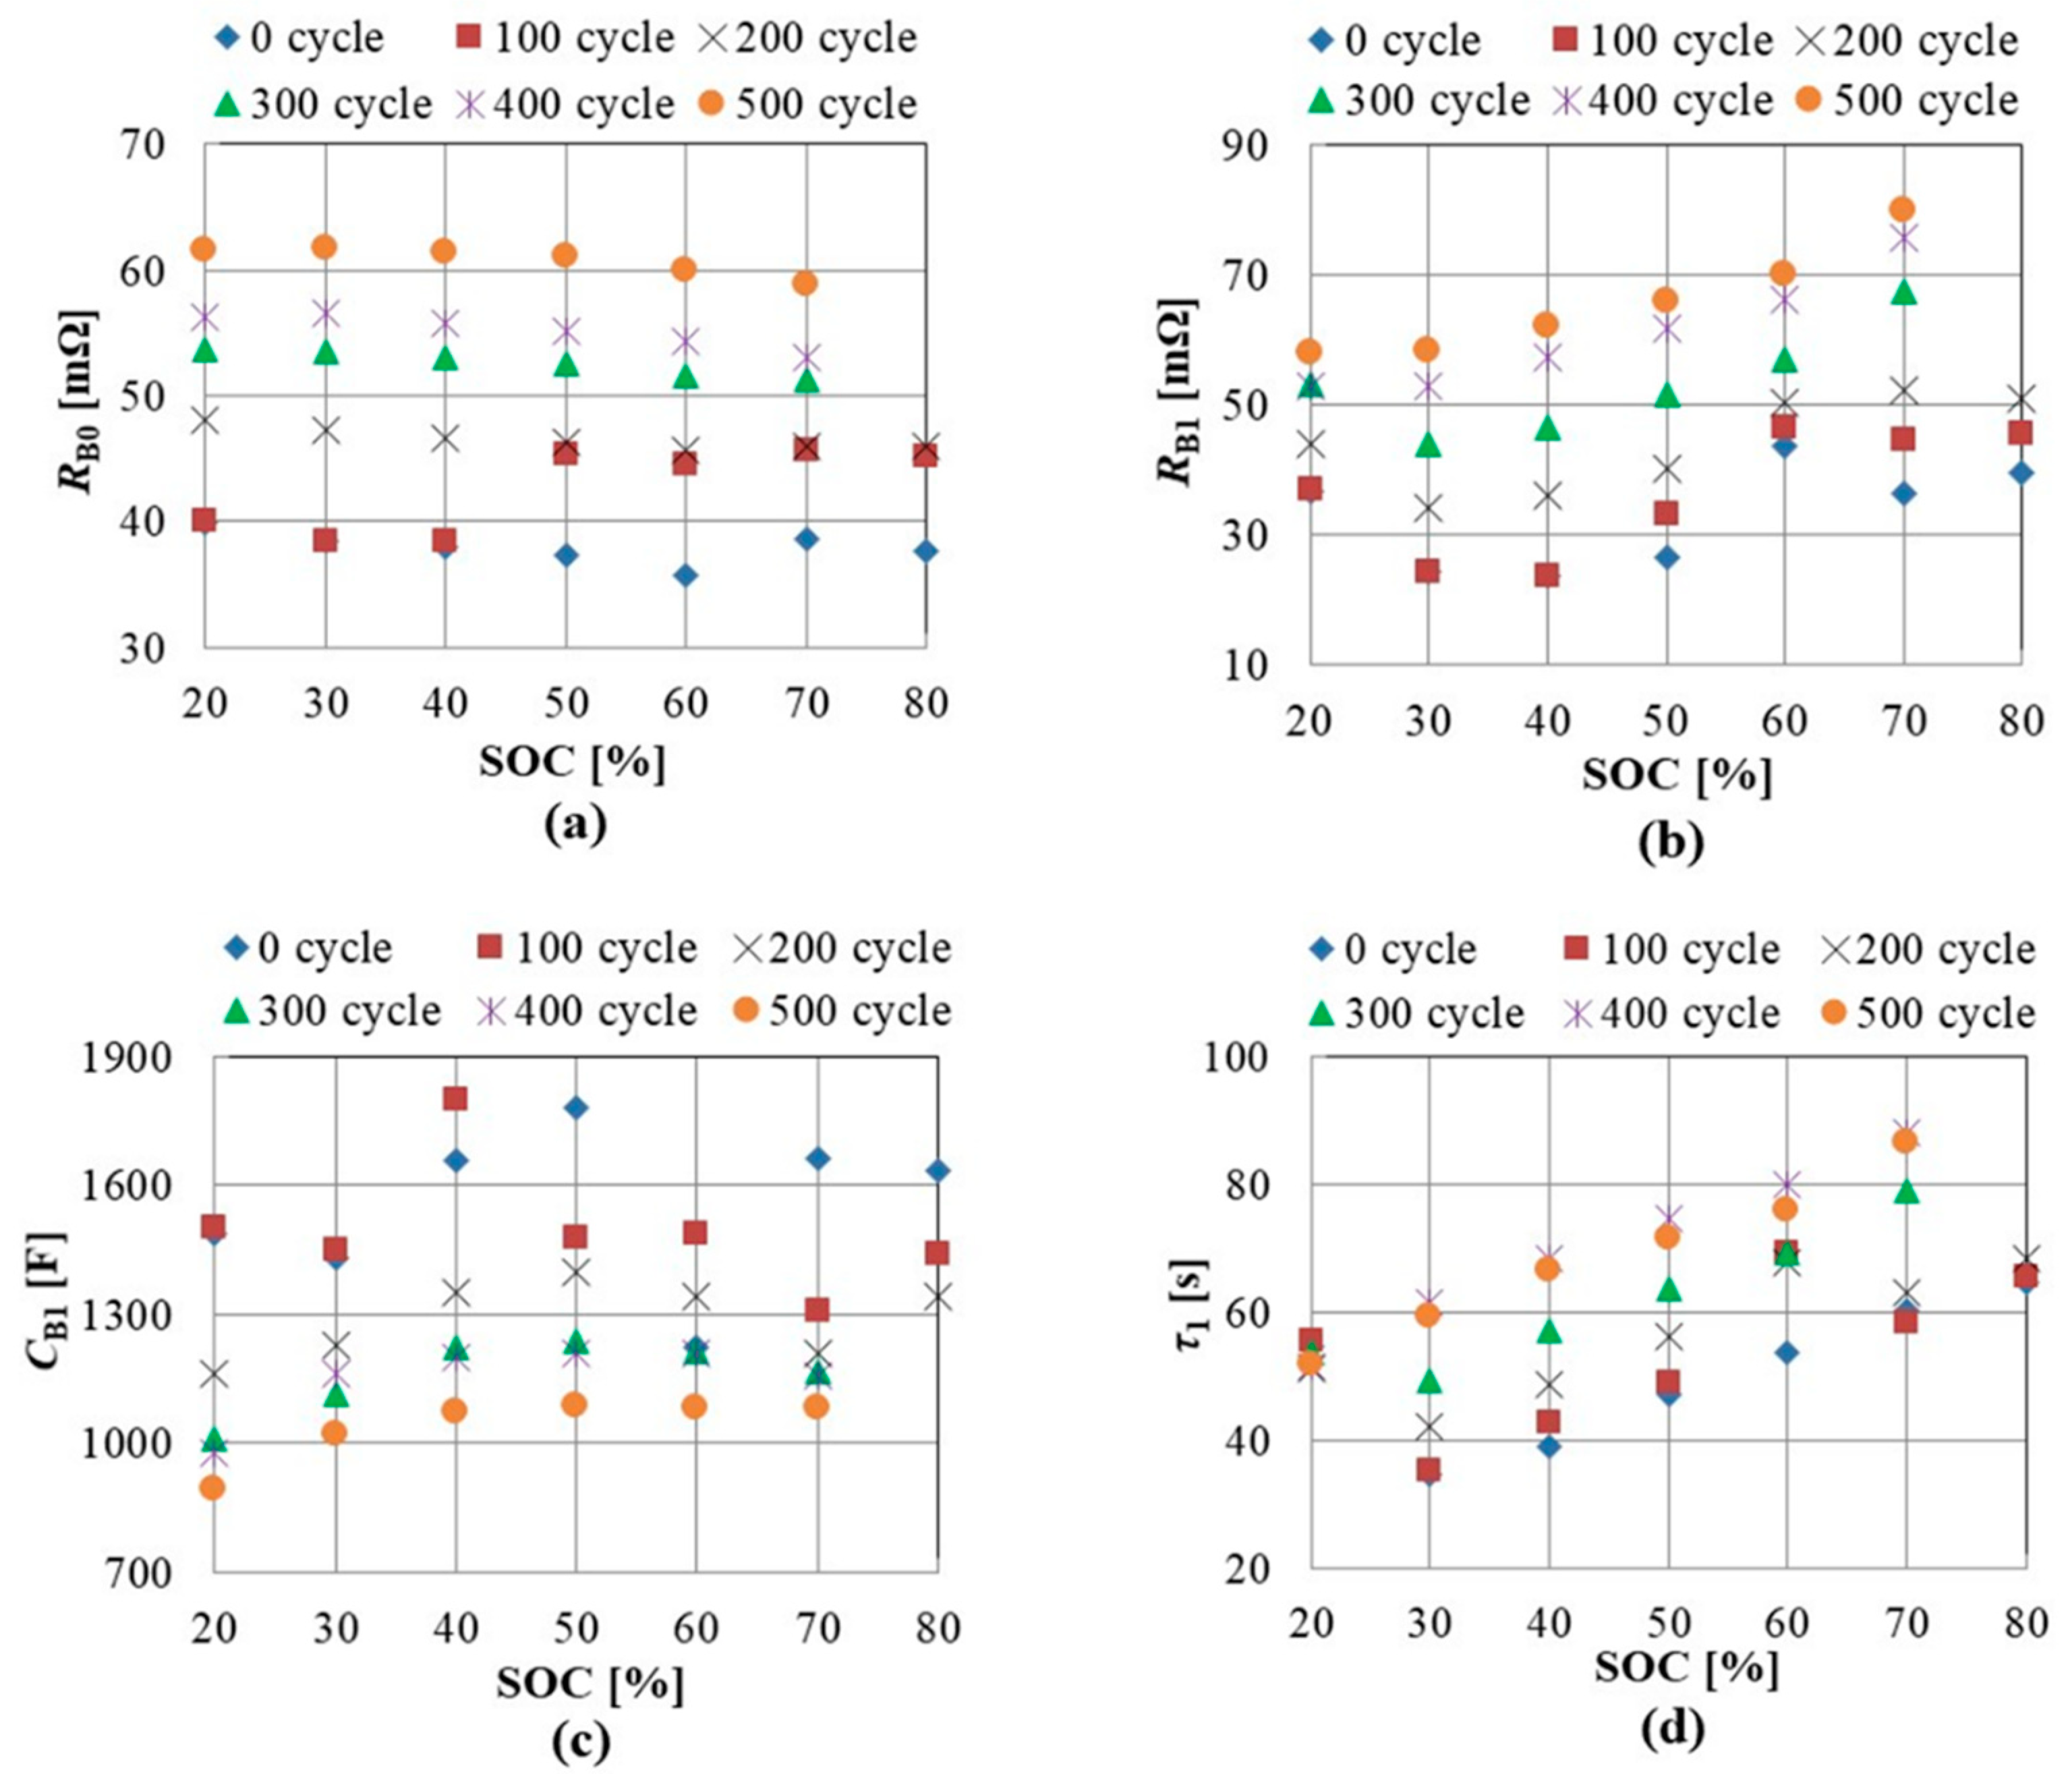
Figure 7a shows the SOC dependence of the voltage responses to a new battery. Its initial SOC (at the beginning of the charging) is set from 20% to 80%. The charging current is 1 C (2.25 A), and the charging period is 100 s. The ambient temperature around the battery is 25 °C and the sampling period is 1 s. Figure 7b shows the effect of the initial SOC on the integrated voltage waveforms S(t) obtained from the voltages shown in Figure 7a. The SOC dependence of the integrated voltage is lower than that of the deterioration characteristic. Figure 8 shows the parameters obtained by curve fitting of Equation (3) by means of the least-squares method. Although the RB1 monotonically increases with the deterioration, the value depends on SOC. The practical solution of the SOC dependence is that the diagnostic is scheduled at a specific SOC, which is suitable for each application. Continuous diagnostic is not required; in general, weekly or monthly inspection is enough in most cases.
3.1.3. Temperature Dependence
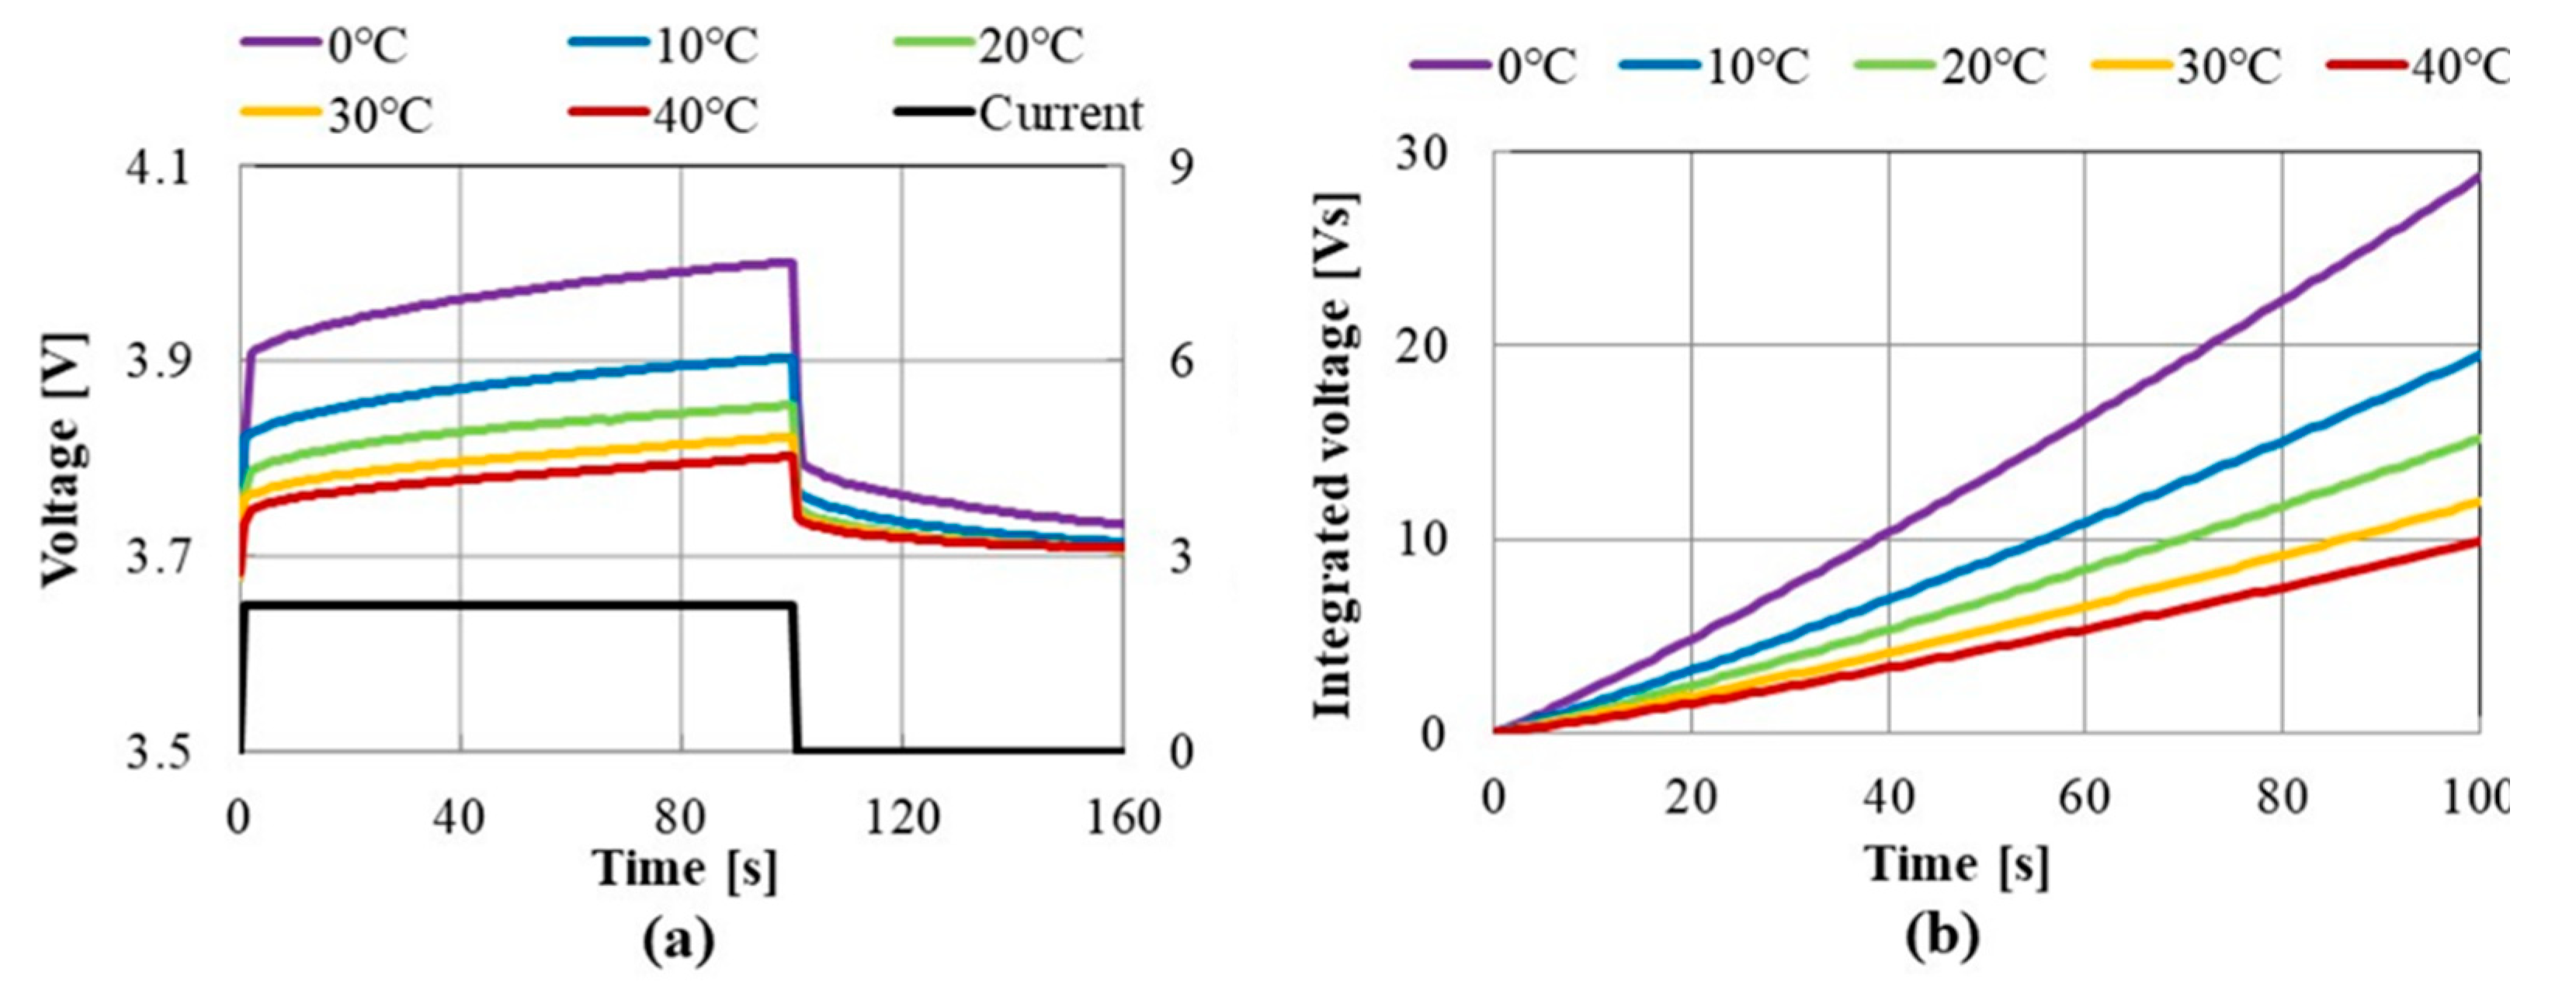
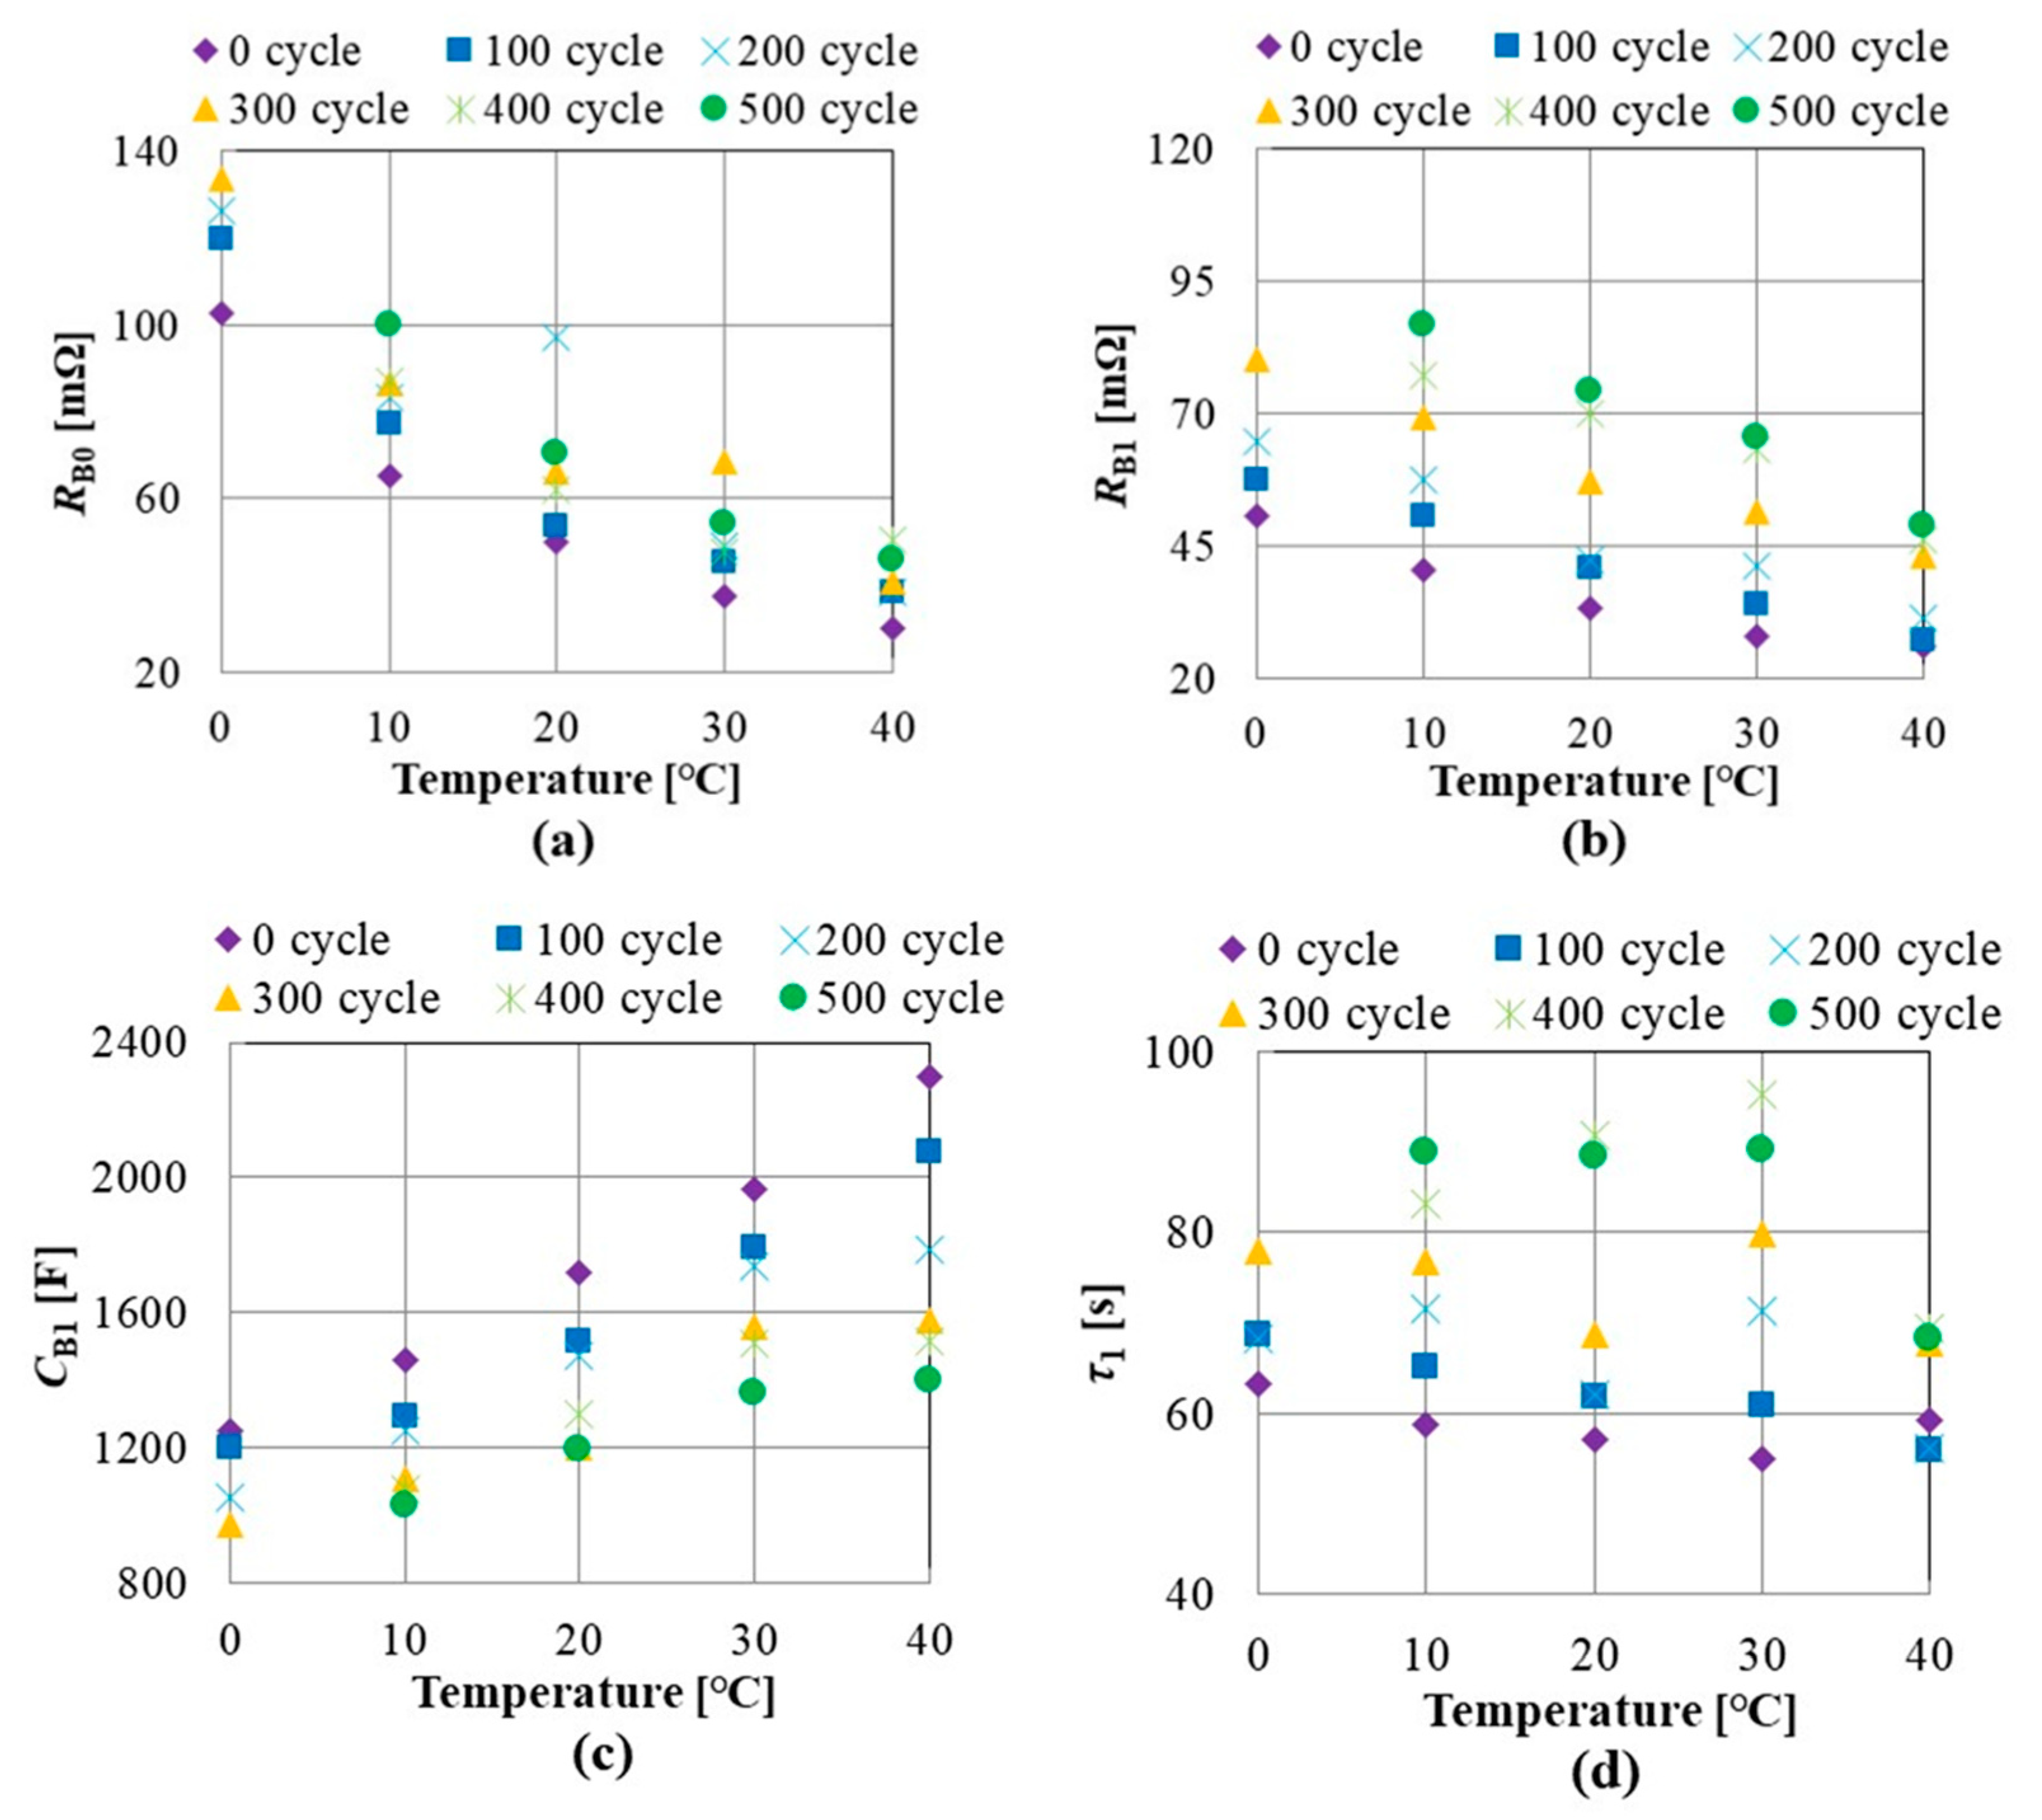
Figure 9a shows the temperature dependence of the voltage waveforms. The ambient temperature around the battery is changed from 0 to 40 °C. These waveforms are obtained using a new battery with a sampling period of 1 s. The battery is charged by a current of 1 C (2.25 A) for 100 s, and the initial SOC is 50%. Figure 9b shows the effect of the temperature on the integrated voltage waveforms obtained from the voltages shown in Figure 9a. The equivalent circuit parameters calculated by curve fitting using Equation (3) are shown in Figure 10. The parameter RB1 exponentially decreases with the increase in the ambient temperature. Therefore, a temperature correction of the parameter RB1 is required [12].
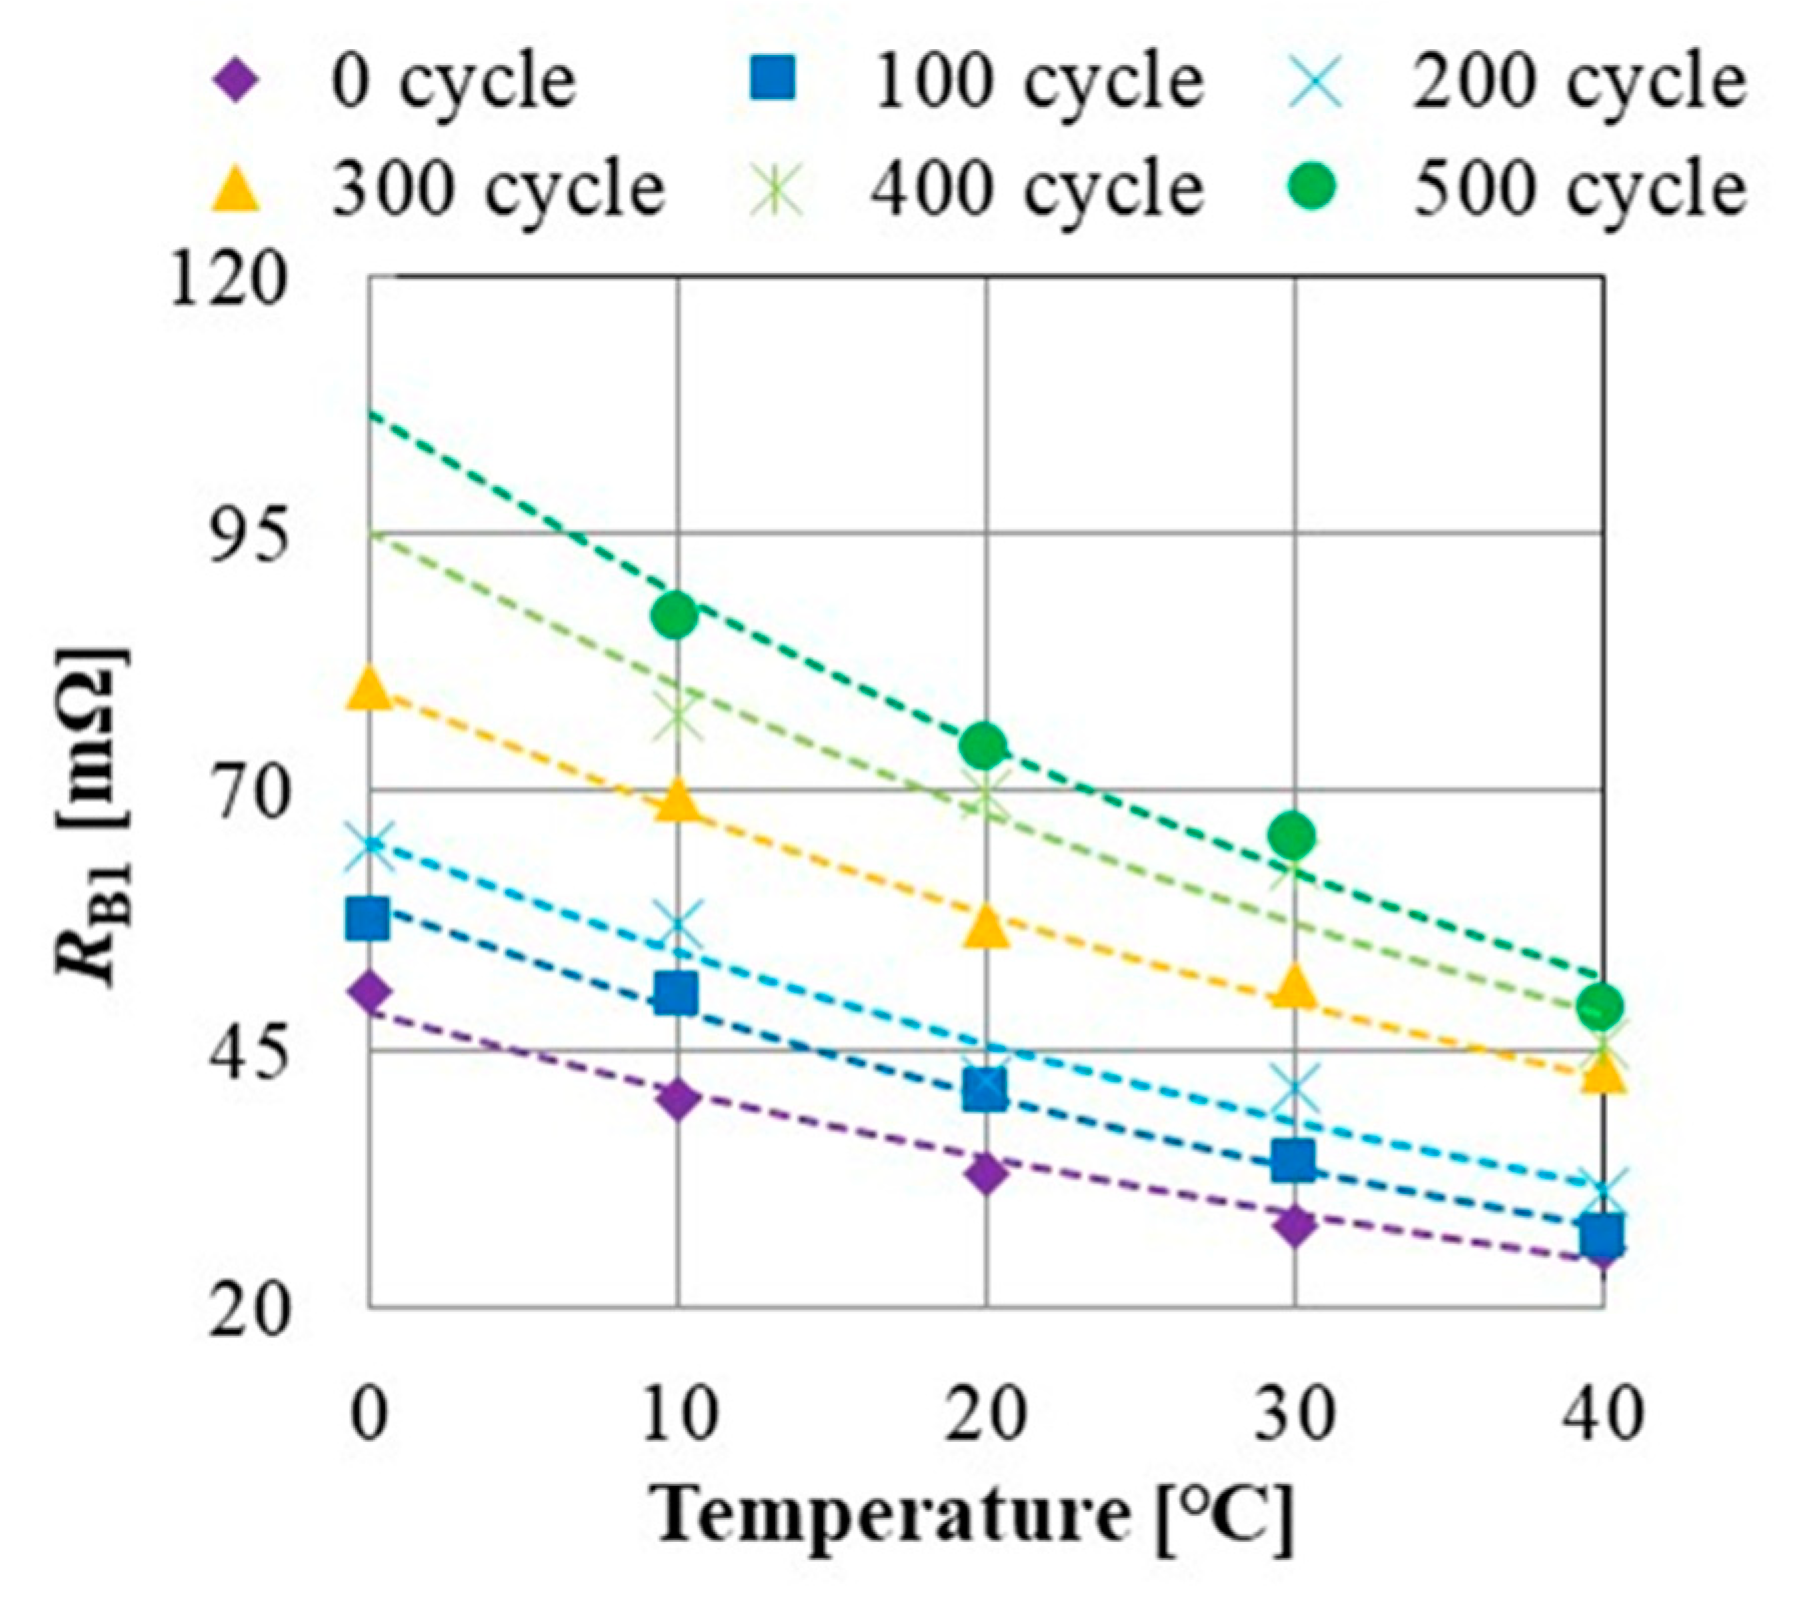
Figure 11 shows the parameter RB1 versus temperature with approximated curves expressed by Equation (13).
where T is the ambient temperature, and the parameter RC′ expresses the estimated resistance RB1 at T = 0 °C.
Table 1 shows the deterioration characteristic of the corrected parameters RC′ and TC in Equation (13). The parameter RC′ increases by 120% according to the deterioration of the battery, and the coefficient TC can be estimated that it is constant. The corrected parameter RC’ can be obtained from the estimated resistance RB1 and ambient temperature T with the averaged coefficient TCA (=57.3 °C) in Table 1.
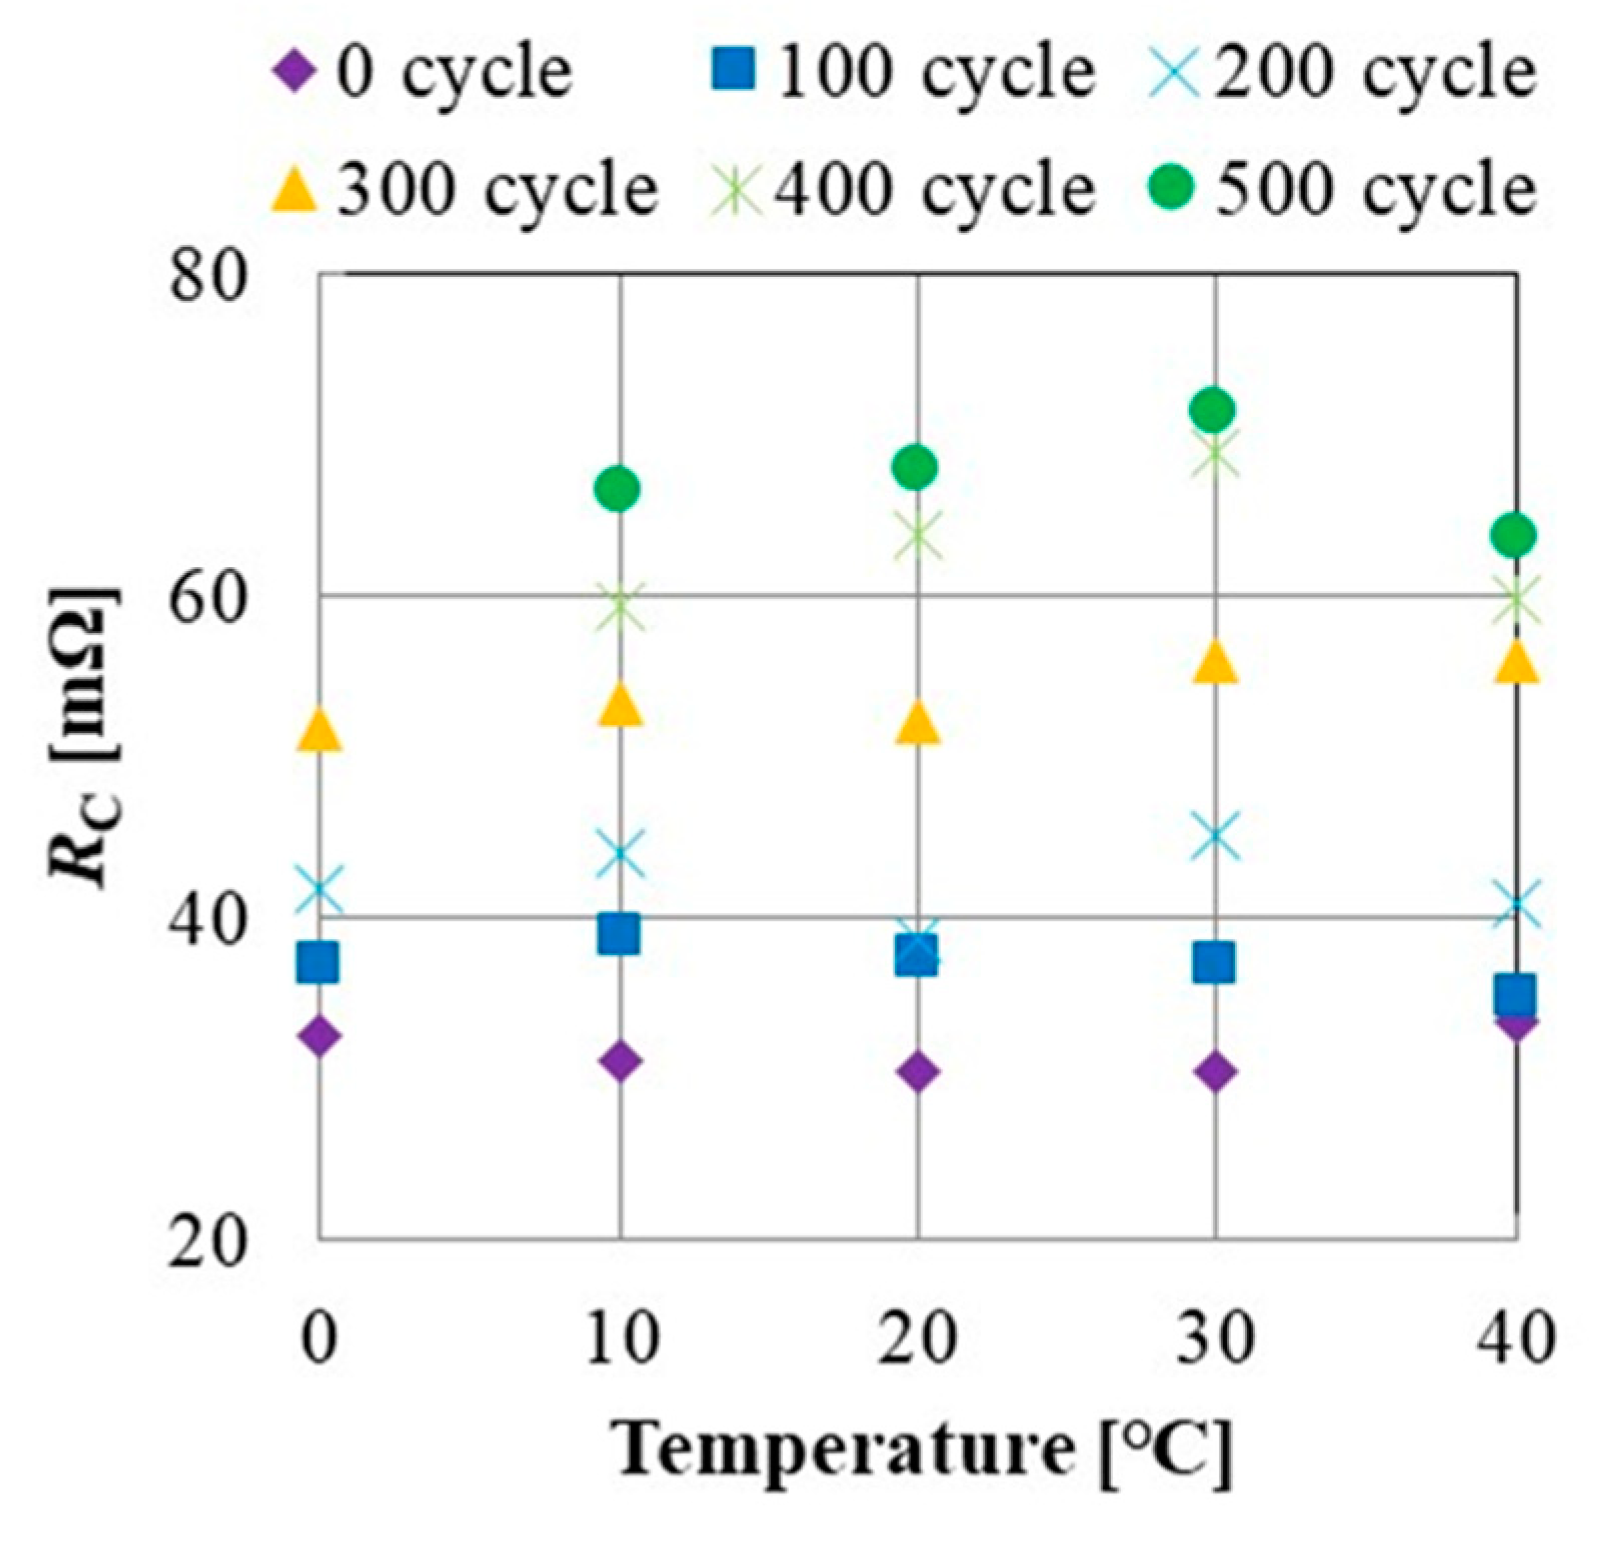
Figure 12 shows the corrected parameter RC, which shows the resistance RB1 at 25 °C. Because the parameter RC increases with the increase with the number of charging cycles, the deterioration of a lithium-ion battery can be diagnosed using the parameter RC at any temperature.
3.2. Automatic Diagnosis Circuit
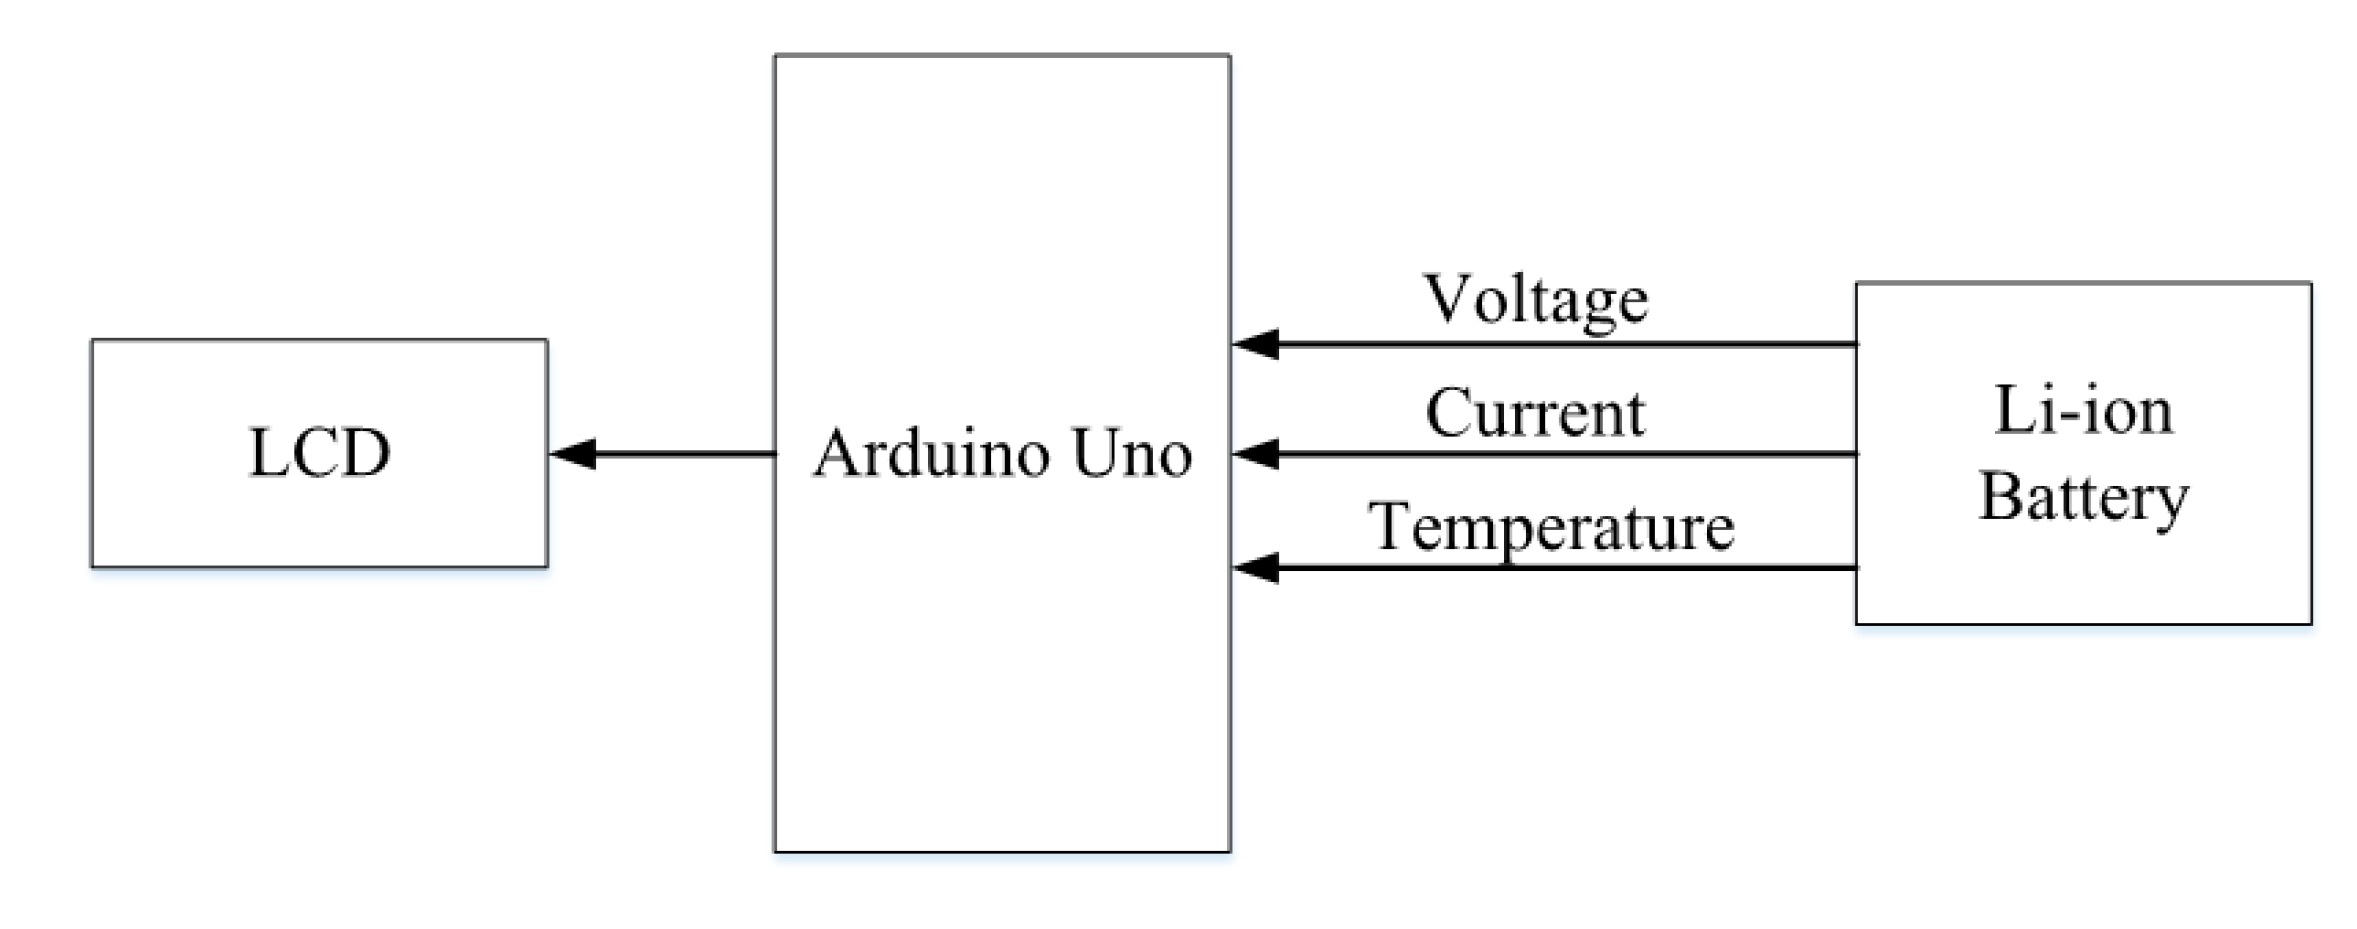
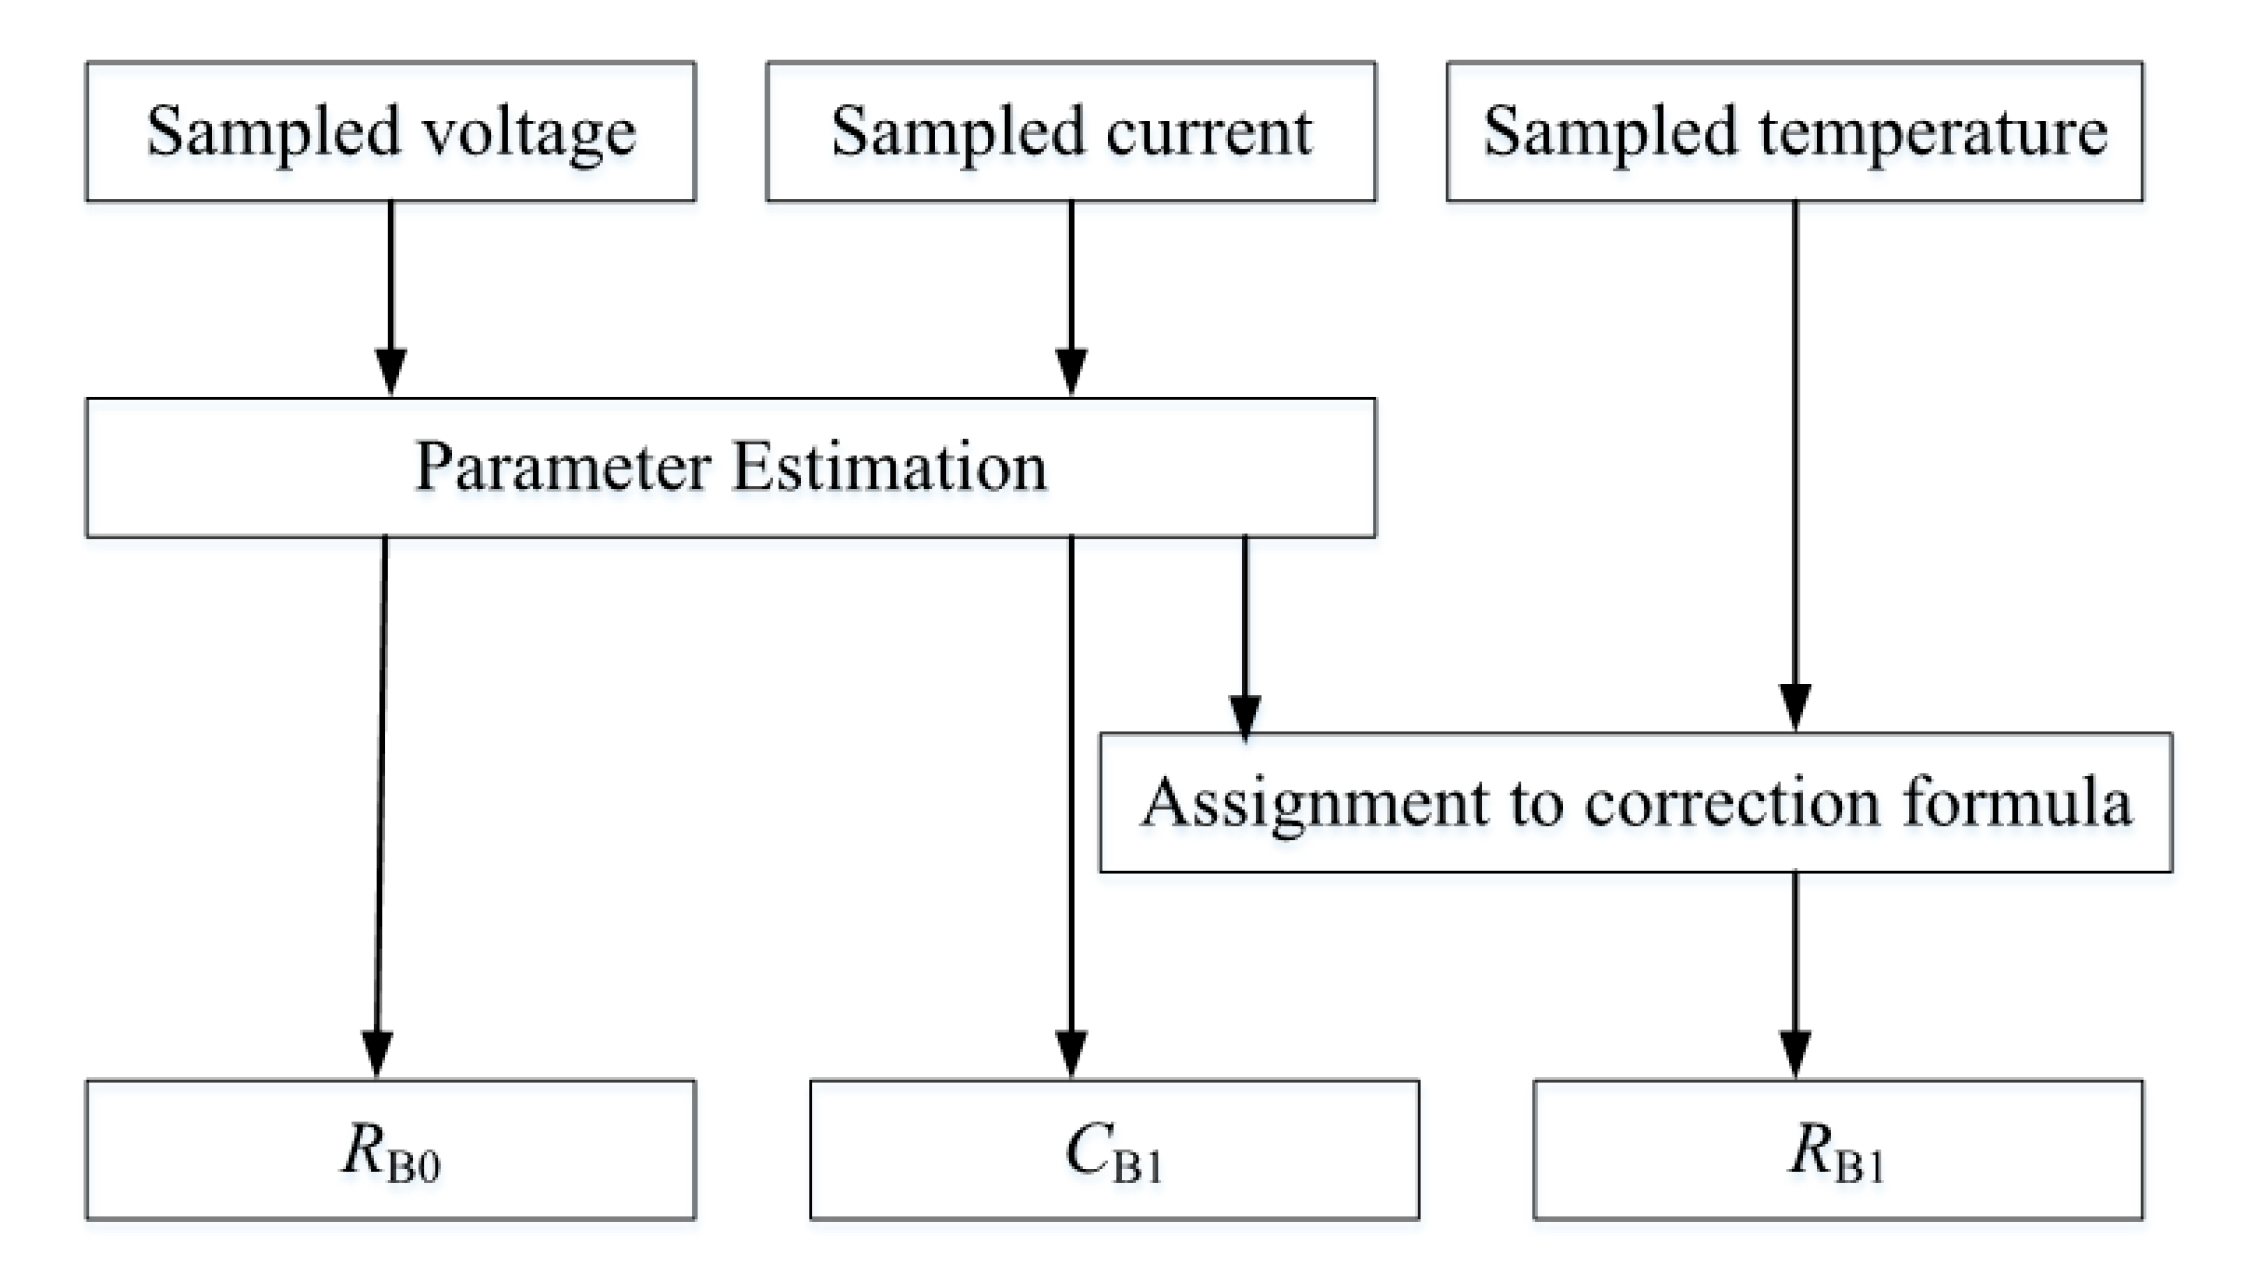
Figure 13 shows the block diagram of an automatic diagnosis circuit developed in this article. Arduino Uno is used for realizing the deterioration diagnosis method using a z-transformation proposed in this article. Figure 14 shows the flow chart of the battery-status estimation system.
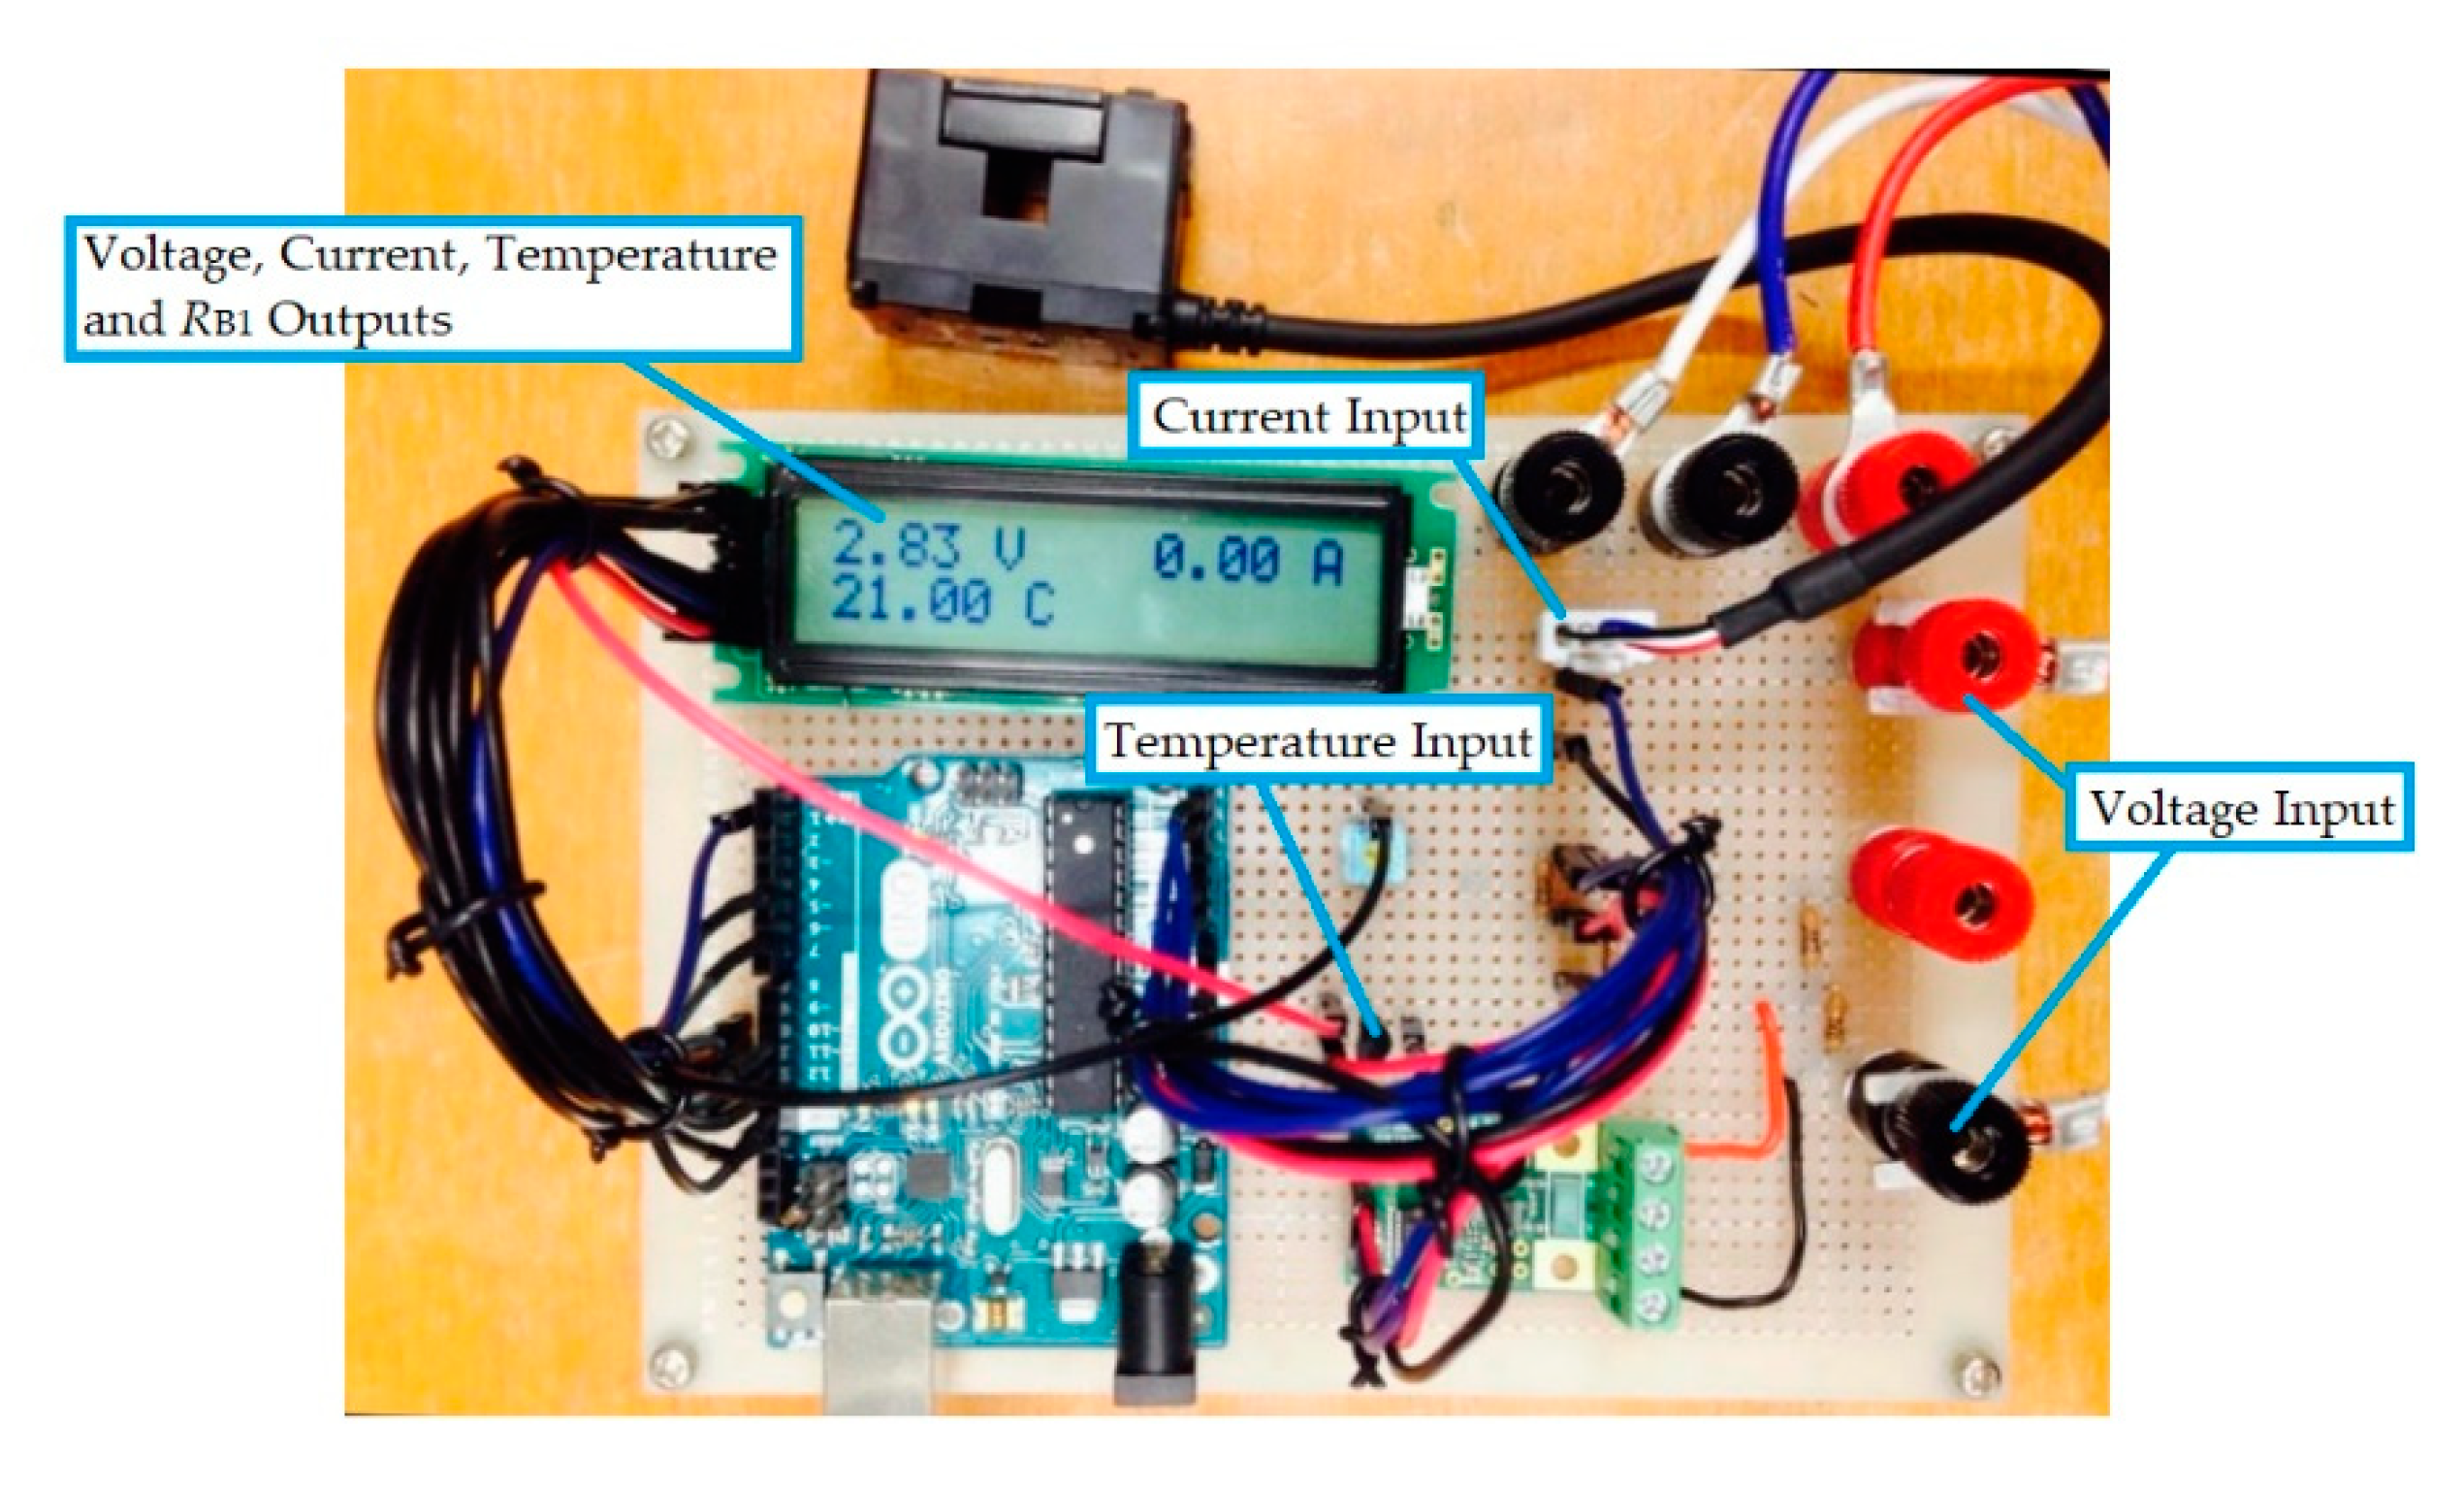
The deterioration diagnosis circuit developed in this article is shown in Figure 15. At first, the voltage, current, and ambient temperature of the battery during its operation are measured through the analog input pins of the Arduino Uno. Signal amplitudes are adjusted by operational amplifiers installed in the voltage, current, and ambient temperature measurement circuits. The parameters of the equivalent circuit of lithium-ion battery are estimated by calculating using Equation (8). Finally, the efficient parameter of degradation of battery RB1 corrected by the ambient temperature is displayed by the light-emitting diodes (LEDs). The voltage, current, and ambient temperature of the battery are displayed in the LCD during its operation.
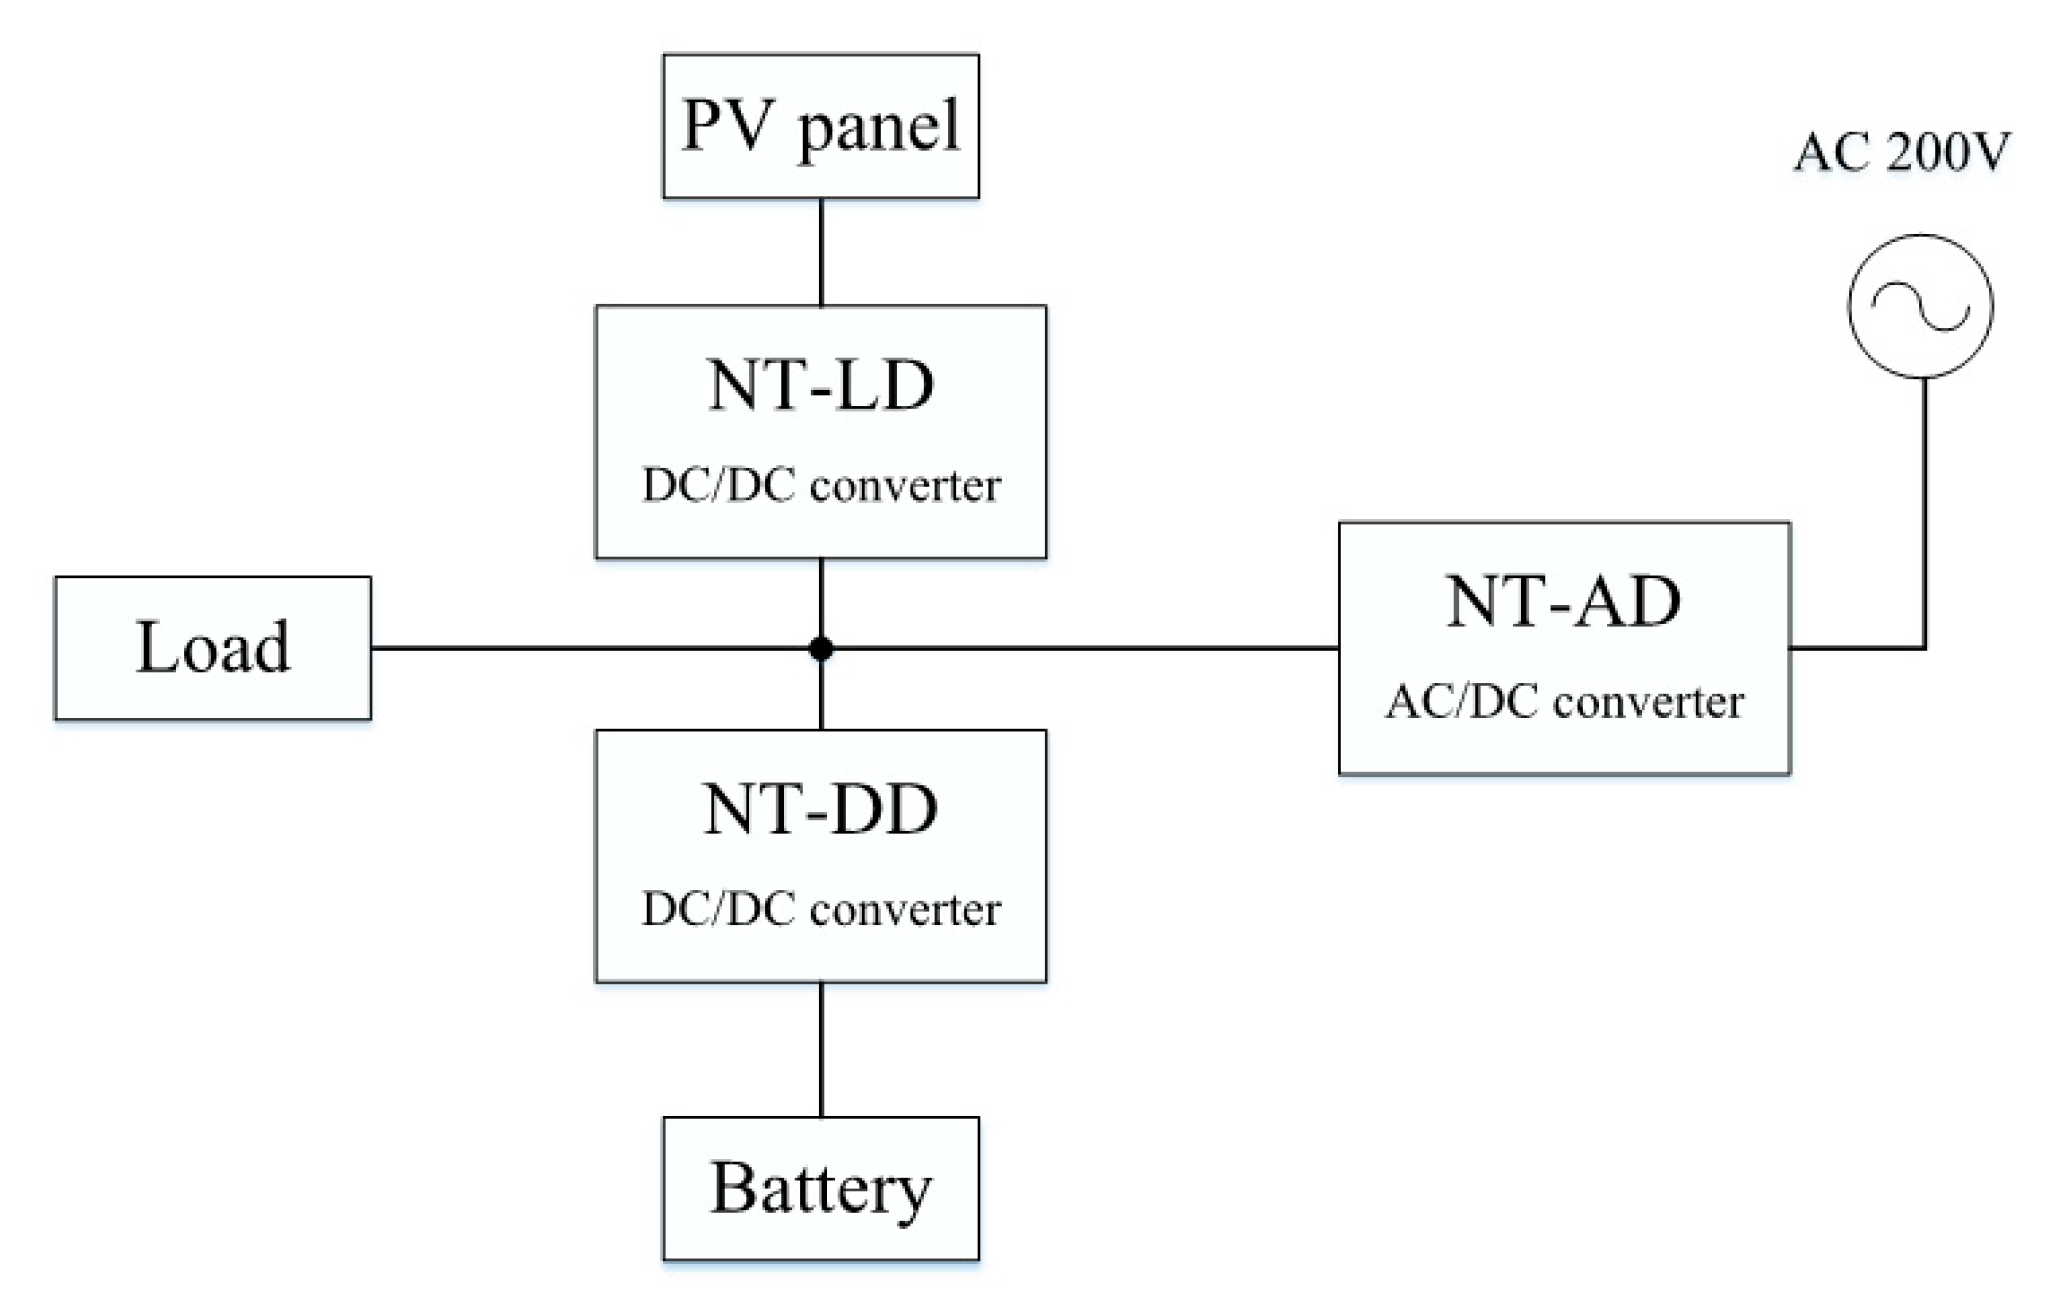
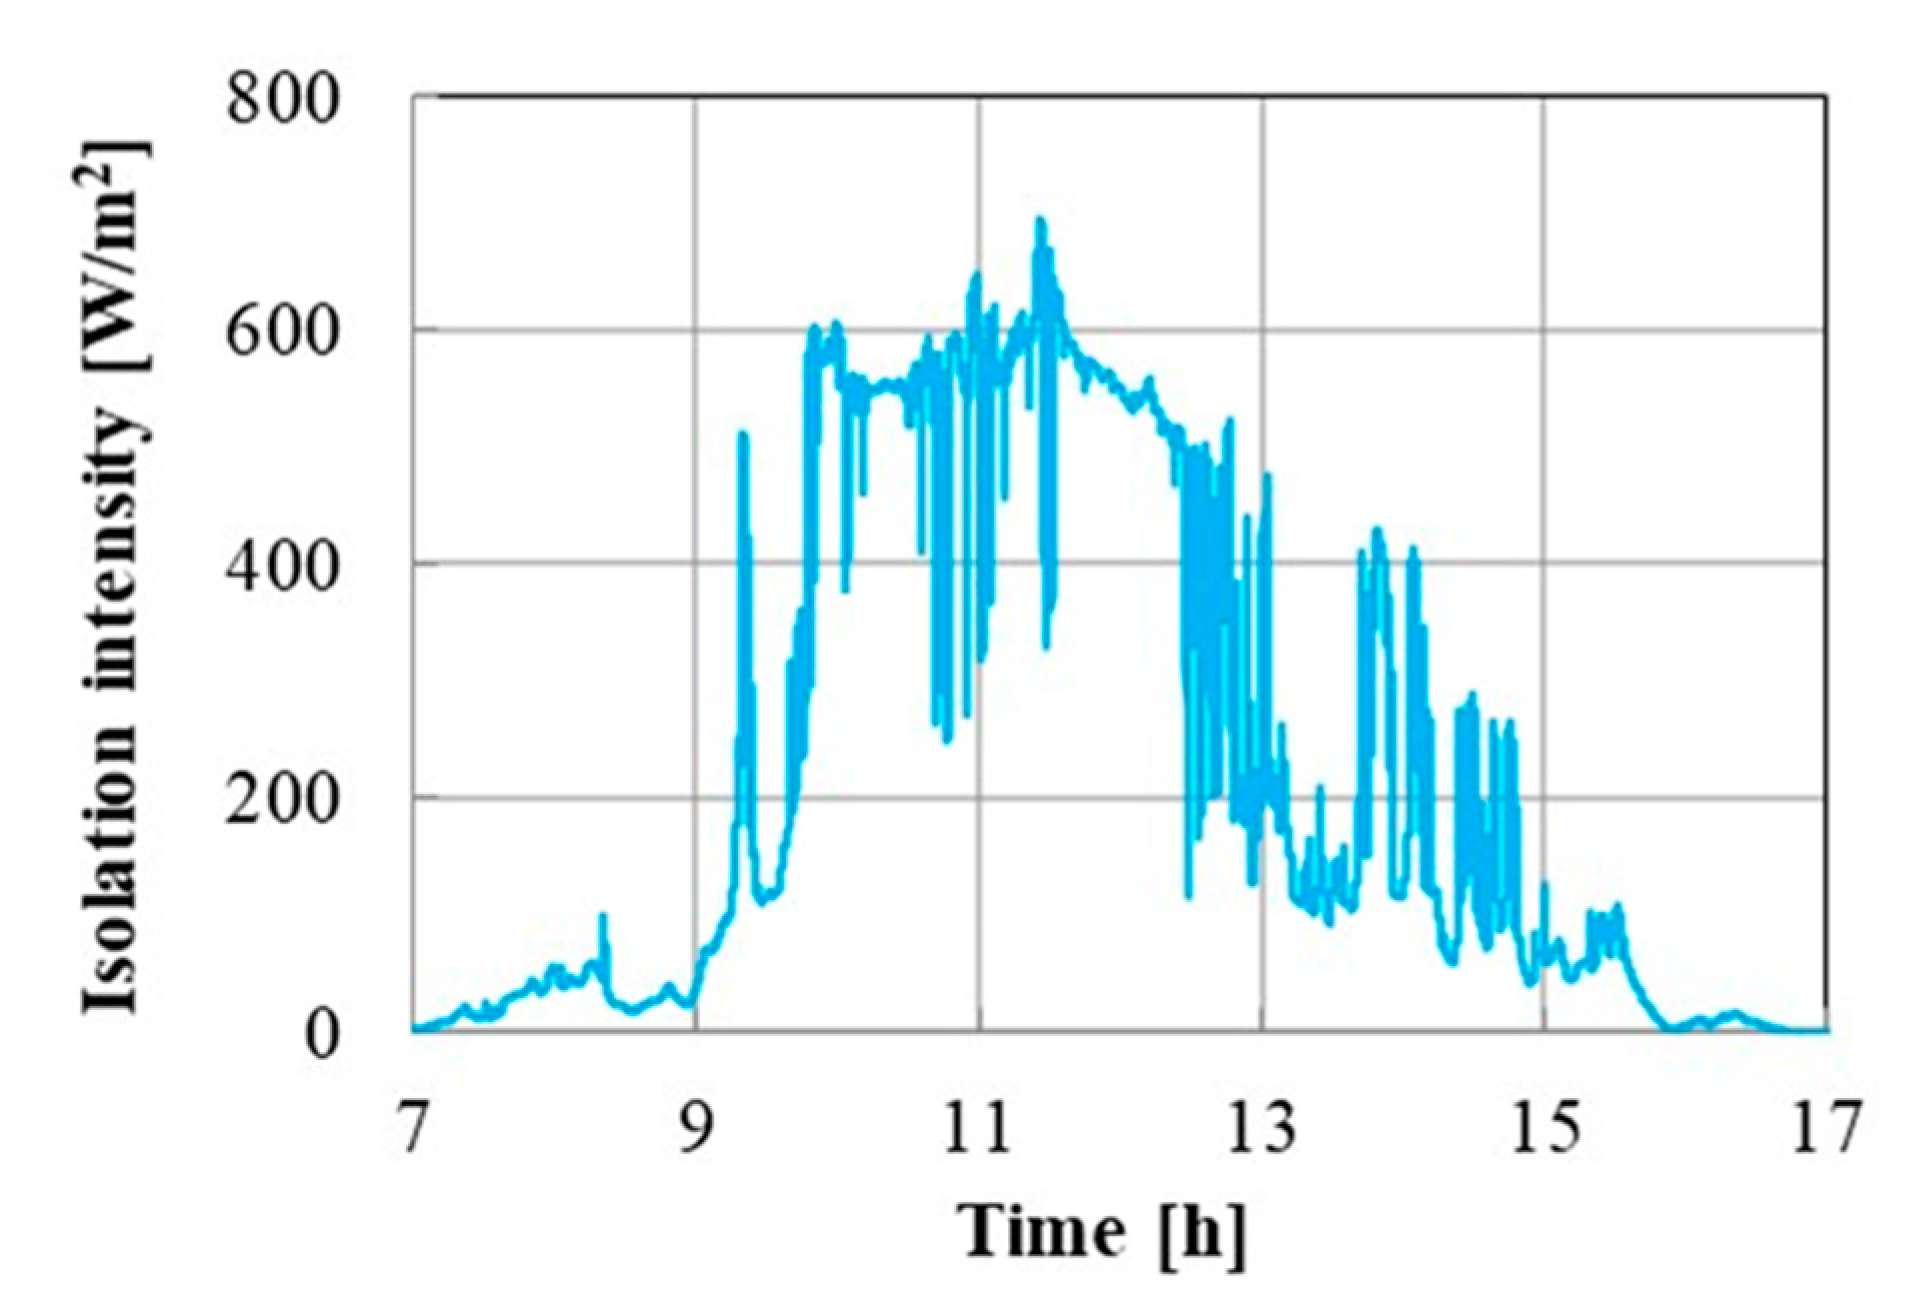
The results of the deterioration diagnosis of the lithium-ion battery using the diagnosis circuit are described below. Because of the difficulty in preparing deteriorated batteries used in a practical system, the effectiveness of the proposed method is confirmed as different circuit conditions provide identical results. A lithium-ion battery used for a home photovoltaic power generation system is chosen in these experiments. Double way power supply of the DC power distribution system manufactured by Keisoku Giken Co. shown in Figure 16 is used in this article. This system consists of 10 series of solar panels. (If the insolation is 1 kW/m2, the maximum output is 2.084 kW, the open-circuit voltage is 332 V, and the rated operating current is 7.84 A.) The battery used in this article is NT-BT1200B, whose capacity is 24 Ah, composed of 16 series and 8 parallel connected US26650FTC1 (3 Ah) cells.
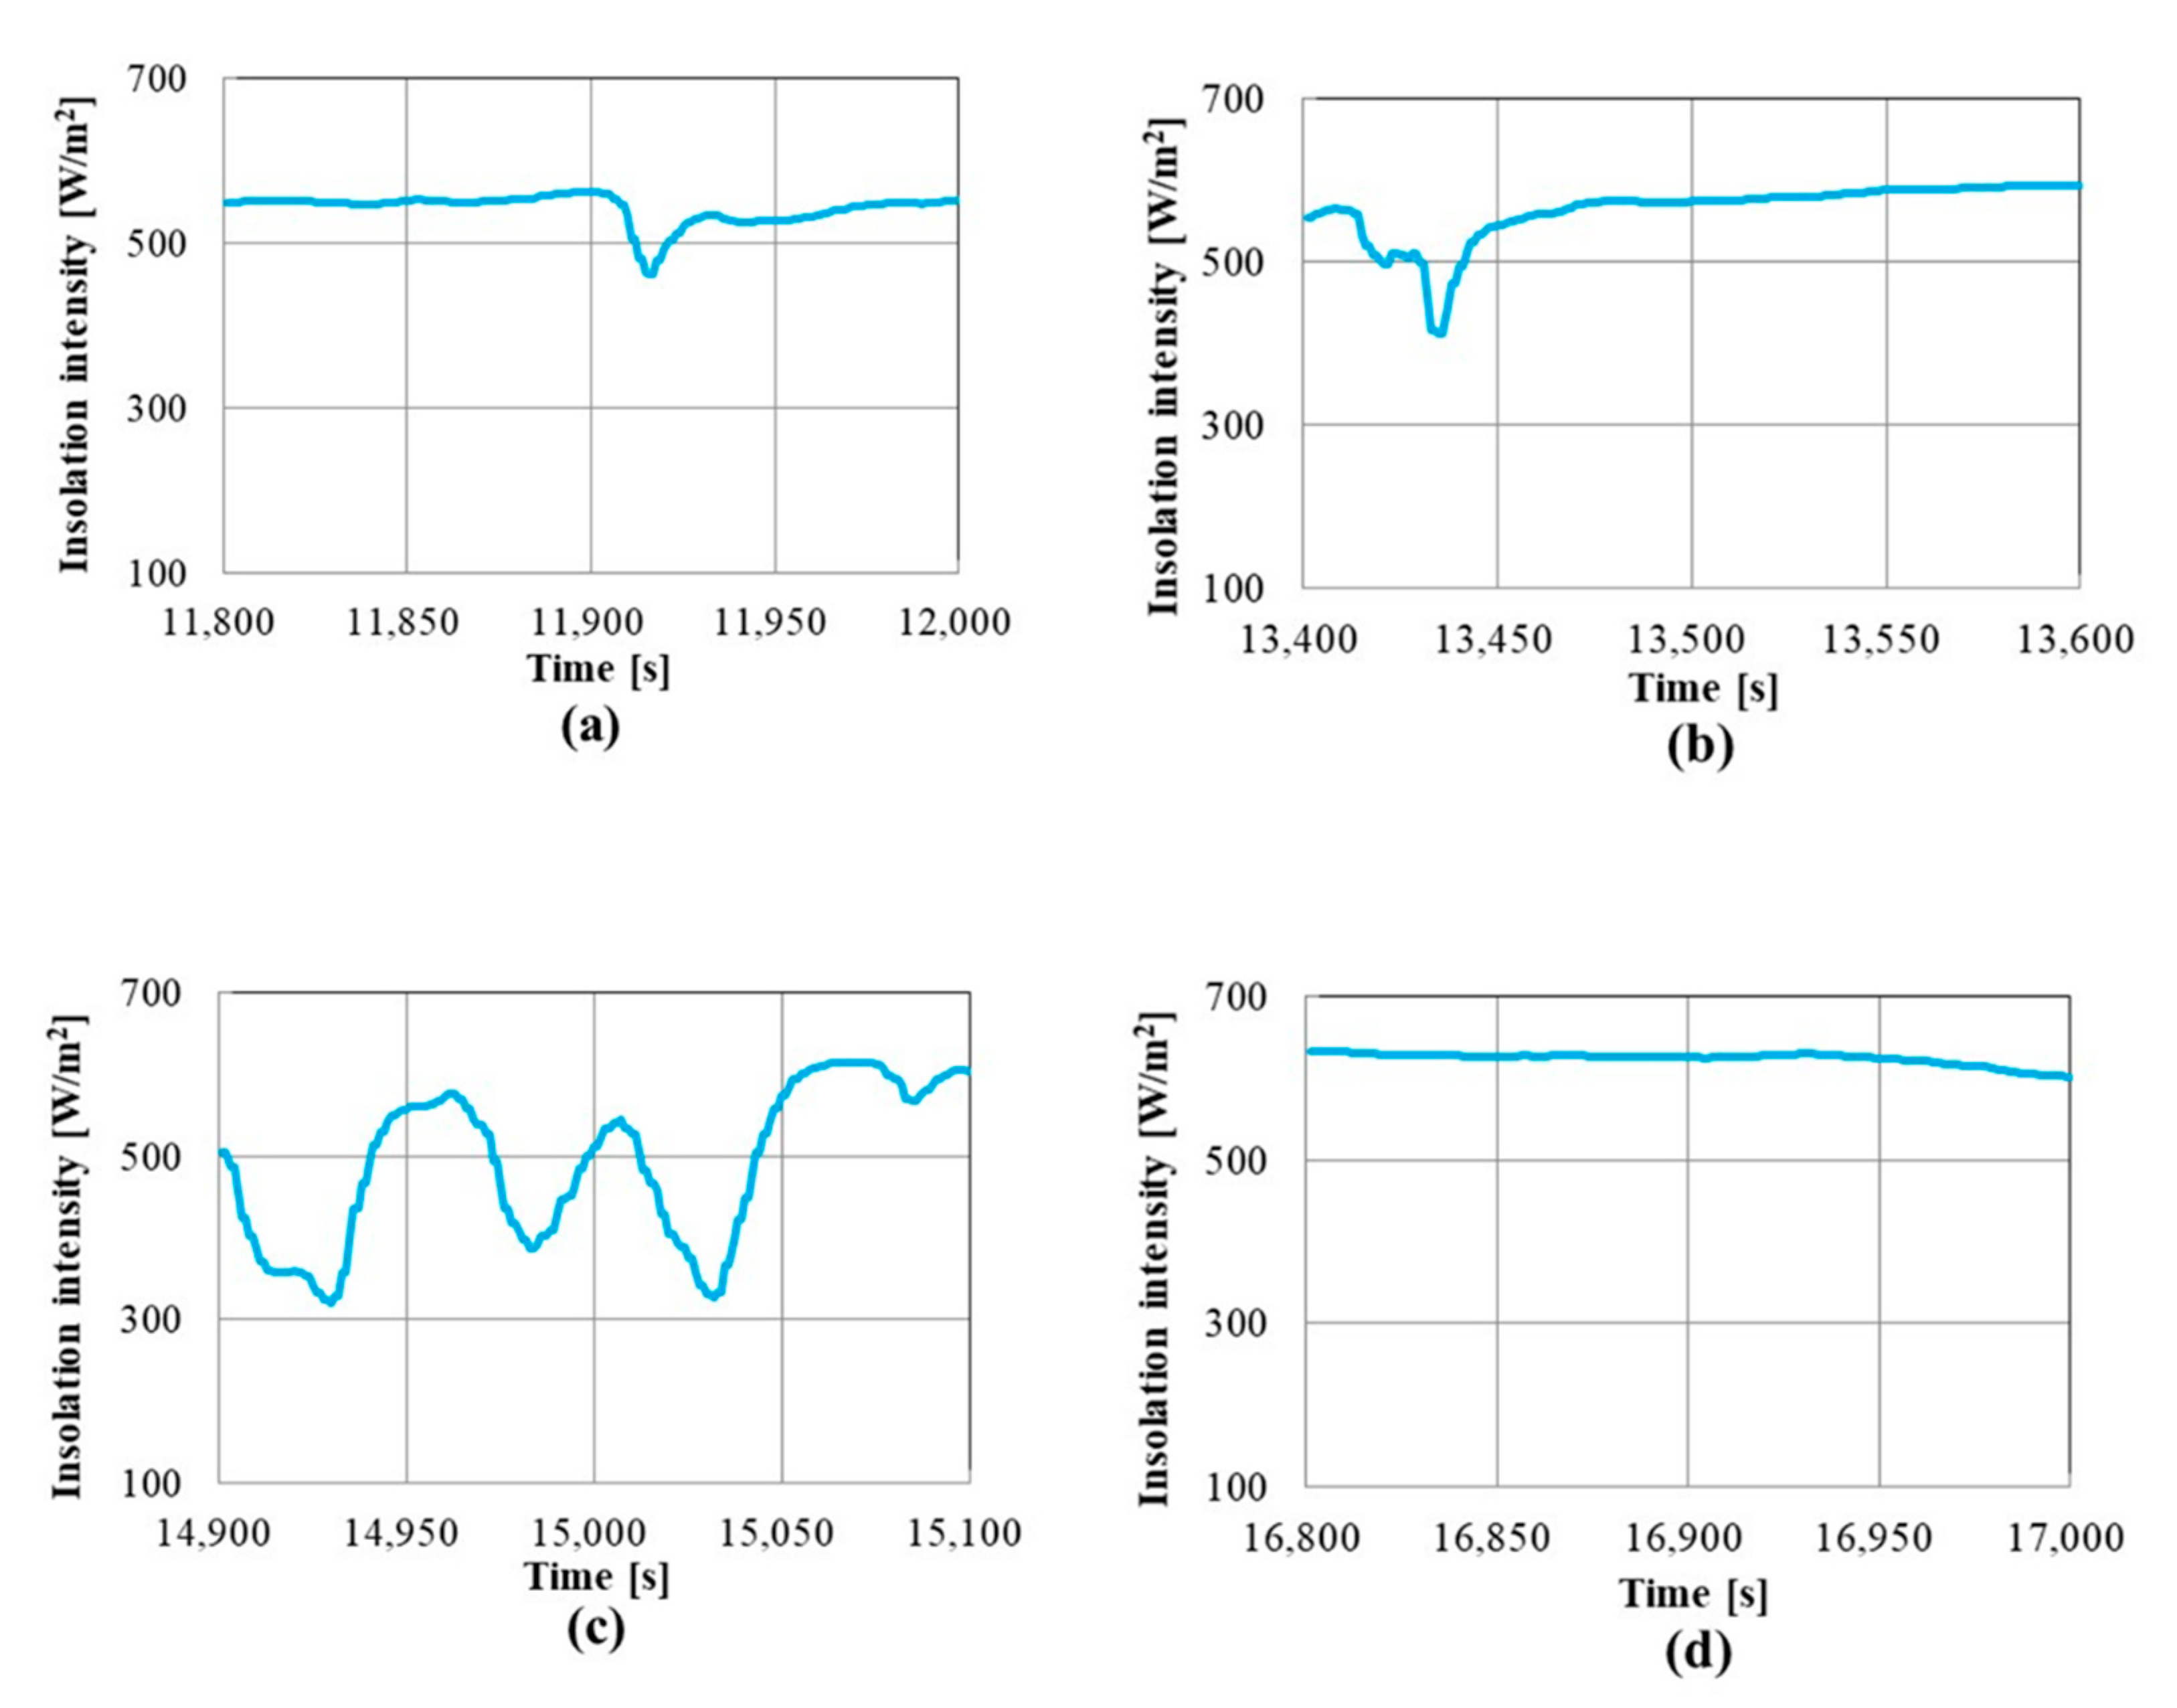
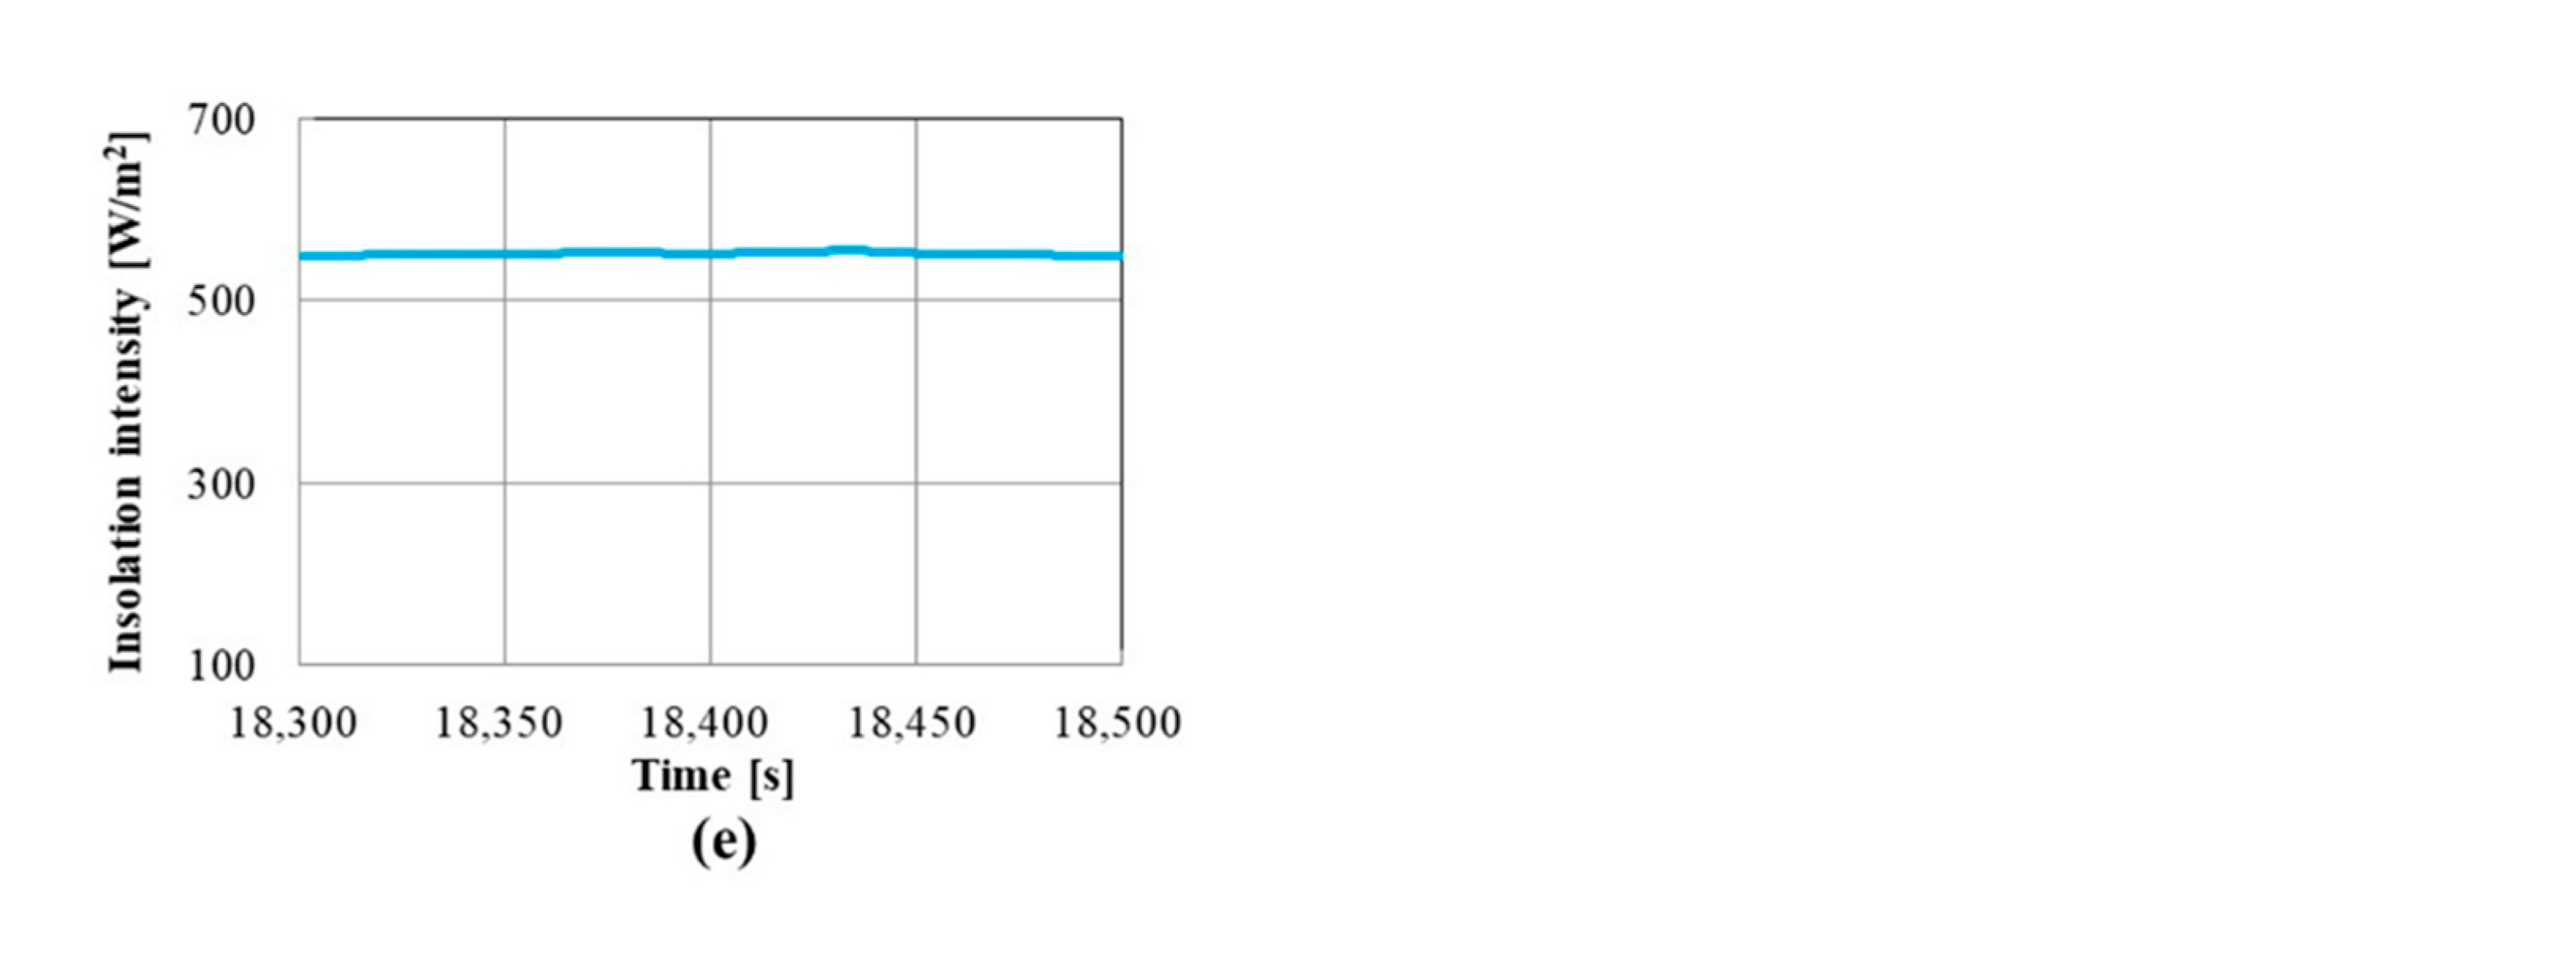
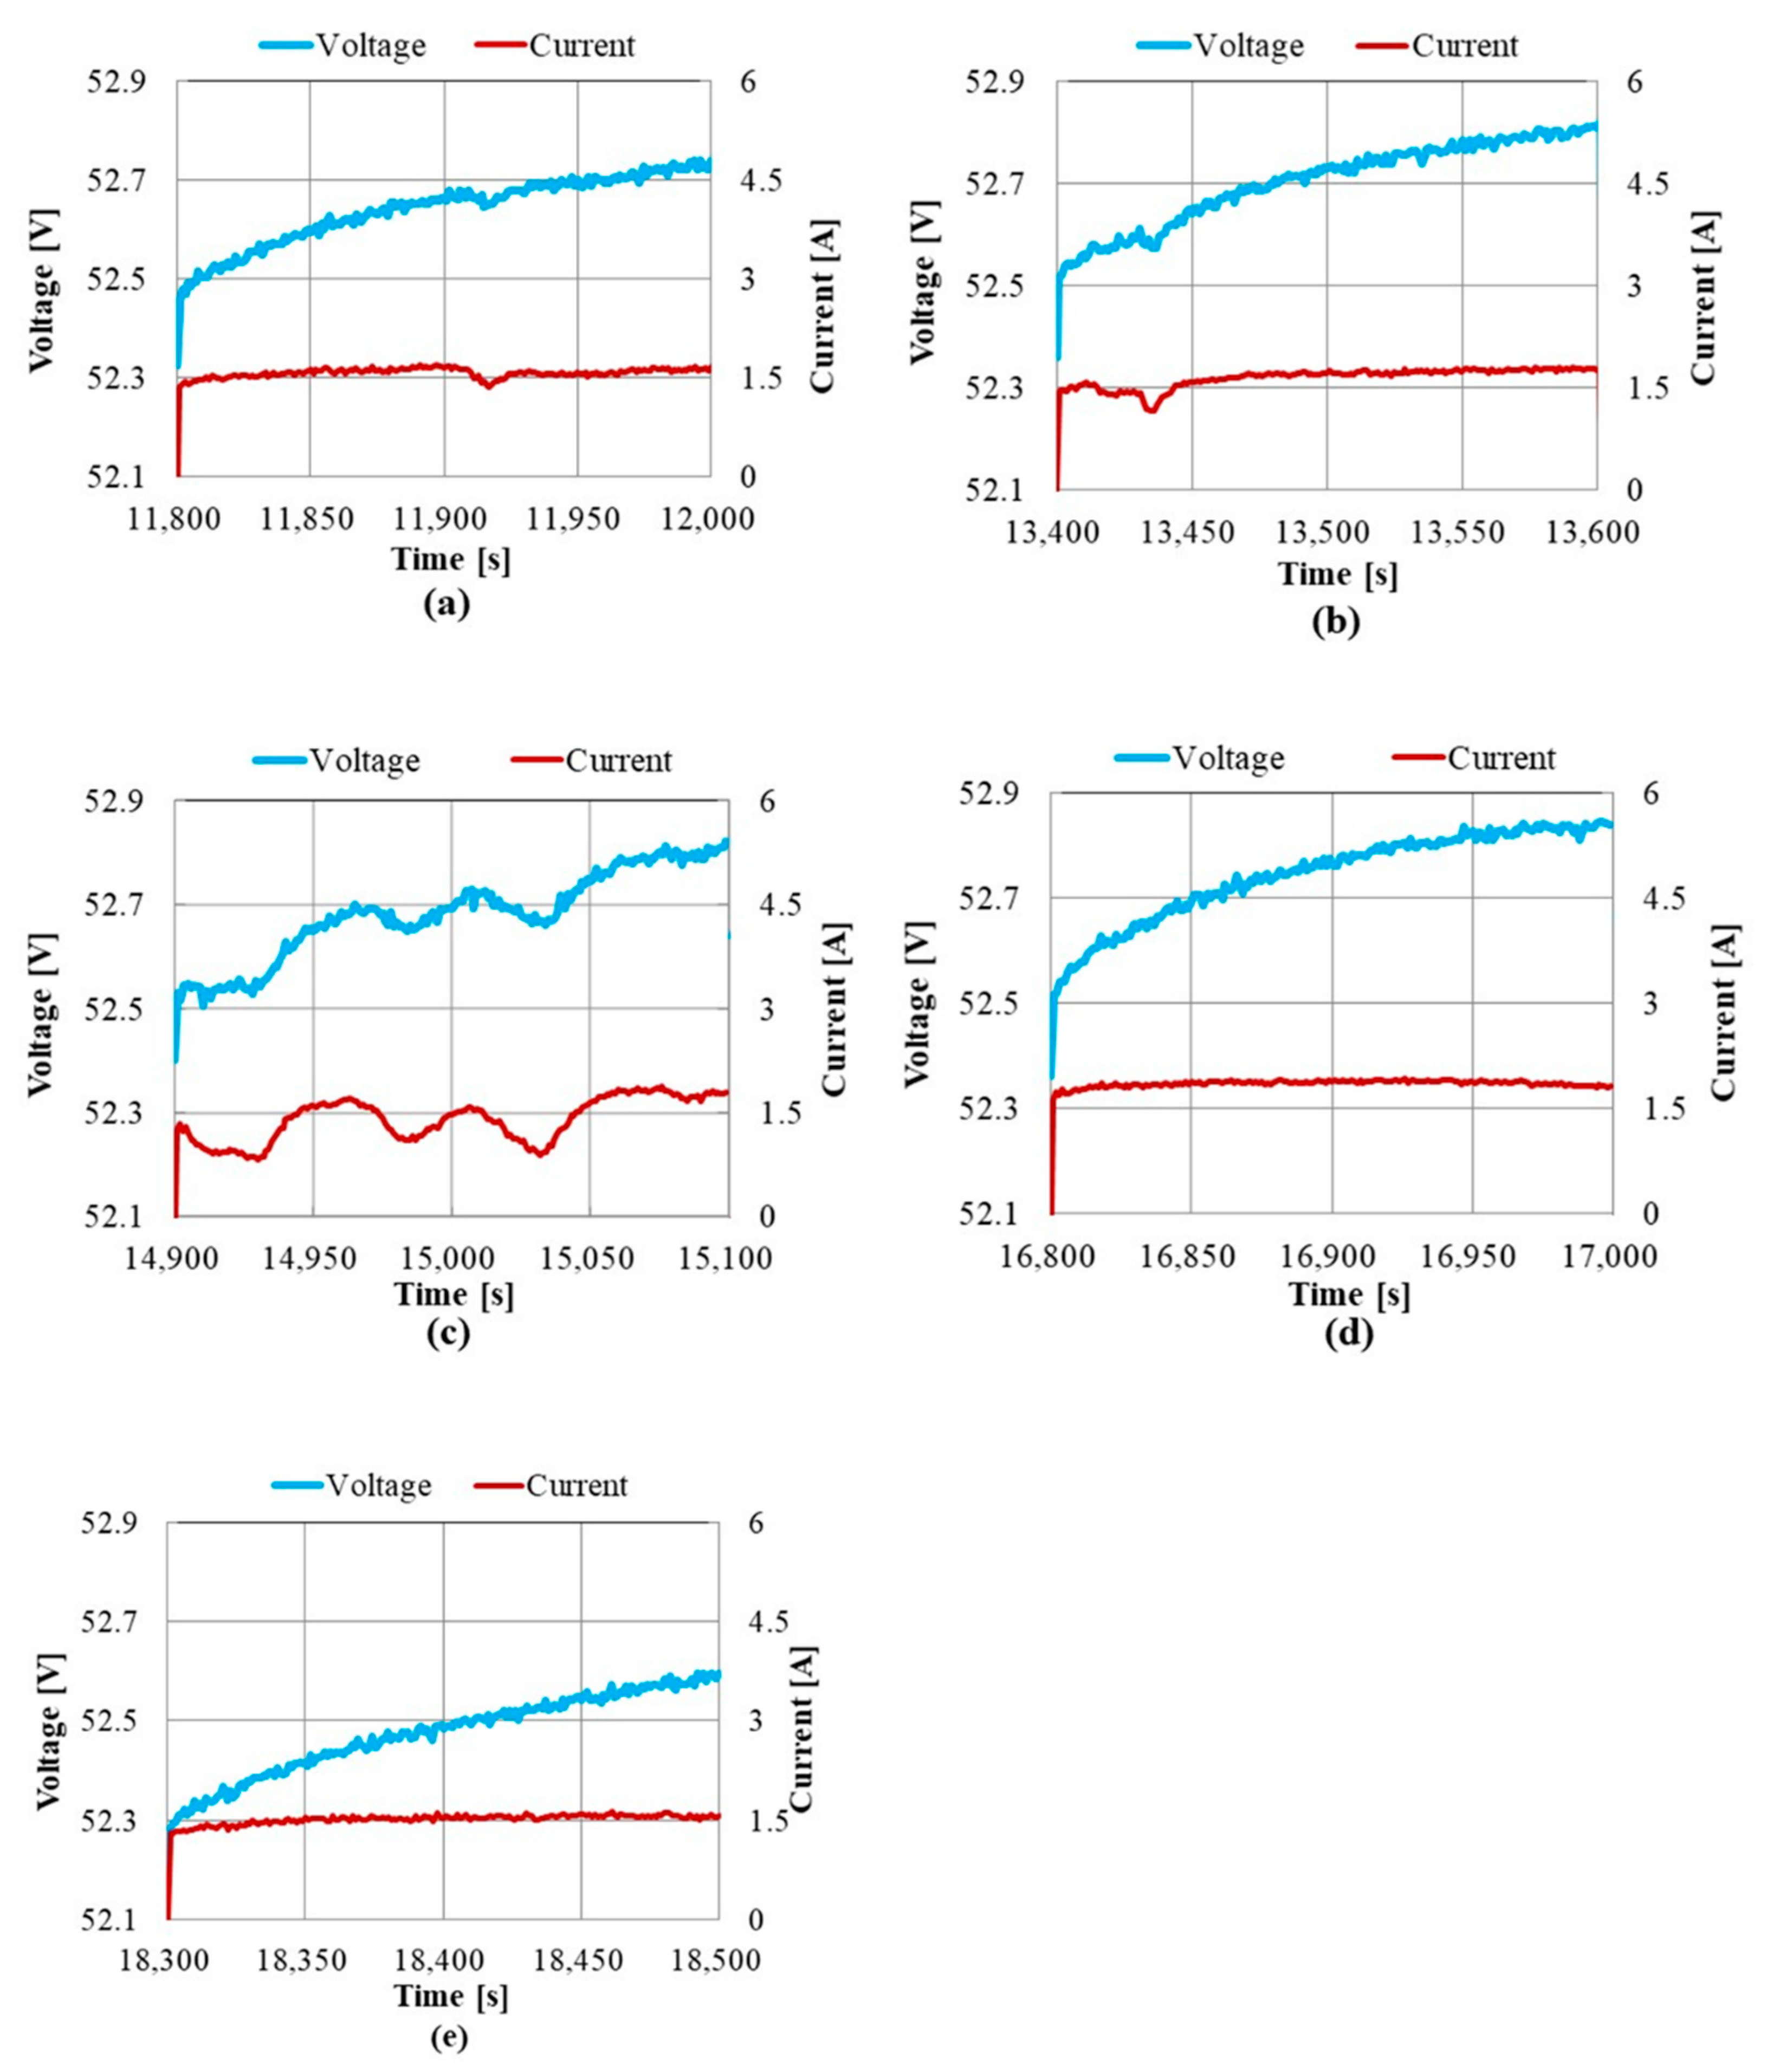
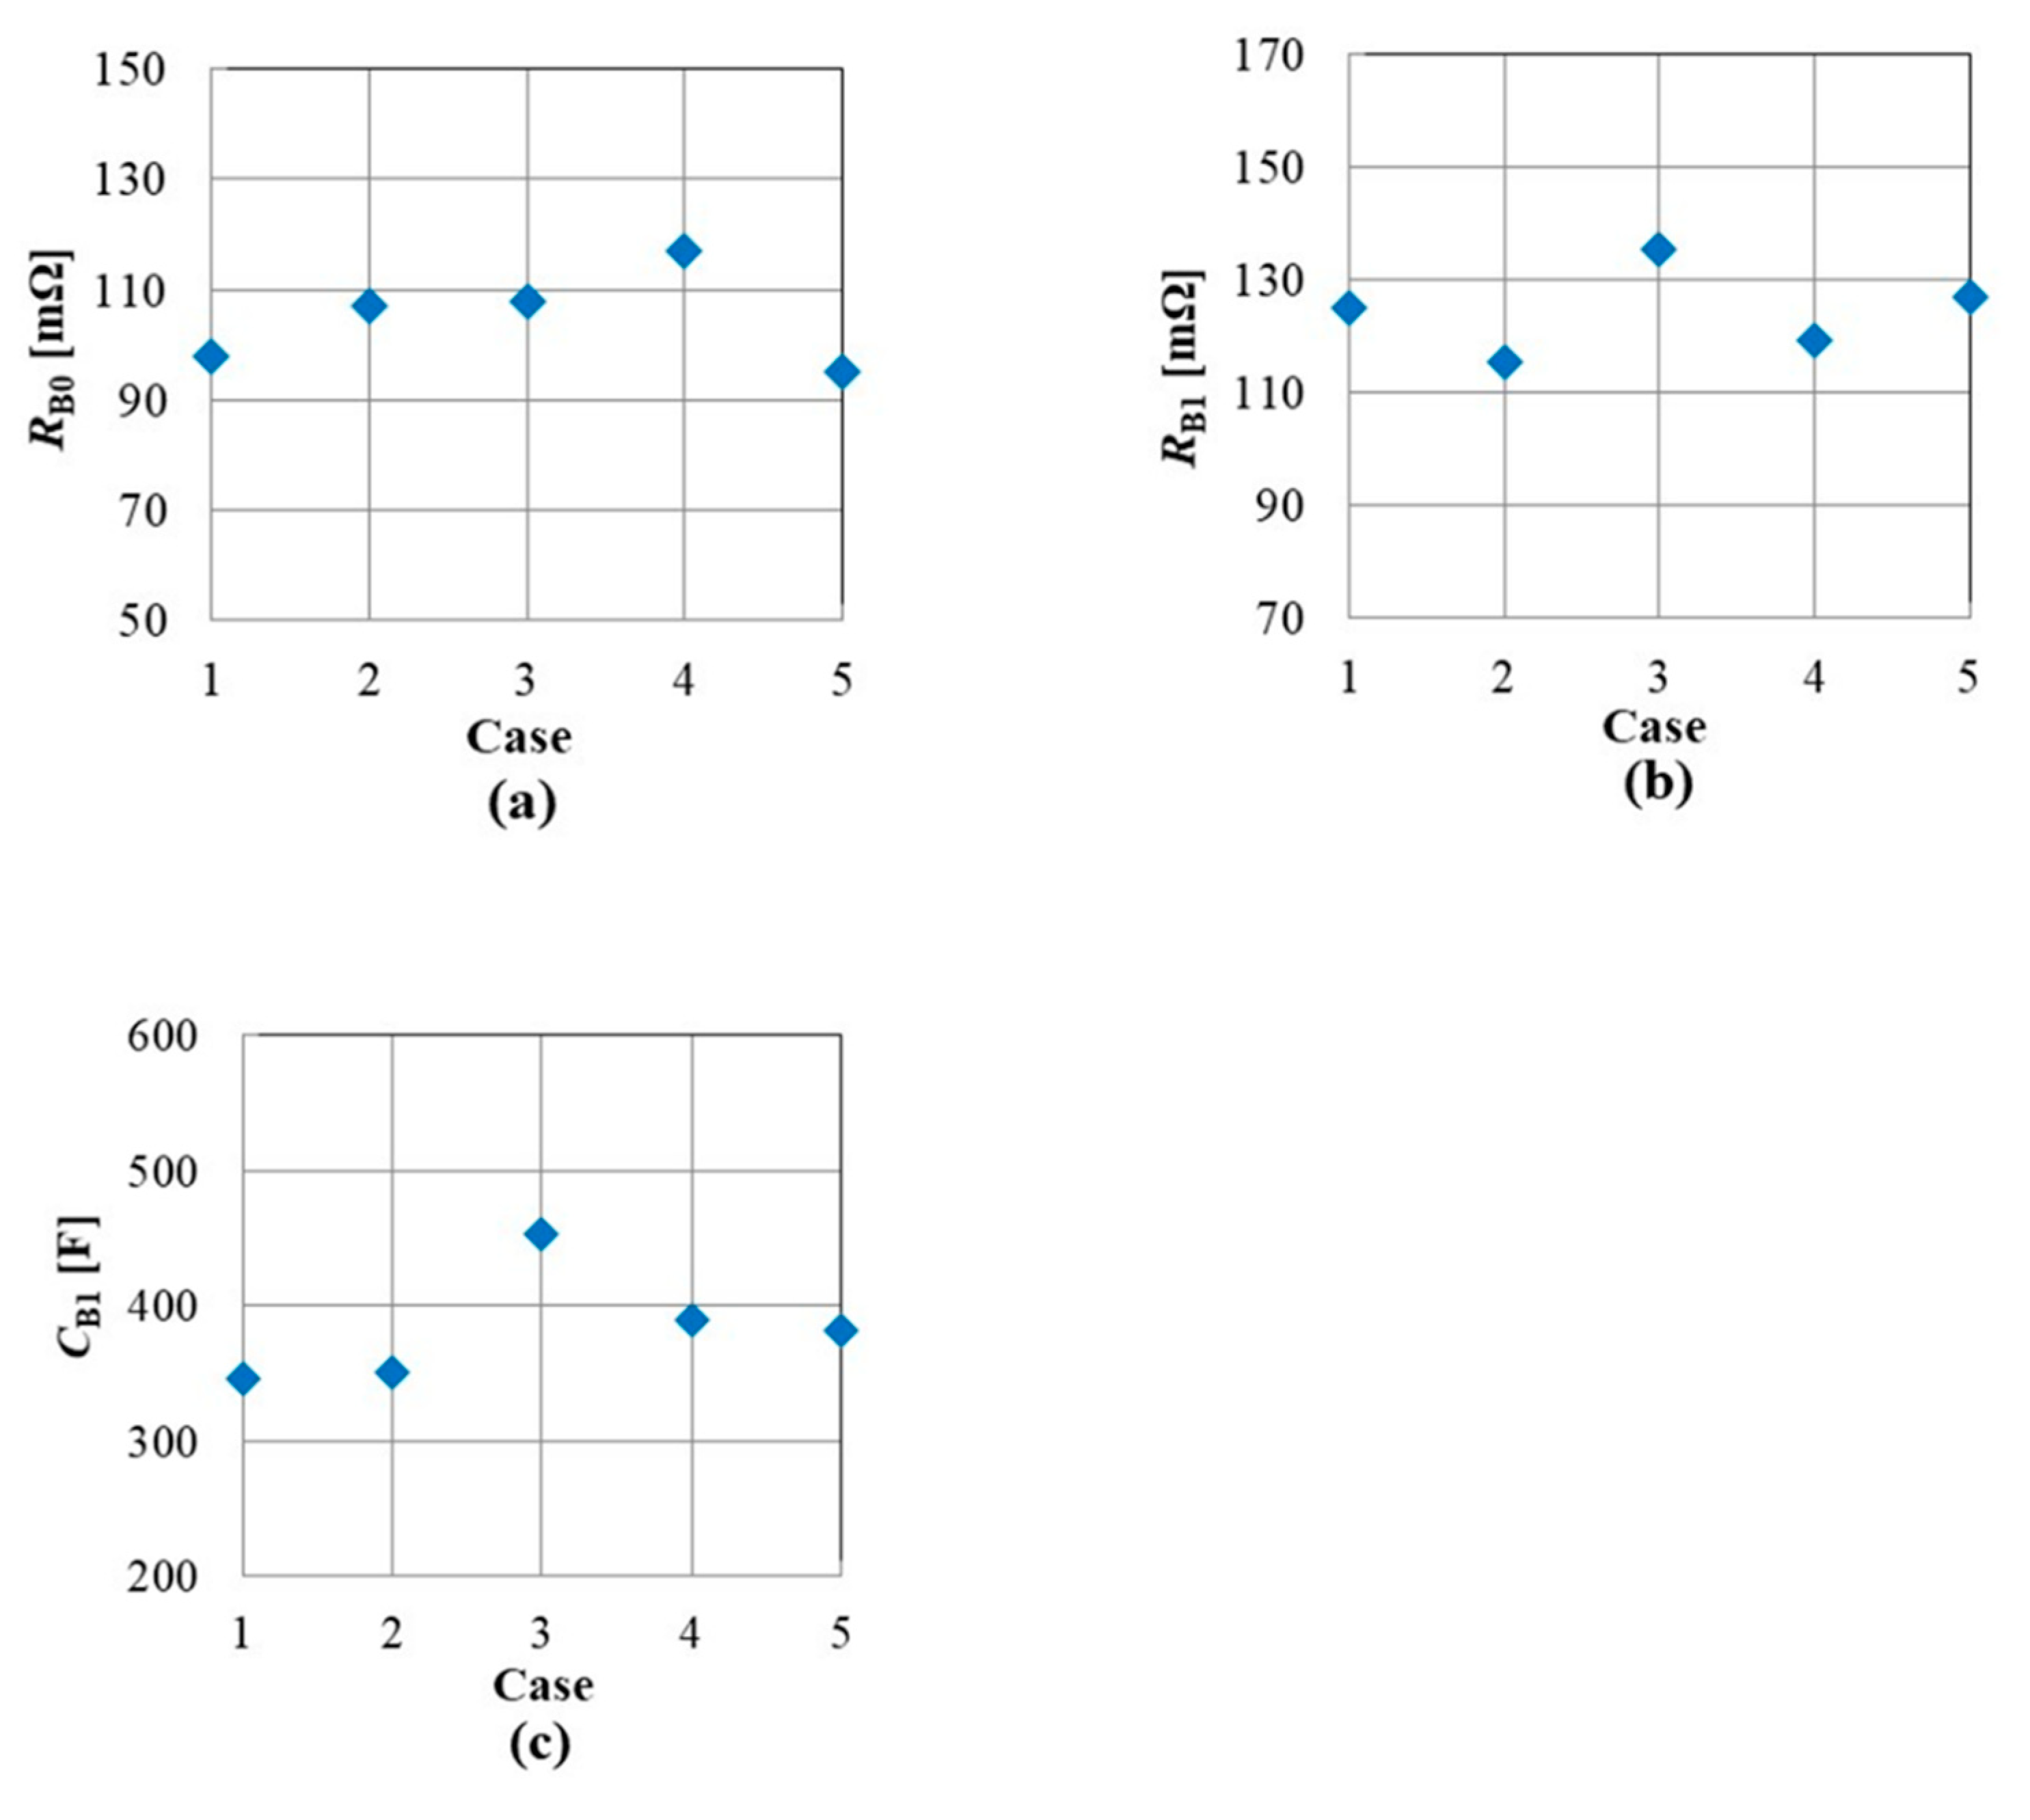
Figure 17 shows an insolation intensity obtained by the DC power distribution system on 8 December 2016. Figure 18a–e shows insolation intensity waveforms for 200 s, which are selected from Figure 17 for the investigation. The voltage and current waveforms of a lithium-ion battery in the DC distribution system are shown in Figure 19a–e. The ambient temperature is 21 °C, and the initial SOC is 50%. Figure 20a–c shows the equivalent circuit parameters calculated by the diagnosis circuit. The observation time used for the calculation is 50 s after the beginning of the charging. The effective parameters of deterioration diagnosis RB1 are calculated almost constant in all cases. The differences between the average of RB1 in Case 1–Case 5 and the result of each Case are less than 9%. The resistance difference of RB1 between the new battery and 500-cycle deteriorated battery in Figure 6a is 85.5%, which is far greater than the fluctuation of 9% around the average of RB1 in Case 1–Case 5 shown in Figure 20b. Therefore, the algorithm of estimation of the parameters is adequate, and the deterioration diagnosis of a lithium-ion battery can be realized using the diagnosis circuit developed in this article. The fluctuation determines the resolution of the proposed method. The resolution is enough to indicate the exchange of the batteries.
4. Conclusions
A deterioration diagnosis method for lithium-ion batteries based on circuit parameters of the equivalent circuit is proposed in this article. The parameters are obtained by applying a convolution technique to the voltage and current during its operation. In addition, a diagnosis circuit using a microcomputer is developed. A simple convolution calculation based on z-transformation enables the implementation in the diagnosis circuit.
Lithium-ion batteries can be expressed by an equivalent circuit composed of an internal voltage V0, a series resistance RB0, and a series-connected RB1CB1 parallel circuit, and the circuit expresses the battery’s transient characteristic. In other words, the parameters can be obtained from the transient characteristic. The equivalent circuit parameters RB0 and RB1 are increased by the deterioration. However, a series resistance RB0 depends on the contact resistance. Therefore, RB1 is the optimal parameter to detect the deterioration of lithium-ion batteries. The integration of the difference between a voltage across terminals and an internal voltage has close relation with the parameter RB1, which expresses the deterioration of the battery. However, the parameter RB1 depends on not only the deterioration but also the temperature and SOC of the battery. A diagnosis of lithium-ion battery can be realized by the temperature corrected parameter RB1 (Rc). The SOC correction is not practical due to the complicated characteristic. However, the weak point can be avoided by scheduling the deterioration diagnosis at specific SOCs because frequent inspection is not required for the battery diagnostic.
A deterioration diagnosis circuit installed the method based on z-transformation is developed in this article. This circuit measures transient battery voltage, current, and ambient temperature. After that, it derives the effective parameter RC for the battery diagnostic. This circuit can be moved to any microcomputer due to its simple algorithm. The accuracies of the algorithm and circuit are confirmed by a single cell and a power storage system for a 2 kW PV generation. The proposed system may apply to the battery, such as large-scale electric power systems using solar and wind during its operation. Therefore, the deterioration diagnosis method for lithium-ion batteries proposed in this article can realize safety operation for battery and reduction in the environmental load by indicating the appropriate replacing time of the battery.
Author Contributions
Conceptualization, N.Y. and N.N.; methodology, N.Y.; software, N.Y.; validation, N.Y.; formal analysis, N.Y.; investigation, N.Y.; resources, N.Y. and N.N.; data curation, N.Y.; writing—original draft preparation, N.Y.; writing—review and editing, N.N.; visualization, N.Y.; supervision, N.N. All authors have read and agreed to the published version of the manuscript.
Funding
This research received no external funding.
Institutional Review Board Statement
Not applicable.
Informed Consent Statement
Not applicable.
Data Availability Statement
Not applicable.
Conflicts of Interest
The authors declare no conflict of interest.
References
- Nagaoka, N. A numerical model of Lithium-ion battery for a life estimation. In Proceedings of the 48th International University Power Engineering Conference, Dublin, Ireland, 2–5 September 2013; Available online: https://0-ieeexplore-ieee-org.brum.beds.ac.uk/document/6714913 (accessed on 20 April 2016).
- Nagaoka, N. Large Scale Battery Storage System and its Lifetime Estimation. IEEJ Trans. Power Energy 2014, 134, 558–561. [Google Scholar] [CrossRef]
- Takano, T. Electric Power Storage Technology for Natural Energy Generations. IEEJ J. 2007, 127, 668–671. [Google Scholar] [CrossRef]
- Secondary Cells and Batteries Containing Alkaline or Other Non-Acid Electrolytes—Secondary Lithium Cells and Batteries for Portable Applications. Available online: http://www.zrlklab.com/uploads/image/202004/5ea79eb64c6fd.pdf (accessed on 15 May 2016).
- Hakozaki, H.; Sakamoto, T. Development of Battery Management System for Lithium-Ion Batteries. In FB Technical News; The FURUKAWA BATTERY CO., LTD: Kanagawa, Japan, 2014; Volume 70, pp. 39–42. Available online: https://corp.furukawadenchi.co.jp/ja/research/technews/main/010/teaserItems1/0/file/fbtn70_all.pdf (accessed on 28 May 2016).
- Ohde, T. Battery Technology for Quick Charging Plug-in Electric Boats. J. Jpn. Inst. Mar. Eng. 2012, 47, 23–27. [Google Scholar] [CrossRef] [Green Version]
- Hirai, T.; Ohnishi, A.; Nagaoka, N.; Mori, N.; Ametani, A.; Umeda, S. Automatic Equivalent-Circuit Estimation System for Lithium-Ion Battery. In Proceedings of the 43rd International University Power Engineering Conference, Padova, Italy, 1–4 September 2008; Available online: https://0-ieeexplore-ieee-org.brum.beds.ac.uk/document/4651678 (accessed on 4 June 2016).
- Osaka, T.; Momma, T.; Mukoyama, D.; Nara, H. Proposal of novel equivalent circuit for electrochemical impedance analysis of commercially available lithium ion battery. J. Power Sources 2012, 205, 483–486. Available online: https://www.researchgate.net/publication/257224351_Proposal_of_novel_equivalent_circuit_for_electrochemical_impedance_analysis_of_commercially_available_lithium_ion_battery (accessed on 8 June 2016). [CrossRef]
- Momma, T.; Matsuda, M.; Mukoyama, D.; Osaka, T. Ac impedance analysis of lithium ion battery under temperature control. J. Power Sources 2012, 216, 304–307. [Google Scholar] [CrossRef]
- Mukoyama, D.; Momma, T.; Nara, H.; Osaka, T. Electrochemical Impedance Analysis on Degradation of Commercially Available Lithium Ion Battery during Charge-Discharge Cycling. Chem. Lett. 2012, 41, 444. [Google Scholar] [CrossRef]
- Kumai, K.; Miyashiro, H.; Kobayashi, Y. Analysis technique for Estimating the Degradation Factors of Li-Ion Secondary Battery. In Report of Central Research Institute of Electric Power Industry; No. T73; Komae Research Laboratory: Tokyo, Japan, 2003; Available online: https://criepi.denken.or.jp/hokokusho/pb/reportDetail?reportNoUkCode=T73 (accessed on 9 July 2016).
- Yoshioka, N.; Narita, S.; Yamada, S.; Nagaoka, N. A Deterioration Diagnosis Method for Li-ion Battery Using a Transient Characteristic and Development of an Automatic Diagnosis Circuit. In Proceedings of the 50th International Universities Power Engineering Conference (UPEC), Stoke-on-Trent, UK, 1–4 September 2015; Available online: https://0-ieeexplore-ieee-org.brum.beds.ac.uk/document/7339946 (accessed on 18 April 2016).
Figure 1.
Transient voltage response against pulse current charging.

Figure 2.
Equivalent circuit of lithium-ion battery.

Figure 3.
Voltage and current waveforms at charging.

Figure 4.
Integrated voltage waveform.

Figure 5.
Effect of charging cycle. (a) Voltage. (b) Integrated voltage.

Figure 6.
Deterioration dependence of equivalent circuit parameters. (a) RB0 and RB1. (b) CB1 and τ1.
Figure 6.
Deterioration dependence of equivalent circuit parameters. (a) RB0 and RB1. (b) CB1 and τ1.

Figure 7.
Effect of SOC. (a) Voltage. (b) Integrated voltage.

Figure 8.
SOC dependence of equivalent circuit parameters. (a) RB0. (b) RB1. (c) CB1. (d) τ1.

Figure 9.
Effect of temperature. (a) Voltage. (b) Integrated voltage.

Figure 10.
Temperature dependence of equivalent circuit parameters. (a) RB0. (b) RB1. (c) CB1. (d) τ1.
Figure 10.
Temperature dependence of equivalent circuit parameters. (a) RB0. (b) RB1. (c) CB1. (d) τ1.

Figure 11.
Effect of charging cycle on integrated voltage.

Figure 12.
Effect of charging cycle on corrected RC.

Figure 13.
Configuration of the diagnosis system.

Figure 14.
Flow chart of battery-status estimation system.

Figure 15.
Deterioration diagnosis circuit.

Figure 16.
DC distribution system used for testing the developed circuit.

Figure 17.
Insolation intensity on 8 December 2016.

Figure 18.
Insolation intensities of the selected regions. (a) Case 1. (b) Case 2. (c) Case 3. (d) Case 4. (e) Case 5.
Figure 18.
Insolation intensities of the selected regions. (a) Case 1. (b) Case 2. (c) Case 3. (d) Case 4. (e) Case 5.


Figure 19.
Battery voltage and current waveforms of the DC distribution system. (a) Case 1. (b) Case 2. (c) Case 3. (d) Case 4. (e) Case 5.
Figure 19.
Battery voltage and current waveforms of the DC distribution system. (a) Case 1. (b) Case 2. (c) Case 3. (d) Case 4. (e) Case 5.

Figure 20.
Equivalent circuit parameters obtained by the diagnosis circuit. (a) RB0. (b) RB1. (c) CB1.
Figure 20.
Equivalent circuit parameters obtained by the diagnosis circuit. (a) RB0. (b) RB1. (c) CB1.


Table 1.
Coefficient of approximate function shown in Equation (13).
| Cycle | RC′ | TC |
|---|---|---|
| 0 | 48.6 | 58.8 |
| 100 | 59.3 | 52.6 |
| 200 | 63.4 | 55.5 |
| 300 | 80.1 | 62.5 |
| 400 | 95.3 | 58.8 |
| 500 | 106.8 | 55.5 |
Publisher’s Note: MDPI stays neutral with regard to jurisdictional claims in published maps and institutional affiliations. |
© 2021 by the authors. Licensee MDPI, Basel, Switzerland. This article is an open access article distributed under the terms and conditions of the Creative Commons Attribution (CC BY) license (https://creativecommons.org/licenses/by/4.0/).
Share and Cite
MDPI and ACS Style
Yoshioka, N.; Nagaoka, N. A Deterioration Diagnosis Circuit of a Lithium-Ion Battery Using Microcomputer Implementing Z-Transform Convolution. Energies 2021, 14, 6868. https://0-doi-org.brum.beds.ac.uk/10.3390/en14216868
AMA Style
Yoshioka N, Nagaoka N. A Deterioration Diagnosis Circuit of a Lithium-Ion Battery Using Microcomputer Implementing Z-Transform Convolution. Energies. 2021; 14(21):6868. https://0-doi-org.brum.beds.ac.uk/10.3390/en14216868
Chicago/Turabian StyleYoshioka, Naoyuki, and Naoto Nagaoka. 2021. "A Deterioration Diagnosis Circuit of a Lithium-Ion Battery Using Microcomputer Implementing Z-Transform Convolution" Energies 14, no. 21: 6868. https://0-doi-org.brum.beds.ac.uk/10.3390/en14216868
Note that from the first issue of 2016, this journal uses article numbers instead of page numbers. See further details here.