Next Article in Journal
Evaluating Consumers’ Adoption of Renewable Energy
Next Article in Special Issue
Model Reference Tracking Control Solutions for a Visual Servo System Based on a Virtual State from Unknown Dynamics
Previous Article in Journal
Carbon Footprint-Energy Detection for Desalination Small Plant Adaptation Response
Previous Article in Special Issue
A Method for Assessing the Stability of Digital Automatic Control Systems (ACS) with Discrete Elements. Hypothesis and Simulation Results
 
 
Comment published on 23 February 2022, see Energies 2022, 15(5), 1640.
Article

Structural and Parametric Optimization of S-CO2 Thermal Power Plants with a Pulverized Coal-Fired Boiler Operating in Russia

Department of Innovative Technologies of High-Tech Industries, National Research University “Moscow Power Engineering Institute”, 111250 Moscow, Russia
*
Author to whom correspondence should be addressed.
Submission received: 31 August 2021 / Revised: 22 October 2021 / Accepted: 26 October 2021 / Published: 1 November 2021
(This article belongs to the Special Issue Intelligent Control for Future Systems)

Abstract

:
The Rankine cycle is widely used for electricity production. Significant weight and size characteristics of the power equipment working on superheated steam are the main disadvantages of such power plants. The transition to supercritical carbon dioxide (S-CO2) working fluid is a promising way to achieve a significant reduction in equipment metal consumption and to increase energy efficiency. This paper presents the results of thermodynamic analysis of S-CO2 thermal power plants (TPPs) utilizing the heat of combustion products of an energy boiler. It was found that the net efficiency of the developed S-CO2 TPP with a pulverized coal-fired boiler reached 49.2% at an initial temperature of 780 °C, which was 2% higher compared to the efficiency level of steam turbine power plants (STPPs) at a similar turbine inlet temperature.

1. Introduction

Currently, the main sources of power are organic fuels. The Rankine cycle mainly transforms fuel’s chemical energy into heat and electricity. In Russia, the most popular power production block is the supercritical facility based on the K-300-240 turbine and the TGMP-344A boiler. The facility operates at an initial temperature and pressure of 540 °C and 24 MPa, respectively. The turbine inlet mass flow is 247.2 kg/s, and its nominal power is 300 MW. The electric efficiency of this type of facility depends upon climatic conditions and fuel types and may be from 39% to 41% [1].
This rather low efficiency and high metal consumption of STPPs are their main shortcomings. The large fleet of K-300-240 turbines is due to the fact of their high expansion ratio of a few thousand. The turbine has large dimensions of 21.3 m in length and an approximately 4 m low-pressure turbine height which are due to the remarkable steam volumetric flow in the last stages. As a result, the turbine’s total mass is 690 t. Efficiency improvement and reduction of metal consumption are important methods for the stable development of organic fuel-burning power facilities.
The most obvious method for improvement of power facility thermal efficiency is an increase in the cycle’s initial thermodynamic parameters. Now, there are power facilities with ultra-supercritical steam parameters of over 35 MPa pressure and temperatures up to 760 °C being developed. Evaluations of these facilities’ efficiency show values of 46.6% [2]. This improvement in efficiency may be balanced by an increase in the facility price which is caused by the use of expensive heat-resistant materials, such as Inconel 617, for the main high-temperature parts of the boiler. The price of a nickel–chromium heat-resistant alloy is above 250,000 USD/t [1]. An improvement in facility efficiency of 5–6% is remarkable, but the high-temperature equipment construction is more than twice as expensive. Thus, this direction in power production improvement will only be valid at very high fuel prices.
Power plant efficiency may grow by 2–3% via utilization of low potential heat sources. It is possible to add the Rankine cycle to the steam turbine or combined cycle facilities for a deeper utilization of the exit gas heat or reduction in the cold source temperature [3,4,5]. Most of the low-temperature cycle heat carriers like freon are not as available and not as chemically stable as water. In addition, these agents are toxic. The cycle addition needs larger capital investments. The above-mentioned factors are the main reasons for the limited introduction of this technology.
A promising method to increase TPP fuel efficiency and reduce investment is the transition to supercritical carbon dioxide working fluid. The use of S-CO2 Brayton cycles leads to low auxiliary power consumption, small power generation equipment sizes, and moderate initial temperatures [6,7,8]. Since the middle of the past century, this research field has been actively developed [9,10]. This area of development has caught the interest of the world’s scientists largely because of carbon dioxide’s competitive advantages compared to other working fluids.
In particular, supercritical carbon dioxide has a high density and low viscosity, which leads to the low specific work of compressors and compact turbomachinery sizes [11,12,13]. A low carbon dioxide critical temperature equal to 30.98 °C is near to the ambient atmosphere, which allows the temperature of heat removed from the cycle without the working fluid condensing [14,15]. In addition, carbon dioxide is less aggressive than water and shows its corrosion activity only in the presence of moisture content in the working fluid or with a water film on a metal surface. The price of carbon dioxide and water working fluids are compatible.
Long-term thermodynamic studies of S-CO2 power facilities resulted in the development of the five cycles presented in Figure 1. The simplest S-CO2 cycle is a closed Brayton cycle with the heat utilization of the exhaust gases (Figure 1a). It contains a compressor (C), regenerator (RH), reactor (R), turbine (T), electricity generator (G), and pre-cooler (PC). The thermal efficiency of the simplest S-CO2 Brayton cycle with regeneration is approximately 40% at an initial temperature of 550 °C and initial pressure of 25 MPa [16].
The S-CO2 Brayton cycle with reheating is presented in Figure 1b. Here, the turbine consists of a high-pressure turbine (HPT), and a low-pressure turbine (LPT). The reheated working fluid is followed by an increase in the mean integral temperature of the heat supply to the cycle of up to 41.5% [12,17].
The S-CO2 Brayton cycle with intermediate cooling is presented in Figure 1c. The introduction of intermediate cooling allows for an increase in the cycle efficiency of 0.8% due to a reduction in the compressor’s energy consumption [16].
The S-CO2 Brayton cycle with partial cooling is presented in Figure 1d. It differs from the simplest S-CO2 Brayton cycle (Figure 1a) by application of a condenser (CR), pump (P), recompressing compressor (RC), high-temperature regenerator (HTR), and low-temperature regenerator (LTR). The use of partial cooling together with two sections of regenerators improves the regeneration system’s efficiency and leads to a cycle efficiency increase of up to 44.8% [18].
The S-CO2 Brayton cycle with recompression is presented in Figure 1e. It is a simplified modification of the partial cooling cycle presented in Figure 1d. The recompression S-CO2 Brayton cycle differs from the partial cooling cycle by the absence of a pump and condenser. The problem of the low efficiency of the heat utilization of the exhaust gases related to the remarkable difference in the regenerators’ hot and cold flows’ specific heat capacity is solved in this scheme. The splitting of the compressed flow and usage of the low-temperature regenerator and the high-temperature regenerator provides deeper utilization of the exhaust gases’ heat and allows for the achievement of an efficiency of up to 46% [19,20,21].
The recompression Brayton cycle is one of the most efficient cycles for supercritical carbon dioxide. Therefore, it is reasonable to particularly use this cycle for the development of maximal heat efficient S-CO2 power plants with pulverized coal-fired boilers.
The research in [22] was devoted to the investigation of S-CO2 power plants with pulverized coal-fired boilers. It investigated the supercritical CO2 Brayton cycle with recompression, compressor inter-cooling, and high-temperature heat exchanger bypass (Figure 2).
The facility flow chart consists of a carbon dioxide turbine (T), a high-temperature heat exchanger (HTR), an intermediate heat exchanger (ITR), a low-temperature heat exchanger (LTR), main compressor compartments (MC1 and MC2), recompression compressor (RC), pre-cooler (PC), and intercooler (IC). The specific feature of this chart is the high-temperature heat exchanger bypass that reduces the exit gas temperature upstream of the air heater down to 340–360 °C [20,23].
The cycle analysis showed that at an initial temperature and pressure of 650 °C and 29.6 MPa, the facility’s net efficiency may reach 49.5%, which is 3% higher than a traditional steam facility. It is worth mentioning that the facility’s parameters were optimized at the initial temperatures of 600–700 °C. Parametric optimization of a facility with a pulverized coal boiler was carried out at a temperature range from the currently available 540 °C to the ultra-supercritical 780 °C. This paper was devoted to the solution of this topical problem.

2. Research Object

The choice of the carbon dioxide facility flow chart depends upon the working fluid’s initial temperature. This paper presents an analysis of the flow cart versions shown in Figure 3 at the boiler exit temperatures 540, 650, and 780 °C. Figure 3a shows a heat flow chart of a carbon dioxide recompression cycle in a pulverized coal boiler at 540 °C. Figure 3b shows a similar scheme that differs in the presence of a bypass circuit at 650 °C high-temperature heat exchanger. The scheme in Figure 3c involves a high-temperature heat exchanger bypass and the 780 °C low-temperature heat exchanger bypass.
The simplest Figure 3a scheme works in the following way. After the 540 °C carbon dioxide leaves the boiler heater, it is sent to the carbon dioxide turbine at a 25 MPa supercritical pressure. In the turbine, it expands to 7.5 MPa and produces the output power. The heat of the turbine exit gas is stage utilized in high-temperature and low-temperature heat exchangers and heats carbon dioxide at the boiler inlet. After that, the flow splits into two parts. One part enters the cooler, and the other part, proportional to the recompression rate, enters the recompression compressor. The first flow releases its heat into the heat exchanger and enters the main compressor, where its pressure increases to the turbine inlet level. The flow compressed in the main compressor heats up in the low-temperature heat exchanger and mixes with the recompression exit flow. Then, the whole working fluid flow enters the cold circuit of the high-temperature heat exchanger, is heated, and enters the boiler heater. Thus, the carbon dioxide cycle is closed.
In the boiler, coal burns in pre-heated air, and the flue gas releases its heat into the superheater and then into the air heater. Application of the recompression compressor reduces the carbon dioxide flow at the low-temperature heat exchanger inlet and equalizes the flows equivalents. This results in more effective heat utilization in the low-temperature heat exchanger. Two full carbon dioxide flows enter both entrances of the high-temperature heat exchanger. The flows have similar heat capacity which results in similar flow equivalents and increases the heat exchanger efficiency.
Figure 3b’s thermal scheme differs from the previous one by the high-temperature heat exchanger bypass. A part of the low-temperature heat exchanger’s exit cold flow enters the high-temperature heat exchanger bypass to remove the low-temperature heat upstream of the air heater. This scheme allows for useful utilization of the low-temperature flue gas heat upstream of the air heater. This scheme is reasonable at a 650 °C initial temperature. On the other hand, Figure 3c’s scheme has additional bypasses of the high-temperature, and the low TGMP-344A boiler is a part widely used in Russia in the 300 MW power block K-300-240. This study took this boiler for its prototype. The fuel considered was the Taldinsky coal field, and its performance is disclosed in Table 1. Table 2 presents input data for the heat flow scheme analysis [24,25].

3. Methods

Aspen Plus was used for the computer simulation of the power production facilities. The working fluid thermophysical parameters were taken from the NIST Reference Fluid Thermodynamic and Transport Properties Database (REFPROP), a high-accuracy database [26,27]. The method for calculating thermodynamic processes is briefly explained below.
The coal combustion product content (77.1% N2; 14.2% RO2; 8.7% H2O) and the adiabatic combustion temperature of 1988 °C in the furnace of the power boiler (Figure 4) was calculated using the method in [28] with a furnace air excess αfur = 1.2.
The boiler fuel mass flow was taken so as to produce a source heat power equal to the TGMP-344A boiler’s thermal power. The air heater inlet temperature was kept at 360 °C by controlling the furnace gas flow at the boiler model inlet to keep the air heater’s exit temperature at 130 °C. In addition, the boiler thermal analysis assumed the following rates for the boiler vacuum chuck: Δαhgd = 0.03 vacuum chuck into the horizontal gas duct, Δαec = 0.03 air chuck into the single-stage economizer, ΔαAH = 0.03 air chuck into the air heater, Δαash.coll = 0.1 air chuck into the ash collector, and Δαgd = 0.05 air chuck into the gas flow path.
At the end of the expansion in the turbine, the enthalpy may be calculated as the following:
h o u t l e t . C O 2 T = h i n l e t . C O 2 T       h i n l e t . C O 2 T     h o u t l e t . i s . C O 2 T · η C O 2 T
where h o u t l e t . C O 2 T and h i n l e t . C O 2 T are the working fluid enthalpy at the turbine outlet and inlet (kJ/kg), h o u t l e t . i s . C O 2 T is the working fluid enthalpy at the turbine outlet at isentropic expansion (kJ/kg), and η C O 2 T is the turbine isentropic efficiency.
At the end of the compression process in the compressor, the enthalpy is calculated as:
h o u t l e t . C = h i n l e t . C + h o u t l e t . i s . C h i n l e t . C / η C
where h o u t l e t . C and h i n l e t . C are the working fluid enthalpy at the compressor outlet and inlet (kJ/kg), h o u t l e t . i s . C is the working fluid enthalpy at the compressor outlet at isentropic expansion (kJ/kg), and η C is the compressor isentropic efficiency.
The high- and low-temperature heat exchangers’ simulation assumed the minimal temperature difference of 5 °C [29]. The circulation pump power was calculated based on the cooling water pressure and mass flow rate.
The optimization criteria were the facility’s net efficiency calculated with the following equation:
η n e t TPP = N C O 2 T · η m e c h · η e g ( N M C + N R C + N C P + + N SE + N BF ) / · η m e c h · η e m B · Q l c v · η t r ,
N C O 2 T —turbine internal power, MW;
N M C —main compressor internal power, MW;
N R C —recompressing compressor internal power, MW;
N C P circulation pump internal power MW;
NSE—smoke exhauster internal power, MW;
NBF—blower fan internal power, MW;
η m e c h –mechanical efficiency, %;
η e g —power generator efficiency, %;
η e m —electric motor efficiency, %;
η t r —heat transportation efficiency, %;
B —fuel consumption, kg/s;
Q l c v —low calorific value, MJ/kg.
The thermal power of the superheater may be calculated as the following:
Q s u p e r h e a t   = D 0 · h 0 h i n l e t . S H
where D 0 is the working fluid mass flow at the turbine inlet (kg/s), h 0 is the working fluid enthalpy at the turbine inlet (kJ/kg), and h i n l e t . S H is the working fluid enthalpy at the superheater inlet (kJ/kg).
The thermal power of the high-temperature heat exchanger bypass was calculated with the following equation:
Q b p . H T R   = D b p . H T R · h o u t l e t . b p . H T R h i n l e t . b p . H T R
where D b p . H T R is the working fluid mass flow at the high-temperature heat exchanger bypass (kg/s), h o u t l e t . b p . H T R is the working fluid enthalpy at the high-temperature heat exchanger bypass outlet (kJ/kg), and h i n l e t . b p . H T R is the working fluid enthalpy at the high-temperature heat exchanger bypass inlet (kJ/kg).
The thermal power of the low-temperature heat exchanger bypass is calculated with the following equation:
Q b p . L T R   = D b p . L T R · h o u t l e t . b p . L T R h i n l e t . b p . L T R
where D b p . L T R is the working fluid mass flow at the low-temperature heat exchanger bypass (kg/s), h o u t l e t . b p . L T R is the working fluid enthalpy at the low-temperature heat exchanger bypass outlet (kJ/kg), and h i n l e t . b p . L T R is the working fluid enthalpy at the low-temperature heat exchanger bypass inlet (kJ/kg).
The thermal power of the high- and low-temperature heat exchanger bypasses was calculated as:
Q b p   = Q b p . H T R   + Q b p . L T R
where Q b p . H T R is the thermal power of the high-temperature heat exchanger bypass (MW), an Q b p . L T R is the thermal power of the low-temperature heat exchanger bypass (MW).
The heat losses in the cooler:
Q c o o l i n g   = G c o o l i n g · h i n l e t . p r e h o u t l e t . p r e
where G c o o l i n g is the working fluid mass flow at the pre-cooler (kg/s), h i n l e t . p r e is the working fluid enthalpy at the pre-cooler inlet (kJ/kg), and h o u t l e t . p r e is the working fluid enthalpy at the pre-cooler outlet (kJ/kg).
The heat losses with the exhaust gas were calculated as:
Q 2   = G e x . g · h e x . g h a m b
where G e x . g is the exhaust gases mass flow (kg/s), h e x . g is the exhaust gas enthalpy (kJ/kg), and h a m b is the enthalpy of exhaust gases at the ambient temperature (kJ/kg).
The following parameters were assumed as the main variables influencing the carbon dioxide NPP efficiency:
-
turbine inlet pressure p0, MPa;
-
recompression ratio x, %;
-
bypass rate xbp, %;
-
bypass outlet temperature tbp, °C.
The parametric optimization method was the sequential enumeration. Thermodynamic studies assumed the turbine inlet temperatures 540, 650, and 780 °C.
The first analysis stage involved verifying the turbine inlet pressure with a 2 MPa step in the 19–31 MPa range at the initial temperature 540 °C, in the 24–36 MPa range at the initial temperature 650 °C, and in the 22–34 MPa range at the initial temperature 780 °C. The next stage involved verification of the recompression rate from 15% to 45% at the initial temperatures 540 and 650 °C, the recompression rate from 10% to 40% at the initial temperature 780 °C.
Then, for the schemes with the heat exchangers, the bypasses were verified the bypass rates and the bypass exit temperature. In the scheme with the 650 °C initial temperature, the high-temperature heat exchanger bypass rate was verified in the 6–18% range. At the optimal bypass rate, the high-temperature heat exchanger bypass exit temperature varied in the range of 450–510 °C.
In Figure 4, the heat flow chart with the 780 °C initial temperature was first optimized with the low-temperature heat exchanger bypass rate. The rate was verified in the 1–15% range. Then, the low-temperature heat exchanger bypass exit CO2 temperature was verified from 255 to 285 °C. The next step was an optimization of the high-temperature heat exchanger bypass rate. At optimal parameters of the low-temperature heat exchanger, the bypass rate was verified in the 6–25% range. At the optimal high-temperature heat exchanger bypass rate, the investigation subject was the CO2 temperature after the bypass from 580 to 610 °C.

4. Results and Discussion

The initial pressure, p0, optimization results for each scheme with a 2 MPa step are presented in Figure 5. The carbon dioxide facility’s net efficiency increased as the turbine inlet pressure increased in the following ranges:
-
From 19 MPa (39.64%) to 25 MPa (40.32%) at the initial temperature of 540 °C;
-
From 24 MPa (45.21%) to 28 MPa (45.42%) at the initial temperature of 650 °C;
-
From 22 MPa (47.24%) to 28 MPa (47.82%) at the initial temperature of 780 °C.
The thermal efficiency reduced as the turbine inlet pressure increased in the following ranges:
-
From 25 MPa (40.32%) to 31 MPa (40.01%) at the initial temperature of 540 °C;
-
From 28 MPa (45.42%) to 36 MPa (43.98%) at the initial temperature of 650 °C;
-
From 28 MPa (47.82%) to 34 MPa (47.32%) at the initial temperature of 780 °C.
Thus, for the 540, 650, and 780 °C initial temperatures, the thermodynamically optimal initial pressures were 25, 28, and 28 MPa, respectively.
The following discloses the relation effect of higher thermal efficiency with the additional bypass circuits. The initial temperature growth increased the heated flow temperature at the high-temperature heat exchanger exit, which increased the exit gas temperature. Supplementation of the bypass regenerator line partly reduced the losses related to the boiler exit gas. In other words, the additional bypass circuits at higher initial temperatures provided maximal carbon dioxide cycle thermal efficiency.
The correlation dependencies of the net efficiency on the initial pressure for the different initial temperatures presented in Table 3 were developed based on the modeling results presented in Figure 5.
The next stage included a study of the thermal efficiency relationships with the recompression rate × at the optimal CO2 initial pressure. The calculation step was 5%; Figure 6 presents the results.
The relationship of net efficiency of the pulverized coal boiler facility carbon dioxide cycle with the recompression ratio was calculated for the following ratio ranges:
-
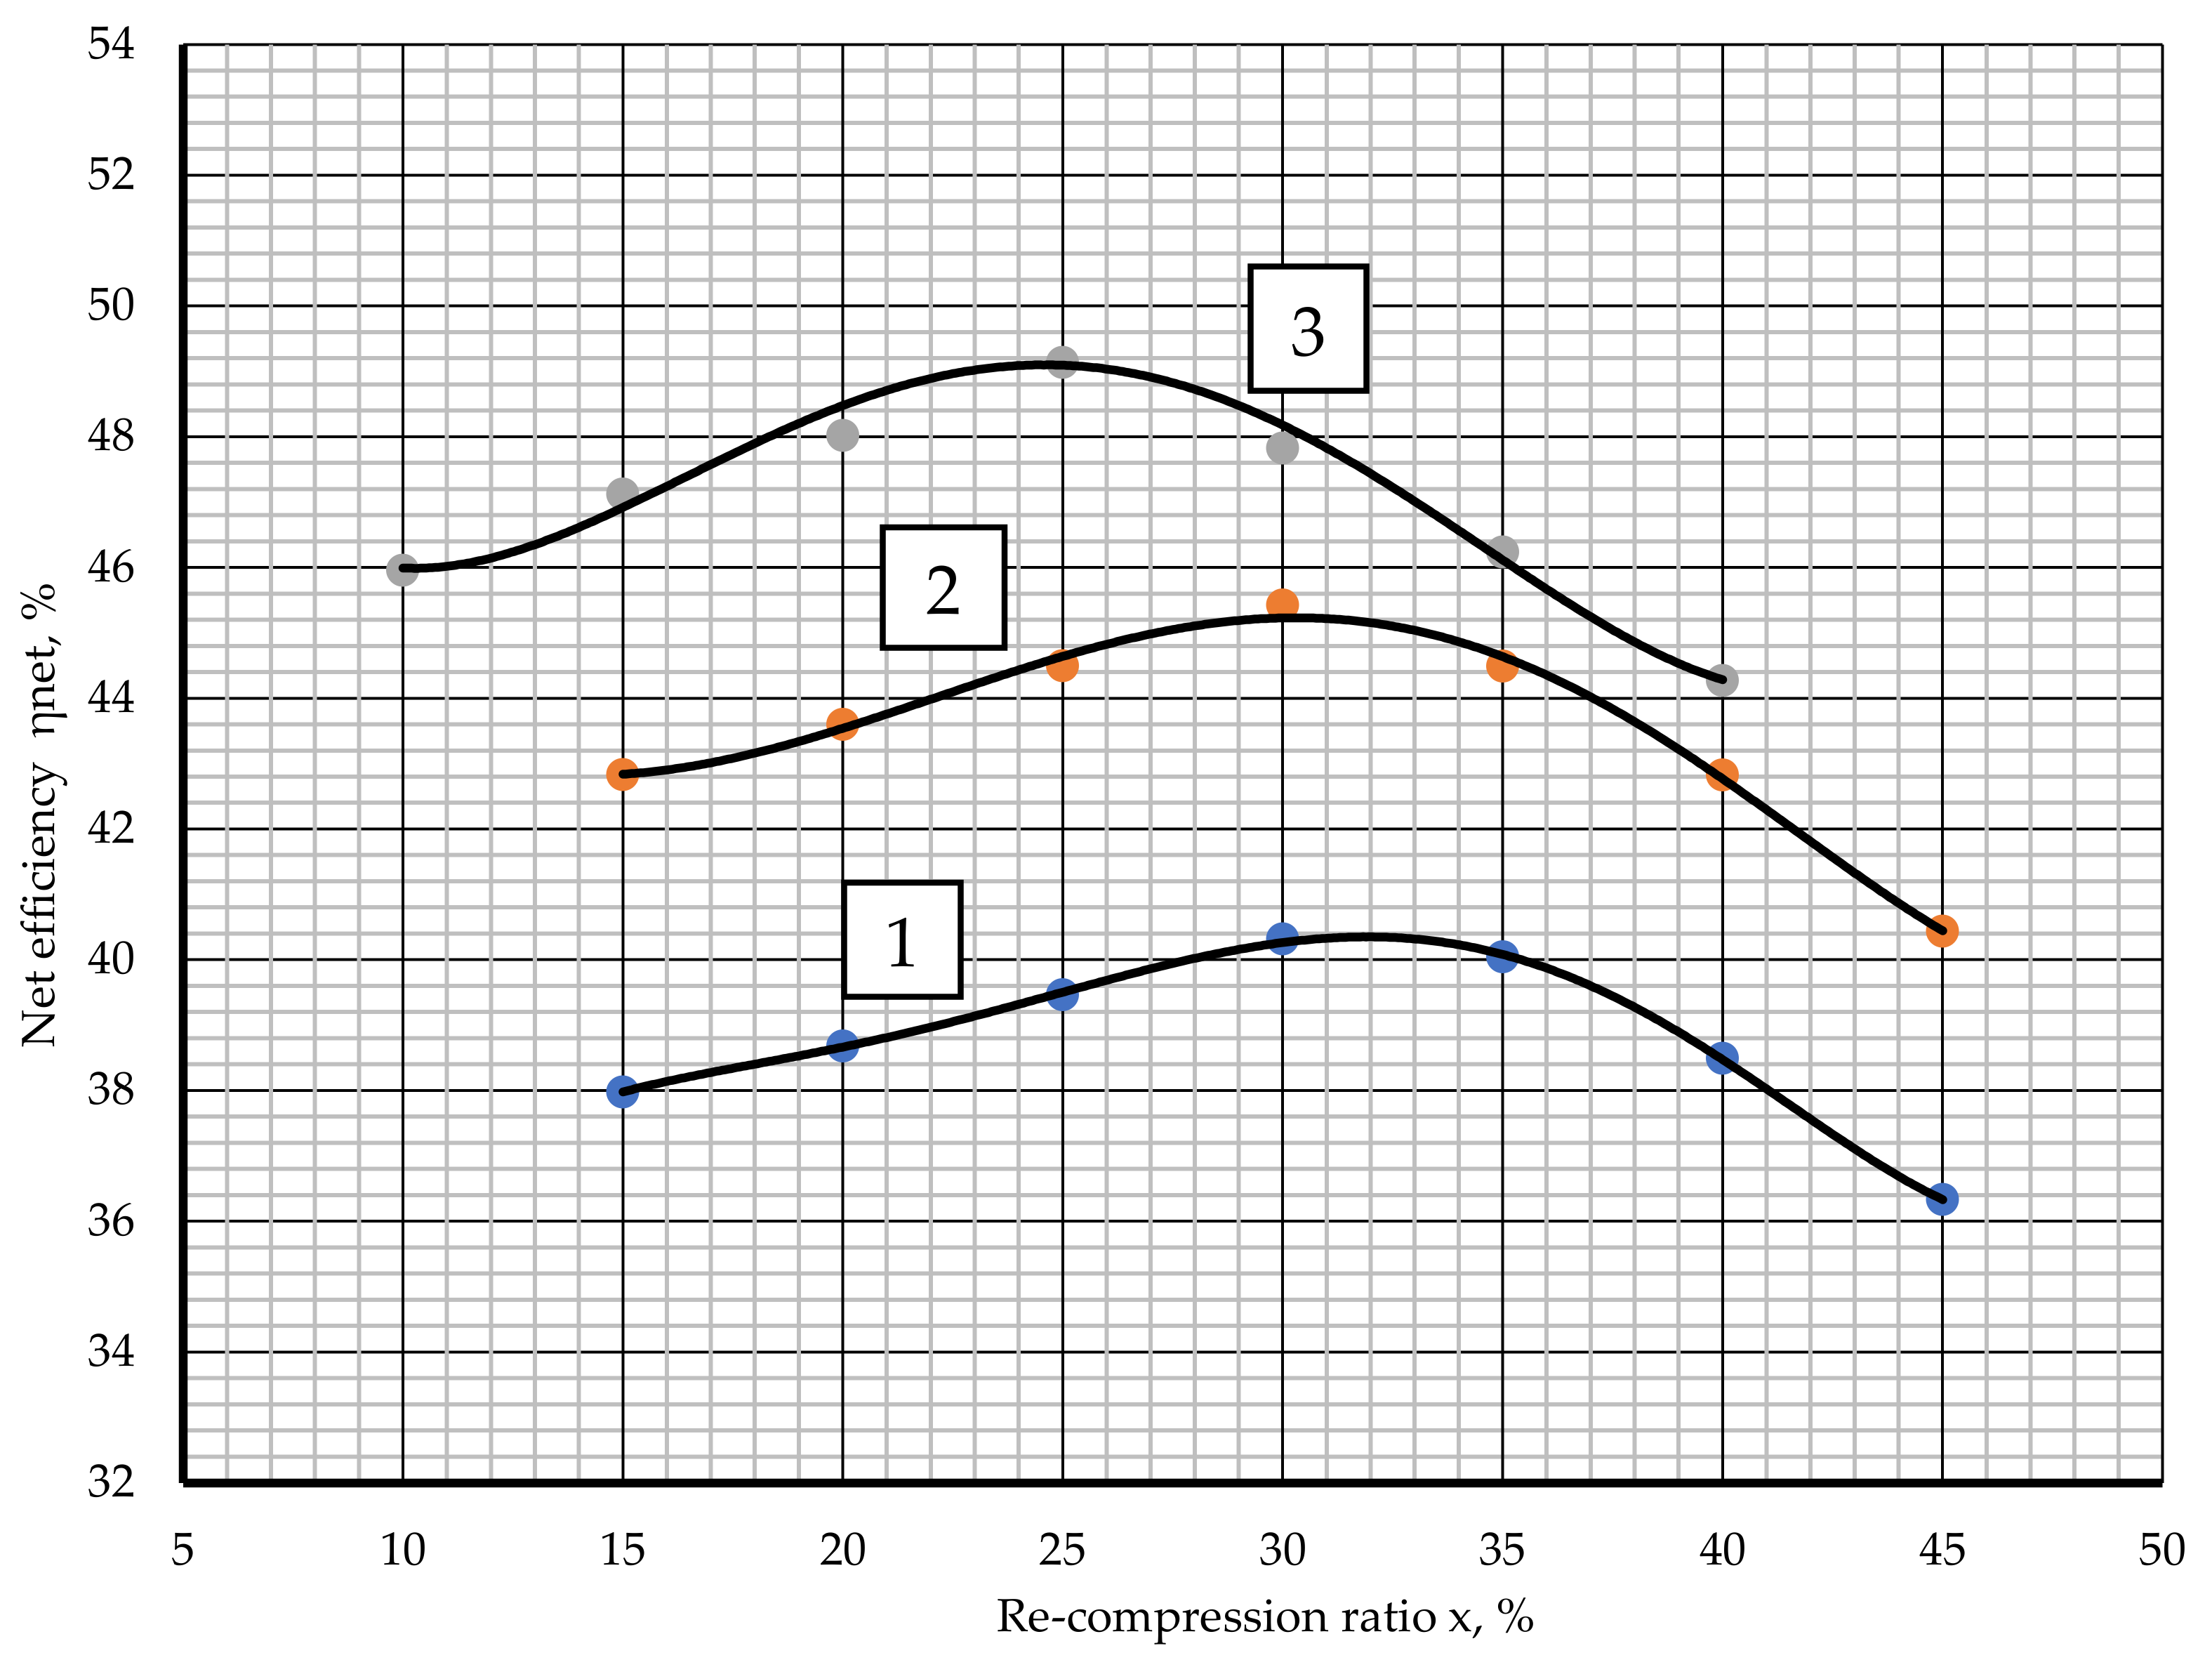
From 15% (37.98%) to 30% (40.32%) at the initial temperature of 540 °C;
-
From 15% (42.83%) to 30% (45.42%) at the initial temperature of 650 °C;
-
From 10% (45.95%) to 25% (49.13%) at the initial temperature of 780 °C.
On the contrary, the thermal efficiency dropped down as the recompression ratio increased. The analysis ranges were the following:
-
From 30% (40.32%) to 45% (36.33%) at the initial temperature of 540 °C;
-
From 30% (45.42%) to 45% (40.43%) at the initial temperature of 650 °C;
-
From 25% (49.13%) to 40% (44.27%) at the initial temperature of 780 °C.
The recompression ratio controls which part of the working fluid mass flow will be cooled before compression and what part goes directly to the recompression. The increase in the recompression ratio causes the re-compressor power consumption. The main compressor’s power consumption and the cold source’s heat losses reduce. In addition, the temperature difference in the low-temperature recuperate also change. When the recompression ratio drops, the cooling agent mass flow grows, and this reduces the recompression power consumption. Thus, changes in the recompression ratio show the optimal relationships between the cold source losses, recompression power consumption, and the low-temperature heat exchanger efficiency.
The recompression ratio values of 30%, 30%, and 25% at the initial temperatures of 540, 650, and 780 °C, respectively, provided optimal thermal efficiency.
The carbon dioxide facility with an initial temperature of 540 °C, an initial pressure of 25 MPa, and a recompression ratio of 30% had a maximal net efficiency of 40.3%. This efficiency was reached with and without the high-temperature heat exchanger bypass. This was related to the carbon dioxide temperature at the boiler inlet staying as remarkably low as 369 °C. Therefore, the carbon dioxide facility with a 540 °C initial temperature was the most reasonable and was the simplest scheme without the high-temperature heat exchanger bypass.
At the optimal values of the turbine inlet pressure and recompression ratio, the bypass ratio and bypass exit carbon dioxide temperature corresponding to the maximal cycle thermal efficiency are given in Table 4 and Table 5, respectively.
Therefore, the following parameters were thermodynamically optimal for the cycle with a 650 °C initial temperature: 28 MPa initial pressure, 30% recompression ratio, and 10% bypass rate.
The further study included the influence of the high- and low-temperature heat exchanger bypasses upon the cycle efficiency at the initial temperature of 780 °C. The bypass ratio change (Figure 7) had a 2% step in the 1–9% range. At the low-temperature heat exchanger bypass ratio below 5%, the net efficiency did not change and stayed at the 49.13% level. At the bypass ratio above 5%, its 1% increase reduced the net efficiency by 0.17%. The lack of influence at the bypass ratio below 1–5% was due to the condition of the heat exchanger surface simulation through the minimal temperature drop.
From the larger flow of the cold carbon dioxide in the low-temperature heat exchanger, the minimal temperature drop moved from the hot side of the low-temperature circuit to the cold one. Further temperature reductions were seen at the re-compressor inlet and the cold source inlet; the efficiency increased together with them. At a higher bypass ratio, the minimal temperature drop was at the hot end of the heat exchanger. Therefore, at the low-temperature heat exchanger exit, the carbon dioxide temperature became higher which increased the cold source losses and the re-compressor’s power consumption.
The correlation dependencies of the net efficiency on the bypass ratio for the different initial temperatures presented in Table 6 were developed based on the modeling results presented in Figure 7.
The next study was devoted to the influence of the low-temperature heat exchanger bypass’s exit temperature at the optimal bypass ratio of 5% from the maximal cycle efficiency point of view (Figure 8). The temperature was verified in the 255–285 °C range with a 5 °C step. The net efficiency reached its maximal value of 49.17% at the bypass exit temperature of 265 °C. In the 265–255 °C temperature range, every 5 °C of temperature reduction caused an approximately 0.03% drop in the net efficiency because of the higher bypass heat capacity and the corresponding higher fuel consumption. Every 5 °C in bypass exit temperature growth from 270 to 285 °C reduced the net efficiency by approximately 0.04% because of the temperature increase at the cooler inlet and the re-compressor inlet.
At the bypass exit temperature of 265 °C, the high-temperature bypass ratio was verified in the 6–25% range of the turbine inlet flow with a 2% step. The maximal net efficiency of 41.17% corresponded to the high-temperature heat exchanger bypass ratio of 10%. Every 1% increase in the bypass ratio reduced the cycle net efficiency by approximately 0.32% because of the regeneration displacement that, in turn, caused the fuel consumption to increase. Every 1% reduction in the bypass ratio in the 6–8% range reduced the net efficiency by 0.07% because of the changes in the heat exchanger operation conditions. The changes in the high-temperature heat exchanger bypass ratio moved the minimal temperature drop towards the cold carbon dioxide inlet and the hot gas exit. Together with this, the temperature of the cold carbon dioxide at the superheater inlet became lower.
The correlation dependencies of the net efficiency on the bypass exit temperature for the different initial temperatures presented in Table 7 were developed based on the modeling results presented in Figure 8.
Table 5 presents the study’s results for the high-temperature heat exchanger’s exit bypass temperature at a 10% bypass ratio in the 580–610 °C range and a 5 °C step. The net efficiency reached its maximal value at the bypass exit temperature of 594 °C, which is equal to the high-temperature heat exchanger’s exit temperature. The increase in the bypass temperature from 594 to 610 °C reduced the net efficiency from 49.17% to 49.11%. The decrease in the bypass exit temperature from 595 to 580 °C reduced the net efficiency from 49.17% to 49.11%.
At the turbine inlet temperature of 780 °C, the net efficiency reached its maximal value of 49.17% at the following cycle parameters: initial pressure of 28 MPa; recompression rate of 25%; low-temperature heat exchanger bypass ratio of 5%; high-temperature heat exchanger bypass ratio of 10%; low-temperature heat exchanger bypass temperature of 265 °C, which was 10 °C below the equilibrium; high-temperature heat exchanger bypass temperature of 594 °C, which was equal to the equilibrium.
The high- and low-temperature heat exchanger bypasses removed the low-temperature heat upstream of the air heater, which provided its inlet temperature of 360 °C and the air heater exit temperature of 134 °C. A larger bypass ratio replaced the cycle regeneration, reduced its thermal efficiency, and reduced the cycle’s net efficiency at a constant temperature of the boiler exhaust gas. A lower bypass ratio provided a higher net efficiency. At a further bypass ratio reduction, the efficiency did not grow, because the heat exchanger simulation method fixed the minimal temperature difference at 5 °C. The bypass exit temperature had a small influence on the cycle efficiency: a 10 °C deviation from the optimal value reduced the net efficiency by 0.05–0.10%.
Figure 9 presents a comparison of TPP thermal efficiency as the net efficiency dependencies from the initial temperature with different heat carriers. The carbon dioxide works in its supercritical state so that in the cycle there are no evaporation and condensation processes. The last factor allows for the regeneration of large amounts of heat in high- and low-temperature heat exchangers. On the other than, the cycle needs gaseous working fluid compression that is less efficient than the liquid working fluid compression in STPPs.
The heat regeneration degree was high; thus, the carbon dioxide temperature at the hot source inlet was higher than in STPPs. (In steam turbine facilities the feeding water temperature is approximately 270 °C, and in a carbon dioxide cycle with a pulverized coal boiler and a 650 °C turbine inlet temperature, this temperature is 476 °C). In STPPs, the boiler inlet water temperature is limited with the critical point parameters. In carbon dioxide cycles, the boiler inlet temperature is related to the turbine inlet temperature almost linearly. In the carbon dioxide cycles, the heat supply temperature grows faster than in STPPs, so at the initial temperature increase, its net efficiency grows faster.
Carbon dioxide facilities consume much energy for the working fluid compression, so at the initial temperatures below 620 °C their net efficiency is lower than for the steam turbine. At turbine inlet temperatures above 620 °C, carbon dioxide facilities with pulverized coal boilers have greater efficiency than the STPPs, and this efficiency difference follows the increase in the cycle heat supply temperature.
The correlation dependencies of the net efficiency on the turbine inlet temperature presented in Table 8 were developed based on the modeling results presented in Figure 9.
The main results of the structural and parametric optimization of the S-CO2 power plants with pulverized coal-fired boilers are presented in Table 9. The transition from water to S-CO2 heat carrier for the most common power units in Russia with a power capacity of 300 MW is advisable if the initial temperature of the working fluid is increased up to 650–780 °C. In particular, the net efficiency of the S-CO2 power plant was 0.7% higher compared to a steam turbine power plant at an initial temperature of 650 °C. In turn, the net efficiency increased by 2% for the initial temperature of 780 °C.

5. Conclusions

(1)
The heat flow models described a supercritical carbon dioxide Brayton cycle with a pulverized coal boiler and a combined carbon dioxide cycle with the utilization of the gas turbine exhaust gas heat;
(2)
The carbon dioxide Brayton cycle with a pulverized coal boiler at a 540 °C initial temperature optimal flow chart had no bypass in its high-temperature heat exchanger. This chart had a net efficiency similar to the one with a bypass, but this chart was simpler. At 650 °C, it appeared a necessary to use a high-temperature heat exchanger bypass. At 780 °C, it was reasonable to use both low- and high-temperature heat exchanger bypasses.
(3)
The heat flow computer simulation showed the key parameters influencing the thermal efficiency of the carbon dioxide facilities with pulverized coal boilers. These parameters were the following:
-
Turbine inlet pressure, recompression ratio with and without bypass of the high-temperature heat exchanger (for a turbine inlet temperature of 540 °C);
-
Turbine inlet pressure, recompression ratio, bypass ratio, and an exit gas temperature downstream of the high-temperature heat exchanger (for the turbine inlet temperature of 650 °C);
-
Turbine inlet pressure, recompression ratio, bypass ratio, and an exit gas temperature downstream of the high- and low-temperature heat exchangers (for a turbine inlet temperature of 780 °C):
(a)
It was determined that a 1 MPa increase in the turbine inlet pressure resulted in a mean net efficiency increase in the following amount:
-
0.11% in a facility with an initial temperature of 540 °C and an initial pressure range of 19–25 MPa;
-
0.05% in a facility with an initial temperature of 650 °C and an initial pressure range of 24–28 MPa;
-
0.10% in a facility with an initial temperature of 780 °C and an initial pressure range of 22–28 MPa;
-
A 1 MPa increase in the turbine inlet pressure reduced the thermal efficiency accordingly:
-
0.05% in a facility with an initial temperature of 540 °C and an initial pressure range of 25–31 MPa;
-
0.18% in a facility with an initial temperature of 650 °C and an initial pressure range of 28–36 MPa;
-
0.08% in a facility with an initial temperature of 780 °C and an initial pressure range of 28–34 MPa.
(b)
It as determined that a 1% increase in the recompression ratio increased the mean net efficiency accordingly:
-
0.16% in a facility with an initial temperature of 540 °C and a recompression ratio range of 15–30%;
-
0.17% in a facility with an initial temperature of 650 °C and a recompression ratio range of 15–30%;
-
0.21% in a facility with an initial temperature of 780 °C and a recompression ratio range of 10–25%.
-
On the other hand, a 1% increase in the recompression ratio reduced the mean net efficiency accordingly:
-
0.27% in a facility with an initial temperature of 540 °C and a recompression ratio range of 30–45%;
-
0.33% in a facility with an initial temperature of 650 °C and a recompression ratio range of 30–45%;
-
0.32% in a facility with an initial temperature of 780 °C and a recompression ratio range of 25–40%.
(c)
The following dependence of the net efficiency on the heat exchanger bypass ratio in a facility with a pulverized coal boiler was as follows:
-
At a high-temperature heat exchanger bypass ratio below 12% in a facility with an initial temperature of 650 °C, the net efficiency of 45.42% was constant. Every 1% increase in the bypass ratio up to 18%, the net efficiency dropped by 0.17%;
-
At a low-temperature heat exchanger bypass ratio below 5% in a facility with an initial temperature of 780 °C, the net efficiency of 49.13% was constant. Every 1% increase in the bypass ratio up to 15% reduced the mean net efficiency by 0.43%;
-
At a high-temperature heat exchanger bypass ratio from 6% to 10% in a facility with an initial temperature of 780 °C, the thermal efficiency grew from 49.02% to 49.17%. Every 1% increase in the bypass ratio from 10% to 25% reduced the net efficiency by 0.32%.
(d)
In a facility with a pulverized coal boiler, the bypass exit temperature influenced the net efficiency as follows:
-
Changes in the high-temperature heat exchanger’s bypass exit temperature in a facility with an initial temperature of 650 °C had no influence;
-
Every 10 °C increase in the high-temperature heat exchanger’s bypass exit temperature in a facility with an initial temperature of 780 °C increased the net efficiency by 0.11% for temperatures from 255 (49.06%) to 265 °C (49.17%) and reduced the net efficiency by 0.07% for the temperatures from 265 °C (49.17%) to 285 °C (49.04%);
-
In a facility with an initial temperature of 780 °C, the high-temperature heat exchanger’s bypass exit temperature’s increase from 580 °C (49.11%) to 594 °C (49.17%) increased the net efficiency by 0.06% and the temperature increase from 594 (49.17%) to 610 °C (49.11%) reduced the net efficiency in a similar way (0.06%).
(4)
For a pulverized coal boiler facility, the optimization results showed the cycle parameters that provided maximal thermal efficiency:
-
At an initial temperature of 540 °C, the initial pressure of 25 MPa and a recompression ratio of 30% provided a maximal efficiency of 40.32%;
-
At an initial temperature 650 °C, the initial pressure of 28 MPa, recompression ratio of 30%, and bypass rate of 10% provided a maximal efficiency of 45.42%;
-
At the initial temperature of 780 °C, the initial pressure of 28 MPa, recompression ratio of 25%, and bypass rates of 5% and 10% and 265 and 594 °C in low- and high-temperature heat exchangers, respectively, provided a maximal efficiency of 49.17%.
(5)
A supercritical carbon dioxide facility had a higher cycle net efficiency than a steam cycle with superheating at initial temperatures above 620 °C. The high heat regeneration degree increased the mean integral heat supply temperature that allowed for the higher cycle efficiency of the carbon dioxide cycle. An increase in the turbine inlet temperature increased the difference between the cycles’ efficiency values.
(6)
The transition from water to a S-CO2 heat carrier for the most common power units in Russia with a power capacity of 300 MW is advisable if the initial temperature of the working fluid is increased up to 650–780 °C. In particular, the net efficiency of the S-CO2 power plant was 0.7% higher compared to the steam turbine power plant for the initial temperature of 650 °C. In turn, the net efficiency increased by 2% for the initial temperature of 780 °C.
(7)
Promising areas for further research are the development of power generation equipment working on supercritical carbon dioxide. It is especially important to develop a rational layout of the boiler heating surfaces, since the transition to S-CO2 working fluid leads to drastic changes in the thermal–hydraulic characteristics of channels. Another important issue to be solved is the development of S-CO2 turbine leakage prevention methods ensuring the construction compactness.

Author Contributions

Conceptualization, A.R.; methodology, V.K. and I.K.; software, V.K. and I.K.; validation, I.K. and S.O.; formal analysis, O.Z.; investigation, V.K., I.K. and S.O.; resources, O.Z.; data curation, S.O.; writing—original draft preparation, V.K.; writing—review and editing, A.R. and O.Z.; visualization, O.Z.; supervision, A.R.; project administration, A.R.; funding acquisition, O.Z. All authors have read and agreed to the published version of the manuscript.

Funding

This study was conducted by the Moscow Power Engineering Institute and was financially supported by the Ministry of Science and Higher Education of the Russian Federation (project no. FSWF-2020-0020).

Institutional Review Board Statement

Not applicable.

Informed Consent Statement

Not applicable.

Conflicts of Interest

The authors declare no conflict of interest.

References

  1. Rogalev, N.; Prokhorov, V.; Rogalev, A.; Komarov, I.; Kindra, V. Steam boilers’ advanced constructive solutions for the ultra-supercritical power plants. Int. J. Appl. Eng. Res. 2016, 11, 9297–9306. [Google Scholar]
  2. Weitzel, P.S.; Tanzosh, J.M.; Boring, B.; Okita, N.; Takahashi, T.; Ishikawa, N. Advanced ultra-supercritical power plant (700 to 760C) design for Indian coal. In Proceedings of the Power-Gen Asia Conference, Bangkok, Thailand, 3 October 2012. [Google Scholar]
  3. Braimakis, K.; Karellas, S. Energetic optimization of regenerative Organic Rankine Cycle (ORC) configurations. Energy Convers. Manag. 2018, 159, 353–370. [Google Scholar] [CrossRef]
  4. Sun, W.; Yue, X.; Wang, Y. Exergy efficiency analysis of ORC (Organic Rankine Cycle) and ORC-based combined cycles driven by low-temperature waste heat. Energy Convers. Manag. 2017, 135, 63–67. [Google Scholar] [CrossRef]
  5. Shi, L.; Shu, G.; Tian, H.; Deng, S. A review of modified Organic Rankine cycles (ORCs) for internal combustion engine waste heat recovery (ICE-WHR). Renew. Sustain. Energy Rev. 2018, 92, 95–110. [Google Scholar] [CrossRef]
  6. Xu, J.; Liu, C.; Sun, E.; Xie, J.; Lin, M.; Yang, Y.; Liu, J. Perspective of S-CO2 power cycles. Energy 2019, 186, 115831. [Google Scholar] [CrossRef]
  7. Song, J.; Li, X.; Ren, X.; Gu, C. Performance analysis and parametric optimization of supercritical carbon dioxide (S-CO2) cycle with bottoming Organic Rankine Cycle (ORC). Energy 2018, 143, 406–416. [Google Scholar] [CrossRef]
  8. Song, J.; Li, X.; Ren, X.; Gu, C. Performance improvement of a preheating supercritical CO2 (S-CO2) cycle based system for engine waste heat recovery. Energy Convers. Manag. 2018, 161, 225–233. [Google Scholar] [CrossRef]
  9. Crespi, F.; Sanchez, D.; Rodriguez, J.M.; Gavagnin, G. Fundamental thermo-economic approach to selecting sCO2 power cycles for CSP applications. Energy Procedia 2017, 129, 963–970. [Google Scholar] [CrossRef]
  10. Dostal, V.; Hejzlar, P.; Driscoll, M.J. The supercritical carbon dioxide power cycle: Comparison to other advanced power cycles. Nucl. Technol. 2006, 3, 283–301. [Google Scholar] [CrossRef]
  11. Angelino, G. Real gas effects in carbon dioxide cycles. In Proceedings of the International Gas Turbine Conference and Products Show, Cleveland, OH, USA, 10–13 March 1969. [Google Scholar]
  12. Dostal, V.; Driscoll, M.J.; Hejzlar, P. A supercritical carbon dioxide cycle for next generation nuclear reactors. Mass. MIT-ANP-TR-100 2004, 307, 265–282. [Google Scholar]
  13. Zaryankin, A.; Rogalev, A.; Osipov, S.; Kindra, V. Supercritical carbon dioxide gas turbines for high-power generation. In AIP Conference Proceedings; AIP Publishing LLC: Melville, NY, USA, 2018; Volume 2047, p. 020026. [Google Scholar]
  14. Liu, Y.; Wang, Y.; Huang, D. Supercritical CO2 Brayton cycle: A state-of-the-art review. Energy 2019, 189, 115900. [Google Scholar] [CrossRef]
  15. Rogalev, A.; Rogalev, N.; Kindra, V.; Komarov, I.; Zlyvko, O. Research and Development of the Oxy-Fuel Combustion Power Cycles with CO2 Recirculation. Energies 2021, 14, 2927. [Google Scholar] [CrossRef]
  16. Angelino, G. Carbon dioxide condensation cycles for power production. J. Eng. Gas Turbines Power 1968, 90, 287–295. [Google Scholar] [CrossRef]
  17. Huang, M.; Sonwane, C. Thermodynamics of conventional and non-conventional SCO2 recompression Brayton cycles with direct and indirect heating. In Proceedings of the 4-th International Symposium-Supercritical CO2 Power Cycles, Pittsburgh, PA, USA, 9–10 September 2014. [Google Scholar]
  18. Ahn, Y.; Bae, S.J.; Kim, M.; Cho, S.K.; Baik, S.; Lee, J.I.; Cha, J.E. Review of supercritical CO2 power cycle technology and current status of research and development. Nucl. Eng. Technol. 2015, 47, 647–661. [Google Scholar] [CrossRef] [Green Version]
  19. Moazzem, S.; Rasul, M.G.; Khan, M.M.K. A Review on Technologies for Reducing CO2 Emission from Coal Fired Power Plants. In Thermal Power Plants; Rasul, M., Ed.; IntechOpen: London, UK, 2012; Chapter 11; Volume 11, pp. 227–254. [Google Scholar] [CrossRef] [Green Version]
  20. Guo, J.Q.; Li, M.J.; Xu, J.L.; Yan, J.J.; Ma, T. Energy, exergy and economic (3E) evaluation and conceptual design of the 1000 MW coal-fired power plants integrated with S-CO2 Brayton cycles. Energy Convers. Manag. 2020, 211, 112713. [Google Scholar] [CrossRef]
  21. Chen, Z.; Wang, Y.; Zhang, X. Energy and exergy analyses of S–CO2 coal-fired power plant with reheating processes. Energy 2020, 211, 118651. [Google Scholar] [CrossRef]
  22. Mecheri, M.; Le Moullec, Y. Supercritical CO2 Brayton cycles for coal-fired power plants. Energy 2016, 103, 758–771. [Google Scholar] [CrossRef]
  23. Liu, M.; Zhang, X.; Ma, Y.; Yan, J. Thermo-economic analyses on a new conceptual system of waste heat recovery integrated with an S-CO2 cycle for coal-fired power plants. Energy Convers. Manag. 2018, 161, 243–253. [Google Scholar] [CrossRef]
  24. Sun, E.; Hu, H.; Li, H.; Liu, C.; Xu, J. How to construct a combined S-CO2 cycle for coal fired power plant? Entropy 2019, 21, 19. [Google Scholar] [CrossRef] [PubMed] [Green Version]
  25. Ma, T.; Li, M.J.; Xu, J.L.; Cao, F. Thermodynamic analysis and performance prediction on dynamic response characteristic of PCHE in 1000 MW S-CO2 coal fired power plant. Energy 2019, 175, 123–138. [Google Scholar] [CrossRef]
  26. Rogalev, A.; Grigoriev, E.; Kindra, V.; Rogalev, N. Thermodynamic optimization and equipment development for a high efficient fossil fuel power plant with zero emissions. J. Clean. Prod. 2019, 236, 117592. [Google Scholar] [CrossRef]
  27. Rogalev, A.; Rogalev, N.; Kindra, V.; Zlyvko, O.; Vegera, A. A study of Low-Potential Heat Utilization Methods for Oxy-Fuel Combustion Power Cycles. Energies 2021, 14, 3364. [Google Scholar] [CrossRef]
  28. Kuznetsov, N.V. Boiler Facility Thermal Analysis; Standard Method. M. Energy: Moscow, Russia, 1973; p. 296. [Google Scholar]
  29. Hahn, D.; Kim, Y.; Lee, C.B.; Kim, S.; Lee, J.; Lee, Y.; Kim, B.; Jeong, H. Conceptual design of the sodium-cooled fast reactor KALIMER-600. Nucl. Eng. Technol. 2007, 39, 193. [Google Scholar] [CrossRef]
Figure 1. Supercritical CO2 Brayton cycles: (a) S-CO2 Brayton cycle with regeneration; (b) S-CO2 Brayton cycle with reheating; (c) S-CO2 Brayton cycle with intermediate cooling; (d) S-CO2 Brayton cycle with partial cooling; (e) S-CO2 Brayton cycle with recompression. C—compressor, RH—regenerator, R—reactor, T—turbine, G—electricity generator, PC—pre-cooler, HTP—high-pressure turbine, LPT—low-pressure turbine, CR—condenser, P—pump, RC—recompressing compressor, HTR—high-temperature regenerator, LTR—low-temperature regenerator, MC—main compressor, and IC—intermediate cooler.
Energies 14 07136 g001
Figure 2. Thermal power plant with an energy boiler and S-CO2 recompression Brayton cycle. T—turbine, HTR—high-temperature regenerator, ITR—intermediate regenerator, LTR—low-temperature regenerator, RC—recompressing compressor, PC—pre-cooler, IC—intermediate cooler, MC1,2—main compressor, and G—electricity generator.
Energies 14 07136 g002
Figure 3. Promising thermal power plants with a pulverized coal-fired boiler and S-CO2 recompression Brayton cycle: (a) base scheme; (b) scheme with HTR bypass; (c) scheme with HTR and LTR bypasses. T—turbine, HTR—high-temperature regenerator, LTR—low-temperature regenerator, RC—recompressing compressor, PC—pre-cooler, IC—intermediate cooler, MC—main compressor, SH—superheater, and AH—air heater.
Energies 14 07136 g003aEnergies 14 07136 g003b
Figure 4. Simplified scheme of the vacuum chuck mixing with high-temperature boiler gas. SH—superheater, HTR—high-temperature regenerator, LTR—low-temperature regenerator, and AH—air heater.
Energies 14 07136 g004
Figure 5. Net efficiency versus initial pressure at the following initial temperature values: 1—540 °C, 2—650 °C, and 3—780 °C.
Energies 14 07136 g005
Figure 6. Net efficiency versus the recompression ratio at different initial temperatures: 1—540 °C, 2—650 °C, and 3—780 °C.
Energies 14 07136 g006
Figure 7. Dependence of the cycle net efficiency on the bypass ratio and the heat power distribution. (a) 1—HTR 650 °C; 2—LTR 780 °C; 3—HTR 780 °C. Net efficiency versus bypass ratio. (b) Heat transfer in the superheater and the high-temperature heat exchanger bypass versus the bypass ratio at the initial temperature of 650 °C. (c) Heat losses in the cooler and with the exhaust gas at the initial temperature of 650 °C.
Energies 14 07136 g007
Figure 8. The cycle’s net efficiency dependence from the high/low-temperature heat exchangers’ bypasses exit temperatures: thermal power distribution diagrams. (a) Net efficiency dependence from the bypass exit temperature at the cycle’s initial temperature of 650 °C. (b) Distribution of surface heat transfer versus the bypass exit temperature at the cycle’s initial temperature of 650 °C. (c) Net efficiency dependence from the low-temperature heat exchanger bypass exit temperature at the cycle’s initial temperature of 780 °C. (d) Net efficiency dependence from the high-temperature heat exchanger bypass exit temperature at the cycle’s initial temperature of 780 °C.
Energies 14 07136 g008aEnergies 14 07136 g008b
Figure 9. Dependence of the cycle’s net efficiency upon the turbine inlet temperature: 1—H2O cycle and 2—CO2 cycle.
Energies 14 07136 g009
Table 1. Coal performance.
ParameterValue
Working mass humidity, %12.5
Working mass ash content, %16
Sulphur mass content, %0.3
Carbon mass content, %58.5
Hydrogen mass content, %3.8
Nitrogen mass content, %1.9
Oxygen mass content, %7.1
Low heating value, MJ/kg22.42
Volatiles, %39.9
Table 2. Input data for the heat flow scheme analysis.
ParameterValue
Variable parameters to be optimized
Turbine inlet pressure, MPa25
Turbine exit pressure, MPa7.5
Recompression rate, %30
Fixed parameters for all heat flow schemes
Compressor internal relative efficiency, %90
Turbine internal relative efficiency, %90
Mechanical efficiency, %99
Power generator efficiency, %99
Heat transportation efficiency, %99
Electric motor efficiency, %99
Turbine inlet temperature, °C540/650/780
Main compressor CO2 inlet temperature, °C32
Low-temperature heat exchanger minimal temperature drop, °C5
High-temperature heat exchanger minimal temperature drop, °C5
Cooling water inlet temperature, °C15
Cooling water inlet pressure, MPa0.1
Cooling water exit temperature, °C25
Cooler hydraulic resistance, MPa0.03
Boiler prototype on thermal powerTGMP-344A
Exit gas temperature upstream air heater, °C360
Boiler inlet air temperature, °C15
Furnace exit air excess1.2
Air vacuum chuck into horizontal gas duct0.03
Vacuum chuck into bypass0.02
Vacuum chuck into air heater0.03
Vacuum chuck into ash precipitators0.1
Vacuum chuck into gas pipelines0.05
Hydraulic resistance on air (TGMP-344A), kPa4.17
Hydraulic resistance on gas (TGMP-344A), kPa2.74
Heat losses on unburning, %1
Heat losses with ash, %0
Heat losses through thermal barriers, %0.2
Smoke exhauster and blower fan efficiencies, %85
Table 3. The correlation dependencies of the net efficiency on the initial pressure for the different initial temperatures.
Initial TemperatureCorrelationCoefficient of Determination (R2)Operating Range
540 °C η n e t = 0.665 p 0 3 63.45 p 0 2 + 1932 p 0 · 10 3 + 21.28 0.9985p0 = 19 ÷ 31 MPa
650 °C η n e t = 0.639 p 0 3 76.74 p 0 2 + 2753 p 0 · 10 3 + 14.45 0.9911p0 = 24 ÷ 36 MPa
780 °C η n e t = 0.766 p 0 3 79.48 p 0 2 + 2629 p 0 · 10 3 + 19.72 0.9997p0 = 22 ÷ 34 MPa
Table 4. Bypass ratio in low and high-temperature heat exchangers optimization results for the CO2 cycle with recompression.
HTR, 650 °CLTR, 780 °CHTR, 780 °C
Bypass Rate
xbpHTR, %
Net Efficiency
ηne, %
Bypass Rate
xbpLTR, %
Bypass Rate
xbpHTR, %
Net Efficiency
ηne, %
Bypass Rate
xbpLTR, %
645.421645.421
845.423845.423
1045.4251045.425
1245.4271245.427
1444.9691444.969
1644.73101644.7310
1844.43151844.4315
Table 5. The exit temperature of low and high-temperature heat exchangers bypass cycle net efficiency optimization results for the carbon dioxide cycle with recompression.
HTR, 650 °CLTR, 780 °CHTR, 780 °C
Bypass Outlet Temperature
tbpHTR, %
Net Efficiency
ηne, %
Bypass Outlet Temperature
tbpLTR, %
Bypass Outlet Temperature
tbpHTR, %
Net Efficiency
ηne, %
Bypass Outlet Temperature
tbpLTR, %
45045.4225545045.42255
46045.4226046045.42260
47045.4226547045.42265
47645.4227047645.42270
48045.4227548045.42275
49045.4228049045.42280
50045.4228550045.42285
51045.4251045.42-
Table 6. The correlation dependencies of the net efficiency on the bypass ratio for the different initial temperatures.
Initial TemperatureCorrelationCoefficient of Determination (R2)Operating Range
650 °C η n e t = 5.556 x b p H T R 3 306.3 x b p H T R 2 + 3936 x b p H T R · 10 4 + 44.01 0.9691xbpHTR = 6 ÷ 18%
780 °C η n e t = 20.21 x b p L T R 3 683.9 x b p L T R 2 + 3058 x b p L T R · 10 4 + 48.85 0.9989xbpLTR = 1 ÷ 15%
780 °C η n e t = 15.09 x b p H T R 3 734.3 x b p H T R 2 + 8061 x b p H T R · 10 4 + 46.59 0.9950xbpHTR = 6 ÷ 25%
Table 7. The correlation dependencies of the net efficiency on the bypass exit temperature for the different initial temperatures.
Initial TemperatureCorrelationCoefficient of Determination (R2)Operating Range
650 °C η n e t = 45.42 1tbpHTR = 450 ÷ 510 °C
780 °C η n e t = 0.009 t b p L T R 3 8.261 t b p L T R 2 + 2359 t b p L T R · 10 3 174.5 0.9992tbpLTR = 250 ÷ 285 °C
780 °C η n e t = 0.008 t b p H T R 3 15.09 t b p H T R 2 + 9131 t b p H T R · 10 3 1792 0.9556tbpHTR = 580 ÷ 610 °C
Table 8. The correlation dependencies of the net efficiency on the turbine inlet temperature.
CycleCorrelationCoefficient of Determination (R2)Operating Range
H2O cycle η n e t = 0.001 T i n 3 2.130 T i n 2 + 1476 T i n · 10 3 298.1 0.998Tin = 540 ÷ 780 °C
CO2 cycle η n e t = 0.730 T i n 2 + 1332 T i n · 10 4 10.34 1Tin = 540 ÷ 780 °C
Table 9. The results of the structural and parametric optimization of the S-CO2 power plants with pulverized coal-fired boilers.
CharacteristicInlet Temperature, °C
540650780
Working fluidH2OS-CO2S-CO2
Inlet pressure, MPa252828
Feedwater temperature, °C270476594
Recompression ratio, %-3025
High-temperature heat exchanger bypass rate, %-1010
Low-temperature heat exchanger bypass rate, %--5
Net efficiency, %40.245.4249.17
Publisher’s Note: MDPI stays neutral with regard to jurisdictional claims in published maps and institutional affiliations.

