
Geochemical Characteristics of Expelled and Residual Oil from Artificial Thermal Maturation of an Early Permian Tasmanite Shale, Australia


Abstract
:
1. Introduction
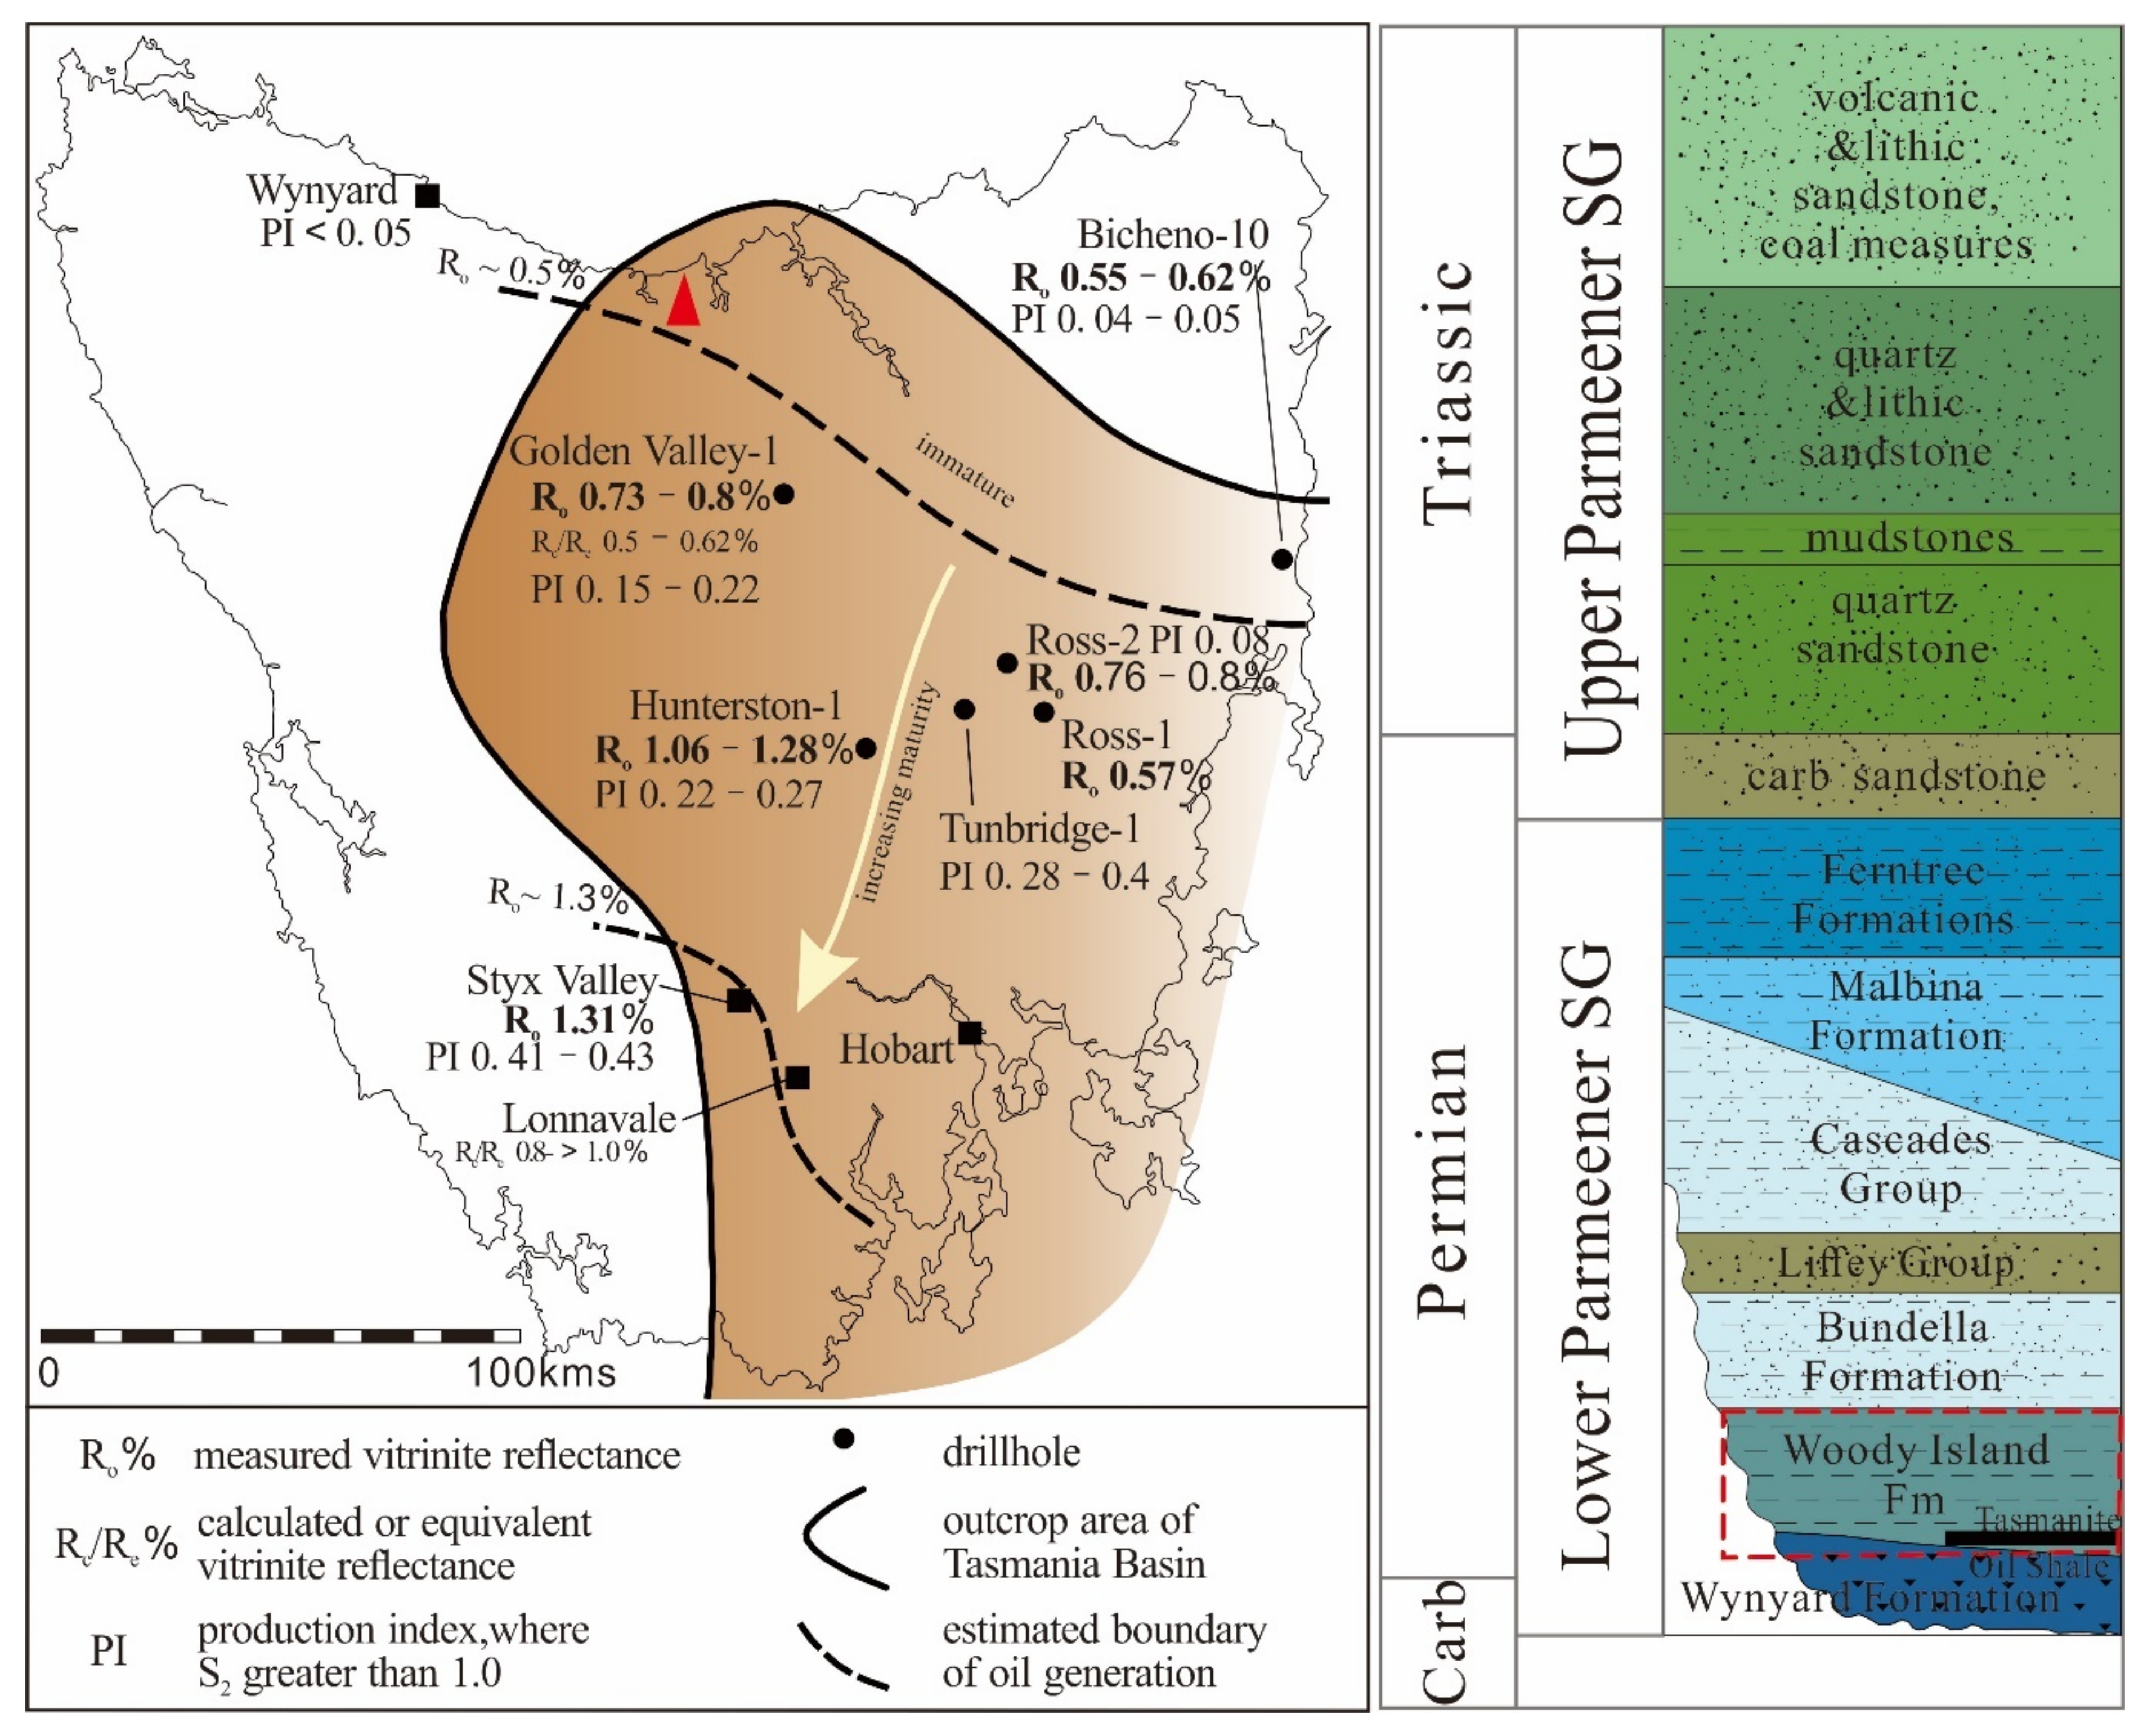
2. Geological Setting and Samples
3. Experimental Methods
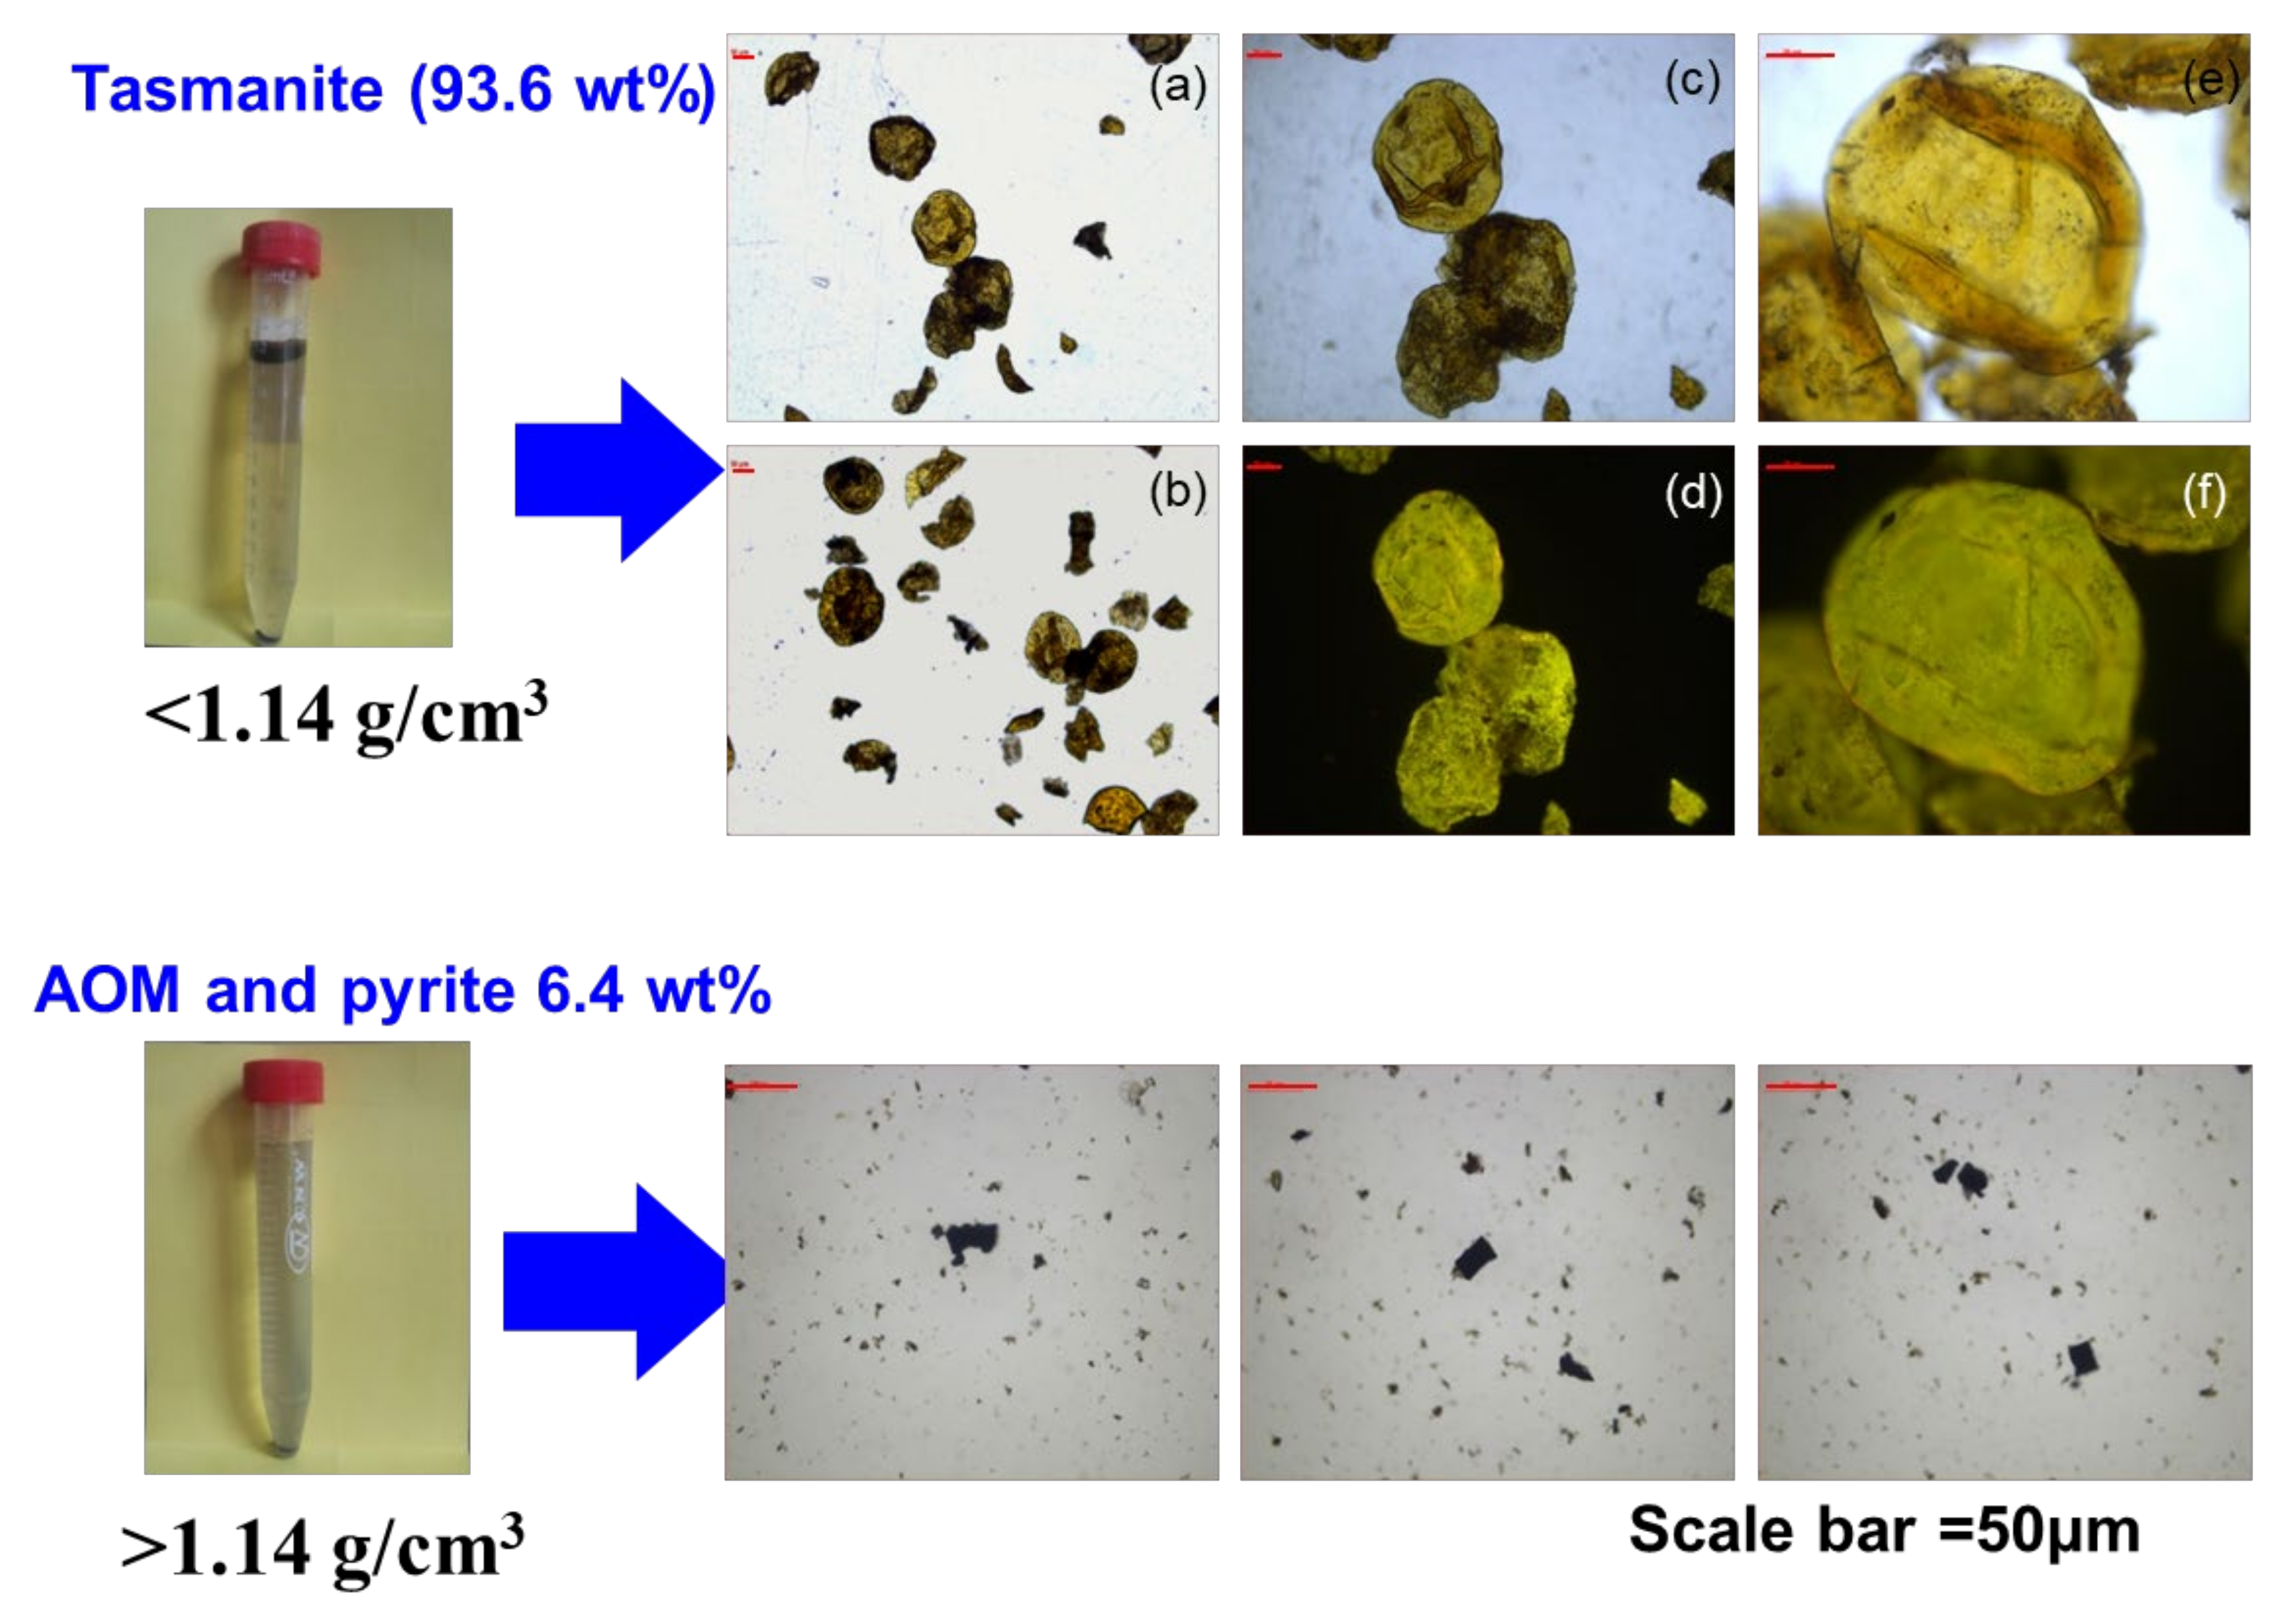
3.1. Kerogen Isolation and Sink-Float Separation
3.2. Organic Petrology, X-ray Diffraction (XRD), Rock-Eval Pyrolysis and Carbon Isotope Analysis
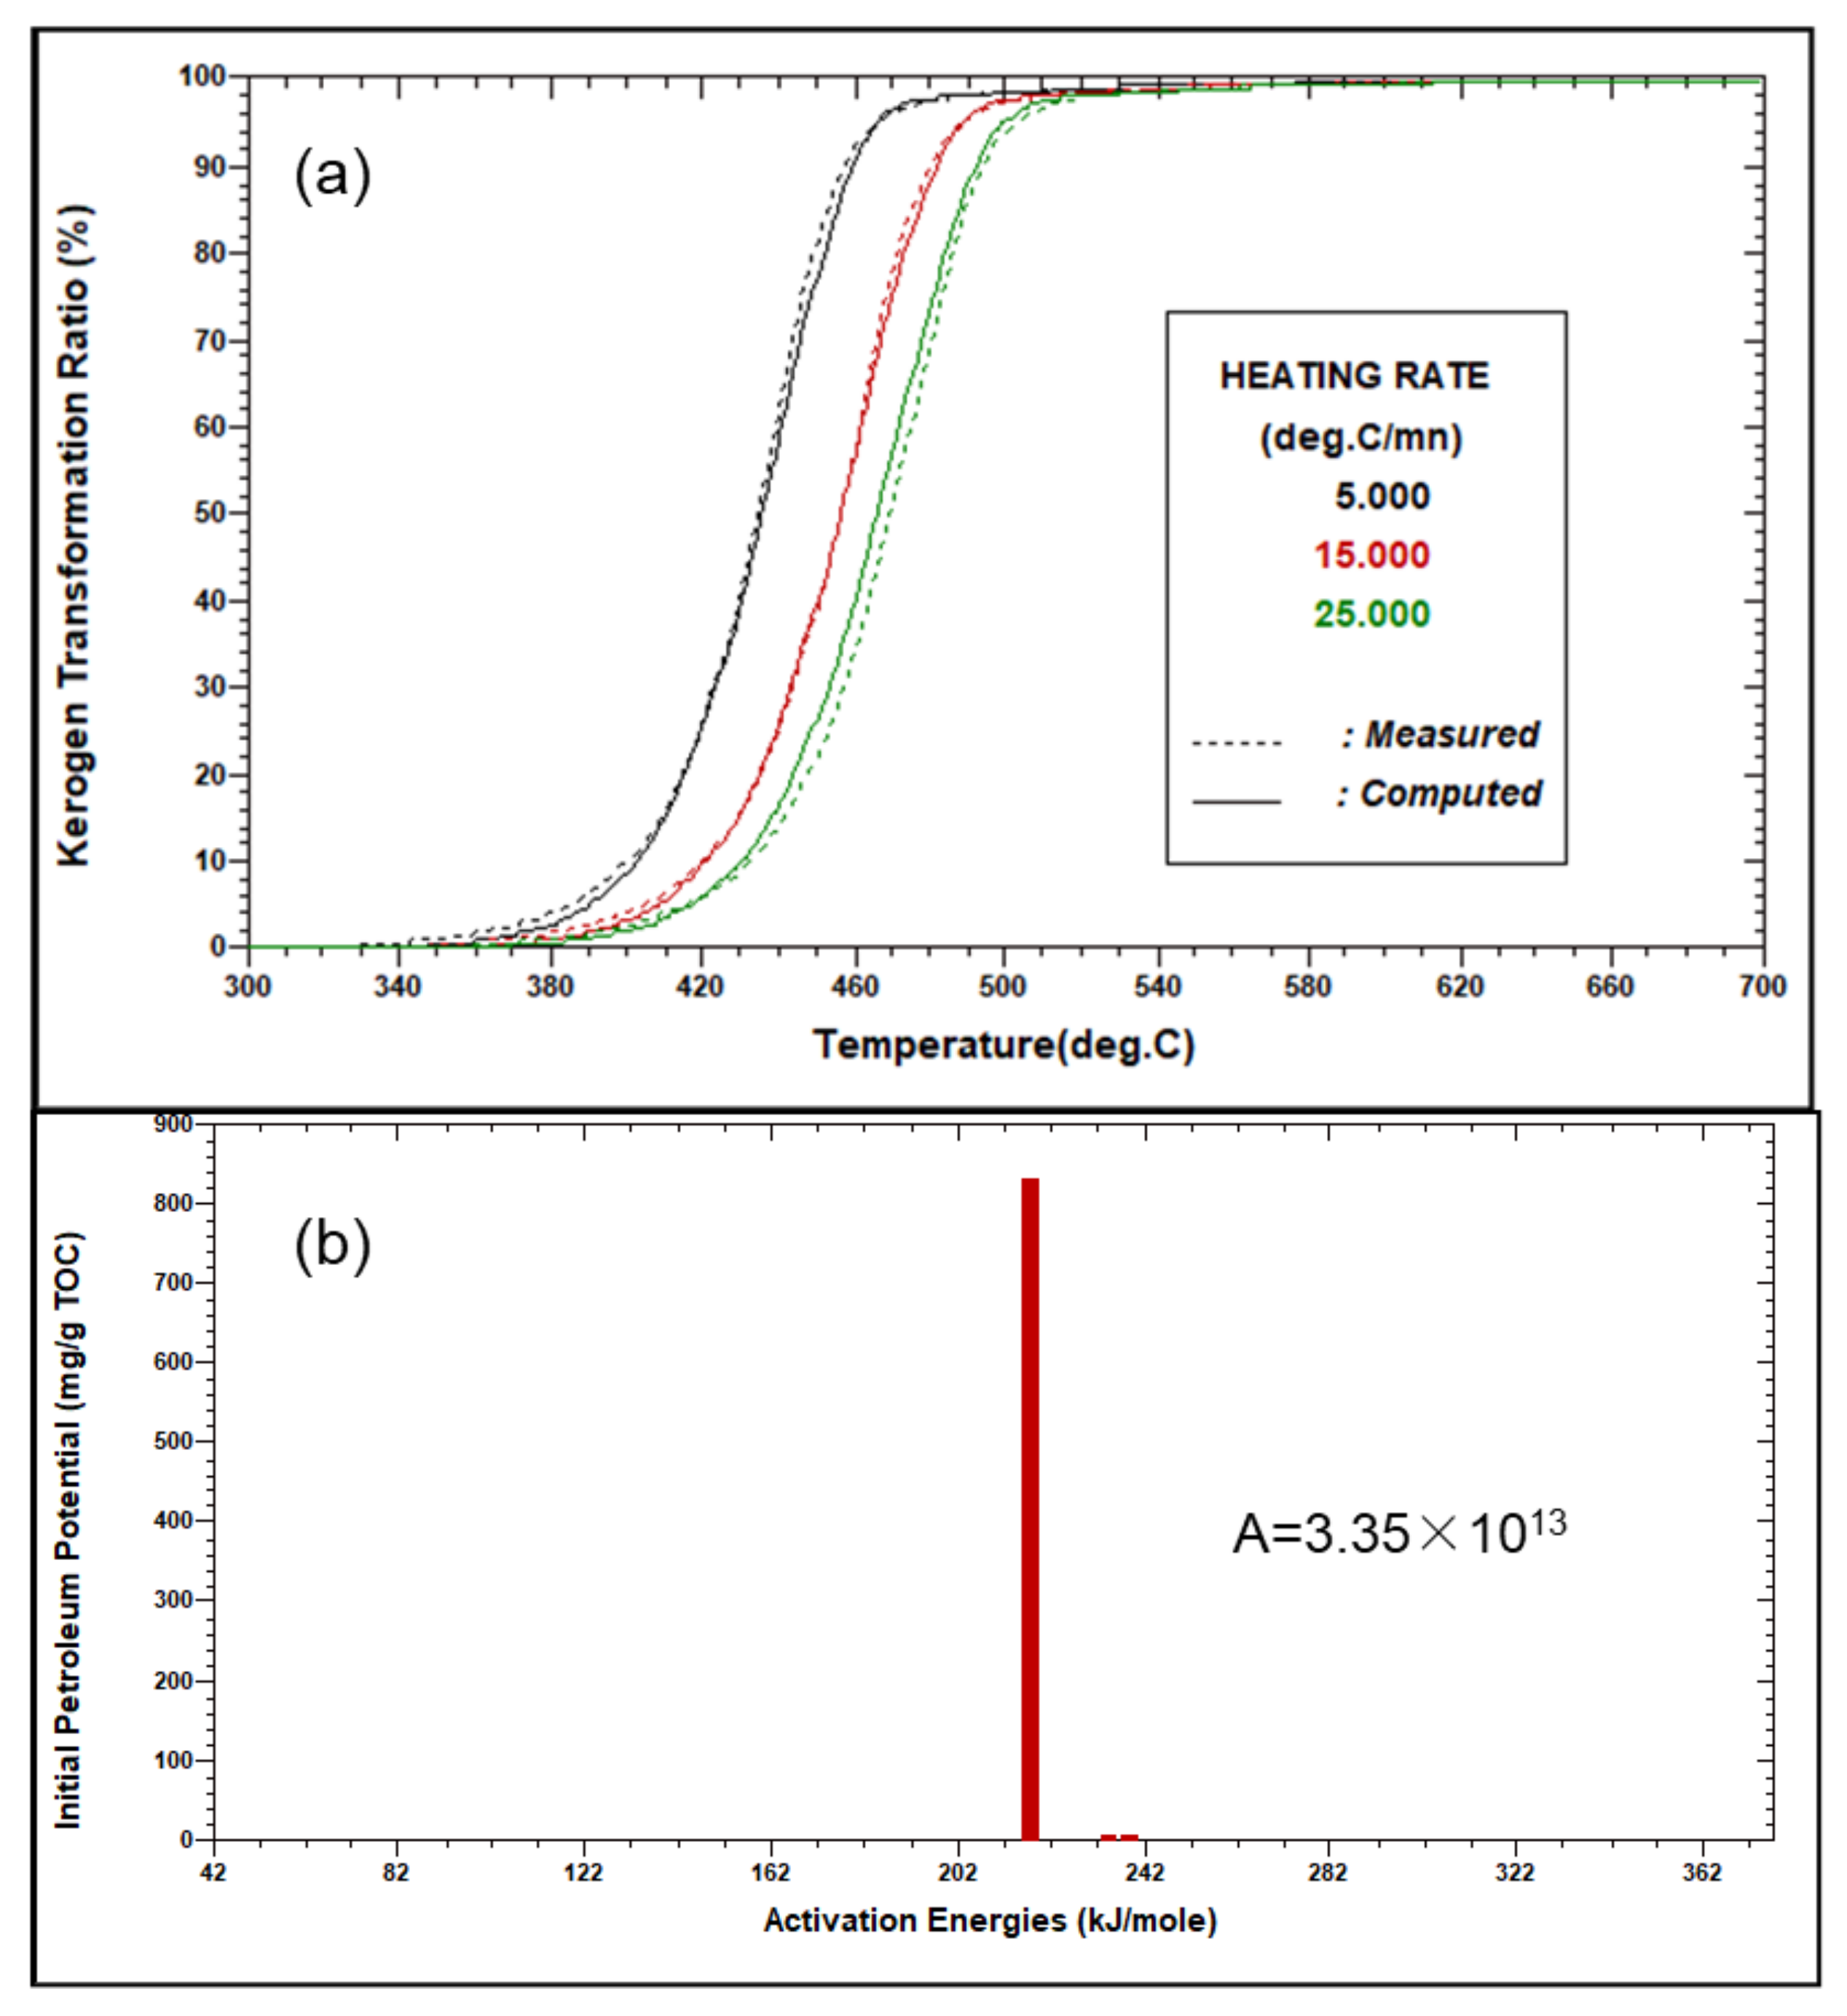
3.3. Kinetics of Hydrocarbon Generation under an Open System
3.4. Artificial Thermal Maturation Experiment
4. Results
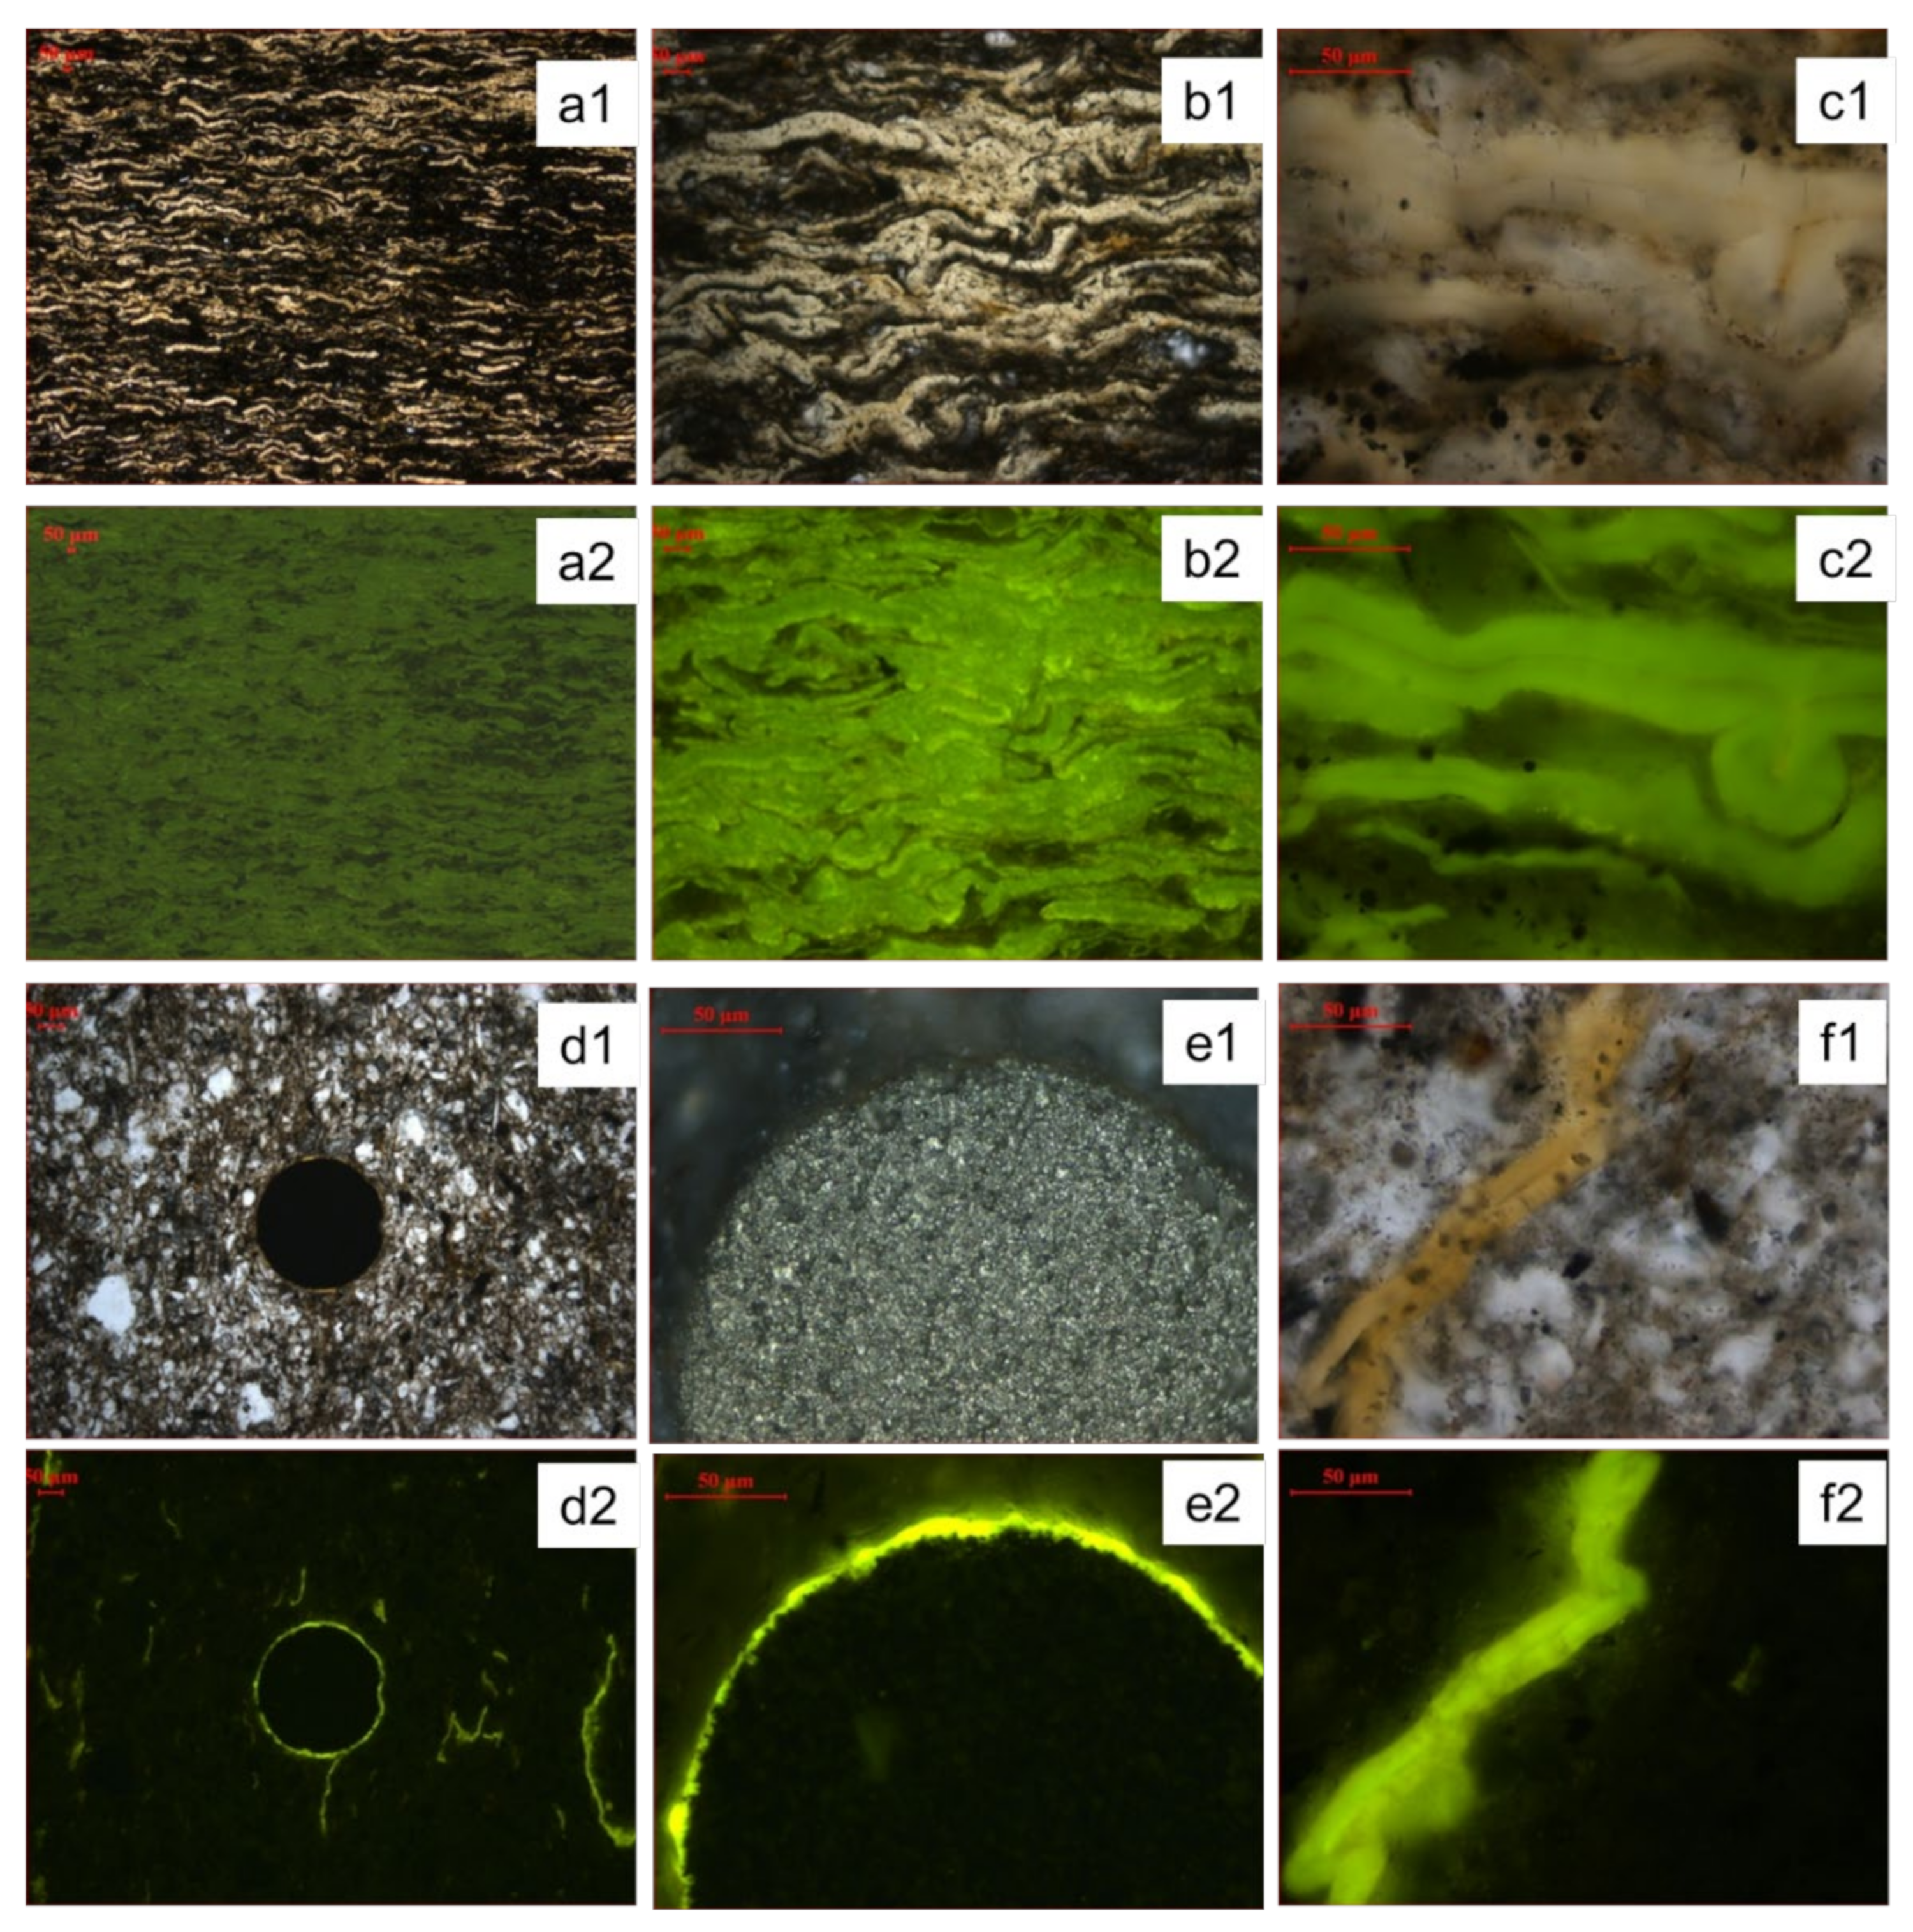
4.1. Organic Petrology and Mineral Composition
4.2. Rock-Eval Pyrolysis and Carbon Isotope Analysis
4.3. Artificial Thermal Simulation Experiments
5. Discussion
5.1. Can Additional Sources of OM Be Recognized?
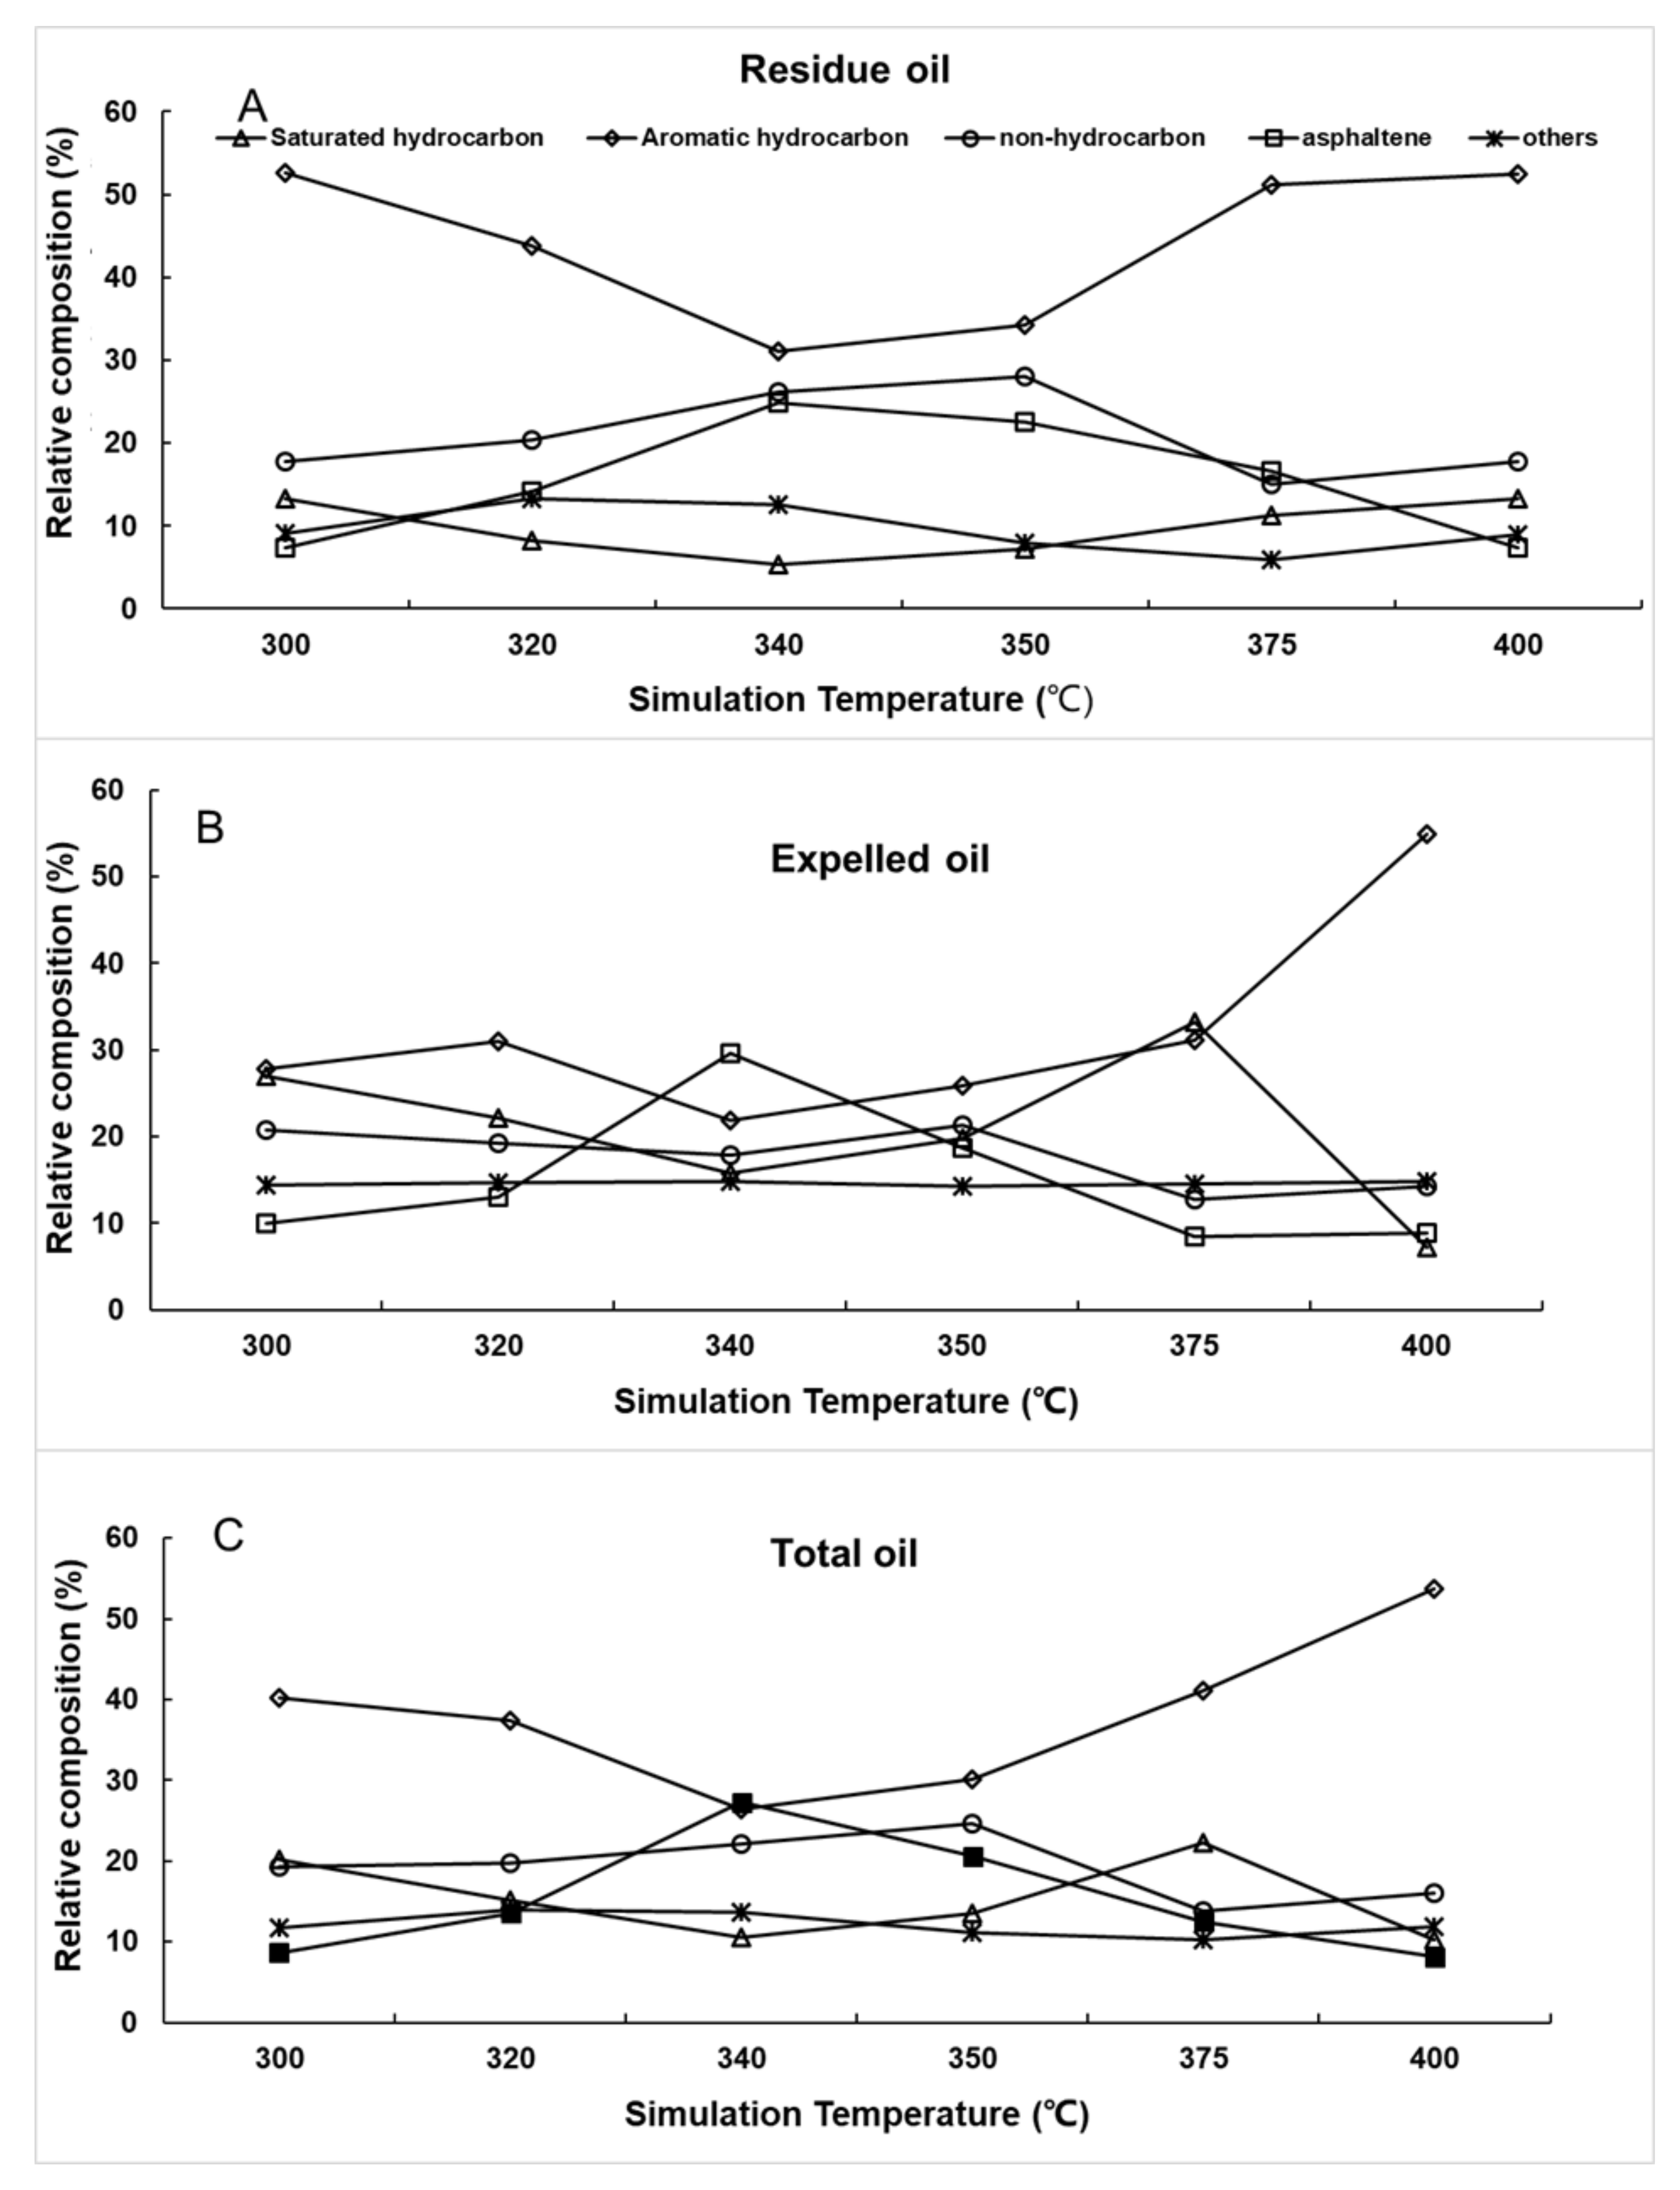
5.2. Variation in Group Constituents with Different Temperatures
5.3. Characterization of Saturated Compounds and Its Significance for Interpretation of Geochemical Parameters
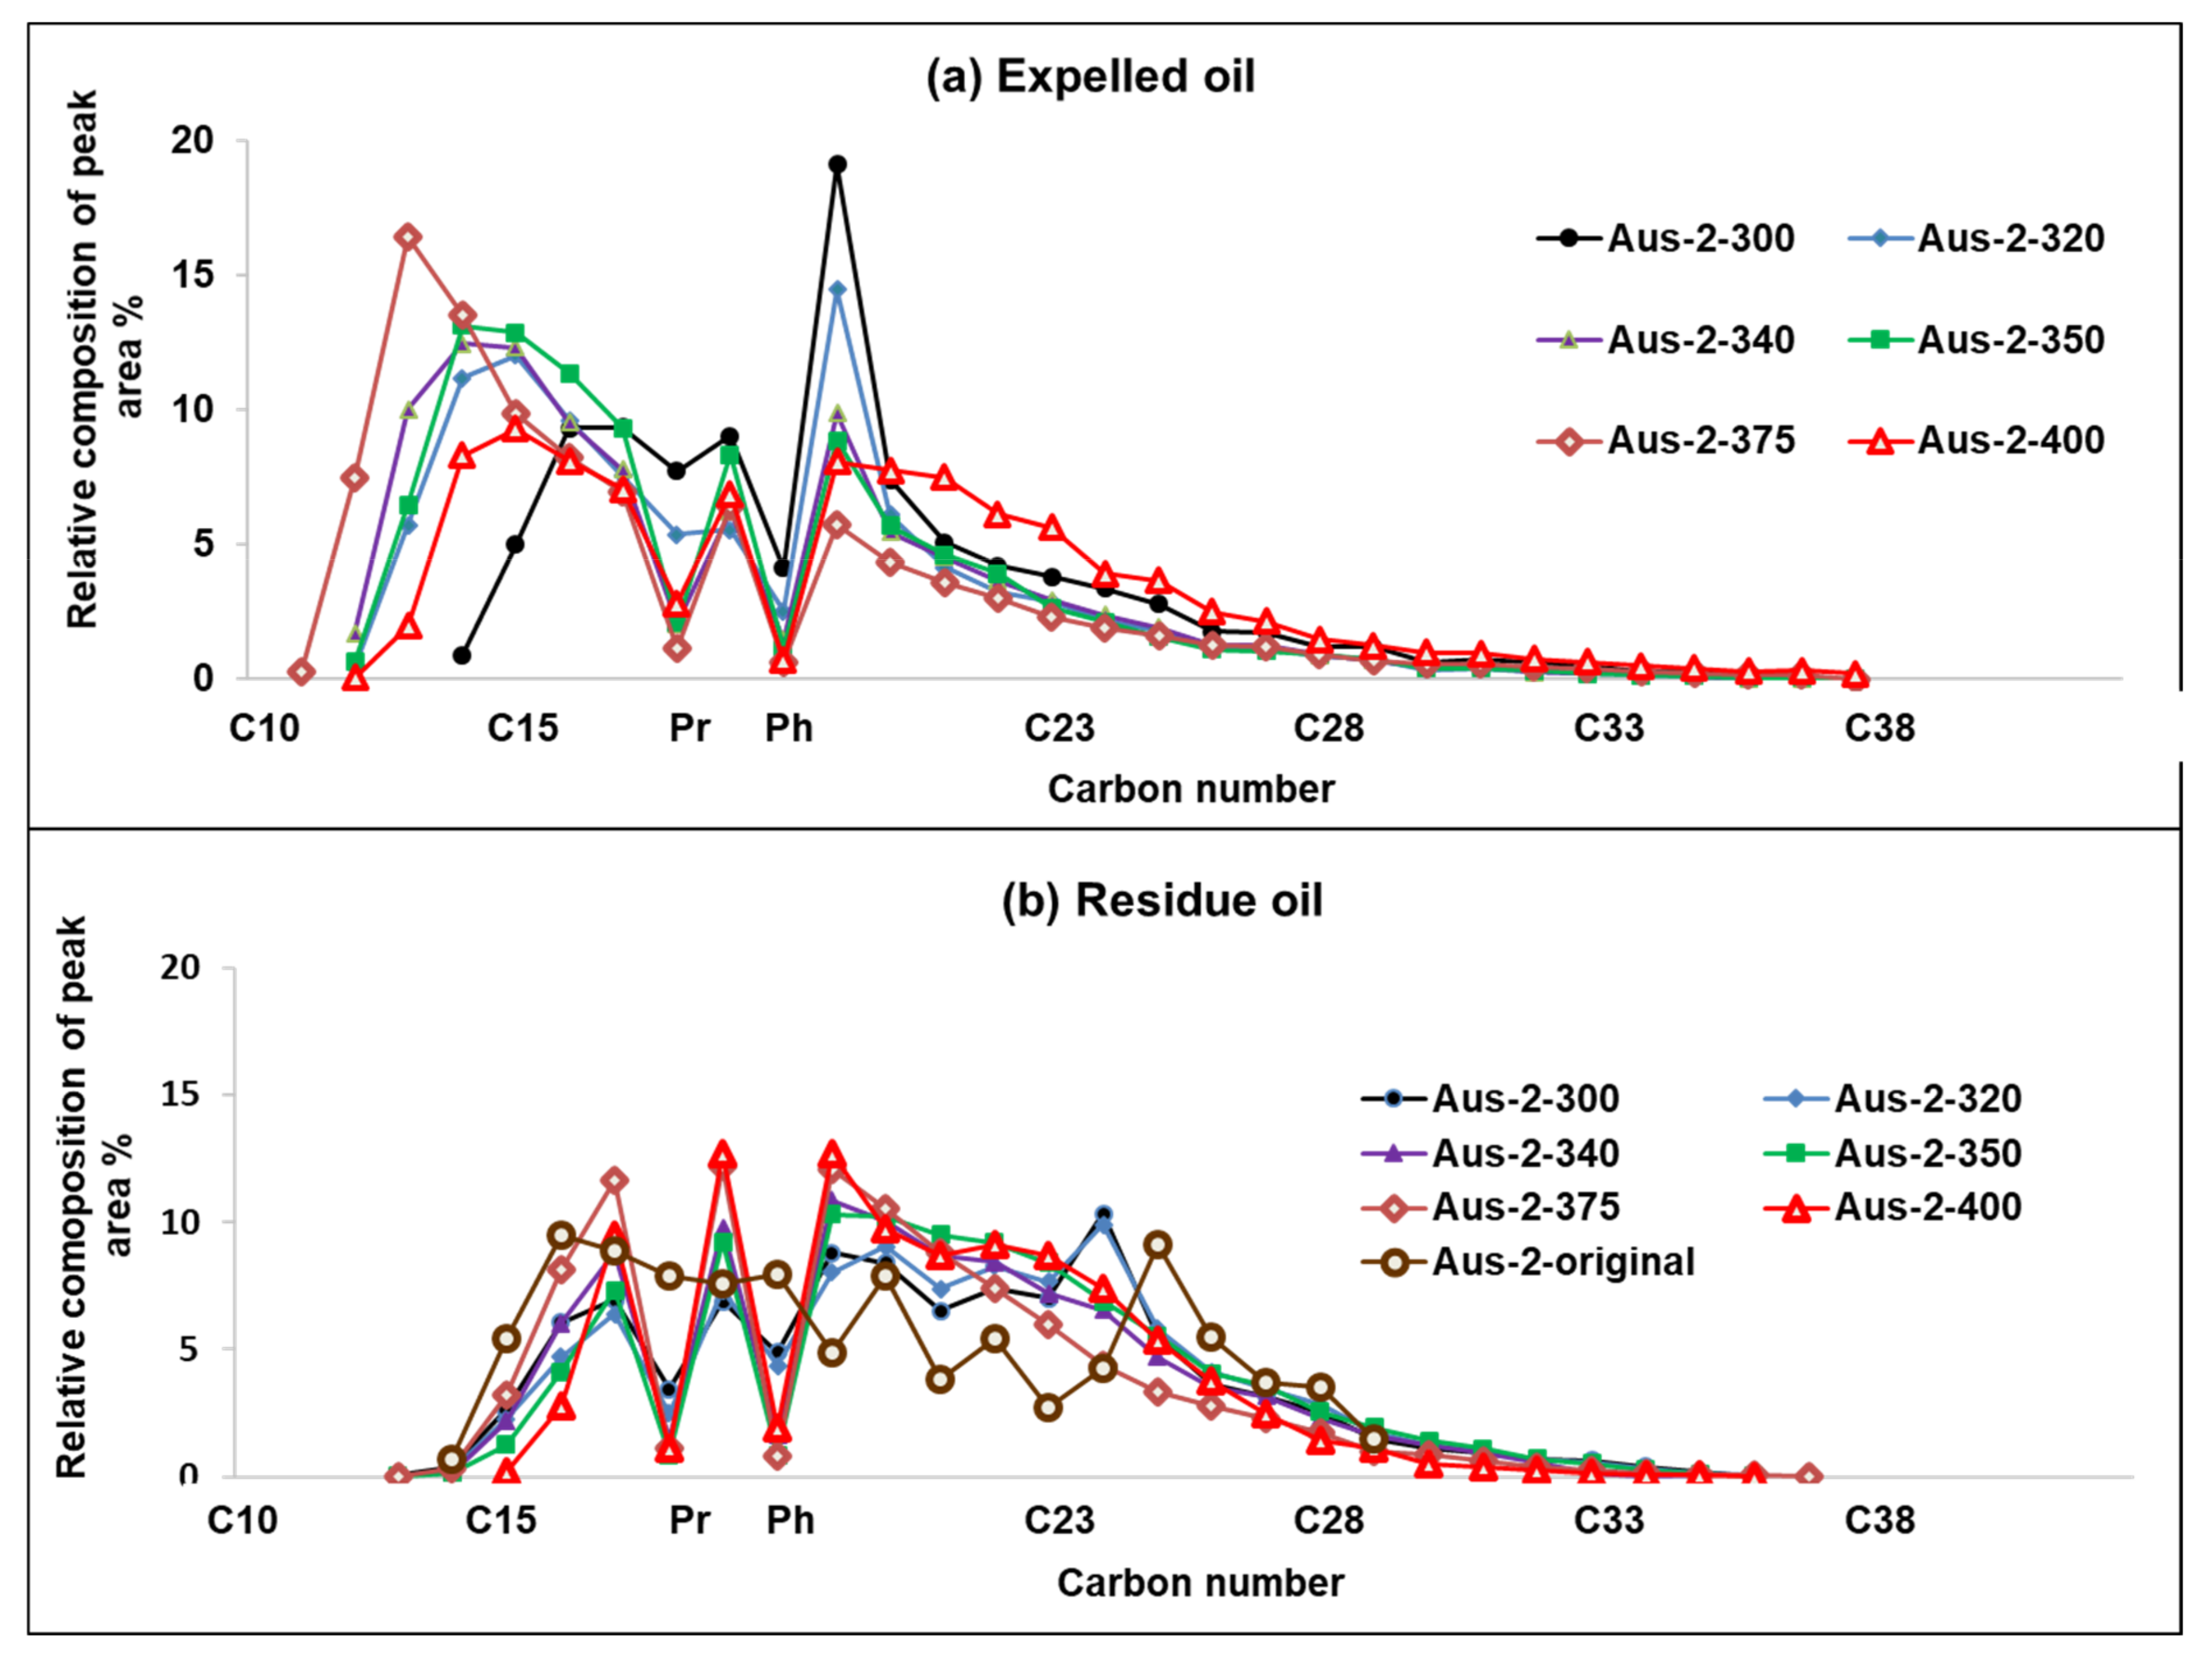
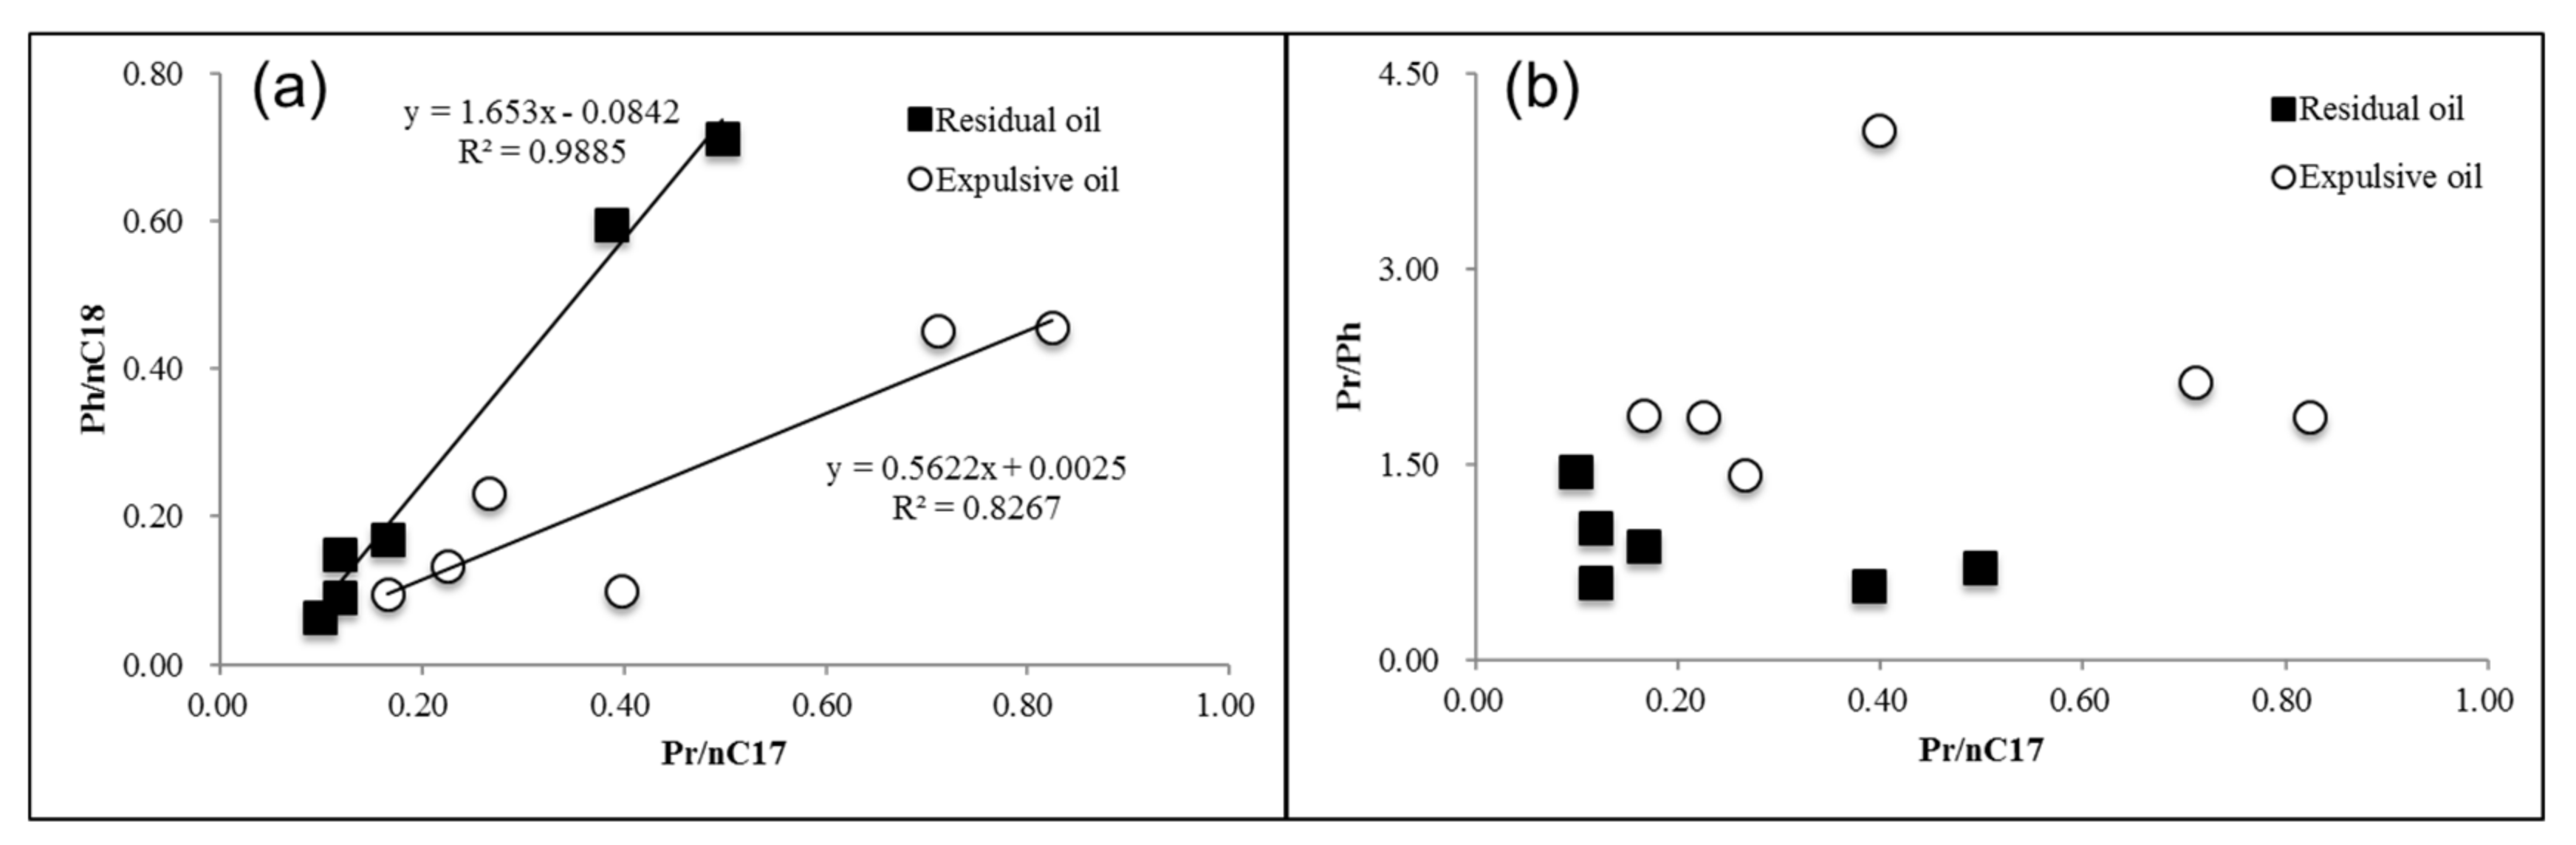
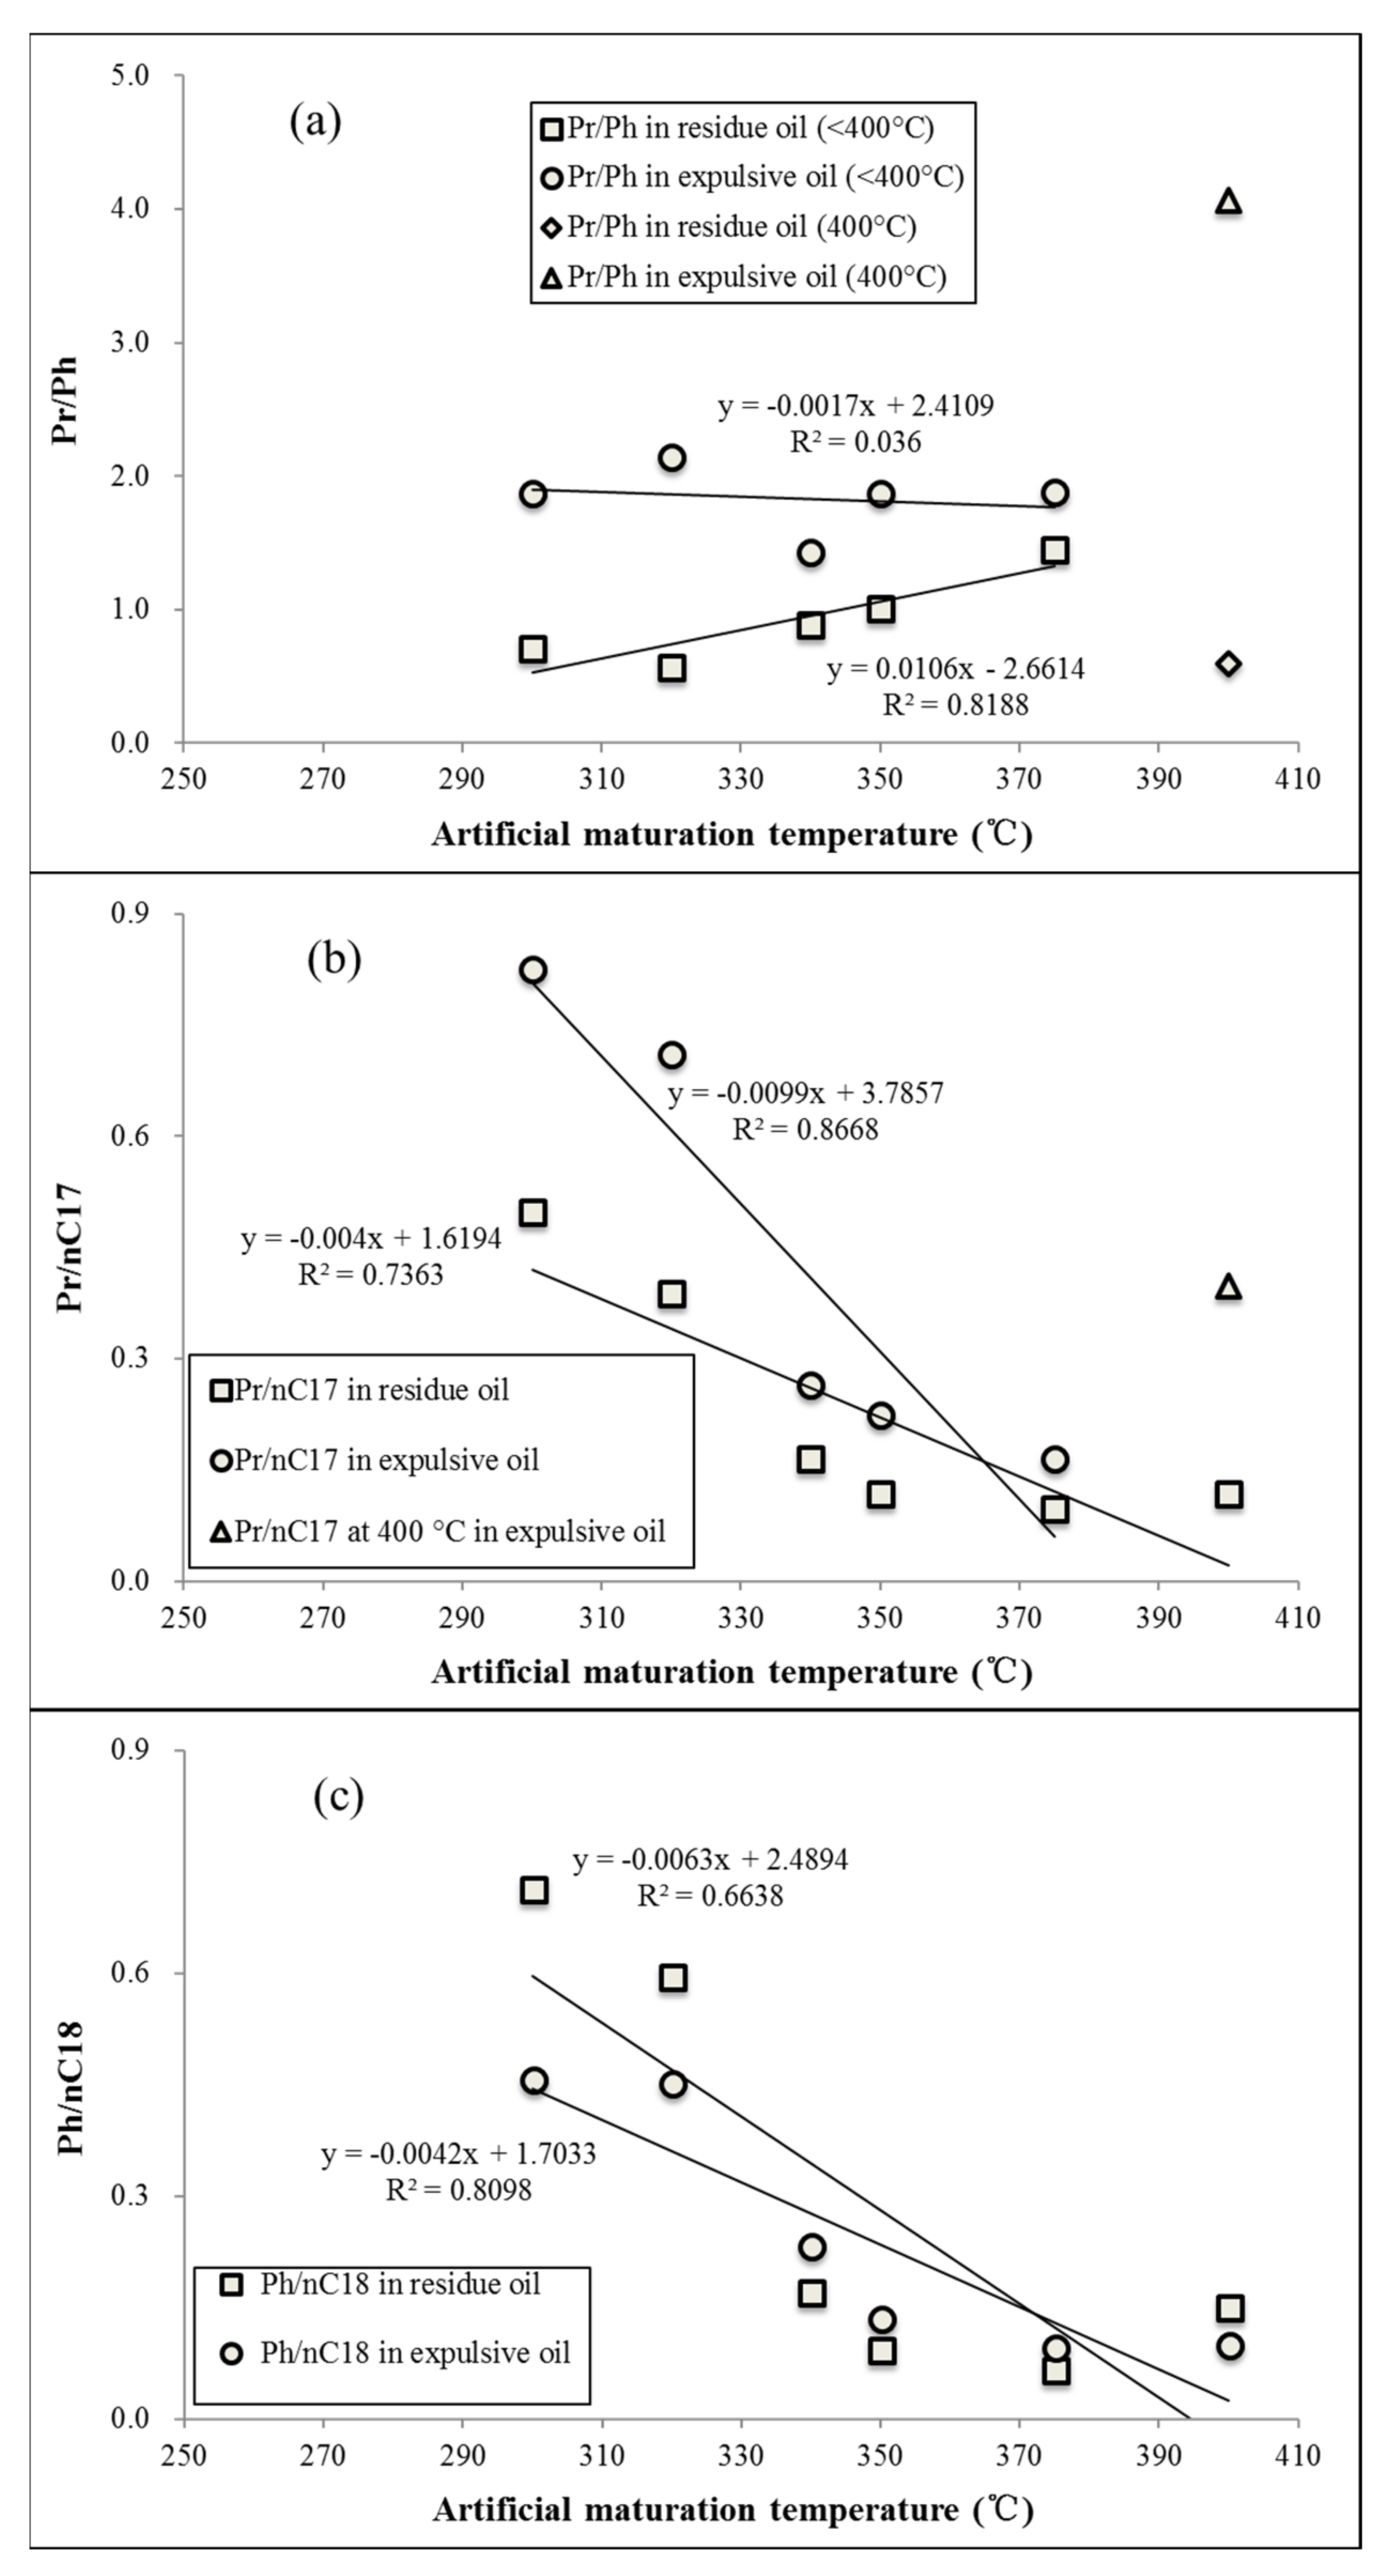
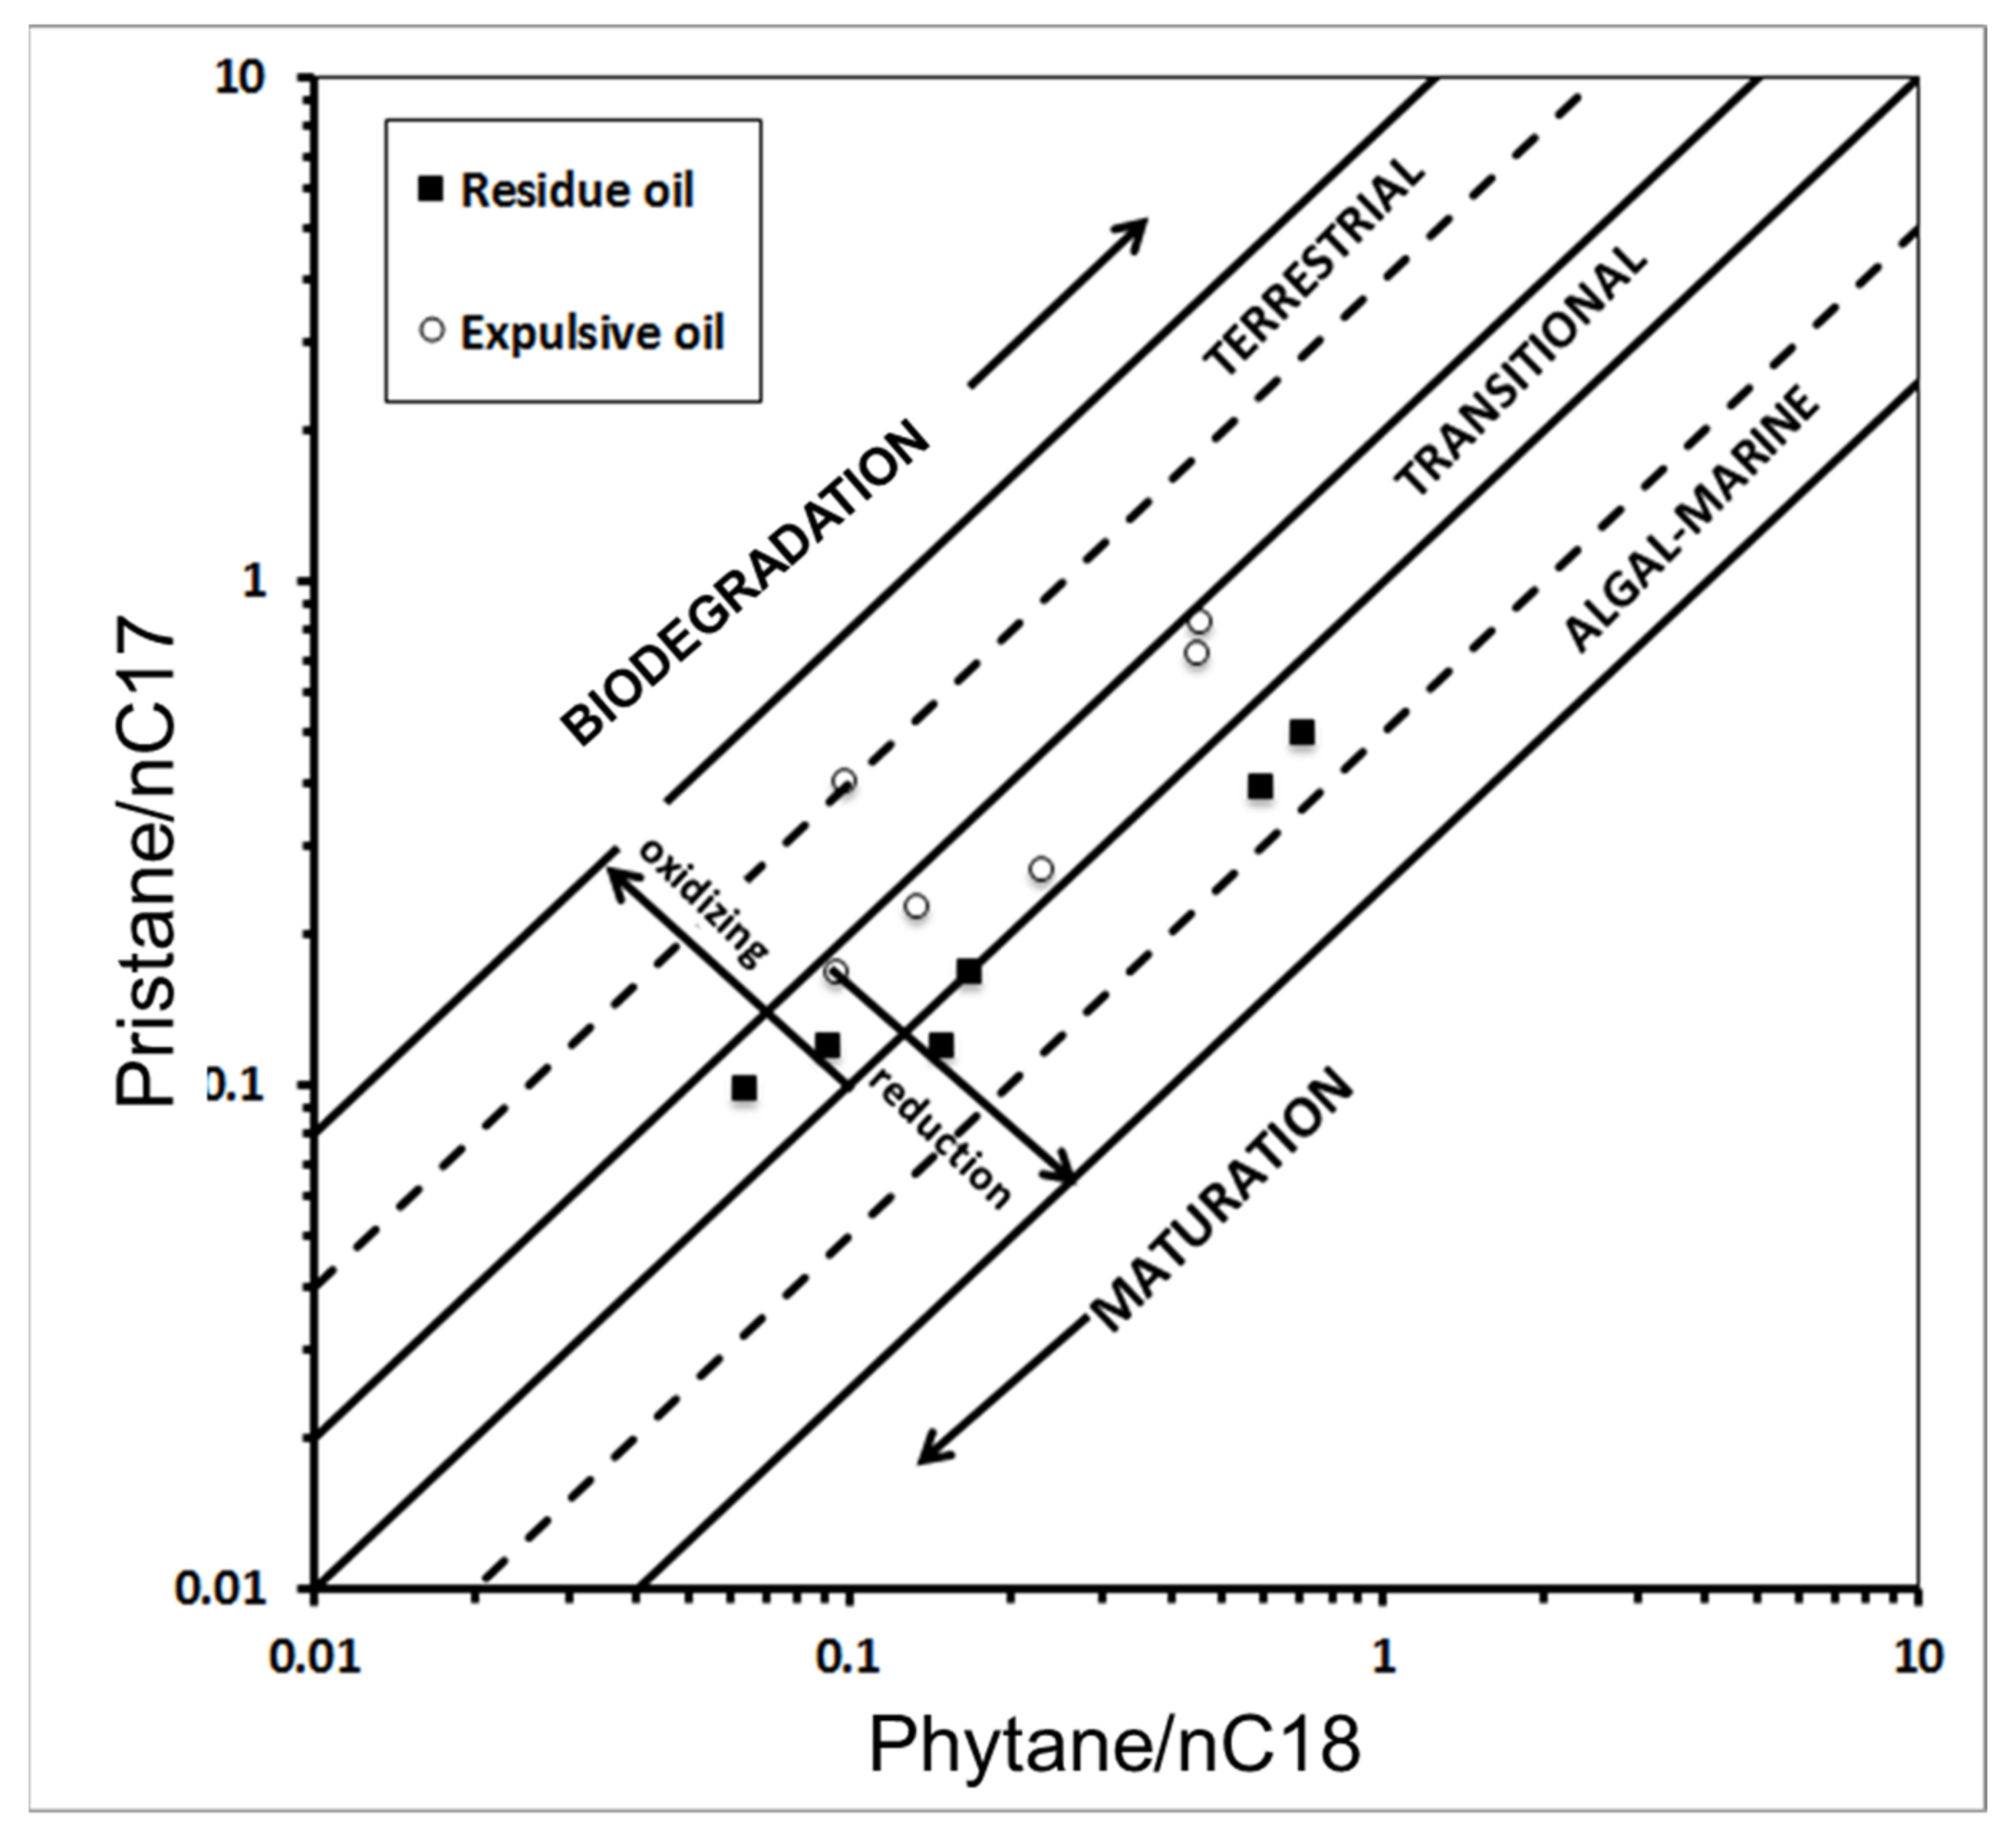
5.3.1. Characterization of Saturated N-Alkanes and Their Environmental Significance
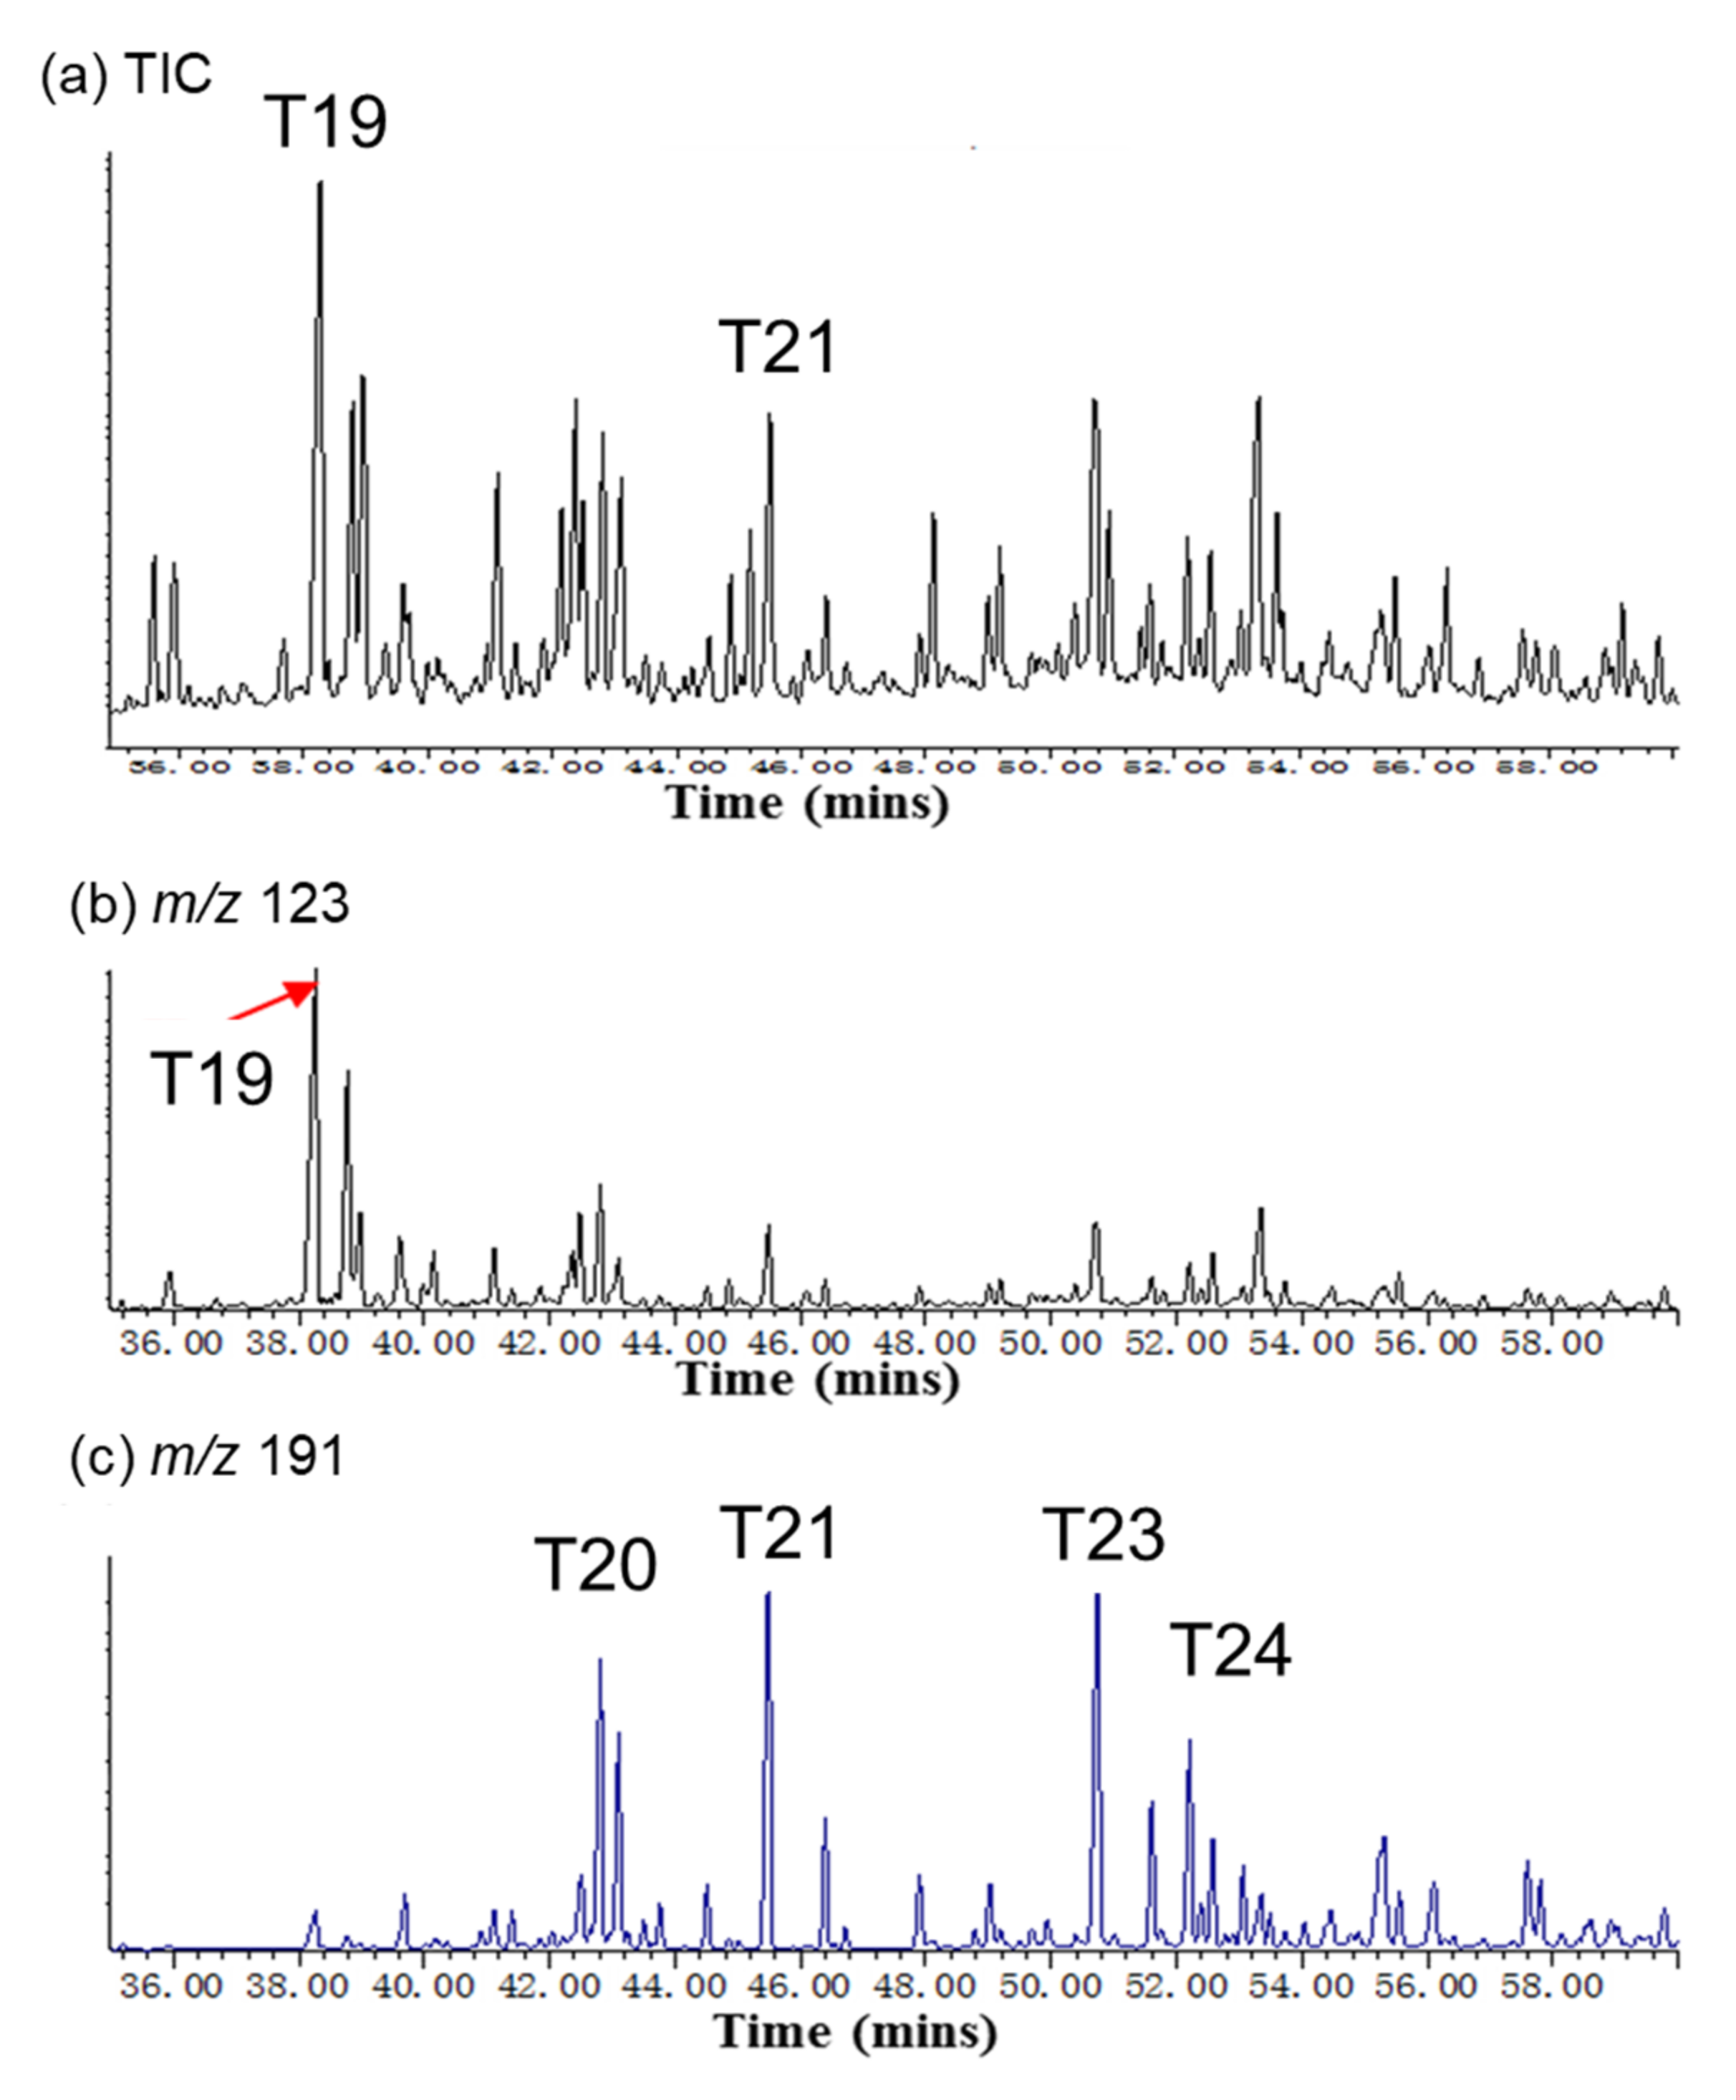
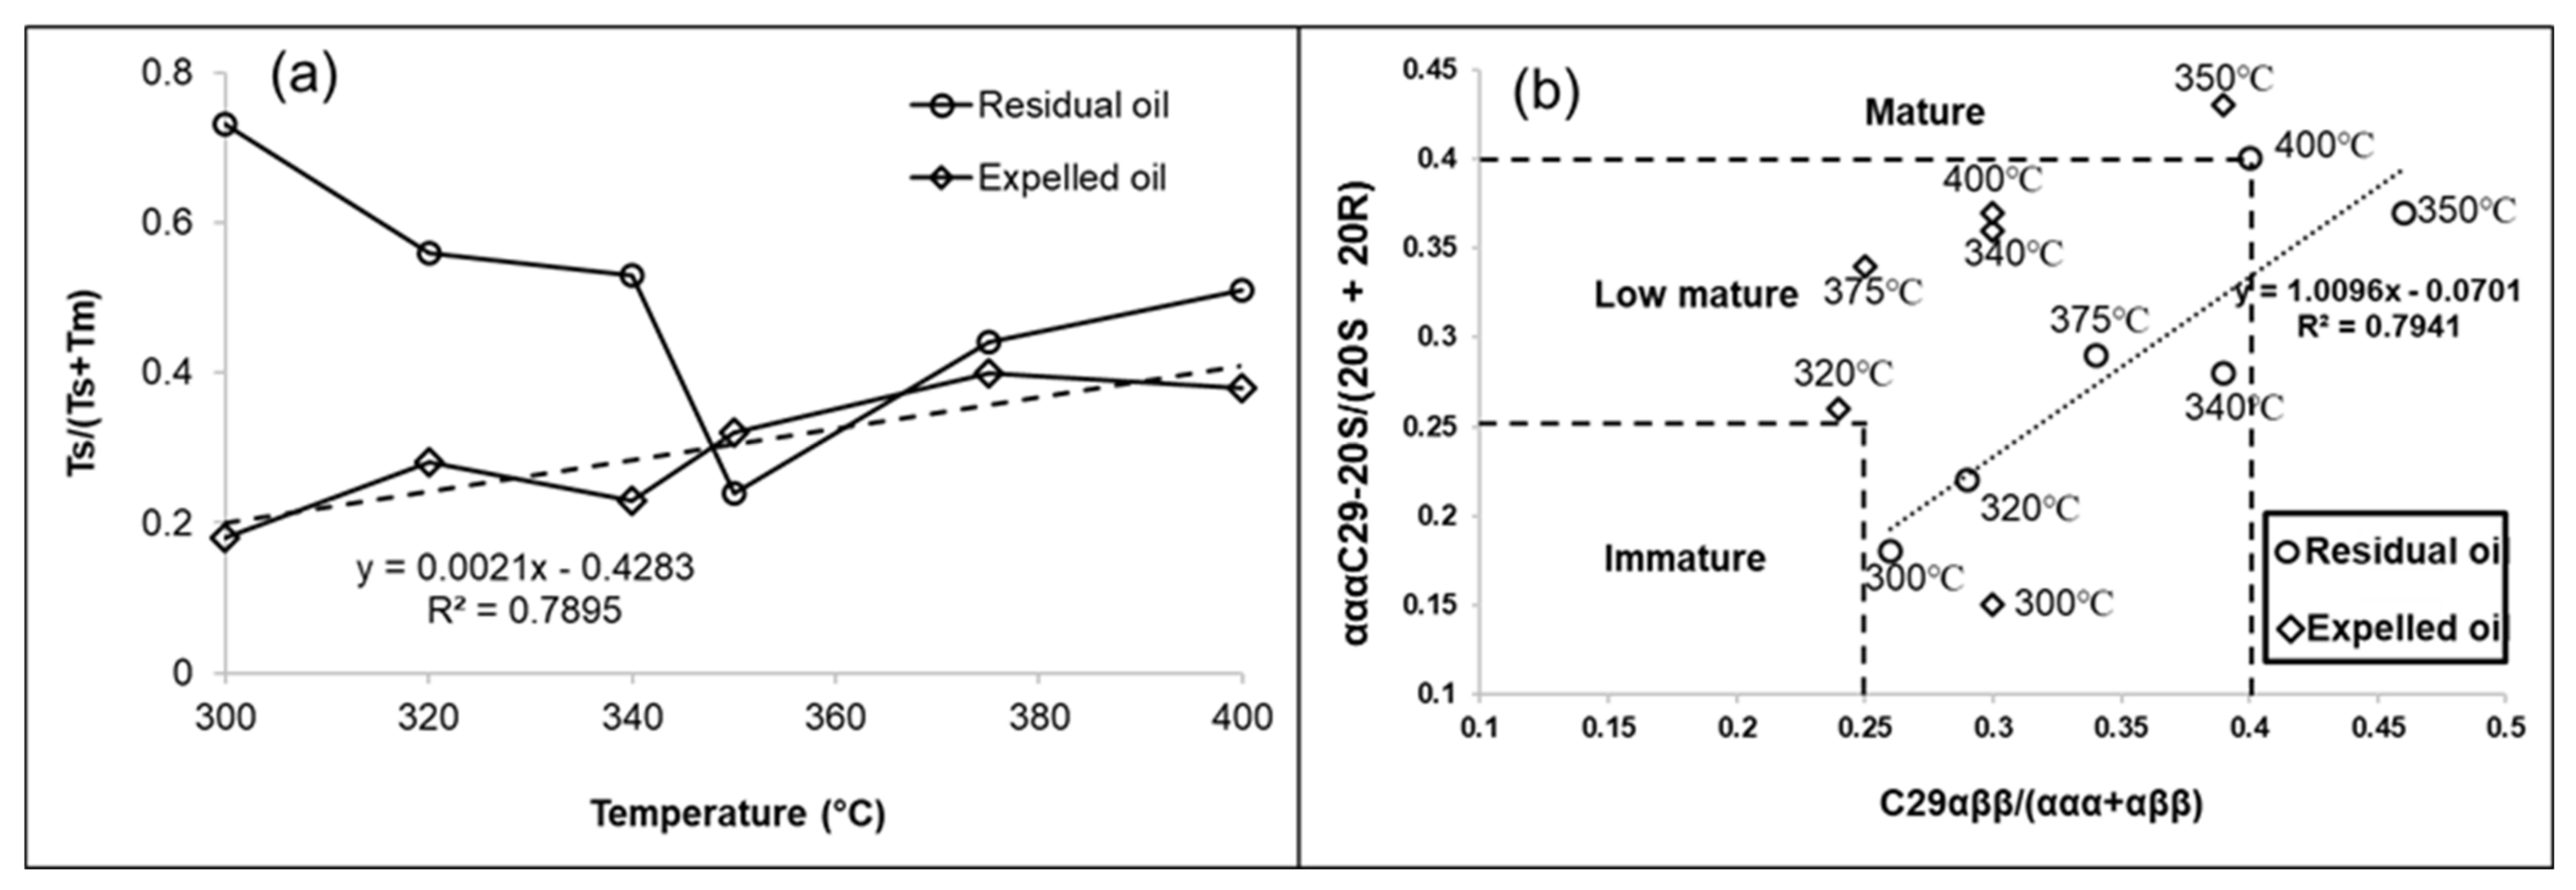
5.3.2. Biomarker Evaluation of Thermal Maturity and Variation with Temperature
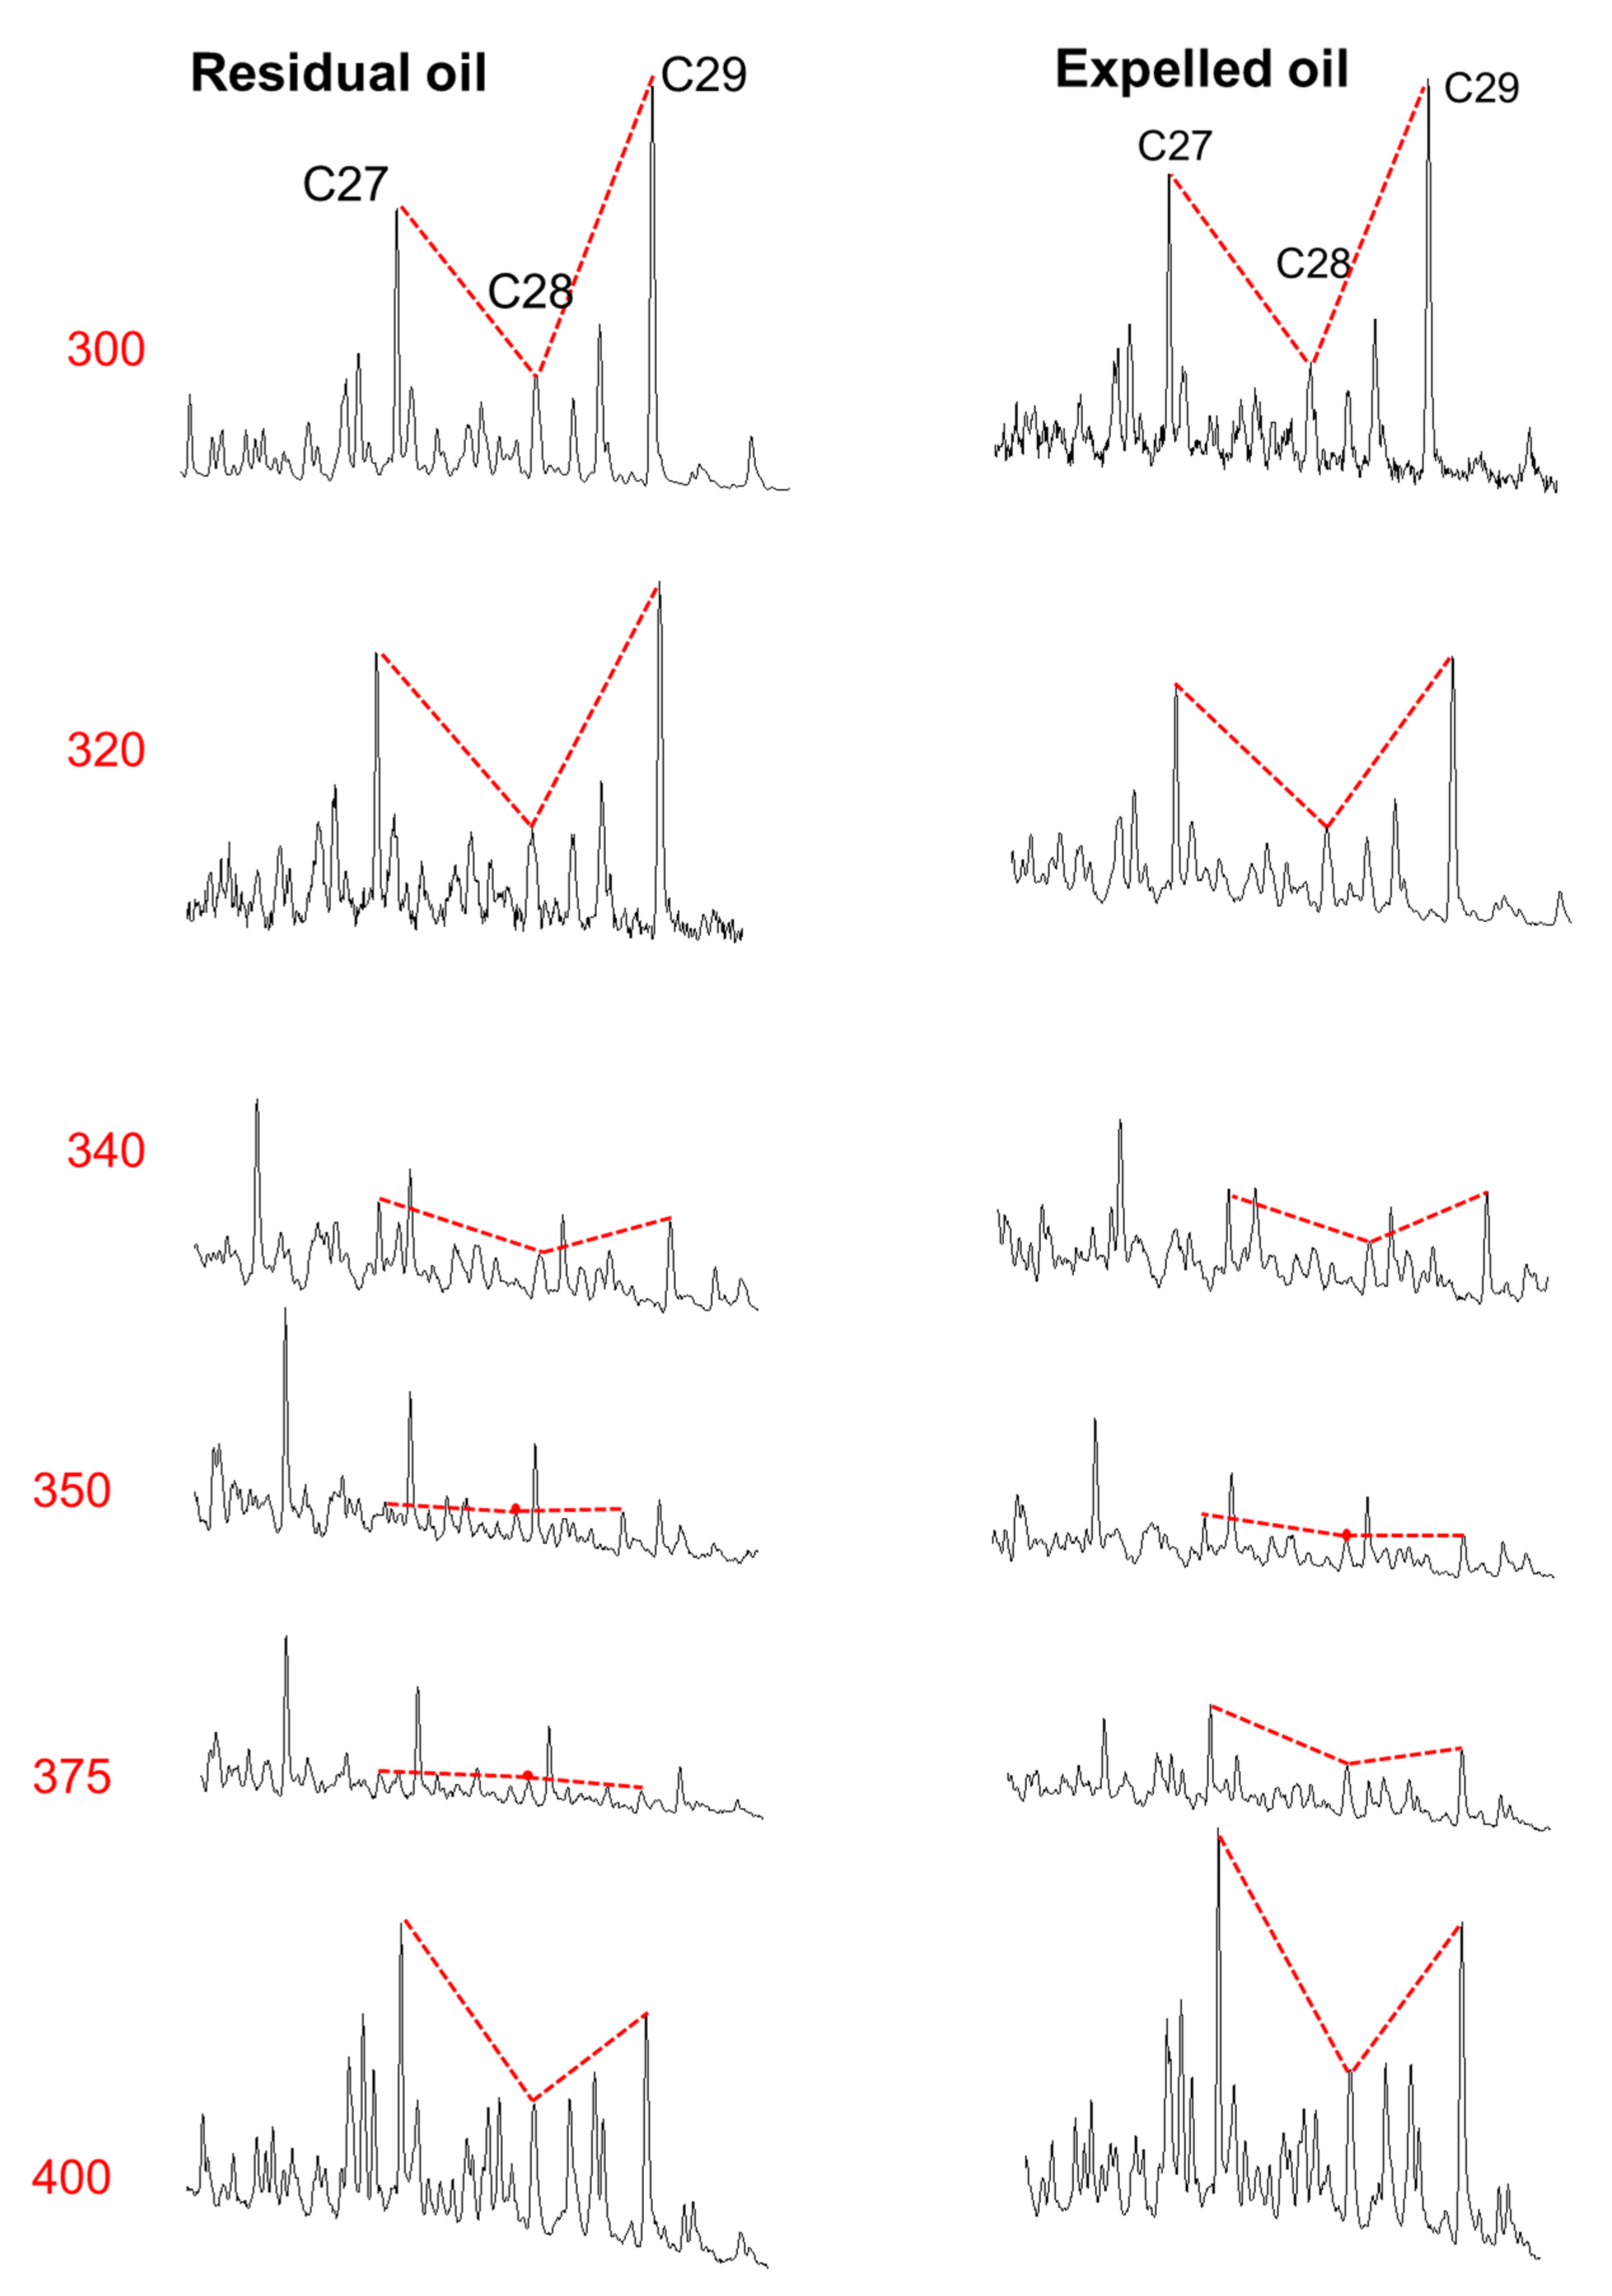
5.3.3. Characterization of C27-, C28-, C29- Steranes and Variation with the Pyrolysis Temperature
6. Conclusions
Author Contributions
Funding
Institutional Review Board Statement
Informed Consent Statement
Acknowledgments
Conflicts of Interest
References
- Peters, K.E.; Moldowan, J.M. The Biomarker Guide: Interpreting Molecular Fossils in Petroleum and Ancient Sediments; Prentice Hall: Hoboken, NJ, USA, 1993. [Google Scholar]
- Balbinot, M.; Kalkreuth, W. Organic geochemistry and petrology of the Gomo Member, Recôncavo Basin, Brazil. Int. J. Coal Geol. 2010, 84, 286–292. [Google Scholar] [CrossRef]
- Tissot, B.P.; Welte, D.H. Petroleum Formation and Occurrence; Springer: Berlin, Germany, 1984. [Google Scholar]
- Hutton, A.C. Petrographic classification of oil shales. Int. J. Coal Geol. 1987, 8, 203–231. [Google Scholar] [CrossRef]
- Hackley, P.C.; Walters, C.C.; Kelemen, S.R.; Mastalerz, M.; Lowers, H.A. Organic petrology and micro-spectroscopy of Tasmanites microfossils: Applications to kerogen transformations in the early oil window. Org. Geochem. 2017, 114, 23–44. [Google Scholar] [CrossRef]
- Volkman, J.K.; Alexander, R.; Kagi, R.I.; Noble, R.A.; Woodhouse, G.W. A geochemical reconstruction of oil generation in the Barrow Sub-basin of Western Australia. Geochim. Cosmochim. Acta 1983, 47, 2091–2105. [Google Scholar] [CrossRef]
- Gelin, F.; Boogers, I.; Noordeloos, A.A.M.; Sinninghe Damsté, J.S.; Hatcher, P.G.; de Leeuw, J.W. Novel, resistant microalgal polyethers: An important sink of organic carbon in the marine environment? Geochim. Cosmochim. Acta 1996, 60, 1275–1280. [Google Scholar] [CrossRef] [Green Version]
- Brocks, J.J.; Buick, R.; Summons, R.E.; Logan, G.A. A reconstruction of Archean biological diversity based on molecular fossils from the 2.78 to 2.45 billion-year-old Mount Bruce Supergroup, Hamersley Basin, Western Australia. Geochim. Cosmochim. Acta 2003, 67, 4321–4335. [Google Scholar] [CrossRef]
- Zhang, M.; Liu, C.L.; Tian, J.X.; Lu, Z.D.; Pang, H.; Zeng, X.; Kong, H.; Yang, S. Geochemical characteristics of crude oil and oil-source correlation in the western Qaidam Basina, China. J. Nat. Gas Geoscienc. 2020, 5, 227–238. [Google Scholar] [CrossRef]
- Peters, K.E.; Walters, C.C.; Moldowan, J.M. The Biomarker Guide: Biomarkers and Isotopes in Petroleum Systems and Earth History, 2nd ed.; Cambridge University Press: Cambridge, UK, 2005; Volume 2. [Google Scholar]
- Peters, K.E.; Hostettler, F.D.; Lorenson, T.D.; Rosenbauer, R.J. Families of Miocene Monterey crude oil, seep, and tarball samples, coastal California. Am. Assoc. Pet. Geol. Bull. 2008, 92, 1131–1152. [Google Scholar] [CrossRef]
- Boreham, C.J.; Hope, J.M.; Jackson, P.; Davenport, R.; Earl, K.L.; Edwards, D.S.; Logan, G.A.; Krassay, A.A. Gas-oil-source correlations in the Otway Basin southern Australia. In Proceedings of the PESA Eastern Australasian Basins Symposium II, Adelaide, Australia, 19–22 September 2004; pp. 603–627. [Google Scholar]
- Grice, K.; Schouten, S.; Blokker, P.; Derenne, S.; Largeau, C.; Nissenbaum, A.; Sinninghe Damsté, J. Structural and isotopic analysis of kerogens in sediments rich in free sulfurised Botryococcus braunii biomarkers. Org. Geochem. 2003, 34, 471–482. [Google Scholar] [CrossRef]
- Xie, X.M.; Volkman, J.K.; Qin, J.Z.; Borjigin, T.; Bian, L.Z.; Zhen, L.J. Petrology and hydrocarbon potential of microalgal and macroalgal dominated oil shales from the Eocene Huadian Formation, NE China. Int. J. Coal Geol. 2014, 124, 36–47. [Google Scholar] [CrossRef]
- Hutton, A.C. Organic petrography of oil shales. In Composition, Geochemistry and Conversion of Oil Shales; Kluwer Academic Publishers, Springer: Dordrecht, The Netherlands, 1995. [Google Scholar]
- Xie, X.M.; Li, M.W.; Xu, J.; Snowdon, L.R.; Volkman, J.K. Geochemical characterization and artificial thermal maturation of kerogen density fractions from the Eocene Huadian oil shale, NE China. Org. Geochem. 2020, 144, 103947. [Google Scholar] [CrossRef]
- Xie, X.M.; Snowdon, L.; Volkman, J.; Li, M.W.; Xu, J.; Qin, J.Z. Inter-maceral effects on hydrocarbon generation as determined using artificial mixtures of purified macerals. Org. Geochem. 2020, 144, 104036. [Google Scholar] [CrossRef]
- Piedad-Sánchez, N.; Martínez, L.; Izart, A.; Suárez-Ruiz, I.; Elie, M.; Menetrier, C. Artificial maturation of a high volatile bituminous coal from Asturias (NW Spain) in a confined pyrolysis system Part I: Petrographic, geochemical and molecular studies. J. Anal. Appl. Pyrolysis 2005, 74, 61–76. [Google Scholar] [CrossRef]
- Reid, C.M.; Burrett, C.F. The geology and hydrocarbon potential of the glaciomarine Lower Parmeener Supergroup, Tasmania Basin. In Proceedings of the PESA Eastern Australasian Basins Symposium II, Adelaide, Australia, 19–22 September 2004; pp. 19–22. [Google Scholar]
- Revill, A.T.; Volkman, J.K.; O’Leary, T.; Summons, R.E. Aromatic hydrocarbon biomarkers in tasmanite oil shales from Tasmania, Australia. In Organic Geochemistry. Poster Sessions from the 16th International Meeting on Organic Geochemistry, Stavanger, 1993; Øygard, K., Ed.; Falch Hurtigtrykk: Stavanger, Norway, 1993; pp. 3–6. [Google Scholar]
- Revill, A.T.; Volkman, J.K.; O’Leary, T.; Summons, R.E.; Boreham, C.J.; Banks, M.R.; Denwer, K. Hydrocarbon biomarkers, thermal maturity, and depositional setting of tasmanite oil shales from Tasmania, Australia. Geochim. Cosmochim. Acta 1994, 58, 3803–3822. [Google Scholar] [CrossRef]
- Xie, X.; Borjigin, T.; Zhang, Q.; Zhang, Z.; Qin, J.; Bian, L.; Volkman, J.K. Intact microbial fossils in the Permian Lucaogou Formation oil shale, Junggar Basin, NW China. Int. J. Coal Geol. 2015, 146, 166–178. [Google Scholar] [CrossRef]
- Xie, X.; Li, M.; Littke, R.; Huang, Z.; Ma, X.; Jiang, Q.; Snowdon, L.R. Petrographic and geochemical characterization of microfacies in a lacustrine shale oil system in the Dongying Sag, Jiyang Depression, Bohai Bay Basin, eastern China. Int. J. Coal Geol. 2016, 165, 49–63. [Google Scholar] [CrossRef]
- Behar, F.; Beaumont, V.; De BPenteado, H.L. Rock-Eval 6 Technology: Performances and developments. Oil Gas Sci. Technol. 2001, 56, 111–134. [Google Scholar] [CrossRef]
- Liu, W.; Wang, J.; Tenger Qin, J.; Zheng, L. Stable carbon isotopes of gaseous alkanes as genetic indicators inferred from laboratory pyrolysis experiments of various marine hydrocarbon source materials from southern China. Sci. China Earth Sci. 2012, 55, 966–974. [Google Scholar] [CrossRef]
- Mohnhoff, D.; Littke, R.; Krooss, B.M.; Weniger, P. Flow-through extraction of oil and gas shales under controlled stress using organic solvents: Implications for organic matter-related porosity and permeability changes with thermal maturity. Int. J. Coal Geol. 2016, 157, 84–99. [Google Scholar] [CrossRef]
- Newton, E.T. On “Tasmanite” and Australian “White Coal”. Geol. Mag. 1970, 8, 337–342. [Google Scholar] [CrossRef] [Green Version]
- Guy-Ohlson, D.; Boalch, G.T. Comparative morphology of the genus Tasmanites (Pterospermales, Chlorophyta). Phycologia 1992, 31, 523–528. [Google Scholar] [CrossRef]
- Cook, A.C. Organic Petrology of Some Core Samples from the Permian of Tasmania; Unpublished report; Keiraville Konsultants Pty. Ltd.: Keiraville, NSW, Australia, 2003. [Google Scholar]
- Domack, E.W.; Burkley, L.A.; Domack, C.R.; Banks, M.R. Facies analysis of glacial marine pebbly mudstones in the Tasmania Basin: Implications for regional paleoclimates during the late Paleozoic. In Gondwana Eight: Assembly, Evolution and Dispersal; Findlay, R.H., Unrug, R., Banks, M.R., Veevers, J.J., Eds.; A.A. Balkema: Rotterdam, The Netherlands, 1993; pp. 471–484. [Google Scholar]
- Cook, A.C.; Sherwood, N.R. Classification of oil shales, coals and other organic-rich rocks. Org. Geochem. 1991, 17, 211–222. [Google Scholar] [CrossRef]
- Lückge, A.; Boussafir, M.; Lallier-Vergès, E.; Littke, R. Comparative study of organic matter preservation in immature sediments along the continental margins of Peru and Oman. Part I: Results of petrographical and bulk geochemical data. Org. Geochem. 1996, 24, 437–451. [Google Scholar]
- Azevedo, D.A.; Aquino Neto, F.R.; Simoneit, B.R.T.; Pinto, A.C. Novel series of tricyclic aromatic terpanes characterized in Tasmanian tasmanite. Org. Geochem. 1992, 18, 9–16. [Google Scholar] [CrossRef]
- Greenwood, P.F.; Arouri, K.R.; George, S.C. Tricyclic terpenoid composition of Tasmanites kerogen as determined by pyrolysis GC-MS. Geochim. Cosmochim. Acta 2000, 64, 1249–1263. [Google Scholar] [CrossRef]
- Wilhelms, A.; Larter, S. Shaken but not always stirred. Impact of petroleum charge mixing on reservoir geochemistry. In Understanding Petroleum Reservoirs: Towards an Integrated Reservoir Engineering and Geochemical Approach; Cubitt, J.M., England, W.A., Larter, S., Eds.; Special Publications; Geological Society: London, UK, 2004; pp. 27–35. [Google Scholar]
- Aquino Neto, F.R.; Trendel, J.M.; Restle, A.; Connan, J.; Albrecht, P.A. Occurrence and formation of tricyclic and tetracyclic terpanes in sediments and petroleums. In Advances in Organic Geochemistry 1981; Bjorøy, M., European Association of Organic Geochemists, Eds.; Wiley: Hoboken, NJ, USA, 1983; pp. 659–667. [Google Scholar]
- Powell, T.G.; McKirdy, D.M. Relationship between ratio of pristane to phytane, crude oil composition and geological environment in Australia. Nature 1973, 243, 37–39. [Google Scholar] [CrossRef]
- Ten Haven, H.L.; de Leeuw, J.W.; Rullkötter, J. Restricted utility of the pristane/phytane ratio as a palaeoenvironmental indicator. Nature 1987, 330, 641–643. [Google Scholar] [CrossRef] [Green Version]
- Requejo, A.G. Maturation of petroleum source rocks—II. Quantitative changes in extractable hydrocarbon content and composition associated with hydrocarbon generation. Org. Geochem. 1994, 21, 91–105. [Google Scholar]
- Farrimond, P.; Bevan, J.C.; Bishop, A.N. Tricyclic terpane maturity parameters: Response to heating by an igneous intrusion. Org. Geochem. 1999, 30, 1011–1019. [Google Scholar] [CrossRef]
- Böcker, J.; Littke, R.; Hartkopf-Fröder, C.; Jasper, K.; Schwarzbauer, J. Organic geochemistry of Duckmantian (Pennsylvanian) coals from the Ruhr Basin, western Germany. Int. J. Coal Geol. 2013, 107, 112–126. [Google Scholar] [CrossRef]
- Fang, R.H.; Littke, R.; Zieger, L.; Baniasad, A.; Li, M.J.; Schwarzbauer, J. Changes of composition and content of tricyclic terpane, hopane, sterane, and aromatic biomarkers throughout the oil window: A detailed study on maturity parameters of Lower Toarcian Posidonia Shale of Hils Syncline, NW Germany. Org. Geochem. 2019, 138, 1–19. [Google Scholar] [CrossRef]
- Farrimond, P.; Taylor, A.; Telnæs, N. Biomarker maturity parameters: The role of generation and thermal degradation. Org. Geochem. 1998, 29, 1181–1197. [Google Scholar] [CrossRef]
- Mißbach, H.; Duda, J.P.; Lünsdorf, N.K.; Schmidt, B.C.; Thiel, V. Testing the preservation of biomarkers during experimental maturation of an immature kerogen. Int. J. Astrobiol. 2016, 15, 165–175. [Google Scholar] [CrossRef]
- Huang, D.F.; Li, J.C.; Zhang, D.J.; Huang, X.M.; Zhou, Z.H. Maturation sequence of Tertiary crude oils in the Qaidam Basin and its significance in petroleum resource assessment. J. Southeast Asian Earth Sci. 1991, 5, 359–366. [Google Scholar]
- Schwark, L.; Empt, P. Sterane biomarkers as indicators of Palaeozoic algal evolution and extinction events. Palaeogeogr. Palaeoclimatol. Palaeoecol. 2006, 240, 225–236. [Google Scholar] [CrossRef]
- Asemani, M.; Rabbani, A.R.; Sarafdokht, H. Origin, geochemical characteristics and filling pathways in the Shadegan oil field, Dezful Embayment, SW Iran. J. Afr. Earth Sci. 2021, 174, 104047. [Google Scholar] [CrossRef]
- Huang, W.Y.; Meinschein, W.G. Sterols as ecological indicators. Geochim. Et Cosmochim. Acta 1979, 43, 739–745. [Google Scholar] [CrossRef]
- Gibb, S.W.; Cummings, D.G.; Irigoien, X.; Barlow, R.G.; Mantoura, C. Phytoplankton pigment chemotaxonomy of the northeastern Atlantic. Deep Sea Res. Part II 2001, 48, 795–823. [Google Scholar] [CrossRef]
- Zhang, Y.; Jiang, A.; Sun, Y.; Xie, L.; Chai, P. Stable carbon isotope compositions of isoprenoid chromans in Cenozoic saline lacustrine source rocks from the Western Qaidam Basin, NW China: Source implications. Chin. Sci. Bull. 2012, 57, 1013–1102. [Google Scholar] [CrossRef] [Green Version]
- Volkman, J.K. A review of sterol markers for marine and terrigenous organic matter. Org. Geochem. 1986, 9, 83–99. [Google Scholar] [CrossRef]
- Moldowan, J.M.; Seifert, W.K.; Gallegos, E.J. Relationship between petroleum composition and depositional environment of petroleum source rocks. Am. Assoc. Pet. Geol. Bull. 1985, 69, 1255–1268. [Google Scholar]
- Hatem, B.A.; Abdullah, W.H.; Hakimi, M.H.; Mustapha, K.A. Origin of organic matter and paleoenvironment conditions of the Late Jurassic organic-rich shales from Shabwah sub-basin (western Yemen): Constraints from petrology and biological markers. Mar. Pet. Geol. 2016, 72, 83–97. [Google Scholar] [CrossRef]
- Snowdon, L.R.; Volkman, J.K.; Zhang, Z.; Tao, G.; Liu, P. The organic geochemistry of asphaltenes and occluded biomarkers. Org. Geochem. 2016, 91, 3–15. [Google Scholar] [CrossRef]


| Sample | Lithology | S1 | S2 | Tmax | TOC | HI | OI | δ13Ckerogen (‰) |
|---|---|---|---|---|---|---|---|---|
| AUS-1 | Oil shale | 2.9 | 112.3 | 438 | 12.26 | 929 | 10 | |
| AUS-2 | Oil shale | 1.03 | 60.2 | 440 | 6.58 | 909 | 9 | –14.0 |
| AUS-3 | Mudstone | 0.02 | 1.9 | 437 | 0.71 | 262 | 31 | |
| AUS-4 | Mudstone | 0.02 | 1.5 | 429 | 1.04 | 144 | 12 |
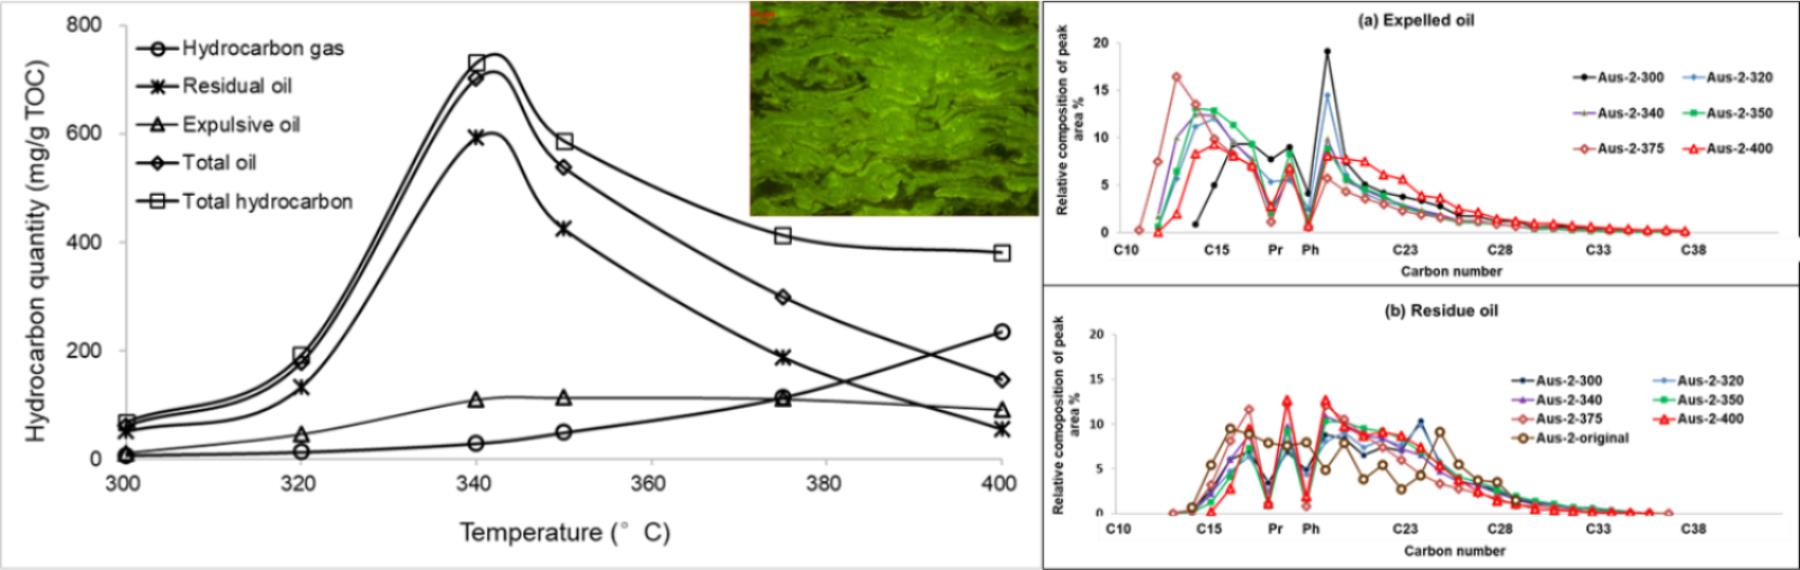
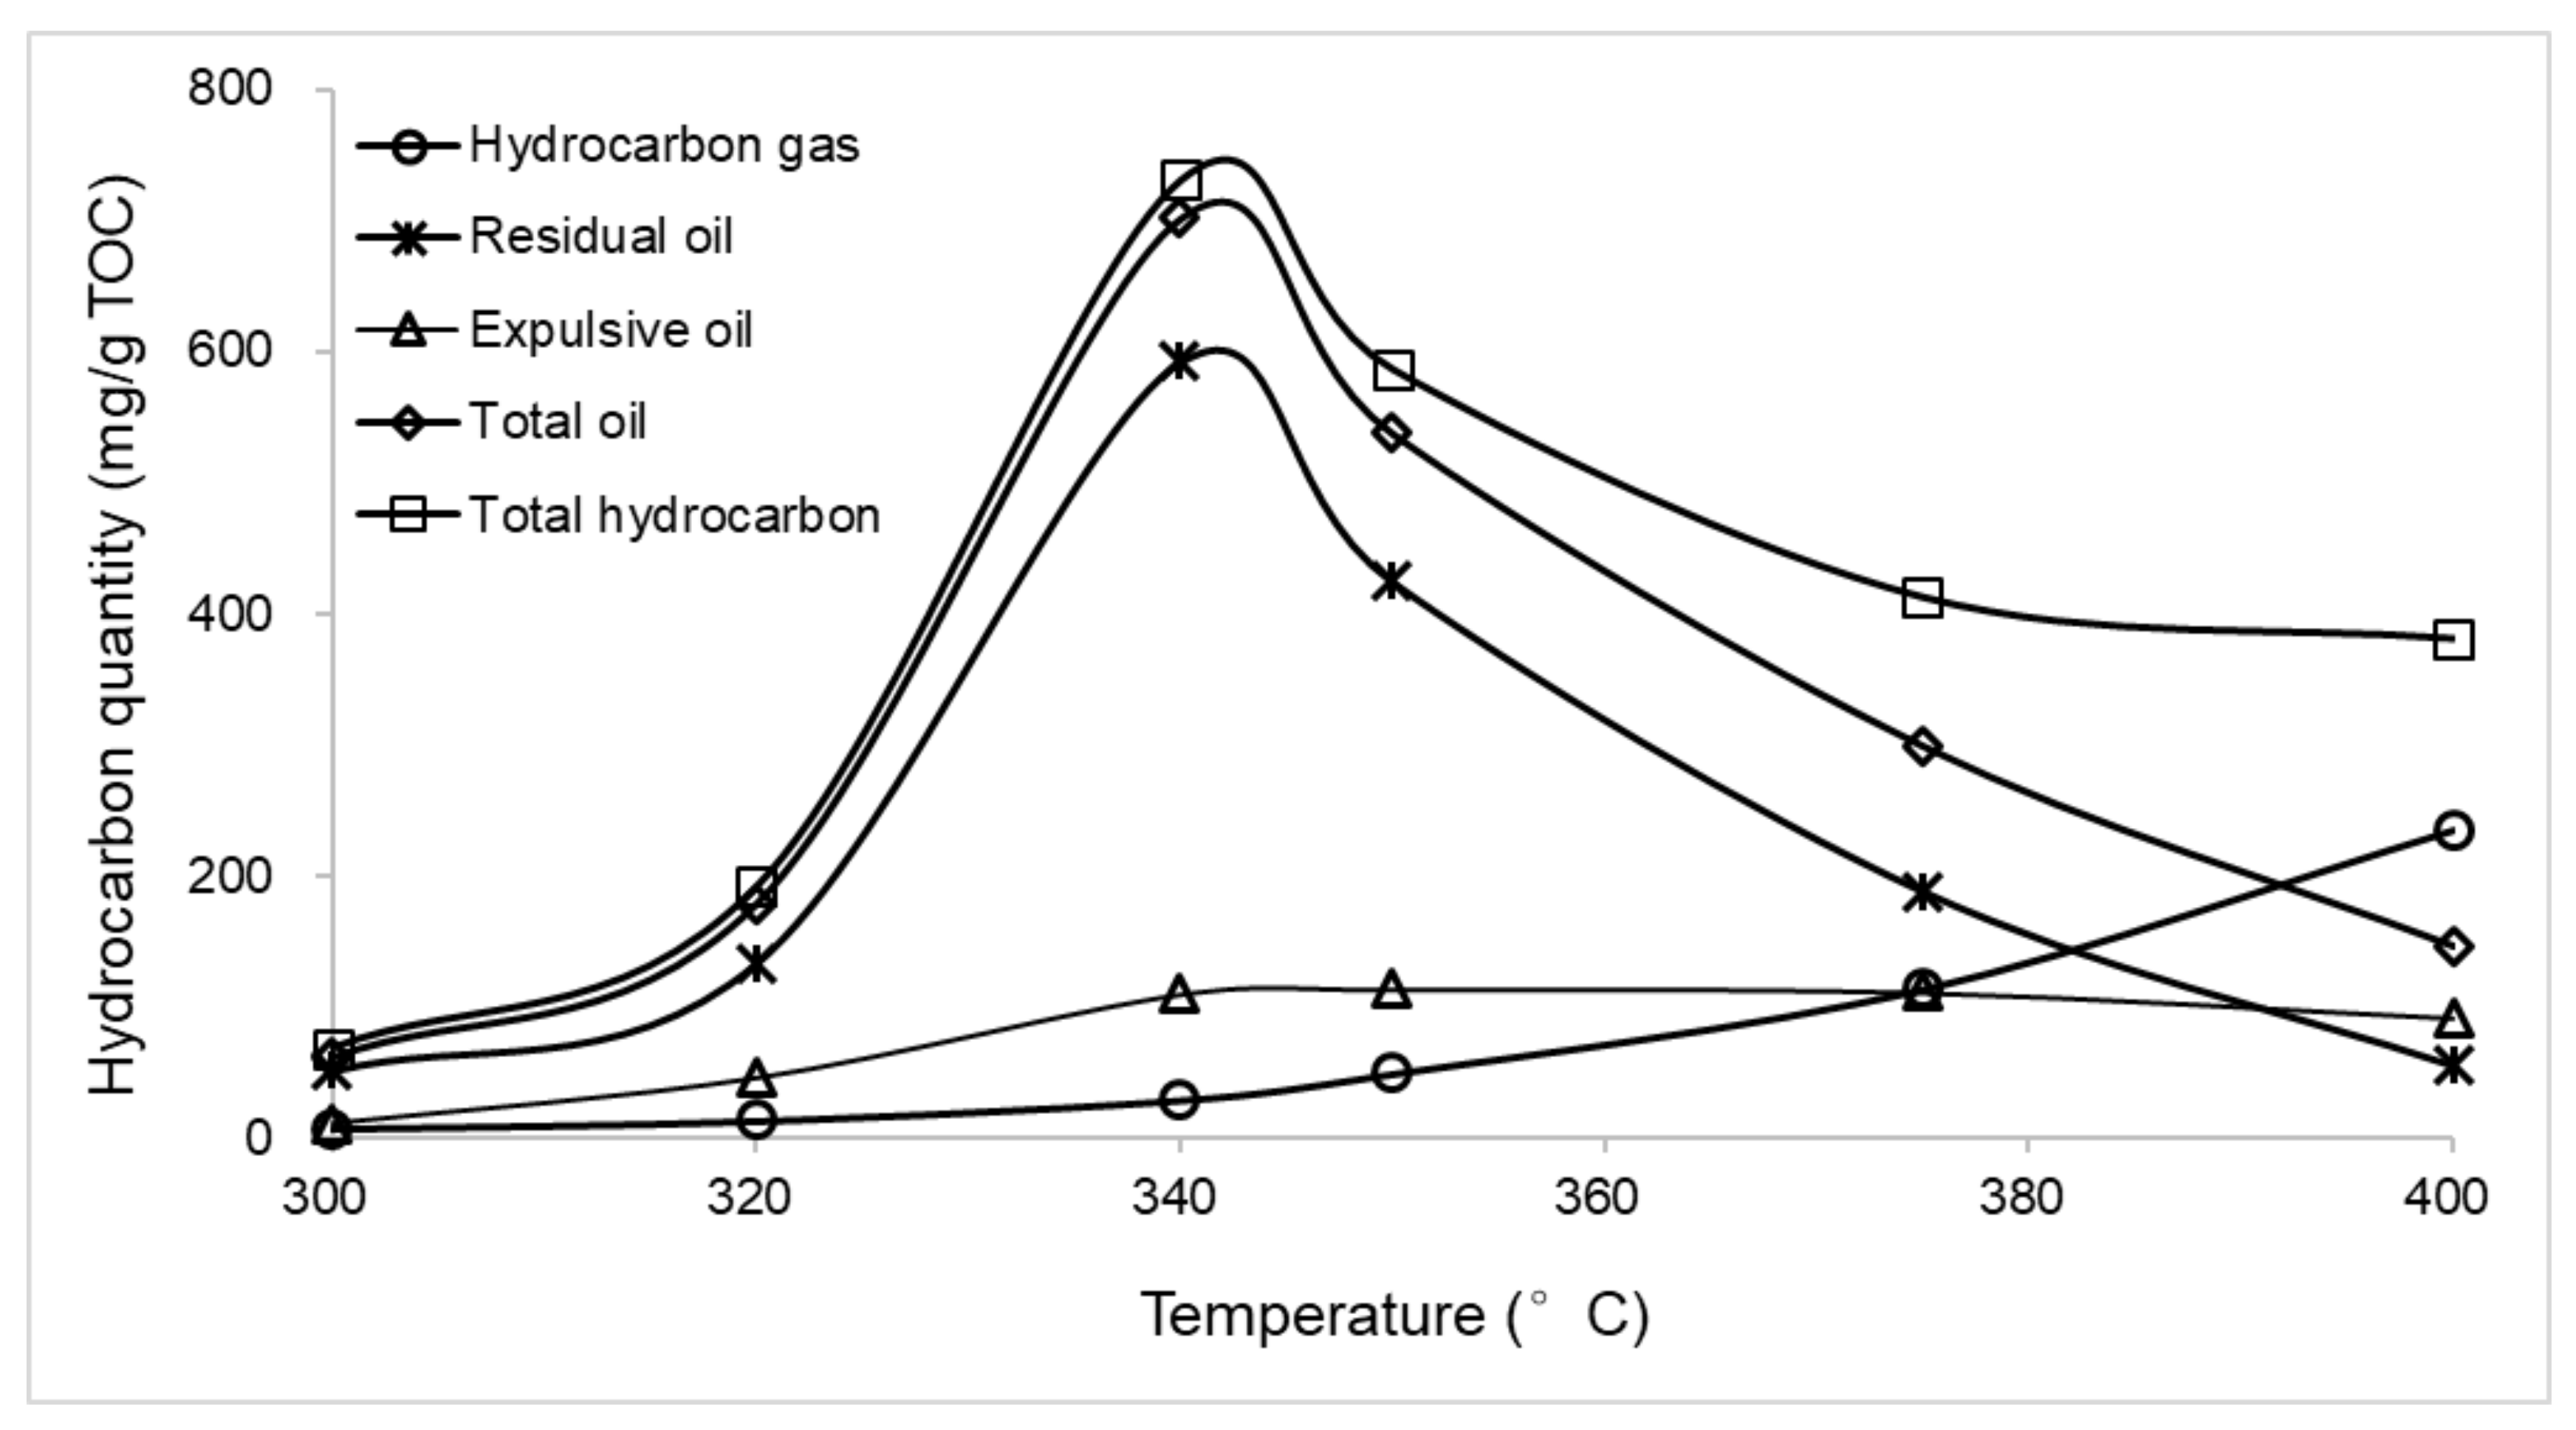
| Temperature (°C) | EASY%Ro | Hydrocarbon Gases (mg/g TOC) | Residual Oil (mg/g TOC) | Expelled Oil (mg/g TOC) | Total Oil (mg/g TOC) | Total Hydrocarbons (mg/g TOC) |
|---|---|---|---|---|---|---|
| 300 | 0.62 | 7.05 | 50.85 | 10.48 | 61.33 | 68.39 |
| 320 | 0.75 | 12.93 | 132.90 | 45.56 | 178.46 | 191.39 |
| 340 | 1.08 | 28.78 | 592.15 | 109.70 | 701.85 | 730.63 |
| 350 | 1.13 | 48.85 | 424.30 | 113.19 | 537.49 | 586.34 |
| 375 | 1.56 | 113.29 | 188.10 | 110.98 | 299.08 | 412.37 |
| 400 | 1.72 | 234.44 | 55.10 | 91.30 | 146.41 | 380.84 |
| HC | T(°C) | Major Carbon | OEP | Pr/n-C17 | Ph/n-C18 | Pr/Ph | ∑n-C21-/∑n-C22+ | Sat-HC/Aro-HC | (Sat-HC + Aro-HC)/((Non-HC + Asphaltene) |
|---|---|---|---|---|---|---|---|---|---|
| Aus-2 | - | 16 | 0.88 | 0.89 | 1.05 | 0.99 | 1.36 | 1.15 | 0.89 |
| Residual oil | 300 | 24 | 0.68 | 0.50 | 0.71 | 0.70 | 1.03 | 0.25 | 2.63 |
| 320 | 24 | 0.75 | 0.39 | 0.59 | 0.57 | 0.95 | 0.19 | 1.51 | |
| 340 | 19 | 1.04 | 0.17 | 0.17 | 0.88 | 1.40 | 0.17 | 0.71 | |
| 350 | 19 | 1.01 | 0.12 | 0.09 | 1.01 | 1.13 | 0.21 | 0.82 | |
| 375 | 18 | 1.03 | 0.10 | 0.06 | 1.44 | 2.14 | 0.22 | 1.97 | |
| 400 | 19 | 1.05 | 0.12 | 0.15 | 0.59 | 1.38 | 0.25 | 2.62 | |
| Expelled oil | 300 | 19 | 1.96 | 0.82 | 0.46 | 1.87 | 2.83 | 0.97 | 1.79 |
| 320 | 19 | 2.11 | 0.71 | 0.45 | 2.14 | 4.98 | 0.71 | 1.65 | |
| 340 | 14 | 1.04 | 0.27 | 0.23 | 1.43 | 4.80 | 0.72 | 0.79 | |
| 350 | 14 | 0.85 | 0.22 | 0.13 | 1.87 | 5.21 | 0.77 | 1.14 | |
| 375 | 13 | 1.29 | 0.17 | 0.10 | 1.88 | 5.36 | 1.07 | 3.05 | |
| 400 | 15 | 0.99 | 0.40 | 0.10 | 4.07 | 2.06 | 0.13 | 2.68 |
| Oil | T (°C) | αααC2920S /(20S + 20R) Steranes | C29ββ/(αα + ββ) Steranes | C27/C29 Steranes | Ts/(Ts + Tm) |
|---|---|---|---|---|---|
| Residual oil | 300 | 0.18 | 0.26 | 0.47 | 0.73 |
| 320 | 0.22 | 0.29 | 0.53 | 0.56 | |
| 340 | 0.28 | 0.39 | 0.61 | 0.53 | |
| 350 | 0.37 | 0.46 | 0.43 | 0.24 | |
| 375 | 0.29 | 0.34 | 0.66 | 0.44 | |
| 400 | 0.40 | 0.40 | 0.82 | 0.51 | |
| Expelled oil | 300 | 0.15 | 0.30 | 0.52 | 0.18 |
| 320 | 0.26 | 0.24 | 0.57 | 0.28 | |
| 340 | 0.36 | 0.30 | 0.54 | 0.23 | |
| 350 | 0.43 | 0.39 | 0.73 | 0.32 | |
| 375 | 0.34 | 0.25 | 0.92 | 0.40 | |
| 400 | 0.37 | 0.30 | 0.73 | 0.38 |
Publisher’s Note: MDPI stays neutral with regard to jurisdictional claims in published maps and institutional affiliations. |
© 2021 by the authors. Licensee MDPI, Basel, Switzerland. This article is an open access article distributed under the terms and conditions of the Creative Commons Attribution (CC BY) license (https://creativecommons.org/licenses/by/4.0/).
Share and Cite
Xie, X.; Wang, Y.; Lin, J.; Wu, F.; Zhang, L.; Liu, Y.; Hu, X. Geochemical Characteristics of Expelled and Residual Oil from Artificial Thermal Maturation of an Early Permian Tasmanite Shale, Australia. Energies 2021, 14, 7218. https://0-doi-org.brum.beds.ac.uk/10.3390/en14217218
Xie X, Wang Y, Lin J, Wu F, Zhang L, Liu Y, Hu X. Geochemical Characteristics of Expelled and Residual Oil from Artificial Thermal Maturation of an Early Permian Tasmanite Shale, Australia. Energies. 2021; 14(21):7218. https://0-doi-org.brum.beds.ac.uk/10.3390/en14217218
Chicago/Turabian StyleXie, Xiaomin, Ye Wang, Jingwen Lin, Fenting Wu, Lei Zhang, Yuming Liu, and Xu Hu. 2021. "Geochemical Characteristics of Expelled and Residual Oil from Artificial Thermal Maturation of an Early Permian Tasmanite Shale, Australia" Energies 14, no. 21: 7218. https://0-doi-org.brum.beds.ac.uk/10.3390/en14217218