
Multi-Criteria Analysis of a Developed Prefabricated Footing System on Reactive Soil Foundation

 , and
, and 
Abstract
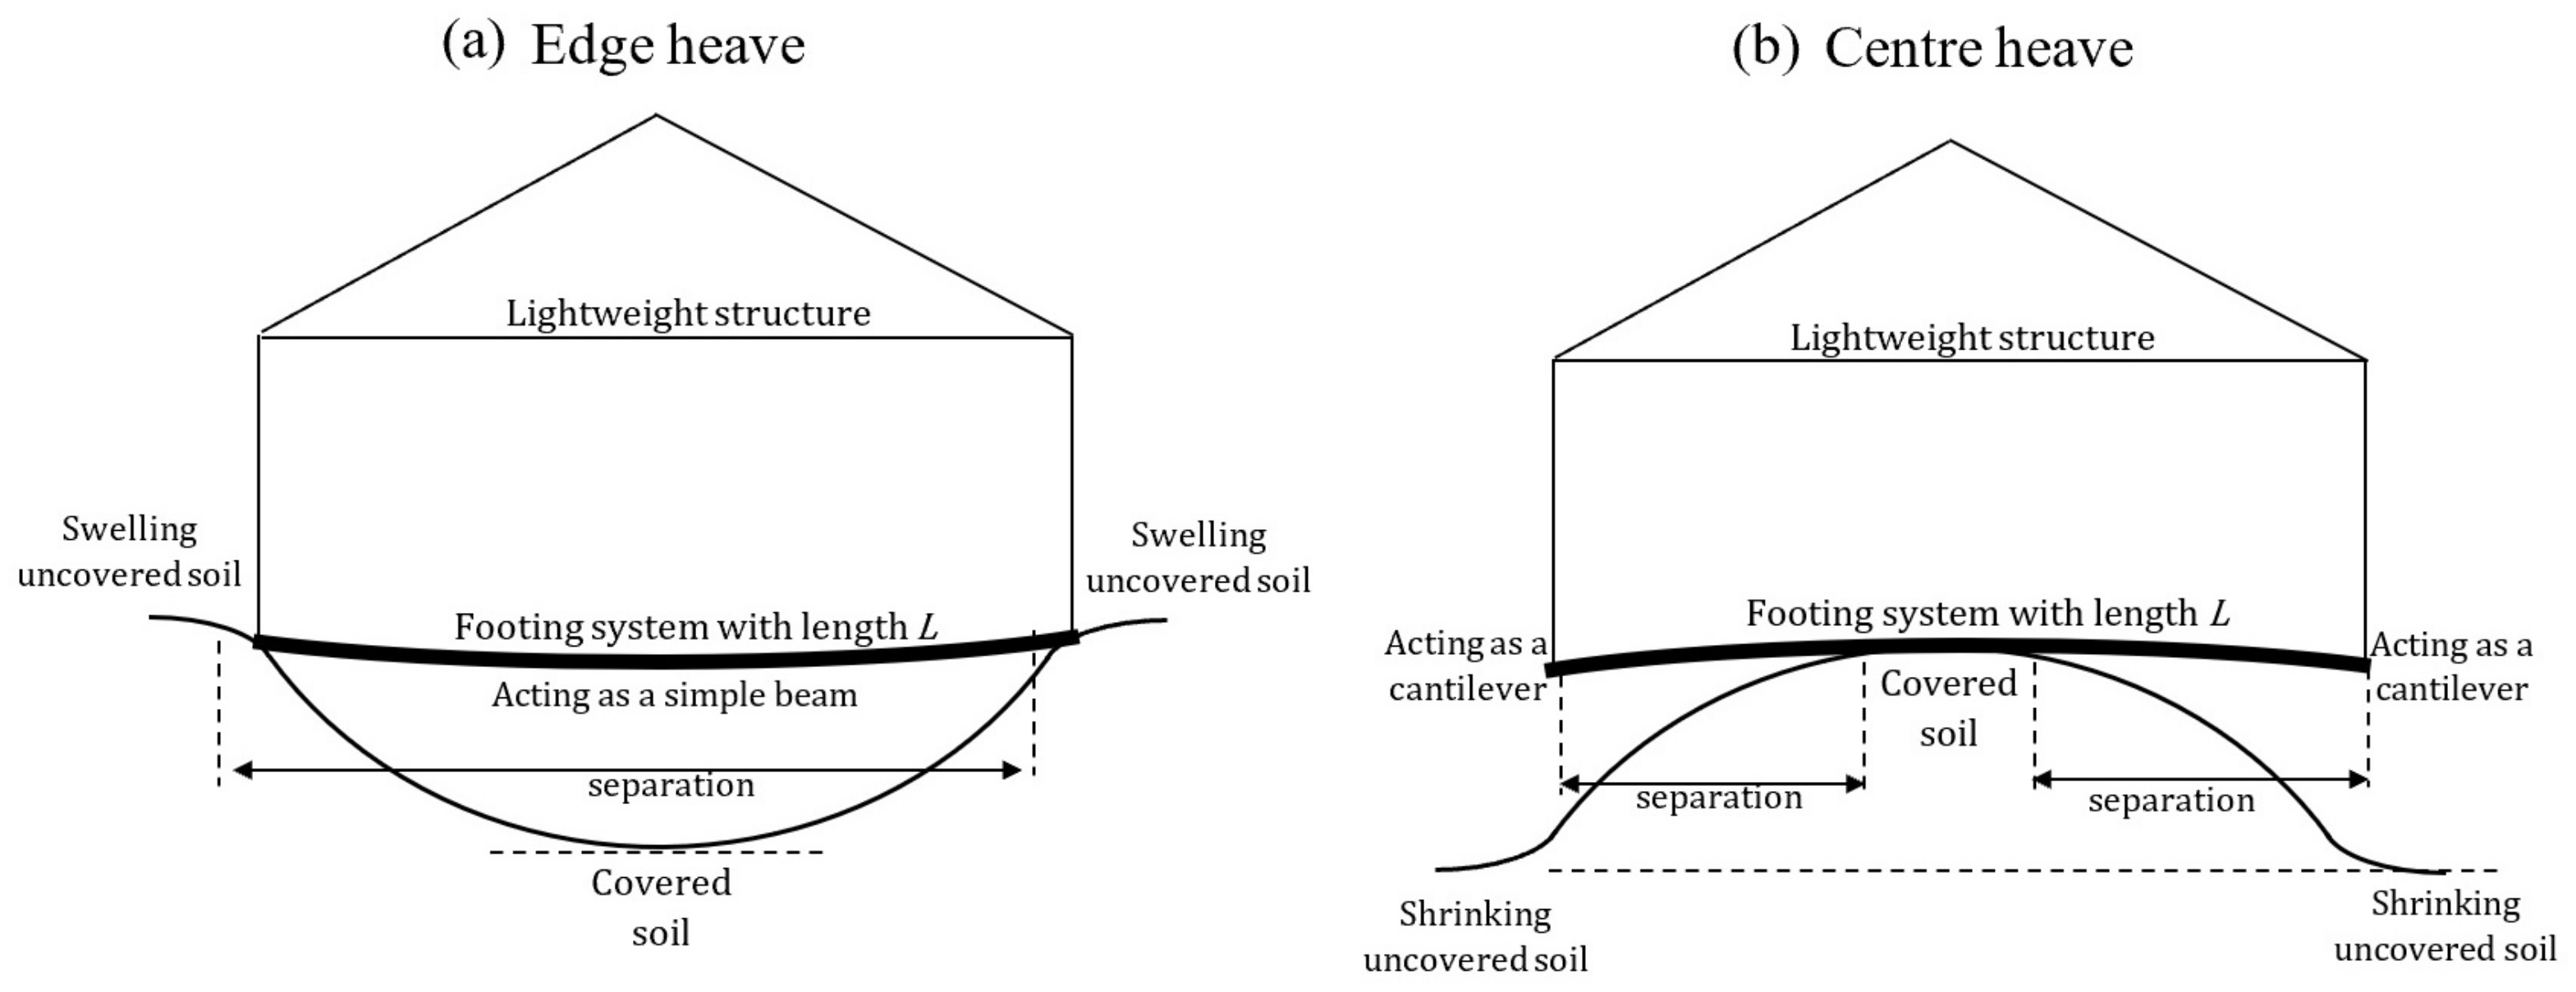
:1. Introduction
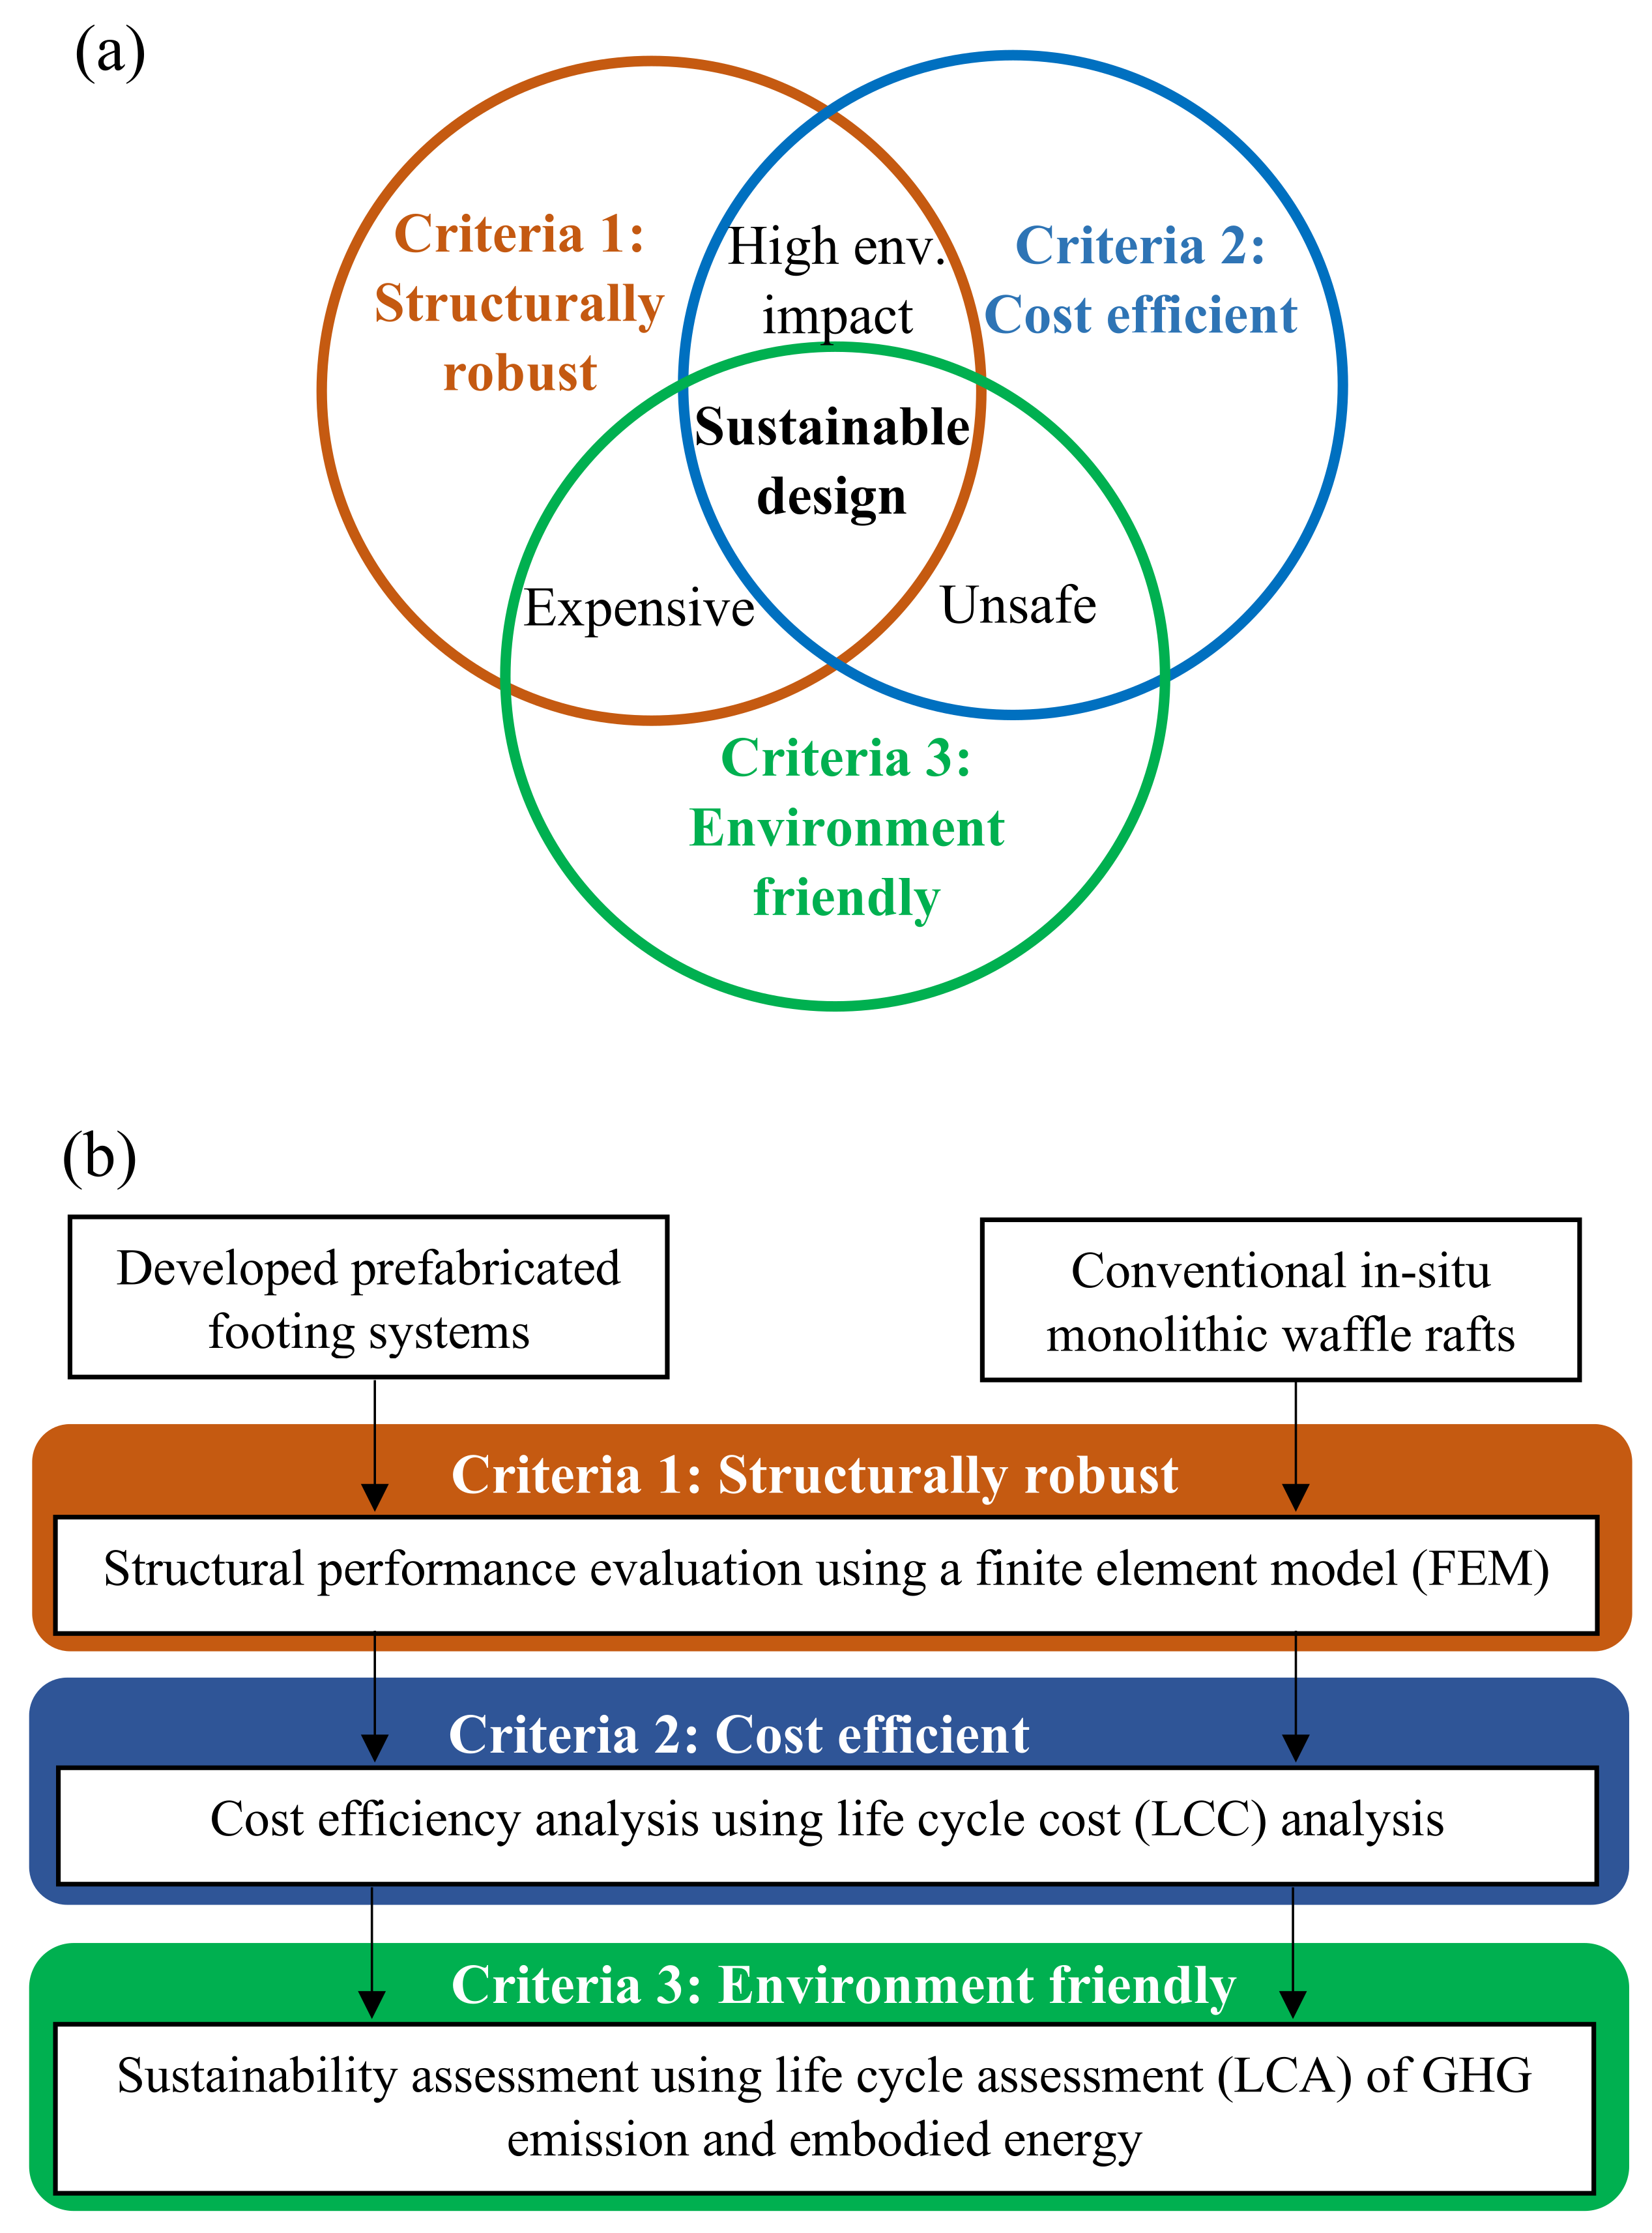
2. Methodology
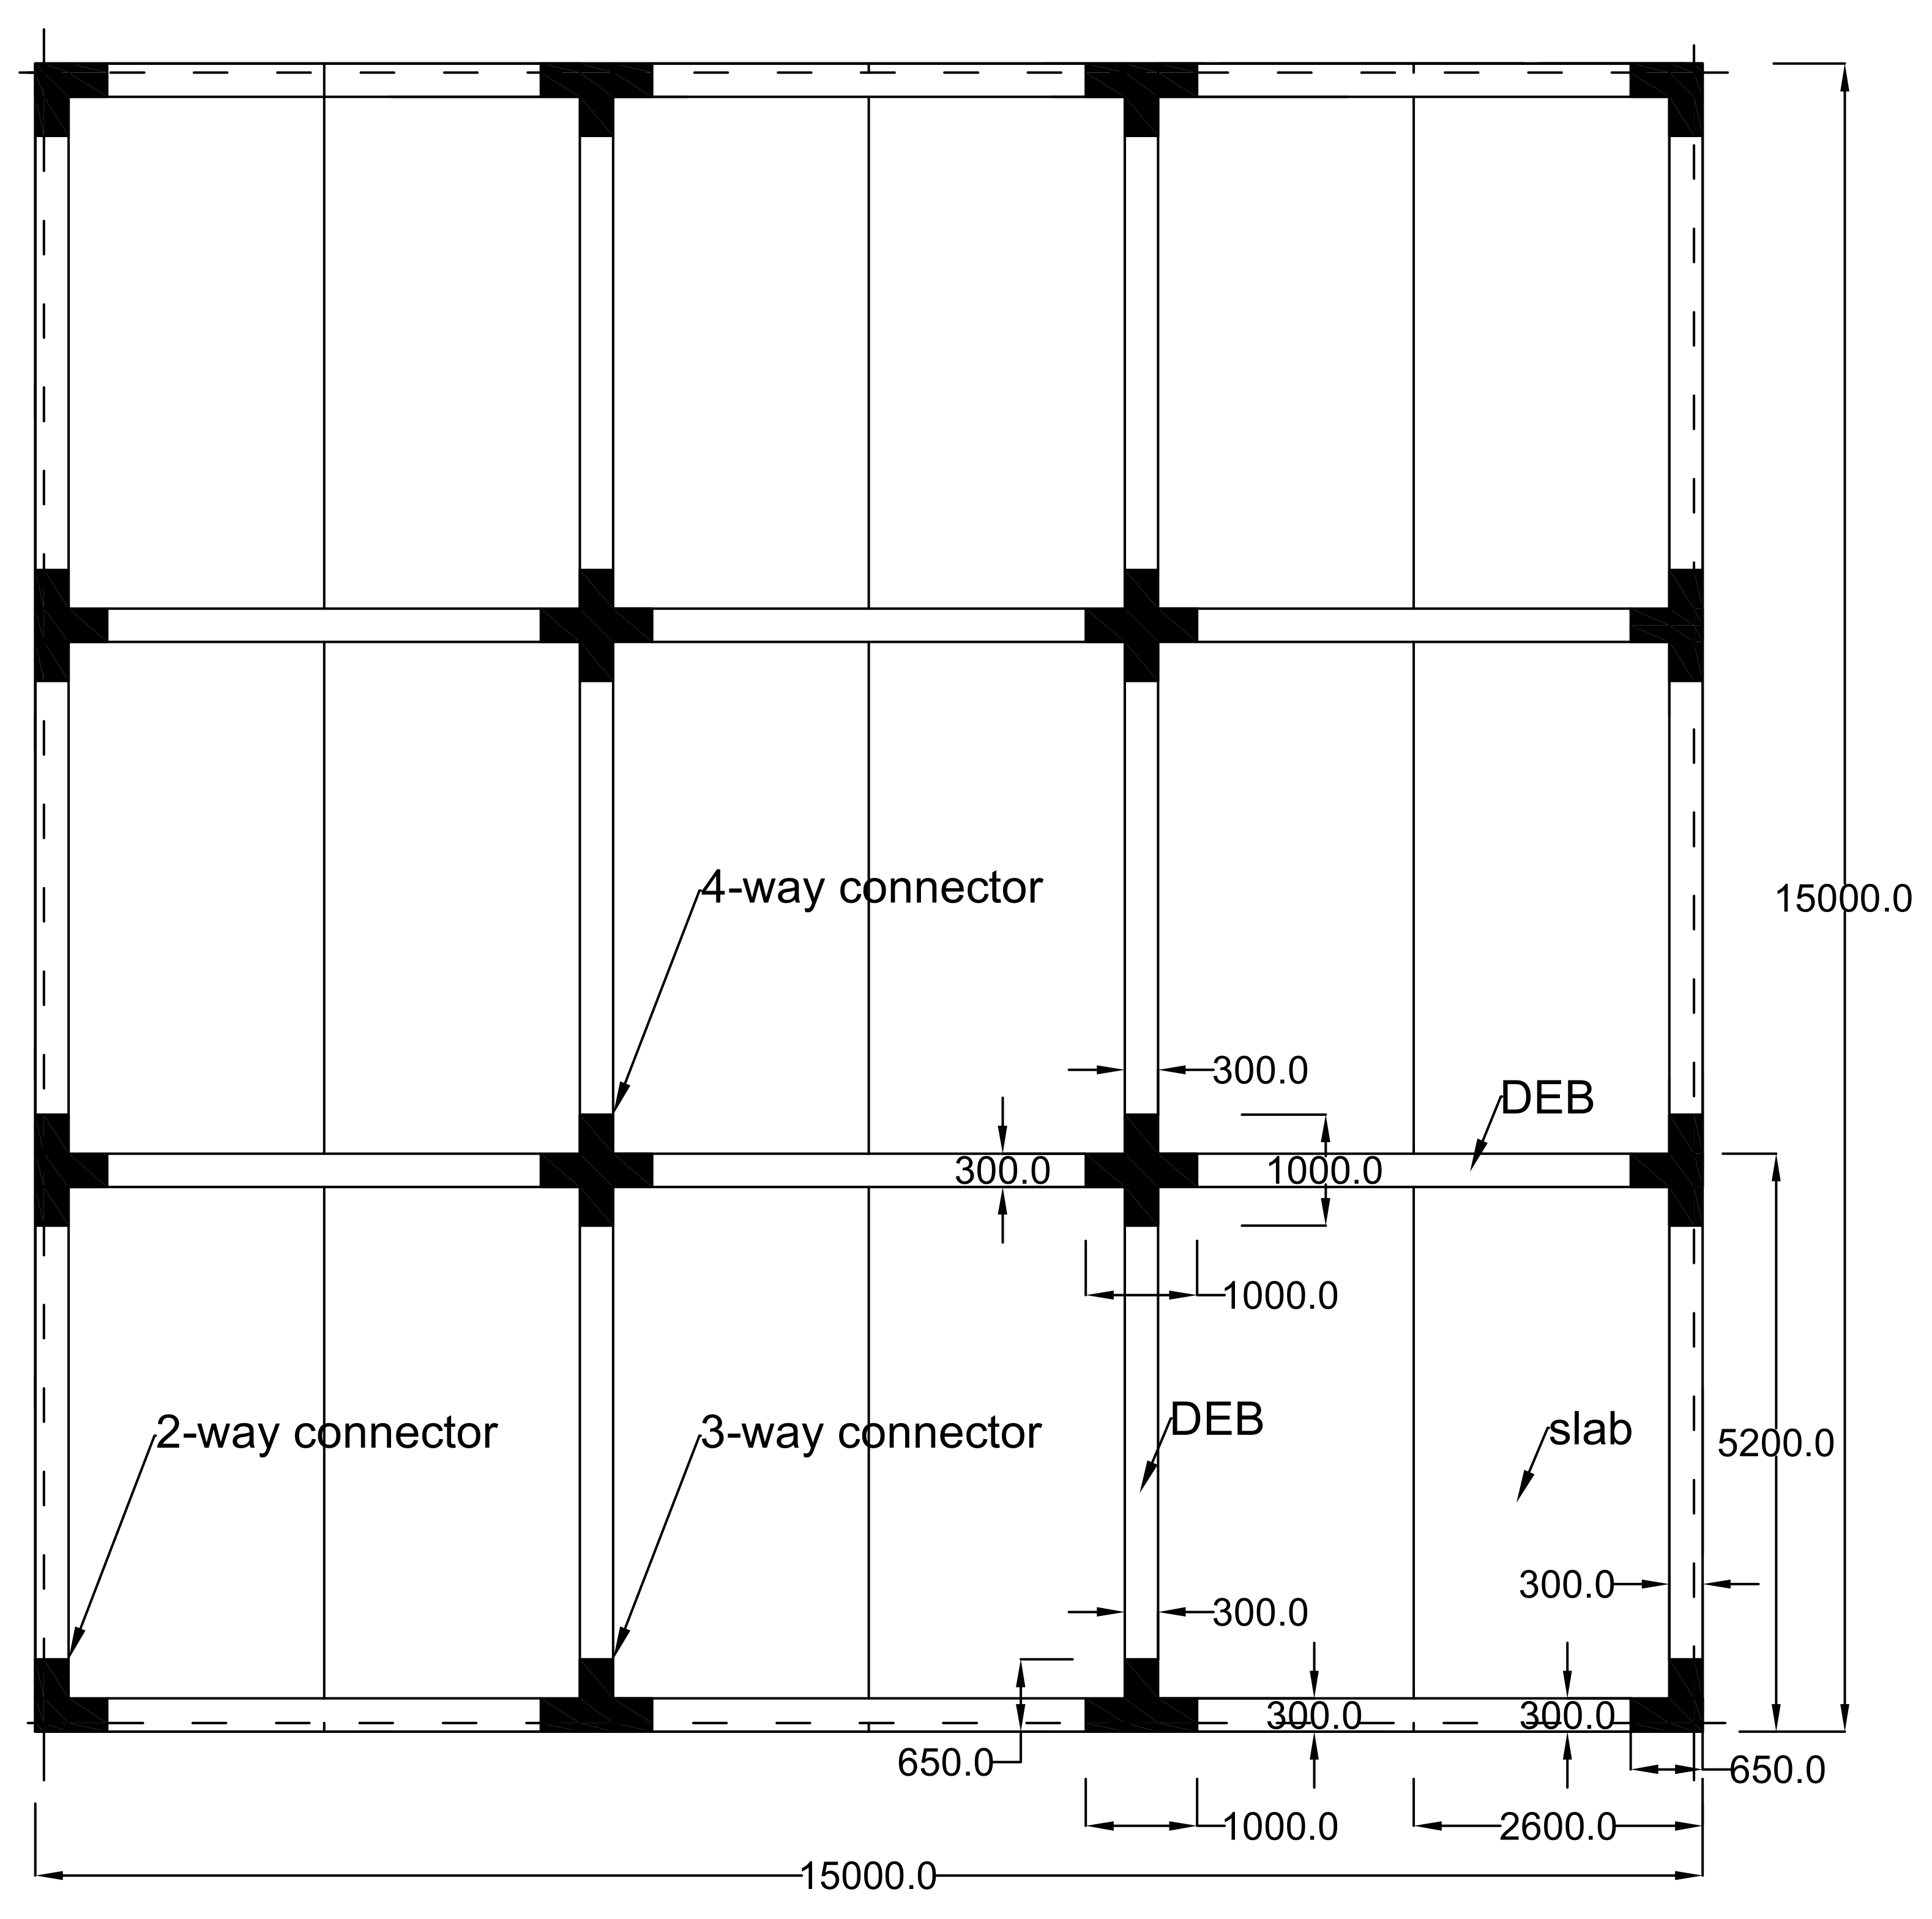
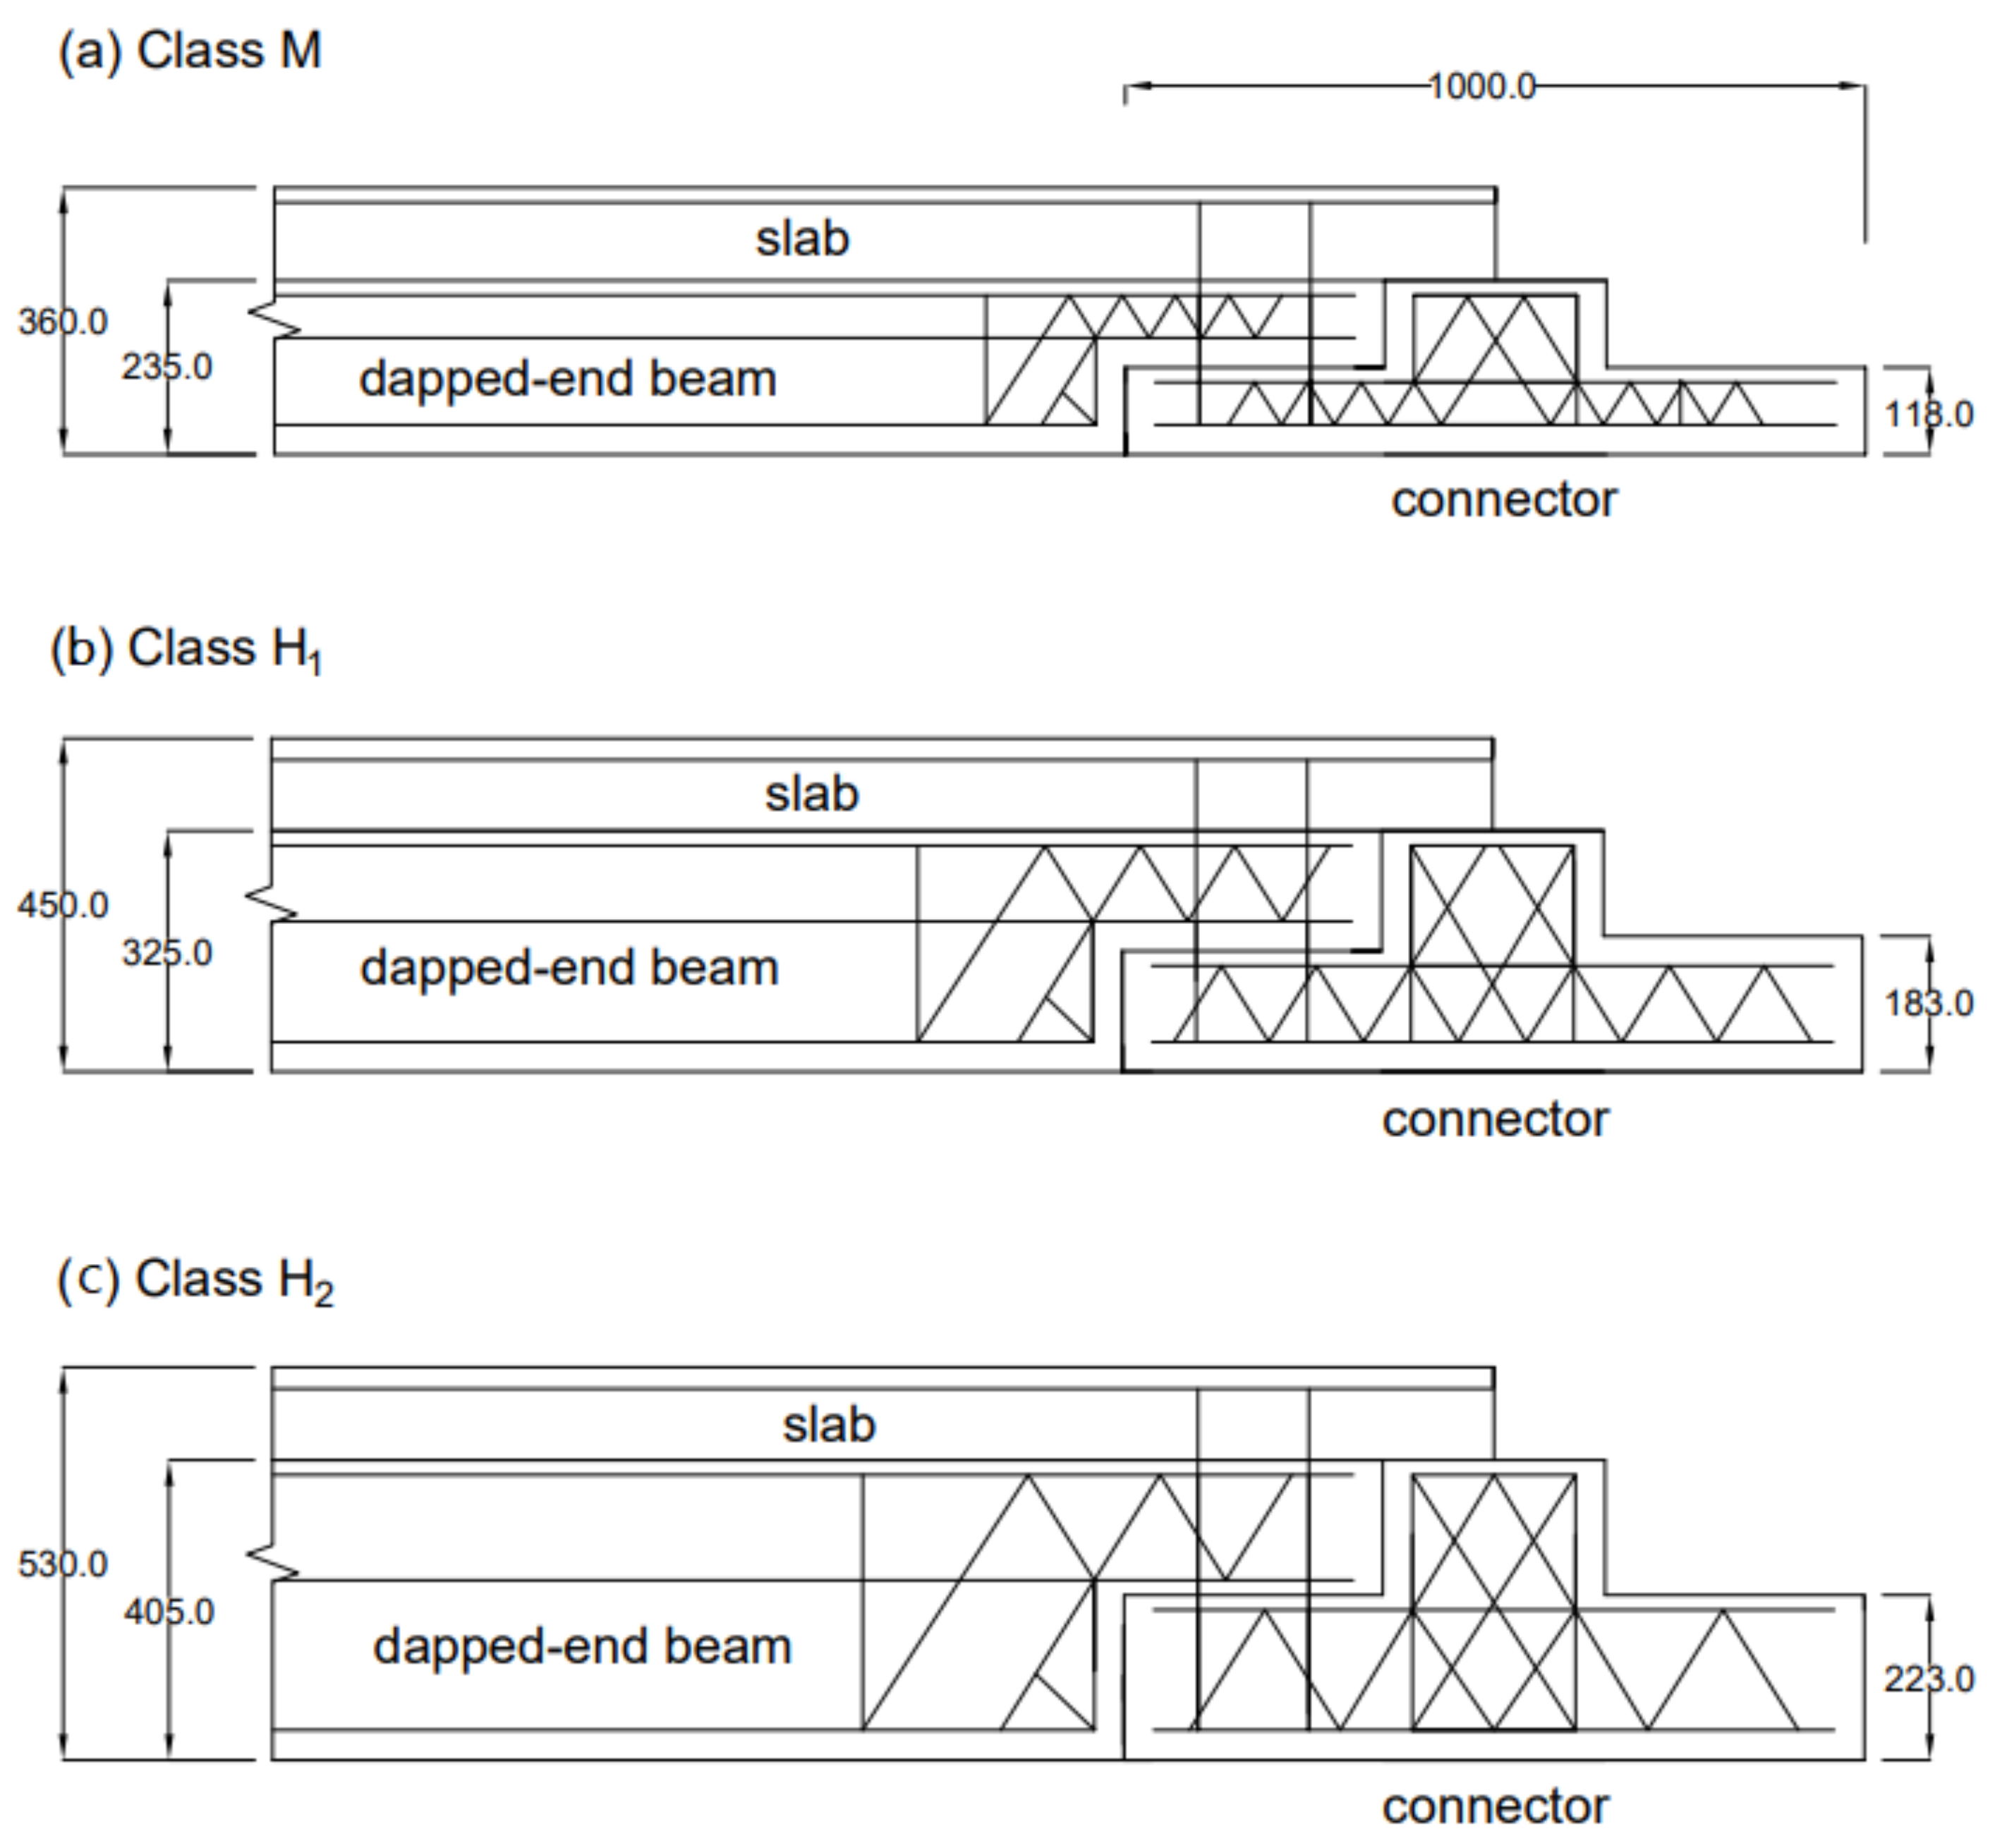
2.1. The Developed Prefabricated Footing
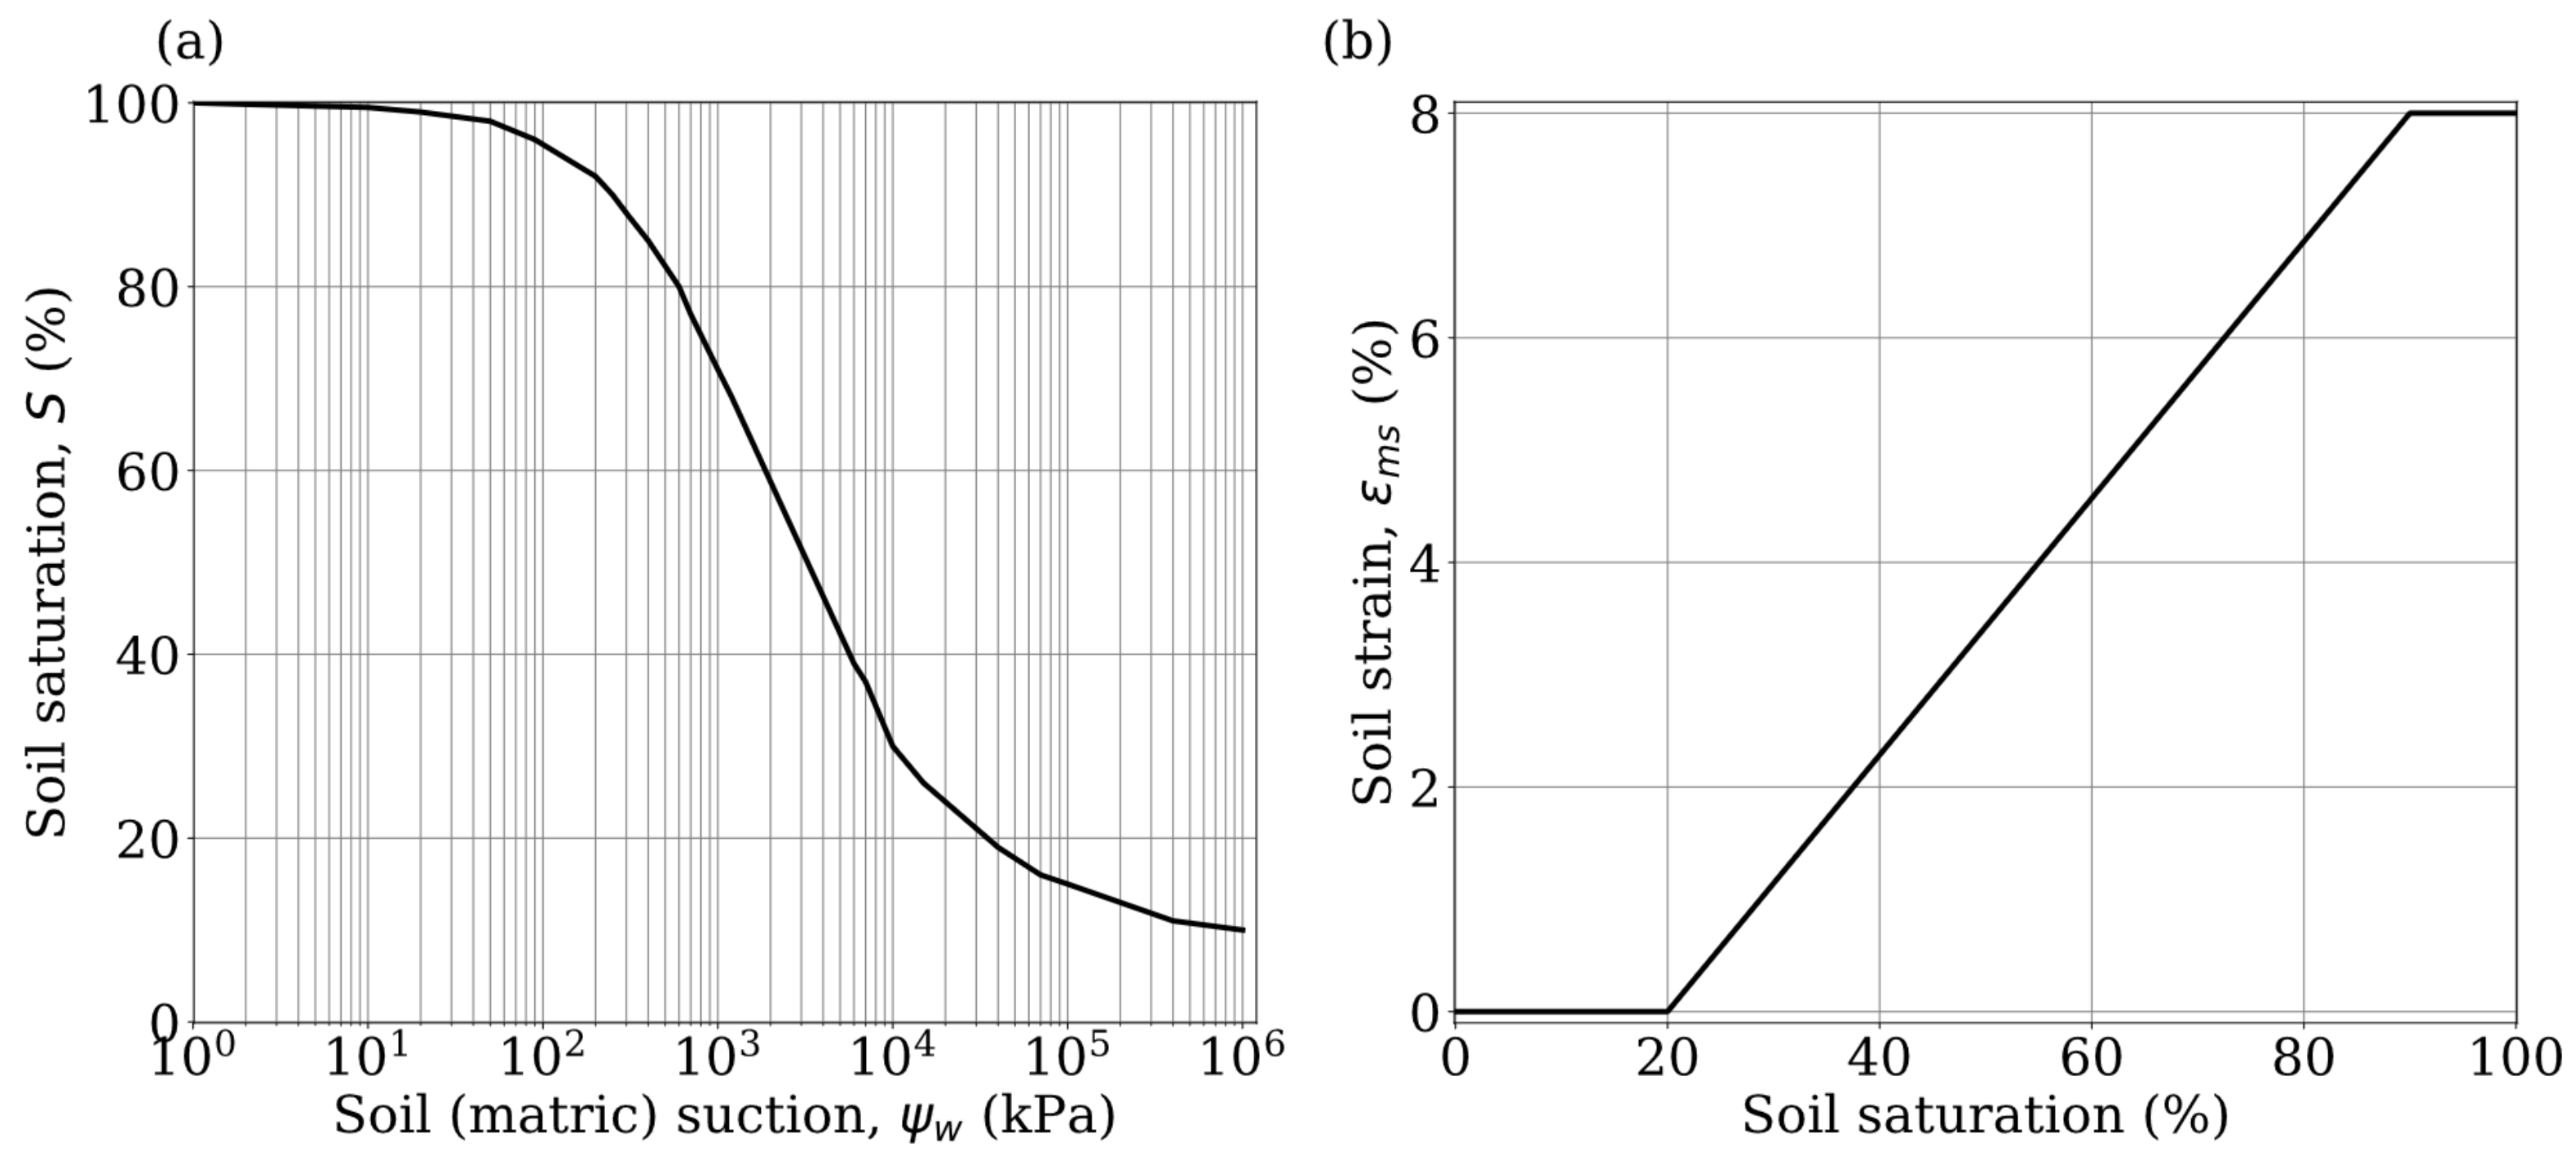
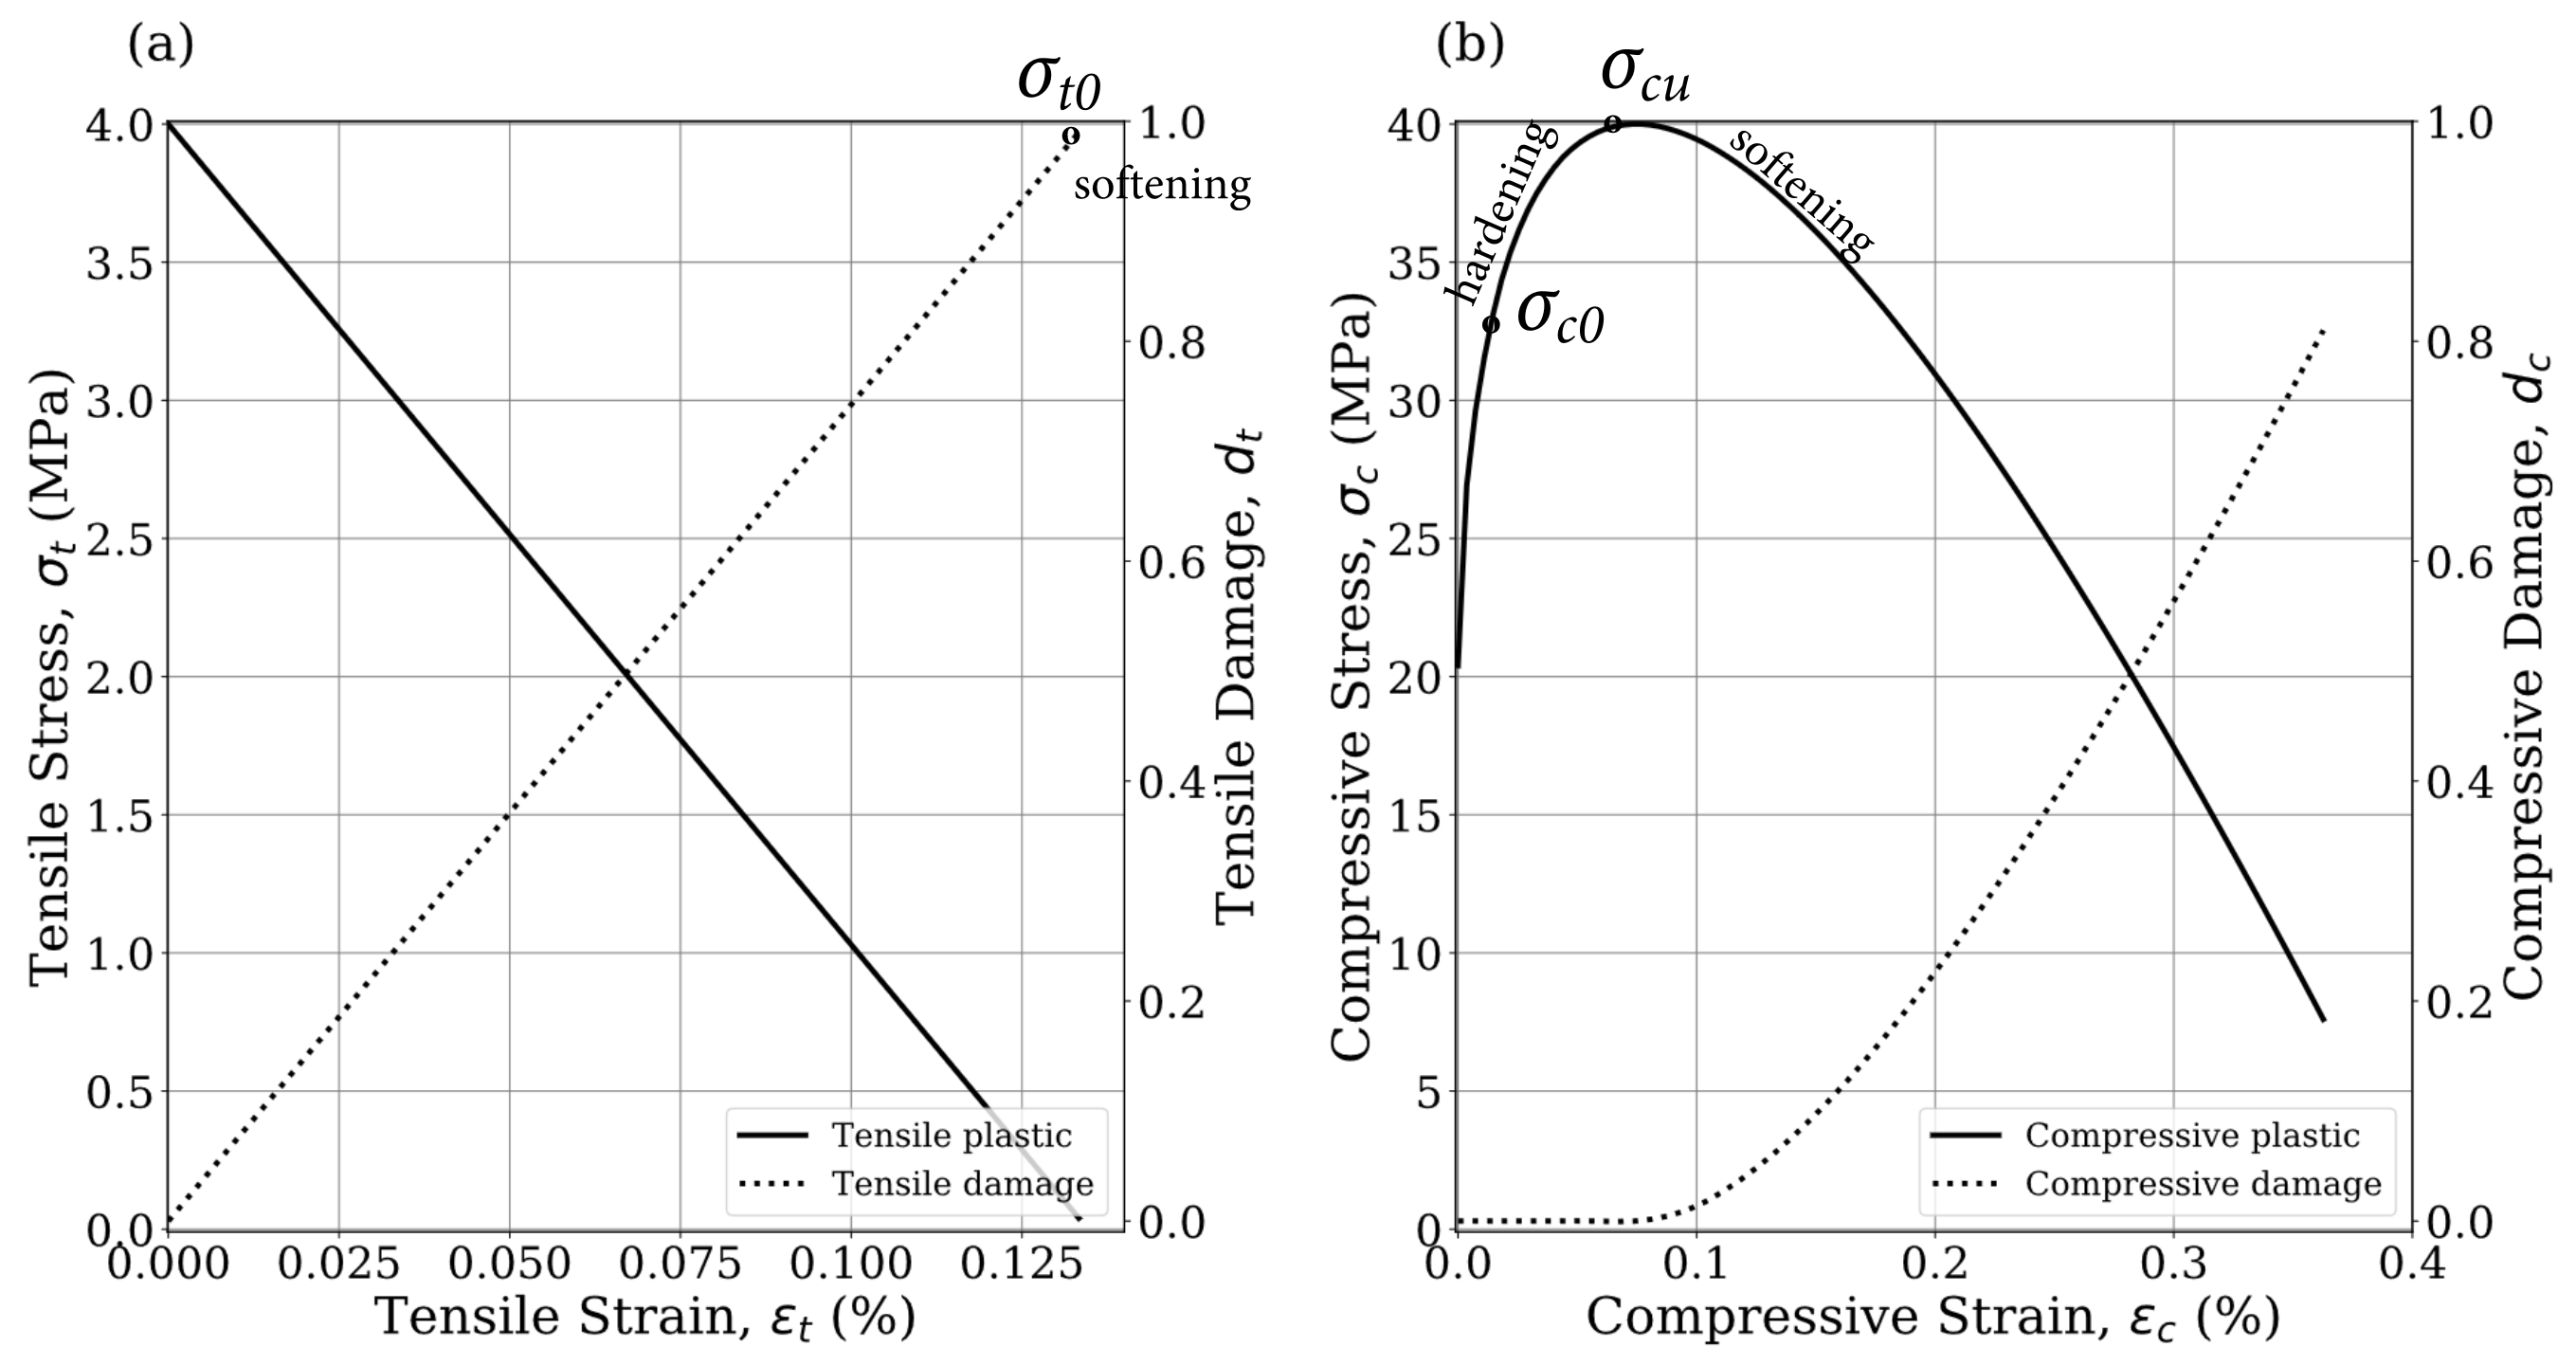
2.2. Structural Performance Using a Hydromechanical Model
2.3. Life Cycle Cost Analysis
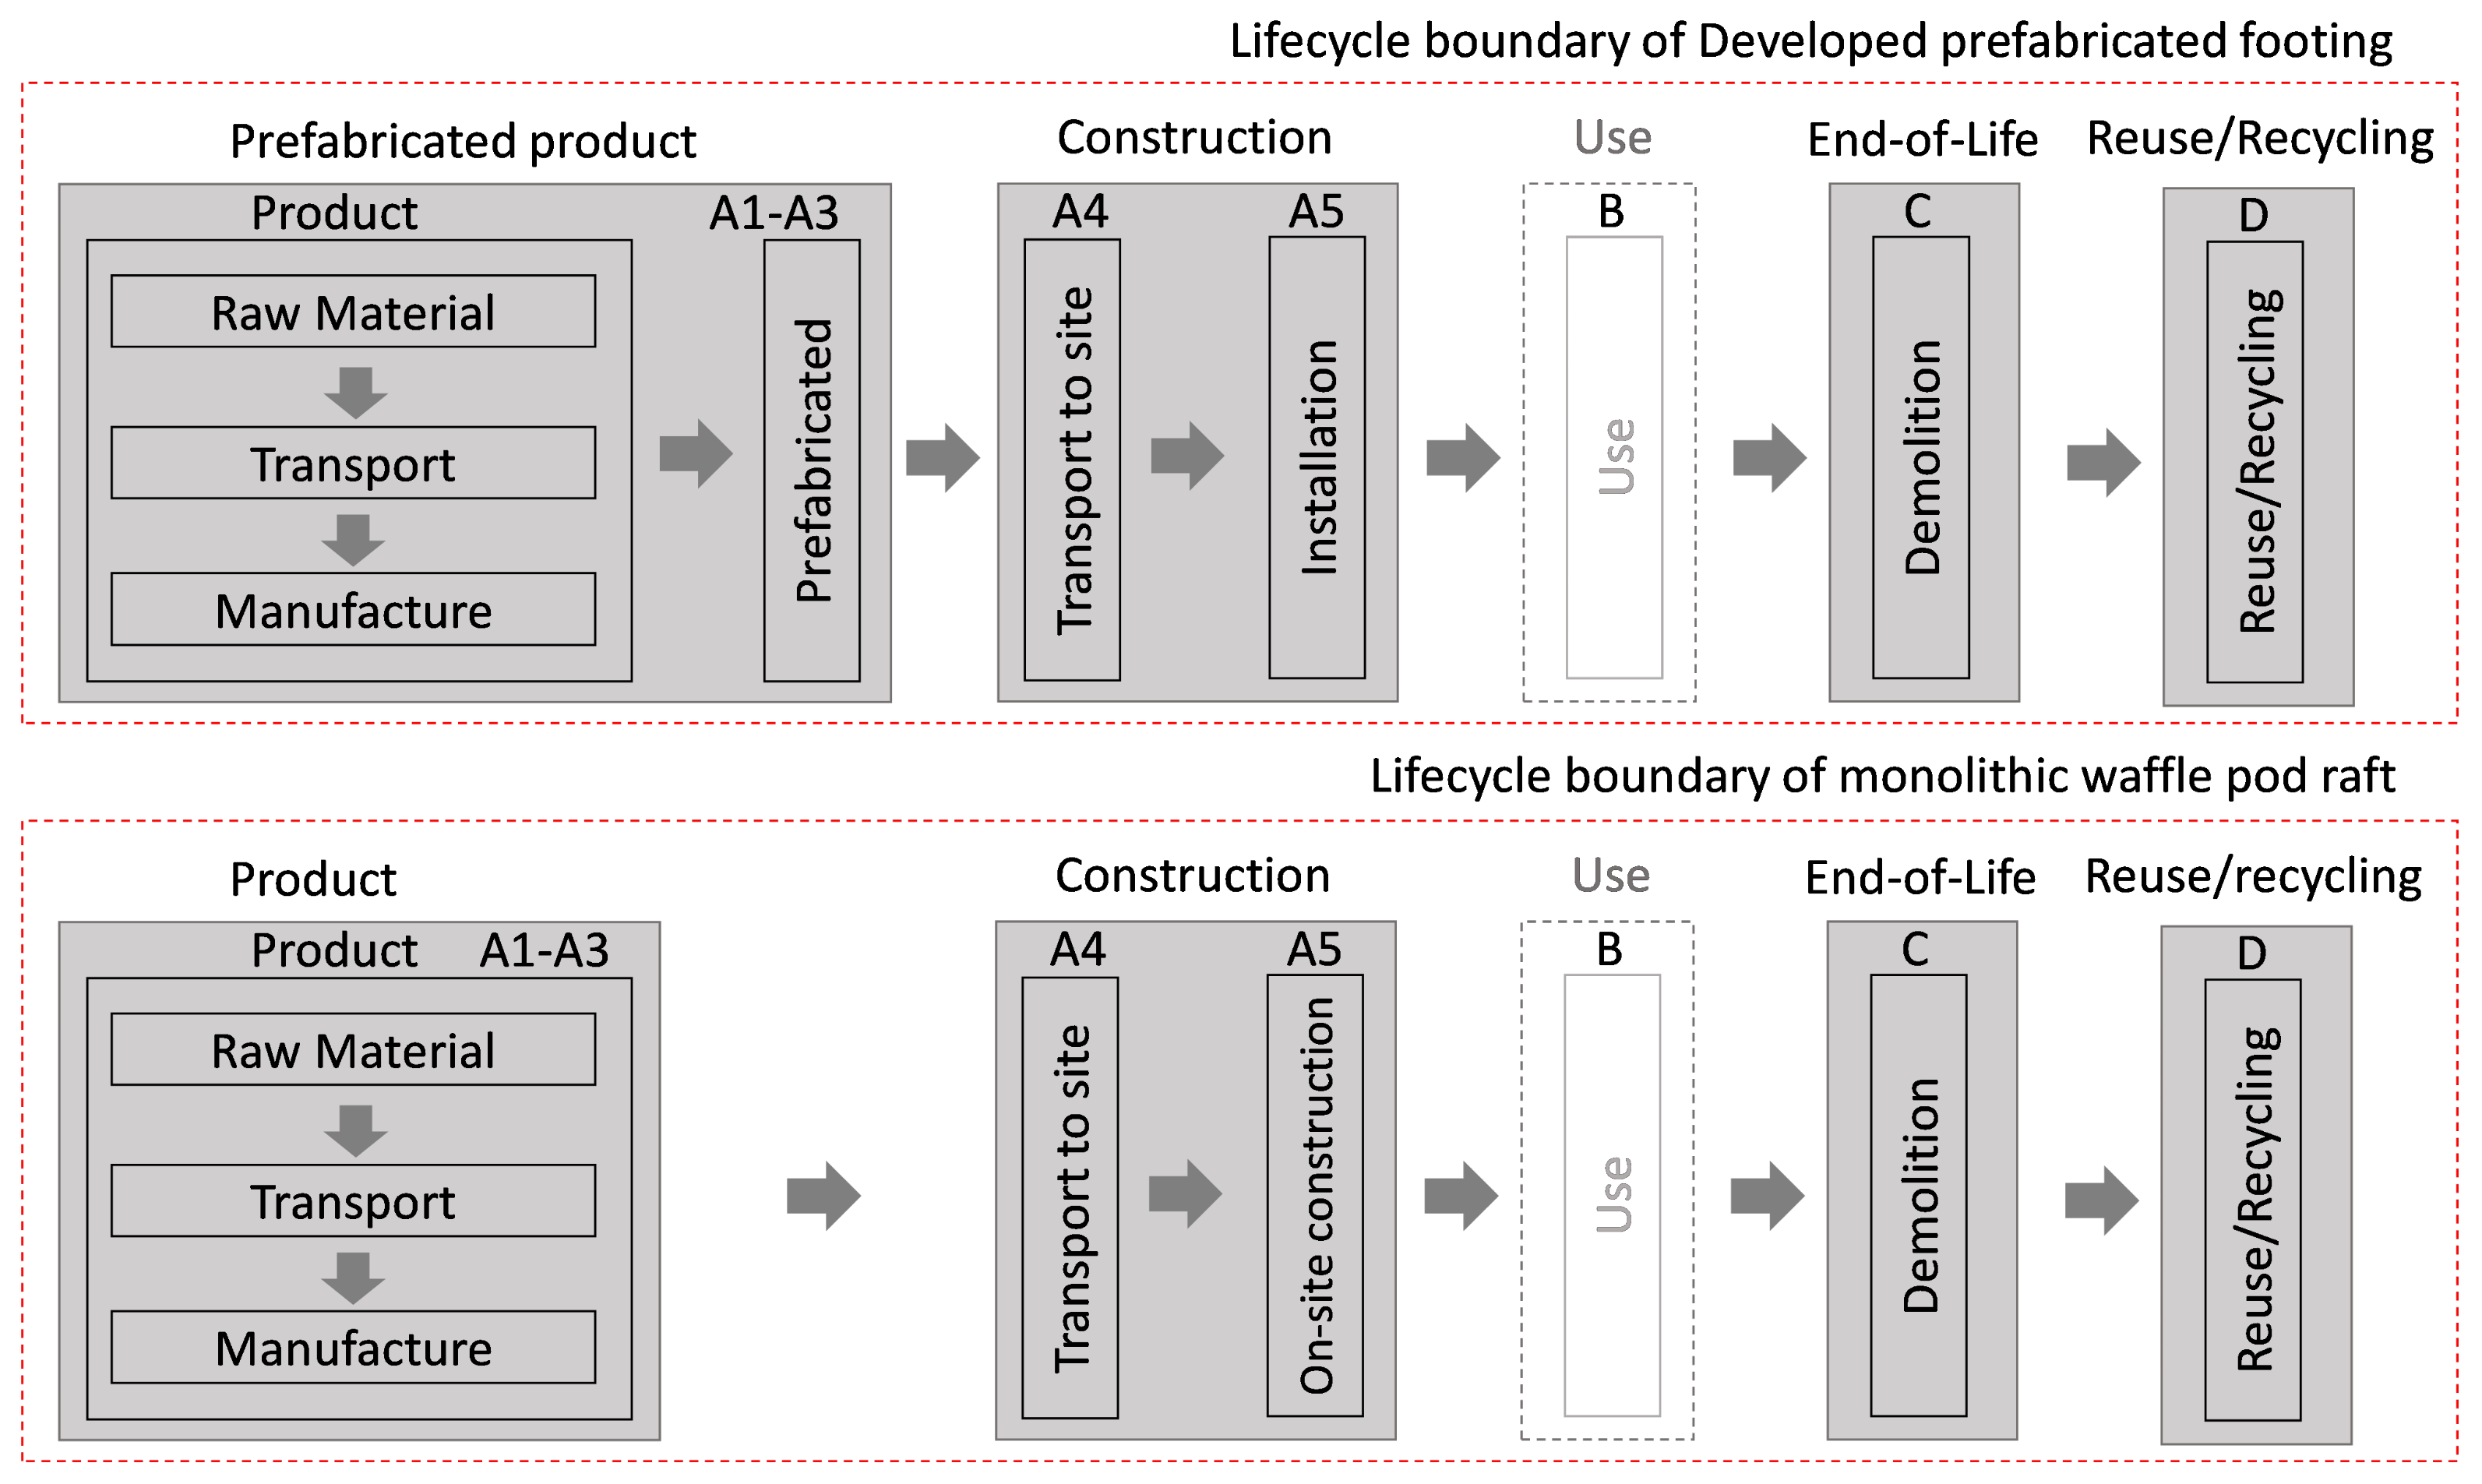
2.4. Life Cycle Assessment
3. Results and Discussion
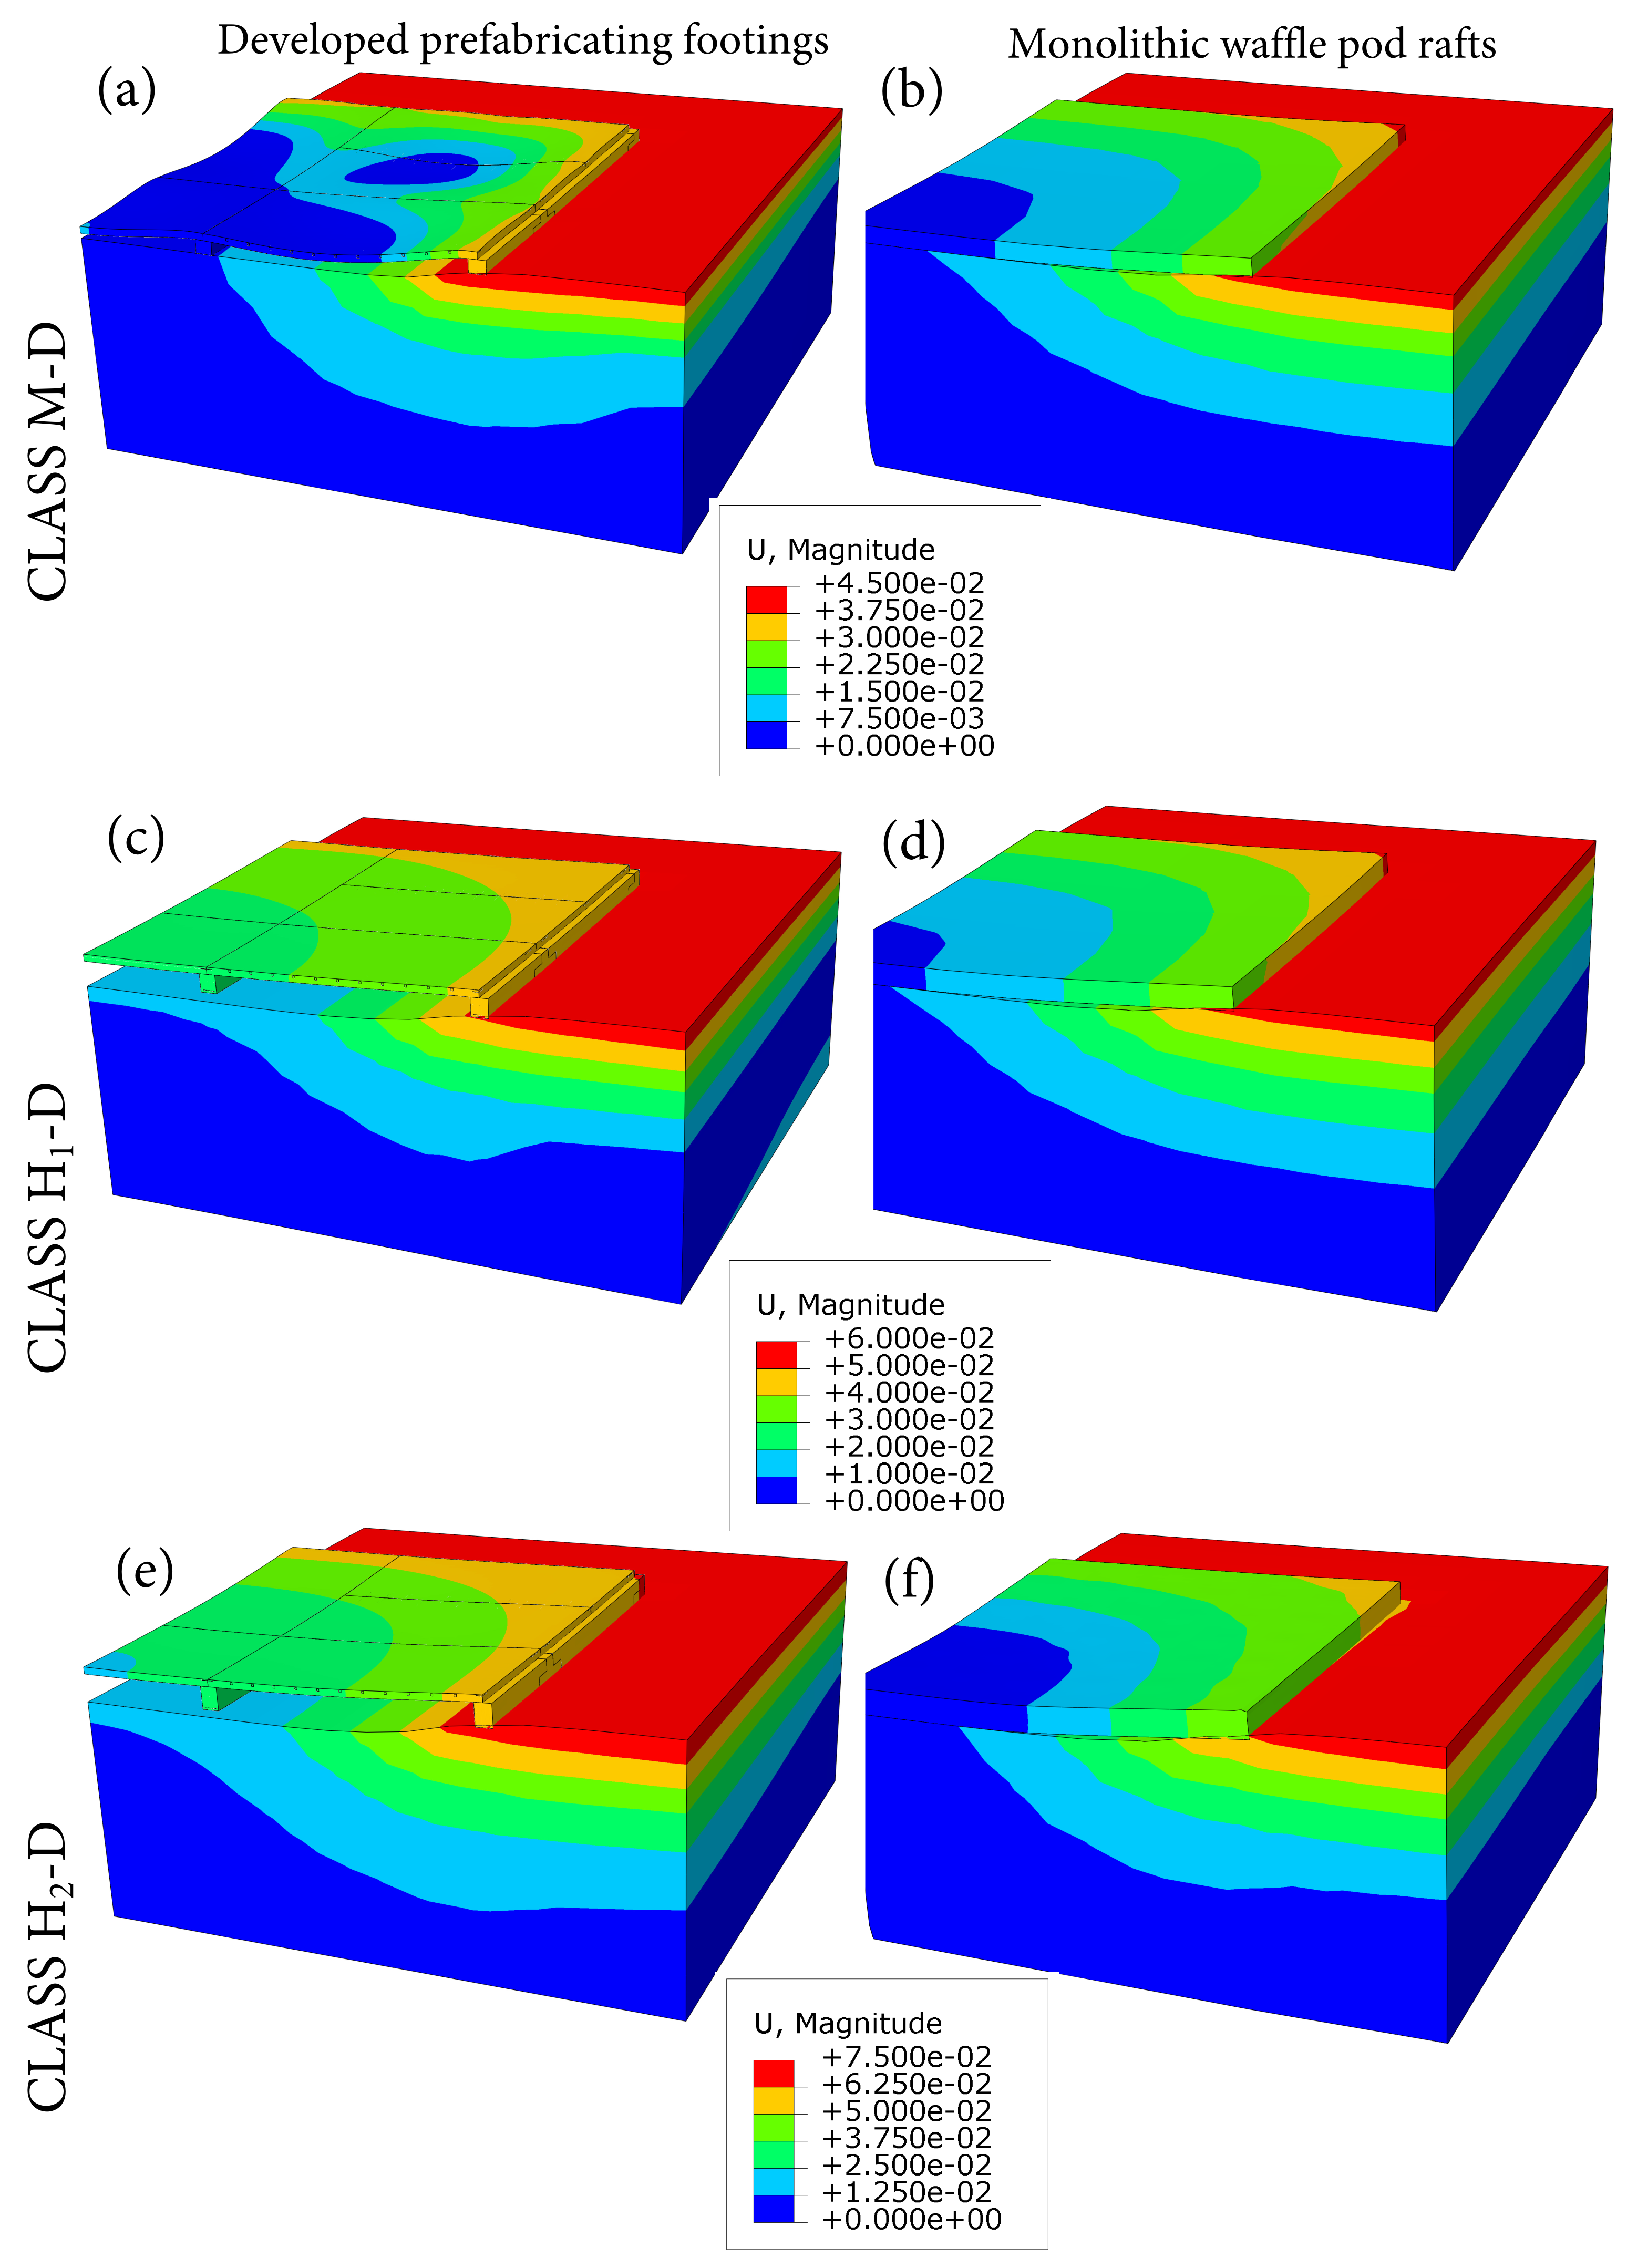
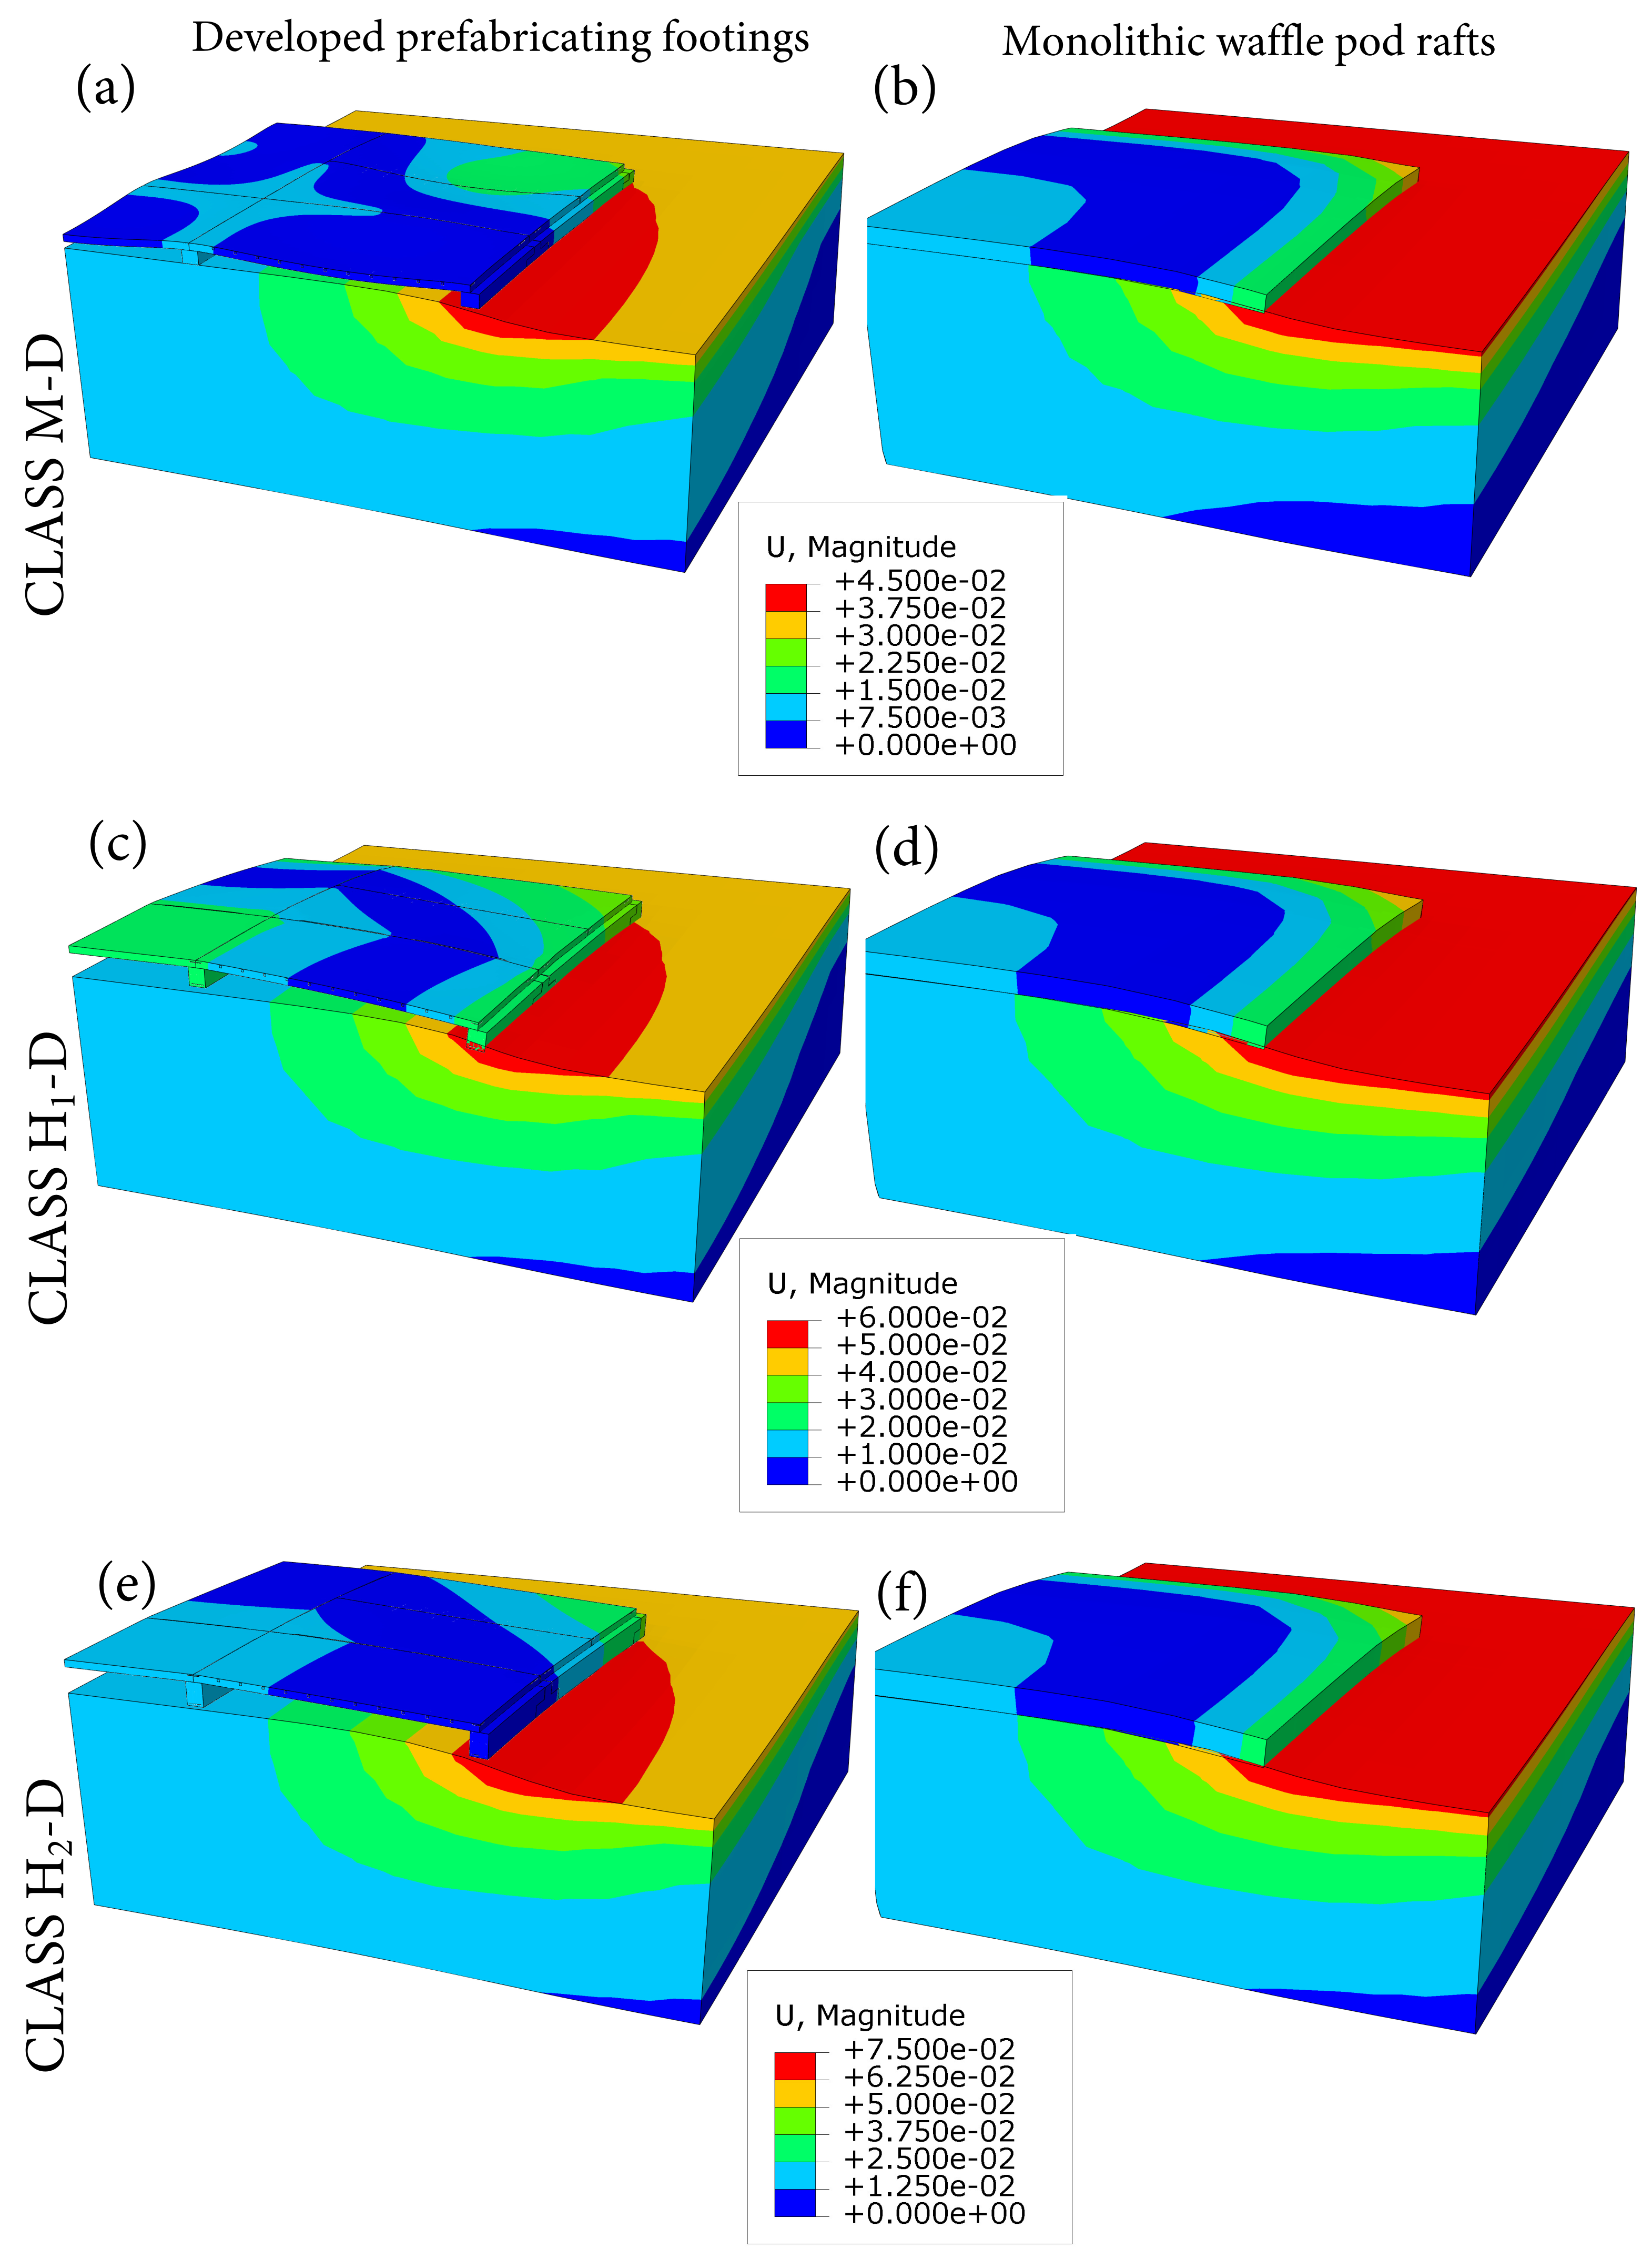
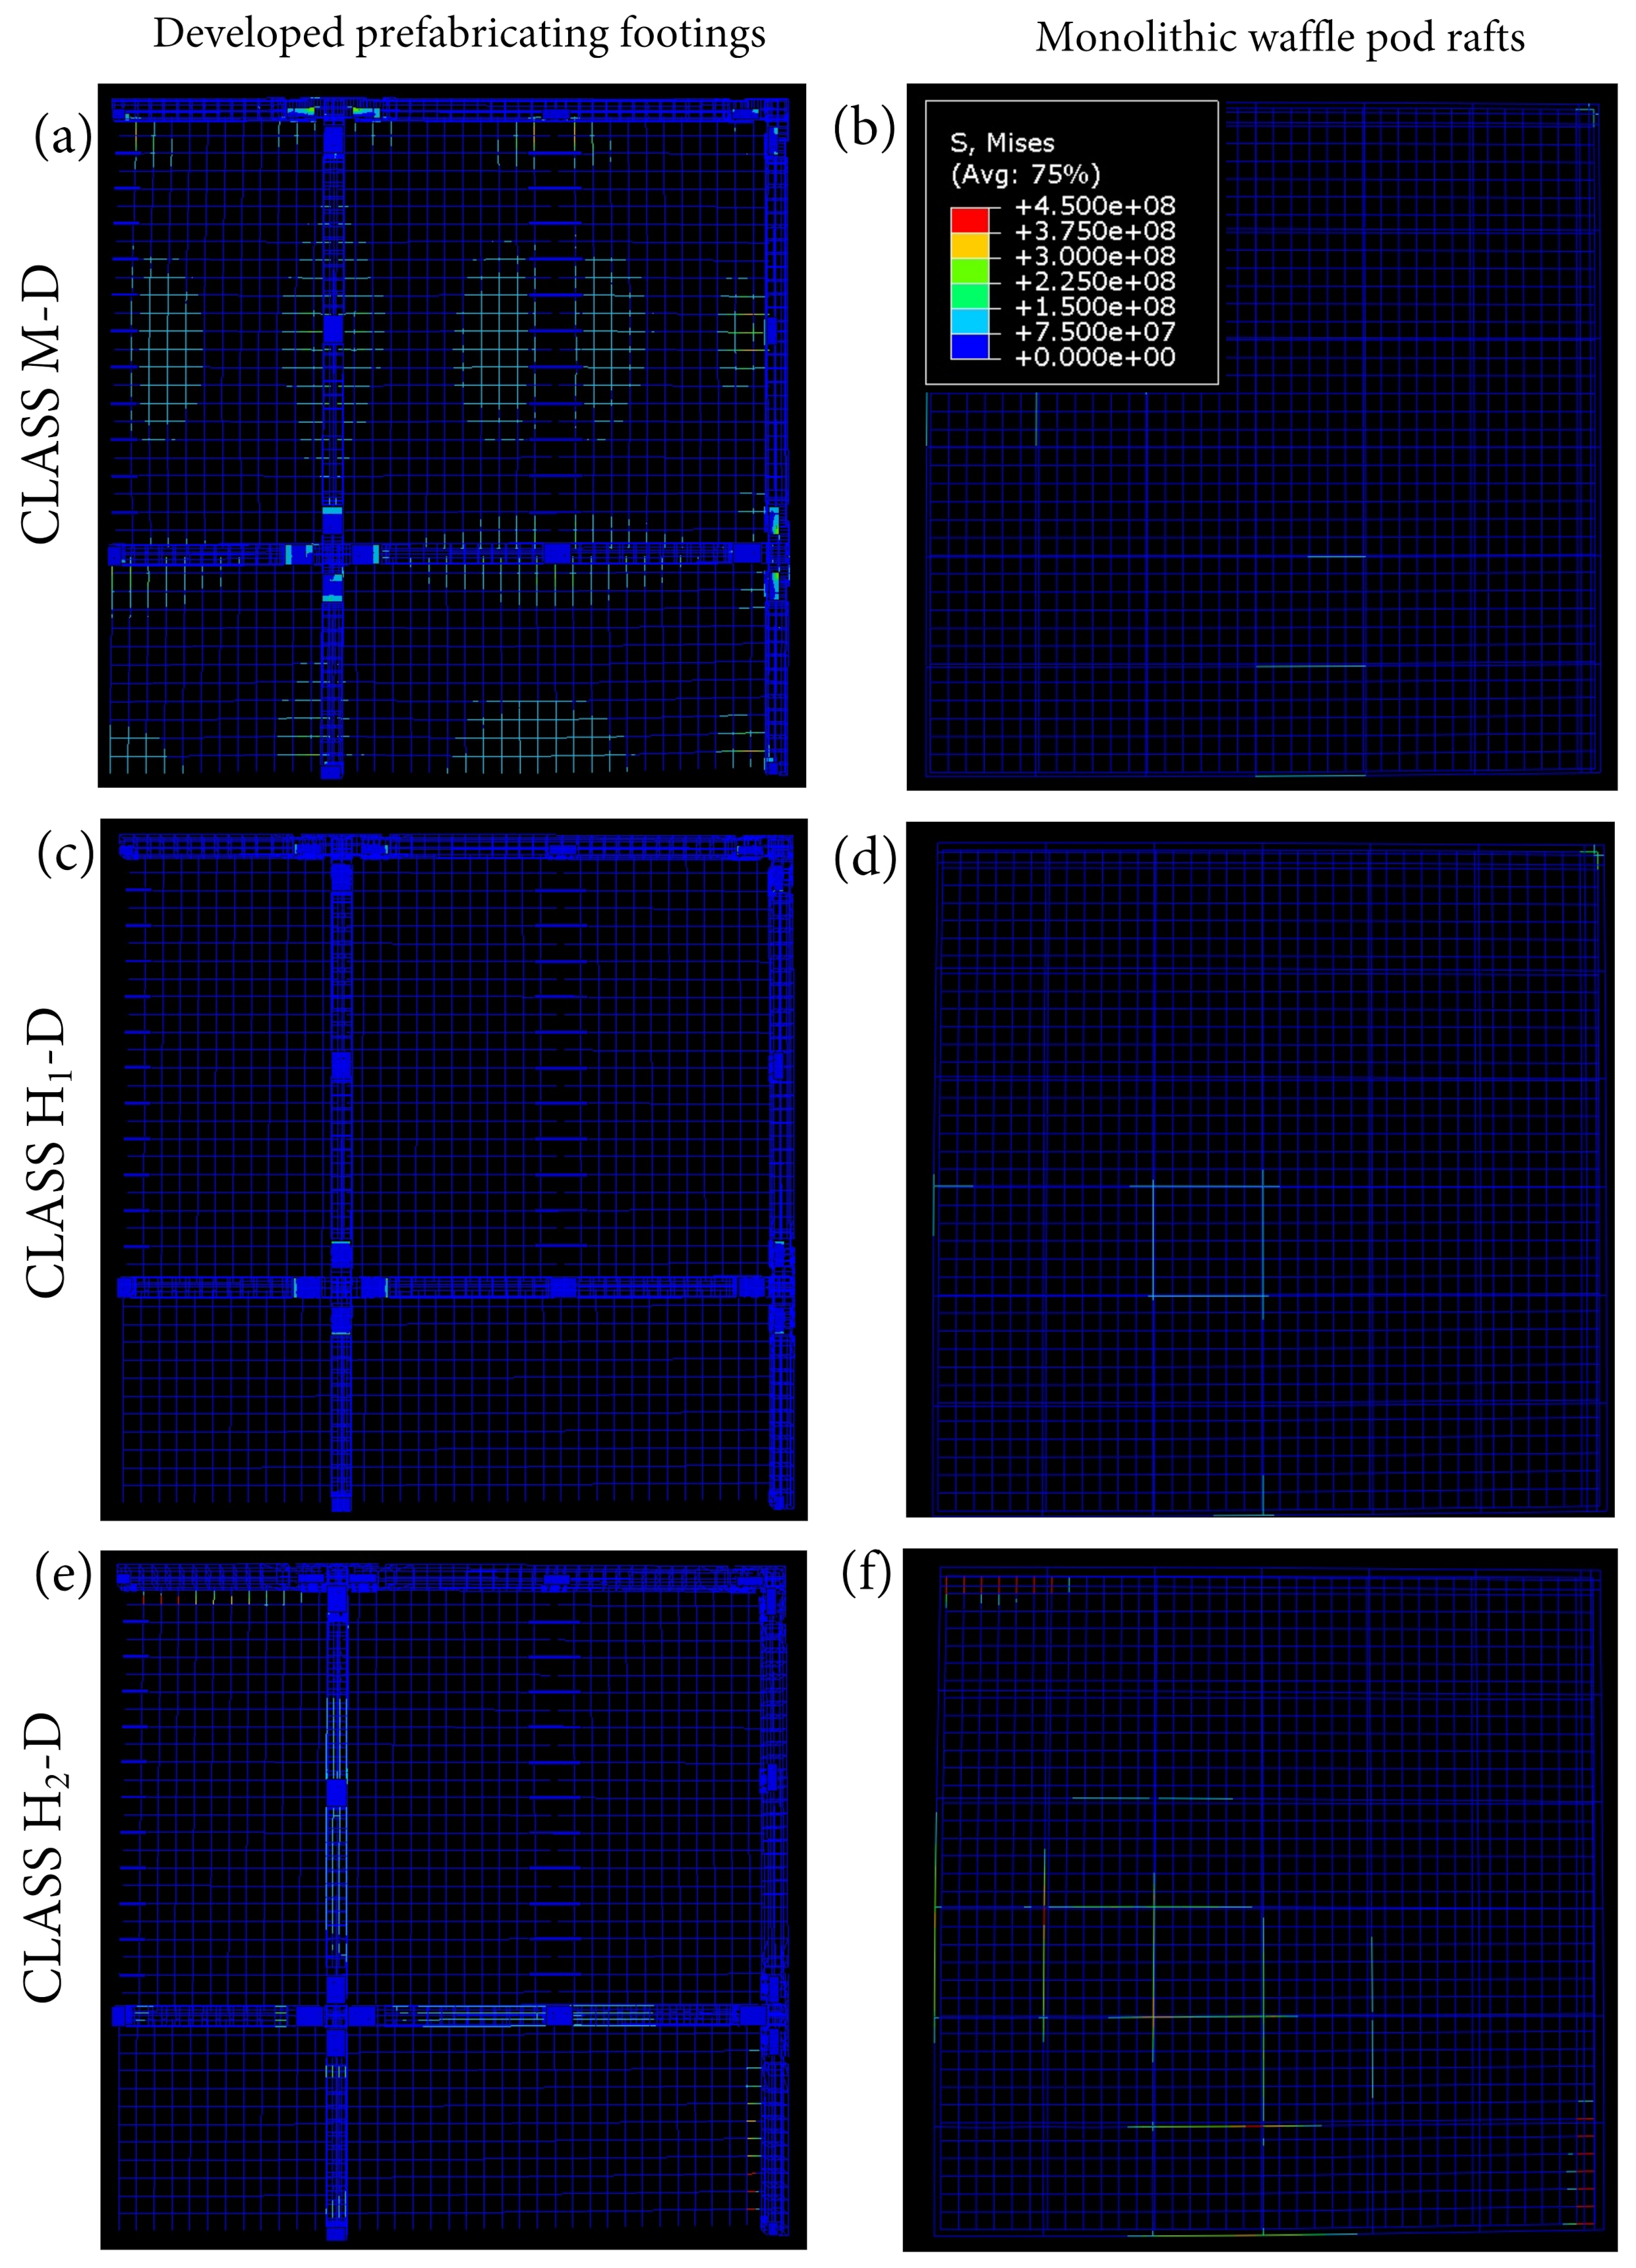
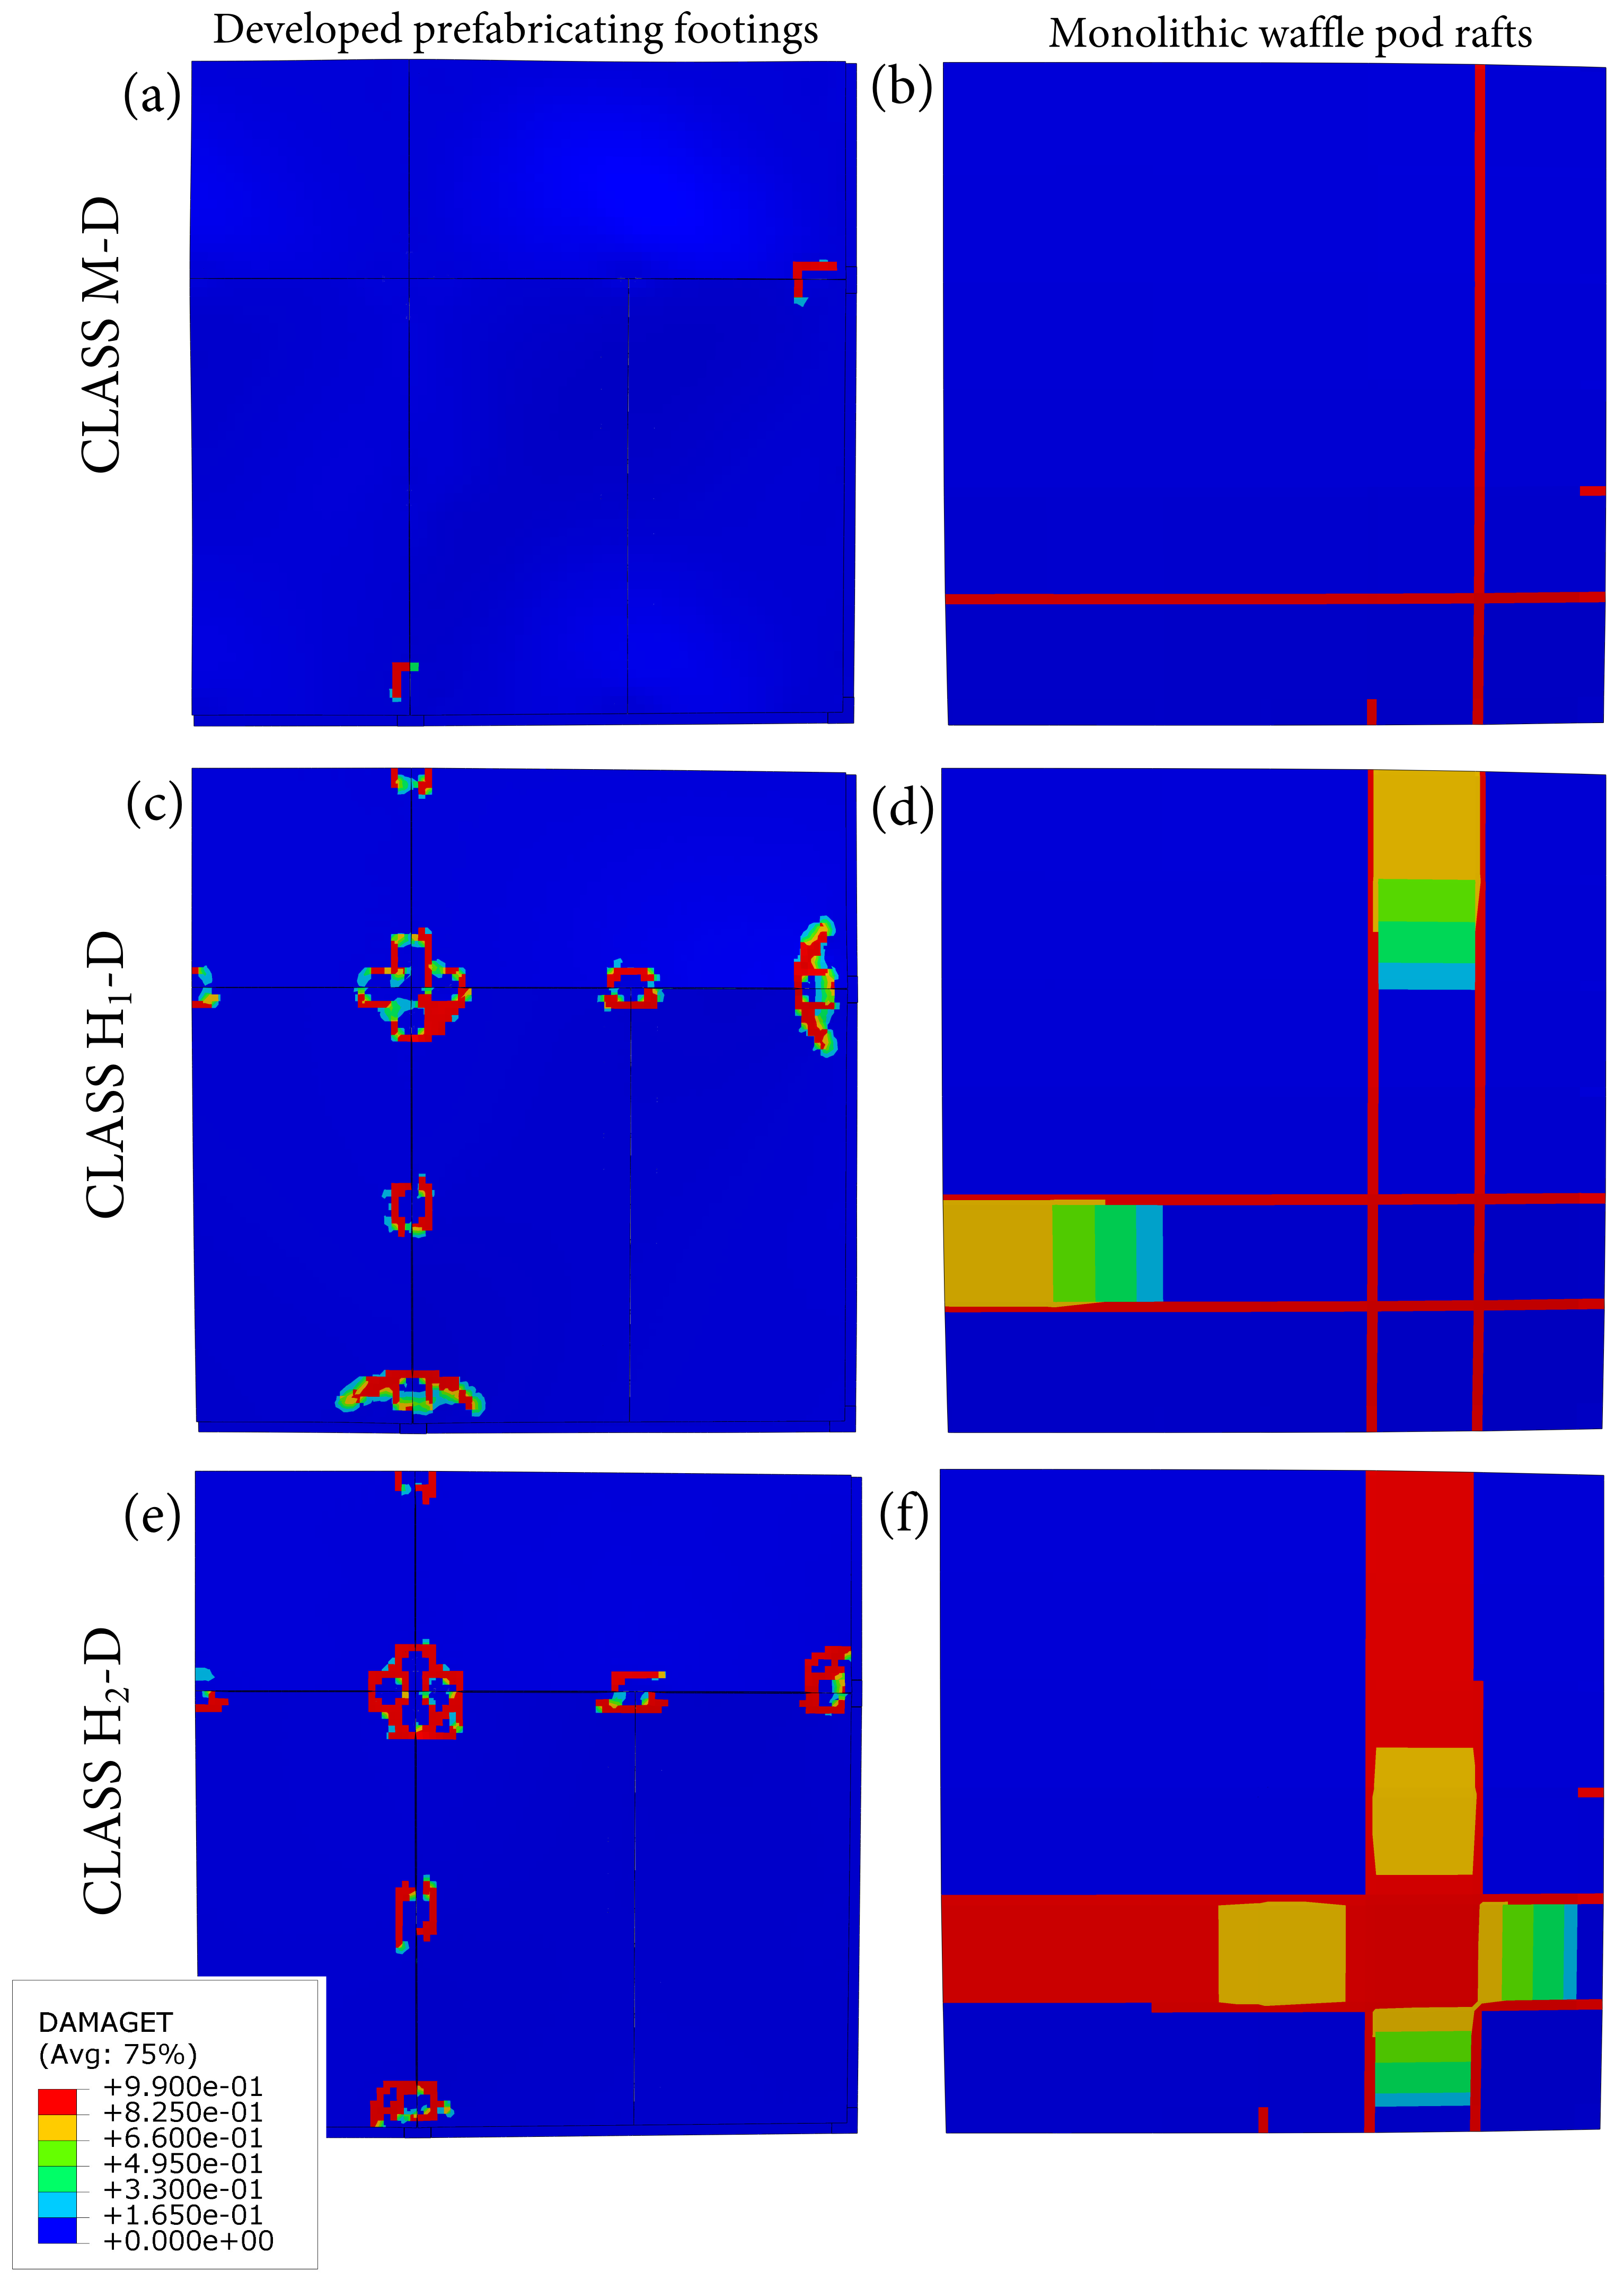
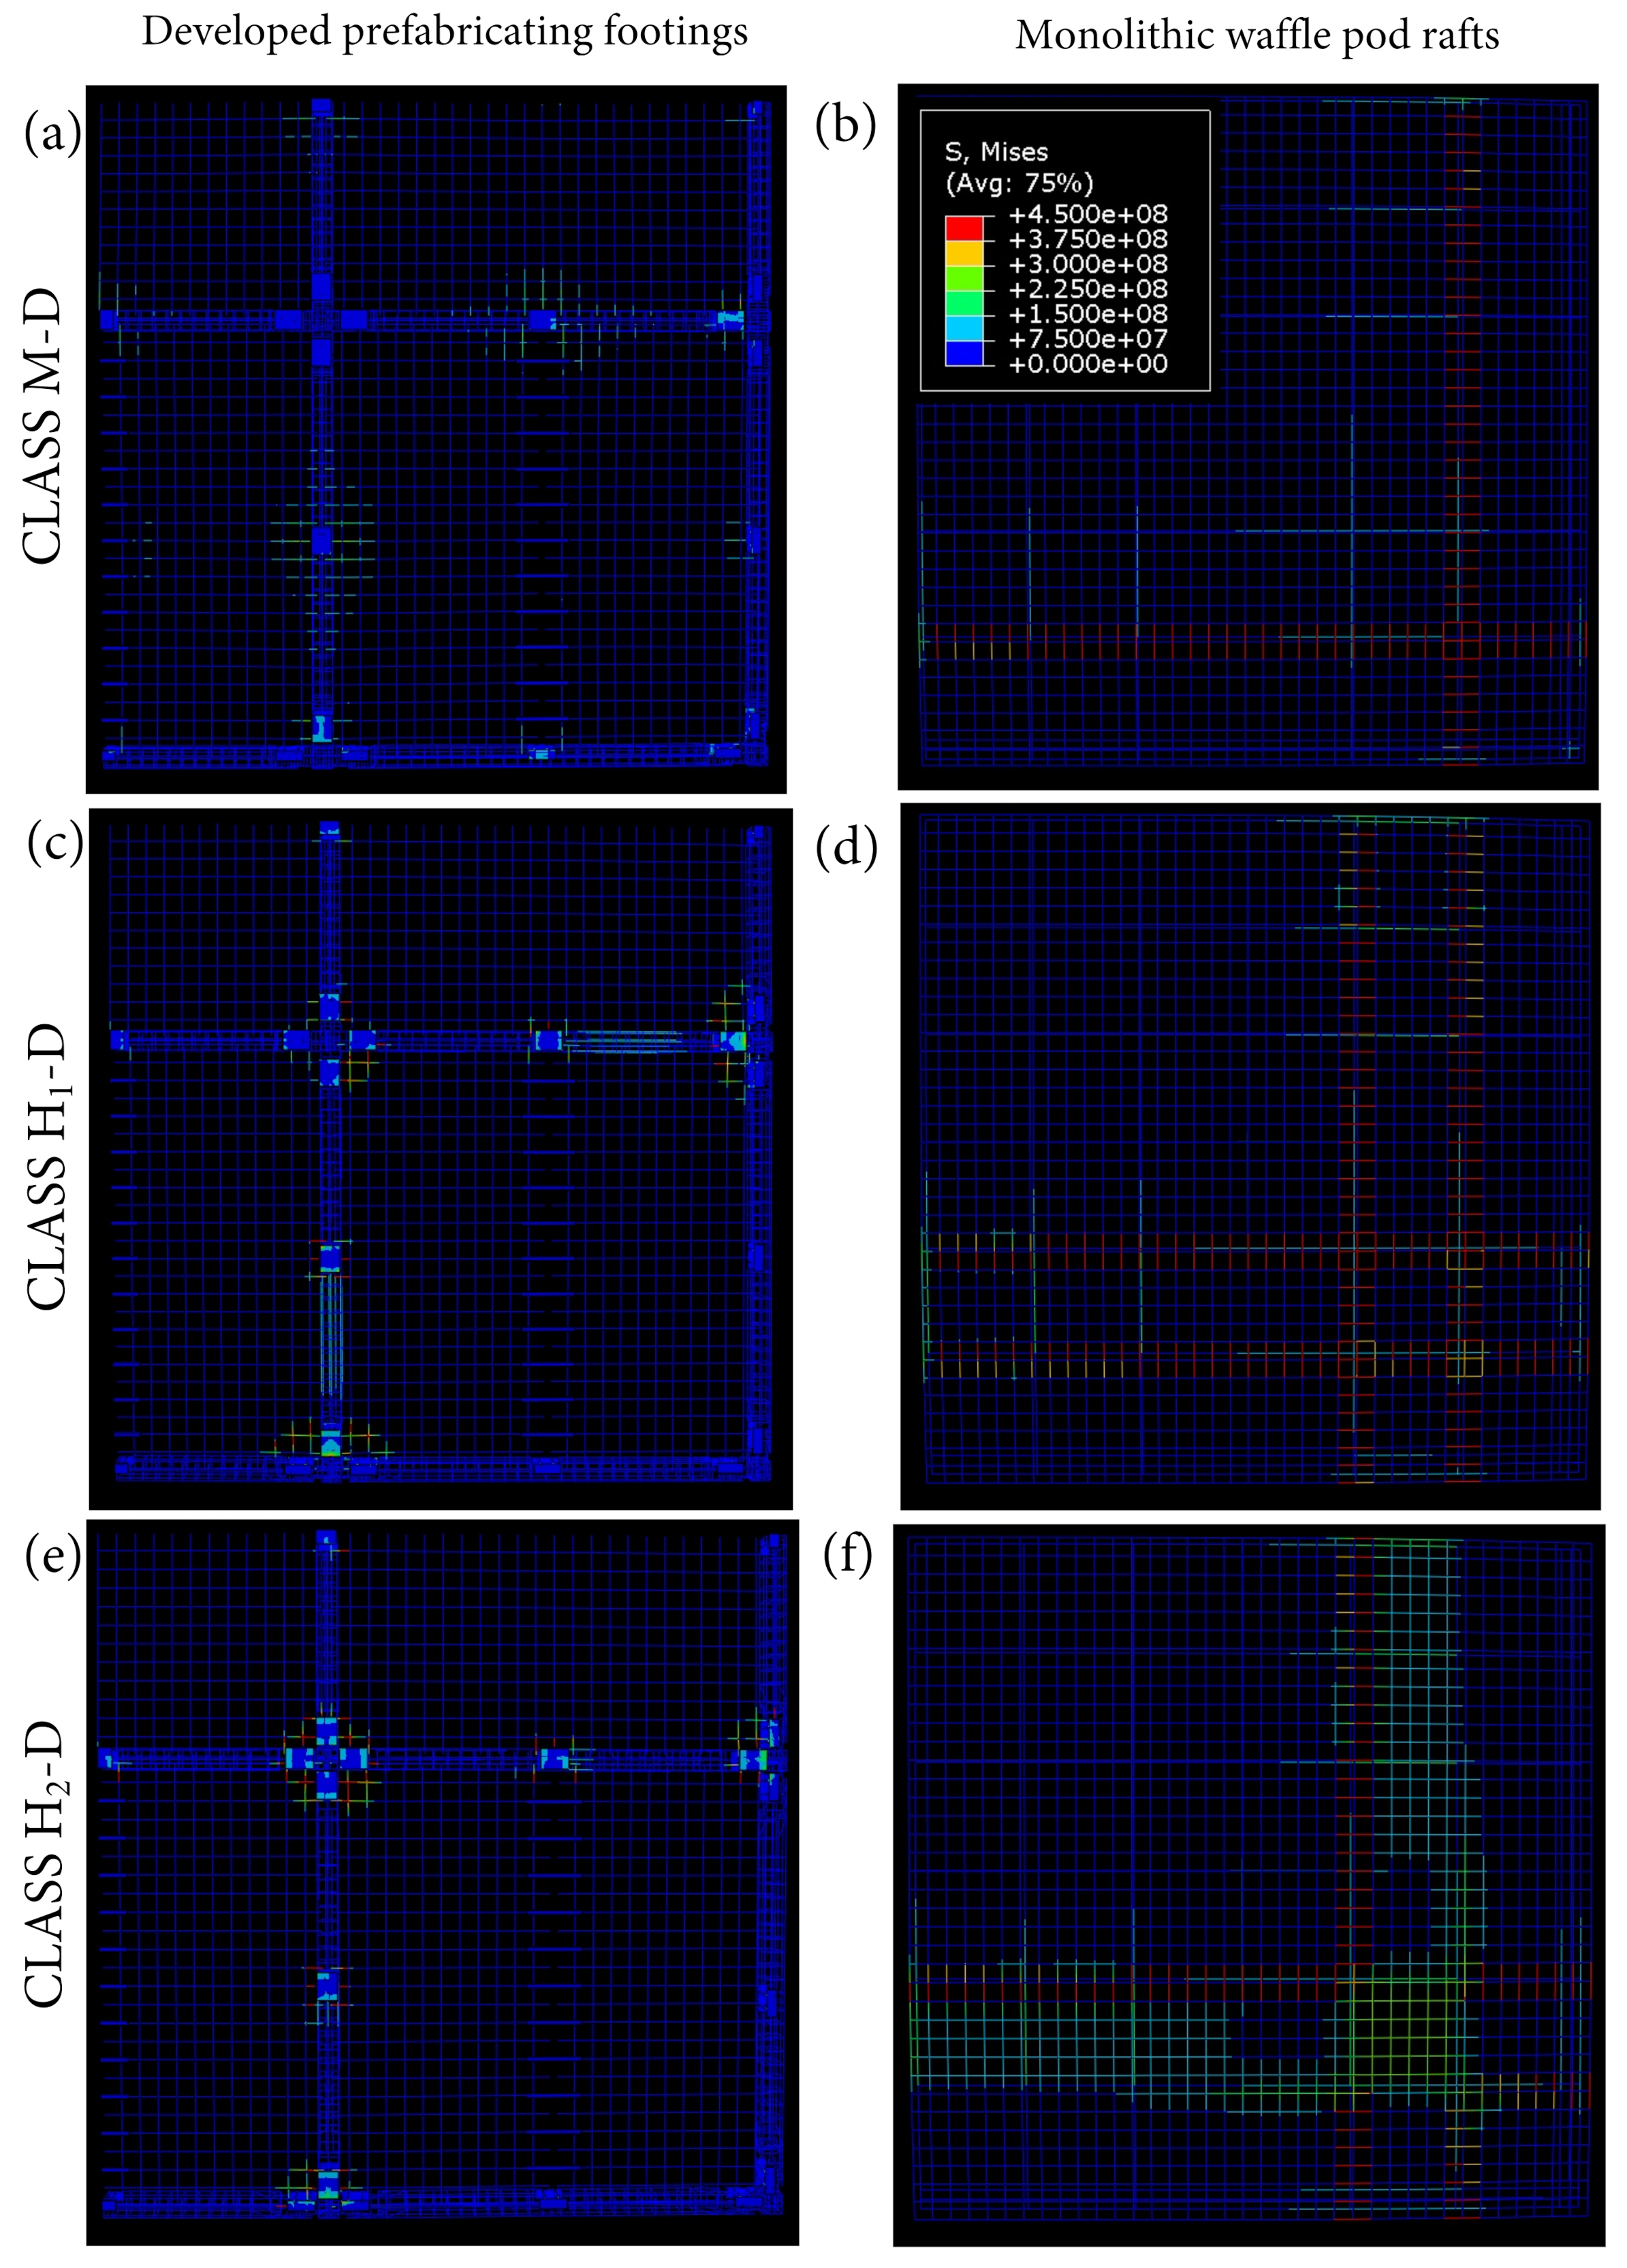
3.1. Structural Performance
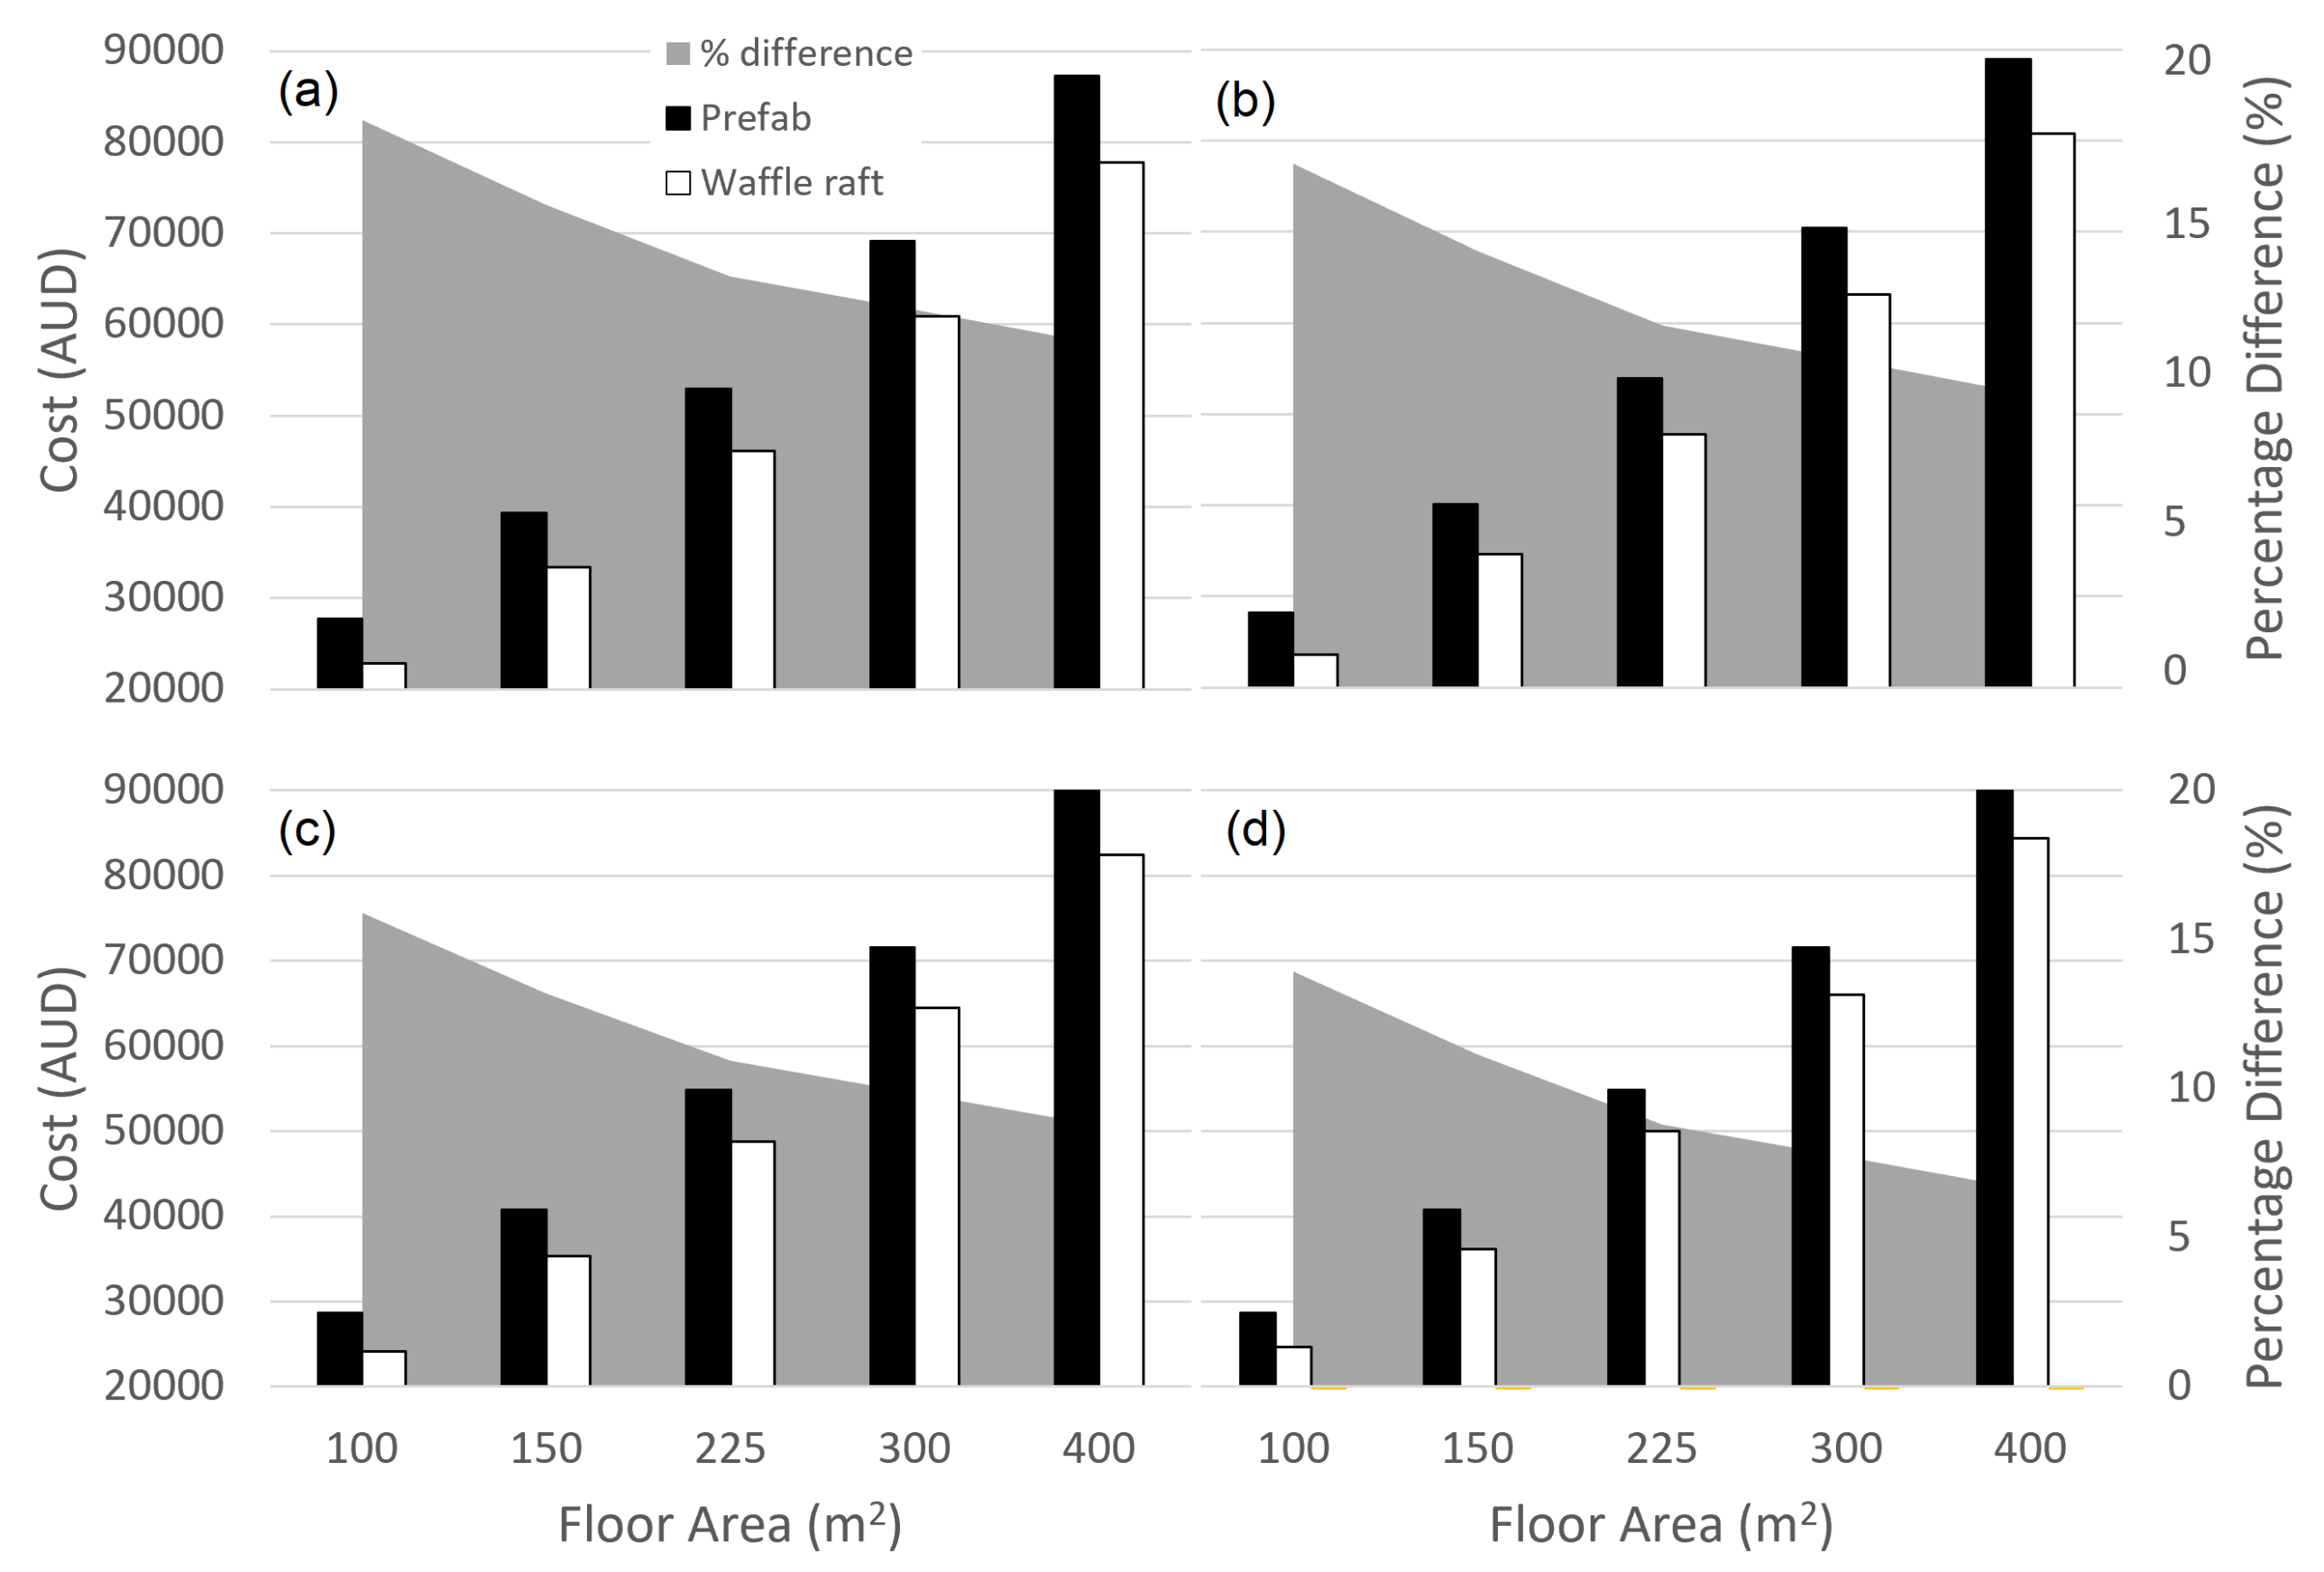
3.2. Life Cycle Cost Analysis
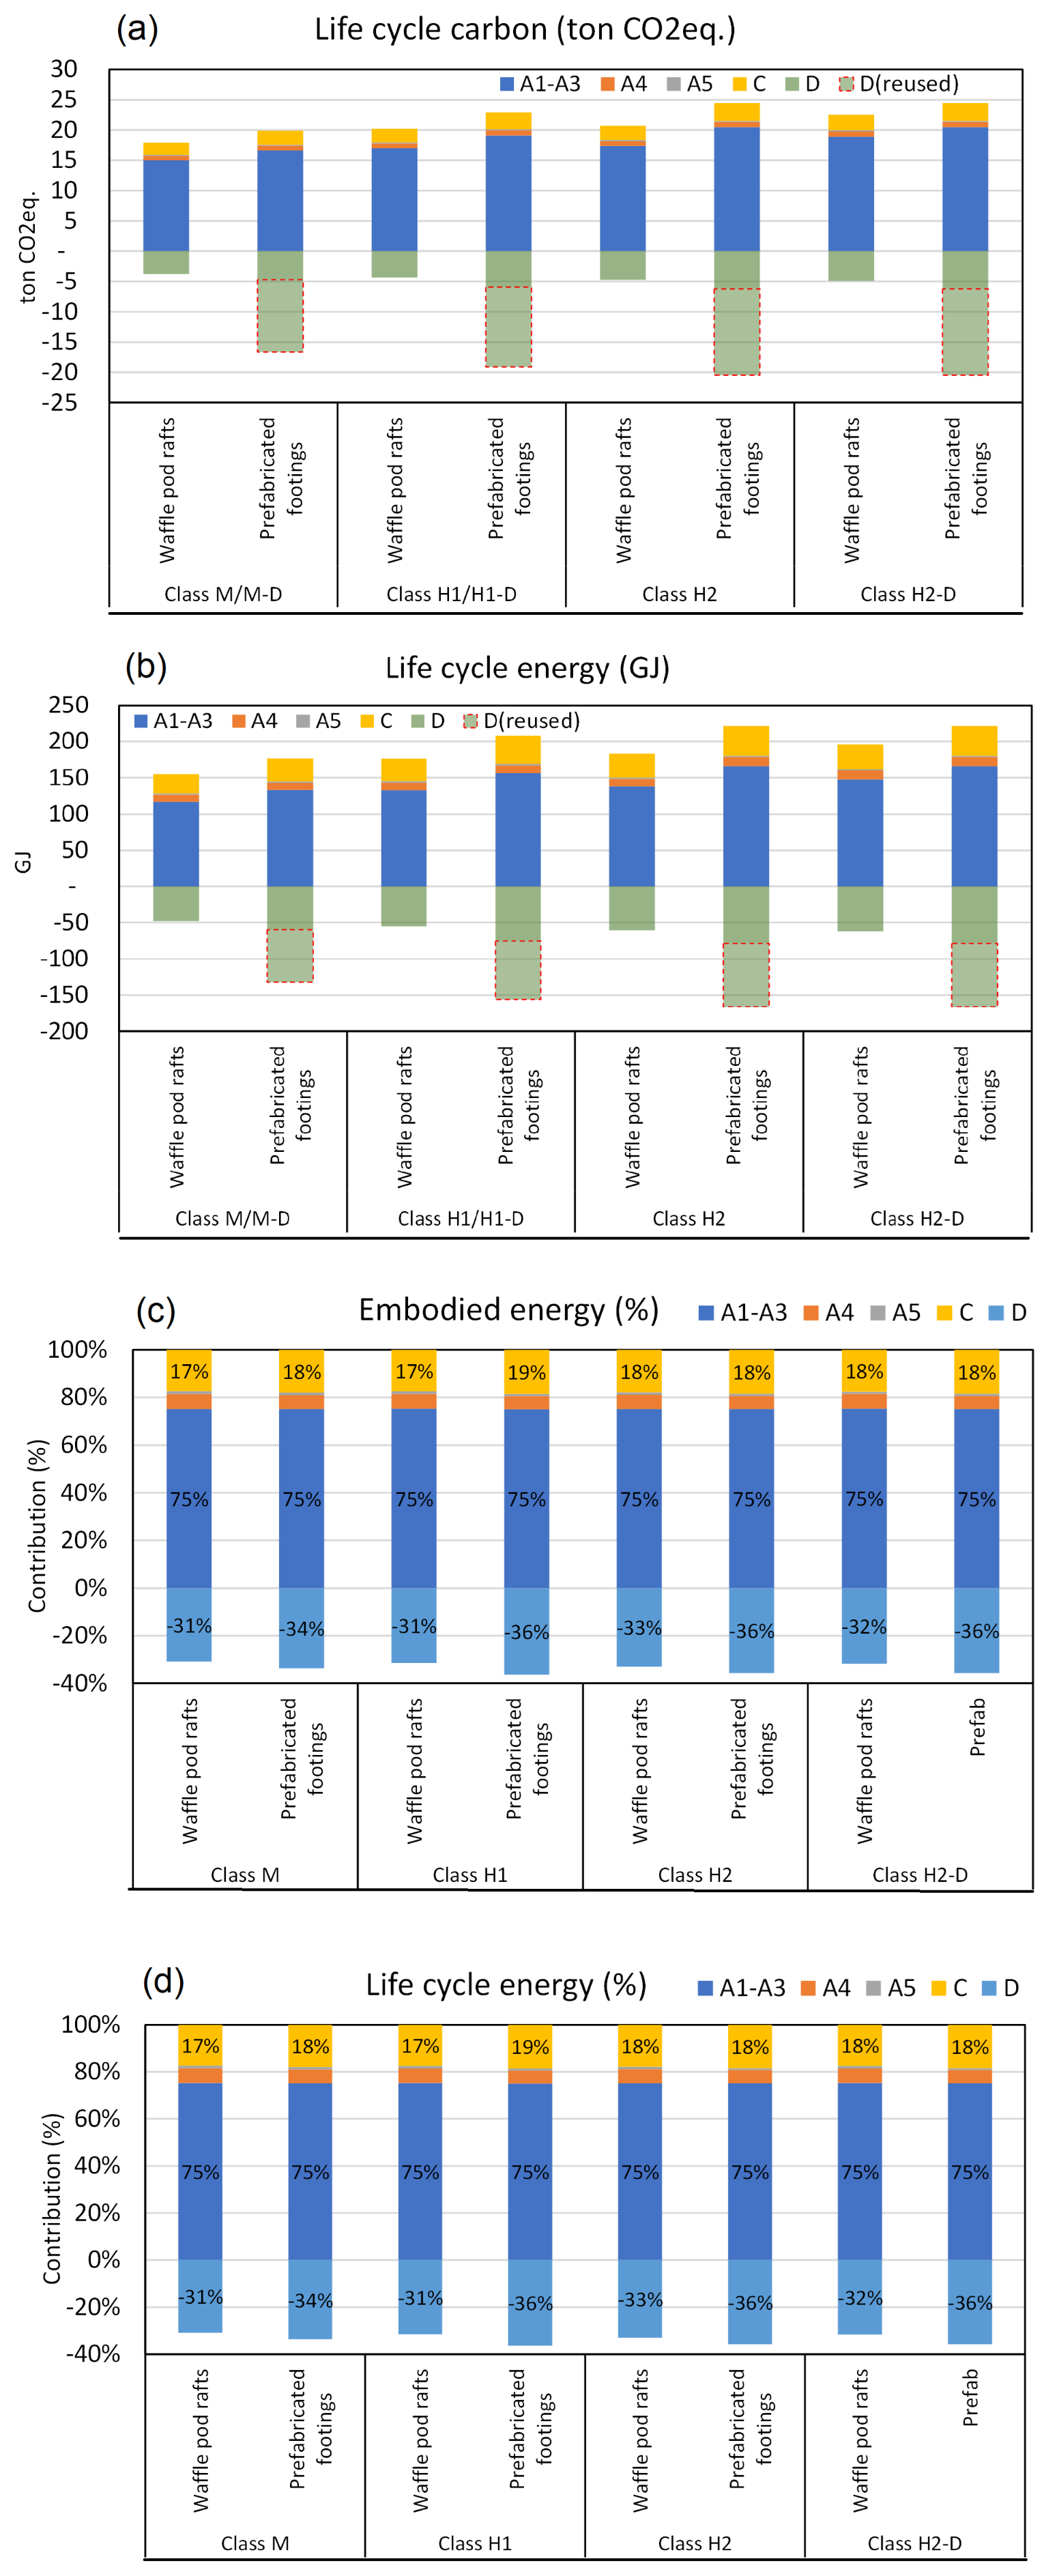
3.3. Life Cycle Assessment: Energy and Ghg
4. Conclusions
Author Contributions
Funding
Institutional Review Board Statement
Informed Consent Statement
Data Availability Statement
Conflicts of Interest
Nomenclature
| Structural performance terms and parameters | |||
| Notation | Parameter | Notation | Parameter |
| lateral restraint factor | beam width | ||
| sorption parameters | D | beam depth | |
| substructure deformation | DEB | dapped-end beam | |
| allowable deformation | concrete damage variables | ||
| average suction change | E | elastic modulus | |
| unit weight of water | concrete elastic modulus | ||
| logarithmic soil bulk constant | steel elastic modulus | ||
| coefficent of friction | Unit stiffness | ||
| Poisson’s ratio of concretel | initial/void ratio | ||
| Poisson’s ratio of steel | FEM | finite element model | |
| Poisson’s ratio of soil | other concrete variables | ||
| gravimetric soil moisture | unsaturated factor | ||
| soil suction | G | shear modulus | |
| soil/water bulk density | specific gravity of solids | ||
| total and effective stress | active depth zone | ||
| initial/equivalent soil stress | H/H-D | highly reactive soil | |
| tensile/compressive stress | H/H-D | very highly reactive soil | |
| deviatoric stress | h | water potential head | |
| tensile/compressive failure | soil layer thickness | ||
| volumetric soil moisture | instability/shrinkage index | ||
| residual/saturated | saturated conductivity | ||
| equivalent plastic strain rates | unsaturated conductivity | ||
| equivalent plastic strains | L or W | length/width of a footing | |
| soil effective strain | M/D-D | moderately reactive soil | |
| moisture-swelling strain | slope of the sorption curve | ||
| test moisture-swelling strain | Q | volumetric water flux | |
| simplified total soil strain | S | degree of saturation | |
| elastic concrete strains | temperature of concrete | ||
| plastic concrete strains | expected soil movement | ||
| Cost analysis terms and parameters | |||
| Notation | Parameter | Notation | Parameter |
| floor area | fixed cost | ||
| construction cost | indirect cost | ||
| disposal cost | discount rate | ||
| present value of disposal cost | LCC | life cycle cost | |
| future value of disposal cost | construction duration | ||
| direct cost | structure deployment period | ||
| Sustainability assessment terms and parameters | |||
| Notation | Parameter | Notation | Parameter |
| construction embodied GHG | construction embodied energy | ||
| demolition embodied GHG | demolition embodied energy | ||
| material embodied GHG | material embodied energy | ||
| reuse/recycling GHG | reuse/recycling energy | ||
| transportation GHG | transportation energy | ||
| LCA | life cycle assessment | LCI | life cycle inventory |
Appendix A. Details of the Numerical Simulations Using the Hydromechanical Model by Teodosio et al.
Appendix A.1. Simplified Hydromechanical Finite Element Model
Appendix A.2. Numerical Simulations
Appendix A.2.1. Validation of the Developed Model
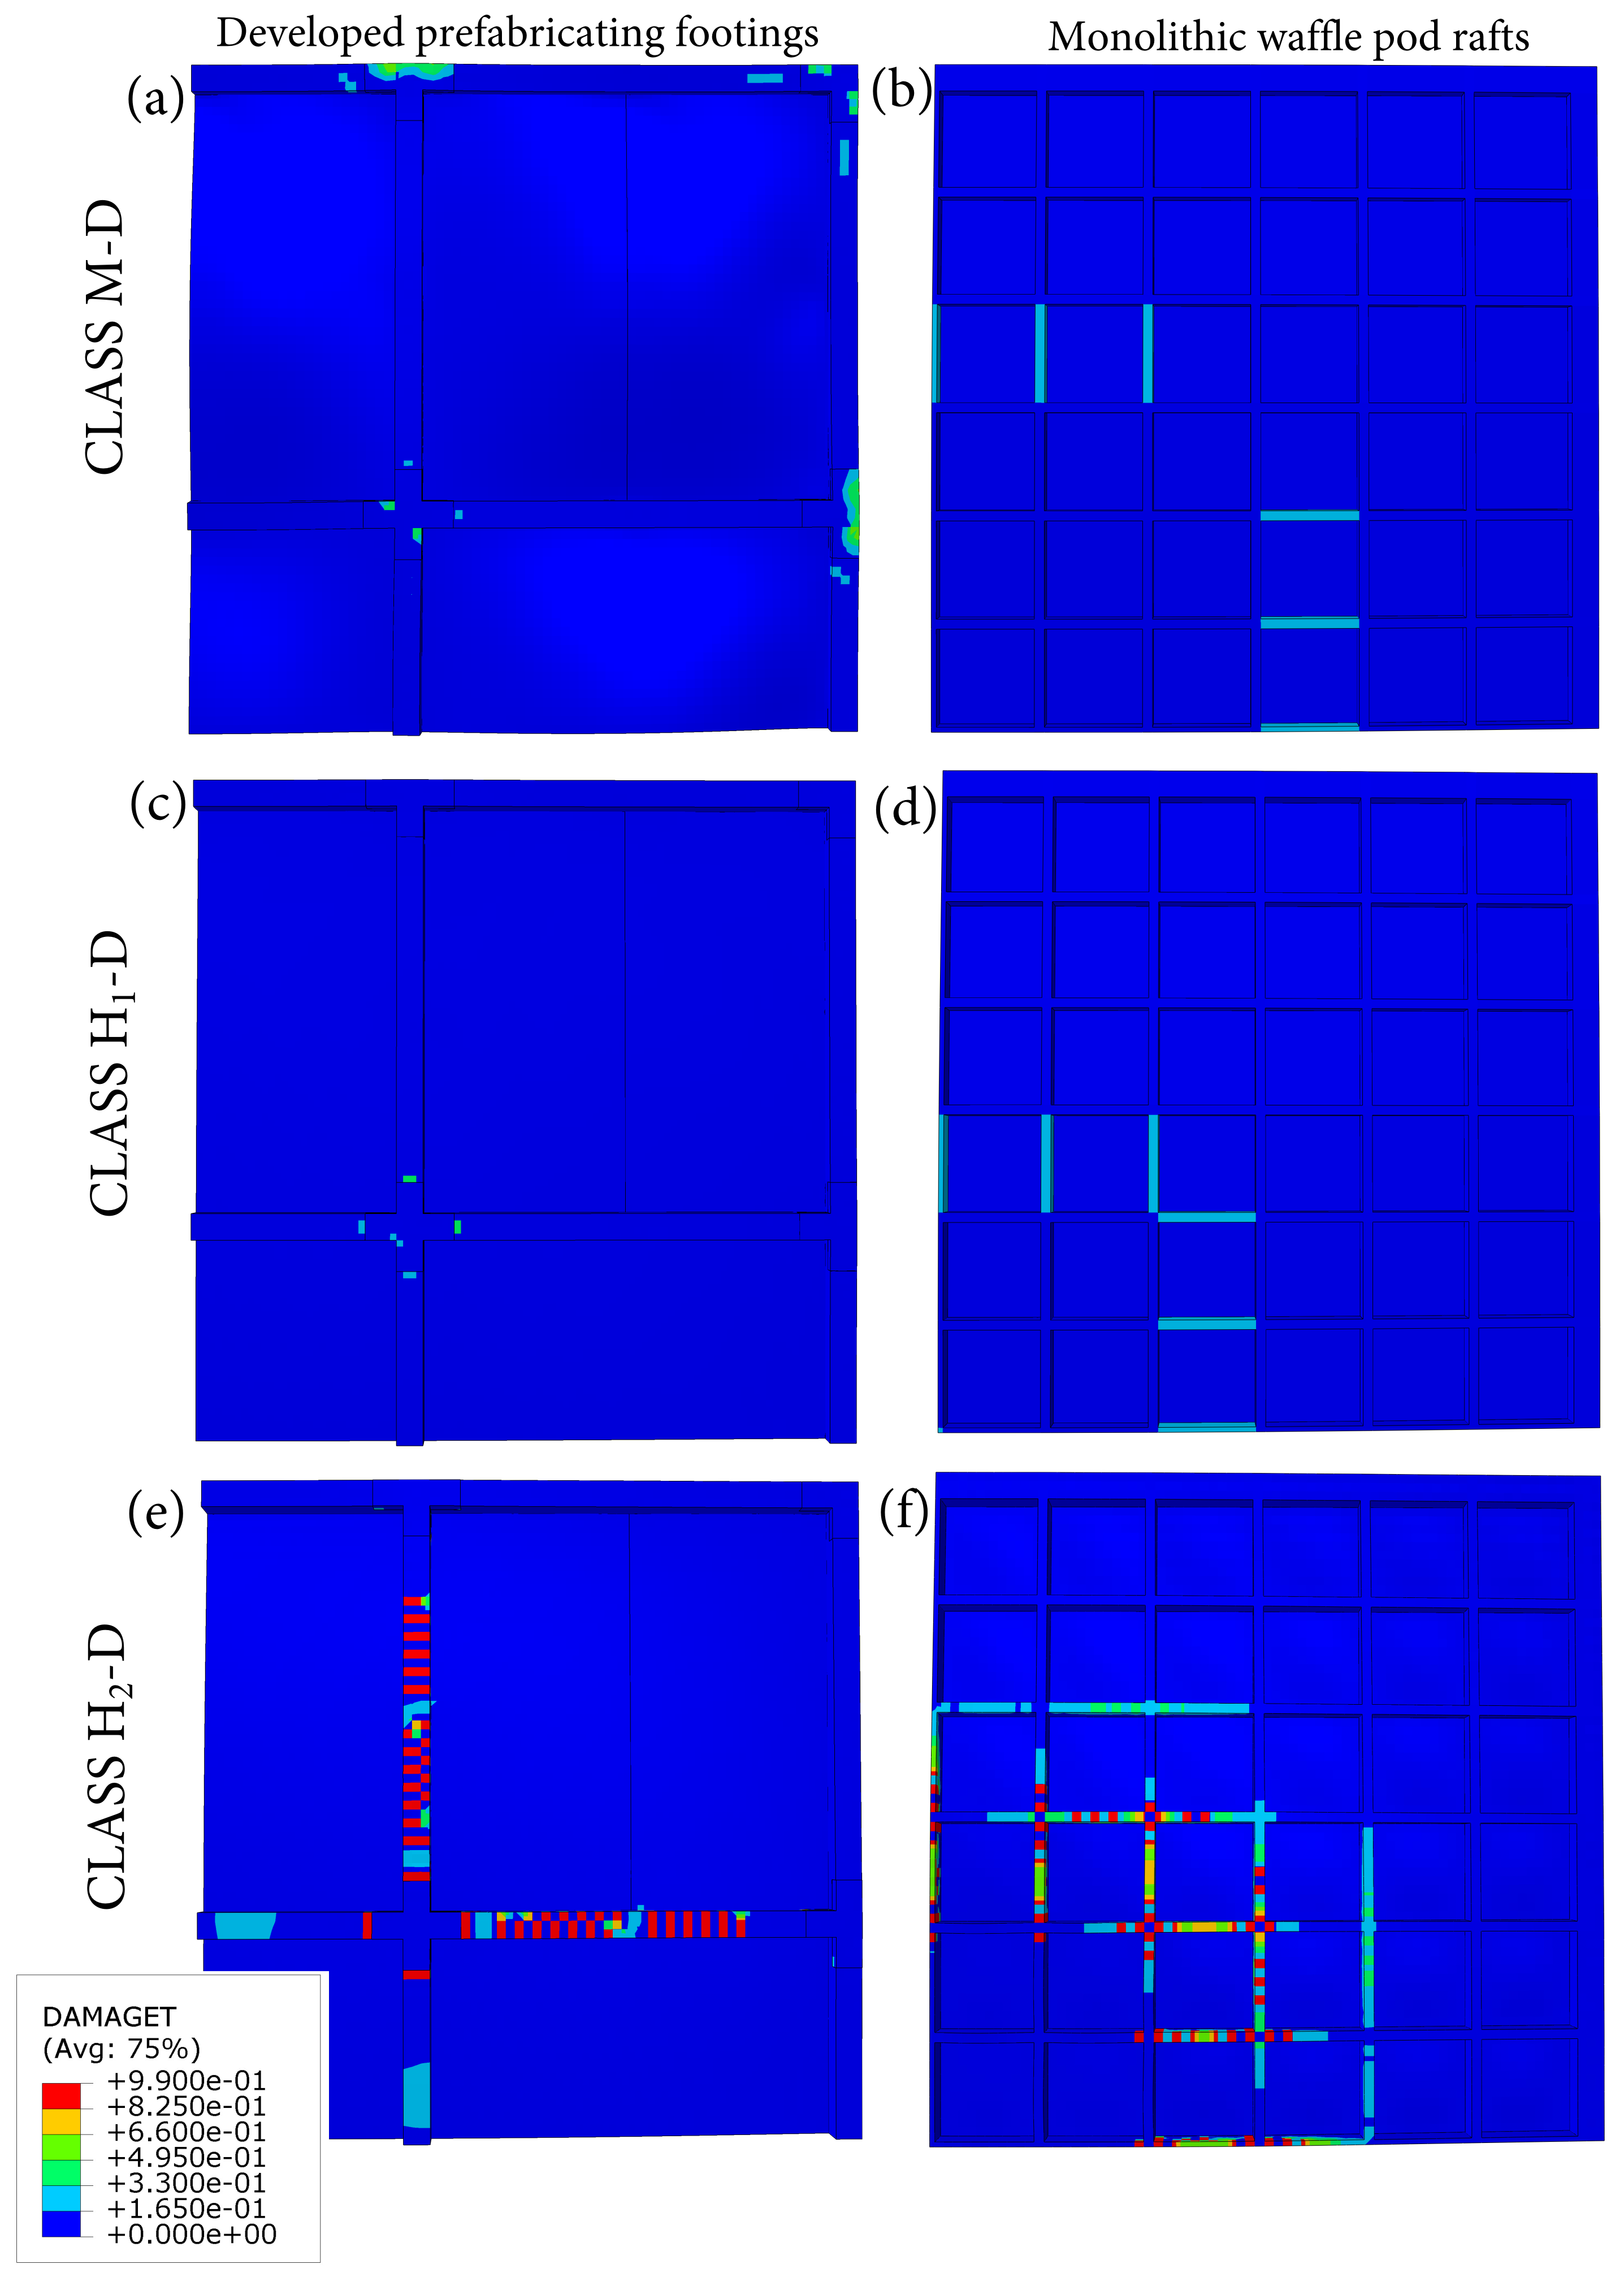
Appendix A.2.2. Developed Prefabricated Footings and Monolithic Waffle Rafts


Appendix B. Supplementary Results of the Numerical Simulations


References
- Azman, M.; Ahamad, M.; Hussin, W. Comparative study on prefabrication construction process. Int. Surv. Res. J. 2012, 2, 45–58. [Google Scholar]
- Lichtenberg, J. Slimbouwen, a strategy for efficient and sustainable building innovation. In Proceedings of the Construction in the XXI Century: Local and Global Challenges, Symposium Proceedings, CIB W065/N055/W086, Rome, Italy, 16–20 October 2006; pp. 206–207. Available online: http://hdl.handle.net/1822/6794 (accessed on 10 October 2021).
- Ross, K.; Cartwright, P.; Novakovic, O. A Guide to Modern Methods of Construction; IHS BRE Press: London, UK, 2006. [Google Scholar]
- Wong, R.; Hao, J.; Zou, P. The application of precast concrete technology in buildings and civil structures construction: Hong Kong experience. In Proceedings of the Second International Conference on Construction in the 21st Century (CITC-II), Sustainability and Innovation in Management and Technology, Hong Kong, China, 10–12 December 2003; pp. 629–634. [Google Scholar]
- Gibb, A.G. Off-Site Fabrication: Prefabrication, Pre-Assembly and Modularisation; John Wiley & Sons: Hoboken, NJ, USA, 1999. [Google Scholar]
- Ngwepe, L.; Aigbavboa, C. A theoretical review of building life cycle stages and their related environmental impacts. J. Civil Eng. Environ. Technol. 2015, 2, 7–15. [Google Scholar]
- Aye, L.; Ngo, T.; Crawford, R.H.; Gammampila, R.; Mendis, P. Life cycle greenhouse gas emissions and energy analysis of prefabricated reusable building modules. Energy Build. 2012, 47, 159–168. [Google Scholar] [CrossRef]
- Sharma, A.; Saxena, A.; Sethi, M.; Shree, V.; Varun. Life cycle assessment of buildings: A review. Renew. Sustain. Energy Rev. 2011, 15, 871–875. [Google Scholar] [CrossRef]
- Piroozfar, A.E.; Larsen, O.P.; Altan, H. Customization in building design and construction: A contribution to sustainability. In Handbook of Research in Mass Customization and Personalization; World Scientific: Singapore, 2010; pp. 911–939. [Google Scholar]
- Smith, D.; Tardif, M. BIM: A Strategic Implementation Guide for Architects, Engineers, Constructors and Real Estate Asset Managers; Wiley: Hoboken, NJ, USA, 2009. [Google Scholar]
- Nelson, S. Modular housing: Prefab and proudly upmarket. Build. Connect. 2008, 24. [Google Scholar]
- Pujadas Gispert, E. Prefabricated Foundations for Housing Applied to Room Modules. Ph.D. Thesis, Universitat Politecnica de Catalunya, Barselona, Spain, 2016. [Google Scholar]
- Teodosio, B.; Baduge, K.S.K.; Mendis, P.; Heath, D. Prefabrication of substructures for single-detached dwellings on reactive soils: A review of existing systems and design challenges. Aust. J. Civ. Eng. 2019, 7, 120–133. [Google Scholar] [CrossRef]
- Li, J.; Cameron, D.A.; Ren, G. Case study and back analysis of a residential building damaged by expansive soils. Comput. Geotech. 2014, 56, 89–99. [Google Scholar] [CrossRef] [Green Version]
- Li, J. Analysis and Modelling of Performance of Footings on Expansive Soils. Ph.D. Thesis, University Melbourne, Melbourne, Australia, 1996. [Google Scholar]
- Teodosio, B.; Baduge, S.K.; Mendis, P.; Heath, D. Soil-structure interaction design methods for residential structures on reactive soils. In Proceedings of the Australian Structural Engineering Conference: ASEC 2018, Adelaide, Australia, 25–28 September 2018; Engineers Australia: Barton, ACT, Australia, 2018; p. 49. [Google Scholar]
- Teodosio, B.; Baduge, K.S.K.; Mendis, P. A review and comparison of design methods for raft substructures on expansive soils. J. Build. Eng. 2021, 41, 102737. [Google Scholar] [CrossRef]
- Teodosio, B.; Baduge, K.S.K.; Mendis, P. Simulating reactive soil and substructure interaction using a simplified hydro-mechanical finite element model dependent on soil saturation, suction and moisture-swelling relationship. Comput. Geotech. 2020, 119, 1–18. [Google Scholar] [CrossRef]
- Li, J.; Cameron, D.A. Case study of courtyard house damaged by expansive soils. J. Perform. Constr. Facil. 2002, 16, 169–175. [Google Scholar] [CrossRef]
- Jones, L.D.; Jefferson, I. Expansive soils. In ICE Manual of Geotechnical Engineering; ICE: London, UK, 2012; pp. 413–441. [Google Scholar]
- Miao, L.; Wang, F.; Cui, Y.; Shi, S. Hydraulic characteristics, strength of cyclic wetting-drying and constitutive model of expansive soils. In Proceedings of the 4th International Conference on Problematic Soils, Wuhan, China, 21–23 September 2012; pp. 303–322. [Google Scholar]
- Skinner, H.; Crilly, M.; Charles, J. Numerical Models for the Design of Shallow Foundations for Low-rise Buildings. In Application of Numerical Methods to Geotechnical Problems; Springer: Berlin, Germany, 1998; pp. 655–664. [Google Scholar]
- Krohn, J.P.; Slosson, J.E.Y. Assessment of Expansive Soils with the United States. Available online: https://www.semanticscholar.org/paper/Assessment-of-Expansive-Soils-in-the-United-States-Krohn-Slosson/4b8f90292a30aef227ec42526031ffaabde82690 (accessed on 10 October 2021).
- Standards Australia. AS 2870-2011: Residential Slabs and Footings; Standards Australia: Sydney, Australia, 2011. [Google Scholar]
- American Society for Testing and Materials. Standard Guide for Dimensional Coordination of Rectilinear Building Parts and Systems; American Society for Testing and Materials: West Conshohocken, PA, USA, 2002. [Google Scholar]
- Bergvall, L. Dimensional Coordination as a Tool for Industrialisation. In Metric Dimensional Coordination—The Issue and Precedent; US Department of Commerce, National Bureau of Standards: Gaithersburg, MD, USA, 1977; pp. 203–204. [Google Scholar]
- Teodosio, B.; Baduge, K.S.K.; Mendis, P. Relationship between reactive soil movement and footing deflection: A coupled hydro-mechanical finite element modeling perspective. Comput. Geotech. 2020, 126, 103720. [Google Scholar] [CrossRef]
- Kim, S.; Ahn, J.; Teodosio, B.; Shin, H. Numerical analysis of infiltration in permeable pavement system considering unsaturated characteristics. J. Korean Soc. Disaster Inf. 2015, 11, 318–328. [Google Scholar] [CrossRef] [Green Version]
- Teodosio, B.; Ahn, J.; Shin, H.S. Numerical analysis of infiltration into pervious concrete-base systems. Int. J. GEOMATE Geotech. Constr. Mater. Environ. 2015, 8, 1117–1122. [Google Scholar] [CrossRef]
- Weerasinghe, D. A Failure Analysis of Small-Diameter Cast Iron Pipes in Reactive Soil Zones of Melbourne. Ph.D. Thesis, Monash University, Clayton, Australia, 2018. [Google Scholar]
- Rutqvist, J.; Börgesson, L.; Chijimatsu, M.; Kobayashi, A.; Jing, L.; Nguyen, T.; Noorishad, J.; Tsang, C.F. Thermohydromechanics of partially saturated geological media: Governing equations and formulation of four finite element models. Int. J. Rock Mech. Min. Sci. 2001, 38, 105–127. [Google Scholar] [CrossRef]
- Hillerborg, A.; Modéer, M.; Petersson, P.E. Analysis of crack formation and crack growth in concrete by means of fracture mechanics and finite elements. Cem. Concr. Res. 1976, 6, 773–781. [Google Scholar] [CrossRef]
- Dassault Systèmes. Abaqus 6.14: Online Documentation Help, Theory Manual. 2016. Available online: http://130.149.89.49:2080/v6.14/ (accessed on 24 July 2018).
- Standards Australia. AS 1289.3. 6.1 2009: Standard Method of Analysis by Sieving in Methods of Testing Soils for Engineering Purposes; SAI Global: Brisbane, Australia, 2009. [Google Scholar]
- Schofield, A.; Wroth, P. Critical State Soil Mechanics; McGraw-Hill: London, UK, 1968; Volume 310. [Google Scholar]
- Altmann, J.B.; Müller, T.M.; Müller, B.I.; Tingay, M.R.; Heidbach, O. Poroelastic contribution to the reservoir stress path. Int. J. Rock Mech. Min. Sci. 2010, 47, 1104–1113. [Google Scholar] [CrossRef]
- Altmann, J. Poroelastic Effects in Reservoir Modeling. Ph.D. Thesis, Universität Karlsruhe, Karlsruhe, Germany, 2010. [Google Scholar]
- Shams, M.A.; Shahin, M.A.; Ismail, M.A. Simulating the behaviour of reactive soils and slab foundations using hydro-mechanical finite element modelling incorporating soil suction and moisture changes. Comput. Geotech. 2018, 98, 17–34. [Google Scholar] [CrossRef] [Green Version]
- Schaap, M.G.; Leij, F.J.; Van Genuchten, M.T. Rosetta: A computer program for estimating soil hydraulic parameters with hierarchical pedotransfer functions. J. Hydrol. 2001, 251, 163–176. [Google Scholar] [CrossRef]
- Standards Australia. AS 1170.1-1989, Part 1: Dead and Live Loads and Load Combinations; SAI Global: Brisbane, Austrlia, 1989. [Google Scholar]
- Briaud, J.L.; Abdelmalak, R.; Zhang, X.; Magbo, C. Stiffened Slab-On-Grade on Shrink-Swell Soil: New Design Method. J. Geotech. Geoenviron. Eng. 2016, 142, 04016017. [Google Scholar] [CrossRef]
- Potyondy, J.G. Skin friction between various soils and construction materials. Geotechnique 1961, 11, 339–353. [Google Scholar] [CrossRef]
- Standards Australia. AS 3600–2009: Concrete Structures; SAI Global: Brisbane, Australia, 2009. [Google Scholar]
- ISO. Buildings and Constructed Assets-Service-Life Planning. 5. Life-Cycle Costing; ISO: Geneva, Switzerland, 2008. [Google Scholar]
- Asamoah, R.O.; Ankrah, J.S.; Offei-Nyako, K.; Tutu, E.O. Cost analysis of precast and cast-in-place concrete construction for selected public buildings in Ghana. J. Constr. Eng. 2016, 2016, 8785129. [Google Scholar] [CrossRef] [Green Version]
- Chan, T.K. Comparison of precast construction costs—Case studies in Australia and Malaysia. In Proceedings of the 27th Annual ARCOM Conference, Bristol, UK, 5–7 September 2011; pp. 3–12. [Google Scholar]
- Rawlinsons. Rawlinsons Construction Cost Guide 2019; Rawlinsons: Rivervale, Australia, 2019. [Google Scholar]
- De Normalisation, C.E. EN 15978 Sustainability of Construction Works—Assessment of Environmental Performance of Buildings–Calculation Method; CEN: Brussels, Belgium, 2012. [Google Scholar]
- Crawford, R.H.; Stephan, A.; Prideaux, F. Environmental Performance in Construction (EPiC) Database; The University of Melbourne: Melbourne, Australia, 2019; Available online: https://melbourne.figshare.com/articles/book/EPiC_Database/10257728 (accessed on 10 October 2021).
- AusLCI. Australian Life Cycle Inventory Database, Australian Life Cycle Assessment Society (ALCAS). 2017. Available online: http://www.auslci.com.au/ (accessed on 10 October 2021).
- Hong, T.; Ji, C.; Jang, M.; Park, H. Assessment model for energy consumption and greenhouse gas emissions during building construction. J. Manag. Eng. 2014, 30, 226–235. [Google Scholar] [CrossRef]
- Ahmed, I.M.; Tsavdaridis, K.D. Life cycle assessment (LCA) and cost (LCC) studies of lightweight composite flooring systems. J. Build. Eng. 2018, 20, 624–633. [Google Scholar] [CrossRef]
- Fityus, S.; Smith, D.; Allman, M. Expansive soil test site near Newcastle. J. Geotech. Geoenviron. Eng. 2004, 130, 686–695. [Google Scholar] [CrossRef]
- Mitchell, P. A simple method of design of shallow footings on expansive soil. In Proceedings of the Fifth International Conference on Expansive Soils 1984: Preprints of Papers, Institution of Engineers, Adelaide, Australia, 21–23 May 1984; p. 159. [Google Scholar]
- Zou, J. Assessment of the Reactivity of Expansive Soil in Melbourne Metropolitan Area; Royal Melbourne Institute of Technology: Melbourne, Australia, 2015. [Google Scholar]


| Class | Soil Footing | (mm) |
|---|---|---|
| A | gravelly and sandy soil | 0 |
| S | slightly reactive silt or clay soil | 0 to 20 |
| M | moderately reactive silt or clay soil | 20 to 40 |
| H | highly reactive clay soil | 40 to 60 |
| H | very highly reactive clay soil | 60 to 75 |
| E | extremely reactive clay soil | greater than 75 |
| P | filled, soft silt or clay, loose sands, | varying |
| sandslip, mine subsidence, collapsing | ||
| D | areas having deep-seated soil moisture changes | - |
| shall use a suffix “-D” |
| Class | Type | (mm) | D (mm) | L (m) | No. of Beams | |
|---|---|---|---|---|---|---|
| M/ | waffle raft | 110 | 310 | 15 | 13 | 8.5 |
| M-D | prefabricated | 300 | 360 | 15 | 4 | 8.5 |
| H/ | waffle raft | 110 | 385 | 15 | 13 | 8.8 |
| H-D | prefabricated | 300 | 450 | 15 | 4 | 8.8 |
| H/ | waffle raft | 110 | 460 | 15 | 13 | 9.0 |
| H-D | prefabricated | 300 | 530 | 15 | 4 | 9.0 |
| Notation Soil Parameters | Parameter | Value | References |
|---|---|---|---|
| soil density | 1550 to | [34] | |
| log bulk | 0.05 (swell) | [35], | |
| modulus | 0.03 (shrink) | [30] | |
| [36] | |||
| [37] | |||
| soil Poisson’s | 0.45 (swell) | [38] | |
| ratio | 0.1 (shrink) | ||
| vs. S | moisture-swelling | 8% | [34], |
| curve | [38] | ||
| saturated permeability | 1 × 10 to | [34], | |
| 1 × 10 ms | [39] | ||
| vs. S | sorption curve | −1 × 10 to | [34], |
| −1 × 10 kPa | [18] | ||
| Environmental Parameters | |||
| average suction change | 1.2 pF | [24] | |
| active depth zone | 3.0 m | [24] | |
| Footing and Stress Parameters | |||
| p | area load | 2.5 | [40], |
| kN m | [41] | ||
| q | line load | 6.5 | [40], |
| kN m | [41] | ||
| coefficient of | 0.35 (soil-concrete) | [42], | |
| friction | 0.4 (concrete-concrete) | [38] | |
| concrete elastic | 40 | [43], | |
| modulus | GPa | [24] | |
| concrete Poisson’s | 0.2 | [43], | |
| ratio | [38] | ||
| steel elastic | 450 | [43], | |
| modulus | GPa | [27] | |
| steel Poisson’s | 0.3 | [43], | |
| ratio | [27] | ||
| Item | Description | Qty | Unit | Rate (AUD) | Amount (AUD) |
|---|---|---|---|---|---|
| A | Site preparation | ||||
| A1 | Slab set-out | 1 | Item | 600.00 | 600.00 |
| A2 | Mobilisation and float costs | 1 | Item | 900.00 | 900.00 |
| A3 | Removal of vegetation | 225 | m | 2.14 | 481.50 |
| and ground leveling | |||||
| A4 | Site soil compaction | 225 | m | 1.85 | 416.25 |
| A5 | Installation/removal of fencing | 60 | Lm | 42.00 | 2520.00 |
| B | Formwork and reinforcement | ||||
| B1 | Steel reinforcement (Beam) | 1.34 | t | 2260.00 | 3020.65 |
| B2 | Mesh (Slab) | 0.81 | t | 2260.00 | 1836.00 |
| B3 | M20 dowel | 192 | Item | 11.88 | 2280.96 |
| B4 | Plant (form release/installation) | 11.63 | hr | 63.00 | 732.58 |
| C | Concrete work | ||||
| C1 | Concrete mix | 42.71 | m | 200.00 | 8541.00 |
| C2 | Manufacturing plant processes | 26.69 | hr | 60.50 | 1614.78 |
| D | Delivery and installation | ||||
| D1 | Float of prefabricated | 10,462.73 | t km | 0.09 | 941.65 |
| elements to site | |||||
| D2 | Mobilisation of crane | 1 | Item | 500.00 | 500.00 |
| D3 | Crane hire (+ operator/fuel) | 14.40 | hr | 220.00 | 3168.00 |
| D4 | Tradesman (+ lifting/installation) | 28.8 | hr | 63.00 | 1814.40 |
| E | Miscellaneous | ||||
| E1 | Concrete batching plant overheads | 1 | Item | 3237.99 | 3237.99 |
| (20 % of construction cost) | |||||
| E2 | Drawings | 36 | Item | 63.89 | 2300.00 |
| E3 | HSE Plan | 1 | Item | 1500.00 | 1500.00 |
| F | End of life | ||||
| F1 | Mobilisation of crane | 2 | Item | 500.00 | 1000.00 |
| F2 | HSE Plan | 1 | Item | 1500.00 | 1500.00 |
| F3 | Crane hire (+ operator/fuel) | 28.80 | hr | 220.00 | 6336.00 |
| F4 | Tradesman | 57.6 | hr | 63.00 | 3628.80 |
| TOTAL LCC | 53,157.06 | ||||
| Item | Description | Qty | Unit | Rate (AUD) | Amount (AUD) |
|---|---|---|---|---|---|
| A | Site preparation | ||||
| A1 | Slab set-out | 1 | Item | 600.00 | 600.00 |
| A2 | Mobilisation and float costs | 1 | Item | 900.00 | 900.00 |
| A3 | Removal of vegetation | 225 | m | 2.14 | 481.50 |
| and ground leveling | |||||
| A4 | Site soil compaction | 225 | m | 1.85 | 416.25 |
| A5 | Installation (+ removal) of fencing | 60 | Lm | 42.00 | 2520.00 |
| B | Formwork and reinforcement | ||||
| B1 | Steel reinforcement (Beam) | 0.80 | t | 2260.00 | 3020.65 |
| B2 | Mesh (Slab) | 0.81 | t | 2260.00 | 1836.00 |
| B3 | Formwork | 60 | Lm | 30.00 | 1800.00 |
| B4 | Waffle pods | 163 | No. | 10.00 | 1630.00 |
| B5 | Tradesman (placing and tie) | 17.55 | hr | 63.00 | 1106.00 |
| B6 | Tradesman (+ formwork) | 17.4 | hr | 63.00 | 1096.20 |
| B7 | Labourer | 6 | hr | 60.50 | 350.30 |
| C | Concrete pour | ||||
| C1 | Concrete (+ delivery truck) | 43.18 | m | 200.00 | 8636.06 |
| C2 | Concrete pumping | 43.18 | hr | 8.00 | 345.44 |
| C3 | Labourer (pour/vibration/finish) | 47 | hr | 60.50 | 2839.57 |
| E | End of life | ||||
| E1 | Demobilisation (break-up/removal) | 225 | m | 90.00 | 20,250.00 |
| TOTAL LCC | 48,244.27 | ||||
| Item by Life Cycle | Unit | Energy (MJ Unit) | GHG (kg COe Unit) | References |
|---|---|---|---|---|
| Construction (A) | ||||
| Concrete (32 MPa) | m | 2776.00 | 412.00 | [50] |
| Hot-rolled steel | kg | 30.60 | 2.40 | [50] |
| Gantry crane | hr | 190.60 | 14.10 | [51] |
| Transportation (A4, C2) | ||||
| Truck (15–30 tonne) | tkm | 2.71 | 0.203 | [50] |
| Excavator (0.2 m bucket) | tkm | 0.74 | 0.053 | [51] |
| Mobile crane (50 ton) | hr | 190.60 | 14.10 | [51] |
| Construction | ||||
| Excavator | MJ/hr | 107.50 | 13.12 | [51] |
| Concrete pump | hr | 1094.30 | 81.40 | [52] |
| Mobile crane | hr | 190.60 | 14.20 | [51] |
| End of life | ||||
| Concrete demolition (C) | kg | 0.007 | 0.00054 | [50] |
| Recycling aggregates | kg | 0.07 | 0.006 | [50] |
| Recycling steel | kg | 11 | 0.74 | [50] |
| Benefit by recycling (D) | ||||
| Recycled aggregates | kg | −0.213 | −0.0169 | [50] |
| Recycling steel | kg | −30.3 | −2.4 | [50] |
| Class | Scenario | Prefabricated Footing | Waffle Raft | ||||||
|---|---|---|---|---|---|---|---|---|---|
| = 30 (mm) | = 45 (mm) | = 60 (mm) | = 75 (mm) | = 30 (mm) | = 45 (mm) | = 60 (mm) | = 75 (mm) | ||
| M/ | swell | 23 | 25 | - | - | 25 | 33 | - | - |
| M-D | shrink | 25 | 27 | - | - | 25 | 39 | - | - |
| H/ | swell | - | 22 | 25 | - | - | 33 | 43 | - |
| H-D | shrink | - | 27 | 38 | - | - | 39 | 51 | - |
| H/ | swell | - | - | 36 | 39 | - | - | 38 | 48 |
| H-D | shrink | - | - | 32 | 39 | - | - | 42 | 63 |
| M/M-D Concrete | Prefabricated Footings | Waffle Rafts | ||||
|---|---|---|---|---|---|---|
| Section Vol. (m/unit) | Number (unit) | Vol. (m/unit) | Section Vol. (m/unit) | Number (unit) | Vol. (m/unit) | |
| Beams | 0.50 | 8 | 3.96 | 0.85 | 13 | 11.05 |
| Slabs | 28.13 | 1 | 28.13 | 19.13 | 1 | 19.13 |
| Total | 32.09 | 30.18 | ||||
| Steel | Diameter | Length | Mass | Diameter | Length | Mass |
| (m) | (m) | (kg) | (m) | (m) | (kg) | |
| Flexural | 0.000491 | 1234.21 | 522 | 0.000113 | 390.00 | 449 |
| Shear | 0.000201 | 159.36 | 243 | - | - | - |
| Mesh | 0.000050 | 2250.00 | 625 | 0.000038 | 2250.00 | 625 |
| Bolts | 0.000314 | 57.60 | 16 | - | - | - |
| Plates | 0.001100 | 12.00 | 8 | - | - | - |
| Total | 1424 | 1074 | ||||
| H/H-D | Section vol. | Number | Vol. | Section vol. | Number | Vol. |
| Concrete | (m/unit) | (unit) | (m) | (m/unit) | (unit) | (m) |
| Beams | 0.90 | 8 | 7.20 | 1.13 | 13 | 14.70 |
| Slabs | 28.13 | 1 | 28.13 | 19.13 | 1 | 19.13 |
| Total | 35.33 | 33.83 | ||||
| Steel | Diameter | Length | Mass | Diameter | Length | Mass |
| (m) | (m) | (kg) | (m) | (m) | (kg) | |
| Flexural | 0.000491 | 1706.89 | 722 | 0.000113 | 390.00 | 449 |
| Shear | 0.000201 | 220.39 | 336 | - | - | - |
| Mesh | 0.000050 | 2250.00 | 813 | 0.000050 | 2250.00 | 813 |
| Bolts | 0.000314 | 57.60 | 16 | - | - | - |
| Plates | 0.001100 | 12.00 | 8 | - | - | - |
| Total | 1895 | 1262 | ||||
| H/H-D | Section vol. | Number | Vol. | Section vol. | Number | Vol. |
| Concrete | (m/unit) | (unit) | (m) | (m/unit) | (unit) | (m) |
| Beams | 1.26 | 8 | 10.08 | 0.76/1.42 | 13 | 14.70/18.42 |
| Slabs | 28.13 | 1 | 28.13 | 19.13 | 1 | 19.13 |
| Total | 38.21 | 33.83/37.55 | ||||
| Steel | Diameter | Length | Mass | Diameter | Length | Mass |
| (m) | (m) | (kg) | (m) | (m) | (kg) | |
| Flexural | 0.000491 | 2127.04 | 890 | 0.000201 | 390.00 | 798 |
| Shear | 0.000201 | 274.64 | 419 | - | - | - |
| Mesh | 0.000050 | 2250.00 | 625 | 0.000050 | 2250.00 | 625 |
| Bolts | 0.000314 | 57.60 | 16 | - | - | - |
| Plates | 0.001100 | 12.00 | 8 | - | - | - |
| Total | 1959 | 1423 | ||||
Publisher’s Note: MDPI stays neutral with regard to jurisdictional claims in published maps and institutional affiliations. |
© 2021 by the authors. Licensee MDPI, Basel, Switzerland. This article is an open access article distributed under the terms and conditions of the Creative Commons Attribution (CC BY) license (https://creativecommons.org/licenses/by/4.0/).
Share and Cite
Teodosio, B.; Bonacci, F.; Seo, S.; Baduge, K.S.K.; Mendis, P. Multi-Criteria Analysis of a Developed Prefabricated Footing System on Reactive Soil Foundation. Energies 2021, 14, 7515. https://0-doi-org.brum.beds.ac.uk/10.3390/en14227515
Teodosio B, Bonacci F, Seo S, Baduge KSK, Mendis P. Multi-Criteria Analysis of a Developed Prefabricated Footing System on Reactive Soil Foundation. Energies. 2021; 14(22):7515. https://0-doi-org.brum.beds.ac.uk/10.3390/en14227515
Chicago/Turabian StyleTeodosio, Bertrand, Francesco Bonacci, Seongwon Seo, Kasun Shanaka Kristombu Baduge, and Priyan Mendis. 2021. "Multi-Criteria Analysis of a Developed Prefabricated Footing System on Reactive Soil Foundation" Energies 14, no. 22: 7515. https://0-doi-org.brum.beds.ac.uk/10.3390/en14227515