
Temperature and Electric Field Distribution Characteristics of a DC-GIL Basin-Type Spacer with 3D Modelling and Simulation


School of Electrical Engineering, Shenyang University of Technology, Shenyang 110870, China
*
Author to whom correspondence should be addressed.
Energies 2021, 14(23), 7889; https://0-doi-org.brum.beds.ac.uk/10.3390/en14237889
Submission received: 12 October 2021
/
Revised: 12 November 2021
/
Accepted: 12 November 2021
/
Published: 24 November 2021
(This article belongs to the Special Issue Power Transmission and Distribution Equipment and Systems)
Abstract
:The temperature properties of real-type direct-current gas-insulated transmission lines (DC-GIL) with a basin-type spacer were investigated by the finite element method in this paper. A horizontally installed model was established and the temperature distribution was obtained with a 3D model. The specific heat capacity and thermal conductivity of the spacer were measured and applied in the simulation. The results show that the temperature of the convex surface was slightly higher than that of the concave surface. With an increase in the SF6 pressure, the temperature of the spacer decreased, which can be attributed to the improvement of convection due to increases in the heat capacity per unit volume. With an increase in the ambient temperature, the temperature of the spacer increased linearly. The temperature difference between the inner and outer parts of the spacer increased with increases in the load current. Besides, an obvious increase in the surface electric field strength appeared under the influence of the thermal gradient compared to the results without the thermal gradient. Thus, special attention should be paid to the insulation properties of the spacer considering the influence of temperature distribution. This study evaluates both the thermal and insulation characteristics of the GIL along with the spacer under various conditions.
1. Introduction
Gas-insulated switchgear (GIS) and gas-insulated transmission lines (GIL) are widely applied in power systems since they can save space, are easy to maintain, and are less sensitive to the environment [1]. Normally the GIL and GIS bus bars are designed as coaxial configurations. The cylindrical conductor made of aluminum is fixed in the center and a coaxial enclosure functions as the seal. Between them, insulating gas such as SF6 or a SF6/N2 mixture is filled to provide reliable insulation. Besides, epoxy composites insulators shaped as basins, discs, or cylinder types are fixed inside the enclosure and act as the supporting and insulating mediums [2,3].
During a normal operation, the current of thousands of amperes flows through the conductor inside the GIL or GIS busbar. Considerable Joule heat will be generated as the result and the insulating gas, conductor, enclosure, and insulator will be heated. If an unreasonable structural design is applied which does not take special care of the heat generation and dissipation, overheating will occur which can cause serious consequences to the long-term operation of the equipment, for example, accelerated aging of the insulator. With the development of high voltage direct current (HVDC) technology, HVDC GIS and GIL have attracted more and more attention. Since the electrical conductivity of epoxy composites varies with the variation in temperature [4], the thermal gradient should be considered when dealing with the electric field distribution of the insulator [5]. Moreover, the surface charge which will cause partial distortion to the electric field distribution is also affected by temperature [6,7]. Thus, the temperature distribution of GIS and GIL including the gas and the insulator should be investigated, especially for the HVDC application.
Since the temperature distribution inside the GIS/GIL is difficult to measure, simulation is a common method to evaluate the temperature characteristics. H. Koch et al. presented a numerical study of the natural convection in a horizontal annulus of GIL and discussed the influence of the Rayleigh number and radius ratio on the heat transfer and fluid motion characteristics [8]. The effect of the eddy current on the temperature rise of the GIS busbar was studied using the coupled magnetothermal finite element analysis method [9,10]. Further, B. Novák et al. conducted simulations dealing with the temperature distribution in a three-phase GIS busbar considering the influence of the eddy current [11]. Y. P. Tu et al. analyzed the temperature distribution in a GIL filled with the fluoronitriles–CO2 gas mixture and compared the result with SF6 for the development of environmentally friendly GIL [12]. However, all these simulations neglected the influence of the insulator on the heat transfer characteristics and the temperature distribution of the insulator. Recently, C. Y. Li et al. [13], and B. X. Du et al. [14] investigated the temperature distribution of DC-GIS/GIL with a spacer inside and further discussed its influence on the surface charge properties. The simulation models in these studies were all set vertically, and thus, they were mostly established based on a 2D center rotationally symmetric model. The temperature distributions of the gas and spacer were obtained symmetrically, yet most GIL subsections and GIS busbars are installed horizontally. Considering the fluid motion and the effect of buoyancy, the temperature distribution does not perform a rotationally symmetric pattern. That means a 3D model should be introduced so that a 3D temperature distribution of the gas and spacer can be obtained.
In this paper, a 3D simulation model was established based on a horizontally installed 200 kV GIL with a basin-type spacer. The heat transfer and fluid motion characteristics inside the GIL were analyzed under the stress of direct current. The influence of geometry simplification on the solution was discussed. The influence of gas pressure, ambient temperature, and load current on the temperature distribution of the gas and spacer was investigated. The temperature rise process under overload conditions was studied as well. Finally, the influence of thermal gradient on the electric field distribution was discussed. The paper is divided as follows: In Section 2, the simulation model and the parameters applied in this model are introduced. In Section 3, the simulation results are presented and discussed. In Section 4, the conclusions are presented.
2. Simulation Model
2.1. Geometry of the GIL Model
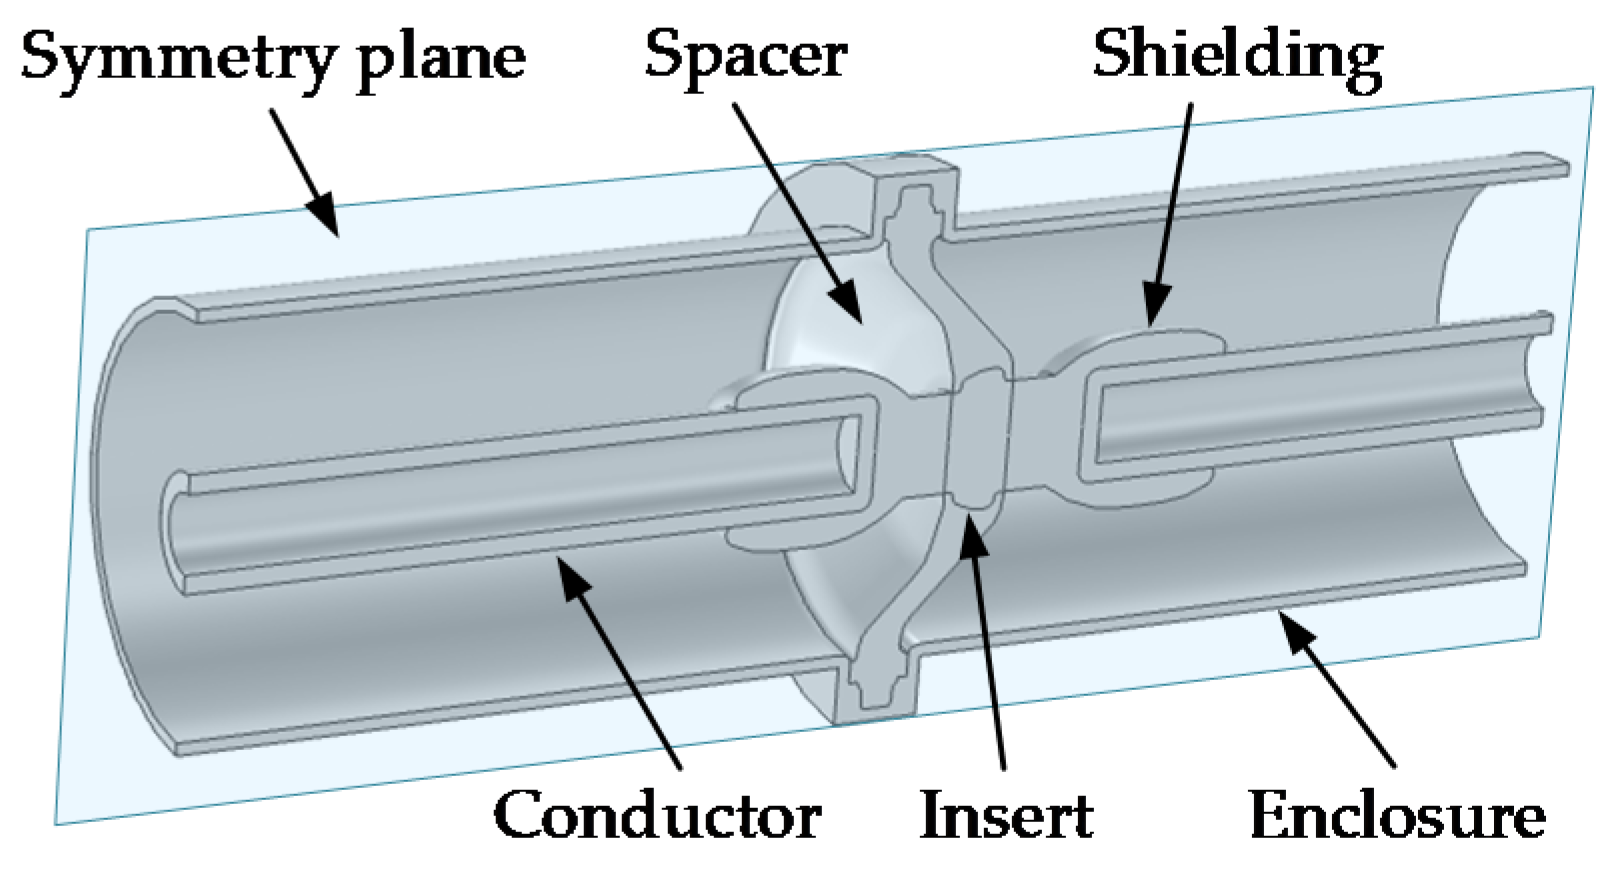
The geometry of the GIL is shown in Figure 1. The parameters are illustrated in Table 1. Since the GIL is installed horizontally, the fluid motion and heat transfer show zygomorphic characteristics with the cross-section marked in the figure as the symmetry plane. Moreover, the cross-section functions as an adiabatic surface. Thus, the model can be simplified to half of the original geometry. In this way, a large amount of meshes can be reduced without the deterioration of calculation accuracy and about 50% of the memory usage and 70% of time consumption can be reduced.
2.2. Mathematical Model of the GIL
2.2.1. Heat Generation
A large current flowing through the aluminum conductor will cause considerable heat generation due to Joule’s Law, as shown in Equation (1):
where P (unit: W) represents the heating power from the conductor, I (unit: A) represents the load current, L (unit: m) represents the length of the conductor, Scond (unit: m2) represents the cross-sectional area of the conductor and σAl (unit: S·m−1) represents the electric conductivity of the conductor. It is noted that in this study, the skin effect was neglected in the simulation. In this study, the conductivity of aluminum was applied. Since this conductivity varies with temperature, (2) is applied in the calculation.
Here σ20 represents the electric conductivity of aluminum at 20 °C (293 K) which is 3.02 × 10⁻⁸ S·m−1 in the calculation and T (unit: K) represents the temperature of the conductor.
2.2.2. Heat Transfer
The heat transfer via conduction follows the equations below:
where ρ (unit: kg·m−3) is the density, Cp (unit: J·kg−1·K−1) is the specific heat capacity at constant stress, q (unit: W·m−2) is the heat flux by conduction, qr (unit: W·m−2) is the heat flux by radiation, κ (unit: W·m−1·K−1) represents the thermal conductivity, T (unit: K) is the absolute temperature and Q (unit: W·m−3) contains additional heat sources which are zero for the spacer and gas. The density, thermal conductivity and specific heat capacity of the conductor and enclosure are shown in Table 2. Since these parameters varied slightly in the temperature range in this study, all these values were obtained at 20 °C.
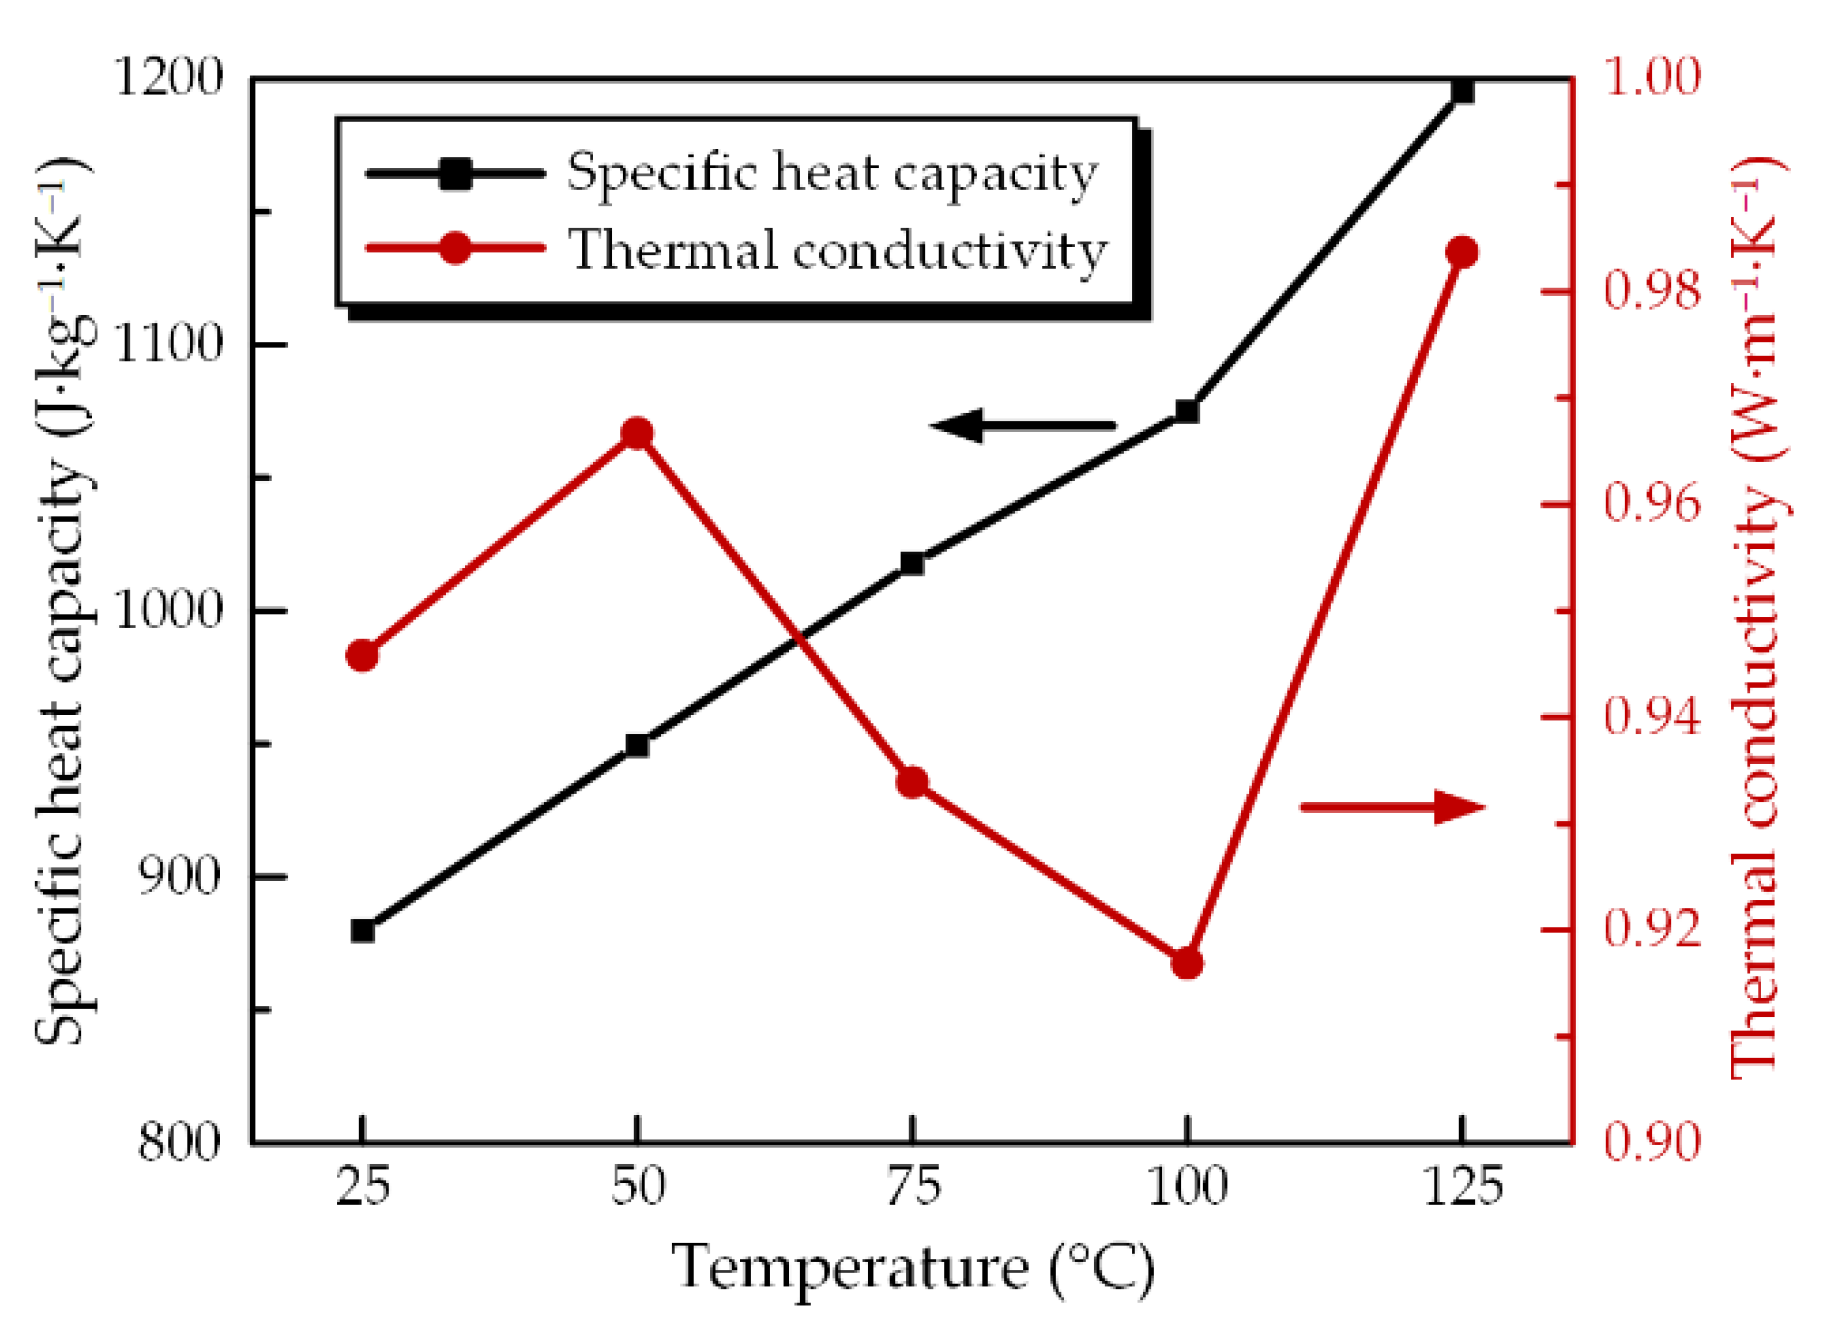
The thermal conductivity, specific heat capacity and density of the epoxy insulator vary with different manufacturers and types; thus, these parameters were measured respectively. The density was 2300 kg·m−3 at 20 °C and it varied slightly with the temperature. Since the thermal conductivity and specific heat capacity varied with the temperature, the parameters at different temperatures were measured by the transient hot-wire method for thermal conductivity (XIATECH, TC3200) and the DSC method for specific heat capacity (NETZSCH, DSC 200F3). The results are shown in Figure 2.
Thermal radiation denotes the stream of electromagnetic waves emitted from a body at a certain temperature. In this study, the radiation functioned at the spacer surface to the internal surface of the enclosure, the spacer surface to the conductor surface, the conductor surface to the internal surface of the enclosure and the external surface of the enclosure to the ambient air. The calculation of the radiation followed the equations below and the surfaces in the simulation were all opaque.
Here, eb(T) (unit: W·m−2) is the power radiated across all wavelengths, n (unit: 1) is the refractive index, σSB (unit: W·m−2·K−4) is the Stefan–Boltzmann constant, G (unit: W·m−2) is the incoming radiative heat flux, ε (unit: 1) is the surface emissivity, q (unit: 1) represents the net inward radiative heat flux and T (unit: K) represents the surface temperature. The surface emissivities were 0.2, 0.93, 0.92 and 0.93 for the conductor, spacer, external and internal surface of the enclosure, respectively [15].
In addition to conduction and radiation, the third mechanism for heat transfer is convection. The Navier–Stokes equations for single-phase fluids were applied to describe the SF6 gas motion in the GIL as defined below.
Equation (7) is the continuity equation and describes the conservation of mass. Equation (8) describes the conservation of energy. Equation (9) is a vector equation and describes the conservation of momentum. Here, u (unit: m·s−1) is the velocity vector, p (unit: Pa) is the pressure, μ (unit: Pa·s) is the dynamic viscosity, g (unit: m·s−2) is the gravity vector and Q (unit: W·m−3) contains heat sources other than viscous heating.
The relationship between the density, pressure and temperature of SF6 follows the ideal gas law. The thermal conductivity and dynamic viscosity of SF6 satisfy Sutherland’s law of viscosity as defined in Equations (10) and (11).
Here, κ0 (unit: W·m−1·K−1) and μ0 (unit: Pa·s) are the thermal conductivity and dynamic viscosity of SF6 at room temperature and T0 (unit: K) represents the corresponding temperature. SSF6 (unit: K) is a constant related to SF6 used at room temperature.
2.2.3. Turbulent Flow
When dealing with the convective heat transfer inside the GIL, the first step is to confirm whether the laminar flow or turbulent flow model should be applied. Both flow models were proposed in the simulation of GIS/GIL [8,10,12]. Thus, in this study, the analysis was conducted on the flow characteristics.
Different from forced convection which is governed by Reynolds number, dimensionless Grashof and Rayleigh numbers are applied to demarcate the laminar and turbulent flow for natural convection [16]. The Grashof and Rayleigh numbers are defined as Equations (12) and (13).
Here, g (unit: m·s−2) is the gravitational acceleration, β (unit: K−1) is the volume expansion coefficient of SF6, Ts (unit: K) is the surface temperature of the conductor, T∞ (unit: K) is the temperature of the SF6 gas inside the GIL sufficiently far from the conductor surface and υ (unit: m2·s−1) is the kinematic viscosity of SF6. Lc (unit: m) is the characteristic length of the geometry which was the gap between the conductor and the enclosure in this case. Pr represents the Prandtl number which was set to 0.7. The calculated Grashof and Rayleigh numbers fell in the range from 109 to 1010 indicating a turbulent gas flow estimation according to the horizontal cylinder model filled with SF6 [17].
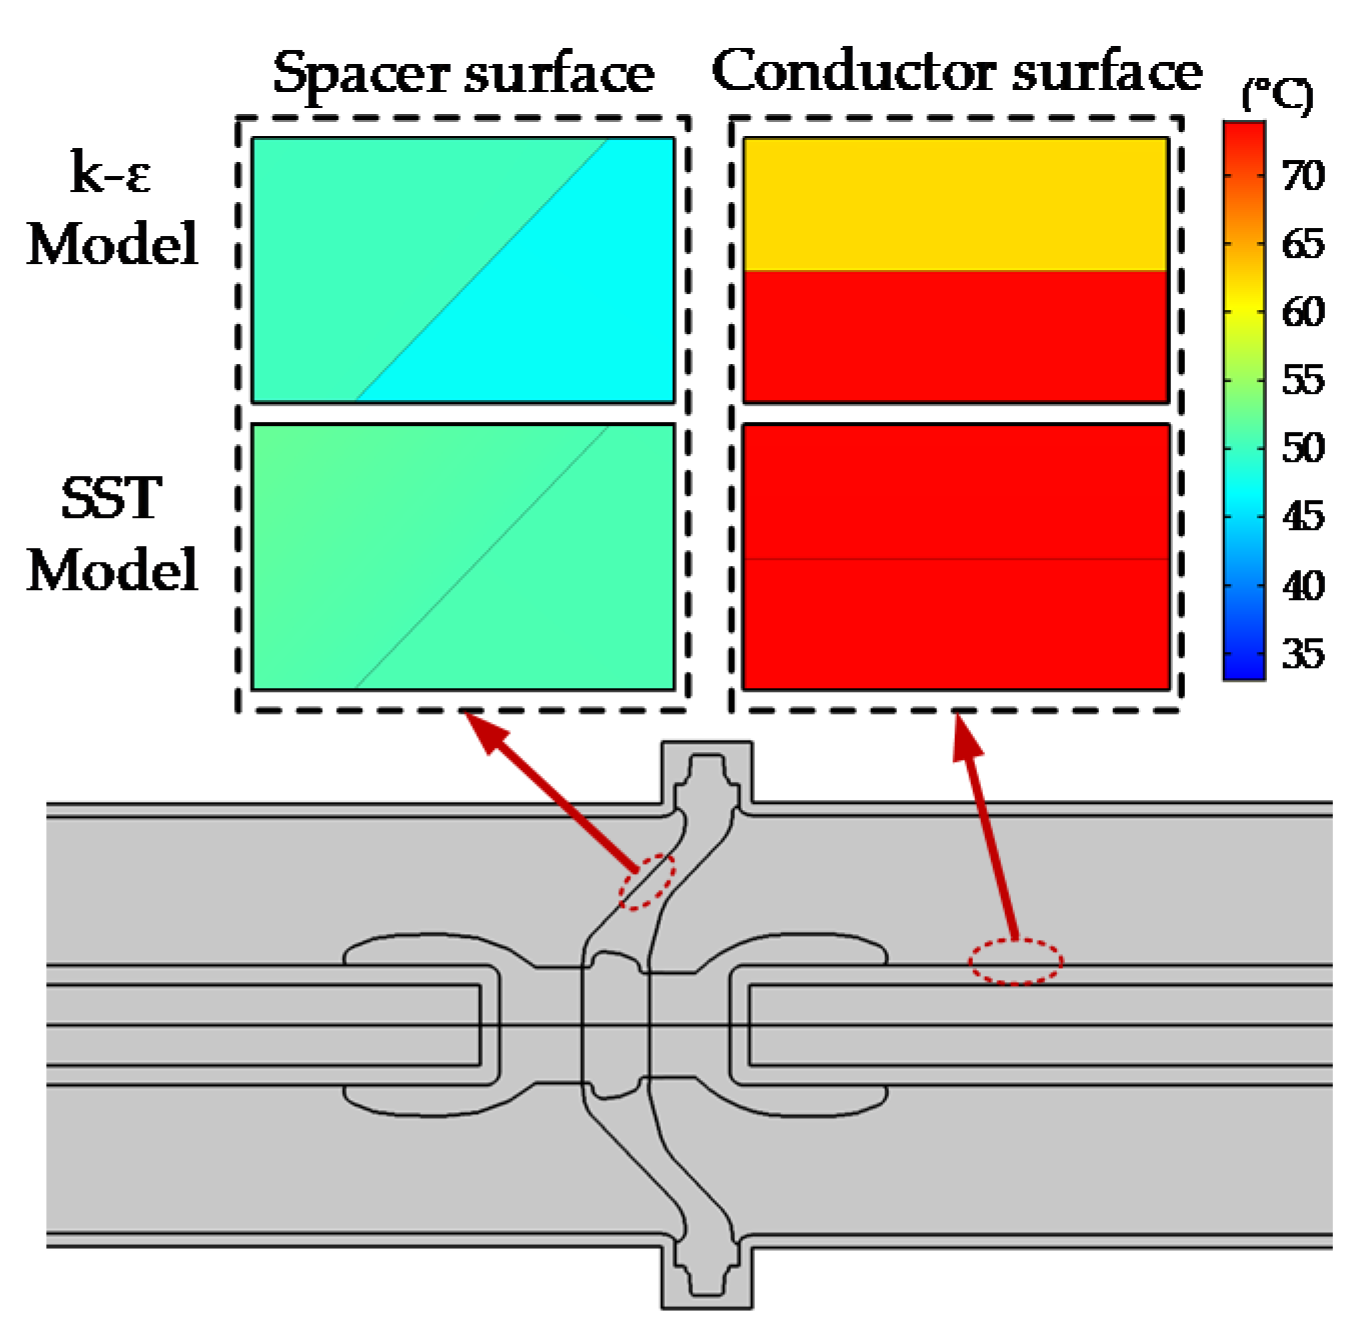
Although the k-ε turbulence model is widely used in the analysis of turbulent flow due to its robustness, the accuracy at the near-wall region is a noteworthy disadvantage that would lead to discontinuous temperature distribution at the gas–spacer interface in this case. Satisfactory temperature distribution cannot be expected via this model. Thus, the SST turbulence model, especially for the low Reynolds number condition, was applied which can be attributed to the superior behavior at the near-wall region [10,18]. COMSOL Multiphysics software was applied to conduct the simulations. The difference in temperature distribution at the interface via the k-ε model and SST model is shown in Figure 3.
Moreover, the calculation of the radiation was conducted via the point-to-point method which is defined by large time consumption and memory usage. Hence, a comparison of temperature distribution was conducted between the model with and without radiation. The result confirmed that the radiation showed an obvious influence on the temperature distribution. Thus, radiation cannot be neglected, although neglecting the radiation would lead to considerable time and memory cost.
3. Results and Discussions
3.1. Influence of Geometry on Temperature Distribution
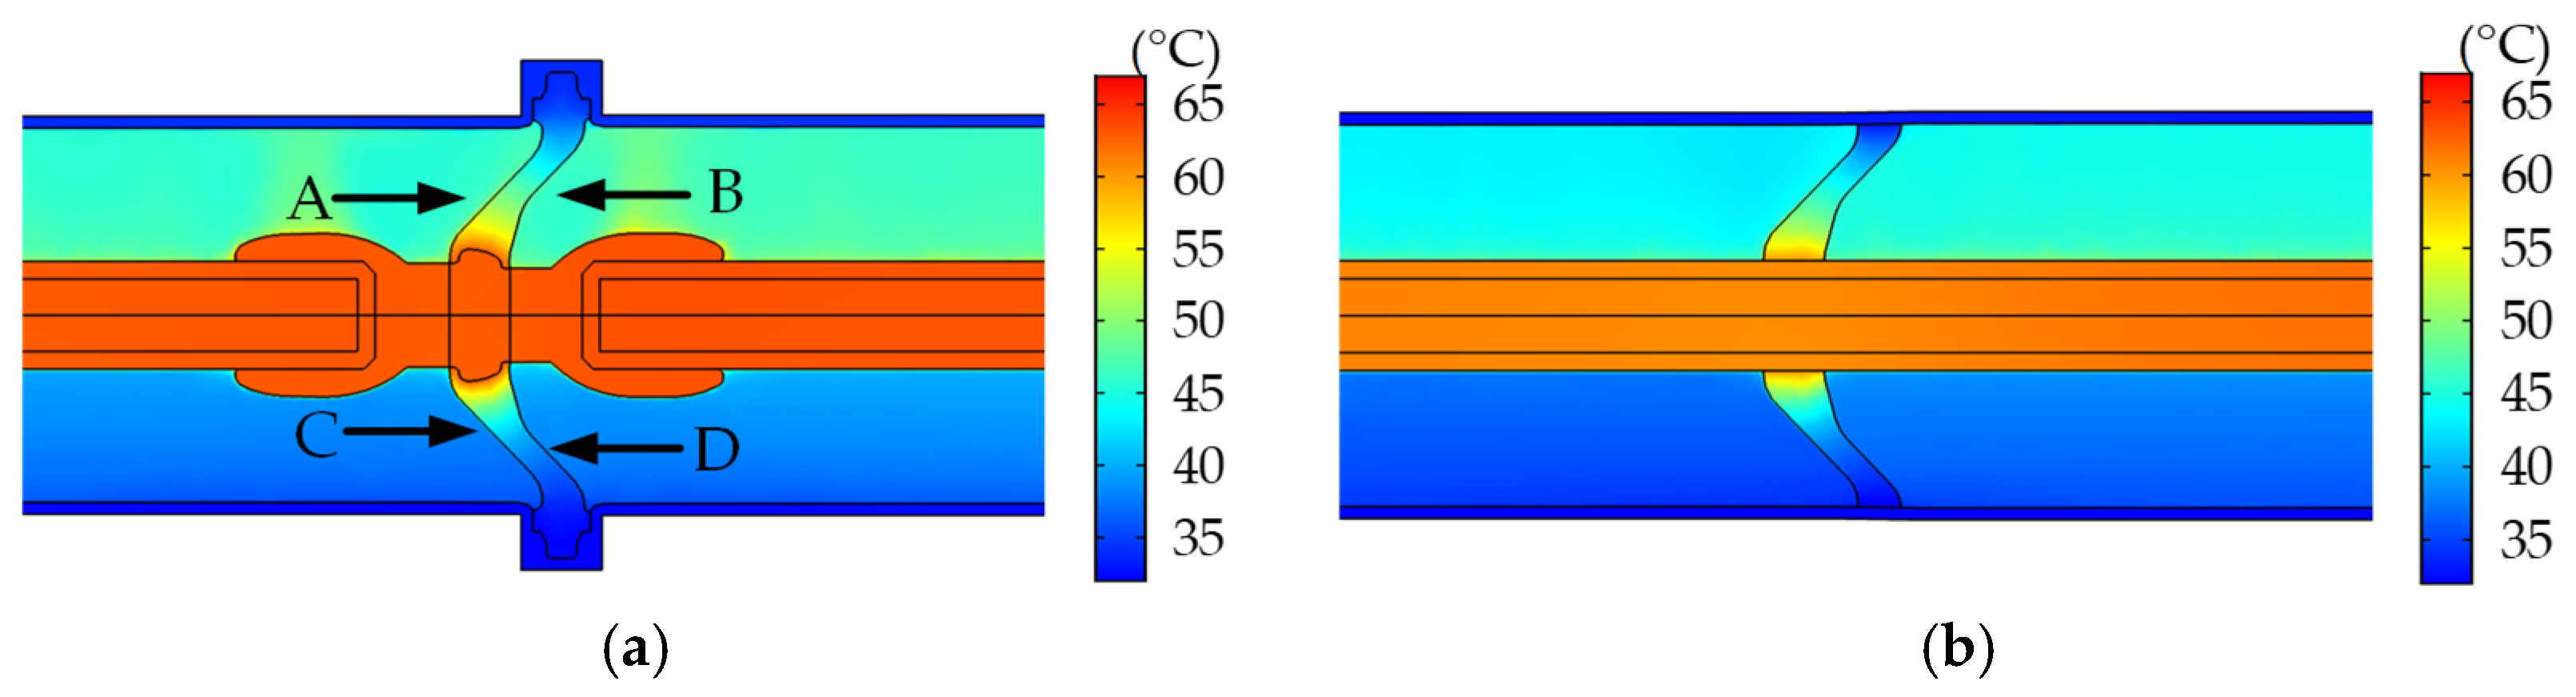
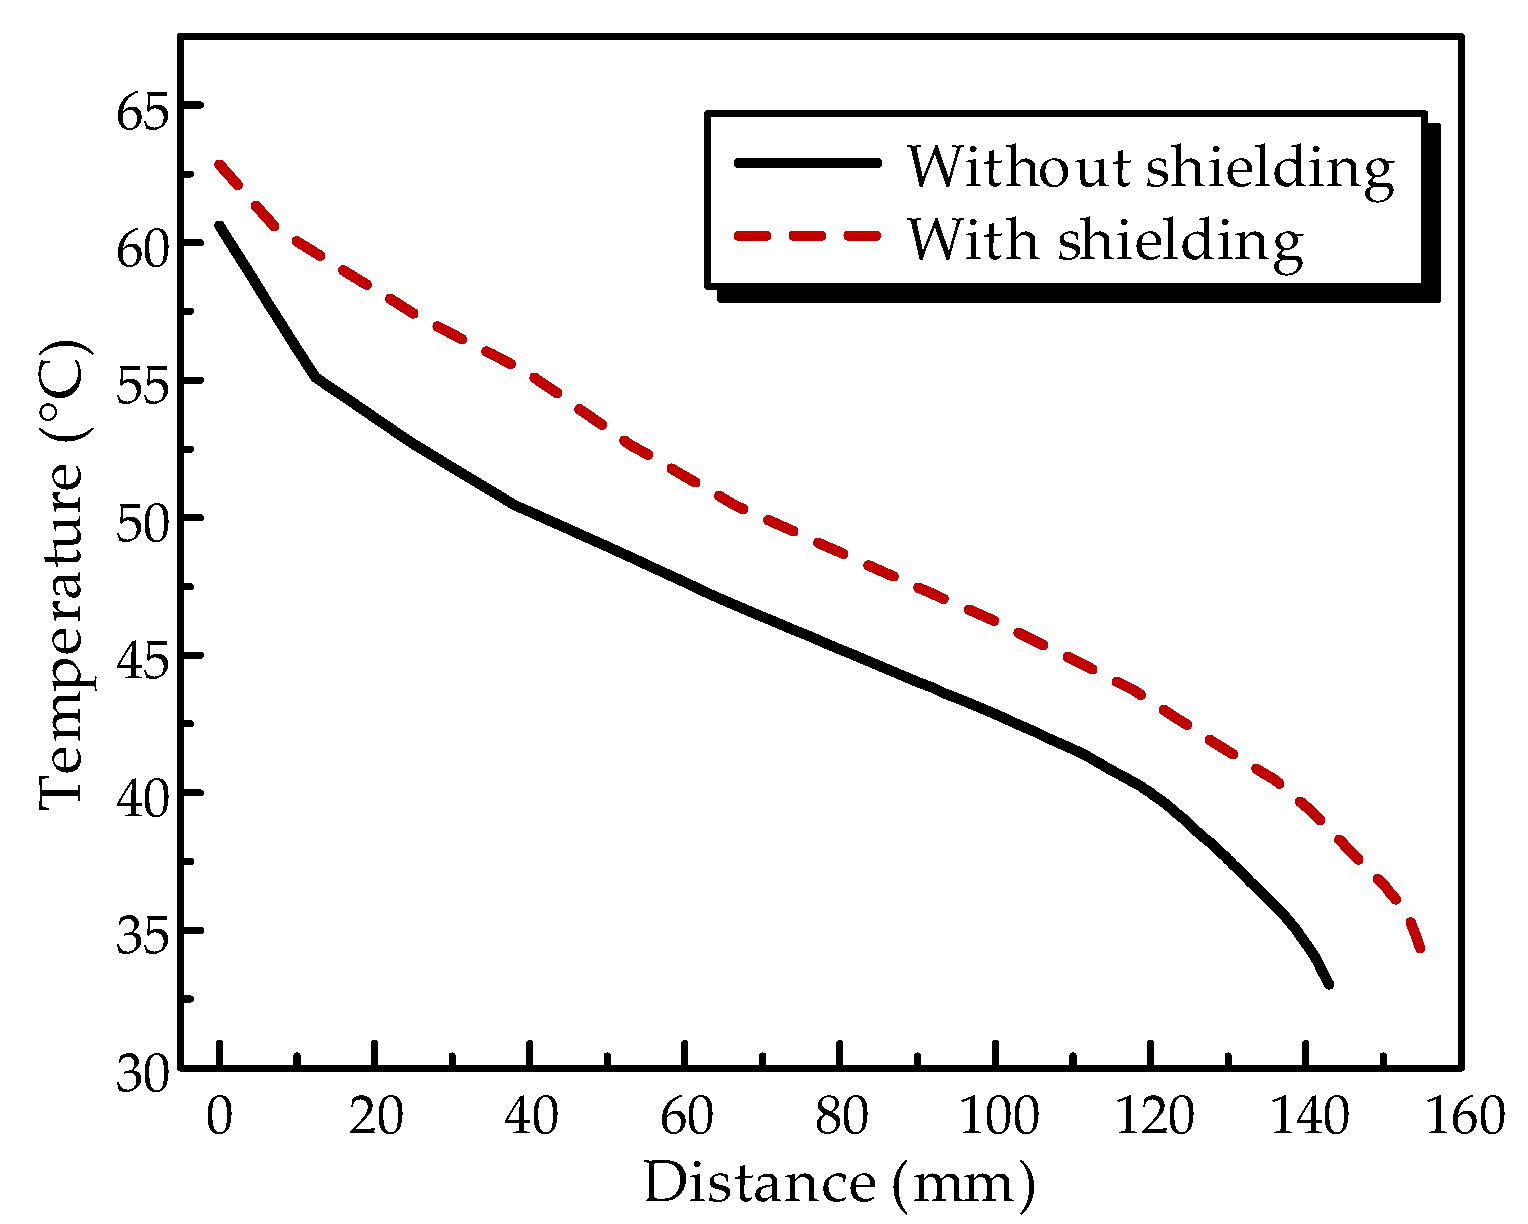
In most of the literature, the geometry of the simulation model was simplified. The shielding, insert and flange were removed leading to a perfect cylindrical conductor and enclosure. This treatment of the geometry is to promote convergence. Since the load current will flow through the shielding, heat will be generated as the consequence. Moreover, the shielding and the flange will show influence on the flow motion due to the structure. Thus, in this study, the influence of geometry on temperature distribution was first investigated. The comparison of temperature distribution between a simplified geometry and a real-type geometry is shown in Figure 4. The shielding, insert and flange were removed and a cylindrical conductor and enclosure were obtained in the simplified model compared with the real-type geometry. The load current was 3150 A, the ambient temperature was 20 °C and the pressure of SF6 gas was 0.5 MPa for both simulation models.
As shown in the figure, the removed components affected the temperature distribution. A lower temperature was obtained in the simplified model compared with the real-type model. A higher temperature region was obtained near the shielding at both sides of the spacer due to the considerable heat generation. The temperature distribution along the convex surface of the upper part (Curve A) as marked by an arrow in Figure 4 was obtained and is shown in Figure 5 for both models. In this figure, the x-axis value indicates the distance from the conductor–spacer intersection along the spacer surface. The value 0 was in accordance with the point at the intersection and the distance increased from the conductor to the enclosure.
It is obvious that the surface temperature of the two models followed a similar tendency, indicating the relative equivalence of the simplification. However, the temperature distribution of the two models was not completely the same since a temperature difference of about 5 °C was observed. Hence, the real-type geometry was applied in the following sections for more precise results.
3.2. Surface Temperature Distribution of the Spacer
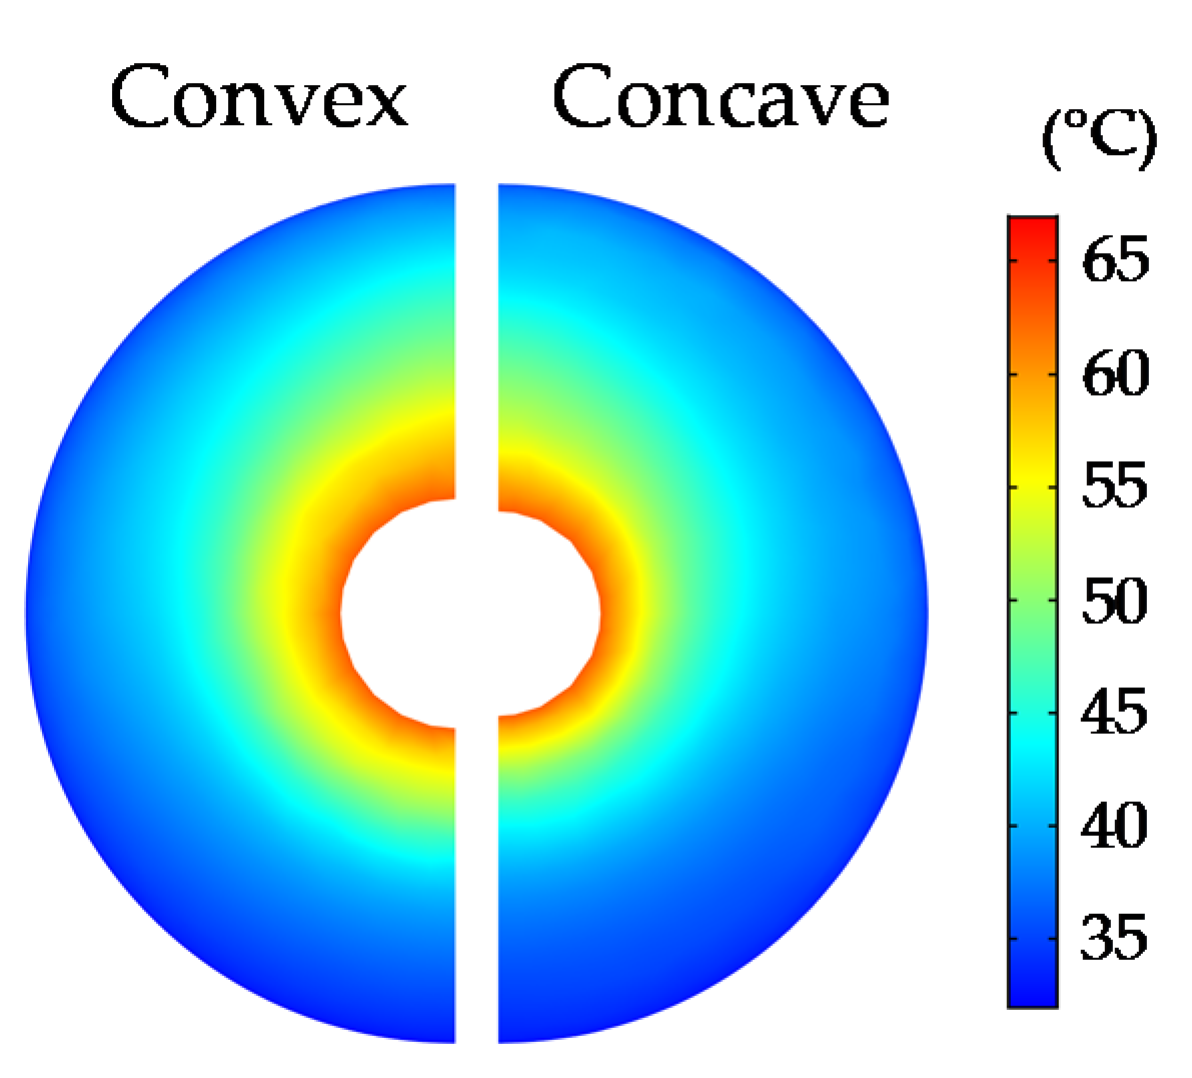
The temperature distribution of the spacer surface is illustrated in Figure 6. In this case, the load current, the ambient temperature and the SF6 pressure were 3150 A, 20 °C and 0.5 MPa, respectively. As shown in the figure, both sides of the spacer followed a similar distribution pattern. The temperature decreased from the central insert to the outer flange leading to an almost annulus shape due to the high thermal conductivity of epoxy composites which was about 1 W·m−1·K−1. This can be attributed to the high thermal conductivity of the mirco-Al2O3 filler. Taking the central insert as the reference, the temperature of the upper part was higher than the lower part, because the SF6 gas was heated by the conductor and the hot gas was lifted by buoyancy. Hence, the upper part of the spacer was hotter compared with the lower part.
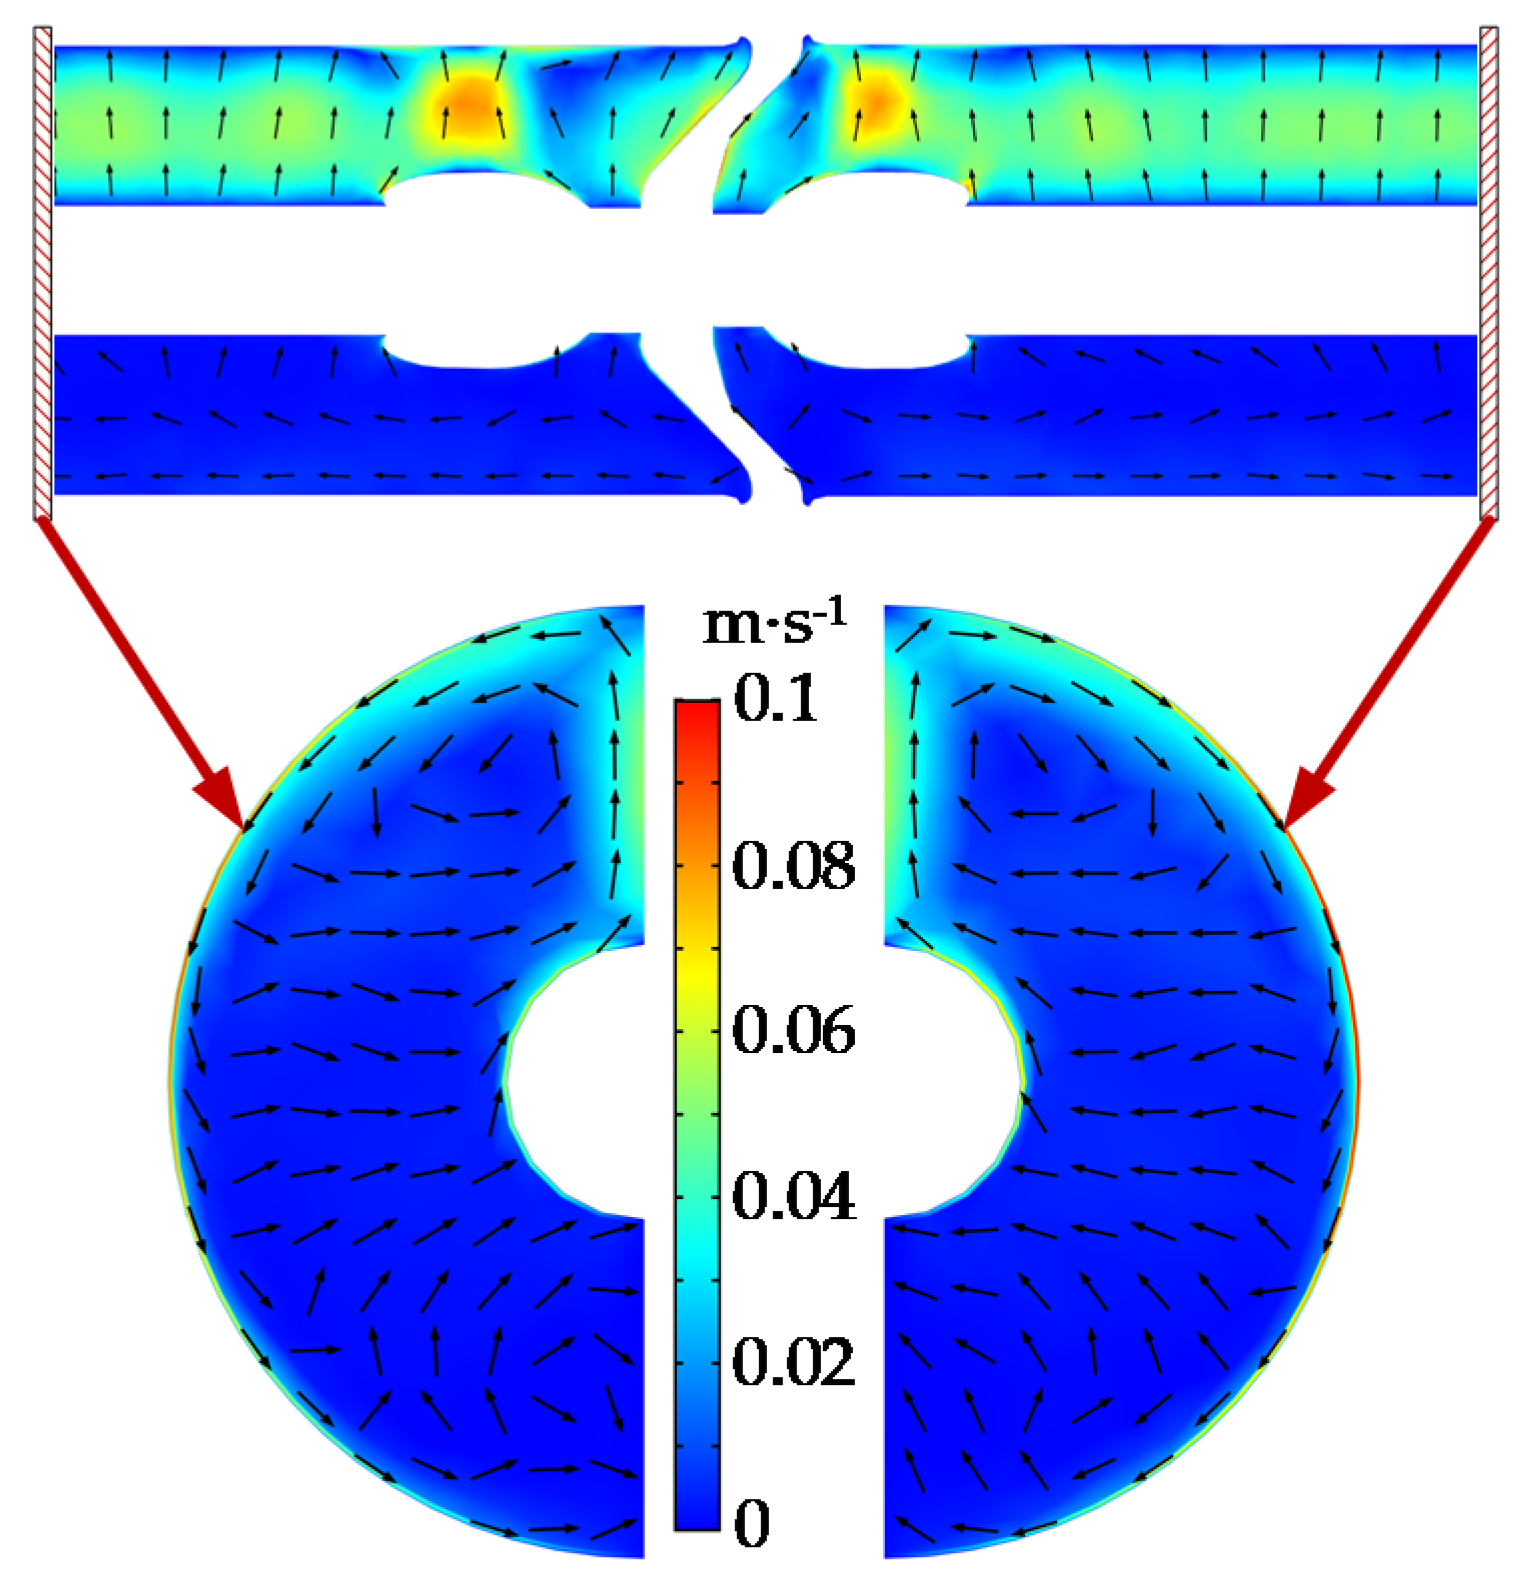
Actually, the two circulations flowed in different directions, as shown in Figure 7. The flow velocity at both sides near the spacer is shown in Figure 7. The gas heated by the conductor was lifted along the conductor surface and along the symmetry plane to the top of the enclosure. Then, the gas went down along the inner surface of the enclosure to the bottom and was lifted to the lower surface of the conductor to complete the circulation. In this way, the upper part of the spacer was heated as discussed above.
Meanwhile, the gas was lifted at the shielding to the top of the enclosure and flowed away from the spacer forming a circulation. In the meantime, part of the gas flowed towards the spacer and then went down along the boundary at the spacer–enclosure interface as shown in this figure. That is the reason why a higher surface temperature can be obtained with shielding compared with the simplified model. Moreover, since less gas flowed towards the spacer near the concave surface compared with the convex surface, a higher surface temperature was obtained at the convex surface.
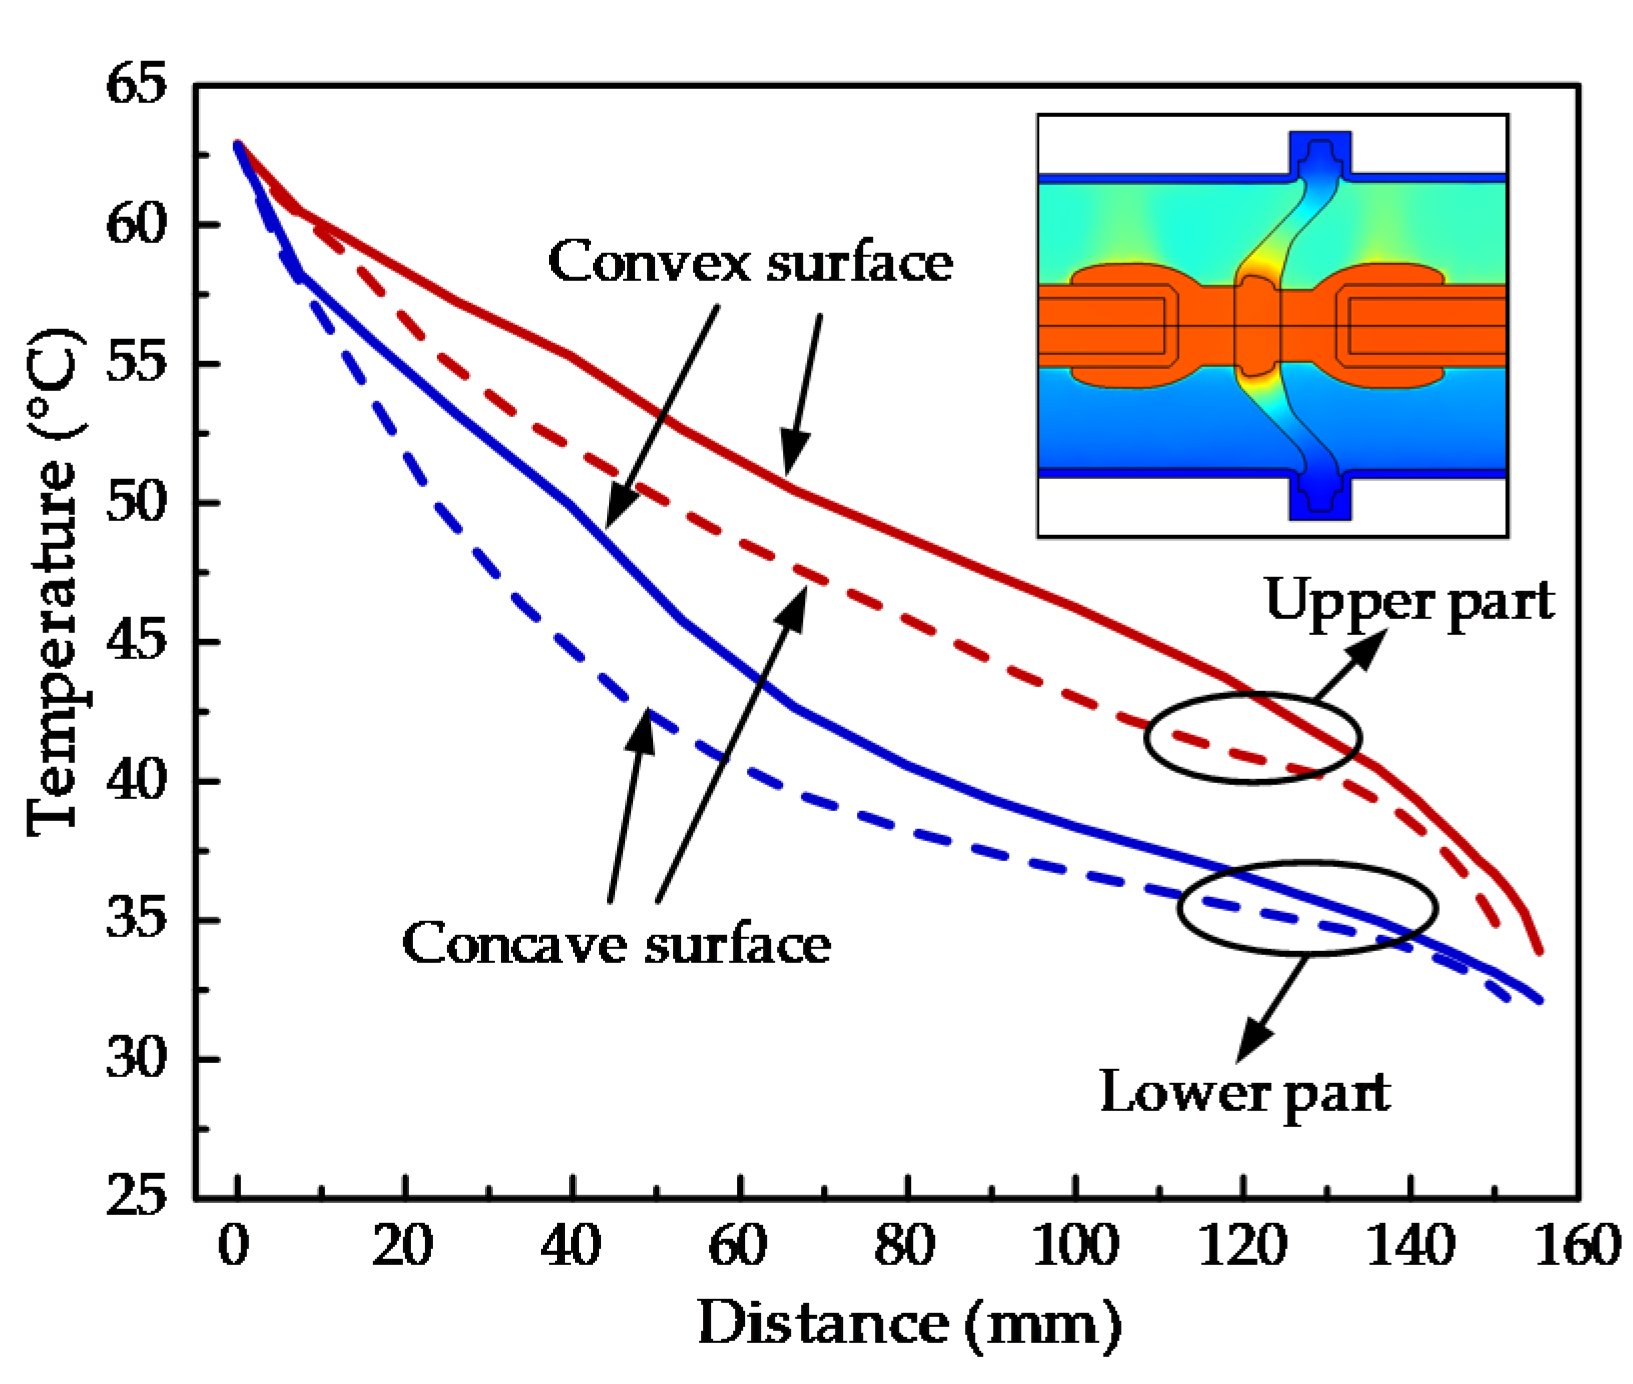
The temperature distribution along the curves A, B, C and D defined in Figure 4a is illustrated in Figure 8. Regardless of the convex and concave surface, the temperature of the upper part was higher than the lower part. At the central high voltage conductor, there was no obvious difference since the temperature of the spacer was close to that of the conductor. An obvious difference referring to the convex and concave surface can be seen in the middle part as the consequence of convection as discussed above. Attributed to the excellent thermal conduction of the enclosure, a slight temperature difference appeared at the outer boundary of the spacer. Moreover, the difference indicates that a higher temperature was obtained at the top of the enclosure compared with the bottom.
3.3. Influence of Gas Pressure on Temperature Distribution
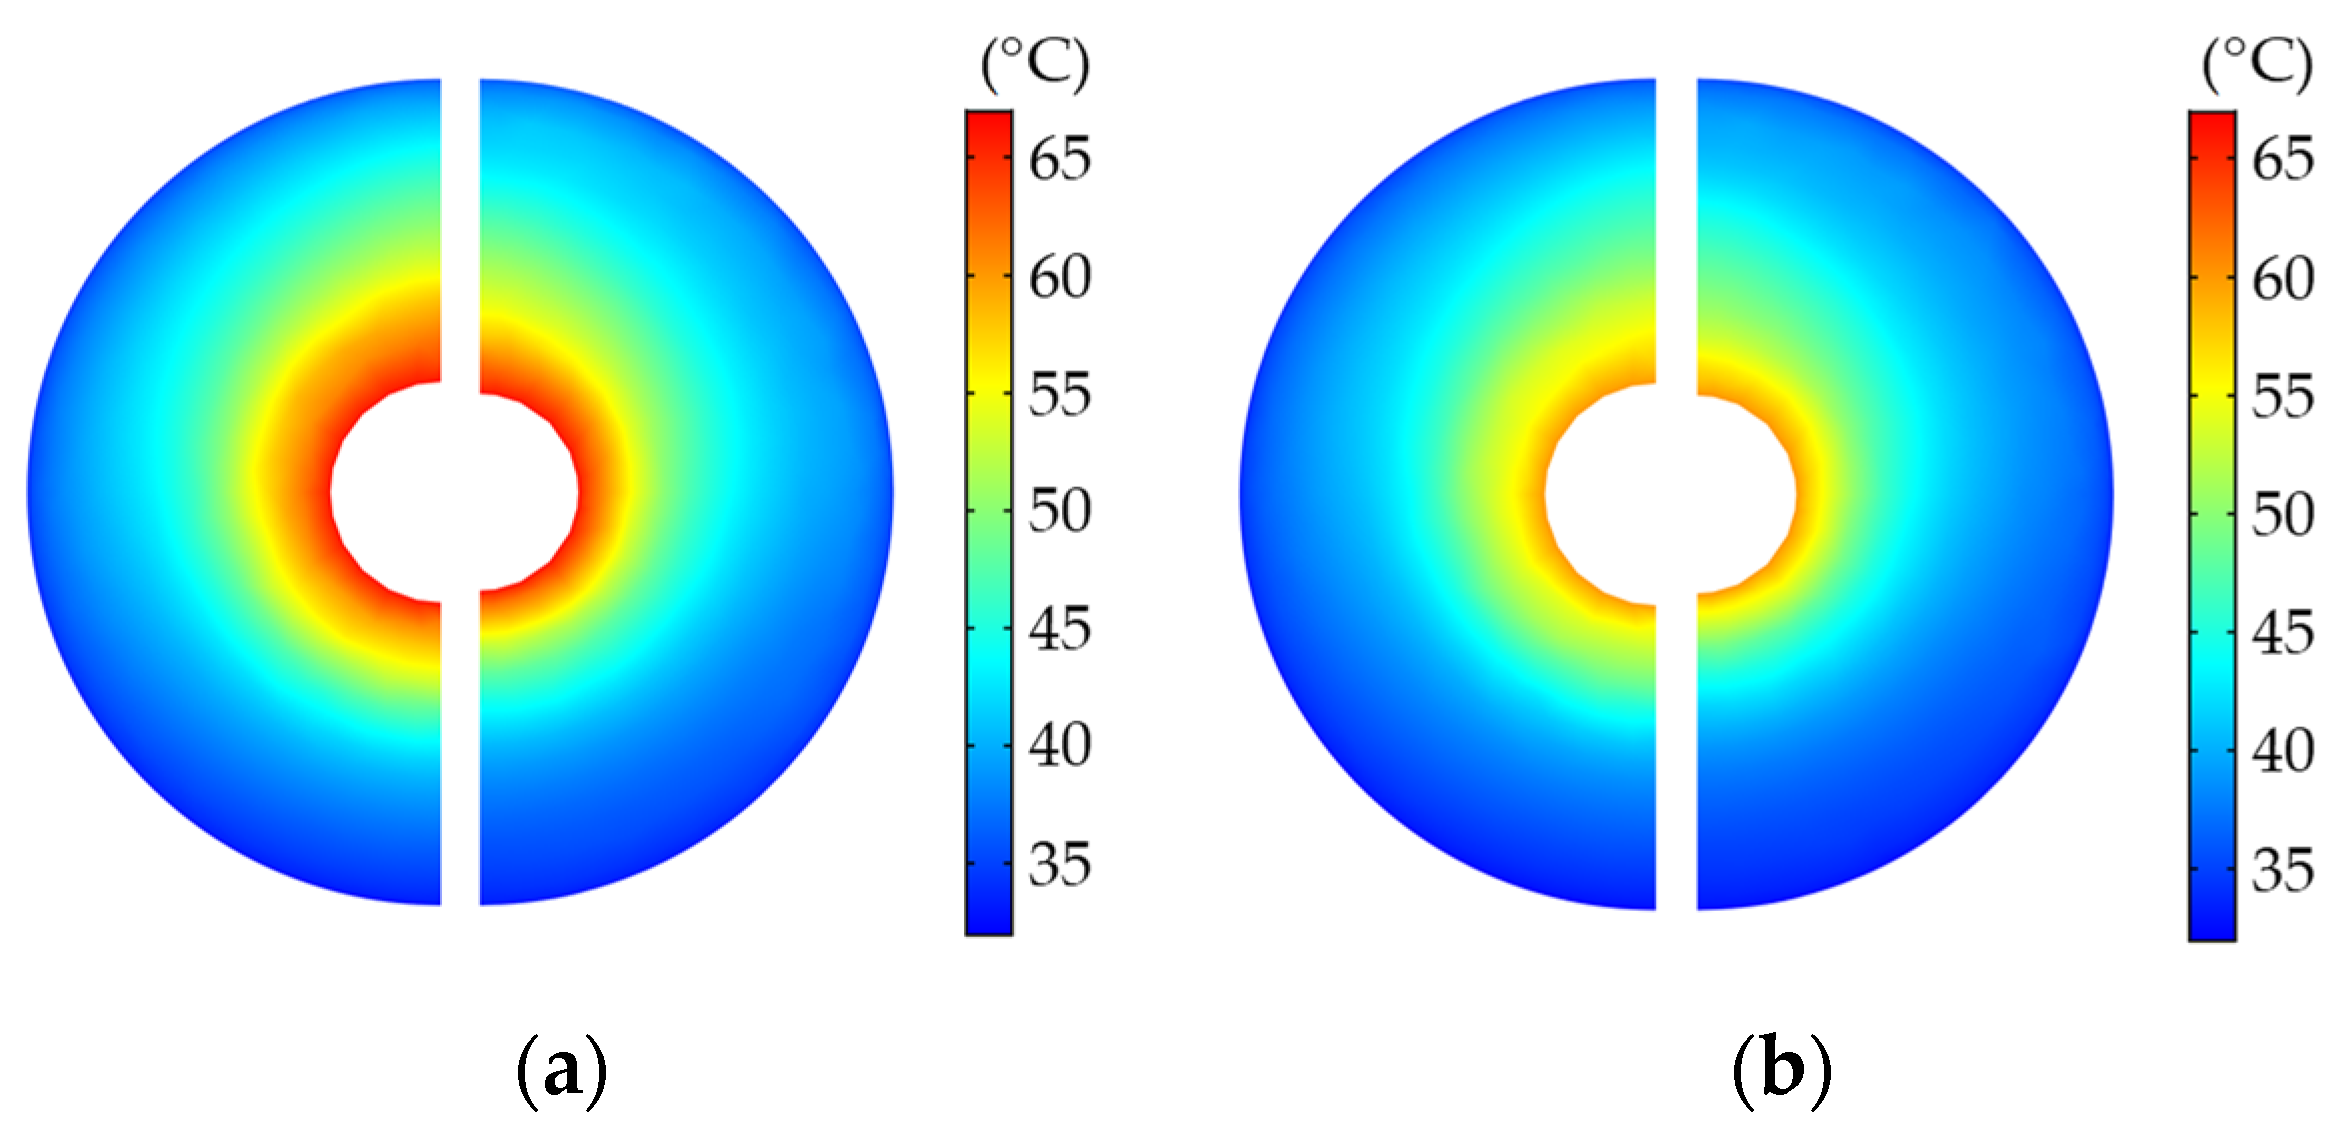
To analyze the influence of SF6 pressure on the thermal characteristics, simulations with SF6 pressure of 0.4, 0.5 and 0.6 MPa were conducted. The surface temperature distribution of 0.4 and 0.6 MPa is illustrated in Figure 9 as examples with the left part corresponding to the convex surface and the right part corresponding to the concave surface. In these cases, the load current was 3150 A and the ambient temperature was 20 °C. Regardless of the pressure, the temperature of both the convex and concave surfaces followed a similar distribution pattern. The temperature decreased from the central insert to the outer flange, nearly forming the annulus, while the upper part had higher temperatures.
As shown in the figure, with an increase in the gas pressure, the temperature of the spacer decreased. A similar tendency in a model without a spacer has been reported by Y. Qiao et al. [19], who showed that with an increase in the pressure, the temperature of the conductor decreased. With an increase in the pressure from 0.4 MPa to 0.6 MPa, the gas density increased from 25.2 to 38.9 kg·m−3 and the specific heat at constant pressure increased from 0.677 to 0.69 J·kg−1·K−1 leading to the increase in the product of the density and specific heat. Hence, the heat capacity per unit volume increased, and the heat transfer by convection was promoted.
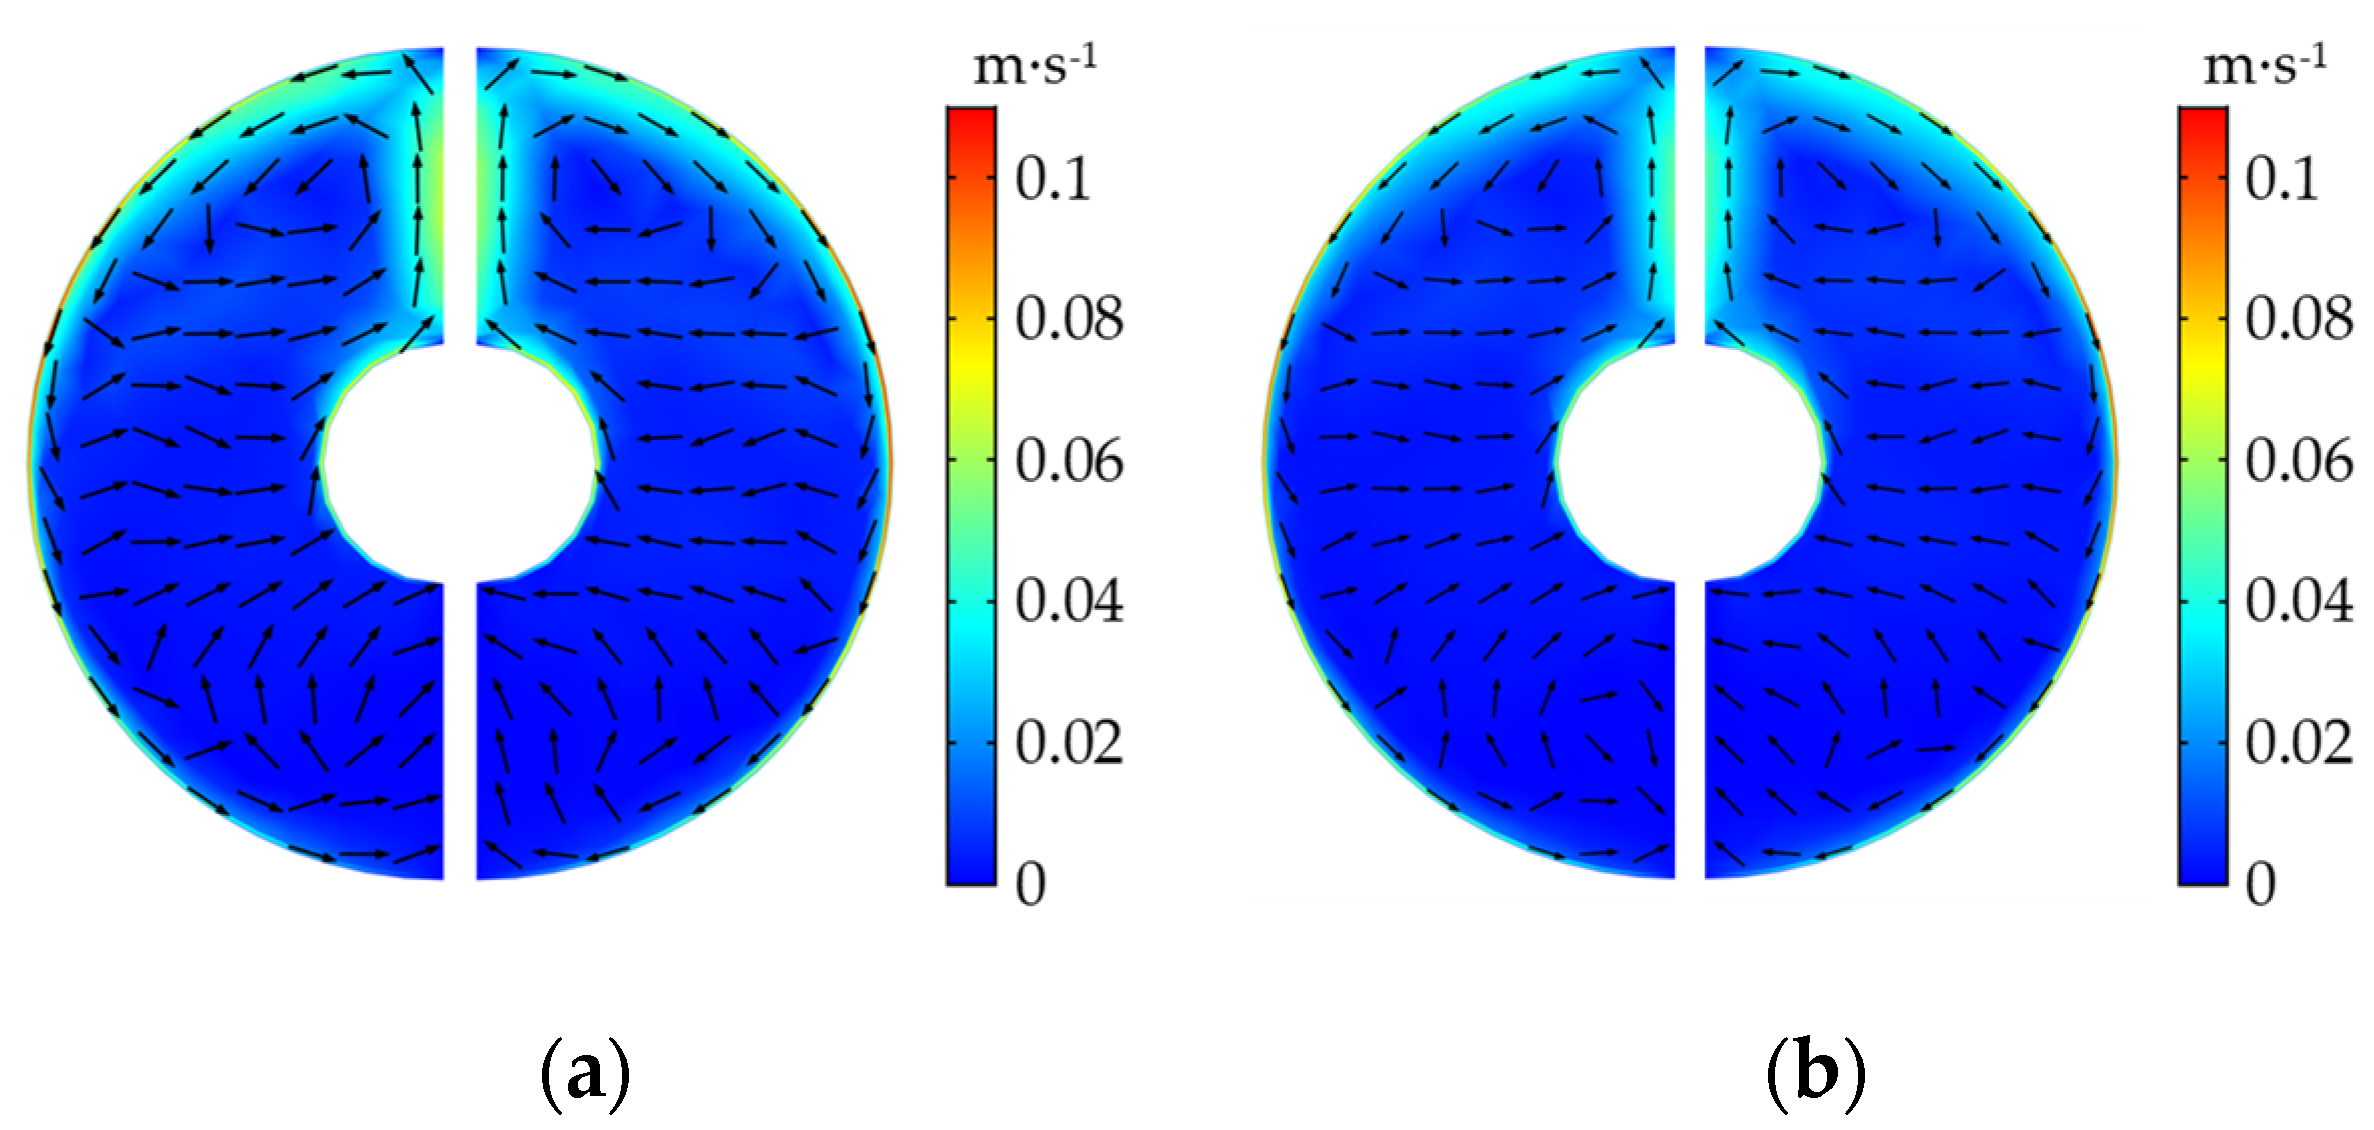
Figure 10 shows the gas velocity distribution of the cross-section near the convex and concave surfaces with different pressure. In this figure, the left part reflects the flow motion on the convex side while the right part reflects the flow motion on the concave side. As shown in the figure, a slight difference can be observed with the increase in temperature. It can be concluded that the improvement in convection referring to heat capacity dominated the cooling of the spacer surface with increasing pressure.
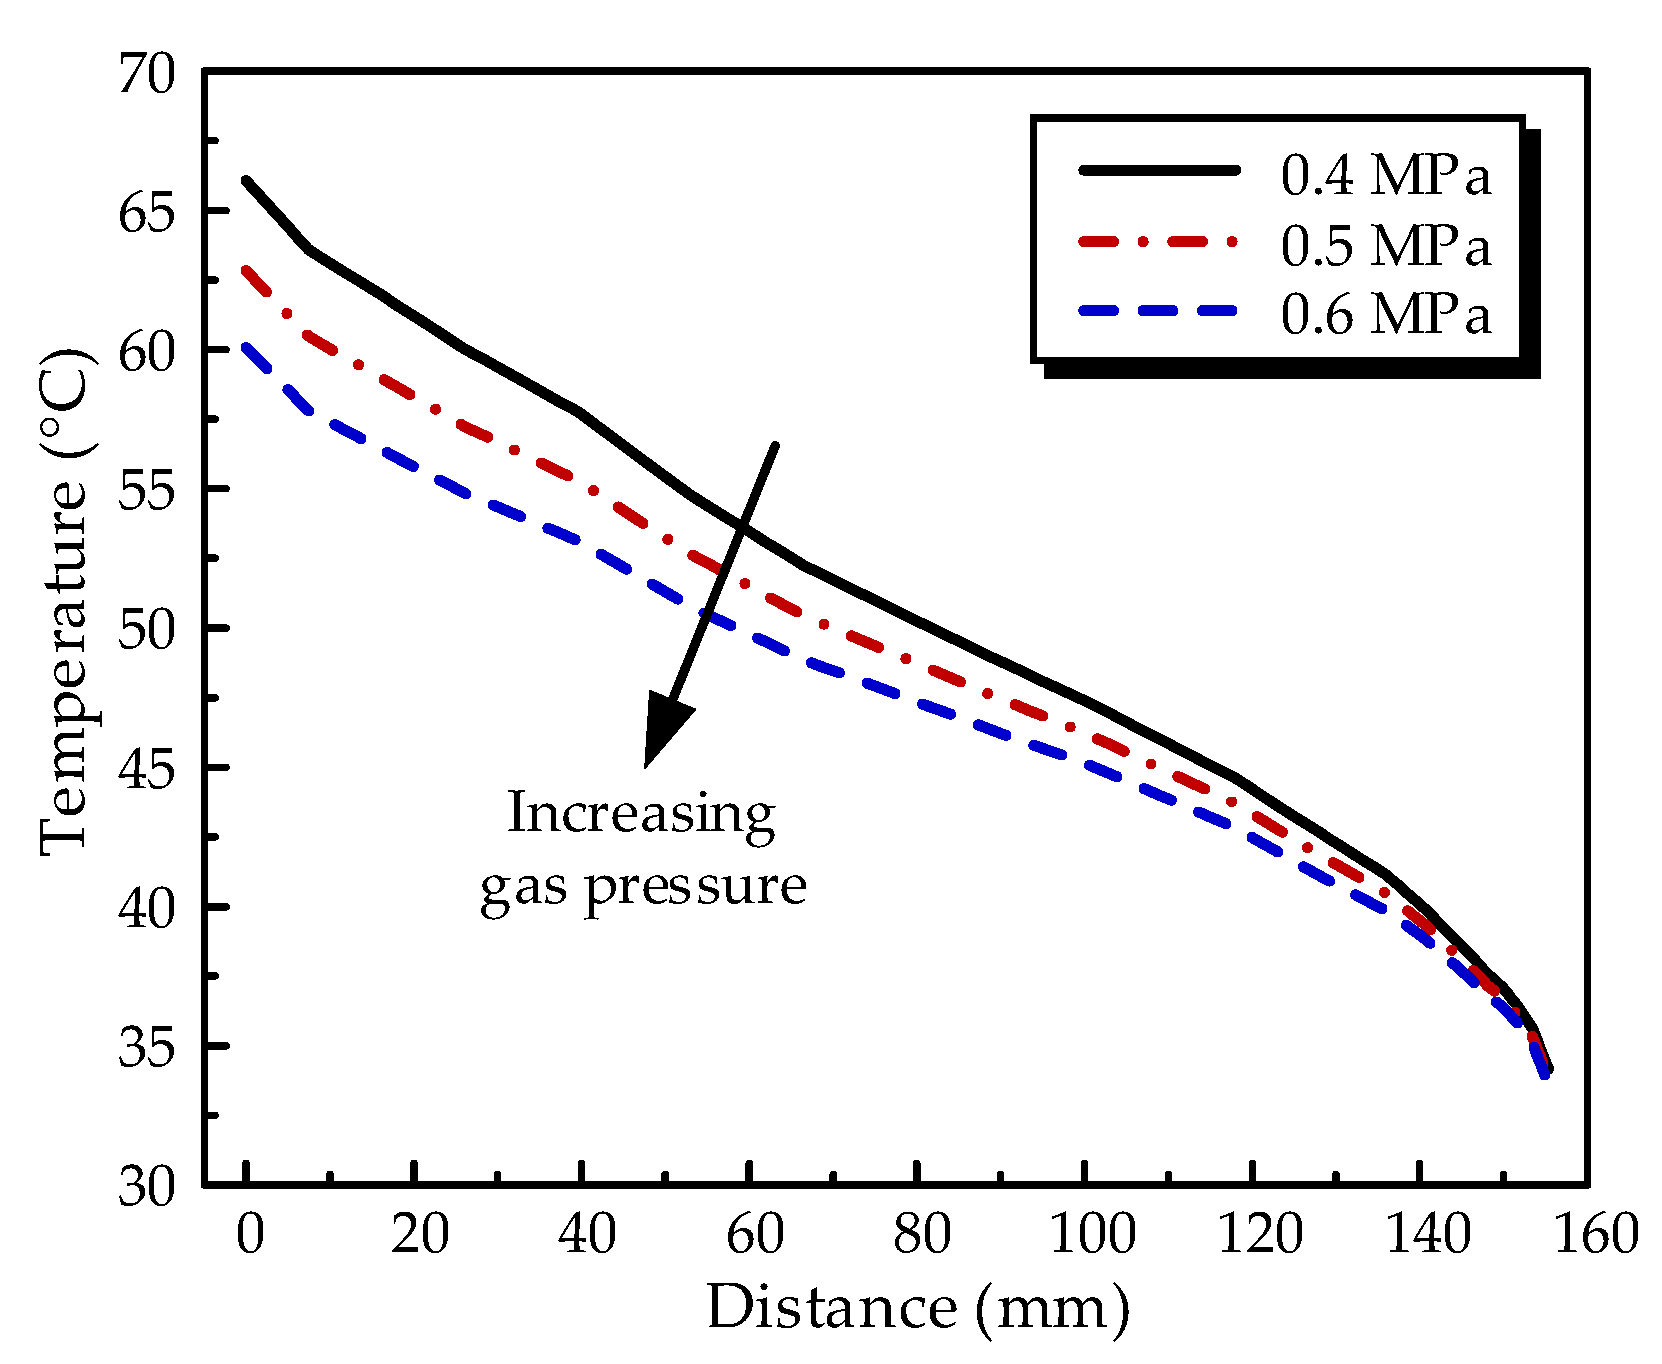
Since the temperature along curve A defined in Figure 4a had the highest overall temperature for a given condition as indicated in Figure 8, the temperature distribution along this curve is illustrated in Figure 11 with different gas pressures. Since the flow motion and the corresponding convection slowed down near the enclosure, a slight temperature difference was found at the ground shielding, as shown in the figure, while an obvious difference can be seen at the high voltage region.
3.4. Influence of Ambient Temperature on Temperature Distribution
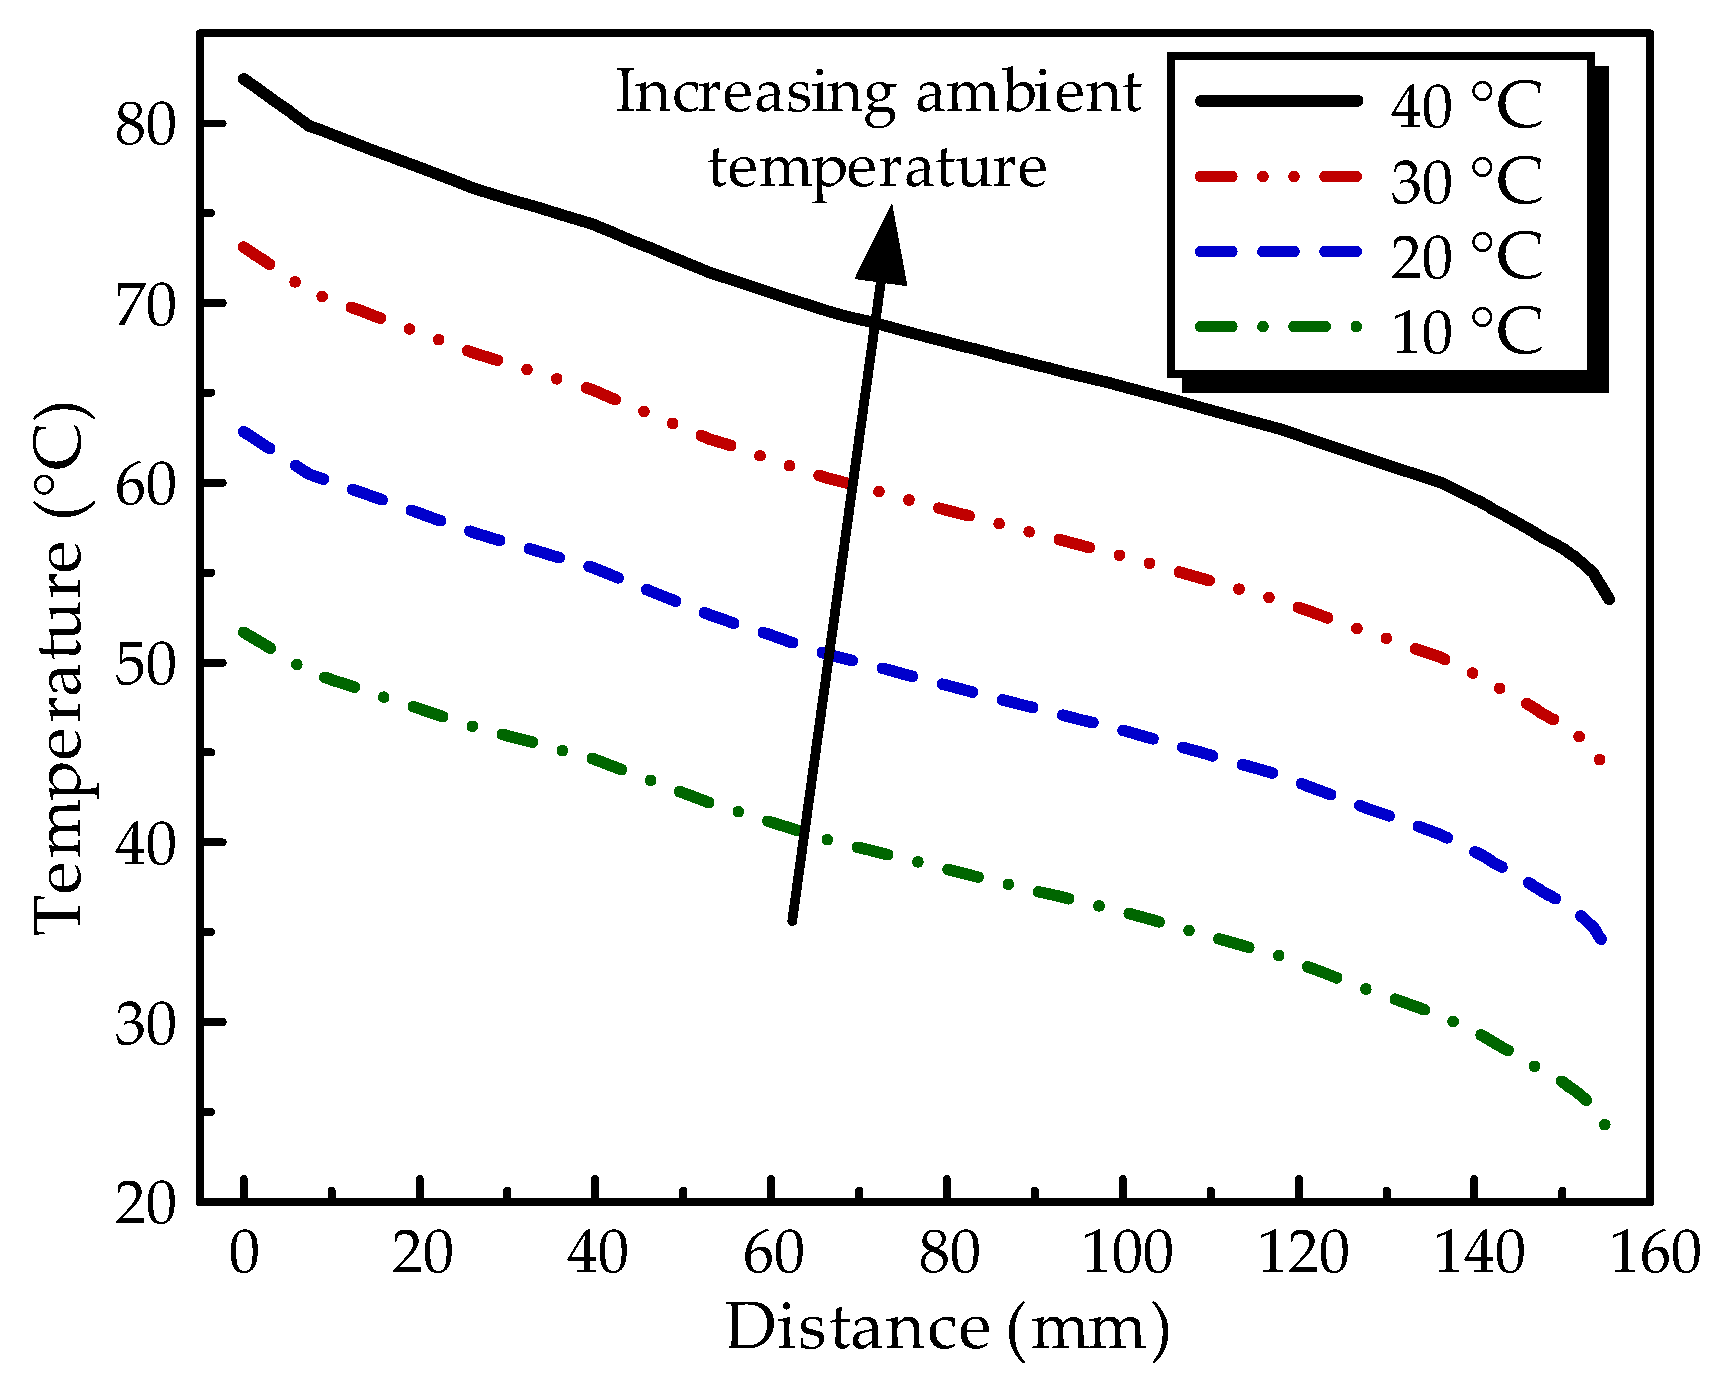
Considering the influence of the application zone and seasonal variation on ambient temperature, simulations with ambient temperatures of 10, 20, 30 and 40 °C were conducted, respectively. In the simulations, the load current was 3150 A and the SF6 pressure was 0.5 MPa. Regardless of the ambient temperature, the surface temperature followed a similar tendency, with decreases from the central high voltage electrode to the outer ground shielding with higher temperatures appearing at the upper part.
The temperature distribution along curve A defined in Figure 4a is shown in Figure 12. It is obvious that the temperature increased nearly linearly with an increase in the ambient temperature. A similar tendency for the conductor temperature has been reported by Wang et al. [20]. Natural convection at the outer surface of the enclosure can be described as:
where κe is the thermal conductivity of the enclosure, n is the normal vector at the interface, h is the natural convection coefficient between the enclosure and the ambient air, Te and Ta are the temperatures of the enclosure and ambient air, respectively.
By increasing the ambient temperature, the heat transfer by natural convection at the outer surface of the enclosure decreased nearly linearly while the heat generated by the conductor remained the same. The overall temperature of the GIL should increase linearly.
3.5. Influence of the Load Current on Temperature Distribution
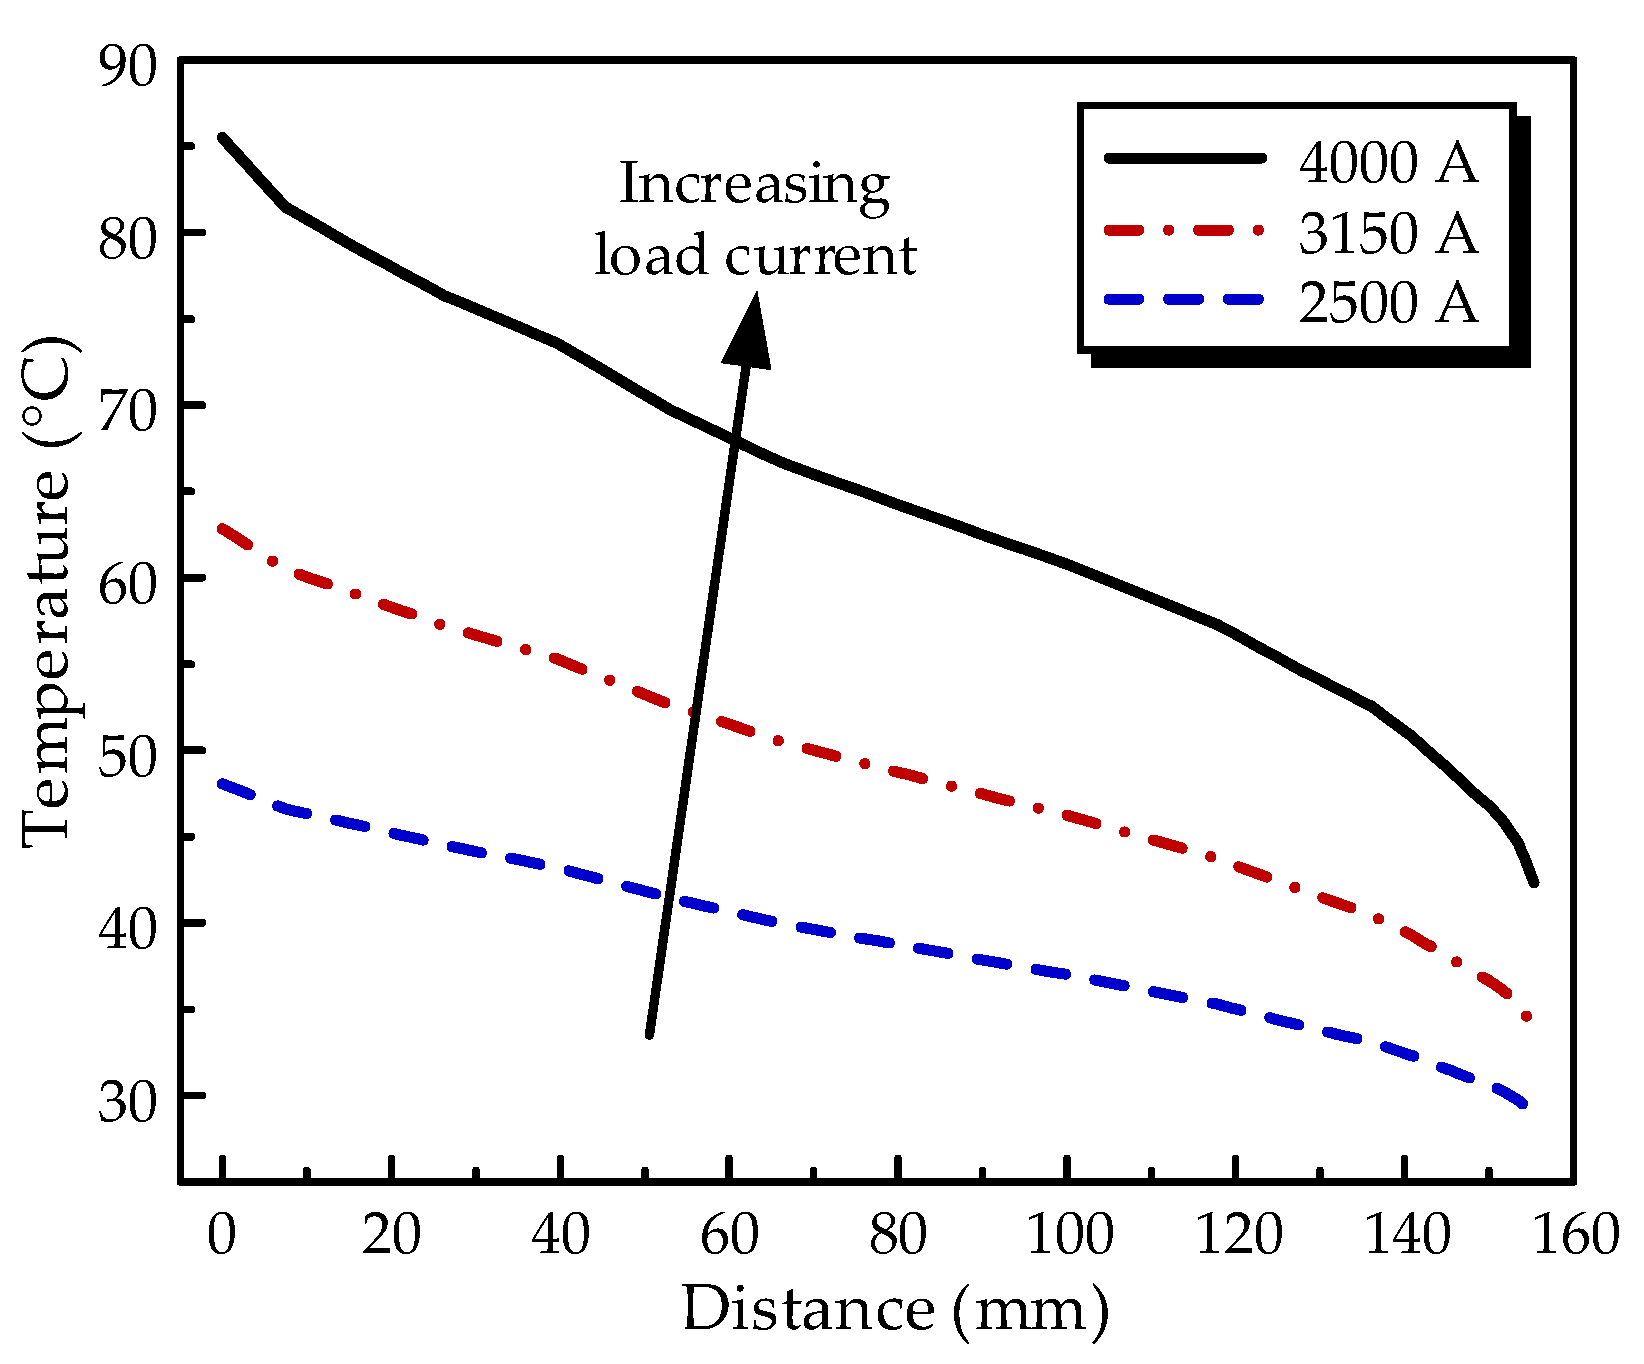
The influence of the load current on the temperature distribution was studied with currents of 2500, 3150 and 4000 A, respectively. In these cases, the ambient temperature was 20 °C and the SF6 pressure was 0.5 MPa. It was found that with an increase in the load current, the surface temperature distribution followed a similar tendency as the temperature decreased from the inner to the outer part and a higher temperature appeared at the upper part of the spacer. The temperature of the convex surface was higher than that of the concave surface. The temperature distribution along curve A corresponding to the convex surface of the upper part is shown in Figure 13.
It is obvious that by increasing the current, the temperature increased since the heat generated due to the Joule effect increased as indicated in Equation (1) while the heat dissipation nearly remained the same. Moreover, the temperature difference between the highest temperature at the high voltage electrode and the lowest temperature at the ground shielding increased with increases in the current.
This is due to the fact that heat generation dominates the temperature rise over the heat transfer inside the GIL. Natural convection driven by SF6 cannot follow the increasing tendency of heat generation due to the increasing current and thus it results in the more obvious temperature rise at the heat source that is the conductor. Furthermore, it can be concluded that attention should be paid to the high-level load current conditions when designing the structure of GIL or GIS busbars since the high temperature will lead to the accelerated aging of the epoxy spacer. Besides, severe electric field distortion and charge accumulation may occur due to the high temperature, which will increase the risk of insulation failure during long-term operations [2,3].
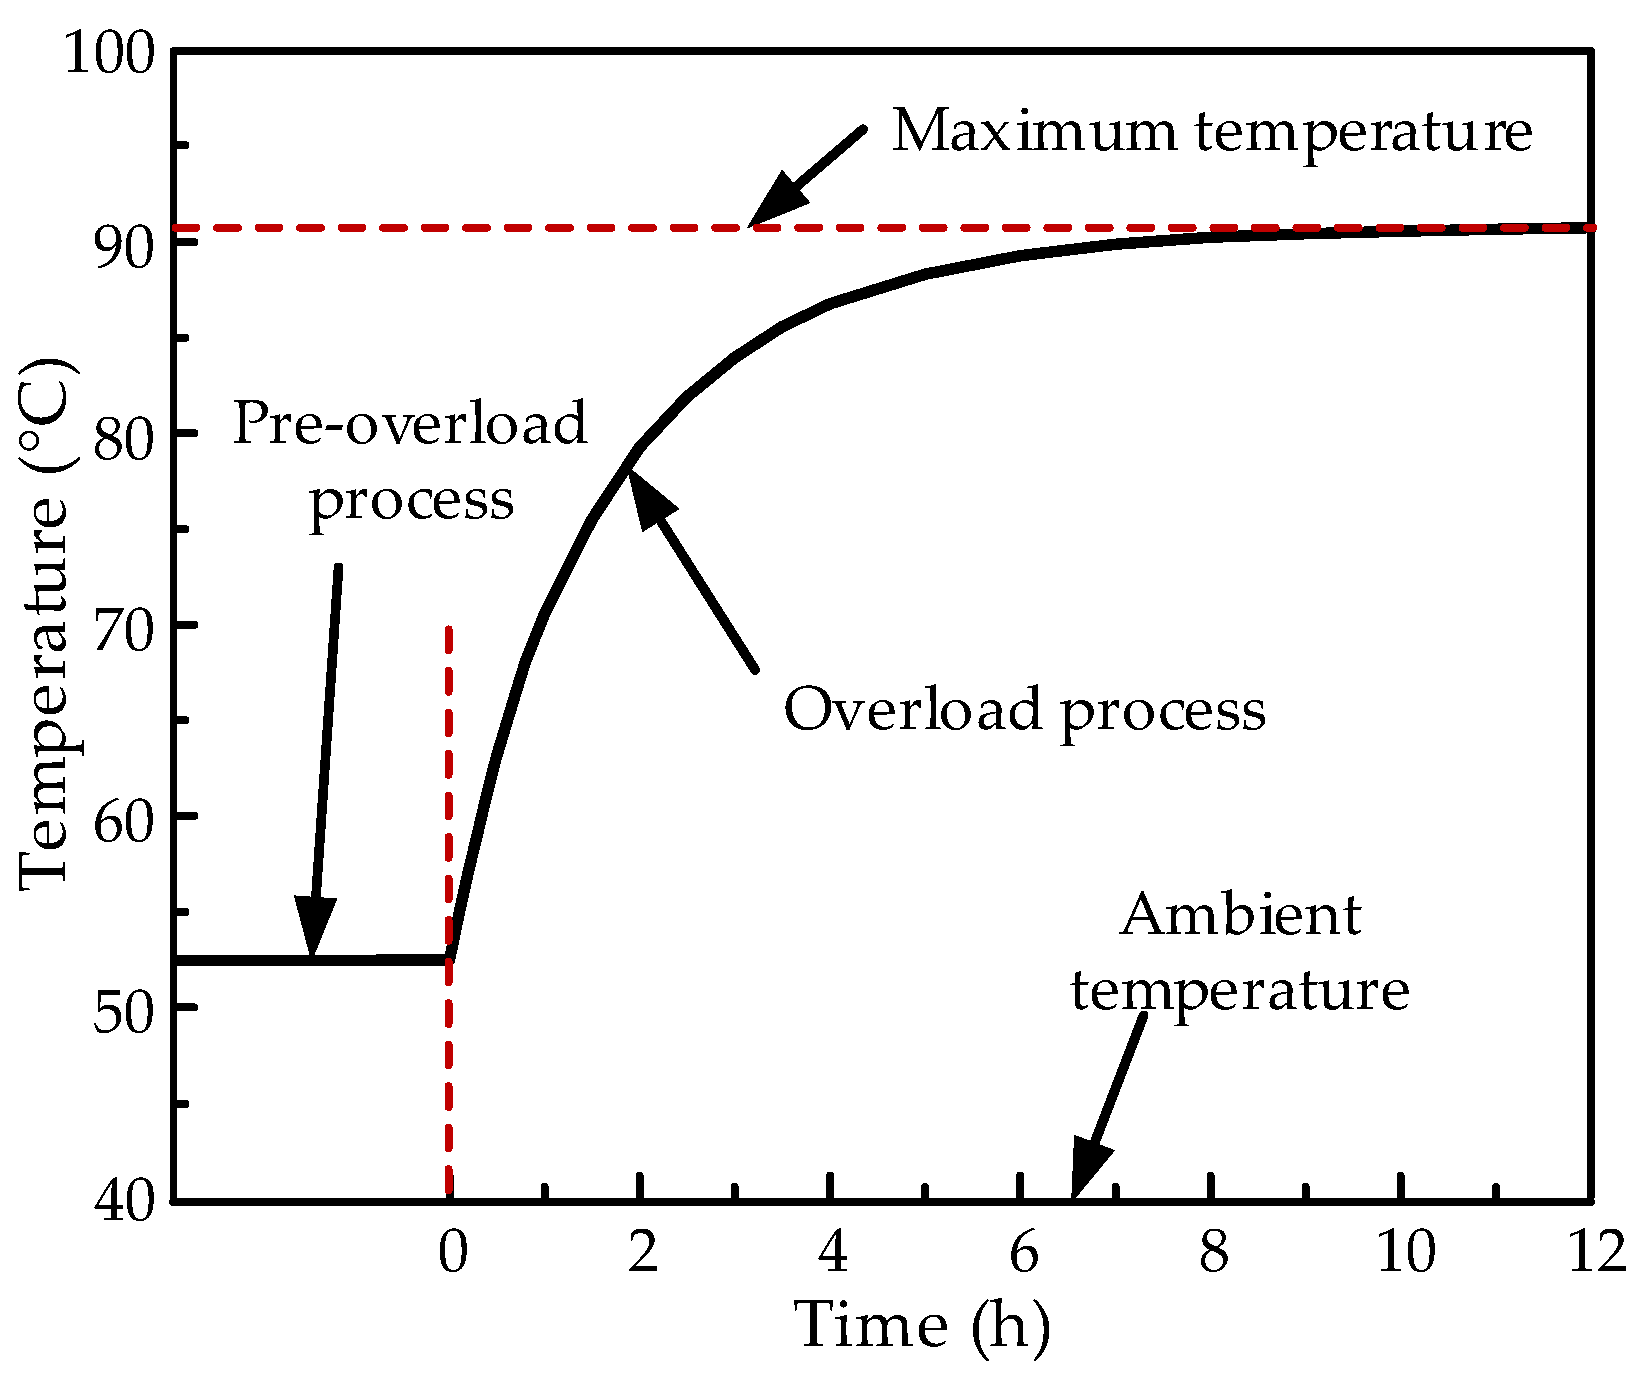
To evaluate the thermal performance under overload conditions, the process leading to the temperature rise in the spacer and the GIL model was investigated. According to the standard [1], the ambient temperature was fixed at 40 °C, and a pre-overload current with 50% of the rated continuous current was applied for a given time interval to form the pre-overload thermal gradient. Then, an overload current 10% higher than the rated current was applied and the process leading to the temperature rise under overload conditions was obtained. In this case, the rated continuous current was 3150 A and the pressure of SF6 gas was 0.5 MPa. The maximum temperature in the GIL with heating time is illustrated in Figure 14. This point corresponding to the maximum temperature was at the spacer–conductor intersection.
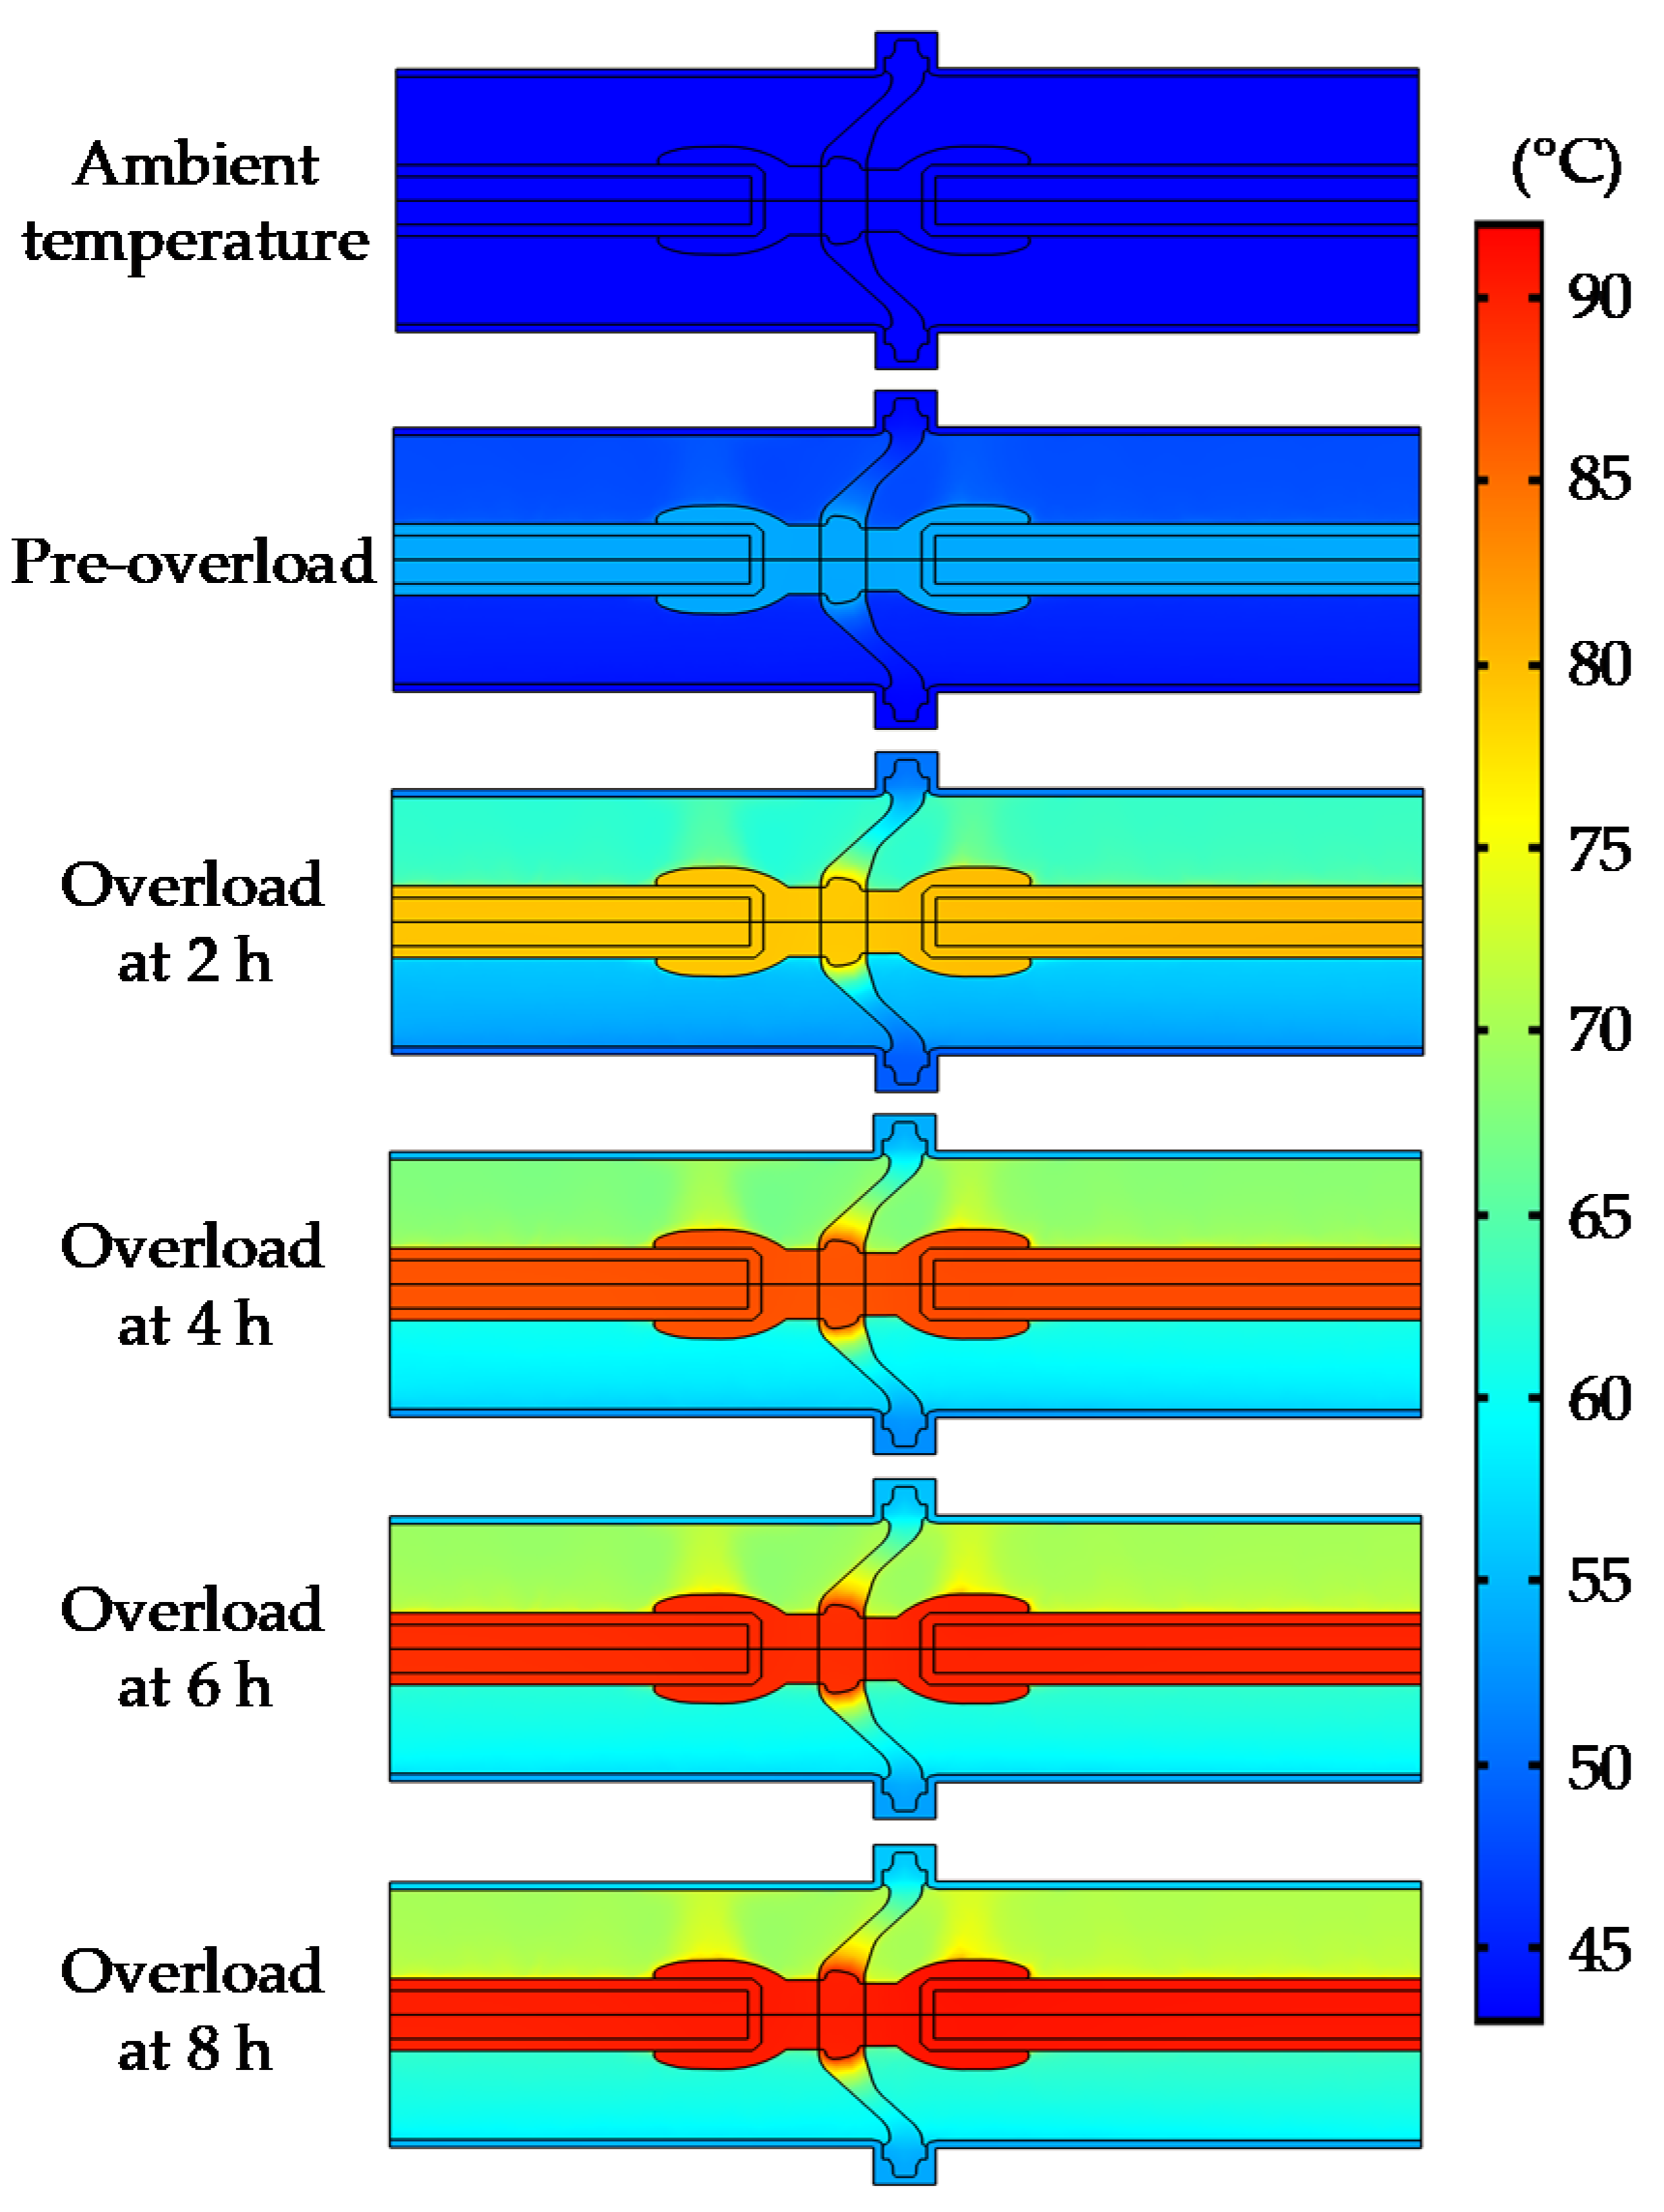
As shown in the figure, with an increase in the heating time, the rate of temperature rising slowed down. After heating for about 8 h, the temperature distribution reached quasi-steady-state and a thermal equilibrium appeared. The maximum temperature rise in the conductor and the spacer was about 50 °C. The temperature distribution on the spacer surface and the whole GIL at 0, 2, 4, 6 and 8 h during the heating process is shown in Figure 15. Since the electric conductivity of epoxy composites and ion mobility in SF6 gas vary with temperature, the result of a temperature rise can contribute to an analysis of the electric field variation of the spacer in long-term operations considering the electric–thermal coupled effect.
3.6. Influence of the Thermal Gradient on Electric Field Distribution
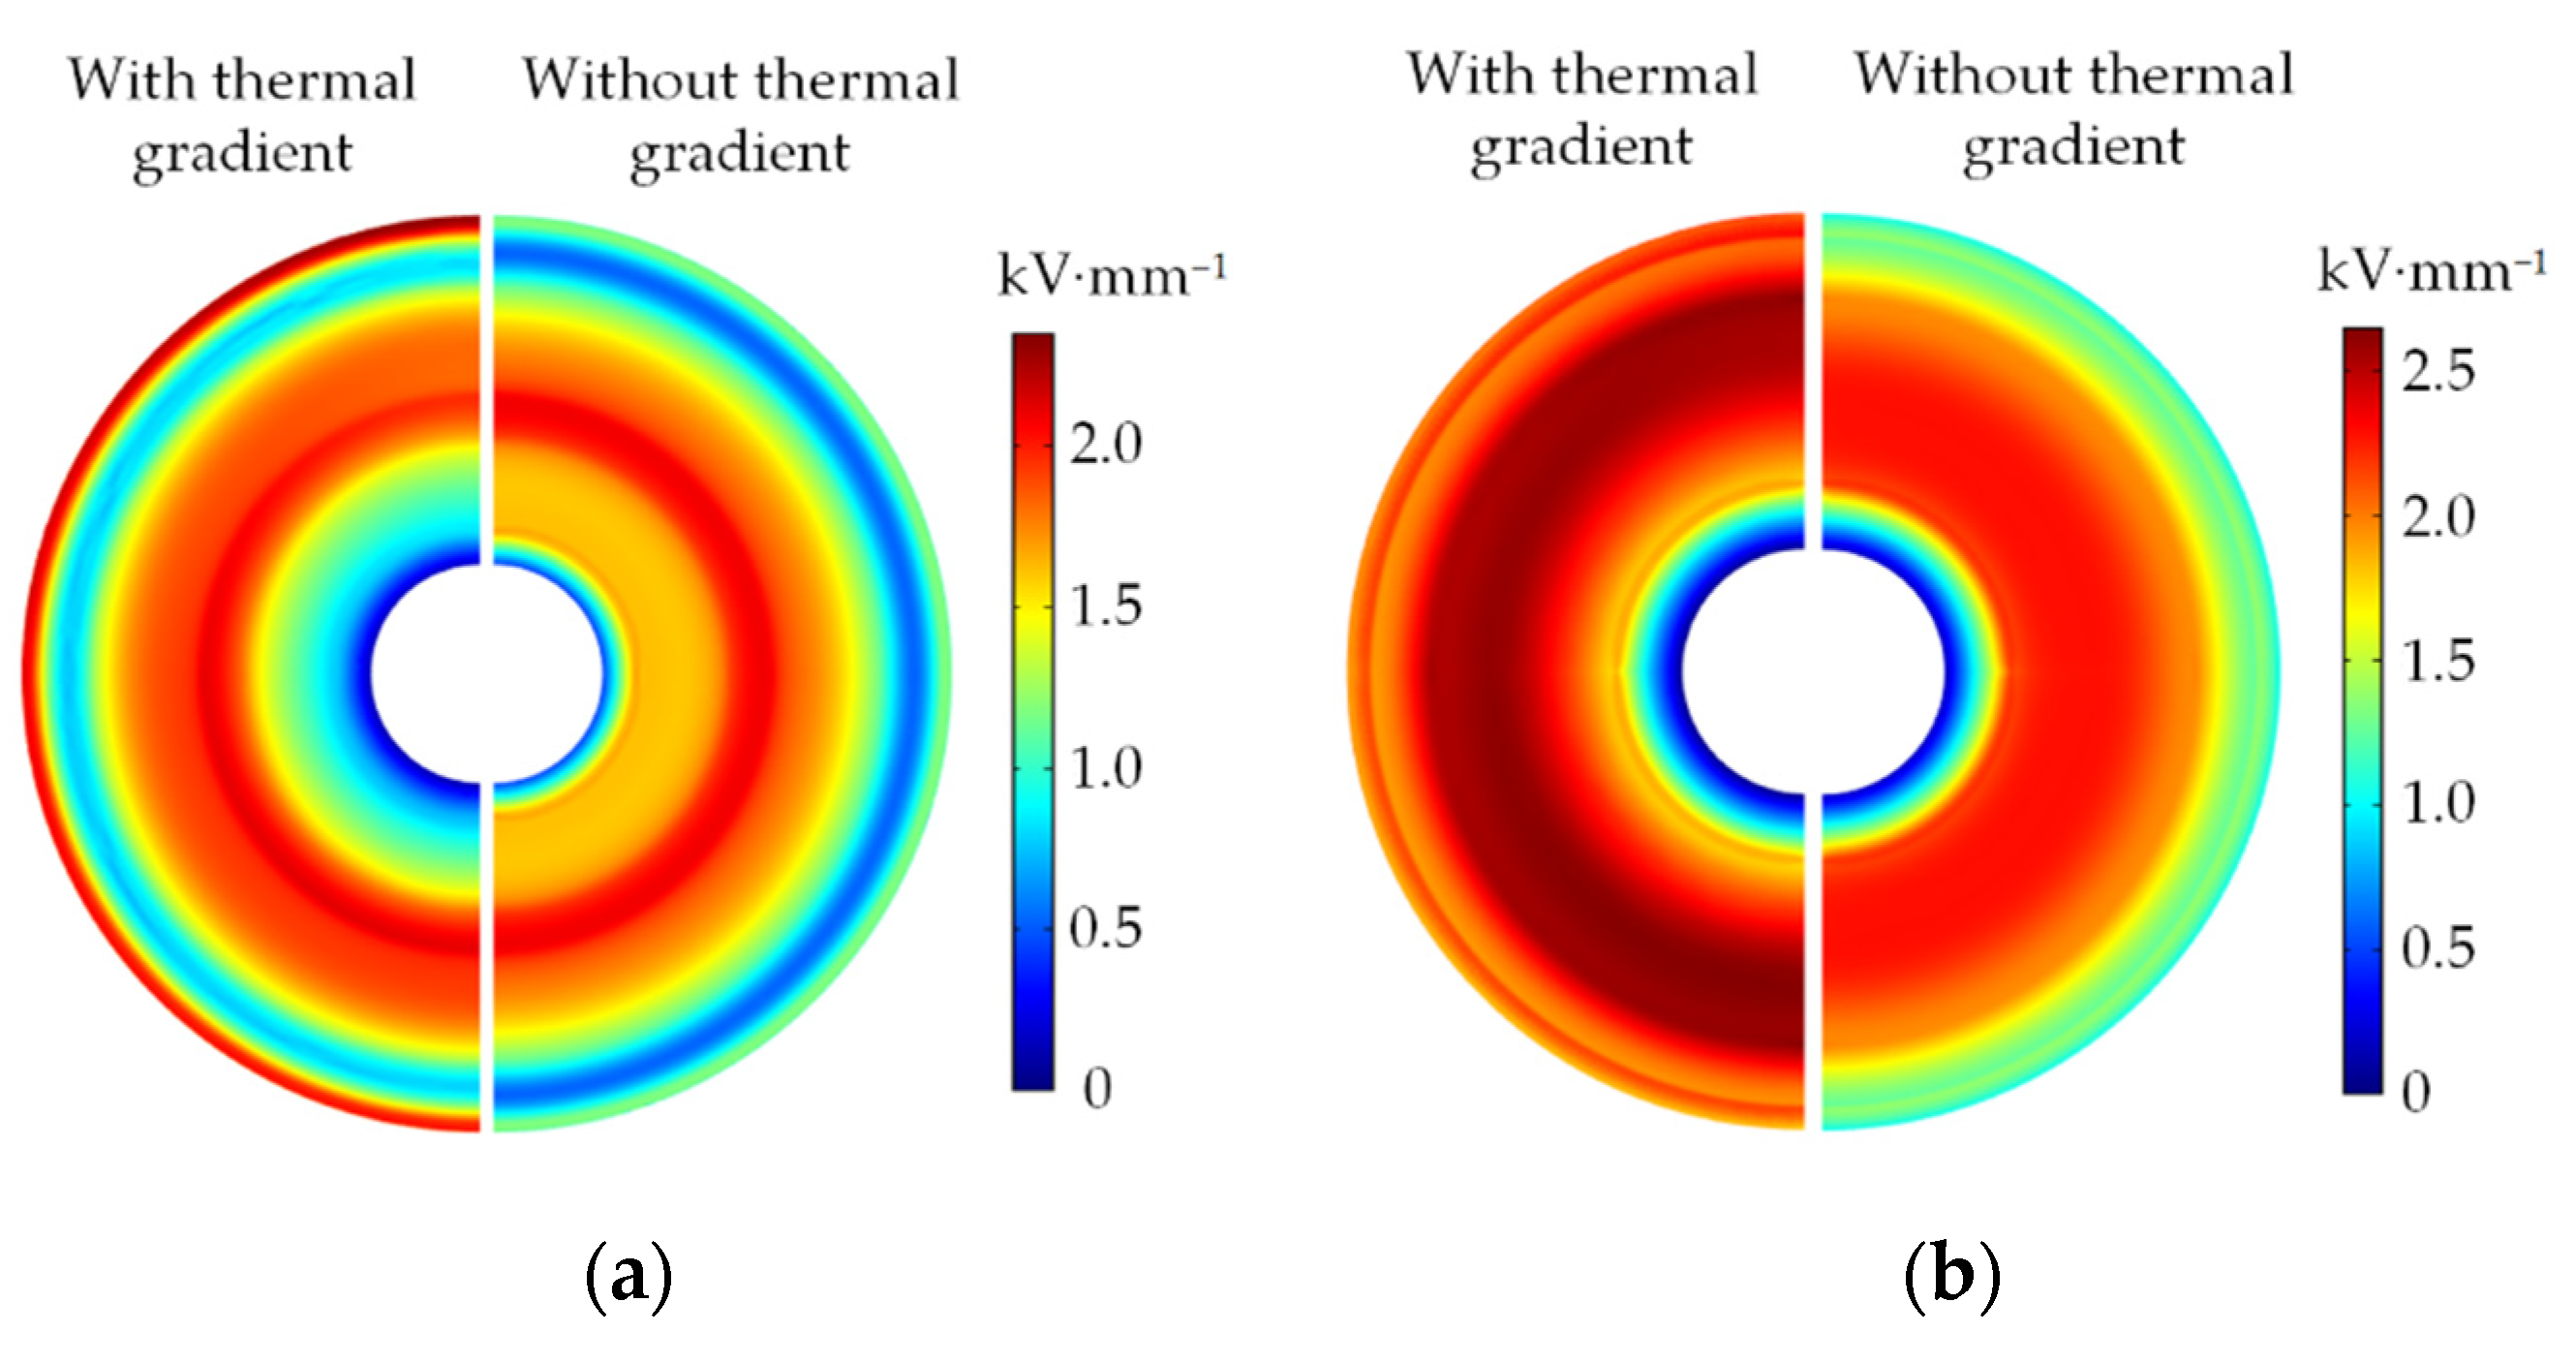
The influence of the thermal gradient on the electric distribution of the spacer was studied. The temperature-dependent electric conductivity of the spacer was obtained from L. Zavattoni’s measurement [5]. A positive voltage of 200 kV was applied on the central conductor and the field distribution under the influence of thermal gradient was obtained. The load current was 3150 A, the ambient temperature was 20 °C and the gas pressure was 0.5 MPa. The field distribution without the influence of thermal gradient was calculated as the reference. The results are illustrated in Figure 16.
As shown in this figure, an obvious difference in field distribution can be seen between the cases with and without thermal gradient for both the concave and convex surfaces. This could be attributed to the exponential variation of the electric conductivity with temperature. For the concave surface, an obvious increase in the field strength appeared at the outer part of the spacer surface. However, for the convex surface, the field strength of the overall surface showed an obvious increase.
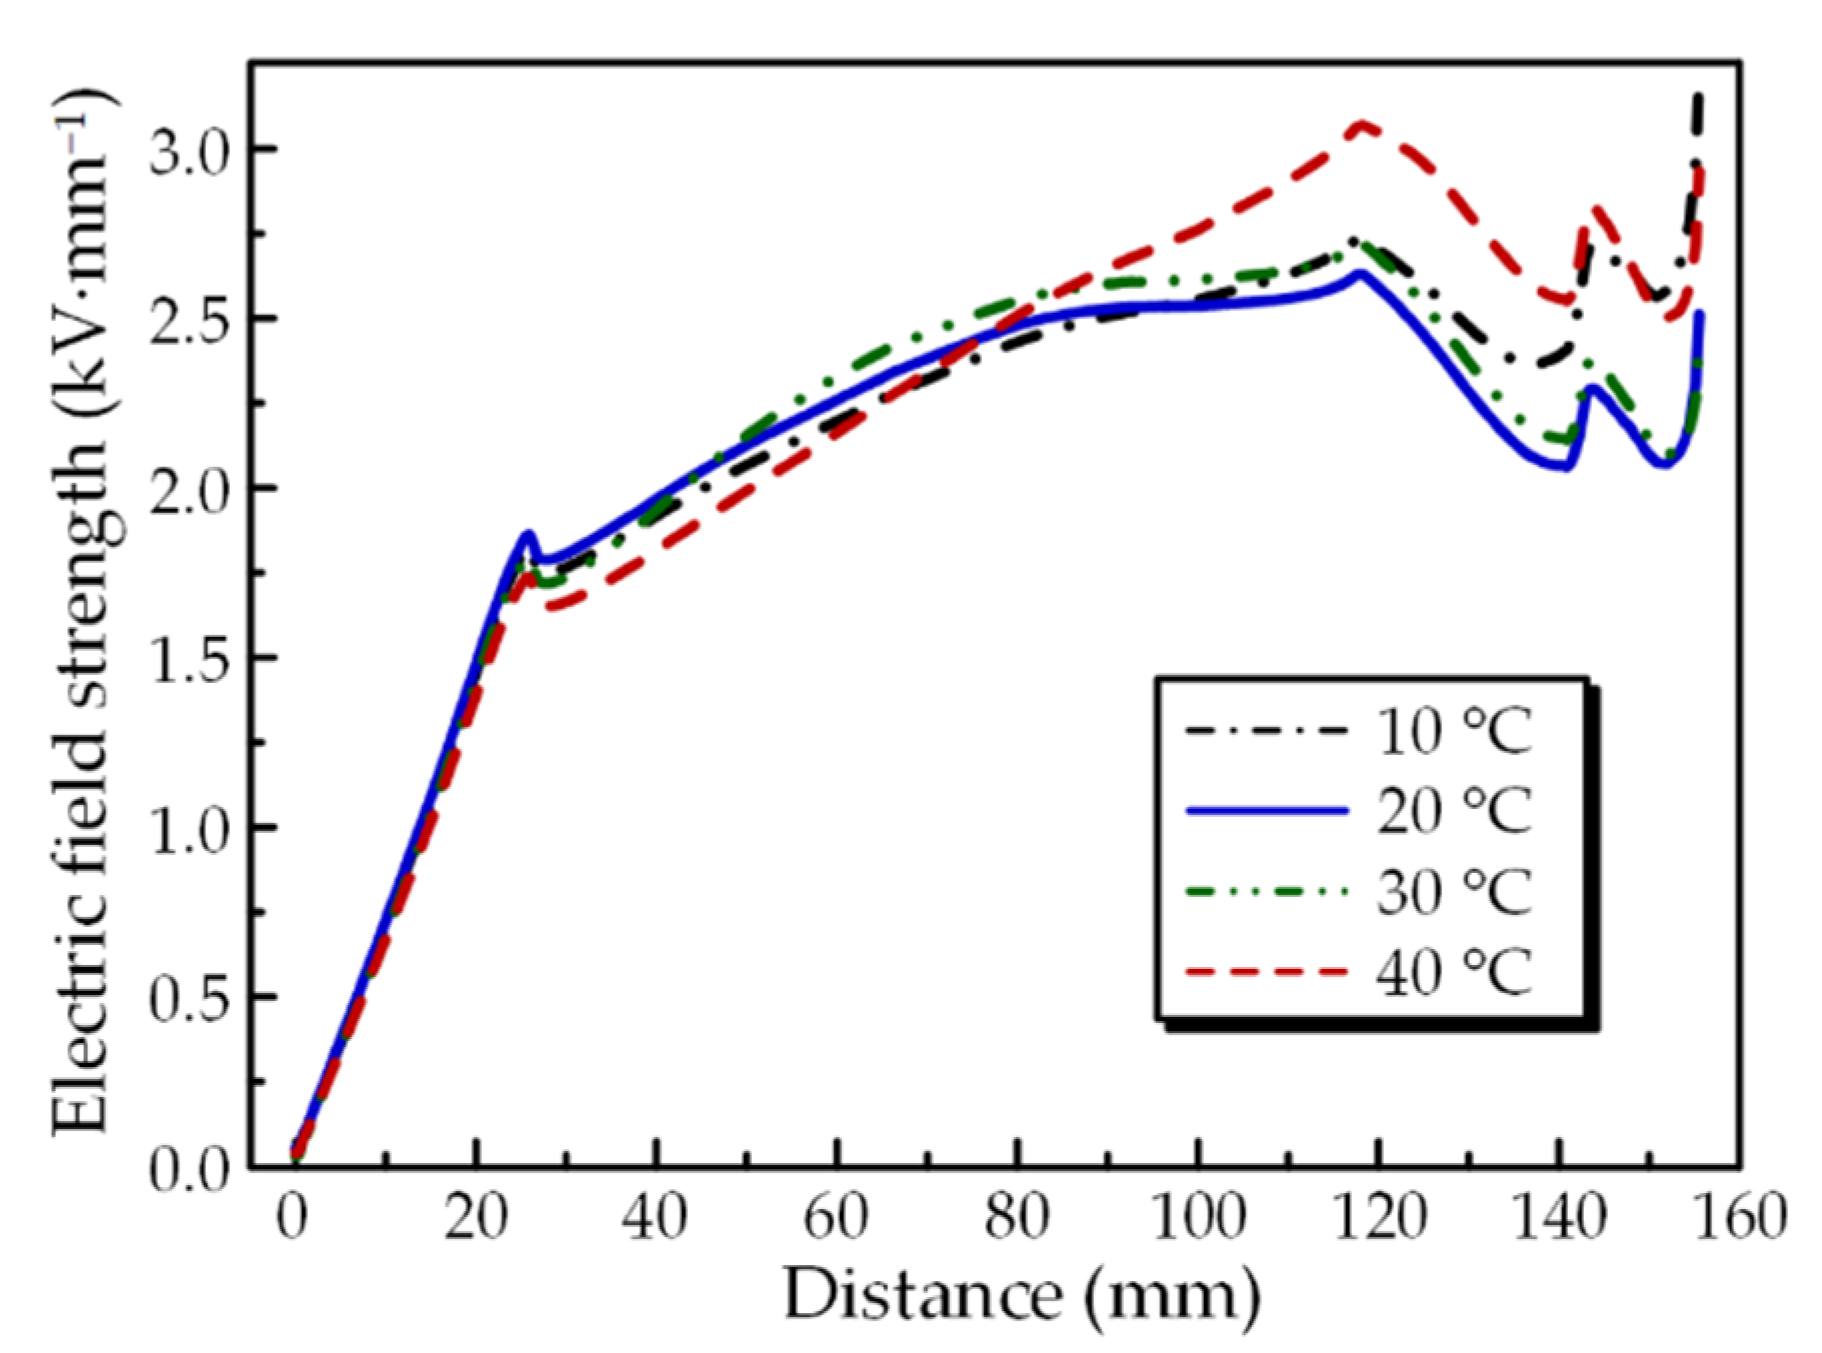
To analyze the influence of ambient temperature referring to the thermal gradient on the field distribution, the electric field distribution of the spacer under different ambient temperature was obtained. The corresponding condition and thermal gradient applied to the temperature-dependent electric conductivity were in accordance with Section 3.4. Thus, the ambient temperature was 10, 20, 30 and 40 °C. The current was 3150 A and the gas pressure was 0.5 MPa. The field distribution along curve A is illustrated in Figure 17.
With an increase in the temperature from 10 °C to 20 °C, the field strength near the enclosure decreased. Further increases in the temperature led to an increase in the field strength. However, with an increase in ambient temperature, the overall temperature showed a linear increasing trend corresponding to the variation in the ambient temperature, as indicated in Figure 12. The electric conductivity of the spacer showed an exponentially increasing tendency with increasing temperature. Since the electric field distribution of the spacer is affected by the overall electric conductivity distribution of the spacer, this may lead to the non-monotonic variation in electric field strength distribution with increases in ambient temperature. Thus, an evaluation of the insulation properties referring to the weather and seasons should be considered for the long-term operation of DC-GIL.
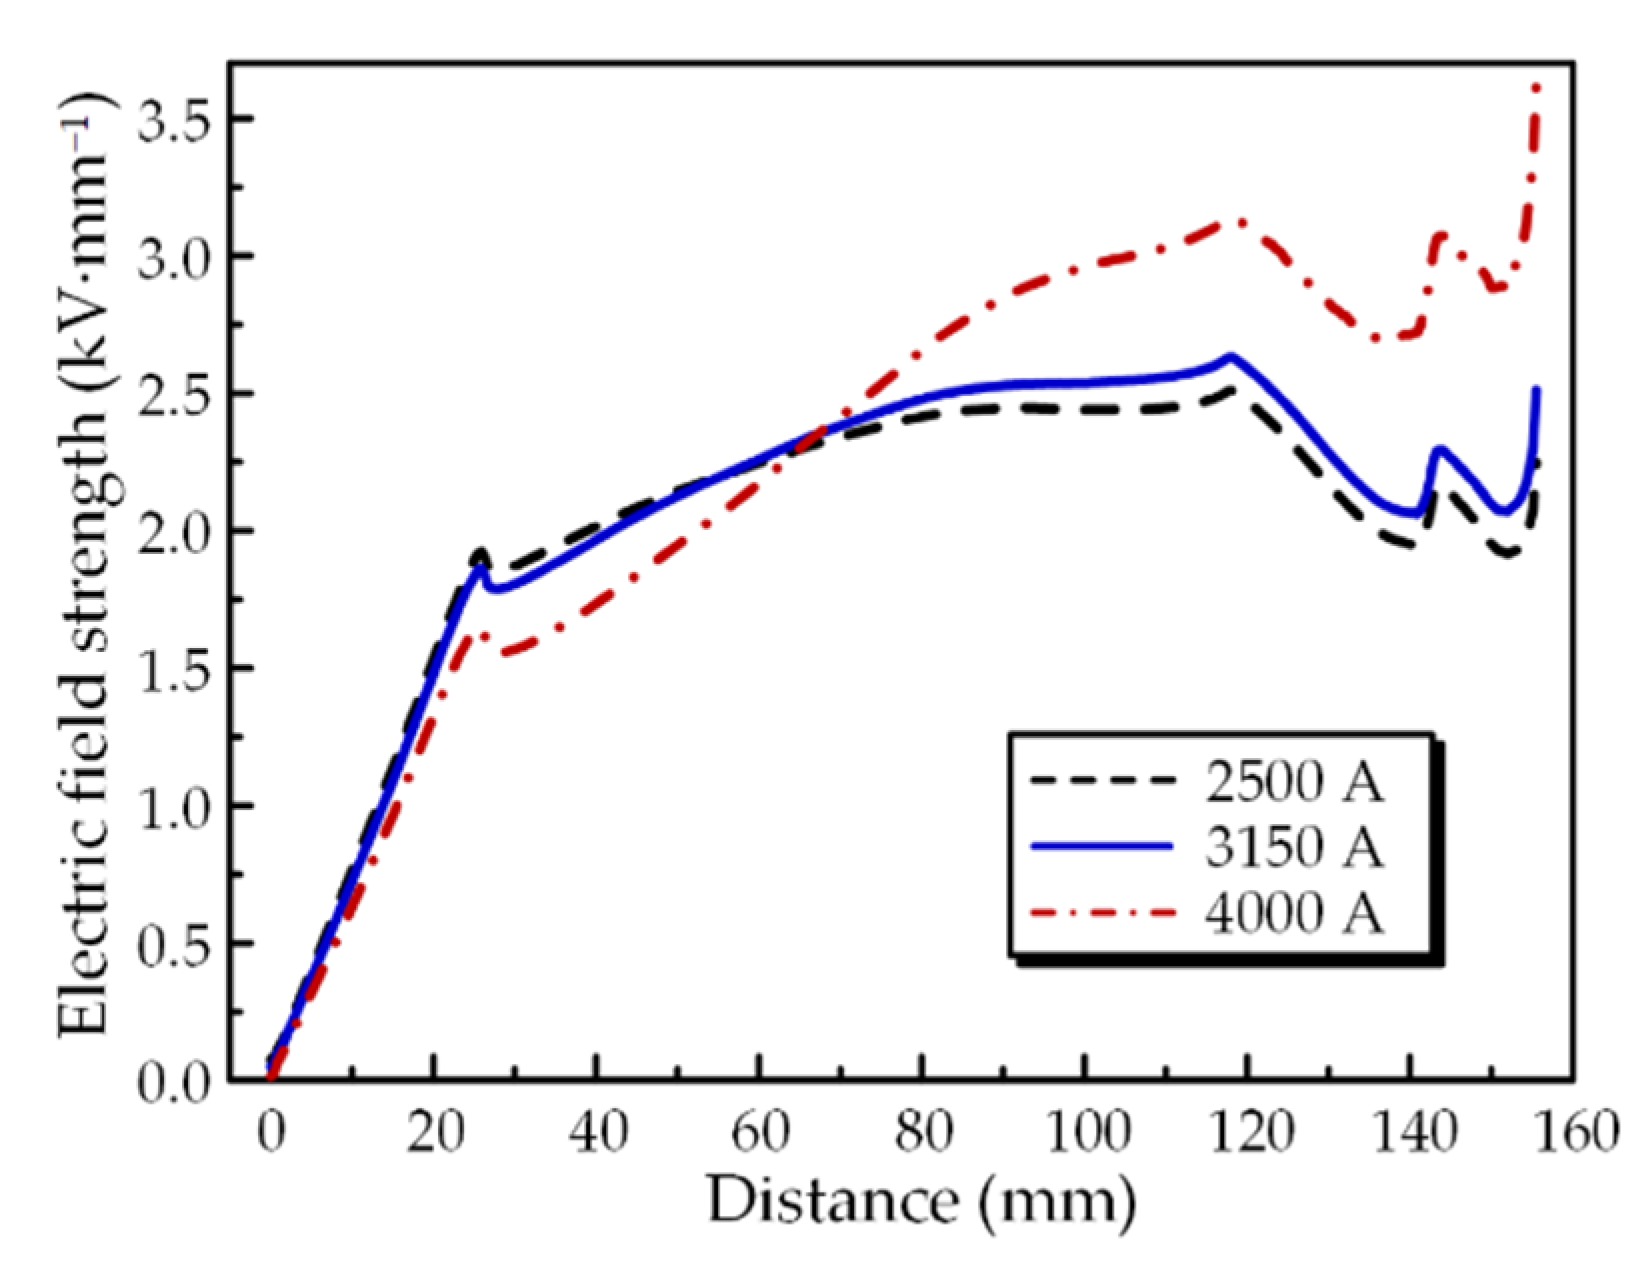
To analyze the influence of the load current on the field distribution, the electric field distribution of the spacer under different current was obtained. The thermal gradient corresponding to the different load current was obtained from Section 3.5 and then applied to the temperature-dependent electric conductivity. The load currents were selected as 2500, 3150 and 4000 A. The field distribution along curve A is illustrated in Figure 18. With an increase in the current, an obvious increase appeared at the region near the enclosure. Thus, attention should be paid to the field distribution property of the spacer, especially at the condition of a high load current.
Moreover, comparing the results in Figure 17 and Figure 18, it can be seen that the field strength distribution showed the same trends at a high ambient temperature and a high current. This may have been due to the fact that a high temperature distribution appeared in the two conditions, as indicated in Figure 12 and Figure 13. However, the field strength under a high current showed a more obvious high field strength near the enclosure compared with the result under a high ambient temperature. This may have been due to the fact that the temperature difference between the high-temperature conductor and the low-temperature enclosure was more obvious under high load currents compared to the condition of high ambient temperatures.
It is noted that the electric field characteristics were calculated without considering the influence of charge accumulation. Obvious charge would accumulate on the spacer surface which could affect the electric field distribution characteristics. As reported, the charge accumulation would be affected by the thermal gradient during long-term operations which shows an obvious influence on the electric field distribution [13,14]. The thermal gradient would affect the field distribution due to the temperature-dependent electric conductivity of the spacer. Meanwhile, the thermal gradient would affect the ion mobility during the charge accumulation process. Both of the aspects would affect the charge accumulation and electric field distribution characteristics. Thus, the investigation of charge accumulation should be more meaningful when referring to field characteristics under electric-thermal coupled fields. This should be concerned with the 3D thermal gradient in the future.
4. Conclusions
The temperature characteristics of a horizontally installed GIL model with a basin-type spacer inside were investigated by FEM with a 3D model. The conclusions can be summarized as follows:
- The specific heat capacity and thermal conductivity of the spacer were measured under various temperatures and applied in the simulation. Higher temperatures appeared at the upper part of the spacer as the consequence of natural convection. The temperature difference could be 10 °C in the middle of the spacer. The temperature of the convex surface was slightly higher than that of the concave surface due to the flow motion towards the spacer near the shielding. Moreover, a temperature difference of about 3 °C could be found.
- With an increase in the SF6 pressure from 0.4 to 0.6 MPa, the temperature of the conductor decreased from 66 to 60 °C due to the improvement in the convection characteristics with an increase in heat capacity per unit volume. With an increase in the ambient temperature from 10 to 40 °C, the temperature of the spacer increased linearly with the variation in the ambient temperature, which was attributed to the linear decrease in heat dissipation. The temperature difference between the inner and outer parts of the spacer increased from 20 to 40 °C with an increase in the load current from 2500 to 4000 A.
- An obvious increase in the electric field strength of 0.5 kV·mm−1 appeared at the spacer surface considering the influence of the thermal gradient compared to the result without the thermal gradient. With an increase in the load current, the field strength increased. Thus, special attention should be paid to the insulation properties under a high load current, different weather conditions and different seasons for the long-term operation of DC-GIL. Further, the 3D temperature distribution can promote an understanding of the insulation characteristics of the GIL in both transient and steady conditions.
Author Contributions
X.L. (Xiaolong Li) Conceptualization, investigation, writing—original draft and funding acquisition; M.W. software, validation, data curation and visualization. S.Y. Methodology, formal analysis, writing—review and editing; X.L. (Xin Lin) Resources, project administration and supervision. All authors have read and agreed to the published version of the manuscript.
Funding
This research was funded by the National Natural Science Foundation of China (No. 51807122), the Scientific Research Project of The Educational Department of Liaoning Province (No. LQGD2019003) and the Science and Technology Project of State Grid Corporation of China (SGSDDK00SPJS2100037).
Institutional Review Board Statement
Not applicable.
Informed Consent Statement
Not applicable.
Data Availability Statement
Not applicable.
Conflicts of Interest
The authors declare no conflict of interest.
References
- Koch, H. Gas-Insulated Transmission Lines; John Wiley & Sons: London, UK, 2012; pp. 4–5. [Google Scholar]
- Li, X.; Liu, W.D.; Xu, Y.; Chen, W.; Bi, J. Surface Charge Accumulation and Pre-Flashover Characteristics Induced by Metal Particles on The Insulator Surfaces of 1100 kV GILs under AC Voltage. High Volt. 2020, 5, 134–142. [Google Scholar]
- Xing, Y.Q.; Liu, L.; Xu, Y.; Yang, Y.; Li, C.Y. Defects and Failure Types of Solid Insulation in Gas Insulated Switchgear: In situ Study and Case Analysis. High Volt. 2021. [Google Scholar] [CrossRef]
- Okabe, S.; Ueta, G.; Nojima, K. Resistance Characteristics and Electrification Characteristics of GIS Epoxy Insulators under DC Voltage. IEEE Trans. Dielectr. Electr. Insul. 2014, 21, 1260–1267. [Google Scholar] [CrossRef]
- Zavattoni, L. Conduction Phenomena through Gas and Insulating Solids in HVDC Gas Insulated Substations, and Consequences on Electric Field Distribution. Ph.D. Thesis, Université de Grenoble, Grenoble, France, 2014. [Google Scholar]
- Du, B.X.; Liang, H.C.; Li, J.; Ran, Z.Y. Electrical Field Distribution along SF6/N2 Filled DC-GIS/GIL Epoxy Spacer. IEEE Trans. Dielectr. Electr. Insul. 2018, 25, 1202–1210. [Google Scholar] [CrossRef]
- Ma, G.M.; Zhou, H.Y.; Lu, S.J.; Wang, Y.; Liu, S.P.; Li, C.R.; Tu, Y.P. Effect of Material Volume Conductivity on Surface Charges Accumulation on Spacers under DC Electro-Thermal Coupling Stress. IEEE Trans. Dielectr. Electr. Insul. 2018, 25, 1211–1220. [Google Scholar] [CrossRef]
- Chakir, A.; Koch, H. Turbulent Natural Convection and Thermal Behaviour of Cylindrical Gas-Insulated Transmission Lines (GIL). In Proceedings of the IEEE PES Summer Meeting, Vancouver, Canada, 15–19 July 2001. [Google Scholar]
- Kim, J.K.; Hahn, S.C.; Park, K.Y.; Hong, K.K.; Oh, Y.H. Temperature Rise Prediction of EHV GIS Bus Bar by Coupled Magnetothermal Finite Element Method. IEEE Trans. Magn. 2005, 41, 1636–1639. [Google Scholar]
- Rebzani, N.; Clavel, E.; Marty, P.; Morin, A. Numerical Multiphysics Modeling of Temperature Rises in Gas Insulated Busbars. IEEE Trans. Dielectr. Electr. Insul. 2016, 23, 2579–2586. [Google Scholar] [CrossRef]
- Novak, B.; Koller, L. Steady-State Heating of Gas Insulated Busbars. In Proceedings of the 2012 IEEE/PES Transmission and Distribution Conference and Exposition (T&D), Orlando, FL, USA, 5–10 May 2012. [Google Scholar]
- Chen, G.; Tu, Y.; Wang, C.; Cheng, Y.; Jiang, H.; Zhou, H.; Jin, H. Analysis on Temperature Distribution and Current-Carrying Capacity of GIL Filled with Fluoronitriles-CO2 Gas Mixture. J. Electr. Eng. Technol. 2018, 13, 2402–2411. [Google Scholar]
- Yan, W.; Li, C.; Lei, Z.; Han, T.; Zhang, Z.; Fabiani, D. Surface Charging on HVDC Spacers Considering Time-Varying Effect of Temperature and Electric Fields. IEEE Trans. Dielectr. Electr. Insul. 2019, 26, 1316–1324. [Google Scholar] [CrossRef]
- Liang, H.C.; Du, B.X.; Li, J. Electric Field Regulation and Parameter Optimization of Surface Nonlinear Conductivity Spacer for 500 kV DC-GIL. IEEE Trans. Dielectr. Electr. Insul. 2020, 27, 1330–1338. [Google Scholar] [CrossRef]
- Lienhard, H.I.V.; Lienhard, H.V. A Heat Transfer Textbook, 3rd ed.; Phlogiston Press: Cambridge, MA, USA, 2003; p. 528. [Google Scholar]
- Yunus, A.C. Heat Transfer: A Practical Approach, 2nd ed.; Mcgraw-Hill: New York, NY, USA, 2002; pp. 465–466. [Google Scholar]
- Kueh, T.H.; Goldstein, R.J. Correlating Equations for Natural Convection Heat Transfer between Horizontal Circular Cylinders. Int. J. Heat Mass Transfer. 1976, 19, 1127–1134. [Google Scholar]
- COMSOL. CFD Module User’s Guide; COMSOL Multiphysics 5.5; COMSOL: Burlington, MA, USA, 2019; pp. 207–209. [Google Scholar]
- Qiao, Y.; Liang, R.; Gao, P.; Zhu, S.Y.; Chen, C.Y.; Qin, Y.X.; Tang, X.Z. Heat Transfer Analysis of Different Conditions for SF6/N2 Gas-Insulated Transmission Lines. IEEE Trans. Power Del. 2020, 5, 160–165. [Google Scholar]
- Wang, J.; Chen, C.; Li, Q.M.; Liu, S.H.; Wang, Z.Y. Thermal-Induced Flexible Property of Gas Insulated Lines and Influencing Factors based on Thermal Mechanical Coupling Analysis. High Volt. Eng. 2017, 43, 429–437. [Google Scholar]
Figure 1.
Geometric model of the GIL model.

Figure 2.
Thermal conductivity and specific heat capacity of the epoxy spacer at different temperatures.
Figure 2.
Thermal conductivity and specific heat capacity of the epoxy spacer at different temperatures.

Figure 3.
Temperature distribution at the gas–solid interface with different turbulence models.

Figure 4.
Temperature distribution with different geometry models. (a) represents the result of the real-type model, and (b) represents the result of the simplified model.
Figure 4.
Temperature distribution with different geometry models. (a) represents the result of the real-type model, and (b) represents the result of the simplified model.

Figure 5.
Surface temperature of the spacer with different geometry models.

Figure 6.
Surface temperature distribution of the spacer.

Figure 7.
Velocity distribution in SF6 gas for different cross-section views.

Figure 8.
Surface temperature distribution along the spacer–symmetry plane interface.

Figure 9.
Surface temperature distribution of the spacer with different SF6 pressures. (a) 0.4 MPa, (b) 0.6 MPa.
Figure 9.
Surface temperature distribution of the spacer with different SF6 pressures. (a) 0.4 MPa, (b) 0.6 MPa.

Figure 10.
Velocity distribution near the spacer with different SF6 pressures. (a) 0.4 MPa, (b) 0.6 MPa.
Figure 10.
Velocity distribution near the spacer with different SF6 pressures. (a) 0.4 MPa, (b) 0.6 MPa.

Figure 11.
Surface temperature distribution along the spacer surface with different SF6 pressures.

Figure 12.
Surface temperature distribution along the spacer surface with different ambient temperatures.
Figure 12.
Surface temperature distribution along the spacer surface with different ambient temperatures.

Figure 13.
Surface temperature distribution along the spacer surface with different load currents.

Figure 14.
Temperature increases in the spacer with heating time.

Figure 15.
Temperature distribution of the spacer and GIL at different overload stages.

Figure 16.
The influence of the thermal gradient on the electric field distribution of the spacer surface. (a) Concave surface; (b) Convex surface.
Figure 16.
The influence of the thermal gradient on the electric field distribution of the spacer surface. (a) Concave surface; (b) Convex surface.

Figure 17.
The influence of ambient temperature on the electric field distribution of the spacer.

Figure 18.
The influence of the load current on the electric field distribution of the spacer.


Table 1.
Parameters of the simulation model.
| Inner Diameter (mm) | Thickness (mm) | Material | |
|---|---|---|---|
| Conductor | 40 | 15 | Aluminum |
| Enclosure | 215 | 10 | Aluminum alloy |
Table 2.
Thermal parameters of the conductor and enclosure.
| Thermal Conductivity (W·m−1·K−1) | Specific Heat Capacity (J·kg−1·K−1) | Density (kg·m−3) | |
|---|---|---|---|
| Conductor | 218 | 895 | 2690 |
| Enclosure | 152 | 819 | 2660 |
Publisher’s Note: MDPI stays neutral with regard to jurisdictional claims in published maps and institutional affiliations. |
© 2021 by the authors. Licensee MDPI, Basel, Switzerland. This article is an open access article distributed under the terms and conditions of the Creative Commons Attribution (CC BY) license (https://creativecommons.org/licenses/by/4.0/).
Share and Cite
MDPI and ACS Style
Li, X.; Wan, M.; Yan, S.; Lin, X. Temperature and Electric Field Distribution Characteristics of a DC-GIL Basin-Type Spacer with 3D Modelling and Simulation. Energies 2021, 14, 7889. https://0-doi-org.brum.beds.ac.uk/10.3390/en14237889
AMA Style
Li X, Wan M, Yan S, Lin X. Temperature and Electric Field Distribution Characteristics of a DC-GIL Basin-Type Spacer with 3D Modelling and Simulation. Energies. 2021; 14(23):7889. https://0-doi-org.brum.beds.ac.uk/10.3390/en14237889
Chicago/Turabian StyleLi, Xiaolong, Mingde Wan, Shouyi Yan, and Xin Lin. 2021. "Temperature and Electric Field Distribution Characteristics of a DC-GIL Basin-Type Spacer with 3D Modelling and Simulation" Energies 14, no. 23: 7889. https://0-doi-org.brum.beds.ac.uk/10.3390/en14237889
Note that from the first issue of 2016, this journal uses article numbers instead of page numbers. See further details here.