
Oil Pressure Monitoring for Sealing Failure Detection and Diagnosis of Power Transformer Bushing


1
State Grid Jiangsu Electric Power Co. Ltd. Research Institute, Nanjing 211103, China
2
Jiangsu Key Laboratory of New Energy Generation and Power Conversion, Nanjing University of Aeronautics and Astronautics, Nanjing 211106, China
3
State Grid Jiangxi Maintenance Company, Nanchang 330001, China
4
Maintenance Branch of Chongqing State Grid Power Company, Chongqing 400039, China
5
Jiangsu Frontier Electric Technology Co. Ltd., Nanjing 211102, China
*
Author to whom correspondence should be addressed.
Energies 2021, 14(23), 7908; https://0-doi-org.brum.beds.ac.uk/10.3390/en14237908
Submission received: 18 October 2021
/
Revised: 15 November 2021
/
Accepted: 16 November 2021
/
Published: 25 November 2021
(This article belongs to the Special Issue Frontiers in Advanced Power Equipment and Research in Condition Diagnostic and Sensing)
Abstract
:Power transformer bushings withstand great electrical and mechanical stress during high voltage and high current working conditions. Sealing failure poses a great threat to the long-term and reliable operation of the bushing and power transformer; however, the criterion to evaluate the sealing status of a bushing caused by mechanical problems is still lacking. In this paper, a transformer bushing model is established to gain theoretical insight into the relationship between temperature and pressure of a compact multilayer bushing. To evaluate the bushing mechanical status, different sealing conditions are tested based on the temperature and pressure monitoring within the physical 110 kV bushing. The results show that mechanical sealing failure can be diagnosed when the fluctuation of the oil pressure value exceeds the theoretical curve in steady state by 3 kPa. With different reliability coefficients, gas leakage and oil leakage are available to be further determined. The primary and auxiliary criteria based on oil pressure and its gradient are proposed to evaluate comprehensively the actual sealing condition of the bushing, and a wireless oil pressure module is developed at the bottom valve, which is quite beneficial to field online application. It is promising to extend the online mechanical monitoring and diagnosis to oil-immersed power equipment.
1. Introduction
Transformer bushings are one of the most important components in power transformers, which are used to conduct high current and insulate the high voltage. However, bushing-related defects cause the failure of transformers and even severe consequences such as fires or explosions, irrespective of the application or manufacturing period [1,2,3]. Therefore, it is significant to evaluate the status of bushings and detect incipient defects to improve the reliability for long-term operation [4,5].
According to CIGRE transformer failure statistics, 14.4% of transformer failures are caused by bushings [6]. Moreover, nearly 12% of bushing failures are mechanical failures. It is indirect and overdue to detect the mechanical defects through conventional electric techniques. Due to mechanical failure, the sealing condition of a bushing may be invalid, which leads to the insulation strength decreasing or even changing the internal moisture of the transformer. Therefore, it is necessary to monitor the sealing state of the bushing.
The poor sealing of the transformer bushing, the loose contact and the aging of the rubber ring seal could result in moisture penetration directly into the bushing. In addition, during the installation process, deviations in the position of the conductor bring in uneven force around the rubber ring, and then the rubber is subjected to varying degrees of aging and leads to sealing defects. These failures are difficult to observe at the very beginning, but it is necessary to be detected in time to prevent damping of the bushing and the transformer.
At present, many methods are used to monitor bushing status such as measuring insulator capacitance and dissipation factor (tanδ), which are sensitive to dampness throughout the bushing [7,8]. Moreover, the frequency domain spectroscopy method (FDS) is proposed since it is more sensitive to moisture content than conventional parameters such as capacitance and tanδ. It expands the frequency band of applied voltage from power frequency (50/60 Hz) to 0.001–1000 Hz, which means more information can be obtained to evaluate the bushing insulation from the degree of its wetness [9,10,11,12]. On the other hand, based on the dissolved gas analysis method, it is feasible for dynamic fault prediction in oil-containing equipment such as a bushing [13,14,15]. The physical condition of the bushing could be evaluated by the concentration and combination of different gases.
These methods, based on the parameters such as capacitance, tanδ, gas concentration, etc., are effective to insulation defects in bushings, but unavailable for mechanical failure. Generally, the insulation and mechanical issues are tightly combined and coupled as to bushings, and the insulation failure is always the focus. Thus, L. Zhang et al. [16] put forward a mechanical parameter to detect the pressure variation caused by partial discharge (PD) and the corresponding dissolved gases [17,18,19]. In this way, the mechanical pressure is an effective perspective to obtain access to the status of the bushing. However, it is easy to understand that oil pressure is greatly associated with temperature variation. Thus, it is more appropriate to reflect the mechanical condition of the bushing, since the sealing defects, such as gas and oil leakage, have a significant effect on the normal operation.
Because of the compact structure inside the bushing [6,20], the temperature at different positions is difficult to predict and analyze. During actual operation, the temperature of the bushing is hardly in a temperature-balanced steady state, which imposes great impact to the judgment of mechanical condition on the basis of oil pressure. It remains challenging to obtain insight into mechanical sealing with appropriate parameters as to a multilayer compact bushing. Especially, the criteria to investigate the degree of sealing are unclear in such an unsteady and mutual distribution of temperature in the entire bushing space.
The objective of this study is to evaluate the bushing mechanical status; a transformer bushing model is established in this study, and the relationship between temperature and pressure is deduced theoretically in Section 2. In Section 3, based on the physical 110 kV transformer bushing, three working conditions of intact seal, gas leakage and oil leakage are tested, and the pressure and temperature are measured. In Section 4, the data of pressure and temperature under three working conditions are analyzed and compared with the derivation results. In Section 5, a primary and auxiliary criterion is proposed to evaluate the transformer bushing sealing on-line. Finally, the main conclusions are drawn in Section 6. The sealing criterion of a bushing is proposed in this paper to monitor the sealing status of bushings, so as to provide a reference for further warning.
2. Analysis of Pressure and Temperature in a Bushing
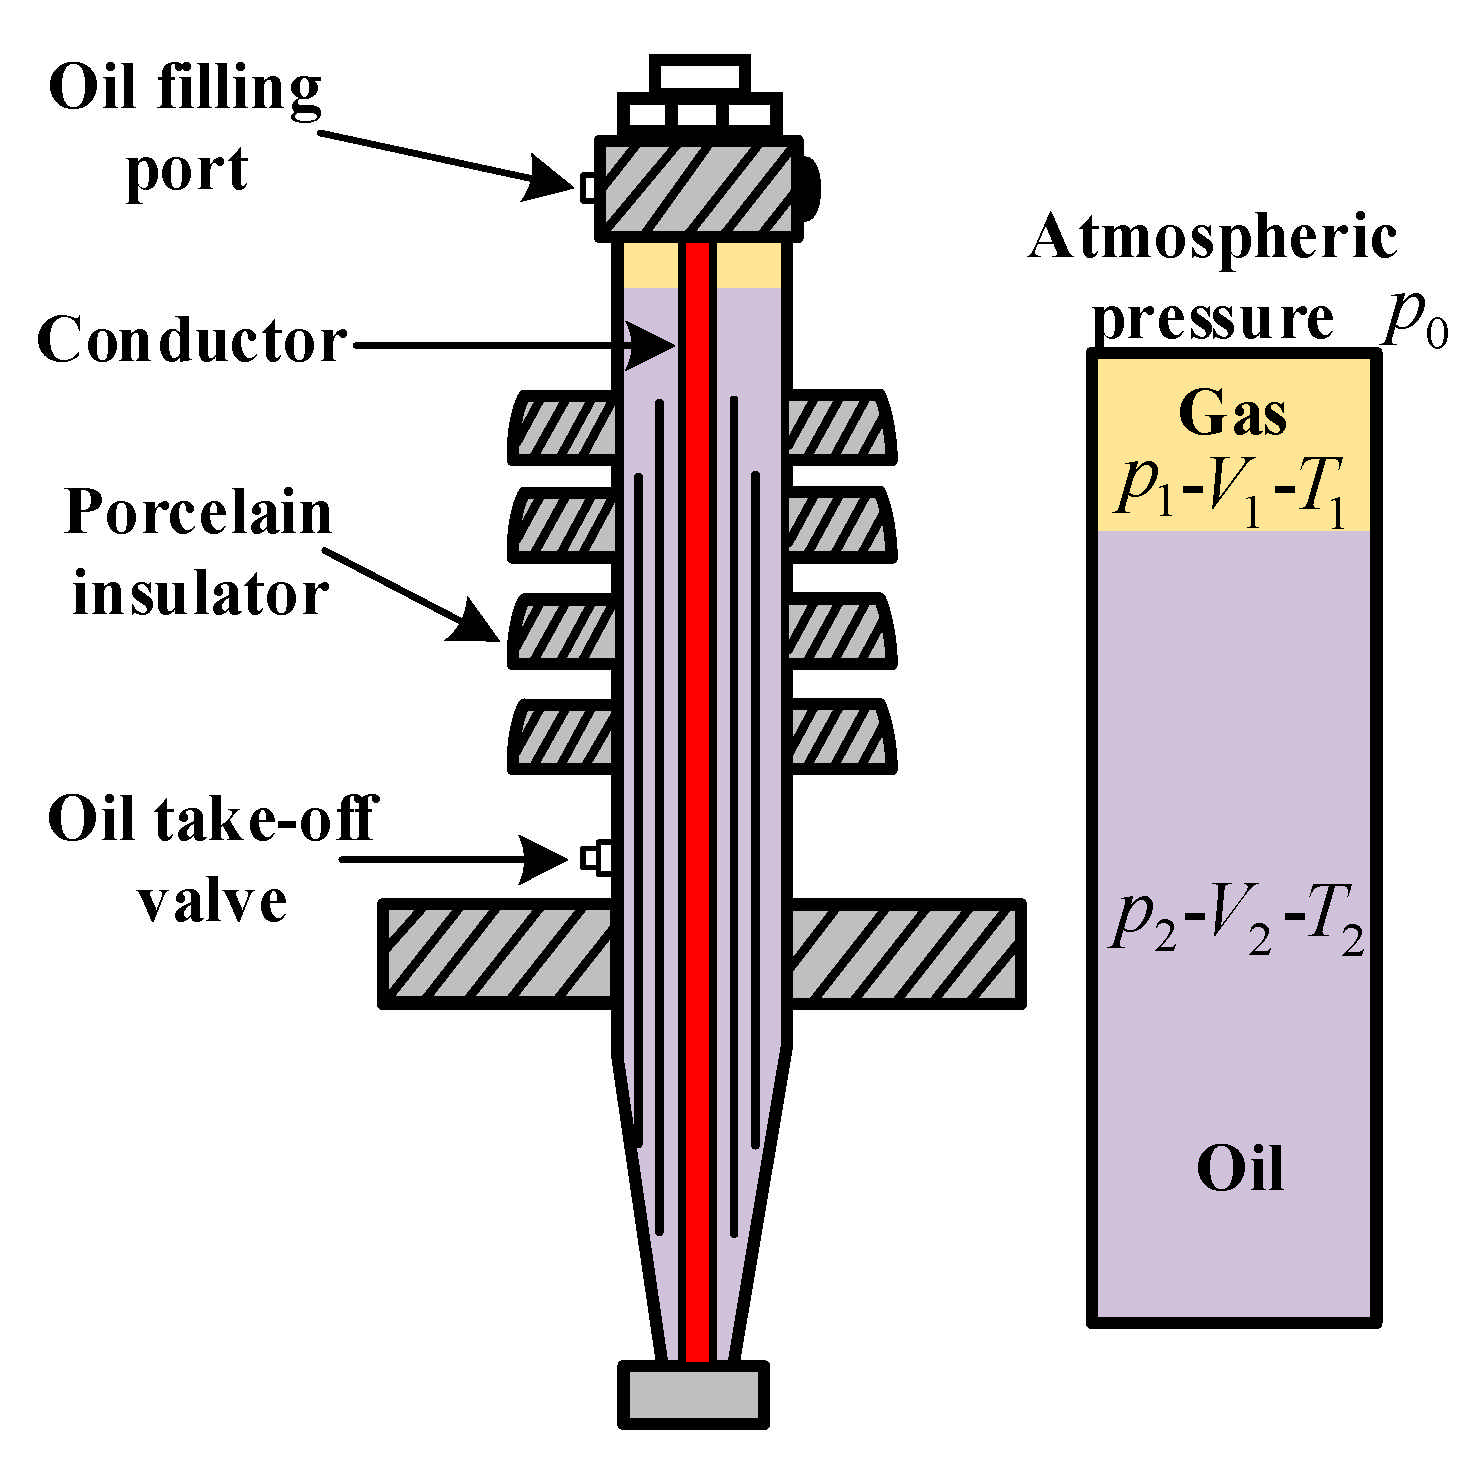
The temperature of a bushing can be higher than 80 °C [21]; it is necessary to keep the amount of gas on the top to prevent the oil from overflowing due to thermal expansion of the oil. Therefore, the pressure at different temperatures is theoretically calculated initially to analyze the change of pressure in the bushing versus variable temperature. The physical model of the oil–gas system is established as shown in Figure 1, in which the bushing is well sealed. V10 and V20 are the initial gas volume and oil volume, T10 and T20 are the initial gas and oil temperature, and p10 and p20 are initial gas and oil pressure. V is the total volume, which remains constant throughout the process.
The volume of oil inside the 110 kV bushing is 11 L, approximately, and the volume of the gas cavity is about 2 L. According to the isobaric expansion equation:
where β is the expansion coefficient; the value of the oil is 0.0008 [22]. V is the volume before oil expansion and T is the temperature. Then the volume change of the oil can be calculated based on temperature. In fact, the gas has a reaction force on the oil while the volume of the gas decreases due to the expanding oil. It can be actually assumed that oil is affected by the gas compression since the molecular gap of the liquid is much smaller than that of the gas. According to the ideal gas law, the measured pressure at the oil valve Pm can be calculated as the sum of gas pressure and oil pressure minus atmospheric pressure P0:
where n is the amount of the substance, R is the ideal gas constant and n is obtained from the initial state. During the operation of the bushing, the volume of gas cannot be calculated. By combining Equations (1) and (2), the measured pressure is obtained as a function of temperature on the premise that the bushing is well sealed:
The actual data are substituted into Equation (3); the results are shown in Table 1.
Since the inside of the bushing contains oil and gas, the pressure changes caused by the sealing failure of different positions, which causes gas leakage or oil leakage with different effects. Once the failure position is above the oil level, it brings in gas leakage; the gas leakage rate and amount are influenced by the pressure difference between the inside and outside. It is difficult to perform quantitative analysis on gas leakage in the field due to the challenge of measuring the pressure difference. In the case of oil leakage, the liquid leakage rate is relatively slow; it is reasonable to assume that it is at a constant speed during the entire oil leakage process. If a is set as the oil leakage flowing rate (m3/s) and the oil leakage duration is t, then the measured pressure is the sum of gas pressure P1 and oil pressure P2:
where ρ, g and S are oil density, acceleration of gravity and cross-sectional area inside the bushing, respectively. The diameter of the conductor inside the bushing is 0.034 m, and the inner diameter of the porcelain envelope is 0.16 m, so the calculated cross-sectional area is about 0.019 m3. The density of insulating oil is 895 kg/m3, and g = 9.8 N/kg.
In short, the pressures at different temperatures can be theoretically calculated after determining the initial parameters. Then the comparisons and verifications through experiments and theoretical analysis can be carried out.
3. Test Platform and Settings
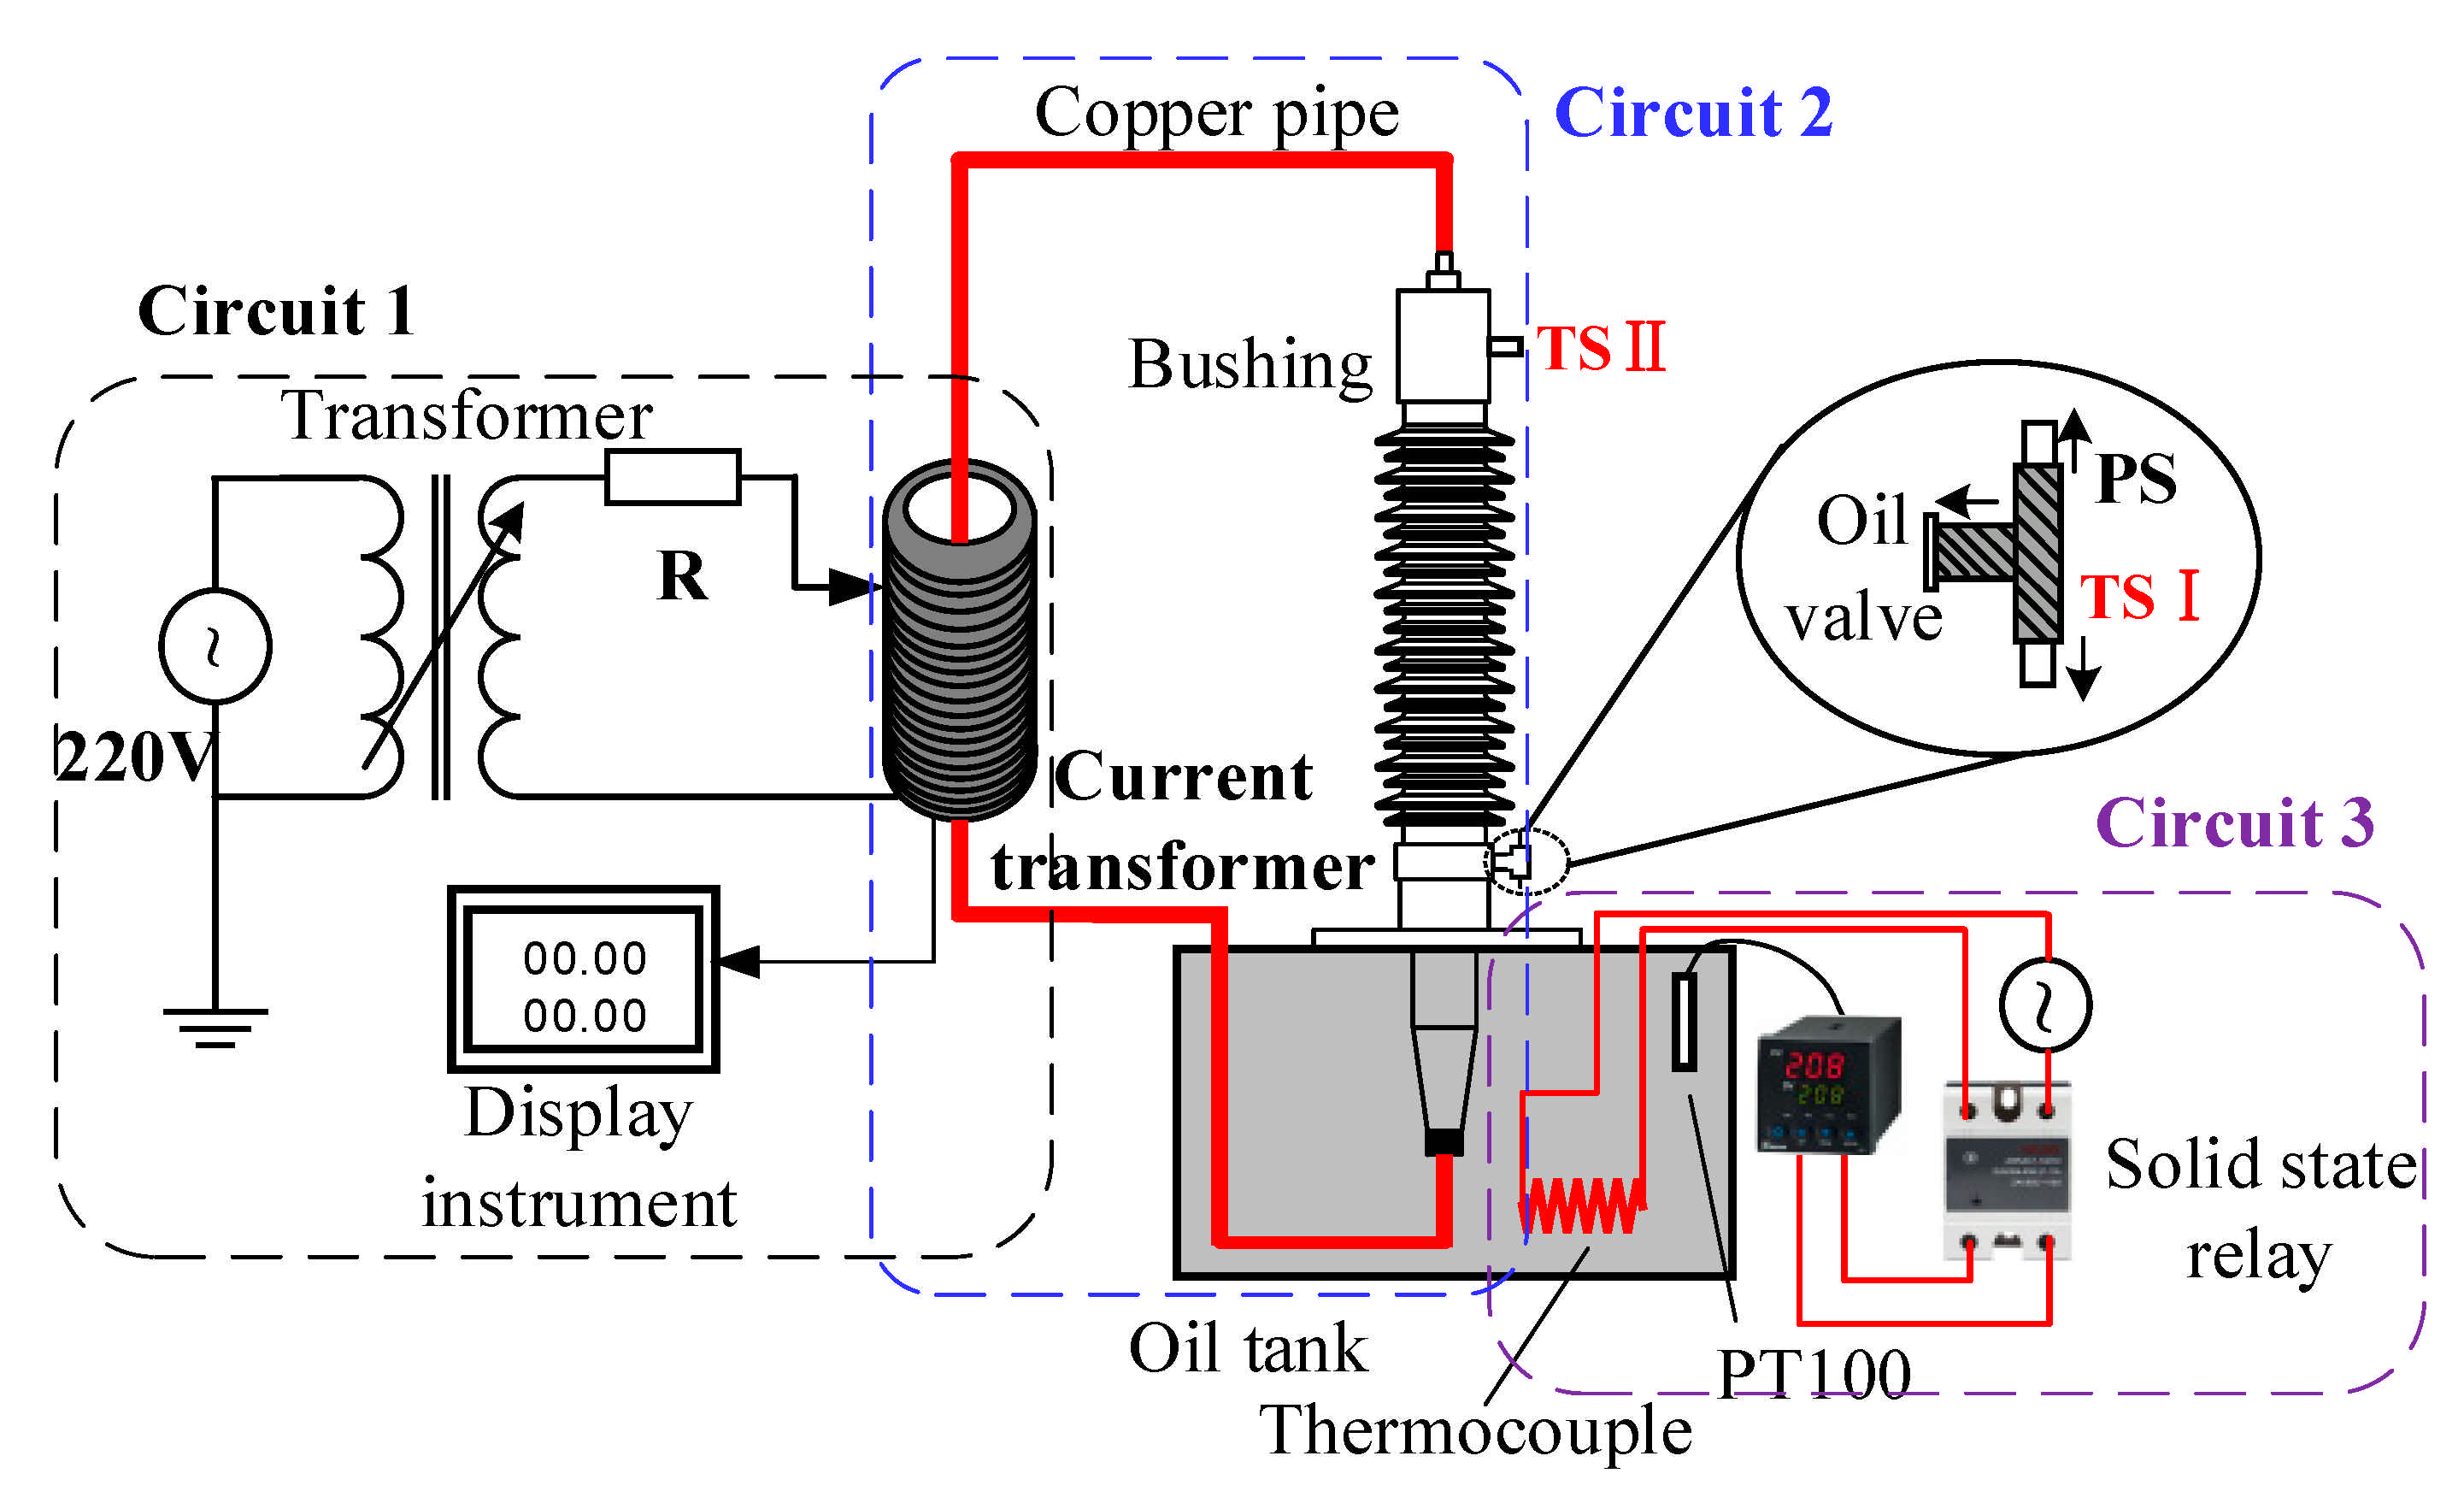
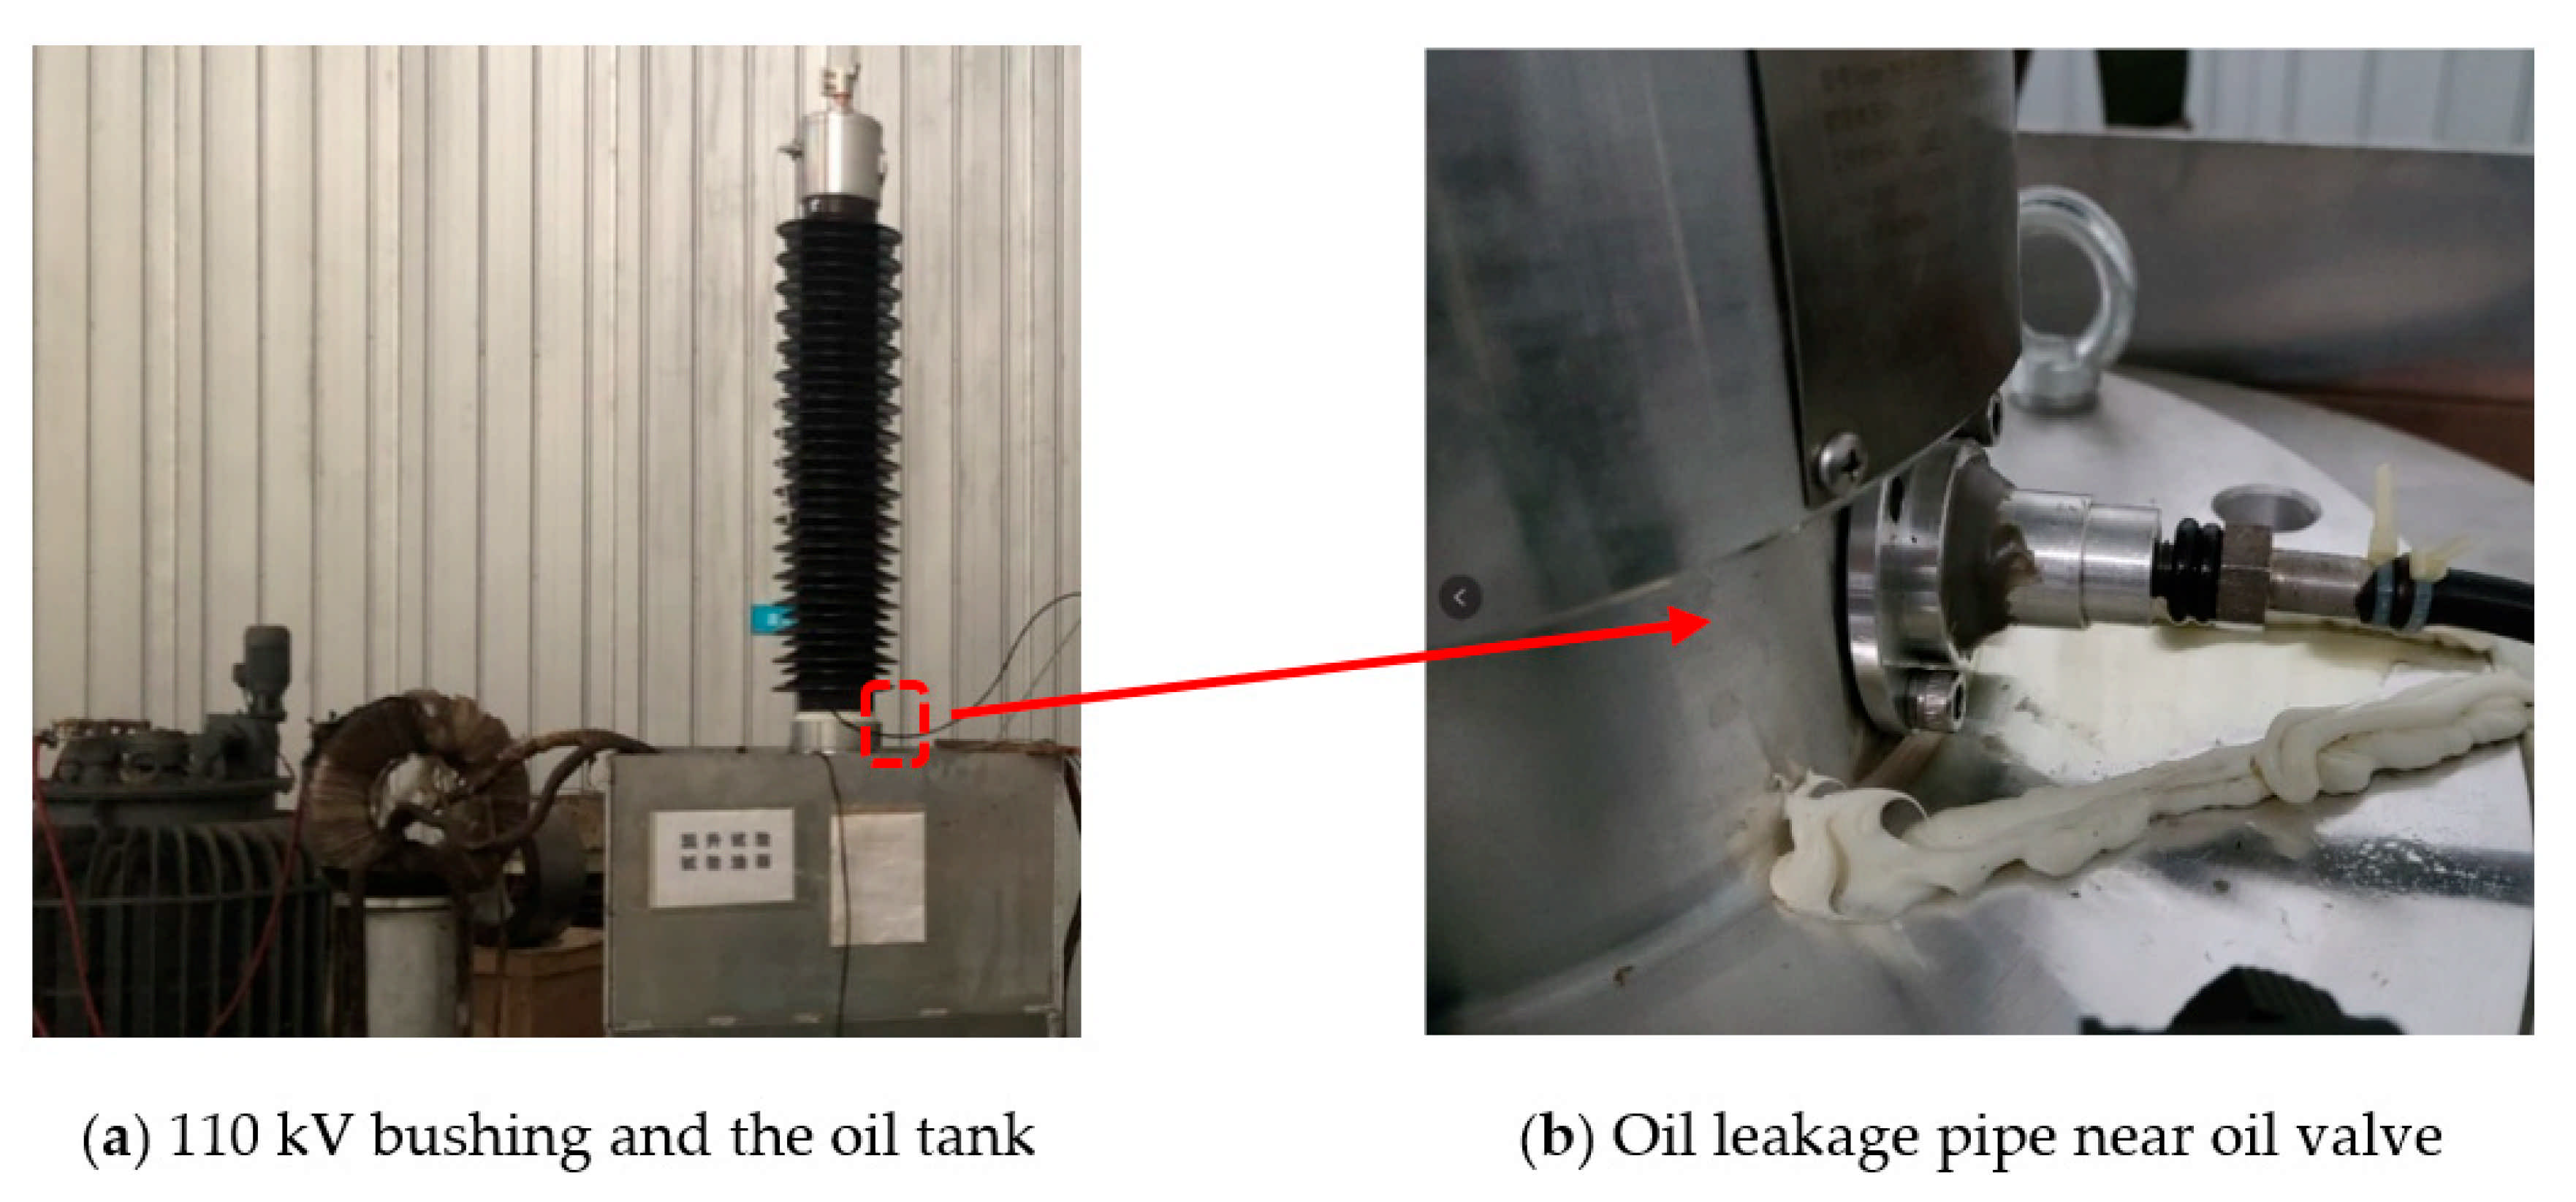
In order to verify the theoretical analysis, a 110 kV oil impregnated paper insulation (OIP) bushing (BRDW-126/630-4) was tested in the lab. The bushing and oil tank were heated by applying a rating current of 630 A; the corresponding temperature and pressure data were recorded simultaneously. The experimental setup is shown in Figure 2 and Figure 3.
There were three circuits in the test: (1) The main energy supply circuit connecting the transformer and the current transformer. (2) The heating circuit of the current transformer output bushing. The conductor inside the bushing was connected by a thick copper tube. (3) The heating circuit in the oil tank. The thermocouple and solid-state relay (CDG1-1DA/100A) and PID (proportion integral differential) controller were directly connected to 220 V. The oil in the tank was heated to simulate the actual temperature in the transformer body.
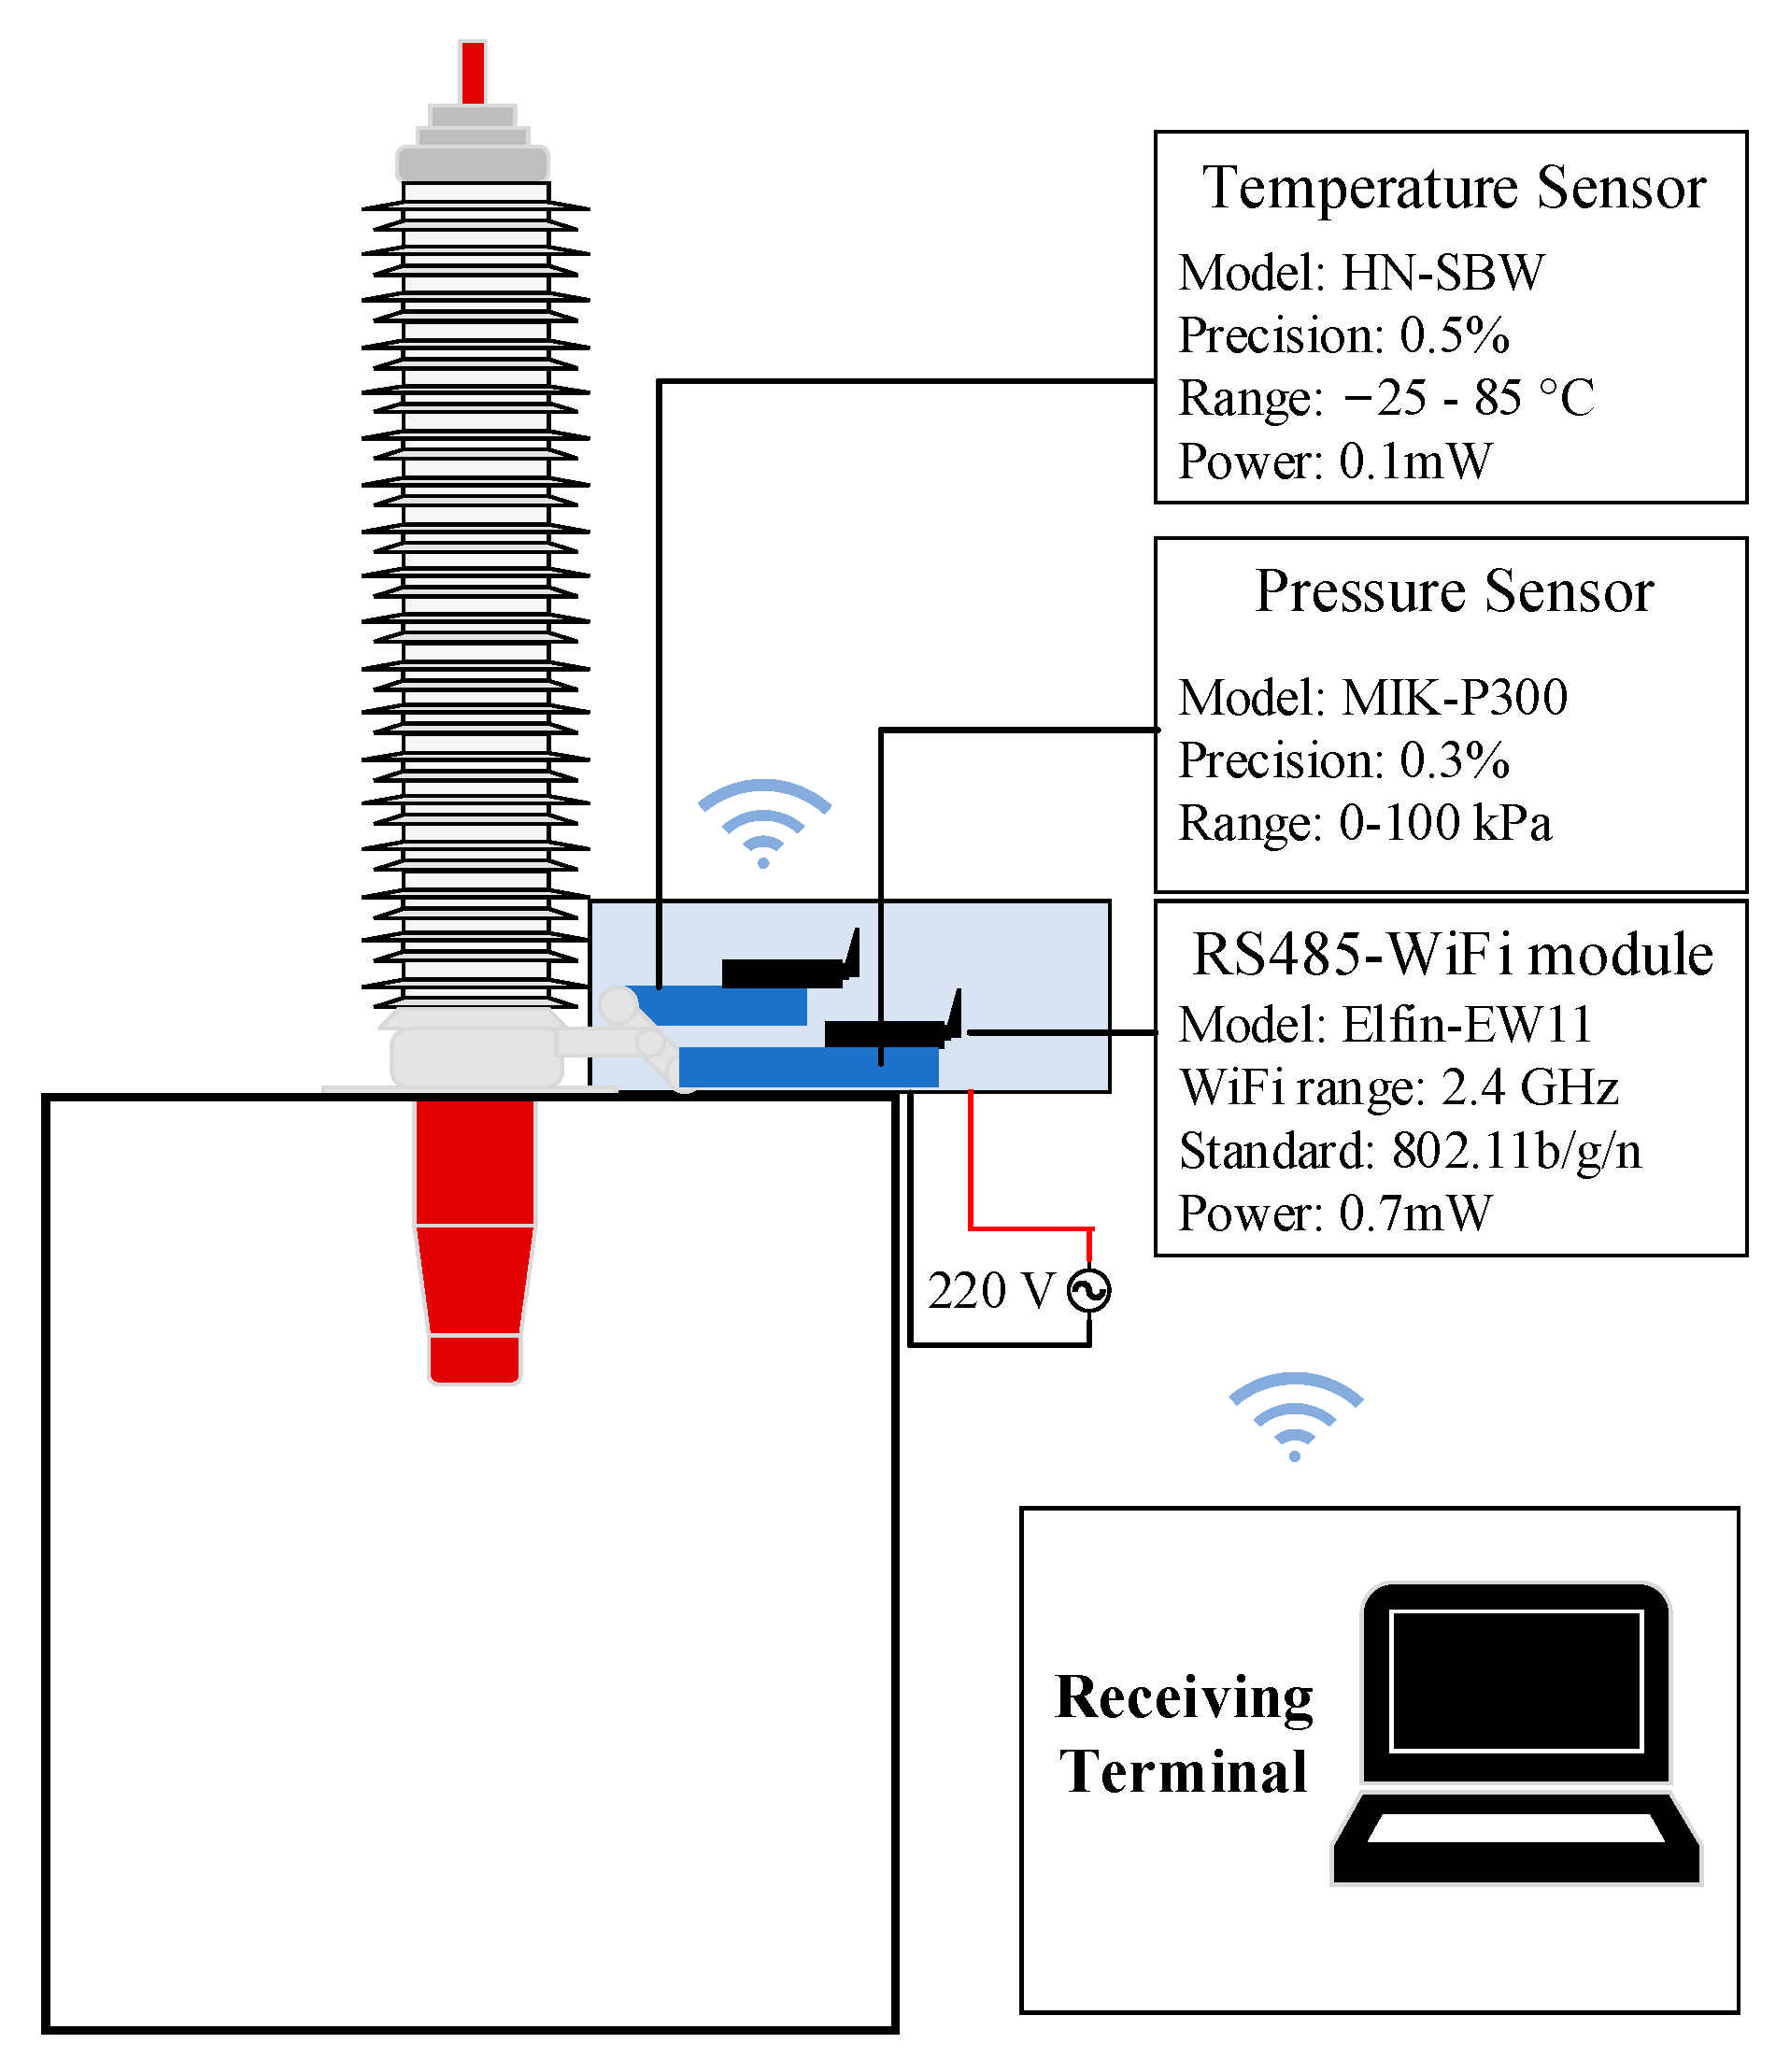
The temperature sensor I (TS I) and the pressure sensor (PS) were both installed at the oil valve through a three-way joint. The sensors were powered by an external DC power source, and the output signal was received by a computer. The temperature sensor II (TS II) was installed on the oil filling port, which lies on top of the bushing. Since the top area of the bushing was connected to high voltage, it was difficult to measure the temperature of the gas. To realize monitoring in the field, the temperature and pressure sensors at the oil valve were packaged as a device. The device included three modules: data acquisition, transmission and processing. The physical structure included sensors, signal transmission and terminals. The overall structure is shown in Figure 4. Considering the practical application of engineering, the pressure sensor with an accuracy of 0.3% and a range of 0–100 kPa was selected. The temperature range of the sensor was from −25 to 85 °C. After installing the sensors, the bushing stood still for 24 h to obtain stable initial data.
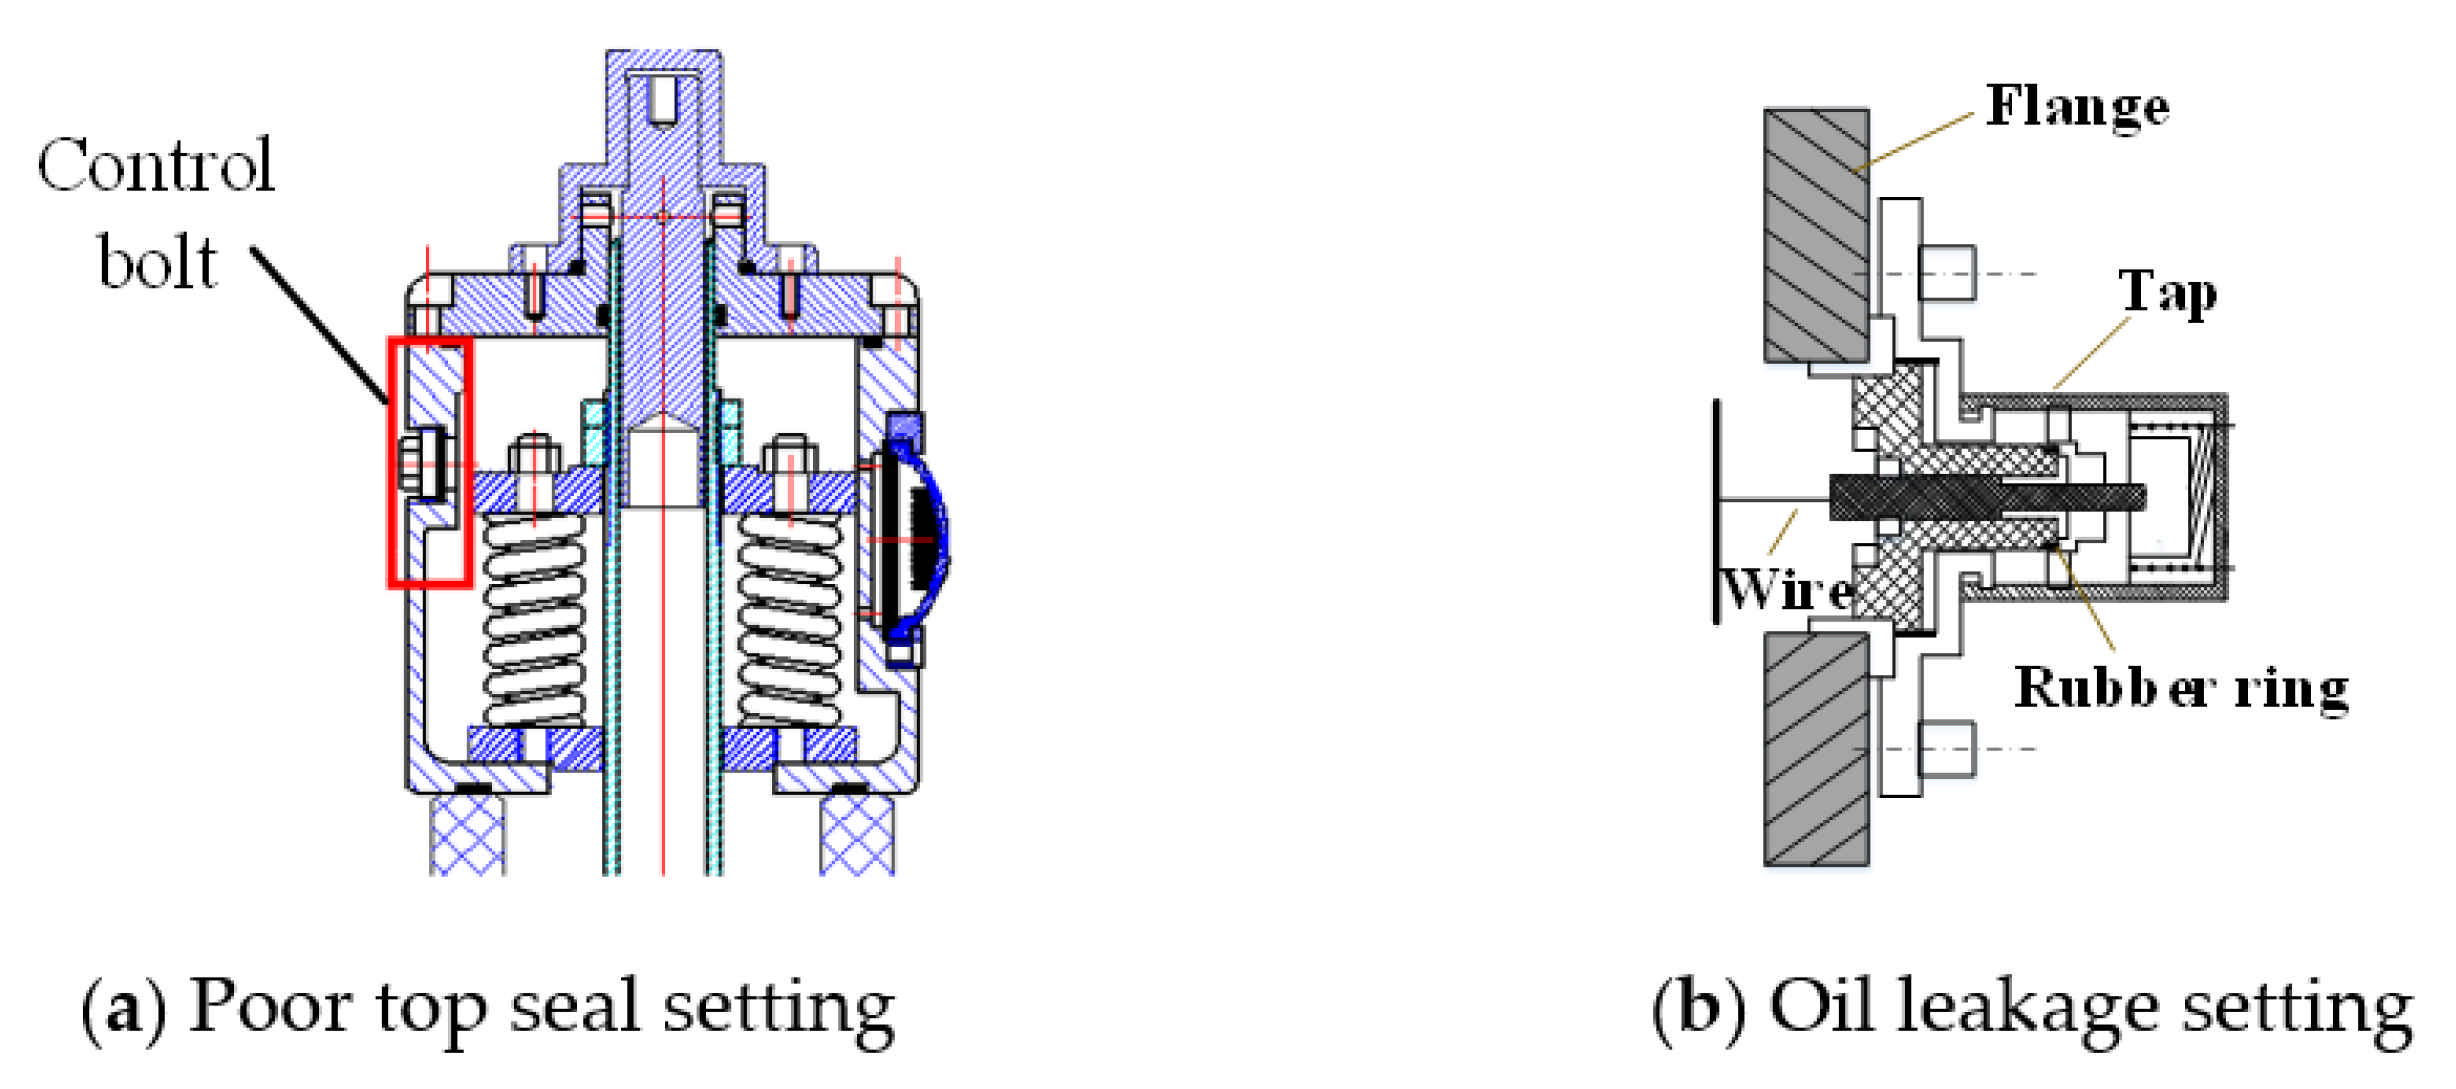
The test was conducted on the bushing with three sealing states: (a) completely sealed, (b) poor sealing at the top and (c) oil leakage. The poor sealing was set to take out the rubber ring at the oil filling port, and the seal relies on the rigid seal between the threads. The oil leakage setting was to loosen the sealing rubber ring of the tap, and the internal insulating oil leaks slowly. The fault setting and control are illustrated in Figure 5.
The temperature increased from room temperature to a stable value under three kinds of sealing conditions. Each condition was maintained for more than 10 h. The temperature and pressure data were collected synchronously at the measurement rate of one point per second. After the temperature increased, circuits (1), (2) and (3) were activated; the oil tank and bushing temperature then naturally cooled to room temperature.
At the beginning of the test, the completely sealed bushing was placed above the oil tank and the part below the flange was immersed in the oil tank. Circuits (2) and (3) were connected to the heating circuit simultaneously. The bushing was supplied with rated current of 630 A, and the oil tank temperature was controlled at 90 °C (according to IEEE standards, the temperature at the top of the transformer generally does not exceed the ambient temperature +60 K) [23]. During the test, a temperature and a barometer were set in the room to consider the environmental influence, and the sampling interval was 15 min. The test steps were as follows:
(1) Initially, a well-sealed bushing was used to conduct the rising temperature test. After the temperature of the oil tank stabilized, the temperature and pressure data were acquired simultaneously.
The temperature of the bushing was maintained for 18 h while the temperature stabilized. Then, multiple blowers were used to accelerate the cooling of the bushing. The pressure and temperature measurement were also maintained during the cooling process. Therefore, the corresponding relationships among the internal gas cavity temperature, oil temperature and oil pressure at steady state were obtained.
(2) When the bushing was cooled stably, the rubber ring of the screw at the gas cavity seal was removed. Keeping other conditions unchanged, it was then heated to a stable temperature. The temperature was then kept constant for 10 h, and the data for each sensor was acquired. The steps were then the same as (1).
(3) After step (2), the gas cavity seal was set completely, and then the heating operations were same as for step (1). While the bushing was heated to a stable temperature, the rubber ring of the tap was loosened slightly. At that time, due to the internal pressure being higher than the outside pressure, oil leaked until the internal and external pressure were equalized in a new steady state. When the data of the three sensors were stable, the dynamic pressure process when the oil leaked from the bushing was obtained. Subsequent comparisons were analyzed based on the actual leaked oil volume and the measured pressure value to verify the theoretical calculation.
4. Results and Discussion
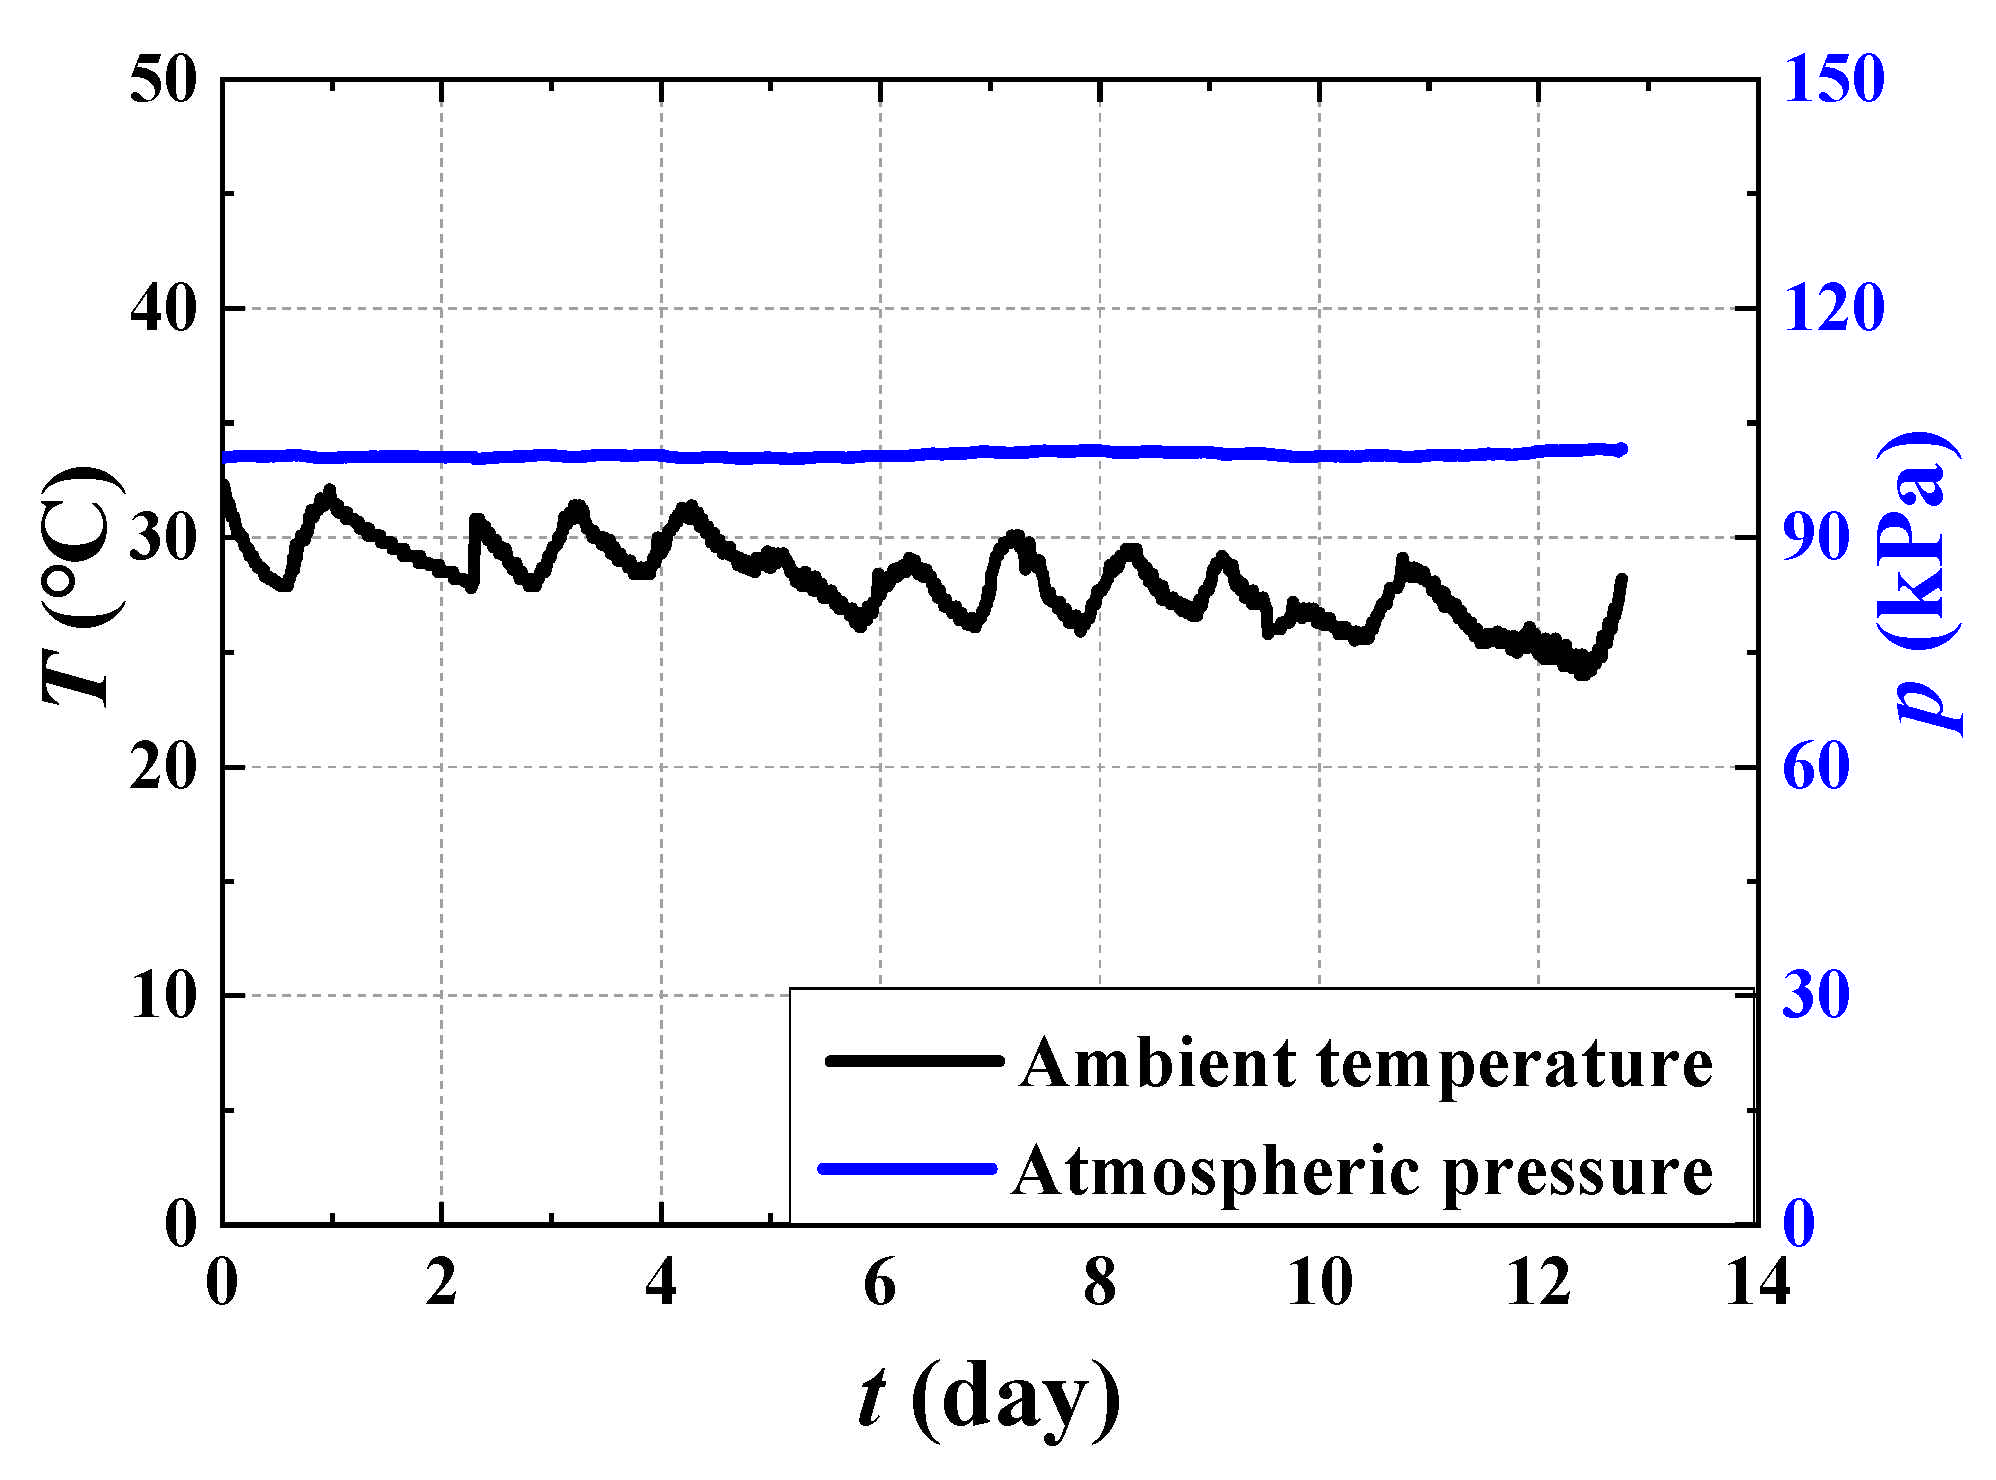
First, the change of ambient temperature and atmospheric pressure during the entire test process is considered. As shown in Figure 6, the atmospheric pressure is basically stable overall, at about 101 kPa. The temperature shows a slight downward trend in fluctuations of about ±3 °C.
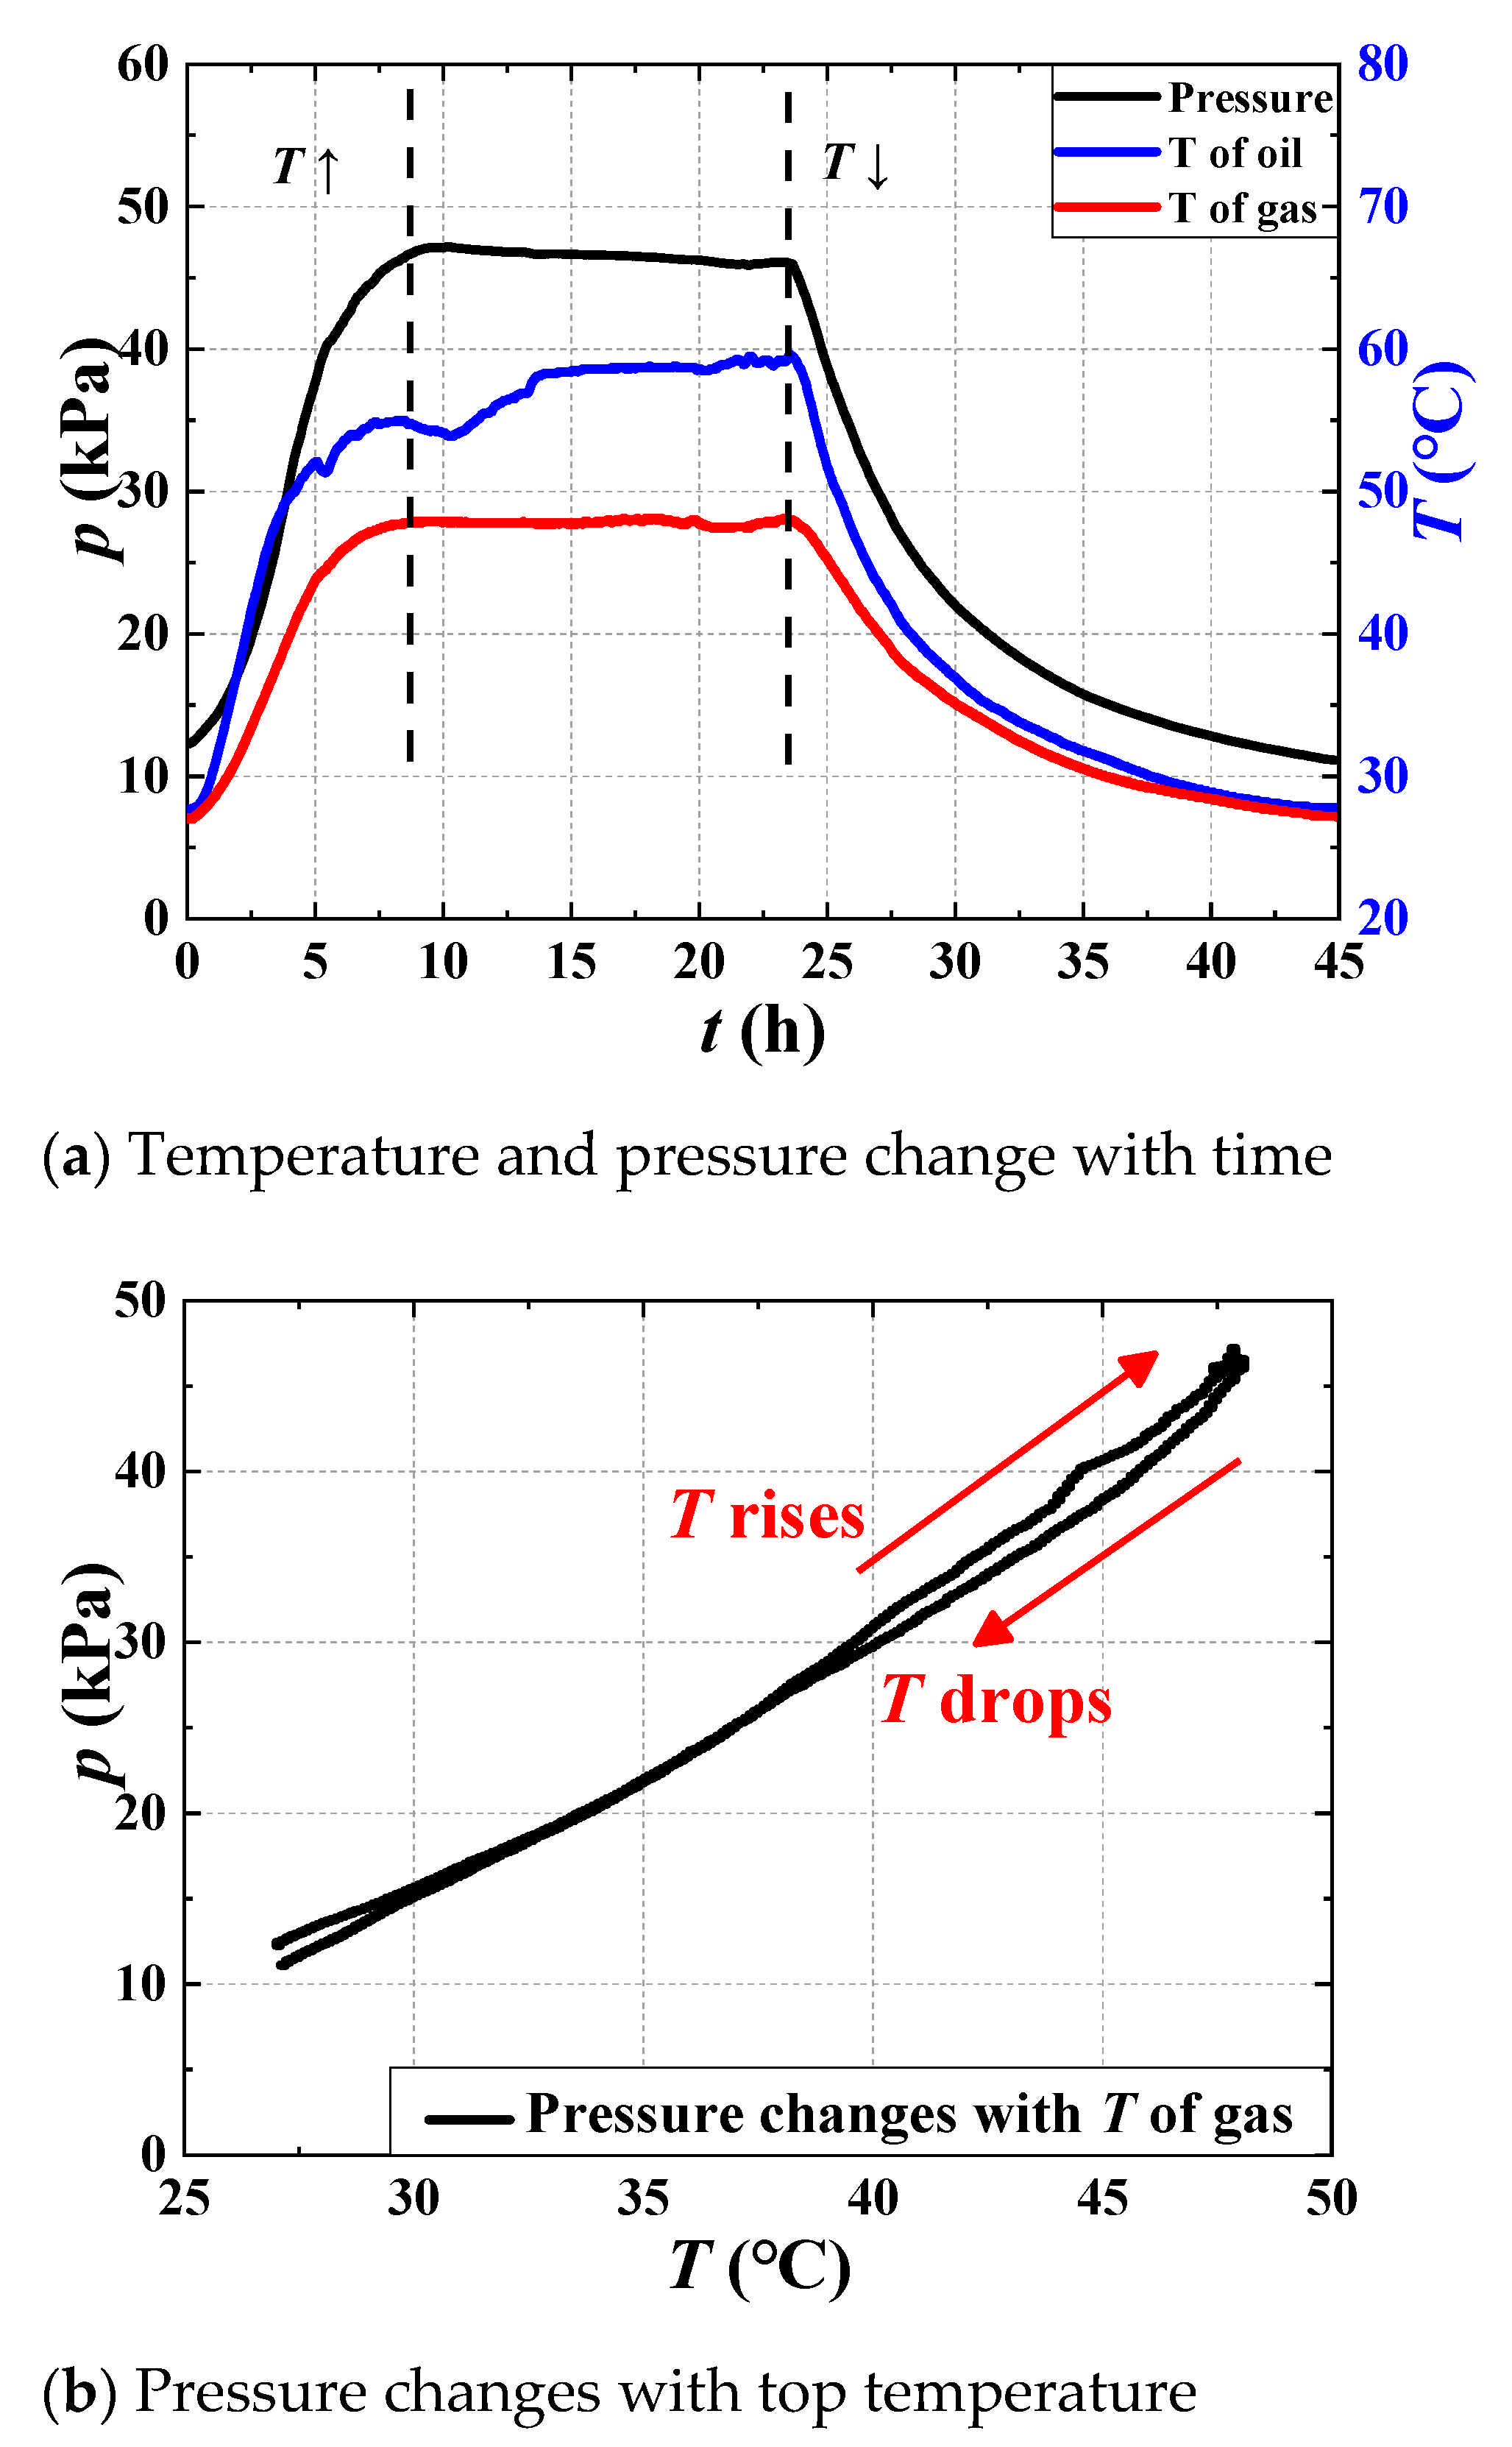
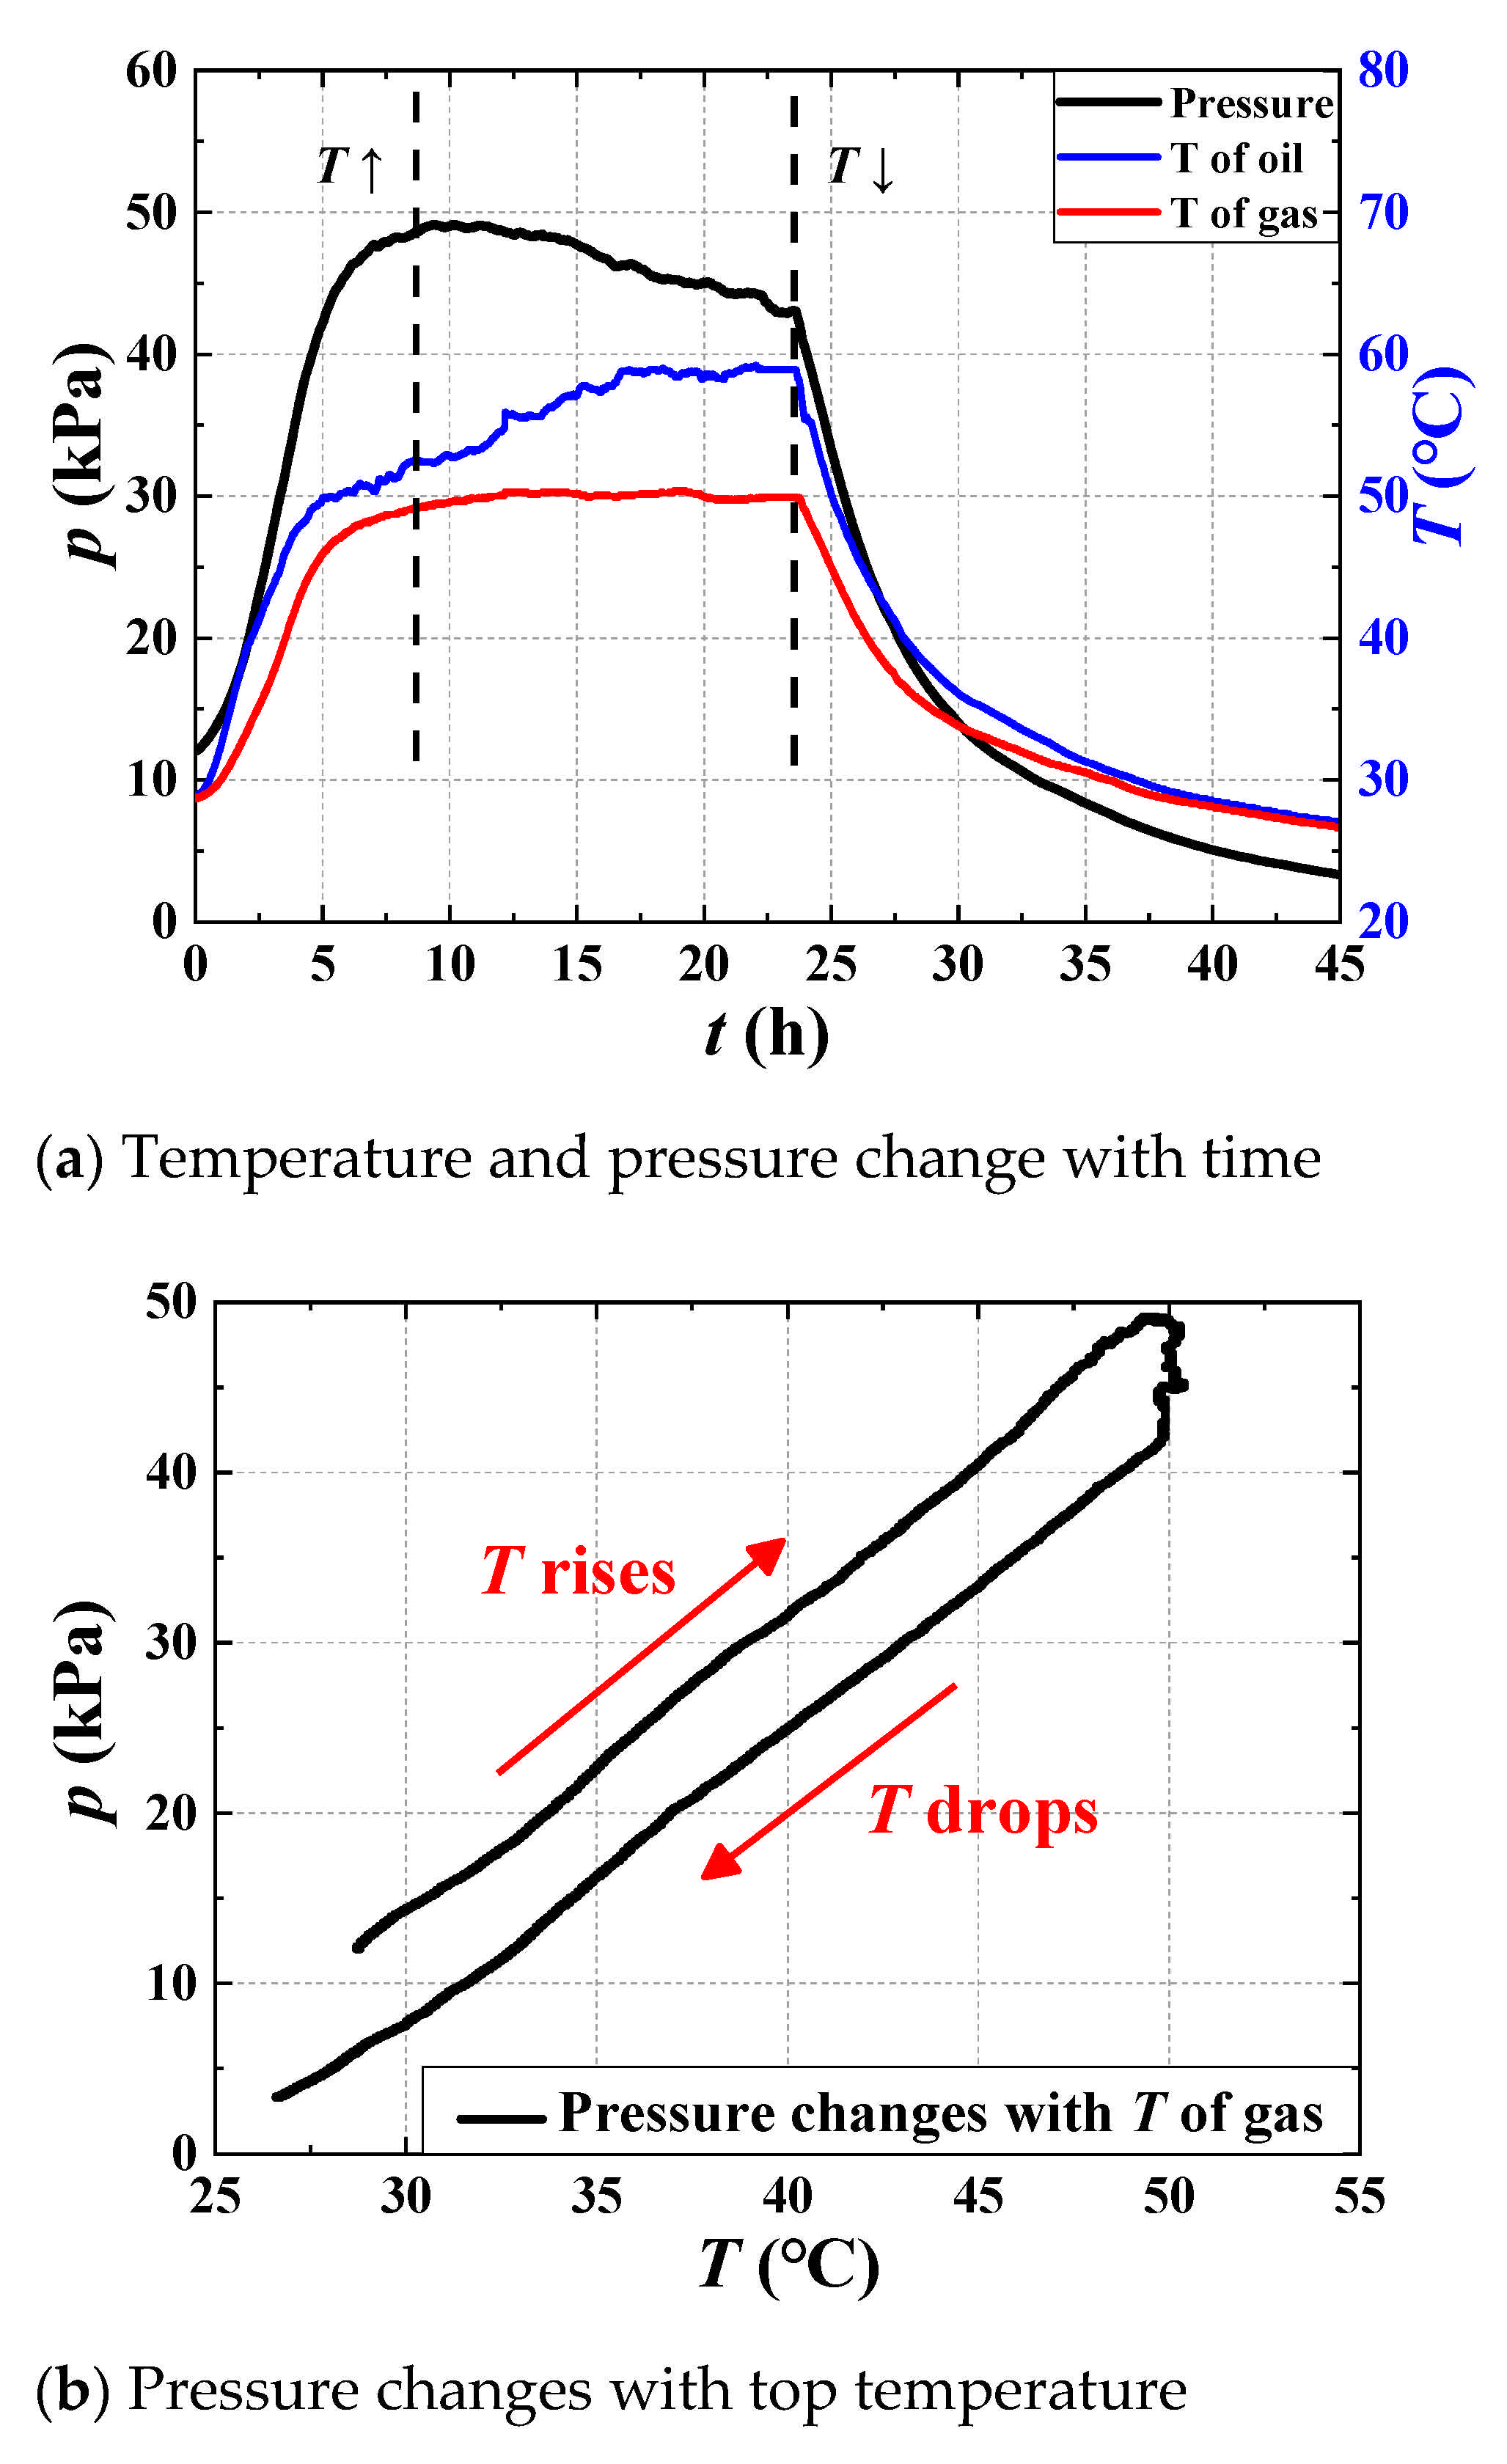
The test results when the seal is intact are shown in Figure 7a. The pressure and temperature are stable in about 7 h, and the fluctuation is small. After about 14 h of heating, the stable oil temperature tends to 60 °C, which is nearly 10 °C different from the top temperature. After the heating time reaches about 24 h, the bushing is cooled until the temperature reaches room temperature and stabilizes.
The top temperature and the measured pressure change curve are shown in Figure 7b; the rising and falling curves are approximately the same. It is obvious that the actual temperature and the pressure are directly related, which is consistent with theoretical analysis. In fact, the value of oil pressure is constant because it expands under heat while the density is correspondingly reduced; thus, the total pressure remains constant. It illustrates that only the relationship among gas volume, temperature and pressure needs to be considered.
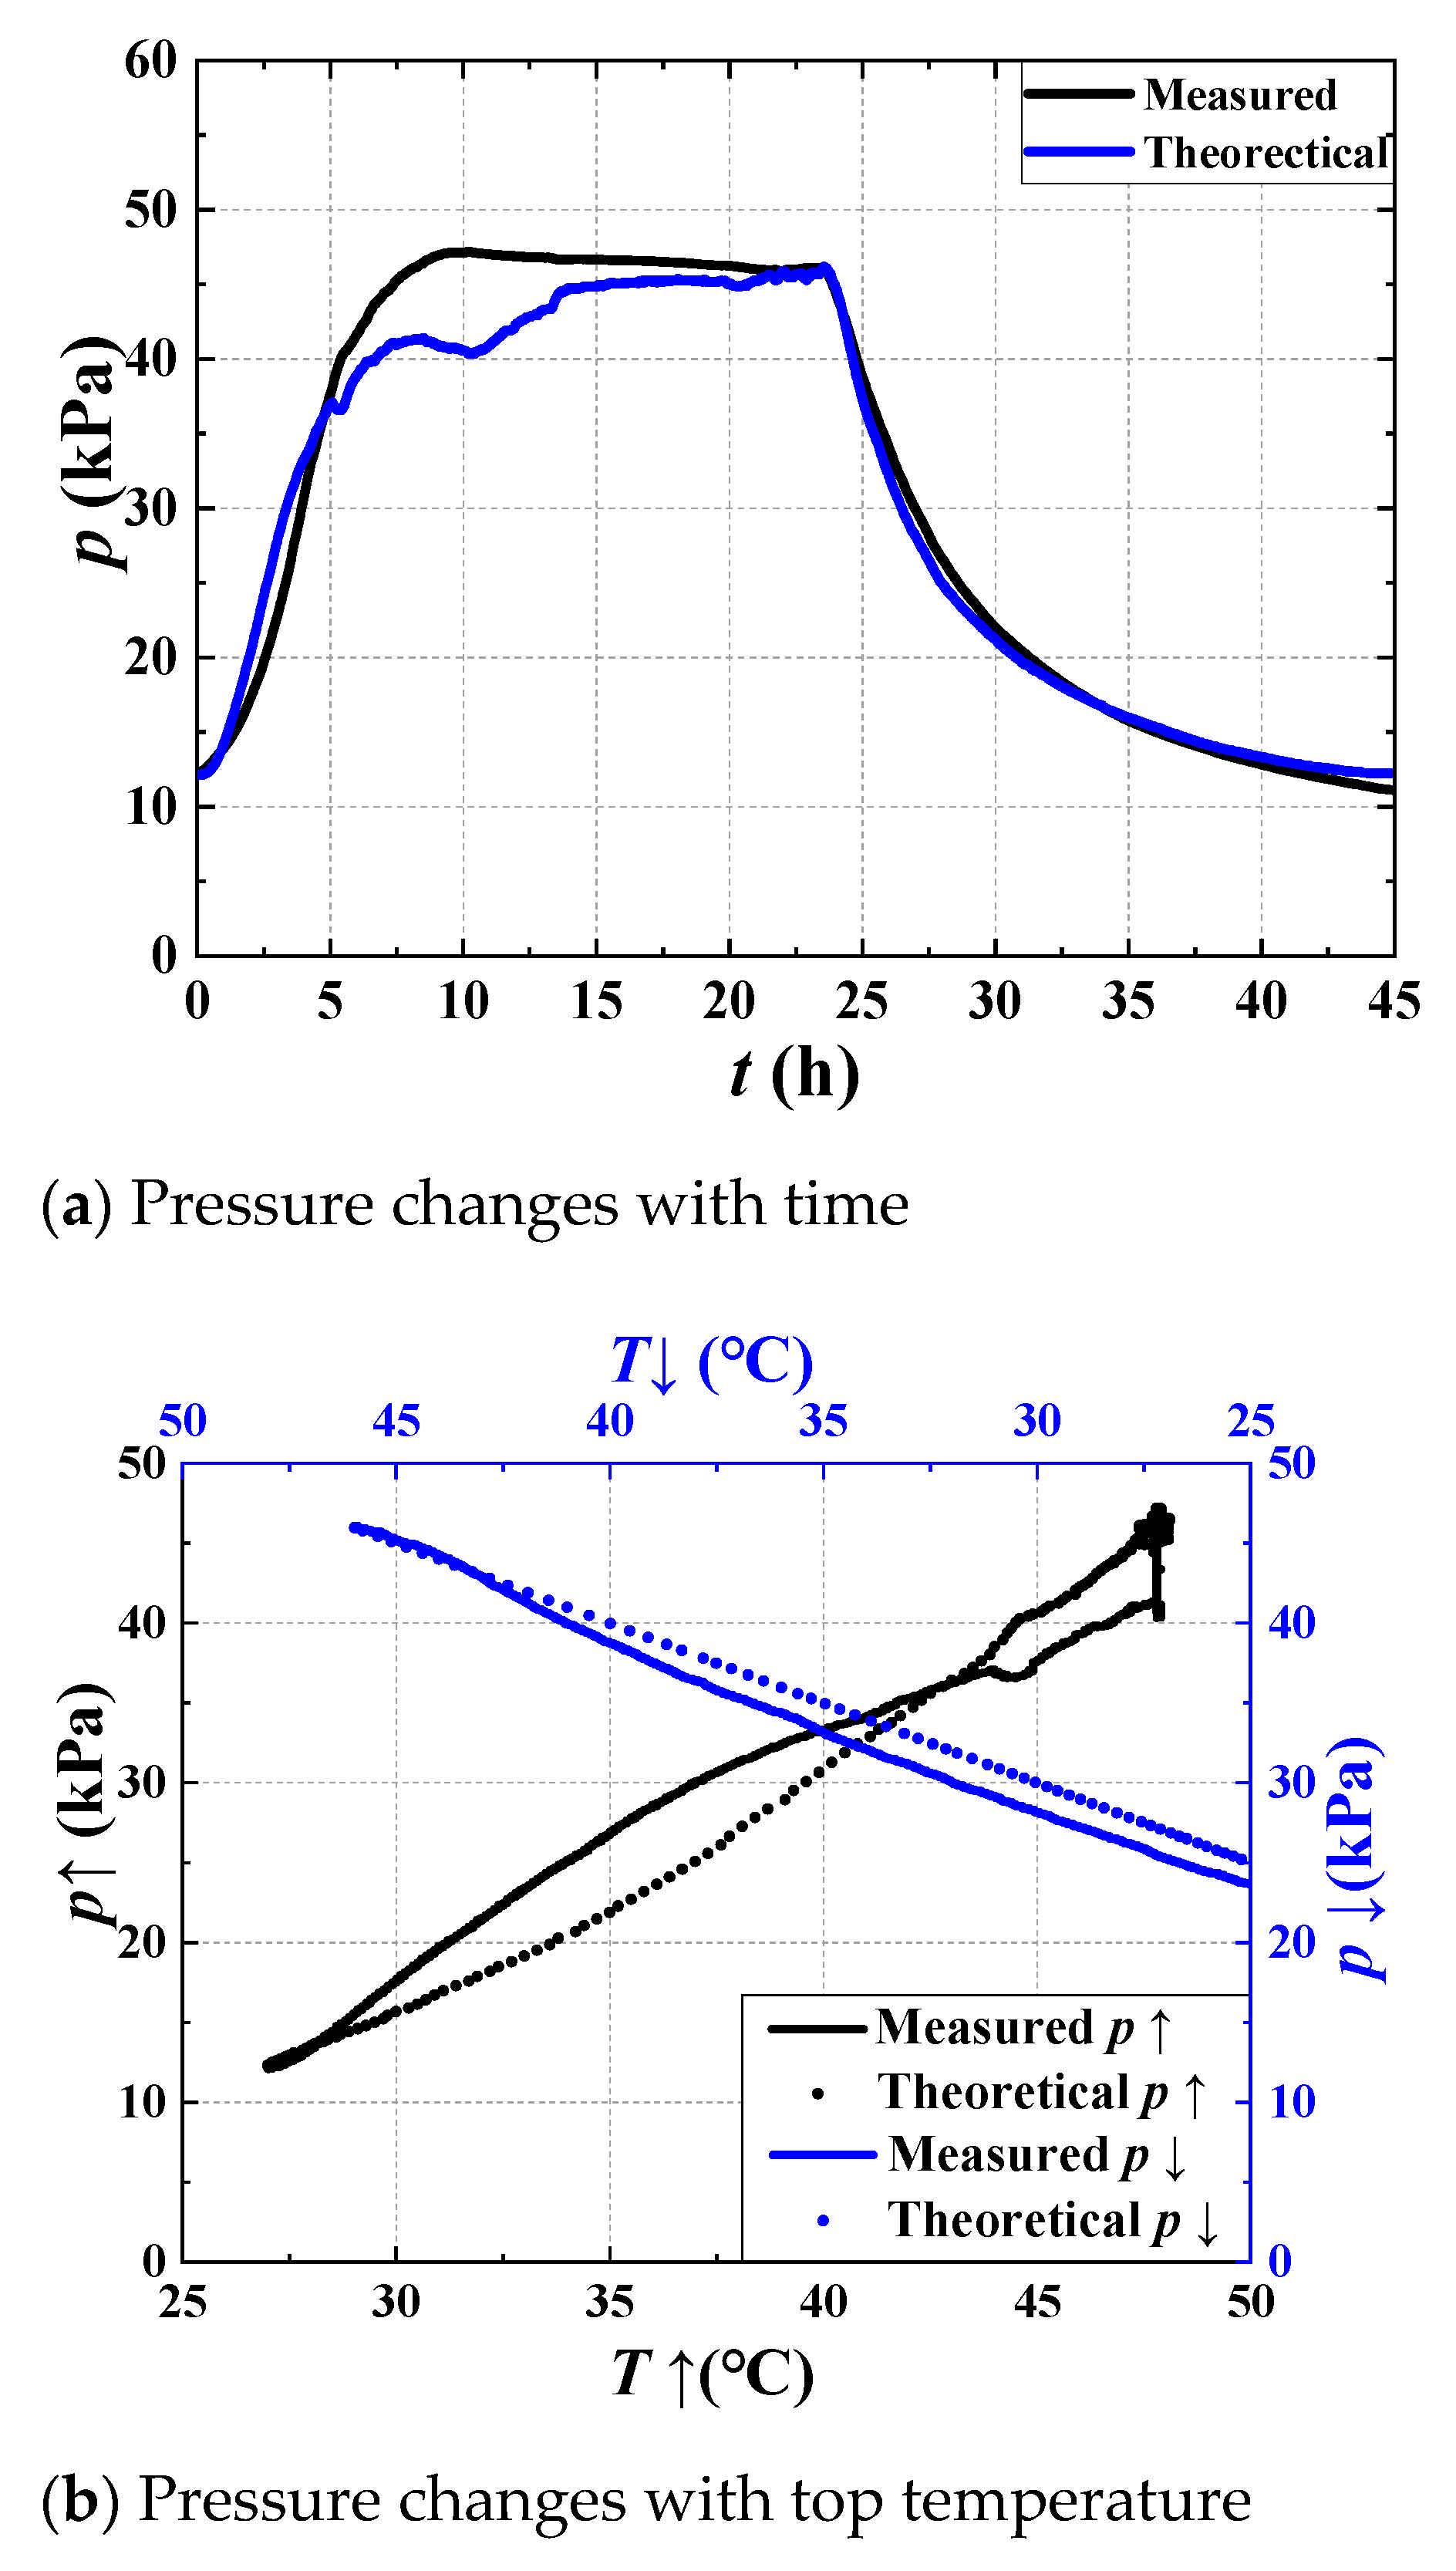
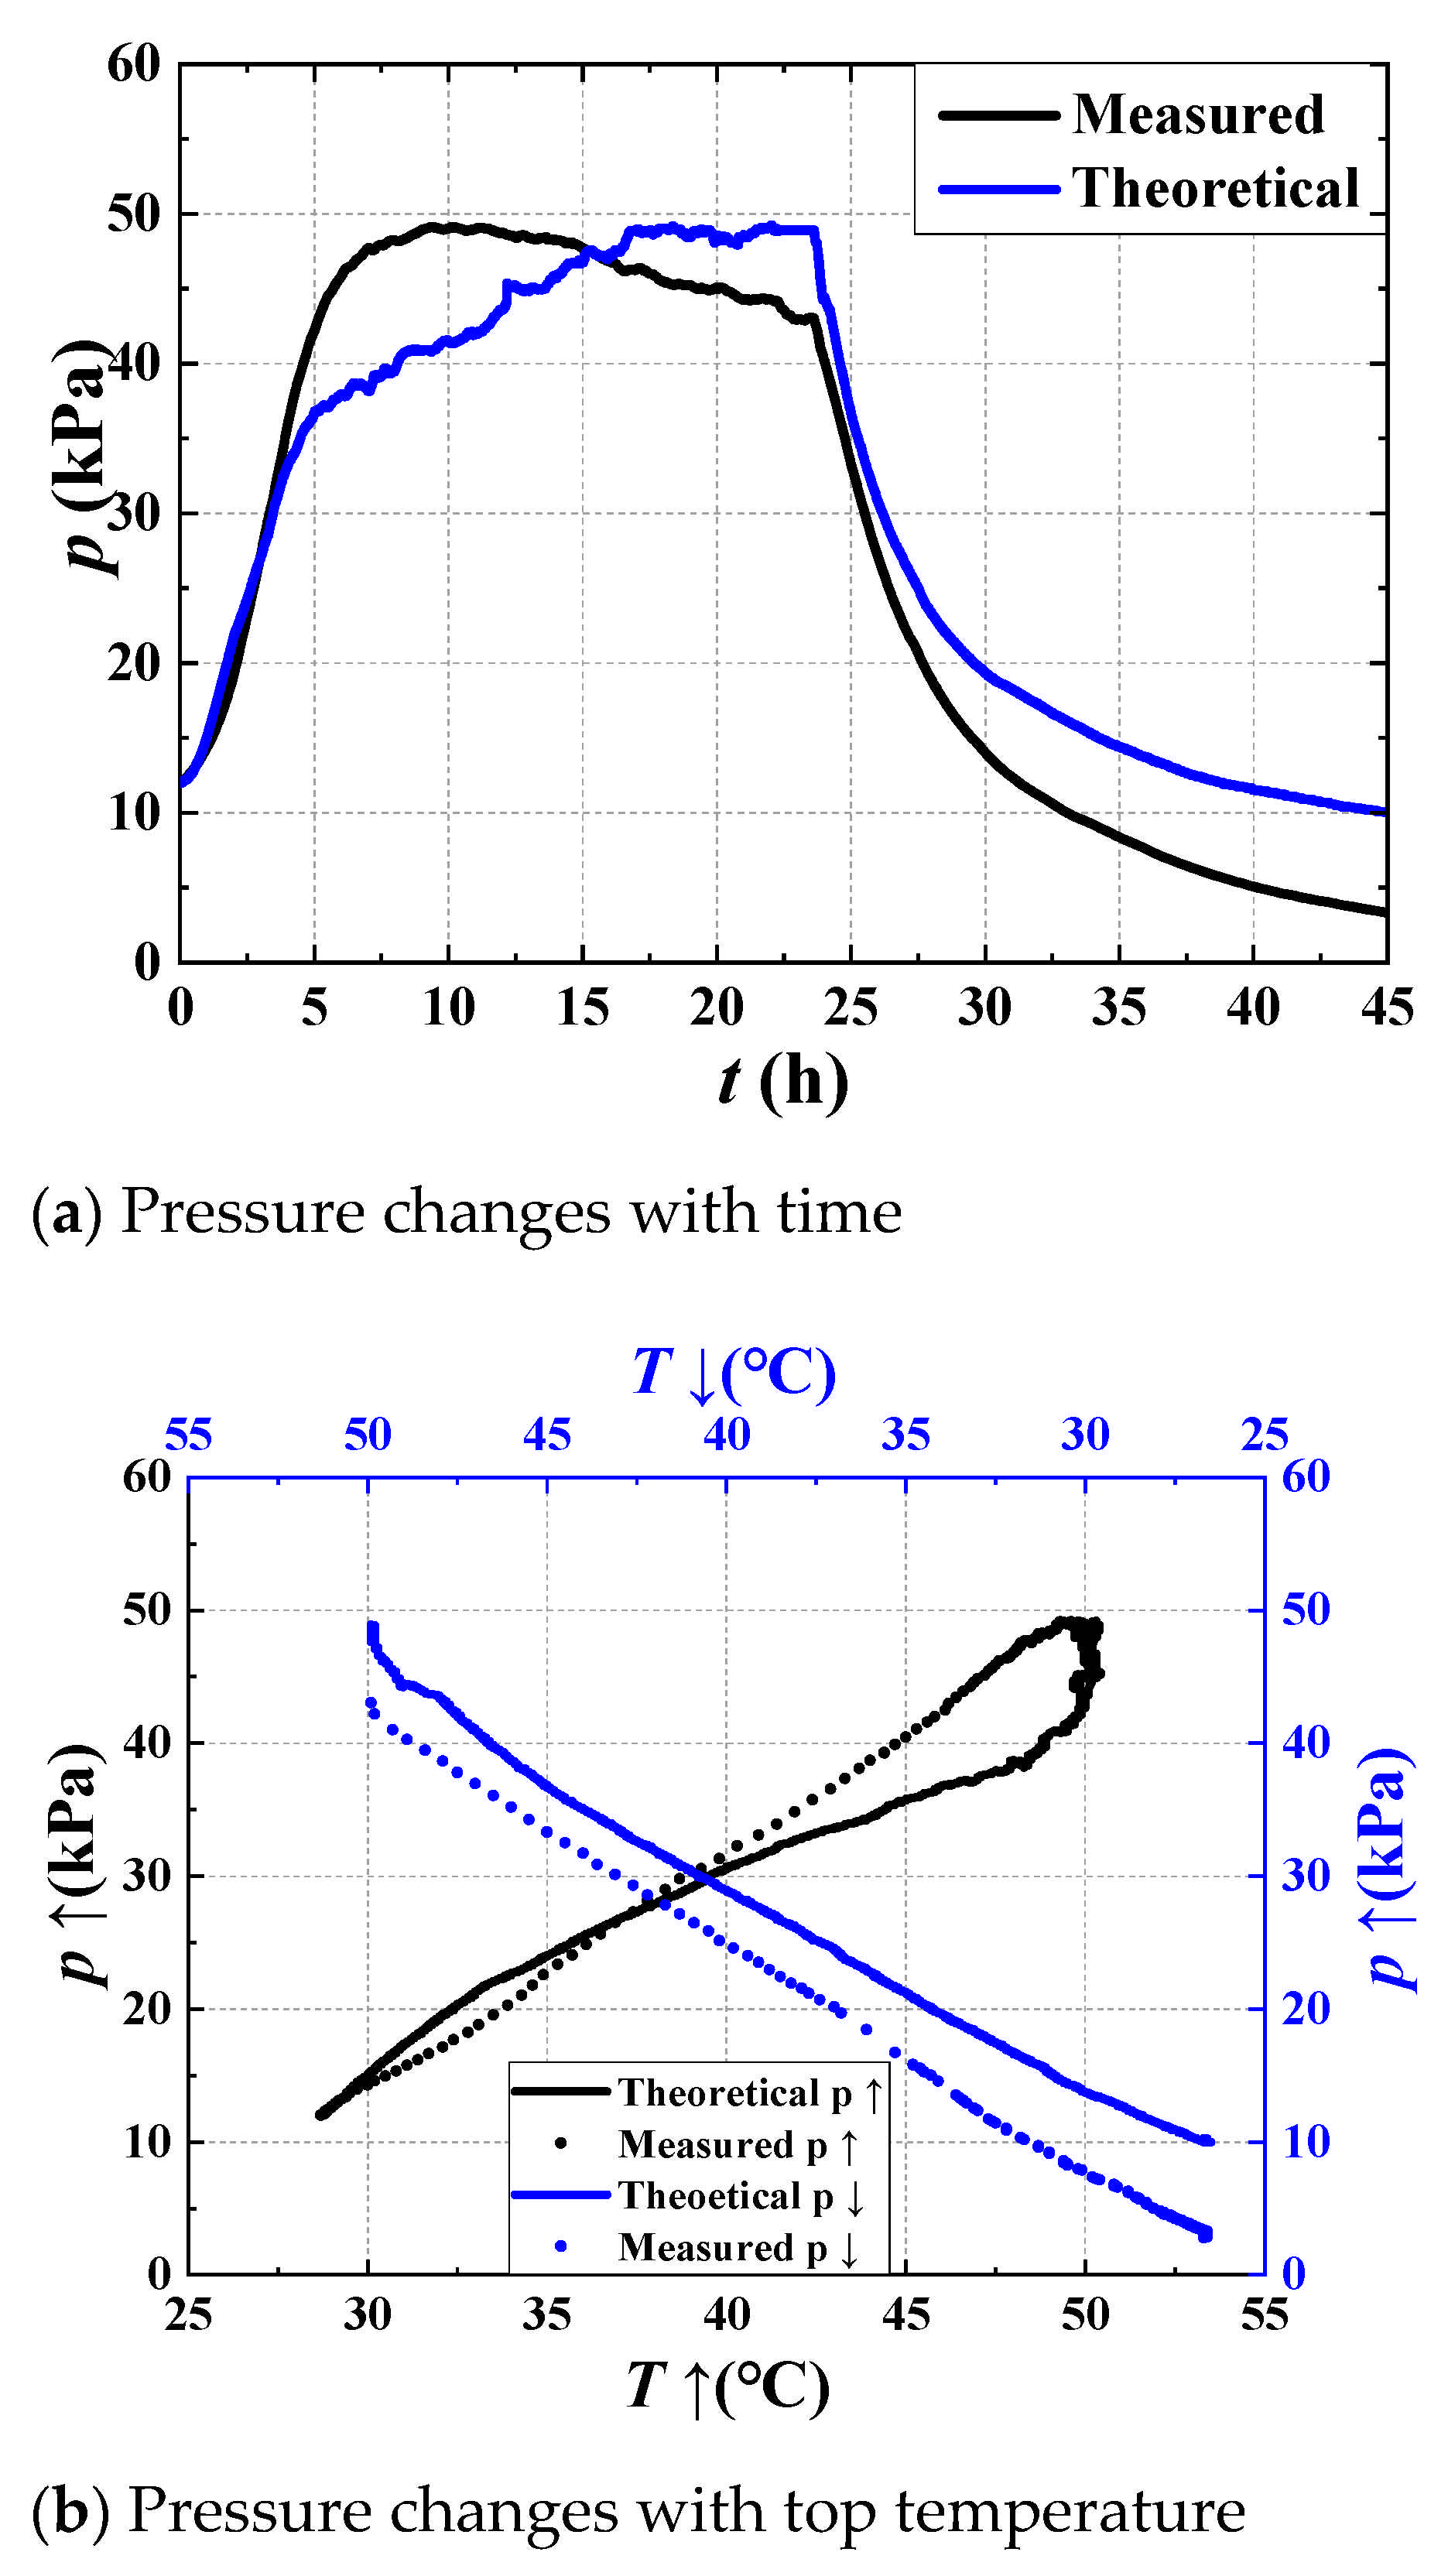
The pressure and temperature results obtained in this test are substituted into Equation (3), and the test results are compared with the theoretical calculation results, as shown in Figure 8.
There is a significant difference between the theoretical and measured value at about 40 kPa during the heating process. The similarity in curves is high during the cooling and basically consistent. The concavity and convexity of the pressure changes with temperature are opposite when the temperature is rising. The reasons for this process are: (1) the bottom oil temperature data fluctuate; there is a wide range of changes during 5–15 h, which directly leads to no correspondence with the theoretical calculation results; (2) the measured temperature is considered as the average temperature and it is adopted in the theoretical calculation. According to the results, the measured gas cavity temperature and bottom oil temperature in steady state may correspond to the theoretical analysis.
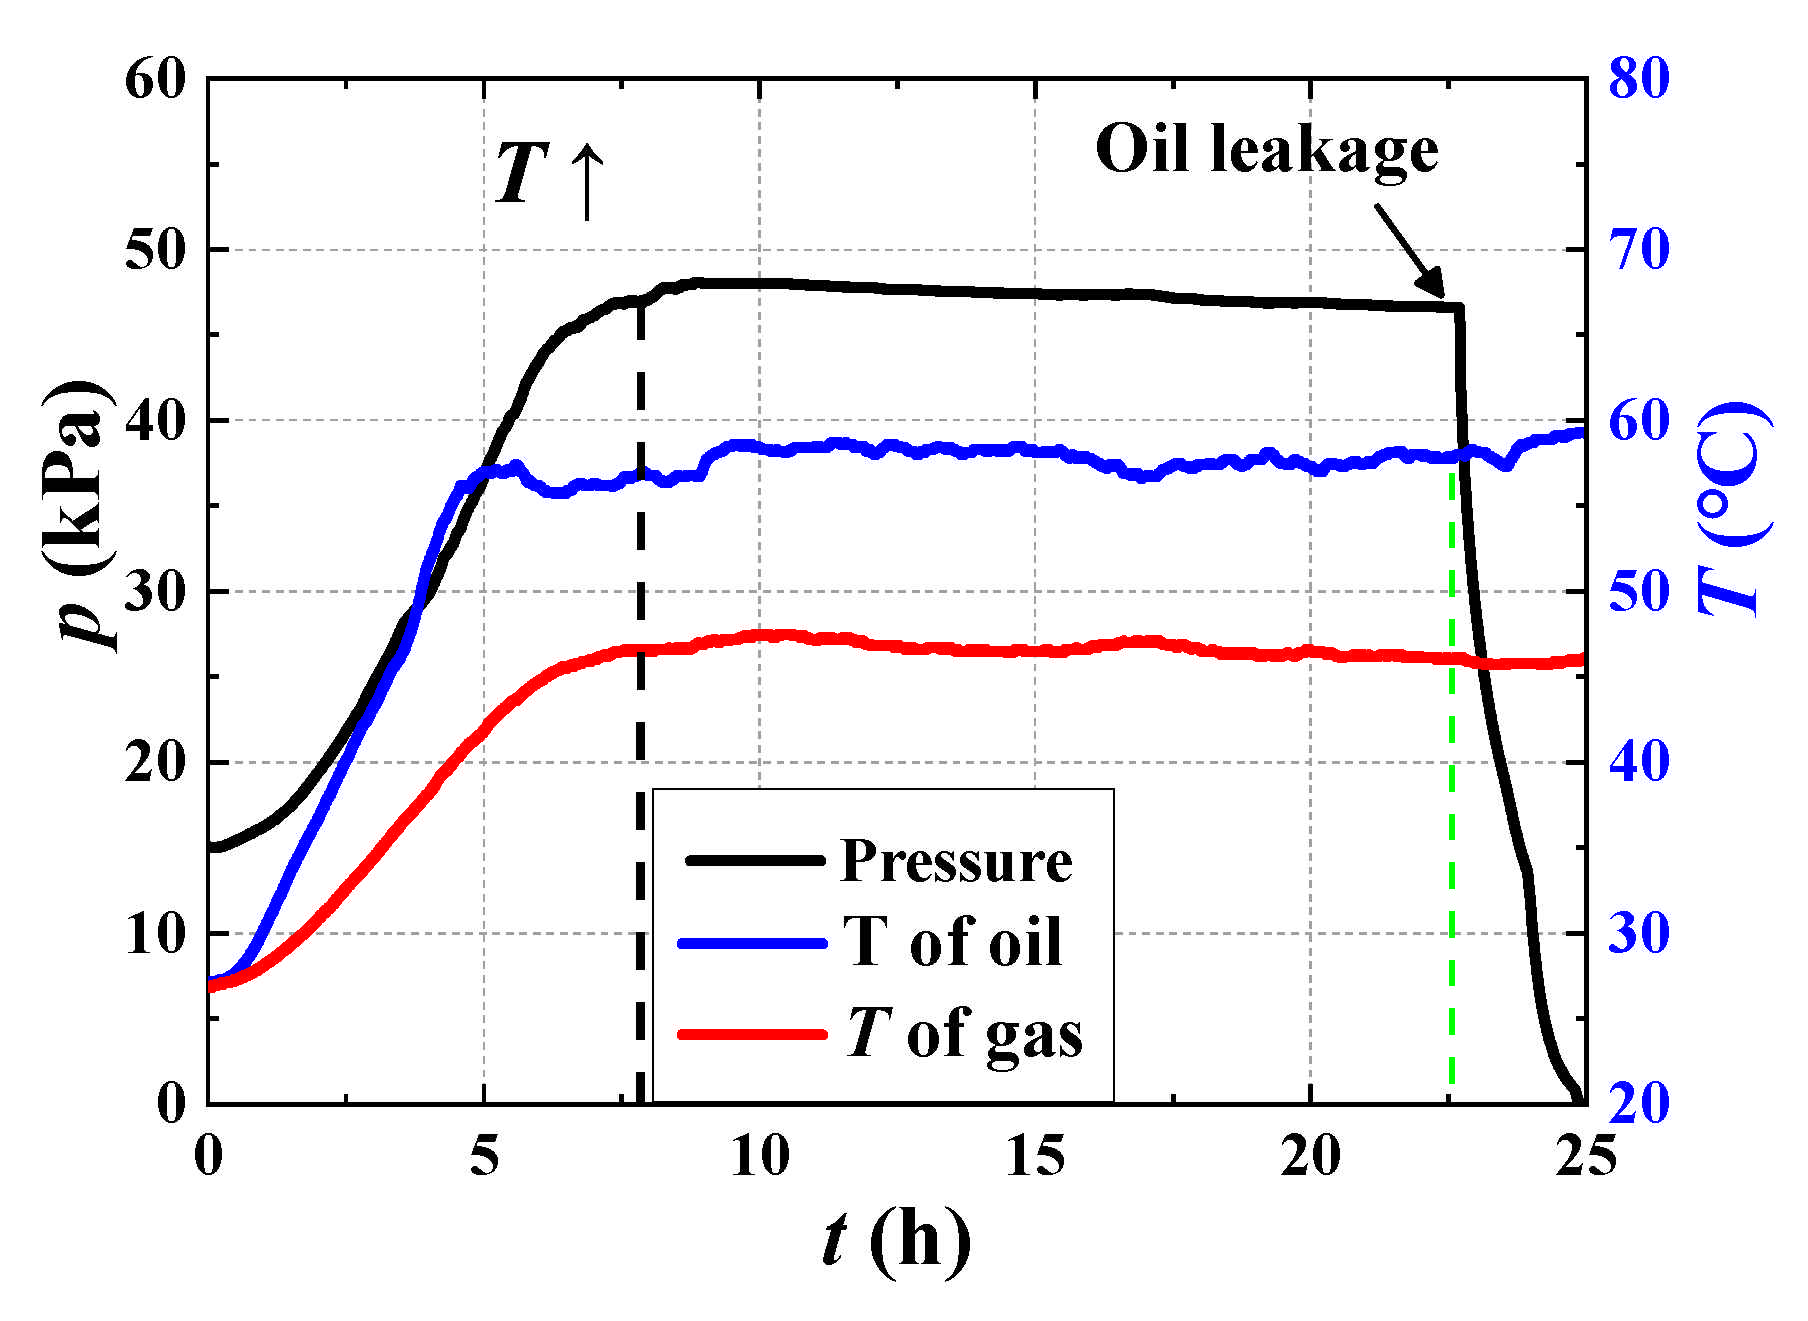
The rubber ring sealing the gas cavity is removed to simulate poor sealing after the test of normal sealing condition. The other settings are the same as the above, and the test results are shown in Figure 9.
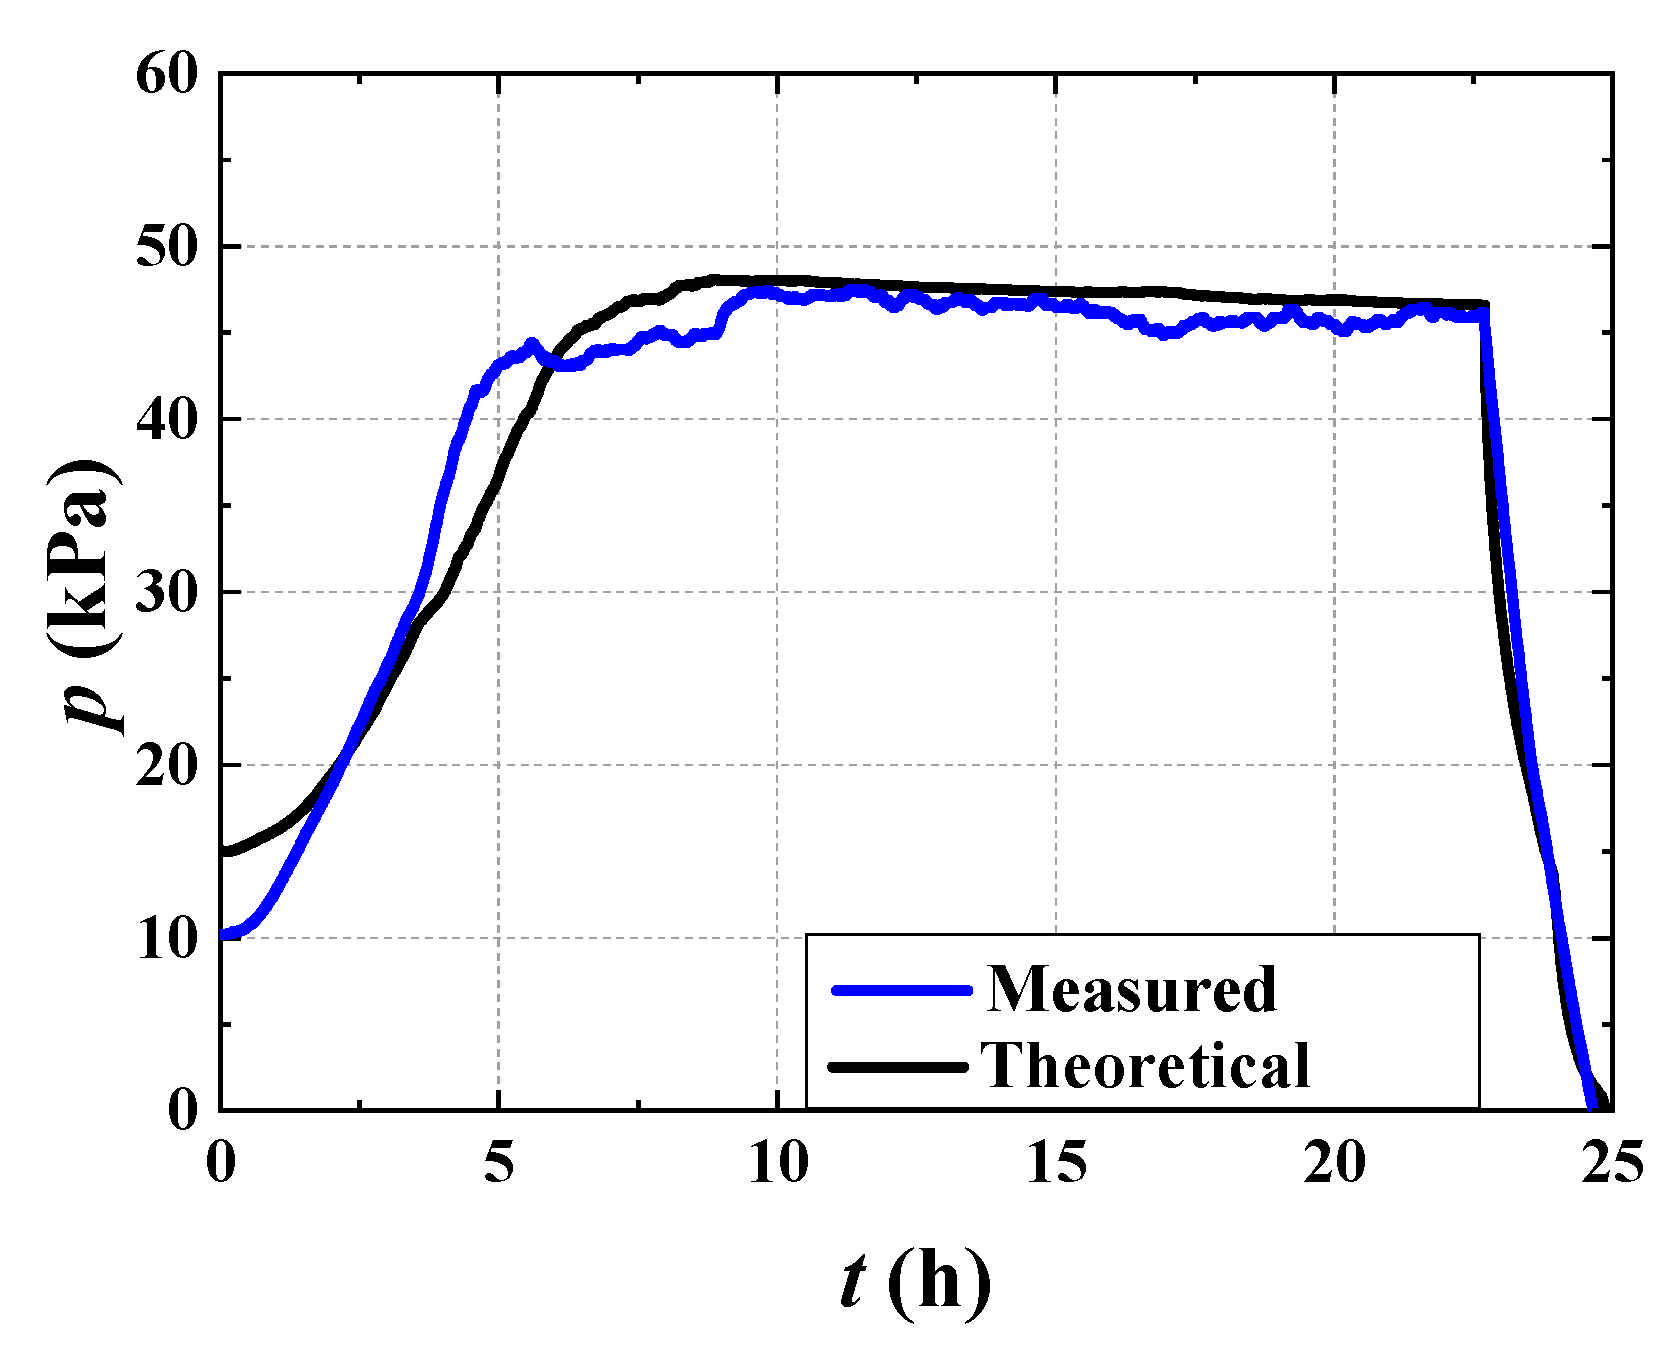
The pressure reaches a peak at about 49 kPa after heating for 10 h, then the bottom oil temperature still increases slowly with the pressure gradually decreasing. The bushing is set to cool down while the pressure is at 42 kPa. The comparison shows that the value of pressure drops more obviously than that for the intact sealing condition. Finally, when the bushing cools to a stable status, the pressure reaches about 3 kPa, while the value of the intact sealing is 11 kPa. The two temperature values are also brought into the Equation (3) for calculation (because the leakage rate and the start time of the leakage cannot be estimated, the theoretical equation that the seal is intact is used to compare), the result is shown in Figure 10. The previous segment of the pressure curves is approximately straight and coincident, which shows that the leakage process exists while the pressure is at a threshold.
There is a significant drop of pressure in the case of leakage and during the cooling process. The reason for the difference in the temperature–pressure curve should be the same as that for normal conditions. The gas cavity is completely sealed after the cooling process. As the bushing is well sealed and being heated, then oil leakage failure is established. The test results are shown in Figure 11.
The oil leaking process lasts for 140 min and the leaking oil volume is around 500 mL. The measured pressure ranges from 47 to 0 kPa; a is the oil leakage rate, and it can be calculated that the oil leakage is 0.06 mL per second, that is, m3/s, which is substituted into Equation (4) for calculation. The comparison with the test results is shown in Figure 12.
In the case of intact sealing and oil leakage, the test results and the theoretical results fit well to a high degree, indicating the suitability of the theoretical analysis and modeling.
5. Criterion for Bushing Sealing Condition
When the bushing is under normal working condition and the top area of the bushing is under high voltage, it is difficult to measure the temperature of the top gas cavity directly. Therefore, to obtain access to practical application and judgment, it is necessary to consider the relationship between the oil temperature and the gas temperature at the top.
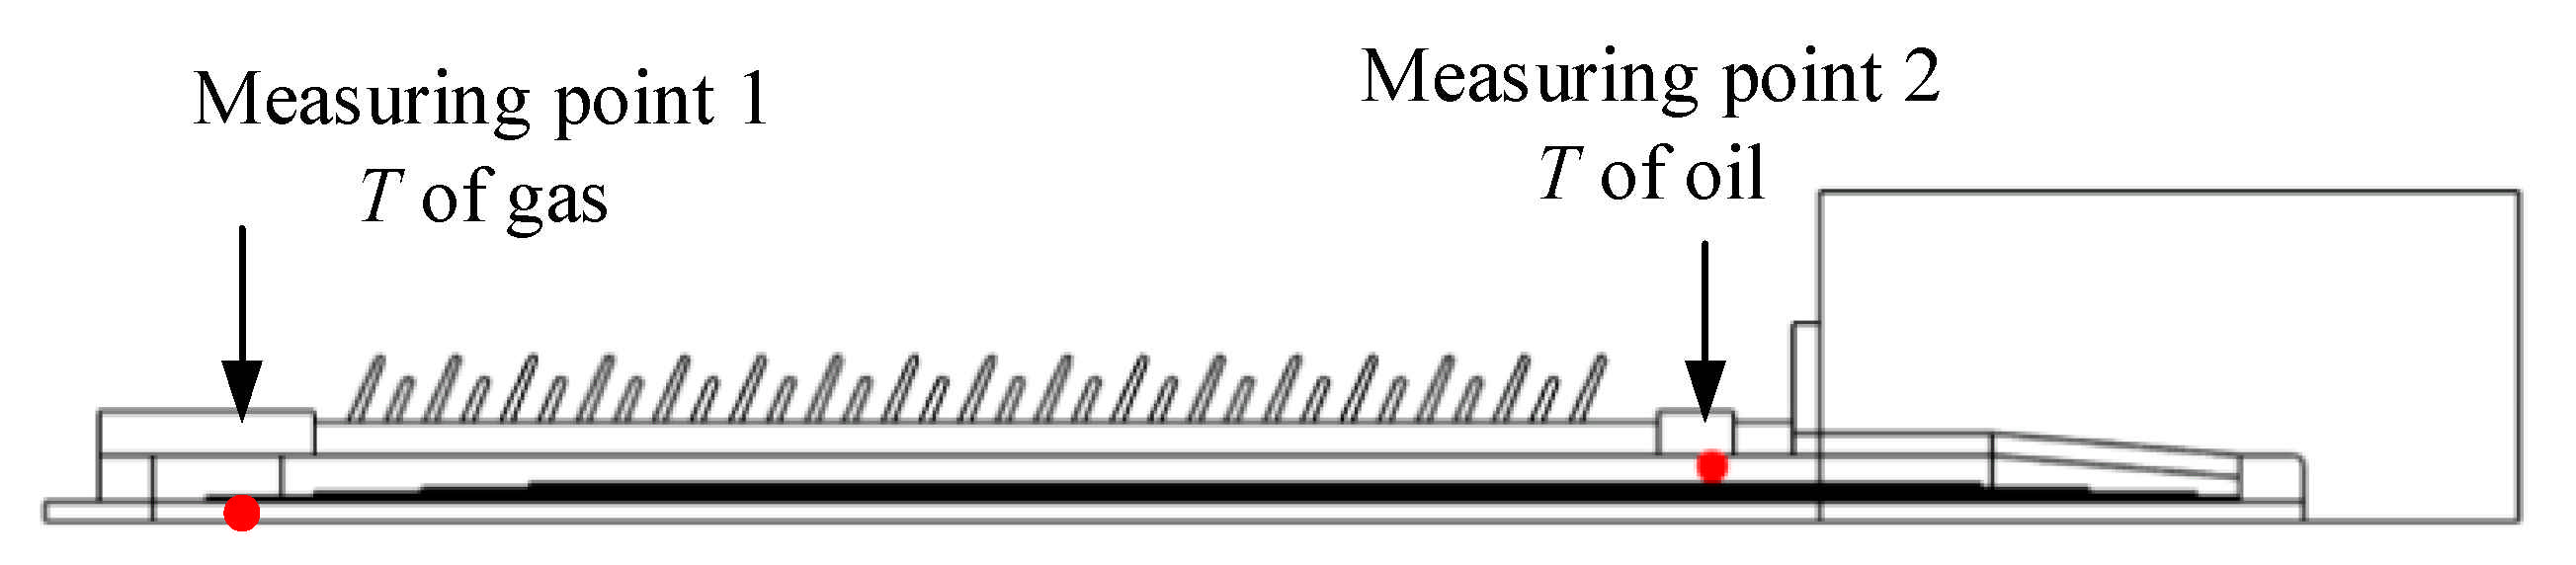
In order to analyze the temperature relationship between the measuring points inside the bushing, a 110 kV oil-immersed bushing (BRDW-126/630-4) is taken as a sample to establish a thermal field simulation model. To accelerate the calculation, a two-dimensional axisymmetric model is established to calculate the temperature distribution of the three-dimensional since the bushing is approximately an axisymmetric object. The model and measuring points are shown as Figure 13.
In the simulation, the radius of the internal current-carrying conductor is 0.018 m, the length is 2 m, and the radius of the condenser body is 0.034 m. The conductor is set to copper. The top, condenser body and the flange are set to aluminum, and the upper and lower porcelain envelopes are set to ceramic. In addition, both gas and insulating oil are fluids, and the dynamic viscosity are set to 1.86 × 10⁻⁵ m2/s and 10 Pa·s [22], respectively. More information is specified in Table 2.
During the simulation, the physical fields include electric, thermal, and fluid. The electric field is distributed on the conductor, and the bottom of the conductor is set as the z-direction current source, and the top of the conductor is set as the ground point. The heat generated by the conductor through high current radiates to the OIP and gas in the form of a “body heat source”. In the thermal field, the heat transfer is mainly carried out through heat conduction and heat convection. The heat conduction is applied for all contact media. Convection is applied to the fluid field and the outer surface of the porcelain. The fluid field includes the fluid area in the bushing, gas and oil. The fluid density changes due to the temperature difference, and the pressure difference between the inside and the outside creates the heat exchange of fluid movement. It is coupled with the heat transfer field to form a nonisothermal fluid heat transfer model.
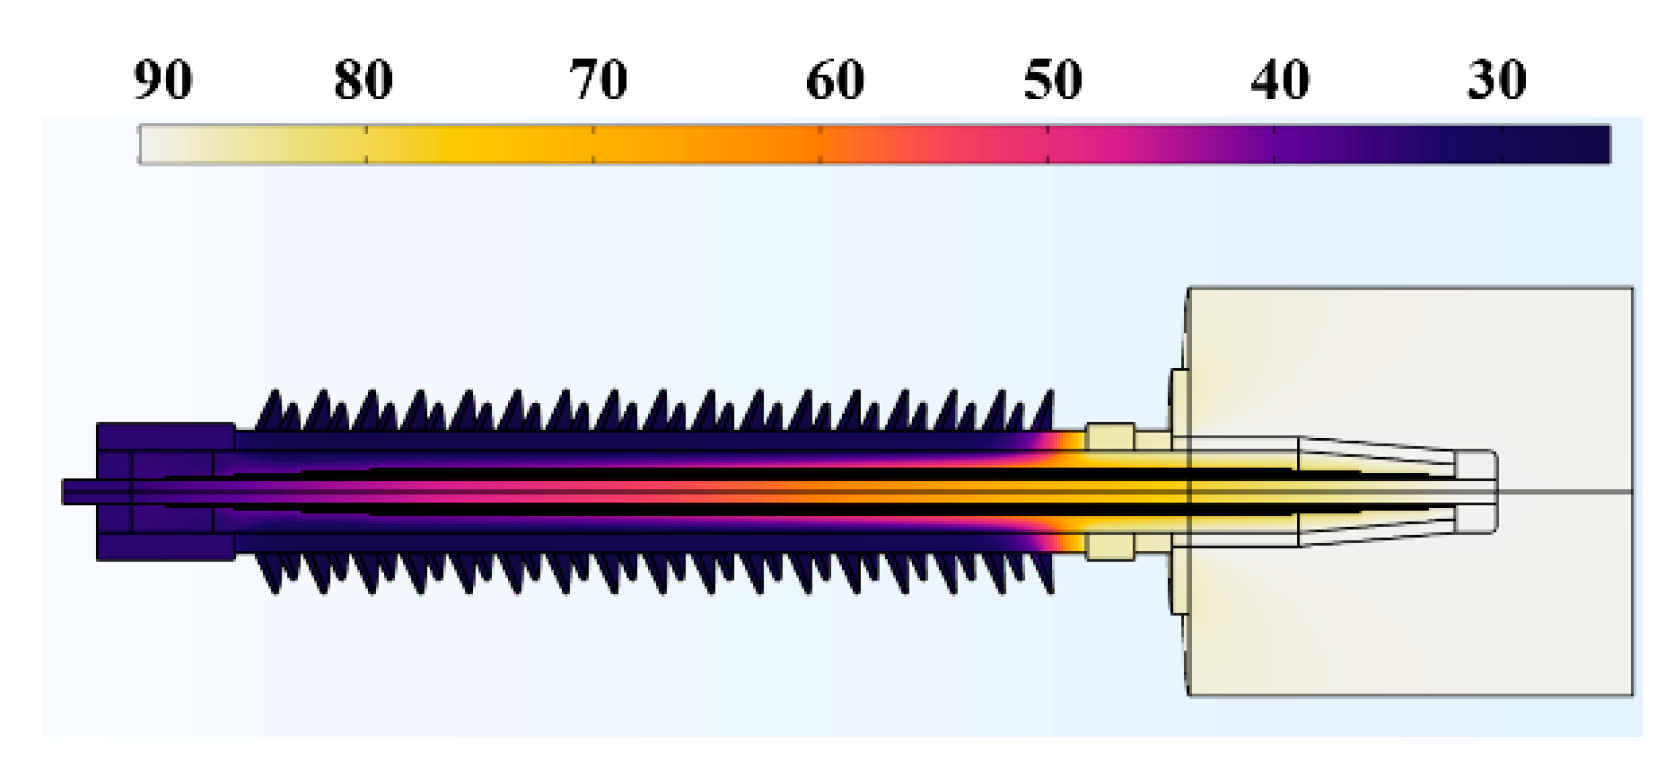
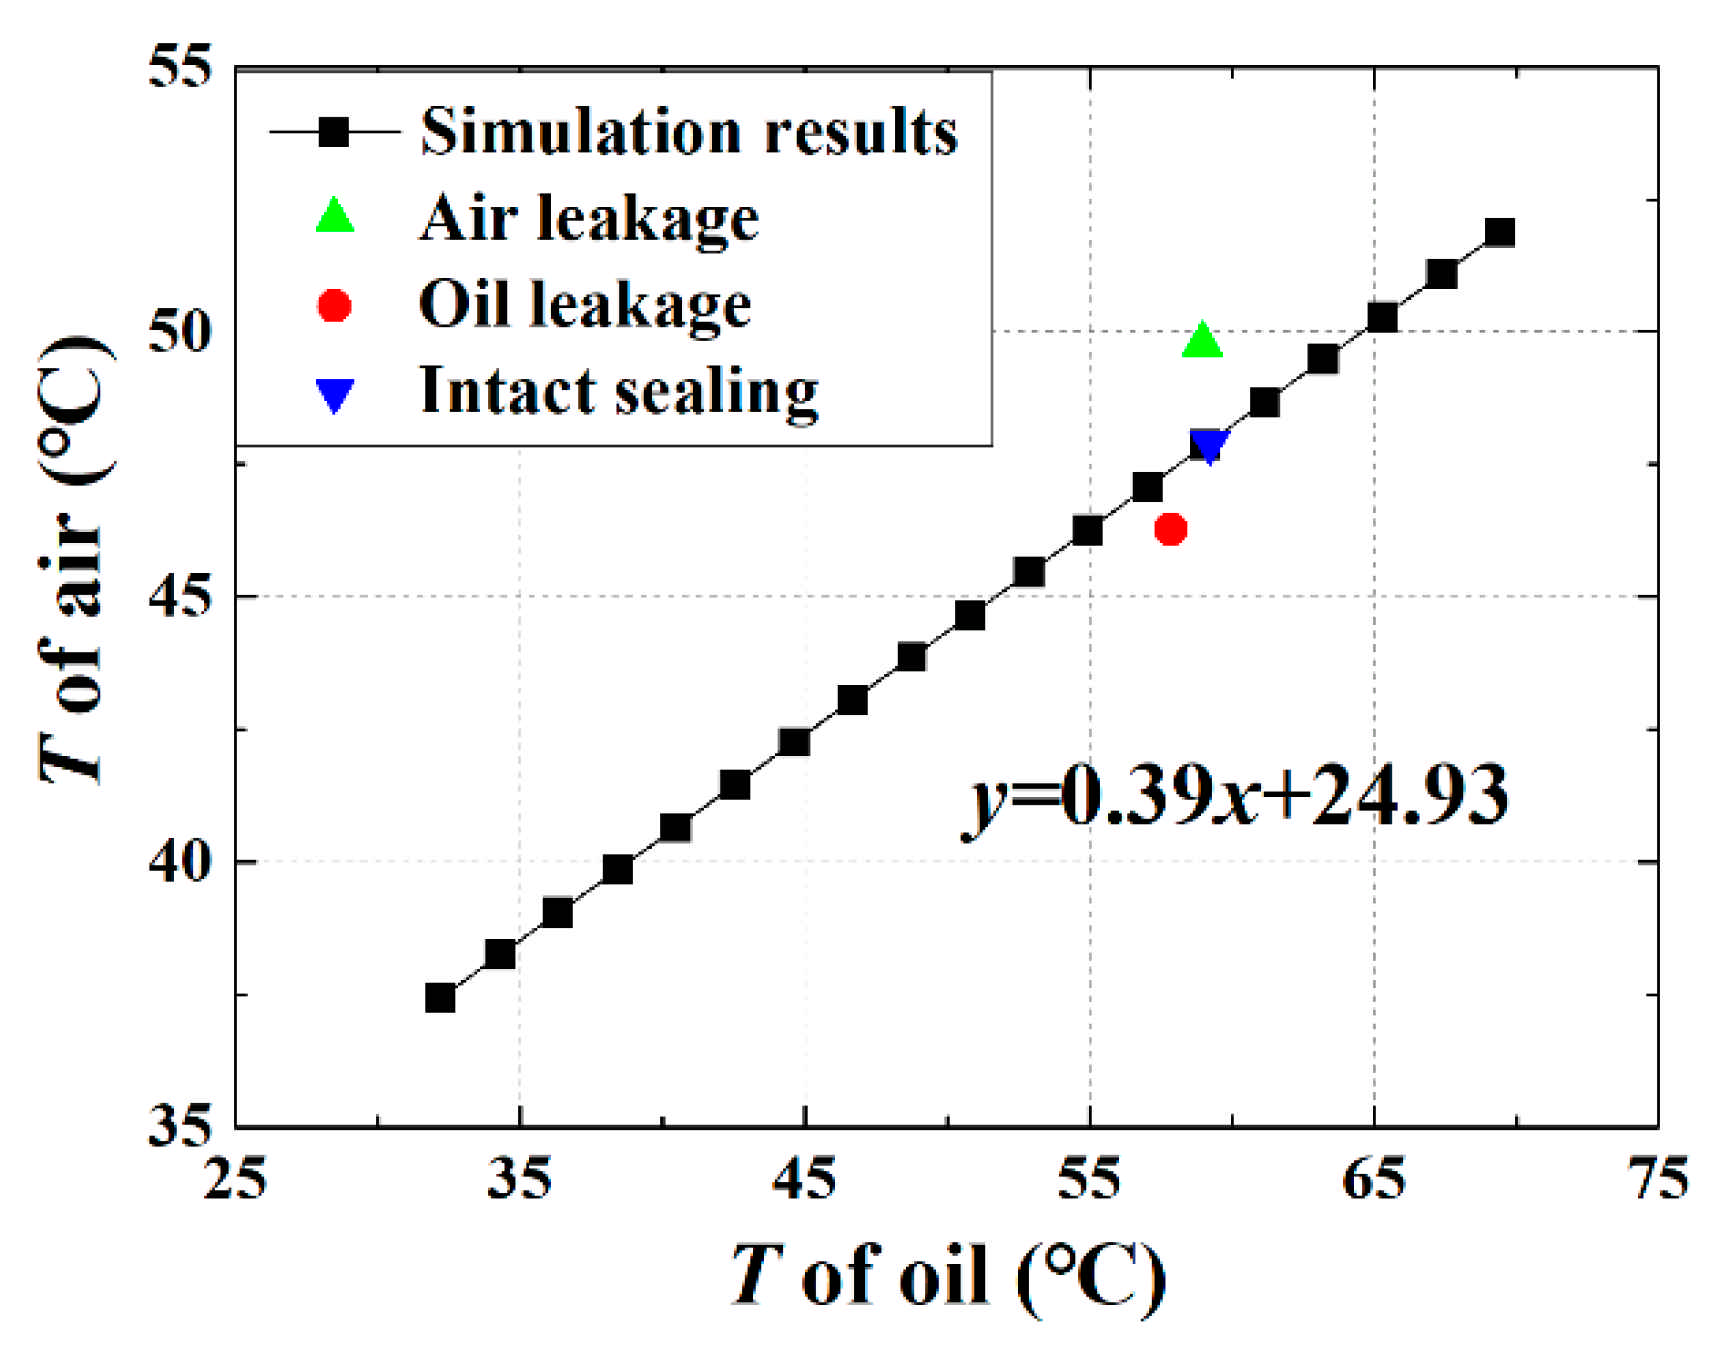
According to the test and simulation process, the temperature of the oil tank is the main factor and the influence of the conductor is relatively small. The reason is that the conductor is composed of metal with low resistivity, so it generates less heat than oil in the tank. The heat distribution when the oil tank is 90 °C is shown in Figure 14. The temperature of the oil tank in the simulation is set at 30, 35, …, 120 °C, to obtain the temperature relationship between the two measuring points. On this basis, the two measuring points at multiple temperatures are fitted, and the result is shown in Figure 15.
The temperature closed to the oil tank is higher, and the temperature at the top is linear to the bottom measuring point temperature. The proportional relationship is set as , y is the temperature of gas, x is the temperature of oil and the solution is , . The temperature measurement results under three different conditions in the experiment versus the simulation fitting curve are compared. The points of oil leakage and intact sealing are closed to the fitting line while the point of gas leakage differs from the fitting line by about 2 °C. Since the failure is set at the temperature measurement point of gas in the case of gas leakage, in which heat dissipation influences the measuring value of temperature. The results show that the temperature on the top can be converted to the oil temperature for achieving the pressure calculation in the field.
Based on the temperature conversion between oil and gas, the relationship curve of oil temperature and gas pressure under the theory can be calculated by combining with Equation (3). The measured value under the intact seal differs from the theoretical curve by 0.7 kPa. The data show that the theoretical result is consistent with the measured value.
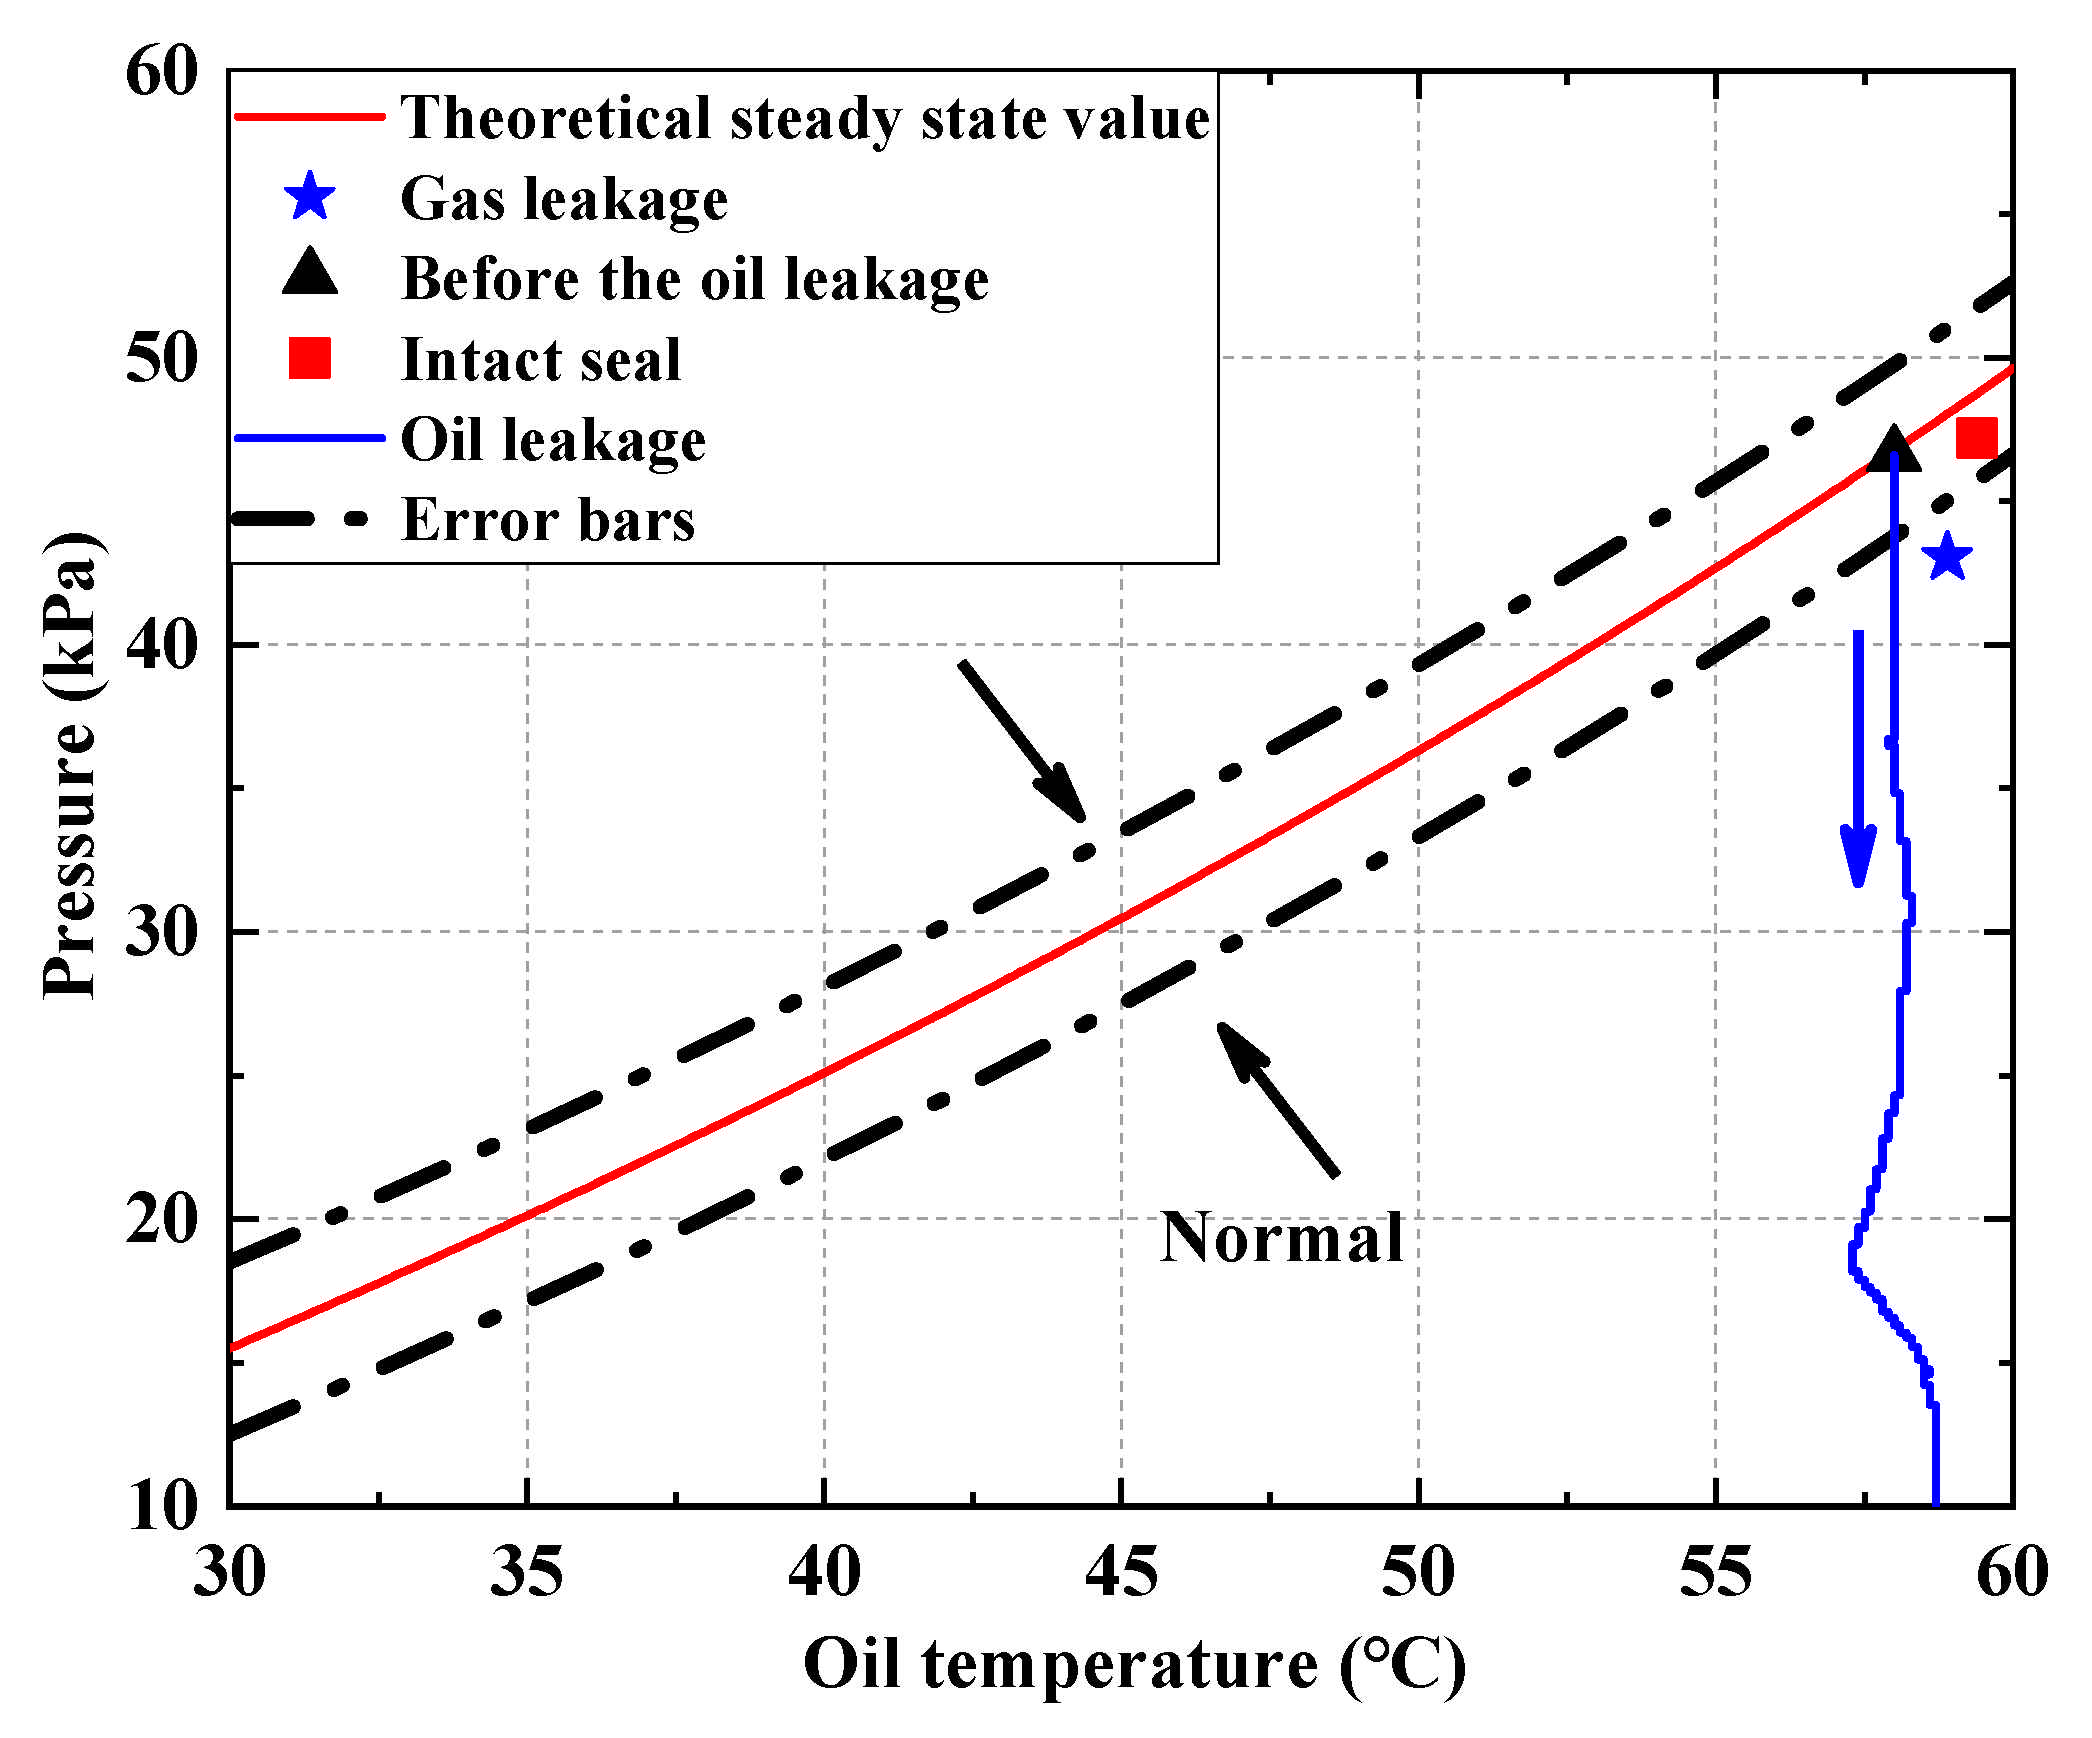
In order to better evaluate the integrity of bushing seal, the main and secondary criteria of bushing seal are developed to fully evaluate the sealing degree of bushing. The pressure error lines are established by calculating the temperature difference between the intact seal condition and the theoretical value in steady state. The main temperature and pressure criterion of bushing seal is shown in Figure 16. In order to prevent misjudgment, the oil temperature difference is within the range of 3.2 °C, and the pressure value fluctuates up and down by 3 kPa. If the pressure does not change with the temperature, the seal is determined to be complete failure. If the measured value is out of this range, then it is considered as poor sealing.
In fact, when the transformer is in actual operation, the temperature change is not in the monotonous rise or fall process. When the temperature is too high, a variety of measures are taken to cool the transformer. For example, forced gas cooling is used to make the transformer temperature drop quickly, and then stop when it reaches the appropriate value. Therefore, the actual temperature of the transformer is difficult to maintain at a balanced steady state. This process of change is easy to misjudge the fault in a short time, and sealing defects including gas leakage and oil leakage need to be further distinguished. In this view, oil leakage or gas leakage can be evaluated through the analysis of pressure change rate at stable temperature. It is recommended to determine the oil leakage or gas leakage through the oil pressure changing rate under a relatively stable temperature.
After temperature conversion, the theoretical results and actual results are compared, as shown in Table 3 and Table 4. It is not obvious how to distinguish the leakage type merely based on the oil pressure changing rate in the temperature constant interval. For different sealing conditions, the leakage process occurs at a certain point. Moreover, when the internal gas leaks to the outside, the accuracy of the top temperature measurement may be affected due to the leaking path contained in the measuring position. As for the oil leakage, when the temperature is stable, it leads to a large pressure change even if leakage is at a lower rate, and the pressure change rate is much greater than the other two cases. It shows that the oil leakage fault can be visually and quickly observed, which provides the basis and measures for early warning.
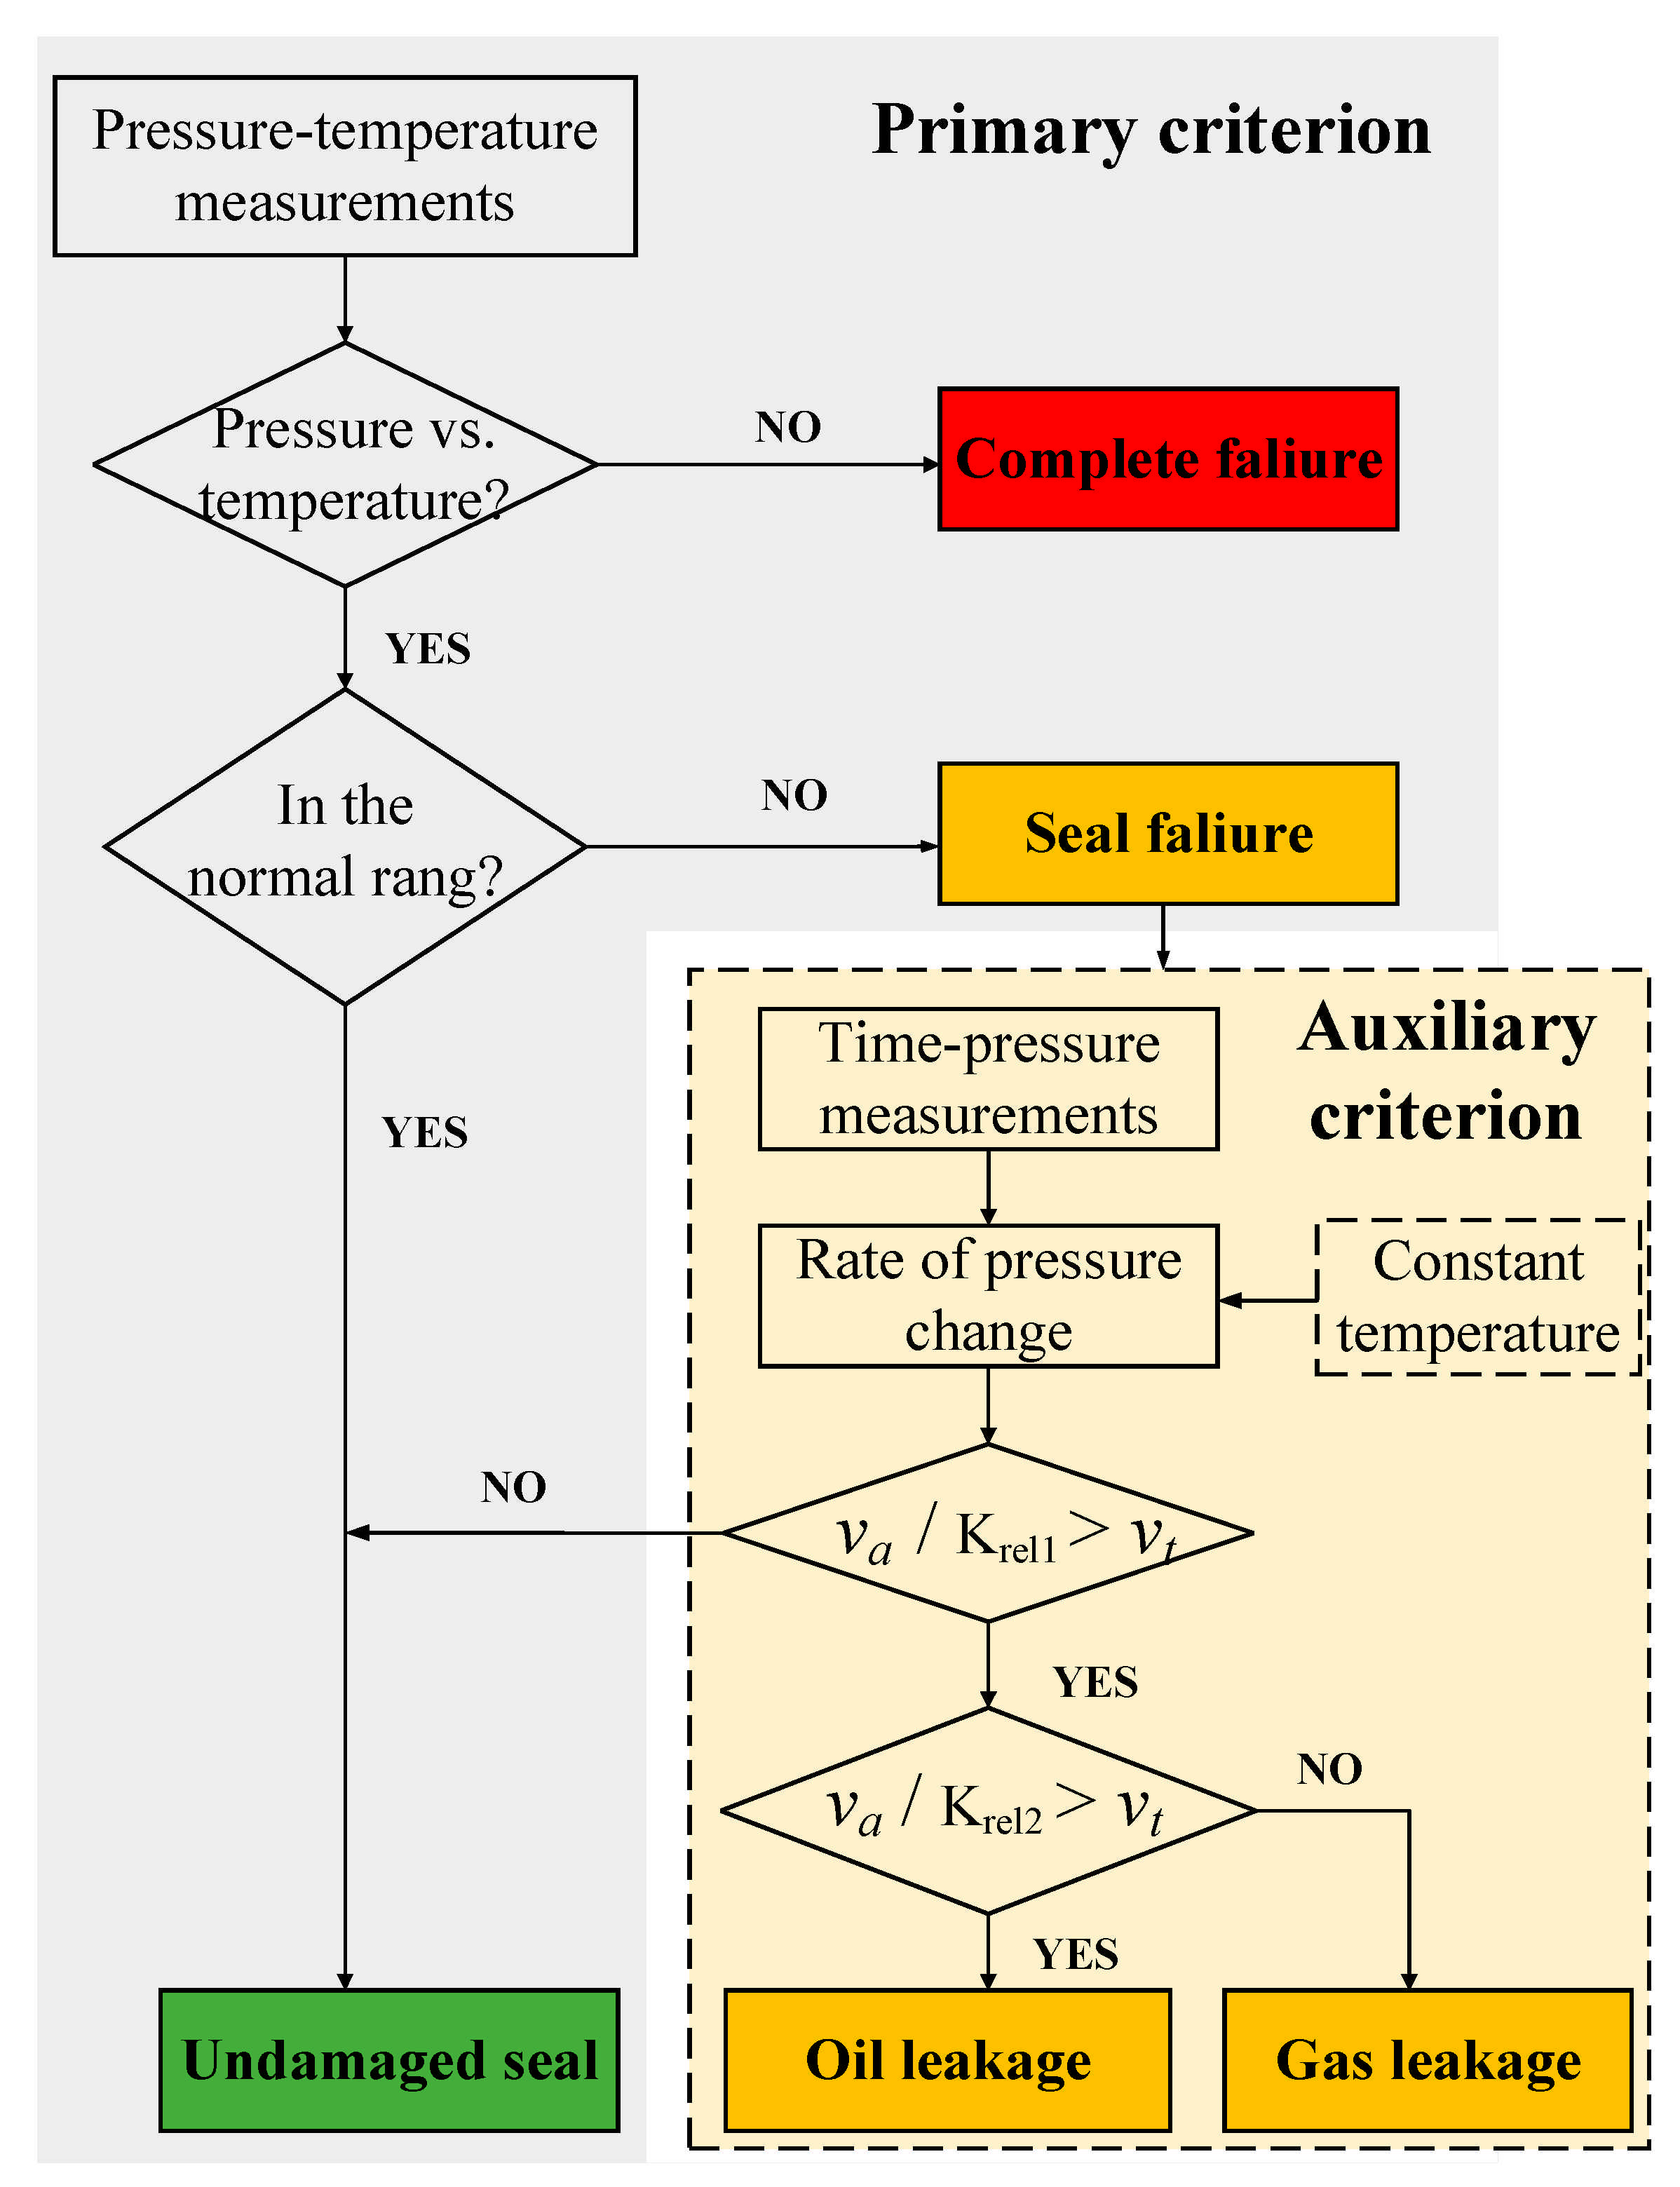
Through the analysis of the experimental and theoretical results, online monitoring of the temperature and pressure in the bushing reflects the degree of sealing condition. When the temperature is relatively stable, comparing theoretical and measured pressure changes, this paper proposes an auxiliary criterion for the bushing, a reliability coefficient needs to be added in the judgment process to prevent misjudgment. For the convenience of expression, the actual pressure change rate is defined as , and the theoretical pressure change rate of intact seal at the same temperature is defined as .
Criterion I: When the temperature is stable, if , it can be judged as a gas leakage fault. Reliability coefficient is set at .
Criterion Ⅱ: When the temperature is stable, if , it can be judged as an oil leakage fault. Reliability coefficient is set at .
The pressure of oil and gas decreases at the same time when the oil leakage occurs, which causes significant changes in the measured pressure. Therefore, it can be timely and accurately judged when oil leakage occurs in any process. The gas leakage may take relatively more time and data to judge, and this fault does not immediately affect the operation of bushing. Figure 17 shows the flow chart of primary and auxiliary criteria with respect to oil pressure and its gradient. With the help of the primary and auxiliary criteria, the actual sealing condition of the bushing can be comprehensively analyzed just based on the oil pressure sensor and oil temperature detection in the bottom valve, which is quite beneficial to field application.
6. Conclusions
In this paper, different sealing conditions based on a 110 kV oil-immersed bushing are conducted, and the influence of the sealing condition at different temperatures on the pressure is analyzed. An online monitoring device is developed and criteria for the bushing sealing condition are proposed. Oil pressure and its gradient can effectively indicate the sealing condition. Excluding the influence of temperature fluctuation, it is effective to determine the mechanical failure of the bushing by detecting the oil pressure. Gas leakage at the top and oil leakage at the bottom are typical sealing defects for power transformer bushings. Once the fluctuation of the oil pressure value exceeds the theoretical curve in steady state by 3 kPa, it is regarded as a poor sealing. If the ratio of the measured oil pressure change rate versus the theoretical value is higher than 500, it is regarded as oil leakage, vice versa, it is probably diagnosed as gas leakage. A wireless oil pressure and temperature sensing module installed at the oil valve is developed in our study. It is effective to diagnose the mechanical conditions such as intact sealing, gas leakage, oil leakage and complete failure in the 110 kV bushing, indicating promising application for online monitoring of mechanical status for oil-immersed power apparatus, especially for vital situations such as in converter power transformers.
Since oil pressure is vital to investigate the sealing condition of high voltage bushings, it is expected to be adopted in monitoring the condition of bushings in the field, especially for high voltage ratings to diagnose bushing status in future applications.
Author Contributions
J.L. and J.C. conceived and designed the experiments and algorithm; J.C. and Z.L. performed the experiments; J.J. analyzed the data; X.Y. and Y.B. provided the insight and technical expertise to improve the quality of this paper; Z.L. and J.J. wrote the paper. All authors have read and agreed to the published version of the manuscript.
Funding
This work was supported by State Grid Jiangsu Electric Power Co. Ltd. (J2019008).
Institutional Review Board Statement
Not applicable.
Informed Consent Statement
Not applicable.
Data Availability Statement
Not applicable.
Conflicts of Interest
The authors declare no conflict of interest.
References
- Analysis of the quantity and causes of outages in LV/MV electrical grids. CSEE J. Power Energy Syst. 2020, 6, 537–542. [CrossRef]
- Boxue, D.; Hanlei, S.; Jinpeng, J.; Xiaoxiao, K.; Wei, Y. Temperature-dependent electric field distribution in ±800 kV valve-side bushing insulation for a converter transformer. High Voltage 2021, 6, 106–115. [Google Scholar]
- Zhang, S. Evaluation of Thermal Transient and Overload Capability of High-Voltage Bushings With ATP. IEEE Trans. Power Deliv. 2009, 24, 1295–1301. [Google Scholar] [CrossRef]
- Wang, W.; Yang, D.; Li, R.; Yan, L.; Guo, R.; Zhang, N.; Tao, W. On-site partial discharge test technology of converter transformer. J. Eng. 2019, 2019, 1820–1823. [Google Scholar] [CrossRef]
- Beura, C.P.; Beltle, M.; Tenbohlen, S. Positioning of UHF PD Sensors on Power Transformers Based on the Attenuation of UHF Signals. IEEE Trans. Power Deliv. 2019, 34, 1520–1529. [Google Scholar] [CrossRef]
- Cigre WG A2.43. Transformer Bushing Reliability; CIGRE: Paris, France, 2019; pp. 1–111. [Google Scholar]
- Zhang, S. Analysis of Some Measurement Issues in Bushing Power Factor Tests in the Field. IEEE Trans. Power Deliv. 2006, 21, 1350–1356. [Google Scholar] [CrossRef]
- Qi, B.; Dai, Q.; Li, C.; Zeng, Z.; Fu, M.; Zhuo, R. The Mechanism and Diagnosis of Insulation Deterioration Caused by Moisture Ingress into Oil-Impregnated Paper Bushing. Energies 2018, 11, 1496. [Google Scholar] [CrossRef] [Green Version]
- Cahue-Diaz, D.; Maximov, S.; Escarela-Perez, R.; Olivares-Galvan, J.; Alvarez-Ramirez, J. Computation of temperature distributions in transformer covers due to high crossing currents in bushing regions. Int. J. Electr. Power Energy Syst. 2019, 113, 699–712. [Google Scholar] [CrossRef]
- Liao, R.; Du, Y.; Yang, L.; Gao, J. Quantitative diagnosis of moisture content in oil-paper condenser bushing insulation based on frequency domain spectroscopy and polarisation and depolarisation current. IET Gener. Transm. Distrib. 2017, 11, 1420–1426. [Google Scholar] [CrossRef]
- Xu, Z.; Yi, F.; Hu, G.; Wang, X.; Yin, P.; Hu, W.; Peng, Z. Study on frequency domain dielectric spectroscopy of epoxy resin impregnated paper bushings under damp conditions. J. Eng. 2019, 2019, 1319–1323. [Google Scholar] [CrossRef]
- Wang, D.; Zhou, L.; Li, H.; Liao, W.; Xu, X.; Guo, L. Moisture estimation for oil-immersed bushing based on FDS method: At a reference temperature. IET Gener. Transm. Distrib. 2018, 12, 2480–2486. [Google Scholar] [CrossRef]
- Zhang, L.; Sun, L.; Wu, J.; Han, Y.; Wang, S.; Yang, C.; Shen, W.; Guo, C. Development of multi-parameter online monitoring equipment for EHV transformer bushing. IET Sci. Meas. Technol. 2020, 14, 98–103. [Google Scholar] [CrossRef]
- Chen, L.; Wu, X.; Tian, Y.; Long, Z.; Su, C.; Lin, T.; Liu, R. PD Defect Monitoring for Oil-Impregnated Paper Bushing by Measuring the Inner Pressure. IEEE Access 2019, 7, 53411–53418. [Google Scholar] [CrossRef]
- Feng, X.; Zhang, M.; Zhao, T.; Wang, W.; He, L.; Liu, H.; Yang, S. Research on Online Monitoring of Converter Transformer Bushing Based on Multi-Sensor Fusion Technology. In Proceedings of the 2020 International Conference on Artificial Intelligence and Electromechanical Automation (AIEA), Tianjin, China, 26–28 June 2020; pp. 44–47. [Google Scholar]
- Zhang, L.; Zhao, H.; Li, Y.; Han, Y.; Wang, S.; Shang, Y. Study on Multi-parameter On-line Monitoring System for Transformer Bushing. In Proceedings of the Asia Energy and Electrical Engineering Symposium (AEEES), Chengdu, China, 29–31 May 2020; pp. 54–58. [Google Scholar]
- Jiang, J.; Chen, R.; Chen, M.; Wang, W.; Zhang, C. Dynamic Fault Prediction of Power Transformers Based on Hidden Markov Model of Dissolved Gases Analysis. IEEE Trans. Power Deliv. 2019, 34, 1393–1400. [Google Scholar] [CrossRef]
- Przybylek, P.; Moranda, H.; Walczak, K.; Moscicka-Grzesiak, H. The bubble effect in bushings—investigations on models. IEEE Trans. Dielectr. Electr. Insul. 2015, 22, 3405–3412. [Google Scholar] [CrossRef]
- Wang, Q.; Yang, X.; Tian, H.; Liu, P.; Peng, Z. A novel dissipating heat structure of converter transformer RIP bushings based on 3-D electromagnetic-fluid-thermal analysis. IEEE Trans. Dielectr. Electr. Insul. 2017, 24, 1938–1946. [Google Scholar] [CrossRef]
- Al-Ameri, S.M.A.N.; Kamarudin, M.S.; Yousof, M.F.M.; Salem, A.A.; Banakhr, F.A.; Mosaad, M.I.; Abu-Siada, A. Understanding the Influence of Power Transformer Faults on the Frequency Response Signature Using Simulation Analysis and Statistical Indicators. IEEE Access 2021, 9, 70935–70947. [Google Scholar] [CrossRef]
- Wang, Q.; Wang, H.; Peng, Z.; Liu, P.; Zhang, T.; Hu, W. 3-D coupled electromagnetic-fluid-thermal analysis of epoxy impregnated paper converter transformer bushings. IEEE Trans. Dielectr. Electr. Insul. 2017, 24, 630–638. [Google Scholar] [CrossRef]
- Yang, Z.; Ruan, J.; Huang, D.; Du, Z.; Tang, L.; Zhou, T. Calculation of Hot Spot Temperature of Transformer Bushing Considering Current Fluctuation. IEEE Access 2019, 7, 120441–120448. [Google Scholar] [CrossRef]
- Akbari, M.; Rezaei-Zare, A. Transformer Bushing Thermal Model for Calculation of Hot-Spot Temperature Considering Oil Flow Dynamics. IEEE Trans. Power Deliv. 2021, 36, 1726–1734. [Google Scholar] [CrossRef]
Figure 1.
Oil–gas model inside a typical bushing.

Figure 2.
The experimental setup for heating the bushing and oil tank.

Figure 3.
Realistic photo of the laboratory experimental setup.

Figure 4.
Pressure and temperature sensing detection device of bushing.

Figure 5.
Illustration of poor sealing: (a) poor top seal setting, (b) oil leakage setting.

Figure 6.
Changes in background temperature and atmospheric pressure during the test.

Figure 7.
The curves of temperature and pressure in the intact seal bushing: (a) temperature and pressure change with time, (b) pressure changes with top temperature.
Figure 7.
The curves of temperature and pressure in the intact seal bushing: (a) temperature and pressure change with time, (b) pressure changes with top temperature.

Figure 8.
Comparison of the measured and theoretical results of pressure and temperature in the intact sealing: (a) pressure changes with time, (b) pressure changes with top temperature.
Figure 8.
Comparison of the measured and theoretical results of pressure and temperature in the intact sealing: (a) pressure changes with time, (b) pressure changes with top temperature.

Figure 9.
The curves of temperature and pressure for a poor seal at the top section: (a) temperature and pressure change with time, (b) pressure changes with top temperature.
Figure 9.
The curves of temperature and pressure for a poor seal at the top section: (a) temperature and pressure change with time, (b) pressure changes with top temperature.

Figure 10.
Comparison of the test and theoretical results of pressure and temperature for a poor seal at the top section: (a) pressure changes with time, (b) pressure changes with top temperature.
Figure 10.
Comparison of the test and theoretical results of pressure and temperature for a poor seal at the top section: (a) pressure changes with time, (b) pressure changes with top temperature.

Figure 11.
Time variation of temperature and pressure in the bushing with oil.

Figure 12.
Comparison of the test and theoretical results of pressure and temperature in oil leakage.
Figure 12.
Comparison of the test and theoretical results of pressure and temperature in oil leakage.

Figure 13.
Bushing model and measuring points in simulation.

Figure 14.
Heat distribution in bushing while the temperature of the oil tank is 90 °C.

Figure 15.
Comparison of simulation fitting curve and actual results.

Figure 16.
Temperature and pressure criterion diagram of bushing seal condition.

Figure 17.
Flow chart of primary and auxiliary criteria of the bushing seal.


Table 1.
The values of each parameter under different temperatures for a 110 kV bushing.
| T (°C) | V2 (L) | V1 (L) | P1 (kPa) | Pm (kPa) |
|---|---|---|---|---|
| 20 | 11.00 | 2.00 | 0 | 12.28 |
| 30 | 11.08 | 1.92 | 7.72 | 20.00 |
| 40 | 11.16 | 1.84 | 16.11 | 28.39 |
| 50 | 11.24 | 1.76 | 25.26 | 37.54 |
| 60 | 11.32 | 1.68 | 35.29 | 47.57 |
| 70 | 11.40 | 1.60 | 46.32 | 58.60 |
| 80 | 11.48 | 1.52 | 58.51 | 70.79 |
| 90 | 11.56 | 1.44 | 72.05 | 84.33 |
| 100 | 11.64 | 1.36 | 87.19 | 99.47 |
Table 2.
Material parameters of bushing used in the simulation.
| Material | Density kg·m−3 | Thermal Conductivity W·(m·K)−1 | Pressure Heat Capacity J/(kg·K) |
|---|---|---|---|
| Copper | 8940 | 400 | 385 |
| Ceramics | 2200 | 1.38 | 703 |
| OIP | 1200 | 0.174 | 20,000 |
| Aluminum | 2700 | 237 | 880 |
| Oil | 895 | 0.12 | 1340 |
| Gas | 1.29 | 0.03 | 1000 |
Table 3.
Comparison of maximum change rate of actual and theoretical pressure.
| Sealing Condition | Pressure Change Rate under Stable Temperature kPa·h−1 | Measured Maximum Pressure Change Rate kPa·h−1 | Theoretical Pressure Maximum Change Rate kPa·h−1 |
|---|---|---|---|
| Intact | 0.064 | 5.05 | 5.54 |
| Gas leakage | 0.450 | 6.29 | / |
| Oil leakage | 20.14 | 29.68 | 29.01 |
Table 4.
Comparison of minimum change rate of actual and theoretical pressure.
| Sealing Condition | Pressure Change Rate under Stable Temperature kPa·h−1 | Measured Minimum Pressure Change Rate kPa·h−1 | Theoretical Pressure Minimum Change Rate kPa·h−1 |
|---|---|---|---|
| Intact | 0.064 | 0.17 | 0.11 |
| Gas leakage | 0.450 | 0.44 | / |
| Oil leakage | 20.14 | 14.12 | 16.21 |
Publisher’s Note: MDPI stays neutral with regard to jurisdictional claims in published maps and institutional affiliations. |
© 2021 by the authors. Licensee MDPI, Basel, Switzerland. This article is an open access article distributed under the terms and conditions of the Creative Commons Attribution (CC BY) license (https://creativecommons.org/licenses/by/4.0/).
Share and Cite
MDPI and ACS Style
Li, J.; Li, Z.; Chen, J.; Bie, Y.; Jiang, J.; Yang, X. Oil Pressure Monitoring for Sealing Failure Detection and Diagnosis of Power Transformer Bushing. Energies 2021, 14, 7908. https://0-doi-org.brum.beds.ac.uk/10.3390/en14237908
AMA Style
Li J, Li Z, Chen J, Bie Y, Jiang J, Yang X. Oil Pressure Monitoring for Sealing Failure Detection and Diagnosis of Power Transformer Bushing. Energies. 2021; 14(23):7908. https://0-doi-org.brum.beds.ac.uk/10.3390/en14237908
Chicago/Turabian StyleLi, Jiansheng, Zhi Li, Judong Chen, Yifan Bie, Jun Jiang, and Xiaoping Yang. 2021. "Oil Pressure Monitoring for Sealing Failure Detection and Diagnosis of Power Transformer Bushing" Energies 14, no. 23: 7908. https://0-doi-org.brum.beds.ac.uk/10.3390/en14237908
Note that from the first issue of 2016, this journal uses article numbers instead of page numbers. See further details here.