
Economic Model Predictive Control for Post-Combustion CO2 Capture System Based on MEA


1
College of Electrical and Information Engineering, Lanzhou University of Technology, Lanzhou 730050, China
2
Key Laboratory of Gansu Advanced Control for Industrial Processes, Lanzhou 730050, China
3
National Demonstration Center for Experimental Electrical and Control Engineering Education, Lanzhou University of Technology, Lanzhou 730050, China
*
Author to whom correspondence should be addressed.
Energies 2021, 14(23), 8160; https://0-doi-org.brum.beds.ac.uk/10.3390/en14238160
Submission received: 31 July 2021
/
Revised: 6 November 2021
/
Accepted: 26 November 2021
/
Published: 5 December 2021
(This article belongs to the Special Issue Modelling, Optimization and Control of Carbon Capture for Power Plants)
Abstract
:For the post-combustion CO capture (PCC) system, the time variability of the economic performance is key to the production process of such an actual industrial process. However, the performance index used by the conventional model predictive control (MPC) does not reflect the economy of the production process, so the economic cost function is used instead of the traditional performance index to measure the economy of the production process. In this paper, a complete dynamic model of the PCC system is constructed in Aspen Plus Dynamics. The effectiveness of the model is verified by dynamic testing; subspace identification is carried out using experimental data, a state-space equation between flue gas flow and lean solvent flow; the CO capture rate is obtained; and dynamic models and control algorithm models of accused objects are established in Matlab/Simulink. Under the background of the environmental protection policy, an economic model predictive control (EMPC) strategy is proposed to manipulate the PCC system through seeking the optimal function of the economic performance, and the system is guaranteed to operate under the economic optimal and excellent quality of the MPC control strategy. The simulation results verify the effectiveness of the proposed method.
1. Introduction
As one of the highest concentrations of greenhouse gases in the atmosphere, carbon dioxide (CO) has caused global climate change, which has become one of the major environmental problems that humanity faces at present. This trend is foreseeable and will not change in the future; thus, carbon capture, utilization and storage (CCUS) [1] technology must be implemented to transport and utilize the captured CO and store it in deep-sea geological wells in a supercritical state. The post-combustion capture technology based on the chemical absorption of monoethanolamine (MEA) solvent is the most effective option to solve the problem of CO emissions from fossil fuel power plants [2]. Among them, China is the world’s largest CO emitter and one of the most vulnerable countries to combat climate change. At the first G20 Summit in November 2020, China made a solemn commitment to reduce their CO emission intensity from 60% to 65% by 2030, compared with 2005, and to achieve carbon neutrality, which means having a balance between emitting carbon and absorbing carbon from the atmosphere in carbon sinks by 2060 [3].
In the actual industrial production, the enterprise should not only ensure the control performances of the PCC process, but should strictly guarantee the economics of the production [4]. The main load (flue gas flow) of the PCC is determined in the open and closed loops, and a framework combined scheduling with control is designed to determine the optimal operating strategy under a given operation condition of flue gas flow [5]. The results obtained from this framework are compared with the traditional control and scheduling methods, and the goal of minimizing the economic cost of the system can be achieved. By analyzing the energy consumption of the system and the water consumption of the power plant separately, the economic connection between the CO capture system and the power plant is established, and the results show that the energy consumption of the regulated capture system can affect the water consumption of the power plant to some extent, and can obtain different economic trends [6]. The simulation results of the CO capture process in a natural gas combined cycle power plant are verified by an on-site industrial test. At the same time, based on the verified process parameters, the economic benefits of the CO capture process of the power plant were evaluated. The results show that the CO capture system of power plants with an MEA absorbent has the lowest economic cost of increasing the electricity at one time. By constructing a model of the post-combustion CO capture system in Aspen Plus software, the simulation study of the capture system under different absorbents, absorption towers and de-absorption towers is carried out; the economic performance under the optimal process parameters selected is analyzed; and the design scheme is obtained in order to make the carbon capture rate the lowest it can be [7,8]. By optimizing the stable operating parameters of each process of CO capture, [9,10] achieves the goal of minimizing the overall energy loss and economic operation of the system. By establishing different control objectives and adopting different control algorithms, ref. [11] uses the adaptive control of the system, enhances the robustness of the system and reduces the operating cost of the system.
The further MPC controller is used for the integrated PCC process through the MPC toolbox of Matlab [12]. The first nonlinear model predictive control (NMPC) is proposed for the PCC process [13]. Two NMPCs were designed therein to control the CO capture efficiency, and results showed the feasibility of NMPC in process control.
Based on the MPC, some works focus on the economic performance function of the PCC system: the method of economic model predictive control (EMPC) [14,15,16] is incorporated, the impact of the system carbon emission index and the poor liquid energy consumption index on the system are taken into account and the economic index is introduced to measure the economic performance, realizing the economic optimization control of the PCC system. The EMPC of CO capture is studied in [17]. It shows that EMPC can drive the processes to run in the most cost-effective way. Dynamic simulations show that EMPC can reduce the cost of carbon dioxide recovery, and that it possesses advantages in selecting optimal economic operation conditions, enabling pre-emptive economic decisions on post-carbon use costs.
Compared with previous studies, the novelty and contribution of this work lies in the application of the EMPC strategy, combined with the economic optimal function, to the PCC process, which ensures that the system runs under the economically optimal control strategy. In this paper, a state space model based on the subspace identification method is implemented to obtain the predictive model and the control of a post-combustion CO capture process based on MEA, consisting of an absorber, a stripper, a heat exchanger and a reboiler. The EMPC approach, similar to the one applied in [18] to PCC, permits tackling this energy cost problem, consisting of both the energy economy cost and dynamic control performance. The main contribution of this research work is the extension of EMPC approaches-mostly studied in the context of PCC systems-to identify the state space model using a subspace identification method on the Aspen Plus platform. The proposed method for optimizing the carbon emissions and the capture rate, considering the terminal constraints, is another novel contribution of this work.
The main structure of this paper is as follows: Section 2 gives the mathematical kinetics description of the carbon capture system and constructs a complete carbon capture process based on the chemical process and reaction kinetic analysis. Section 3 derives the principle of the EMPC algorithm and sets related control parameters. Section 4 performs dynamic tests based on dynamic models to identify actual system models. Section 5 uses three sets of simulations to study the impact of economic indicators on the system. Concluding remarks are presented at the end of this paper.
2. Carbon Capture Technology and Main Unit Models
As shown in Figure 1, the desulfurized furnace gas in the absorption unit is pressurized by the fan into the absorption unit; then, it chemically reacts with the MEA flowing into the top of the tower to remove CO from the furnace gas. The rich solvent absorbing CO flows from the bottom of the absorption unit and heats up after the solvent-rich pump is pressurized into the stripper unit [19]. In the desorption unit, a CO de-absorption effect is produced by the solvent-rich pump making contact with the steam in the reboiler., and the de-absorbed CO is purified to obtain a high-pressure CO gas. In order to ensure the stable operation of the system, water is replenished in the mixer to guarantee the system balance [18,20]. The phase equilibrium and kinetic reactions that occur in the CO-MEA-HO system are highly complex [21]. MEA and CO in the system mainly undergo water-phase reactions with each other, as shown in Table 1.
The chemical kinetic behavior that occurs in PCC is shown in Figure 1 and can be described by following Equations (1)–(3) [22]. Among them, component i is CO, N, HO, MEA, respectively.
Absorber and Stripper Models
Heat Exchanger
Reboiler
The meanings of the main symbol parameters in the above Formulas (1)–(3) are shown in Table 2:
3. Algorithm of Economic Model Predictive Control
This section details the mathematical description of the EMPC algorithm and describes its optimization design problems [23,24,25].
Suppose that the system characteristics can be represented by a constrained discrete time system, as shown in Equation (4):
Set the economic target function to and design the feedback rate to control the PCC, which means that the EMPC controller stabilizes the PCC system and approximates the PCC to its minimum average economic performance cost:
Defining steady-state optimization issues, this section builds a description of the predictive control of economic models based on terminal inequality constraints, as shown in Equations (6) and (7).
Assuming that the solutions of Equations (6) and (7) are unique, the EMPC control algorithm can find a solution function . In addition, we assume that another point, except the unique solution, can be found; this point is defined as . In the case of constraint , make ; this means that the state does not meets the constraint .
Differently from MPC, the economic performance function in EMPC is not necessarily positive for the optimal steady state. In EMPC, an economic real-time optimization performance objective in dynamic processes is used, other than the tracking target of steady-state points in MPC. The restriction of the steady-state constraints on the economic performance function is broken, and the economic function is directly used as the objective function of EMPC; the objective function and the constraints are shown in Equations (8) and (9). An EMPC problem is constituted based on terminal inequality constraints, which are written as [26].
In Equation (8), is the economic target function appointed in EMPC; is the terminal inequality constraint; is the time domain step of the EMPC prediction; is the set of terminal steady-state constraints; represents the tight terminal domain containing the steady-state point; is the state initial value of the EMPC at each rolling moment; and is the state initial value of the state variable of the k-moment state.
Supposing that the optimal solution to the optimization question is Equation (10):
The first element of the optimal solution set is used on the controlled plant to obtain the implicit control rate controlled by the forecast of the economic model, as shown in Equation (11).
The corresponding economic model predicts the control of the closed-loop system, as shown in Equation (12).
In order to ensure the stability of EMPC, Equation (12) should tend toward stabilizing gradually; hence the feasibility and stability should be analyzed [27].
Definition 1.
(Strict dissipation system): System is strictly dissipated relative to the supply rate s, if there are storage functions λ and positive function ρ, so that all Equation (13) set up; then, the system is a high open system.
Assumption 1.
(Constraint set nature): The collection is tight.
Assumption 2.
(Continuity of cost functions and systems): Functions , are continuous on set , and terminal cost functions are continuous on set Ω.
Assumption 3.
(Dissipative): System has an Equation (14) strict dissipation relative to the supply rate .
Assumption 4.
(Continuity of storage functions): Storage function is continuous on set .
Assumption 5.
(Stability hypothesis): There is a tight terminal domain , which contains a steady-state point and a control rate of γ, making Equation (15) valid.
Assumption 6.
For System (4), the supply function represented by Equation (16) is highly open.
Assumption 7.
Defines a given on collection X. If is continuous at the origin and , there is a function, as , which makes Equation (17) valid.
Theorem 1.
If the above assumptions are true, the closed-loop system (12) tends to stabilize gradually at the ideal steady-state value.
Thus, the rolling optimization problem of EMPC is transformed into the traditional MPC rolling optimization problem, because the two optimization problems have the same optimal solutions. According to the traditional MPC stability proof ideas, Theorem 1 is proven [28], and thus the closed loop stability of the closed-loop system (12) is proven.
4. EMPC for Post-Combustion CO Capture System Based on MEA
In order to study the application of the EMPC approach in the CO capture system, Aspen Plus software is used for a dynamic behavior simulation and modelling. First, the steady-state model established is shown in Figure A1, in Appendix A. The result of the stable condition simulation is used as an initial value of the operation. Once the steady-state convergence of the system has been guaranteed, pump and valve modules are added, the relevant pressure drop is set and the pressure is exported as the driving type into Aspen Plus Dynamics for the dynamic simulation. The parameters of the main valves and pumps are shown in Table 3 and an established dynamic PCC model is shown in Figure A2, in Appendix A. A proportional controller is appended to manipulate the flue gas flow rate and the lean solvent flow rate, and is then connected in series with the CO composition controller of the pure gas outlet. The purpose is to control the CO concentration in the pure gas by adjusting the lean solvent flow rate.
In order to verify the effectiveness of the dynamic model, an open-loop step response experiment is designed; that is, a ±20% step is performed and implemented when the flue gas flow rate is 468 kg/h, and the dynamic changes in the system under different flue gas flow rates are analyzed. The dynamic test results are shown in Figure 2.
From Figure 2, we can see that, when the flue gas flow rate increases by 20 percent (+20%), the CO concentration in the purified gas rapidly increases to an instant peak value. Hence, due to the presence of the composition controller, the ratio of the flue gas flow rate and the lean solvent flow rate increase in time to make the CO concentration return to the setpoint value. Due to the increase in the lean solvent flow rate, the outlet concentration of pure CO reduces slightly, and, at the same time, the temperature of the reboiler will also reduce, but will eventually stabilize at the setpoint value. When the flue gas flow rate is reduced by 20 percent (−20%), this situation is similar to those analyzed above.
The modeling data are generated by the Aspen Plus Dynamics simulation platform. The excitation signals shown in Figure 3 and Figure 4 are appended to the flue gas flow and lean solvent flow input ports, and the real output curve of the PCC system is shown in Figure 5.
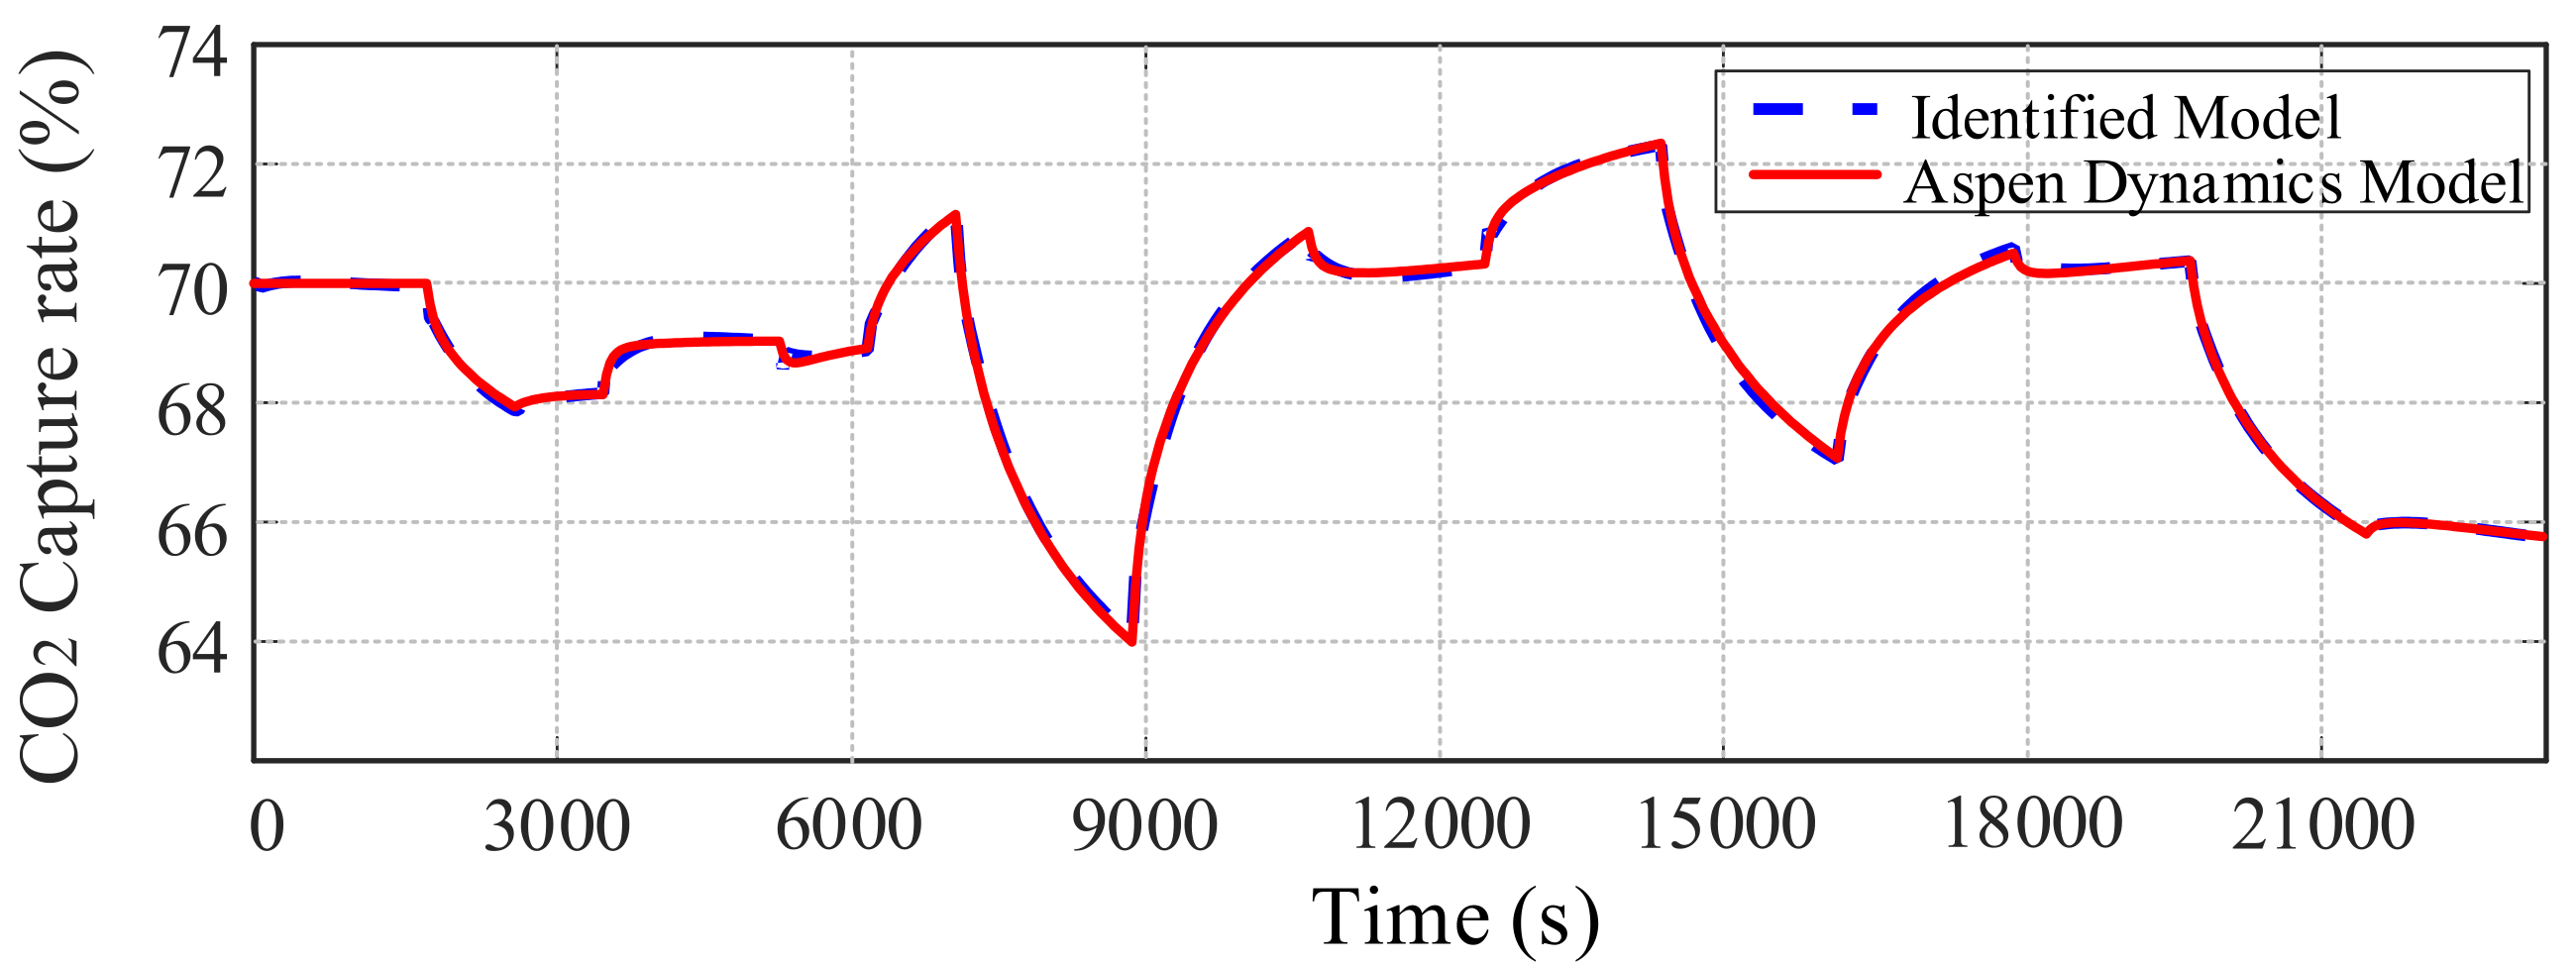
Next, the subspace identification approach is used, the state-space model of the PCC system is estimated directly using the obtained input and output data above and the sampling time is set to 36 s according to the sampling period of the actual system. The fitting curve between the real output and predicted output of the system is obtained, as shown in Figure 6. It can be known from the identification data that the system achieves a degree of fit of 96.42%, and a satisfactory fitting effect is obtained.
Through the open-loop disturbance experiment, it is no longer necessary to establish a complex mechanism model, as such a trade-off model is beneficial to increase the simulation speed and facilitate the establishment of a control strategy model. The state space equation system matrix of the flue gas flow and CO capture rate obtained by the System Identification toolbox in Matlab [29] are shown in Equation (18).
The system state space matrix between the lean solution flow rate and capture rate are shown in Equation (19).
Economic Performance Function Construction
Figure 7 is the schematic diagram of the economic predictive control of the PCC system.
According to the mathematical description of EMPC, the first step is to construct the economic performance index function in the schematic diagram. As shown in Equations (20)–(22) [30], the proportion of carbon emissions and lean solvent flow is comprehensively considered and combined with the capture rate. The difference between the actual capture rate of the system and the terminal constraint is taken as the third consideration factor. Hence, when the actual capture rate of the system is greater than the terminal constraint value, the value is not taken into consideration [31].
In the equation above, presents the performance index function of economic energy efficiency; is the lean solvent flow rate of the CO capture system after combustion; is the capture rate of the CO capture system after combustion; is the terminal constraint value of the system capture rate after steps are predicted; is the amount of CO emitted. The specific calculation equation of is shown in Equation (22). is the change rate corresponding to the system lean solvent flow; , and are the amount of CO emitted by the system, lean solvent flow and the corresponding terminal constraint weight. p is calculated by comparing the system terminal constraint value with the actual catch rate of the system, as shown in Equation (21). is the mass fraction of CO in the inlet flue gas.
5. Simulation and Analysis
In this section, three simulation scenarios are considered. Namely, the first scenario is that the PCC system needs a higher carbon capture rate to meet the policy requirements of environmental protection and sustainable development, or, it means that the current carbon price is high and that the enterprise needs to obtain higher economic benefits; then, the proportion of carbon emissions needs to reduce relatively. The second scenario is, considering the actual situation, after coal or fossil fuel combusts, the CO capture system may be affected by flue gas flow fluctuations from upstream power plants, which will have a certain effect on the alleged output. The third scenario is, assuming that the system capture rate runs up to 90% and that the flue gas flow is 0.130 kg/s and remains unchanged, respectively, in the initial state, both the model prediction control and the economic model prediction control are applied to the system to guarantee the dynamic behavior and economic performance of the PCC system.
Simulation scenario 1: Suppose the system needs a higher carbon capture rate in order to meet the policy requirements of environmental protection and sustainable development, or in the case that the current carbon price is high and the factory needs to obtain higher economic benefits, then the proportion of carbon emissions needs to increase relatively. Take = 40, = 3, = 7.
Assuming that, in the initial state, the system capture rate is 90% and the flue gas flow remains unchanged; the system runs stably under this condition, and the EMPC is carried out on the PCC system. The control parameters of the economic model prediction controller are: , , ; the range and rate of variation of the variables are shown in Table 4.
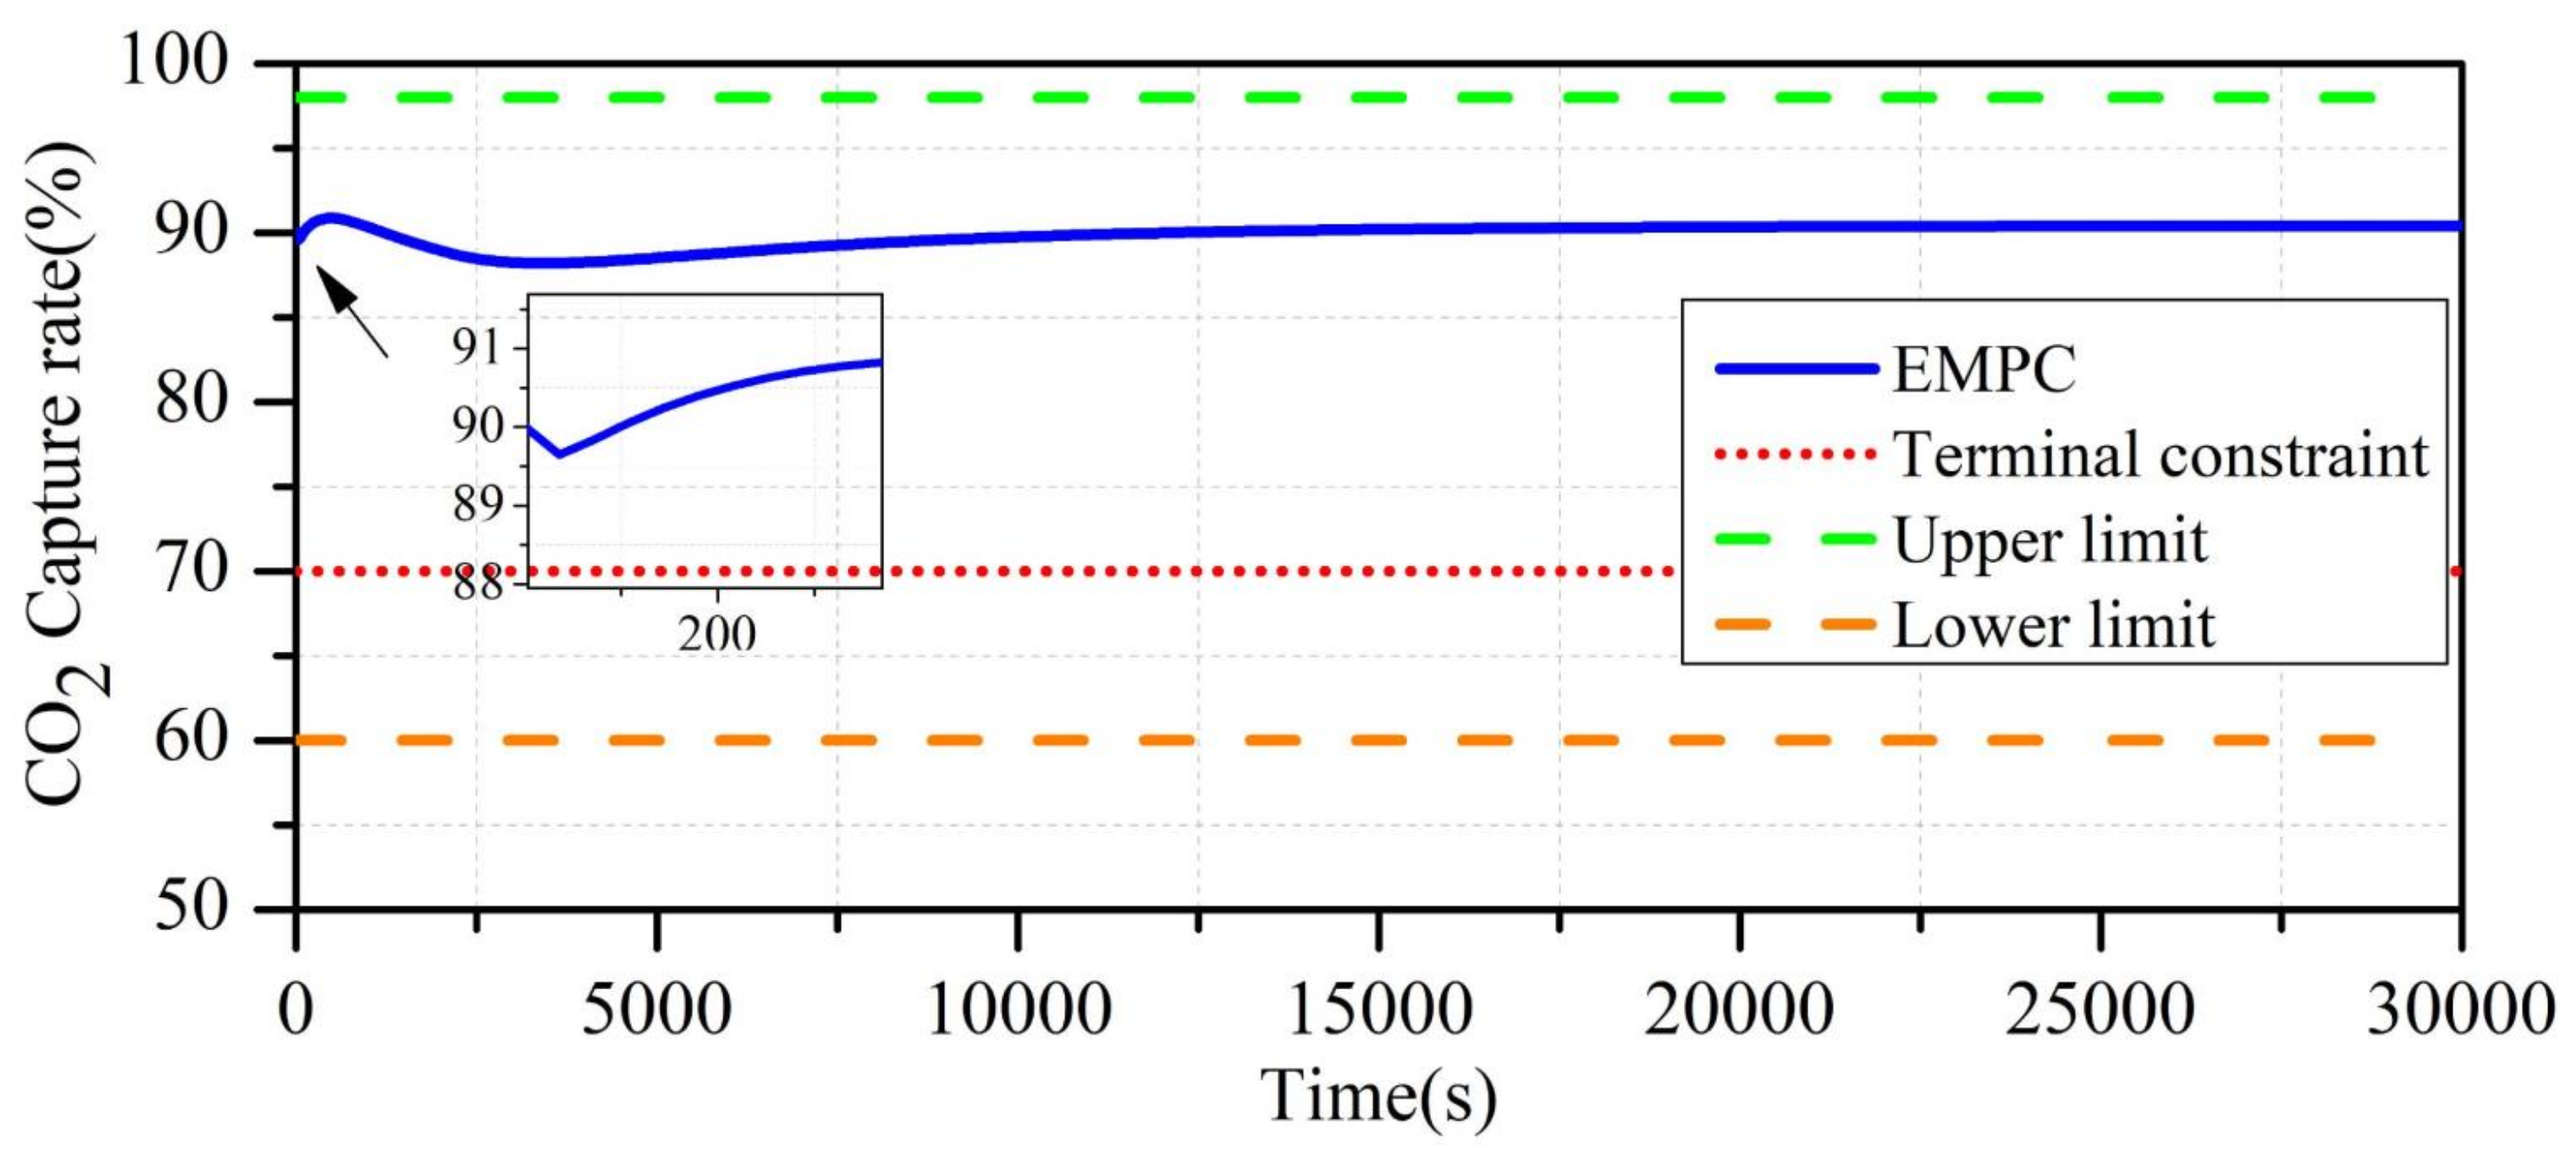
Based on the selection of the controller parameters above, the simulation results are shown in Figure 8.
From Figure 8, it can be seen that, when the carbon emission restraint weight in the economic performance index is large, in order to obtain a higher capture rate to meet the actual requirements, the controller stabilizes the system capture rate at 93% of the high capture rate level after three stages of small variety, and does not exceed the upper limit of the system capture rate change set by the controller to meet the terminal constraint requirements.
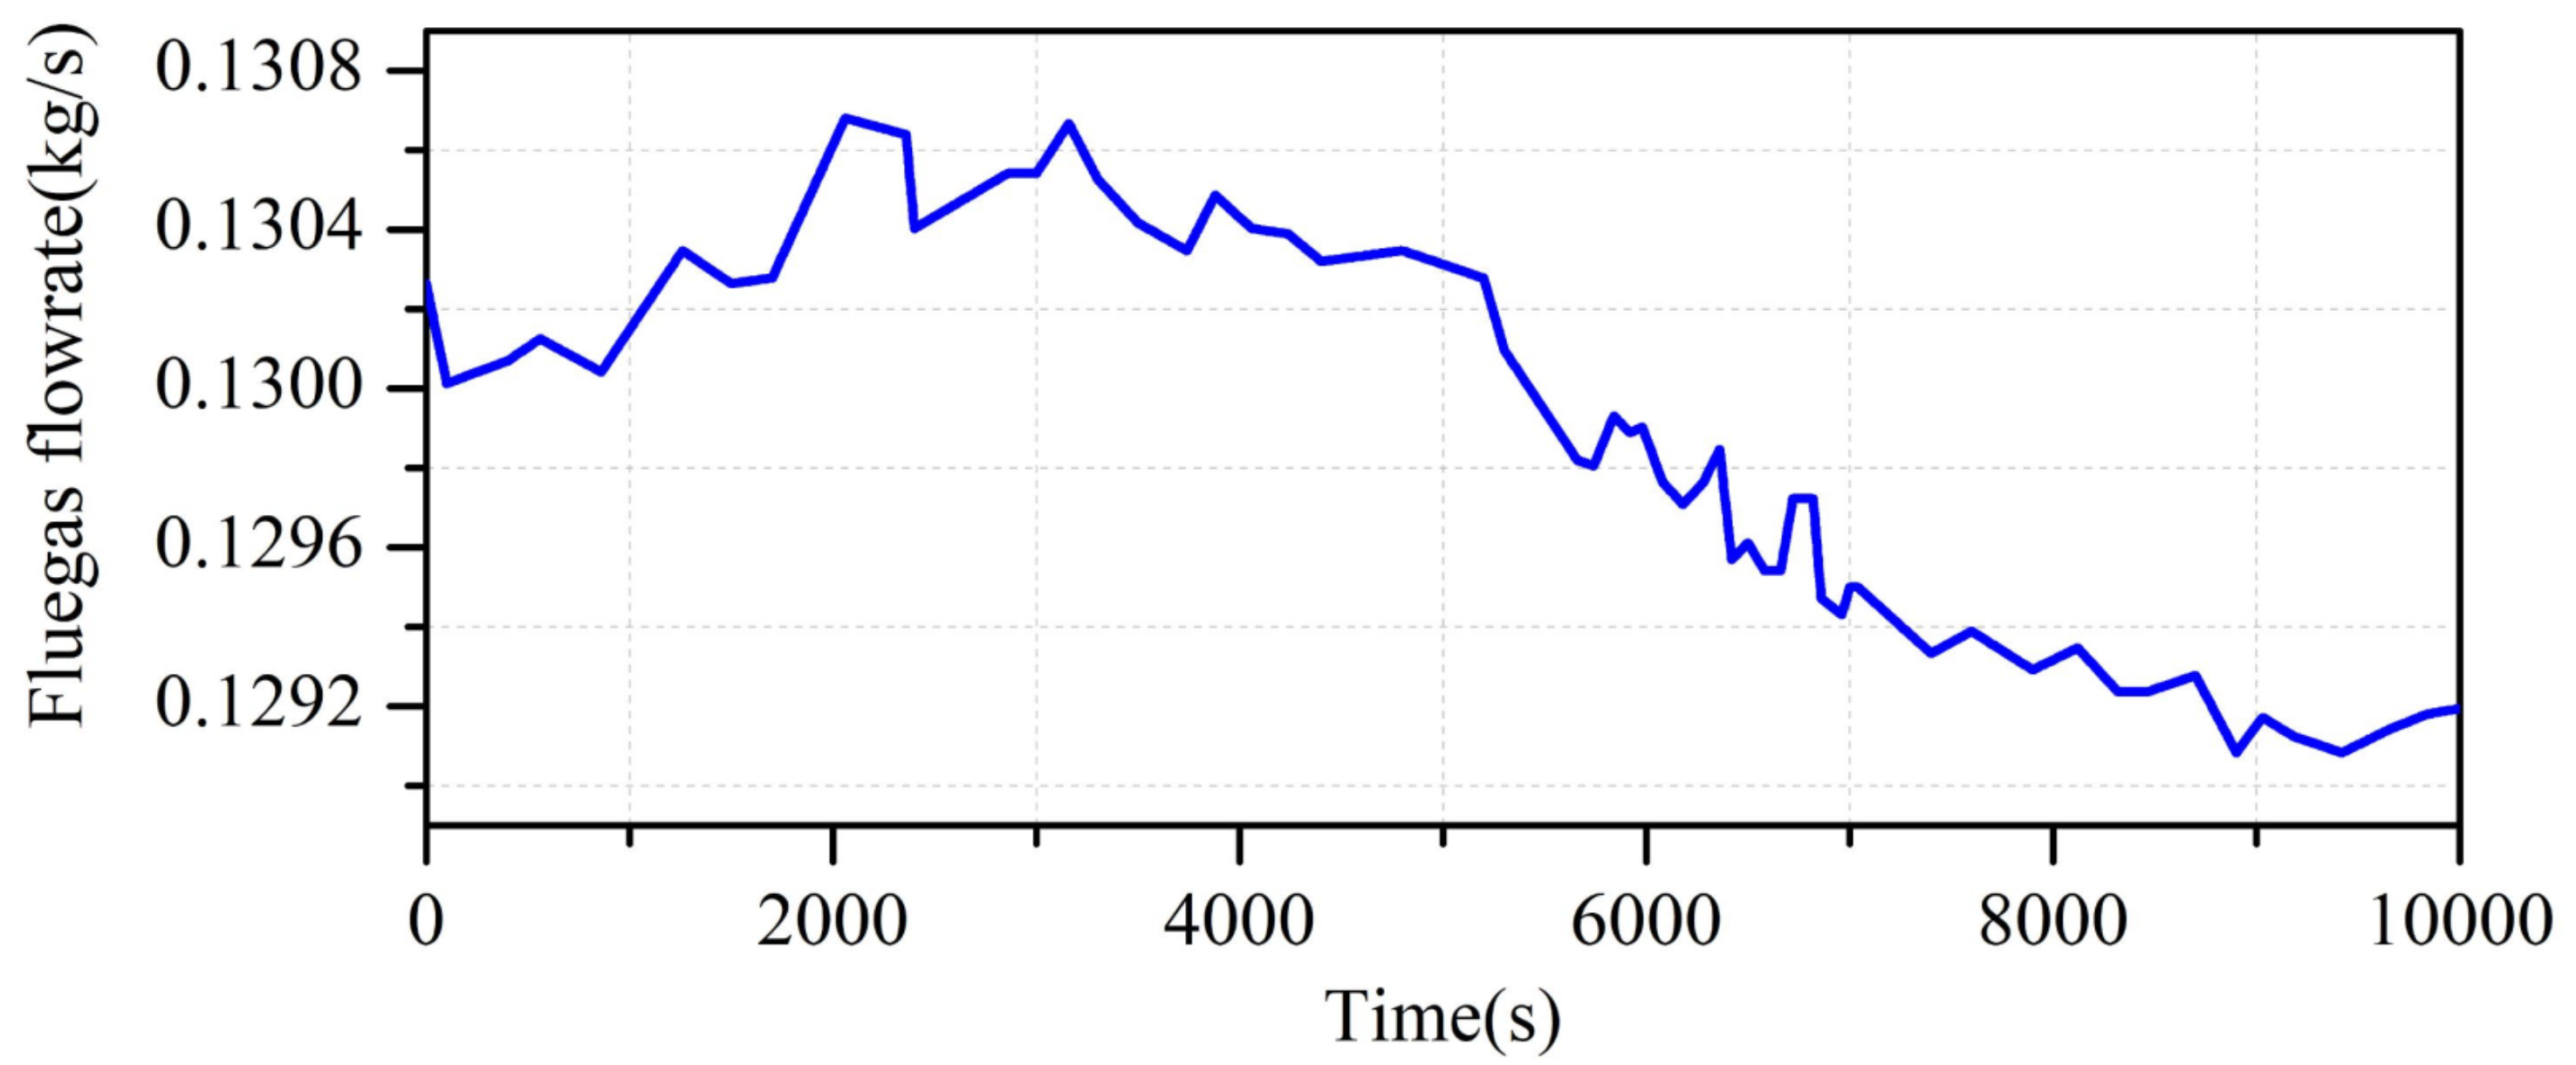
Simulation scenario 2: Considering the true situation in the actual production, after coal combustion, the CO capture system may be affected by flue gas flow fluctuations from upstream power plants, which will have a certain effect on the alleged output. Figure 9 simulates the small fluctuation trend of flue gas flow upstream of power plants. Assuming that, in the initial state, the system catch rate remains stable at 90%. The MPC control strategy and EMPC control strategy are applied to the system under flue disturbance. EMPC weights take = 50, = 2.8, = 7; the variation range and rate of the PCC system variables are shown in Table 3.
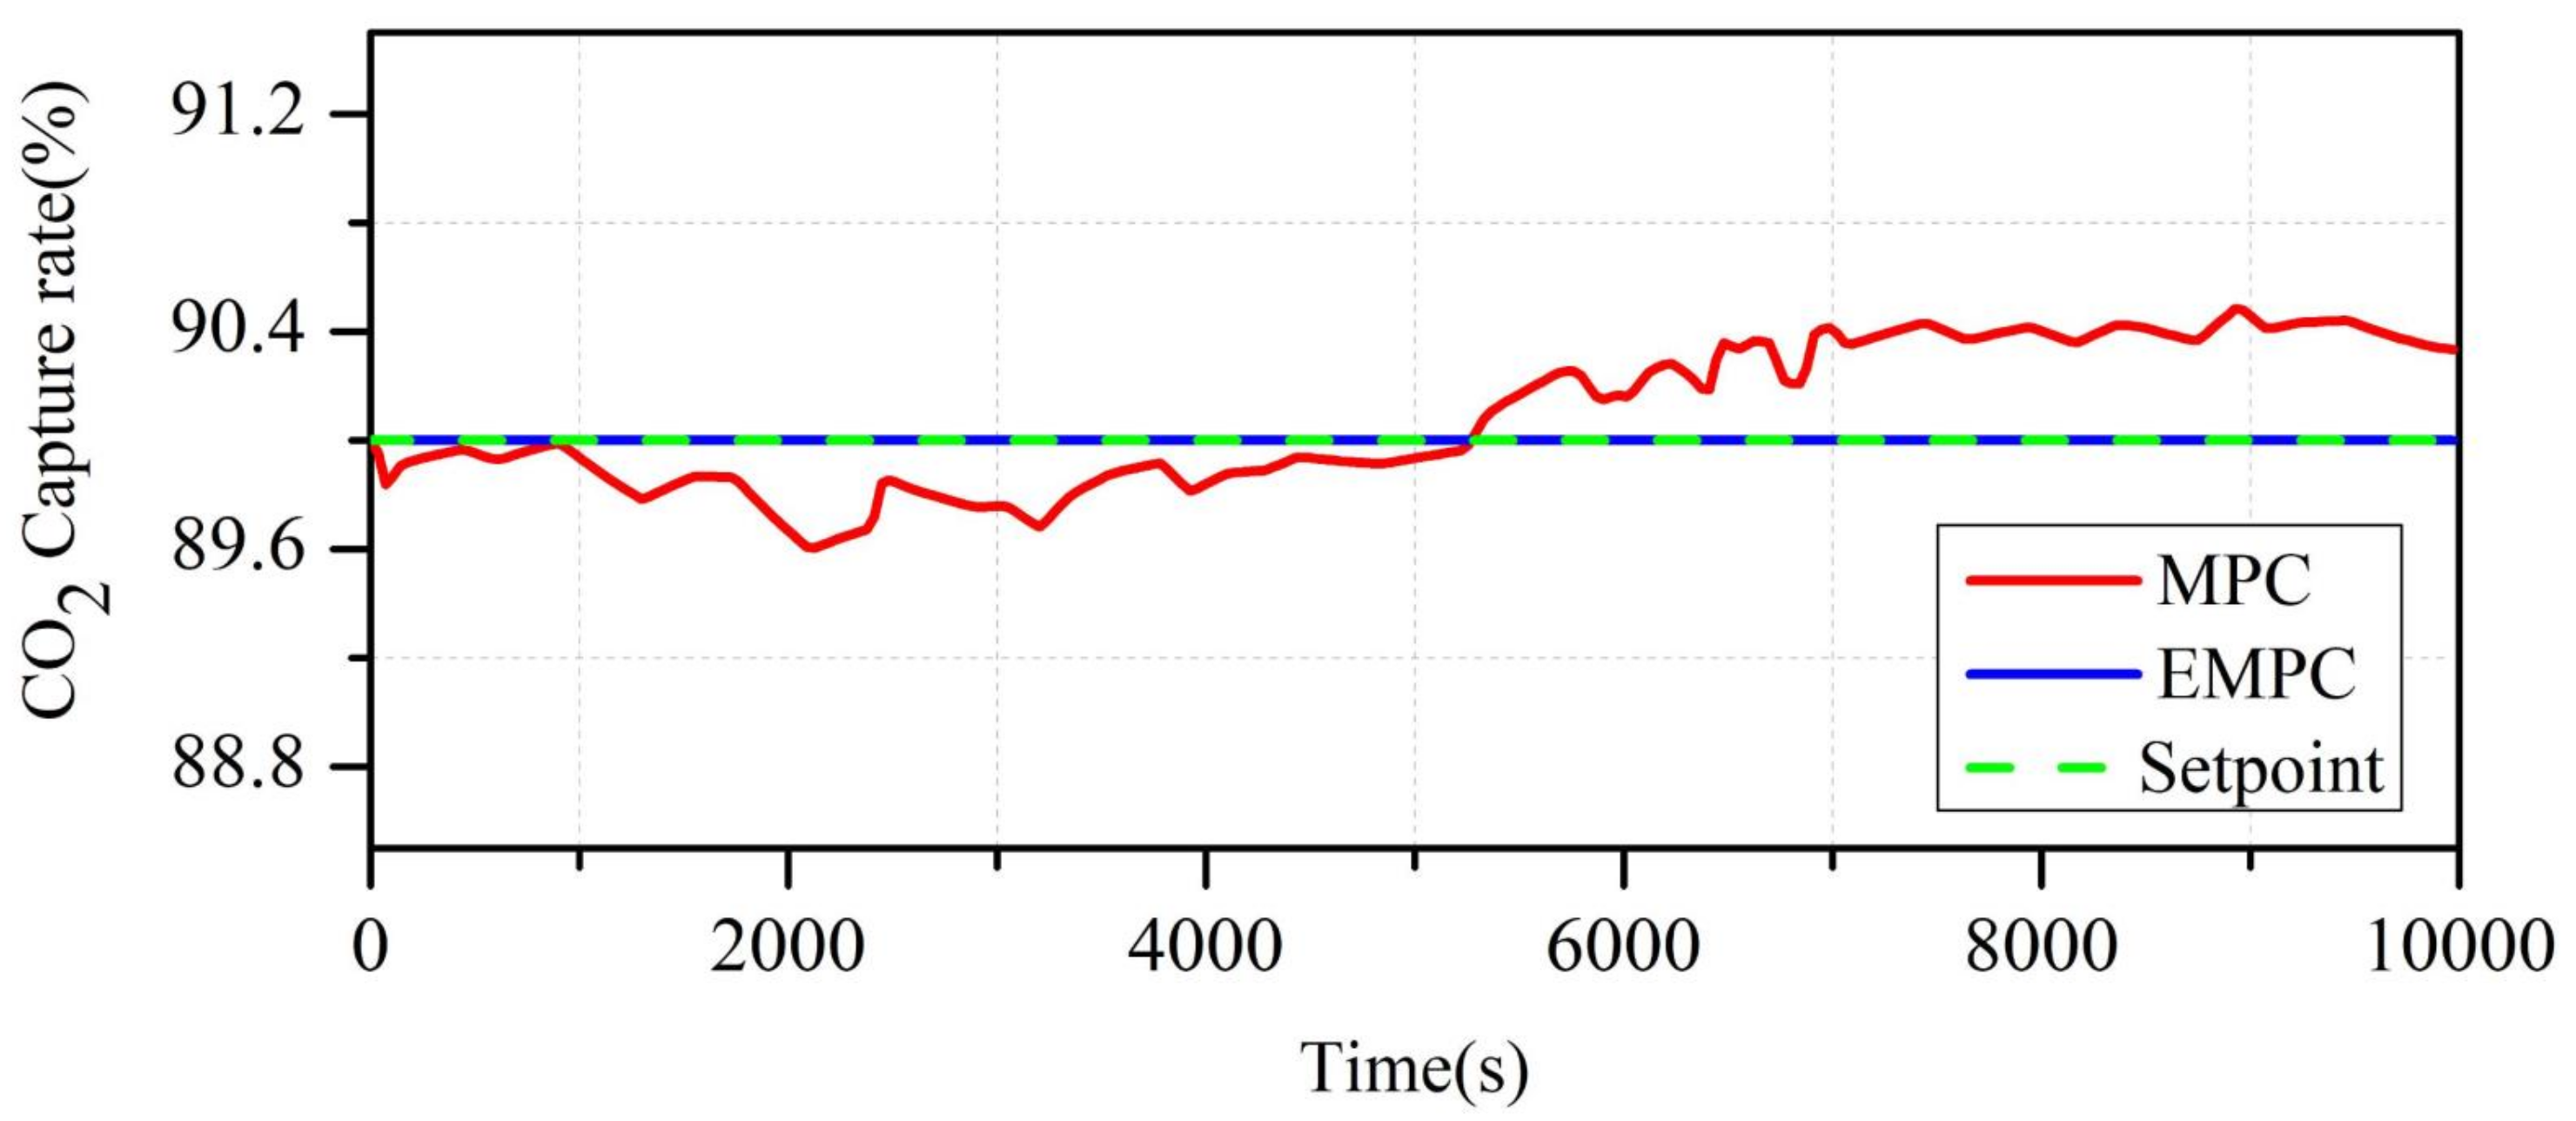
In Figure 10, the simulation results show that, when the flue gas flow changes in real time, the MPC controller constantly adjusts the control signals to maintain the original set value, so the MPC obtains the control increment adjustment signals , which are relatively frequent, and the control signal obtained by EMPC is basically maintained at 90% of the setpoint value. It can be seen that the EMPC in the system encountered the smoke real-time disturbance, and that it can still better control near its setpoint value.
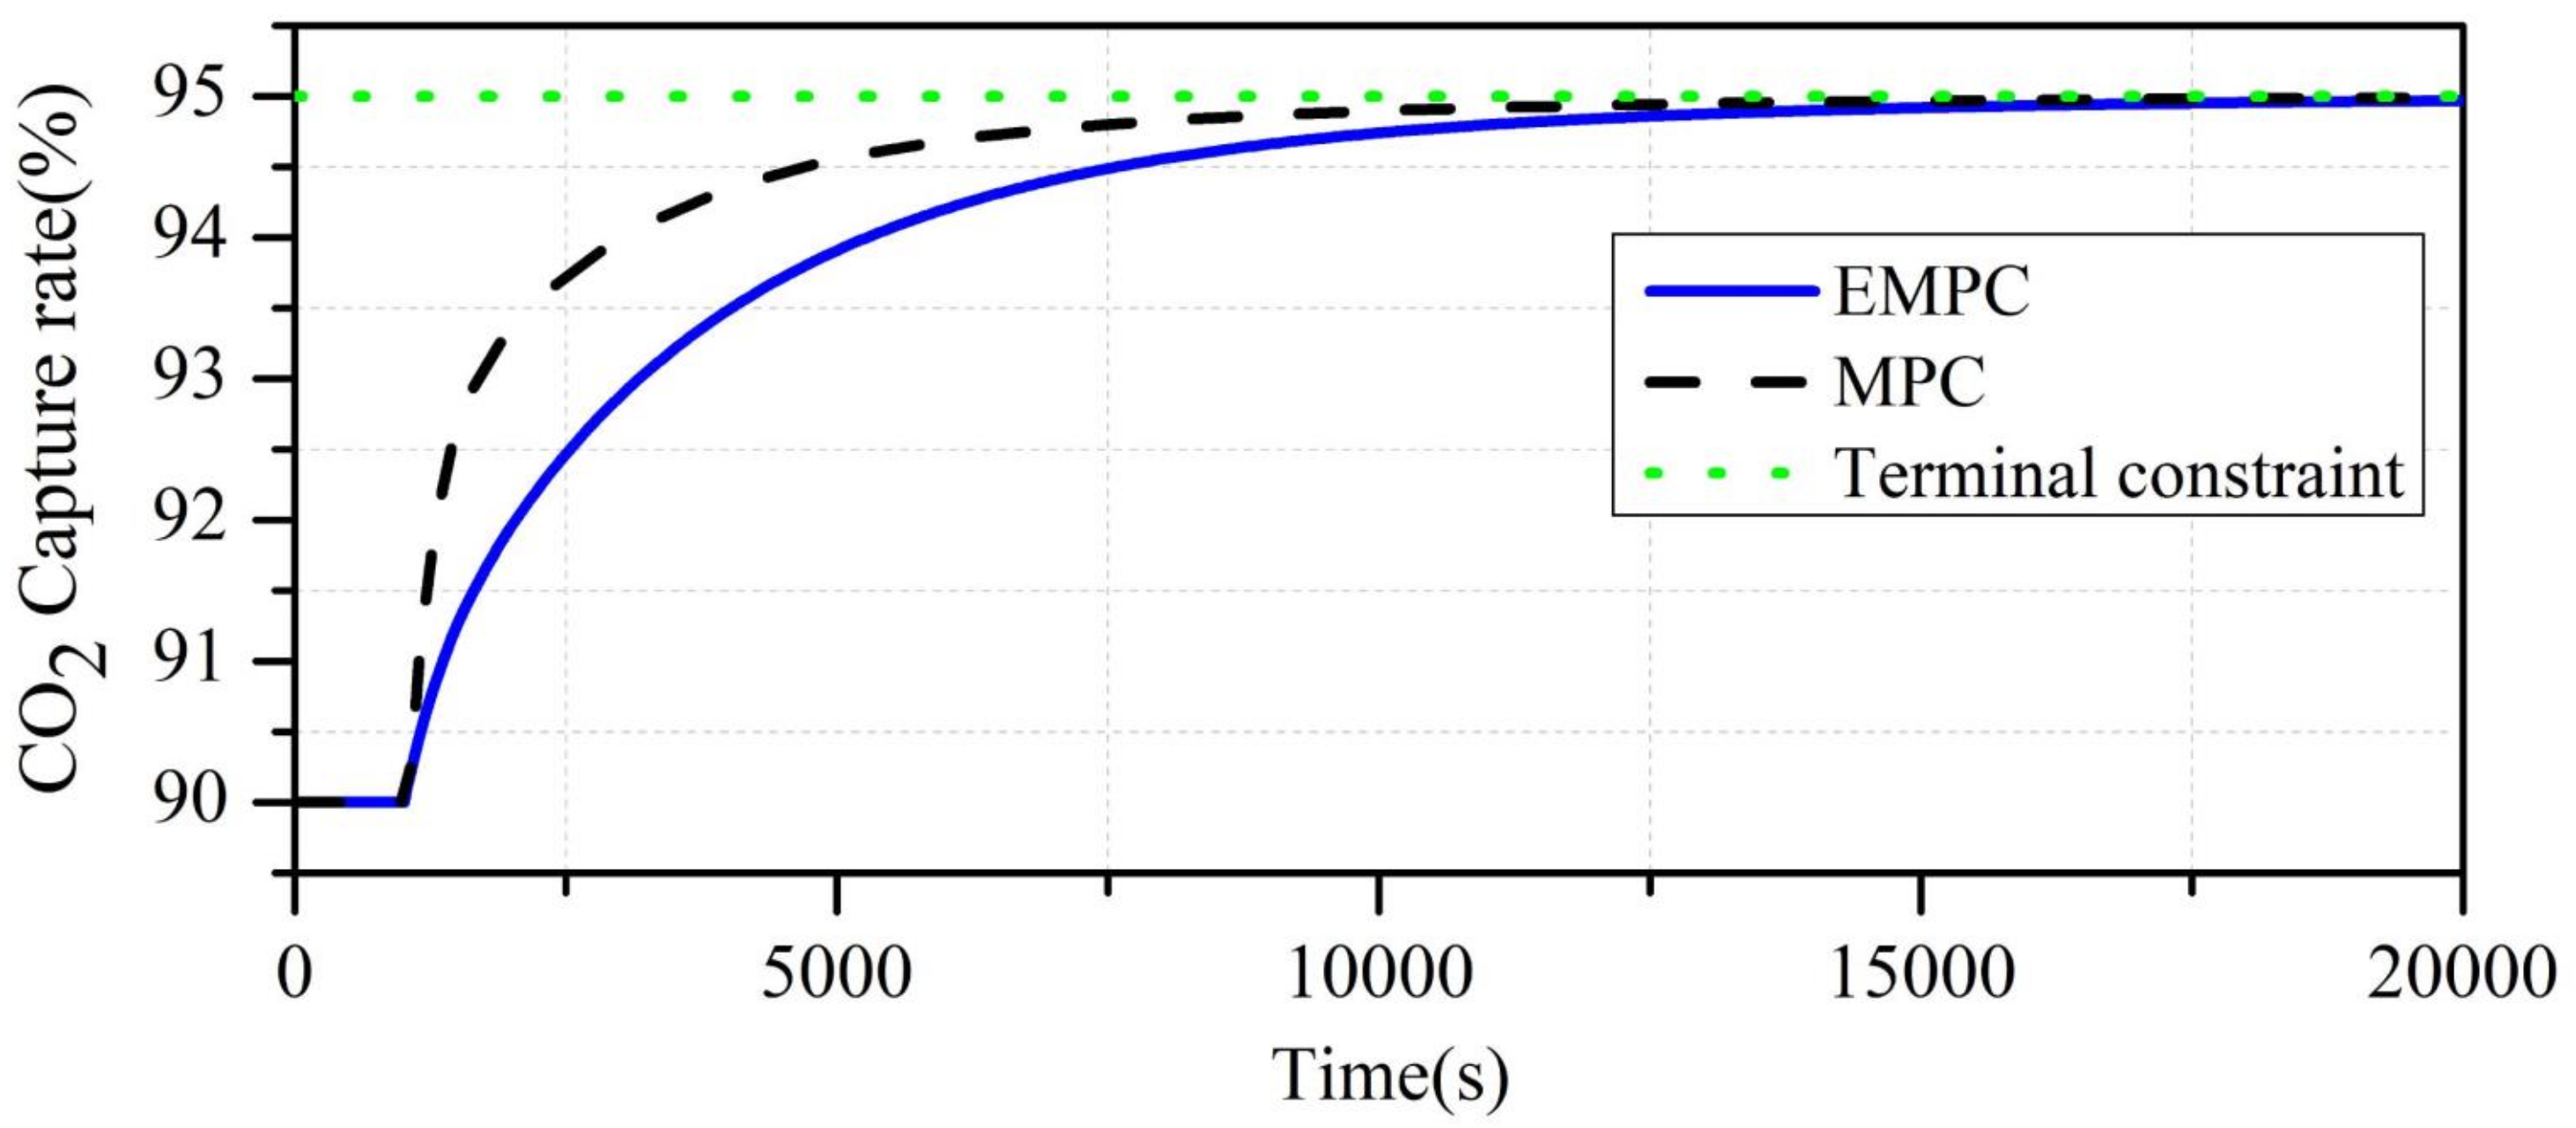
Simulation scenario 3: Assuming that all states are their initial states , the system capture rate is 90%, the flue gas flow rate is 0.130 kg/s and that they remain unchanged, the MPC and the EMPC are applied to the system, respectively.
For the MPC control strategy, at the initial moment, the MPC controller operates the PCC system steadily at a capture rate at percentage of 90 and a flue gas flow rate of 0.130 kg/s. When the system is running steadily at 1000 s, the setpoint value is increased from 90% to 95%. The parameters of MPC are: , , , , . For the EMPC control strategy, at the initial moment, the capture rate is set at 90% and the flue gas flow rate is 0.130 kg/s. The economic model prediction control is applied to the system when running at 1000 s. The terminal constraint is set to 95%, the control parameters selected by the economic model prediction controller are: , , and the variation range and rate of the variables are shown in Table 5.
In order to clearly compare the influence of MPC and EMPC on the economy of the PCC system, an index that reflects the economic performance is added, as shown in Equation (23).
Equation (23) brings two important indicators, including carbon emissions and the lean solvent flowrate , shown together in this equation, and the price factors correspond to the carbon emissions and the lean solvent flowrate , respectively. The greater the value and , the higher the price to pay, which means a poor economic performance. The weight is selected with simulation 2, and the simulation results are shown in Figure 11 and Figure 12.
The results of simulation scenario 3 show that the EMPC does not exceed 95% when running to 15,000 s, which meets the terminal constraints. Under the control of MPC and EMPC, the system can achieve the same steady state value. Compared with MPC, the process of EMPC’s controlled variables reaching the steady-state value is more smooth, and, from the analysis of economic indicators in Figure 12, the EMPC’s economic indicator value at each sampling point is less than MPC’s value, which achieves the combination of a satisfactory control effect and economic benefit.
6. Conclusions
Based on the concept of environmental protection, regarding the economic benefit and control effect of the enterprise, an EMPC algorithm is implemented to control a PCC system in this paper. The purpose is to compensate for the shortcomings of the traditional MPC algorithm, which cannot take the economy into account and cannot realize the economic optimality of the PCC system in dynamics. The main conclusions are as follows.
- The carbon emission index of the system and the energy consumption index of lean solvent are taken into account in the PCC system, and the economic optimization control of the carbon capture system can be realized under the condition of terminal constraints; thus, the employed EMPC controller can dynamically and flexibly adjust the relationship between its own carbon emission reduction function and lean solvent energy consumption. Through three simulation experiment scenarios, the economic performance of the proposed EMPC is verified, and the economic optimization control of the carbon capture system is realized;
- Based on the subspace identification method, the state space model of a PCC process based on MEA is identified on the Aspen Plus platform, which produces the identification data. The effectiveness of the identified model is verified by designing an open-loop step response experiment. The satisfactory fitting effect and dynamic test results validate the effectiveness of the identified model. Then, the identified model is used as a predictive model in both MPC and EMPC;
- Three simulation scenarios are considered in the validation. The simulation results show that, when the constraint weight of carbon emissions in the economic performance index is larger, in order to obtain a higher value of the capture rate to meet the actual requirements, the controller manipulates the PCC system though a small drop–rise–drop stage. The capture rate of the system is stable at the high capture rate level of 93%, and does not exceed the system capture rate set by the controller; then, it reaches the upper limit value in order to meet the terminal constraint requirements;
- The simulation results show that, when the flue gas flow rate changes slightly in real time, the MPC constantly adjusts the controlled variable to maintain it at its original value, so the MPC-controlled variable is adjusted relatively frequently. While the EMPC-controlled variable is basically at 90%, it can be seen that the EMPC has better results when the PCC system encounters a real-time disturbance of flue gas; the EMPC controller runs near the setpoint value in order to maintain the required capture rate;
- The result of simulation 3 shows that, when the EMPC runs to 15,000 s, it does not exceed 95%, which satisfies the terminal constraint. Under the action of the MPC and EMPC control, the PCC system can reach the same steady-state value. Compared with MPC, the controlled variable manipulated under the EMPC controller reaches the steady state value more gently. From the economic index analysis of Figure 12, at each sampling point, the PCC system under EMPC can obtain a larger economic index value, and a better control effect and economic benefit are realized.
Author Contributions
Conceptualization, C.M., A.A. and W.Z.; methodology, C.M. and W.Z.; validation, Y.Z., A.A. and W.Z.; formal analysis, investigation, C.M.; resources, Y.Z.; data curation, W.Z.; writing—original draft preparation, Y.Z.; writing—review and editing, C.M.; visualization, W.Z.; supervision, A.A.; project administration, A.A.; and funding acquisition, A.A. All authors have read and agreed to the published version of the manuscript.
Funding
This work was supported by the National Science Foundation of China (61563032, 61963025); Project (18JR3RA133) supported by Gansu Basic Research Innovation Group, China; Open Fund Project of Industrial Process Advanced Control of Gansu Province (2019KFJJ02).
Institutional Review Board Statement
Not applicable.
Informed Consent Statement
Not applicable.
Data Availability Statement
The data presented in this study are available on request from the corresponding author. The data are not publicly available due to the large amount of data from commercially available simulation software.
Conflicts of Interest
The authors declare no conflict of interest.
Abbreviations
The following abbreviations are used in this manuscript:
| CO | Carbon dioxide |
| CCUS | Carbon capture, utilization and storage |
| EMPC | Economic model predictive control |
| NMPC | Nonlinear model predictive control |
| MEA | Monoethanolamine |
| MPC | Model predictive control |
| PCC | Post-combustion CO capture |
Appendix A
Figure A1.
Schematic diagram of steady-state PCC process developed on the Aspen Plus platform.

Figure A2.
Schematic diagram of dynamic PCC process developed on the Aspen Plus Dynamics platform.

References
- Saeed, I.M.; Alaba, P.; Mazari, S.A.; Basirun, W.J.; Lee, V.S.; Sabzoi, N. Opportunities and challenges in the development of monoethanolamine and its blends for post-combustion CO2 capture. Int. J. Greenh. Gas Control 2018, 79, 212–233. [Google Scholar] [CrossRef]
- Li, H.; Dang, C.; Yang, G. Process intensification techniques towards carbon dioxide capture:a review. Int. J. Greenh. Gas Control. 2020, 39, 4919–4939. [Google Scholar]
- Duan, H.; Zhou, S.; Jiang, K.; Bertram, C.; Harmsen, M.; Kriegler, E.; van Vuuren, D.P.; Wang, S.; Fujimori, S.; Tavoni, M.; et al. Assessing China’s efforts to pursue the 1.5 °C warming limit. Science 2021, 372, 378–385. [Google Scholar] [CrossRef] [PubMed]
- Wang, D.; Wu, X.; Shen, J. An Efficient Robust Predictive Control of Main Steam Temperature of Coal-Fired Power Plant. Energies 2020, 13, 3775. [Google Scholar] [CrossRef]
- Wu, X.; Wang, M.; Shen, J.; Li, Y.; Lawal, A.; Lee, K.Y. Flexible operation of coal fired power plant integrated with post combustion CO2 capture using model predictive control. Int. J. Greenh. Gas Control 2019, 82, 138–151. [Google Scholar] [CrossRef] [Green Version]
- He, Z.; Sahraei, M.H.; Ricardez-Sandoval, L.A. Flexible operation and simultaneous scheduling and control of a CO2 capture plant using model predictive control. Int. J. Greenh. Gas Control. 2016, 48, 300–311. [Google Scholar] [CrossRef]
- Wang, F.; Deng, S.; Zhao, J. Analyses of energy and water consumption for coal-fired power plant with CO2 capture and system integration. J. Eng. Thermophys. 2016, 37, 2288–2295. [Google Scholar]
- Wu, X.; Wang, M.; Lee, K.Y. Flexible operation of supercritical coal-fired power plant integrated with solvent-based CO2 capture through collaborative predictive control. Energy 2020, 206, 118105. [Google Scholar] [CrossRef]
- Oexmann, J.; Kather, A.; Linnenberg, S.; Liebenthal, U. Post-combustion CO2 Capture: Chemical Absorption Processes in Coal-fired Steam Power Plants. Greenh. Gases Sci. Technol. 2012, 2, 80–98. [Google Scholar] [CrossRef]
- Panahi, M.; Skogestad, S. Economically efficient operation of CO2 capturing process part I: Self-optimizing procedure for selecting the best controlled variables. Chem. Eng. Process. Process Intensif. 2011, 50, 247–253. [Google Scholar] [CrossRef]
- Panahi, M.; Skogestad, S. Economically efficient operation of CO2 capturing process. Part II. Design of control layer. Chem. Eng. Process. Process Intensif. 2012, 52, 112–124. [Google Scholar] [CrossRef]
- Zhang, Q.; Turton, R.; Bhattacharyya, D. Nonlinear model predictive control and robust control for a post-combustion CO2 capture process. Int. J. Greenh. Gas Control 2018, 70, 105–116. [Google Scholar] [CrossRef]
- Gabriel, D. Patron and Luis Ricardez-Sandoval. A robust nonlinear model predictive controller for a post-combustion CO2 capture absorber unit. Fuel 2020, 265, 116932. [Google Scholar]
- Luu, M.T.; Manaf, N.A.; Abbas, A. Dynamic Modelling and Control Strategies for Flexible Operation of Amine-based Post-combustion CO2 Capture Systems. Int. J. Greenh. Gas Control. 2015, 39, 377–389. [Google Scholar] [CrossRef]
- Lin, Y.J.; Chang, C.C.; Wong, D.S.H.; Jang, S.S.; Ou, J.J. Control Strategies for Flexible Operation of Power Plant Integrated with CO2 Capture Plant. AIChE J. 2012, 30, 237–241. [Google Scholar]
- Li, Z.; Ding, Z.; Wang, M.; Oko, E. Model-free Adaptive Control for MEA-based Post-combustion Carbon Capture Processes. Fuel 2018, 224, 637–643. [Google Scholar] [CrossRef] [Green Version]
- Arce, A.; Mac Dowell, N.; Shah, N.; Vega, L.F. Flexible Operation of Solvent Regeneration Systems for CO2 Capture Processes Using Advanced Control Techniques: Towards Operational Cost Minimization. Int. J. Greenh. Gas Control. 2012, 11, 236–250. [Google Scholar] [CrossRef]
- Chan, L.L.T.; Chen, J. Improving the energy cost of an absorber-stripper CO2 capture process through economic model predictive control. Int. J. Greenh. Gas Control 2018, 76, 158–166. [Google Scholar] [CrossRef]
- Wu, X.; Wang, M.; Liao, P.; Shen, J.; Li, Y. Solvent-based post-combustion CO2 capture for power plants: A critical review and perspective on dynamic modelling, system identification, process control and flexible operation. Appl. Energy 2020, 257, 113941. [Google Scholar] [CrossRef]
- Li, X.; Wang, S.; Chen, C. Investigation of the Dynamic Behavior and Control Strategies for a CO2 Capture System Using Amine Solution. Proc. CSEE 2014, 34, 1215–1223. [Google Scholar]
- Decardi-Nelson, B.; Liu, S.; Liu, J. Improving flexibility and energy efficiency of post-combustion CO2 capture plants using economic model predictive control. Processes 2018, 6, 135. [Google Scholar] [CrossRef] [Green Version]
- Harun, N.; Nittaya, T.; Douglas, P.L.; Croiset, E.; Ricardez-Sandoval, L.A. Dynamic simulation of MEA absorption process for CO2 capture from power plants. Int. J. Greenh. Gas Control 2012, 10, 295–309. [Google Scholar] [CrossRef] [Green Version]
- He, D.-F. Stabilizing economic model predictive control of constrained nonlinear systems. Acta Autom. Sin. 2016, 42, 1680–1690. [Google Scholar]
- Huang, J.; Li, H. Switching control-based economic model predictive control. Control Decis. 2016, 31, 137–142. [Google Scholar]
- Wang, N.; An, A. Hierarchical Model Predictive Control Strategy Based on Model Switching Considering Economic Benefits. Control Eng. China 2019, 26, 2141–2146. [Google Scholar]
- Biliyok, C.; Lawal, A.; Wang, M.; Seibert, F. Dynamic modelling, validation and analysis of post-combustion chemical absorption CO2 capture plant. Int. J. Greenh. Gas Control 2012, 9, 428–445. [Google Scholar] [CrossRef]
- Santander, O.; Elkamel, A.; Budman, H. Economic Model Predictive Control of Chemical Processes with Parameter Uncertainty. Comput. Chem. Eng. 2016, 95, 10–20. [Google Scholar] [CrossRef]
- Clarke, W.C.; Manzie, C.; Brear, M.J. Hierarchical economic MPC for systems with storage states. Automatica 2018, 94, 138–150. [Google Scholar] [CrossRef]
- Li, Q.; Zhang, W.; Qin, Y.; An, A. Model Predictive Control for the Process of MEA Absorption of CO2 Based on the Data Identification Model. Processes 2021, 9, 183. [Google Scholar] [CrossRef]
- Akinola, T.E.; Oko, E.; Wu, X.; Ma, K.; Wang, M. Nonlinear model predictive control (NMPC) of the solvent-based post-combustion CO2 capture process. Energy 2020, 213, 118840. [Google Scholar] [CrossRef]
- Wang, Y.; Puig, V.; Cembrano, G. Non-linear economic model predictive control of water distribution networks. J. Process Control 2017, 56, 23–34. [Google Scholar] [CrossRef] [Green Version]
Figure 1.
A general schematic diagram of the post-combustion CO capture process based on MEA.

Figure 2.
Dynamic test: (a) flue gas flow rate; (b) lean solvent flow rate; (c) pure gas CO mass fraction; (d) pure CO-out CO mass fraction; (e) reboiler extracted steam flow rate; (f) reboiler temperature.
Figure 2.
Dynamic test: (a) flue gas flow rate; (b) lean solvent flow rate; (c) pure gas CO mass fraction; (d) pure CO-out CO mass fraction; (e) reboiler extracted steam flow rate; (f) reboiler temperature.

Figure 3.
Inlet flue gas flow rate excitation signal.

Figure 4.
Inlet lean solvent flow rate excitation signal.

Figure 5.
The actual output of the CO capture system.

Figure 6.
Comparison of subspace identification results.

Figure 7.
Economic forecast control schematic of the CO capture system after combustion.

Figure 8.
Economic model predictive control of post-combustion CO capture system.

Figure 9.
Flue gas flow fluctuations.

Figure 10.
Comparison of MPC and EMPC control under flue gas disturbance.

Figure 11.
The change curve of the catch rate of the CO capture system after combustion.

Figure 12.
Comparison of economic indicator values.


Table 1.
Chemical equation.
| Reaction Type | Reaction Equation |
|---|---|
| Carbamate reversion to bicarbonate: | MEA + HCO3− |
| MEAH+ + H2OMEA + H3O+ | |
| CO2 + 2H2OH3O+ + HCO3− | |
| HCO3− + H2O H3O+ + CO32− | |
| 2H2O H3O+ + OH− | |
Table 2.
Main operating parameters.
| Notation | Description | Notation | Description |
|---|---|---|---|
| C/ (kmol/m) | Liquid/gas phase concentration of component i | (kJ/mol) | Average molar liquid heat capacity |
| / (m/s) | Liquid/gas volume flow | T (K) | Temperature |
| (m) | Column inner diameter | V (m) | Volume |
| l (m) | Column height | (m/s) | Volume flow rate |
| (kJ/s) | Heat transfer rate | (kmol/ms) | Mass transfer rate |
| (kJ/mol) | Heat capacity | (kmol/m) | Average molar density |
| Q (kJ/ms) | Heat transfer rate | H (kJ) | Enthalpy |
| (m/m) | Specific packing area | (kJ/s) | Heat input |
Table 3.
Valve and pump parameters in PCC process.
| Valve/Pump | V1 | V2 | V6 | ∖ | V3 | V4 | V5 |
|---|---|---|---|---|---|---|---|
| Outlet pressure (Mpa) | 2.014 | 2 | 2.09 | Pressure drop (Kpa) | 10 | 10 | 10 |
| Controller action | Reverse | Reverse | Reverse | ∖ | Direct | Direct | Reverse |
| Valid phases | Vapor-only | Liquid-only | Liquid-only | ∖ | Liquid-only | Vapor-only | Vapor-only |
Table 4.
Simulation 1: The range and rate of change in EMPC variables.
| Type | The Range of Changes | The Rate of Change |
|---|---|---|
| Lean solvent flue gas | 0.1–0.8 kg/s | ≤0.00015 kg/s |
| CO capture rate | 50–98% | ∖ |
Table 5.
Simulation 3: The range and rate of change in EMPC variables.
| Type | The Range of Changes | The Rate of Change |
|---|---|---|
| Lean solvent flue gas | 0.1–0.8 kg/s | ≤0.00015 kg/s |
| CO capture rate | 70–95% | ∖ |
Publisher’s Note: MDPI stays neutral with regard to jurisdictional claims in published maps and institutional affiliations. |
© 2021 by the authors. Licensee MDPI, Basel, Switzerland. This article is an open access article distributed under the terms and conditions of the Creative Commons Attribution (CC BY) license (https://creativecommons.org/licenses/by/4.0/).
Share and Cite
MDPI and ACS Style
Ma, C.; Zhang, W.; Zheng, Y.; An, A. Economic Model Predictive Control for Post-Combustion CO2 Capture System Based on MEA. Energies 2021, 14, 8160. https://0-doi-org.brum.beds.ac.uk/10.3390/en14238160
AMA Style
Ma C, Zhang W, Zheng Y, An A. Economic Model Predictive Control for Post-Combustion CO2 Capture System Based on MEA. Energies. 2021; 14(23):8160. https://0-doi-org.brum.beds.ac.uk/10.3390/en14238160
Chicago/Turabian StyleMa, Chenbin, Wenzhao Zhang, Yu Zheng, and Aimin An. 2021. "Economic Model Predictive Control for Post-Combustion CO2 Capture System Based on MEA" Energies 14, no. 23: 8160. https://0-doi-org.brum.beds.ac.uk/10.3390/en14238160
Note that from the first issue of 2016, this journal uses article numbers instead of page numbers. See further details here.