
Current Harmonic Aggregation Cases for Contemporary Loads
by
 , , , and
Kamran Daniel
1,2, 
Lauri Kütt
1,
Muhammad Naveed Iqbal
1,3,* ,
,
Noman Shabbir
1 ,
,
Ateeq Ur Rehman
3,
Muhammad Shafiq
4,* and
Habib Hamam
5,6,7 1
Department of Power Engineering and Mechatronics, Tallinn University of Technology, Ehitajate tee 5, 19086 Tallinn, Estonia
2
Department of Electrical, Electronics and Telecommunication Engineering, FSD Campus, University of Engineering and Technology, Lahore 54890, Pakistan
3
Department of Electrical Engineering, Government College University, Lahore 54000, Pakistan
4
Department of Information and Communication Engineering, Yeungnam University, Gyeongsan 38541, Korea
5
Faculty of Engineering, Université de Moncton, Moncton, NB E1A3E9, Canada
6
Spectrum of Knowledge Production & Skills Development, Sfax 3027, Tunisia
7
Department of Electrical and Electronic Eng. Science, School of Electrical Engineering, University of Johannesburg, Johannesburg 2006, South Africa
*
Authors to whom correspondence should be addressed.
Energies 2022, 15(2), 437; https://0-doi-org.brum.beds.ac.uk/10.3390/en15020437
Submission received: 5 December 2021
/
Revised: 29 December 2021
/
Accepted: 5 January 2022
/
Published: 8 January 2022
(This article belongs to the Special Issue Power Transmission and Distribution Equipment and Systems)
Abstract
:Power electronic circuits in modern power supplies have improved the conversion efficiency on the one hand but have also increased harmonic emissions. Harmonic currents from the operation of these units affect the voltage waveforms of the network and could compromise the reliability of the network. Load and source non-linearity can, therefore, limit the renewable source’s hosting capacity in the grid, as a large number of inverter units may increase the harmonic distortions. As a result, voltage and current distortions could reach unbearable levels in devices connected to the network. Harmonic estimation modelling often relies on measurement data, and differences may appear in mathematical simulations as the harmonic aggregation or cancellation may generate different results due to the inaccuracies and limitations of the measurement device. In this paper, the effect of harmonic currents cancellation on the aggregation of different load currents is evaluated to show its impact in the network by presenting a comparison between the measurement and mathematical aggregation of harmonics. Furthermore, the harmonic cancellation phenomenon is also qualified for multiple loads connected to the power supply.
1. Introduction
Hosting capacity (HC) evaluation for the inclusion of renewable energy production and storage units, including photovoltaic inverters, battery chargers, etc., is one of the tasks that must be carried out in distribution network planning. In [1], the historical outline of HC assessment is explained and the HC of low voltage networks is illustrated by increasing the number of electric vehicle (EV) chargers or photovoltaic (PV) panels [2]. The performance index calculation requires a network model, partial input data, and Monte Carlo simulation to indicate the uncertainties. Different approaches for HC, which are deterministic, stochastic, and time-series are outlined in [3]. These approaches use unique uncertainties, computation time, precision, input data, and models. A detailed investigation and mitigation of challenges associated with power quality when renewable distribution systems are integrated into a grid are presented in [4] For example [5], ideas are presented to forecast the HC of the distribution network as they make up important tools to plan the distribution network and predict the impact on power quality due to the integration of the PV system.
HC can be more accurately assessed if the harmonic profile of contemporary loads is analyzed along with the harmonic profile of future loads and sources such as EV and PV inverters [6]. For environmentally sustainable electricity production and use, the number of solar plants and EVs is increasing annually; this impacts the distribution network in terms of power quality. Measurements can provide a closer insight into the solar inverter effect on THDv of the supply voltage [7].
As most contemporary loads implement power electronic converters at the load side, their non-linear characteristics are a reason for feeding harmonic currents into networks. This has an influence on the voltage distortion parameters of an AC power system. In order to have a power system with credible power quality indices [8,9], it is essential to determine the contribution of harmonic content injected devices connected to the electrical grid [10]. Voltage distortion not only influences a single consumer, but affects all other consumers sharing the same network [11,12]. To deliver the least distorted voltage to consumers, the network operator must take actions to leverage voltage distortions.
Current harmonics can be represented as phasors with RMS and phase angle values; in such a manner, harmonic components are rotating vectors with real and imaginary parts in the complex plane. In a distribution network where multiple non-linear loads are connected, it is likely that the different harmonic load currents not only have different RMS component values but also harmonic phase angle values. As a result, various combinations of similar loads could lead to variations in the aggregated harmonic current. In order to find the total harmonic currents loading the substation, the individual load harmonics have to be summed geometrically. The total harmonic current from the multiple devices can be significantly lower than the arithmetic sum of individual current magnitudes due to diversity in the harmonic phase angles [13].
Harmonic voltages with different magnitudes and phase angles can cause changes in load current harmonics both in RMS and phase [14]. In addition, both the voltage and current distortions vary with different loading levels and are time-varying PQ characteristics. Hence, it is highly complex to accurately determine current harmonics magnitude and phase angle values for every time instant [15]. Summation coefficients are provided by IEC standard 61000-3-6 to perform the summation of harmonic magnitudes [16]. The IEC standard has suggested rules based on summation coefficients, if using harmonic current magnitudes. Furthermore, there are several other influences to current harmonic RMS levels and phase angle values. The impact on harmonic current variation due to the impedance of cables attached to LED lamps was studied in [17].
One of the most straightforward approaches to determine the expected load harmonic current fingerprint is the measurement of the loads. This must also include aspects of sensitivity [18]. For example, the thermal stability of loads refers to the temperature stability when performing measurements; for example, LED lamps and power supplies require roughly forty minutes [19]. The average variation interrelation of higher-order harmonic currents increases with an increase in the number of loads connected simultaneously [20]. Similarly, in [21] the aggregation result was compared to measurement data with multiple loads connected simultaneously, showing that higher-order harmonics vary more significantly than lower-order harmonics. In addition, higher-order harmonic current vectors are spread out more compared to lower-order harmonics. THDI was observed with an average reduction of up to 10% due to the harmonic currents’ cancellation effect.
This paper focuses on the practical aspects of the aggregation of the harmonic emission at the point of common coupling; this is usable, for example, in the case of simplified measurements of RMS harmonic currents in the estimation of load and source HC. The scale and accuracy of harmonic component summation are measured and compared with the values obtained from a single load measurement. Combinations of loads are tested for the total harmonic load currents’ estimation. The analysis is based on measurements performed for different numbers of combinations of loads operating simultaneously. The harmonic estimation of multiple loads operating at the same time presents an approximate occurrence of cancellation that may happen when multiple devices are operating. Not accounting for the cancellation would lead to pessimistic harmonic estimation, in turn leading to lower hosting capacity estimation.
2. Harmonic Variation and Summation
Harmonic current can be represented as complex phasor quantities; measured values are RMS and phase angle. Therefore, in order to perform aggregation, the amplitude and phase form can be converted to real and imaginary components in the complex plane using the following formulas. Harmonic aggregation is performed using Equation (1).
f1 is the frequency of fundamental component, h is the harmonic number, and is the phase shift to corresponding h number. The real and imaginary values of the any harmonic phasor are:
and a modulus of them will be:
As root-mean-square values can be used to present phasor magnitudes, the RMS value of any harmonic and total RMS current can be calculated using the equation below.
Harmonic currents are produced when a load draws a current with a non-sinusoidal waveform. According to the Kirchoff Current Law (KCL), the total sum of current at the point of common connection is zero when multiple loads are simultaneously connected. Every load device behaves as a source of harmonics and provides its share, so the total current at PCC is the aggregation of individual harmonics from all load devices according to superposition. In order to find total vector current, the real and imaginary components of individual loads should be added.
ix,h,k—real component of current harmonic of particular device k;
iy,h,k—imaginary component of current harmonic of load k;
K—total loads at the point of common connection.
The resultant magnitude and RMS of a particular harmonic are:
Phase angle calculation is performed according to the quadrant of the phasor. The resultant phase-angle range is –180 to +180 degrees (–π to +π).
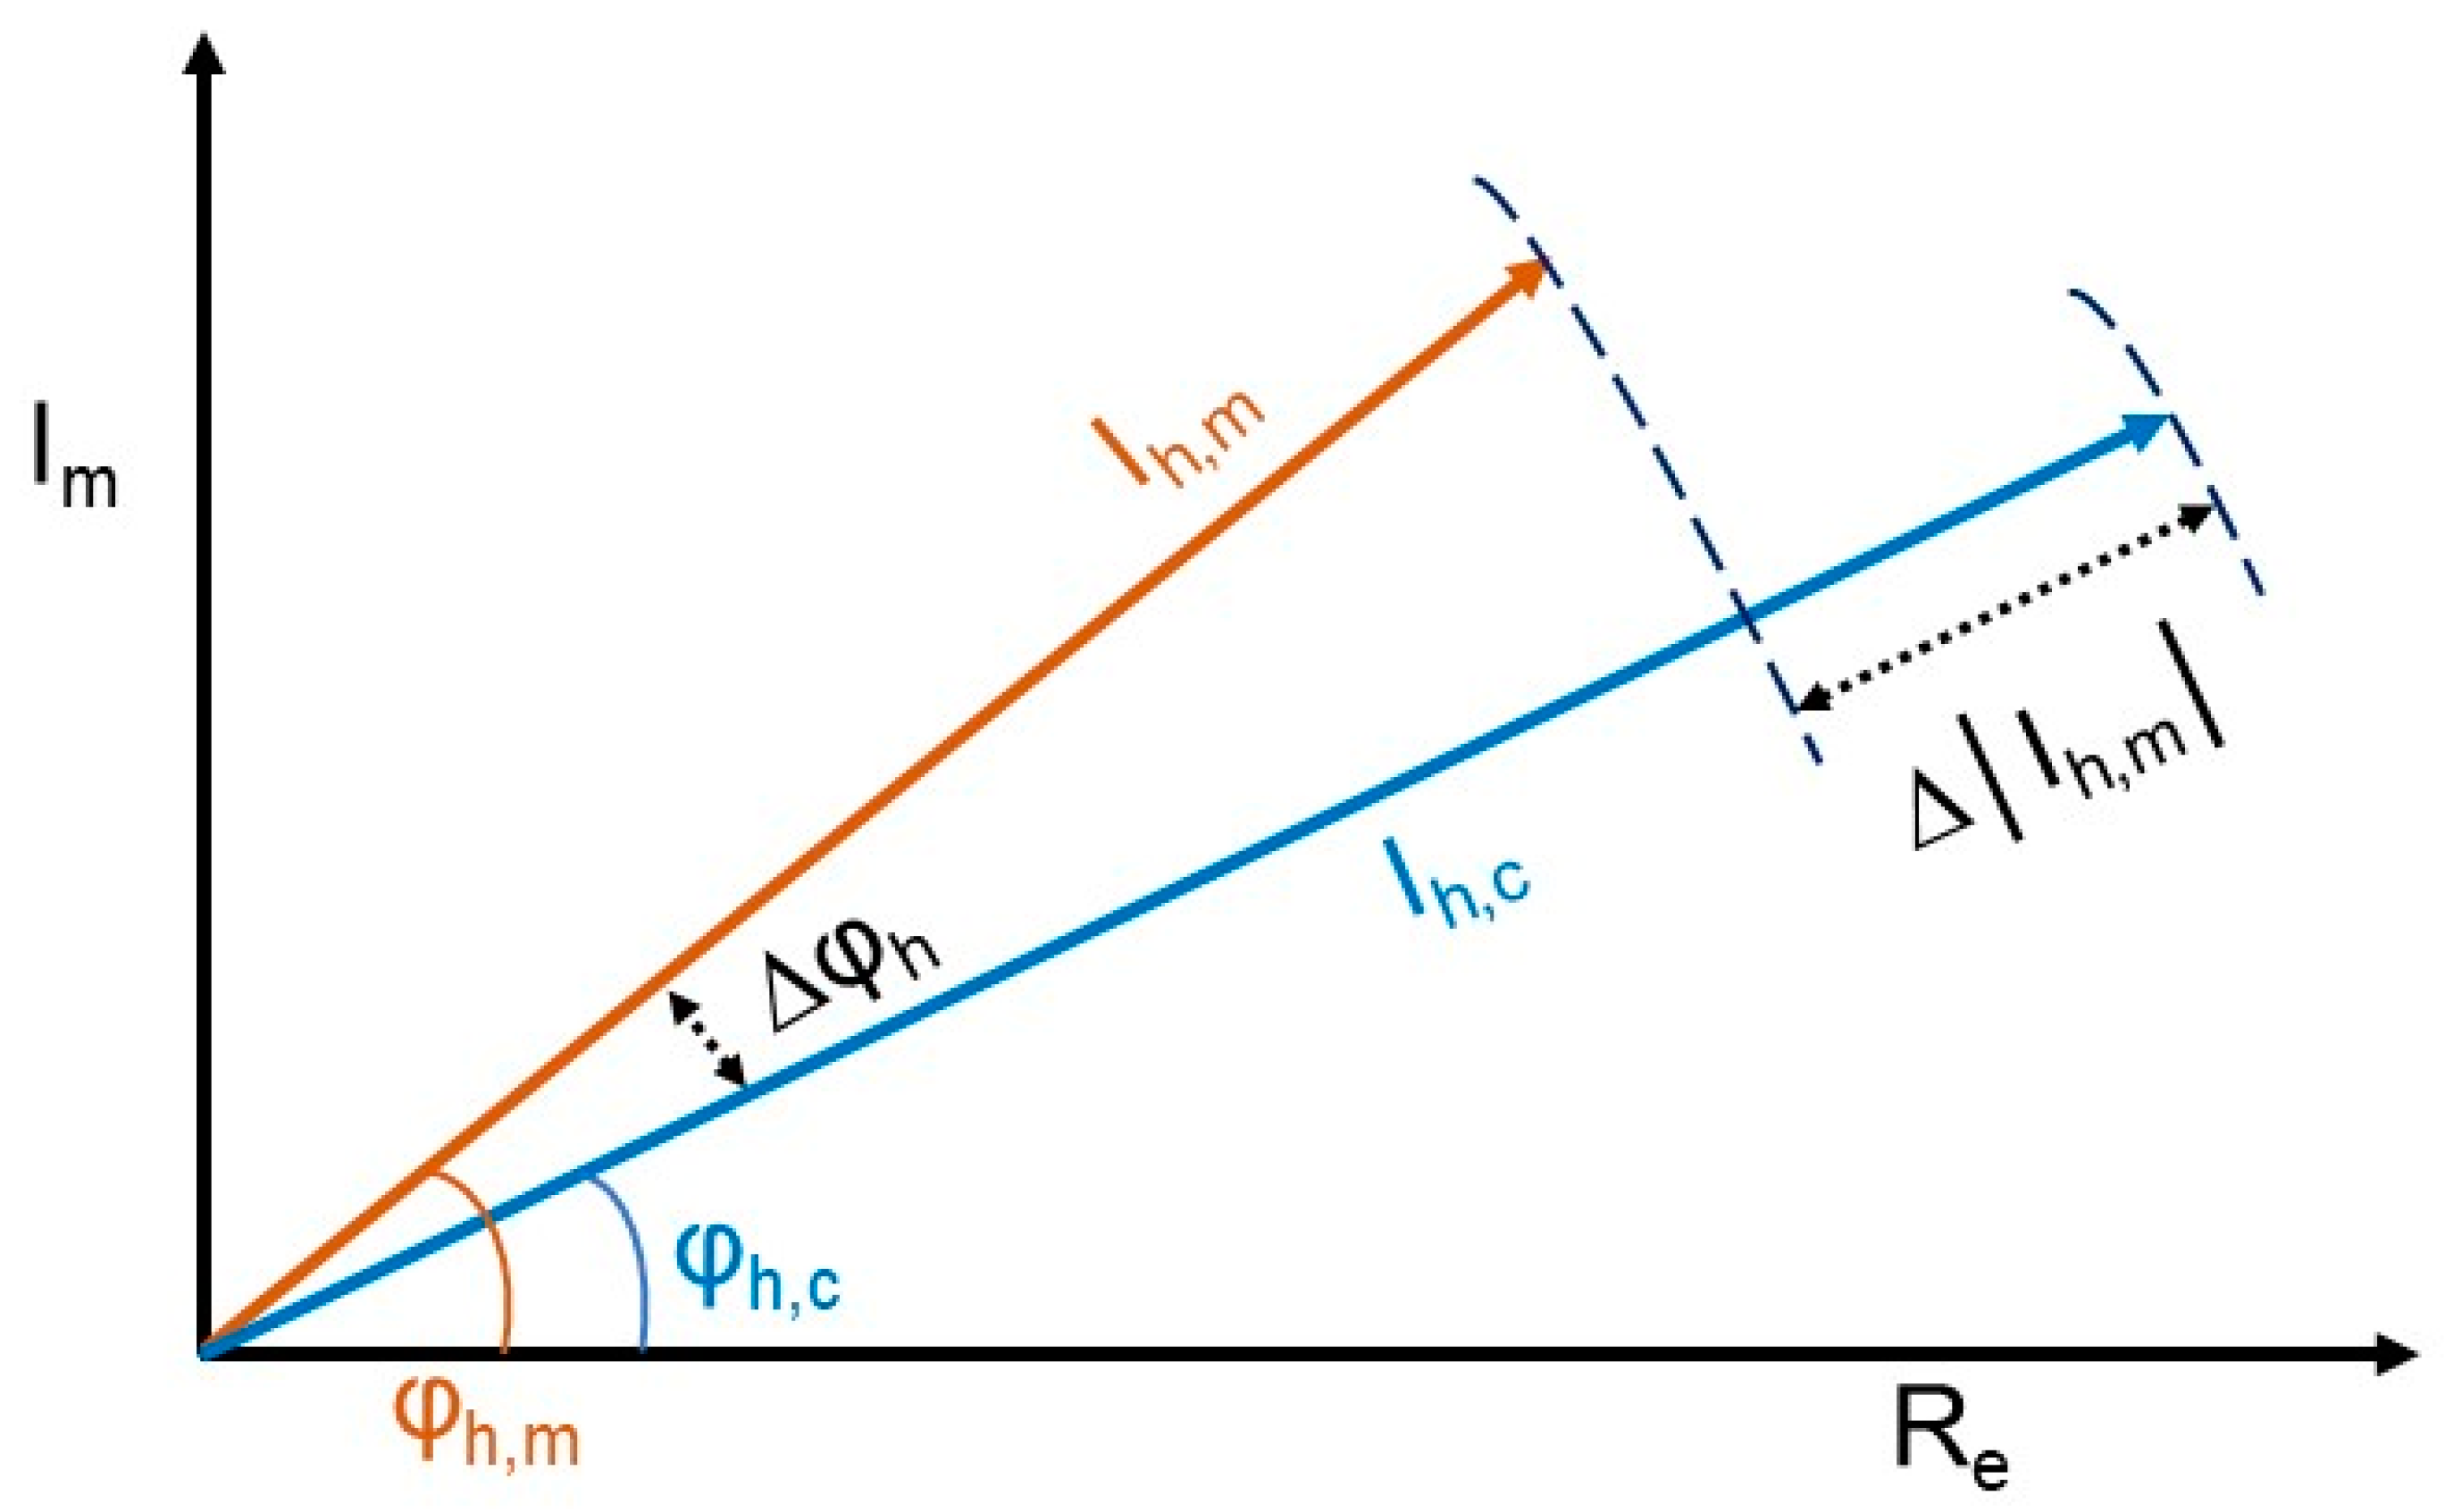
To find the summation accuracy of harmonics, harmonic phasors of individual loads are aggregated to find the resulting harmonic current magnitudes and phase of investigated load combinations. The calculated values of phasors are then compared to measured phasor data of the respective combination of load, and the difference between the calculated and actual values is found. Figure 1 illustrates the difference between measured and aggregated harmonic vectors.
3. Measurement Setup
Sixteen LED lamps are arbitrarily chosen as loads; lamps have a power rating range from 8 W to 17 W and a luminous flux between 800 and 1521 Lm. To reach thermal stability, the LED lamps and power amplifier/power supply were powered up for more than one hour prior to measurement [19]. Table 1 also shows the total harmonic distortion percentage of all the LED lamps used in the experiment. Three of the lamps have a THDI in the range of 28 to 53%; the others have a THDI above 100%.
The experimental setup consists of a power quality (PQ) analyzer, a data acquisition (DAQ) module, a load combination array, a programmable power supply, and a personal computer. The PQ analyzer realizes a one-second measurement that is aggregated and recorded according to class-A standards [22]. MATLAB controls the generation of input voltage for measurement setup as it programs the DAQ module to provide the signal to programmable power supply. Supply waveform is generated with the sampling frequency of 100 kS/s, meaning 2000 points for every 50 Hz cycle. The same MATLAB script drives the load scenarios by supplying a digital binary switching signal to dual-pole double-throw (DPDT) relays which are embedded on 16-load combination array [22,23].
Initially, harmonic current measurements are performed for each load/lamp individually. Afterwards, a combination of loads—for example, load numbers 1 and 2—are subjected to measurement. Different load combinations are used in each step. Each individual lamp or lamp combination is run for 10 s. The PQ analyzer records with a minimum interval of 1 s. The phase angles of harmonic currents are recorded with respect to the input fundamental voltage. Measurements are only conducted after the thermal stability of the load, with a warm-up period of 60 minutes. Continuous power is provided to LED lamps to maintain a working temperature.
Lamps are supplied either by a source to warm them up to a stable operating temperature or during the measurement from the pure sinewave source. Double throw relays provide power from the secondary source when lamps are unengaged. The outline of the measurement setup is presented in Figure 2.
4. Measurement Results
4.1. Individual Load Measurements
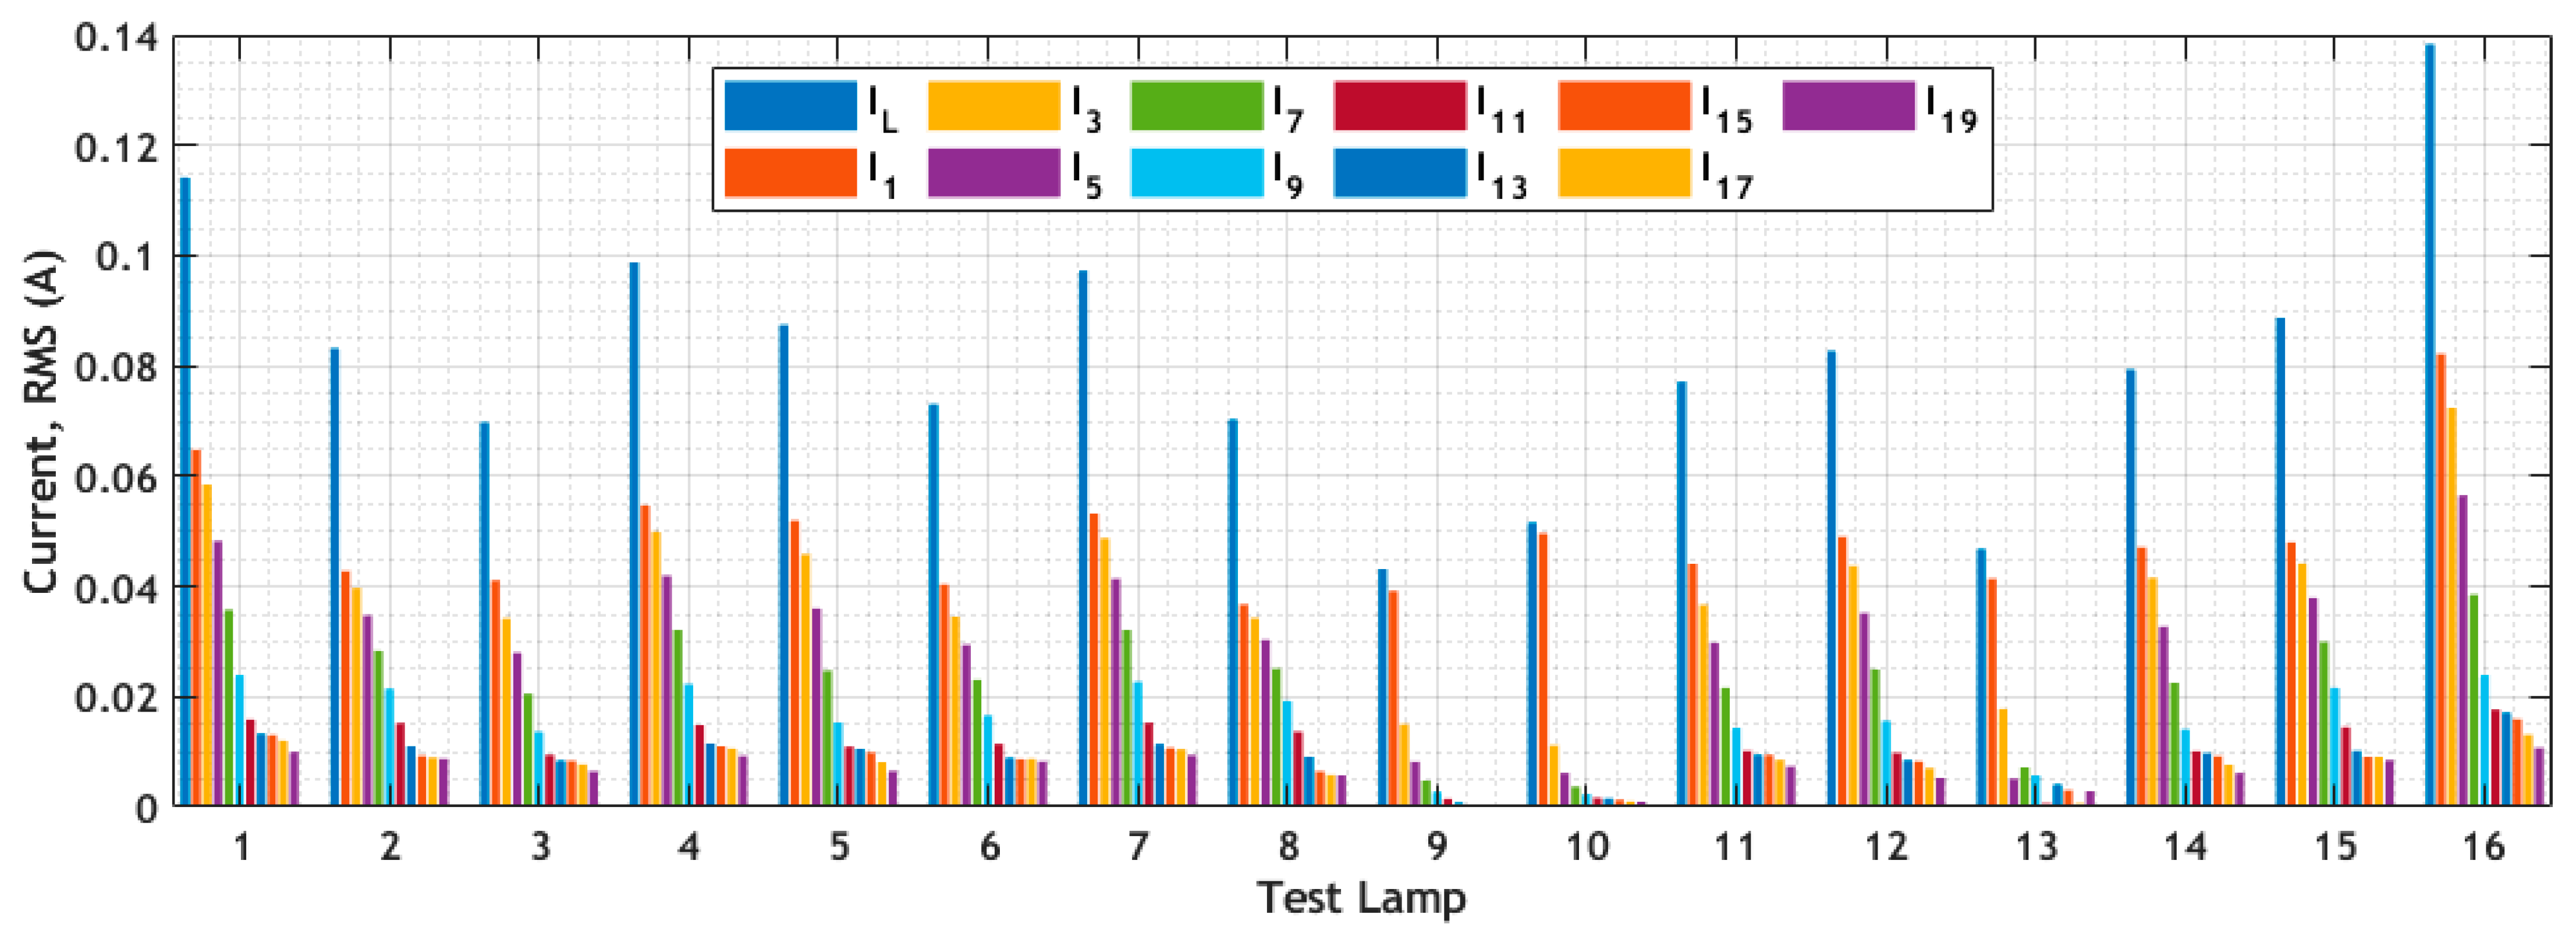
The measured load currents of all sixteen lamps are shown in Figure 3, and measured RMS currents are in the 40 mA to 140 mA range. The figure also indicates the harmonic profile details of lamps used in this study. Only odd harmonic currents under the 1 kHz range are considered for analysis and the calculation is in the present context. The limit used is due to the measurement system capabilities and related uncertainty. However, it was verified that harmonics above 1 kHz have a negligible impact on the load current. LEDs’ internal circuit topology can play an essential role in defining the harmonic current fingerprint of lamps, as some lamps can contain active or passive filters and power factor correction circuit for reducing the harmonic content in a current. More details on the lamp circuit topologies are presented in [21,23]. The number of circuit types selected here is assumed to present the statistical mix of lamps on the market. Every lamp follows approximately the same pattern: the RMS of the current harmonic components decreases as the order of the harmonic decreases. Table 2 represents the RMS and phase angle information of the test lamps, as the phase angle information must be observed during the estimation of the total harmonics of multiple devices.
4.2. Aggregation Measurement Results
All possible combinations of the sixteen lamps are issued by switching two lamps at a time. The total number of possible lamp combinations is 120. Due to the limitation of the power in the voltage power supply, only two lamps are switched on at a time. For any combination, measurements of the individual lamps are taken and resultant harmonics are calculated by adding the individual current harmonics.
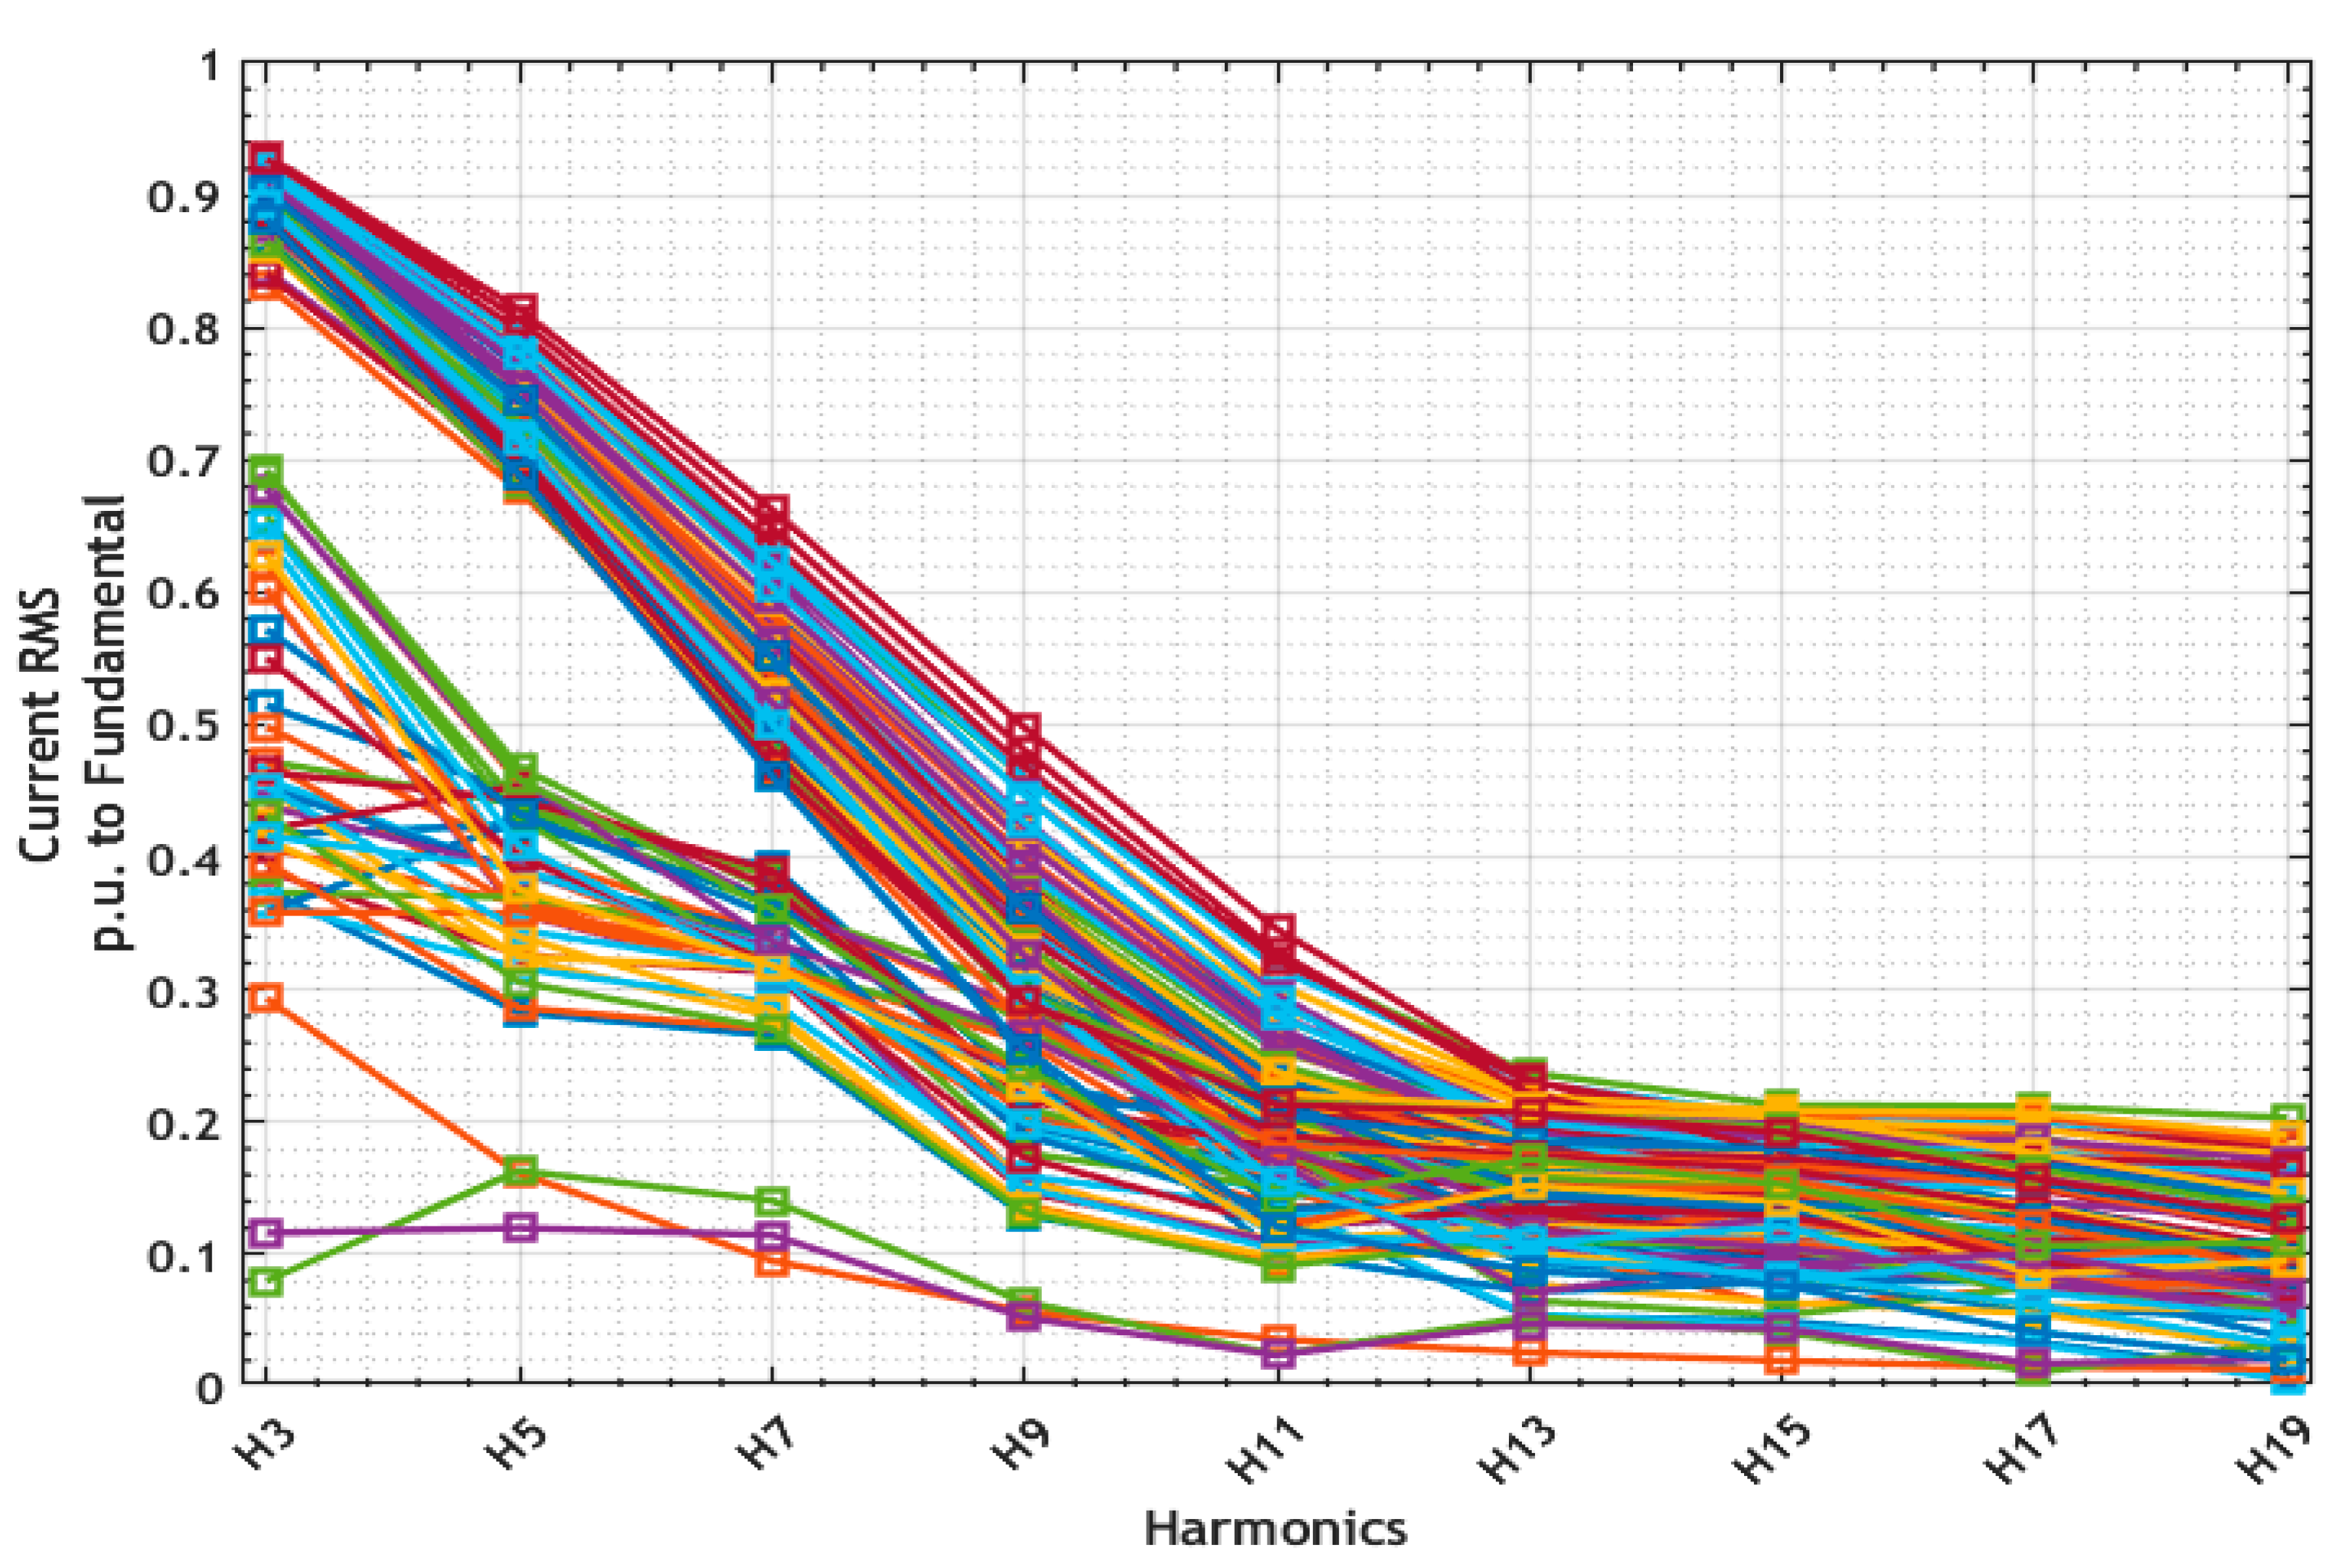
The RMS measurement data of all combinations of the lamps are illustrated in Figure 4. The trend shows the similar behavior of harmonics; that is, lower-order harmonics have more significant percentage than higher-order harmonics in total harmonic content. Very few lamp combinations show a small amount of harmonic content because these loads may contain harmonic filters; for those combinations, even lower-order harmonic content is negligible.
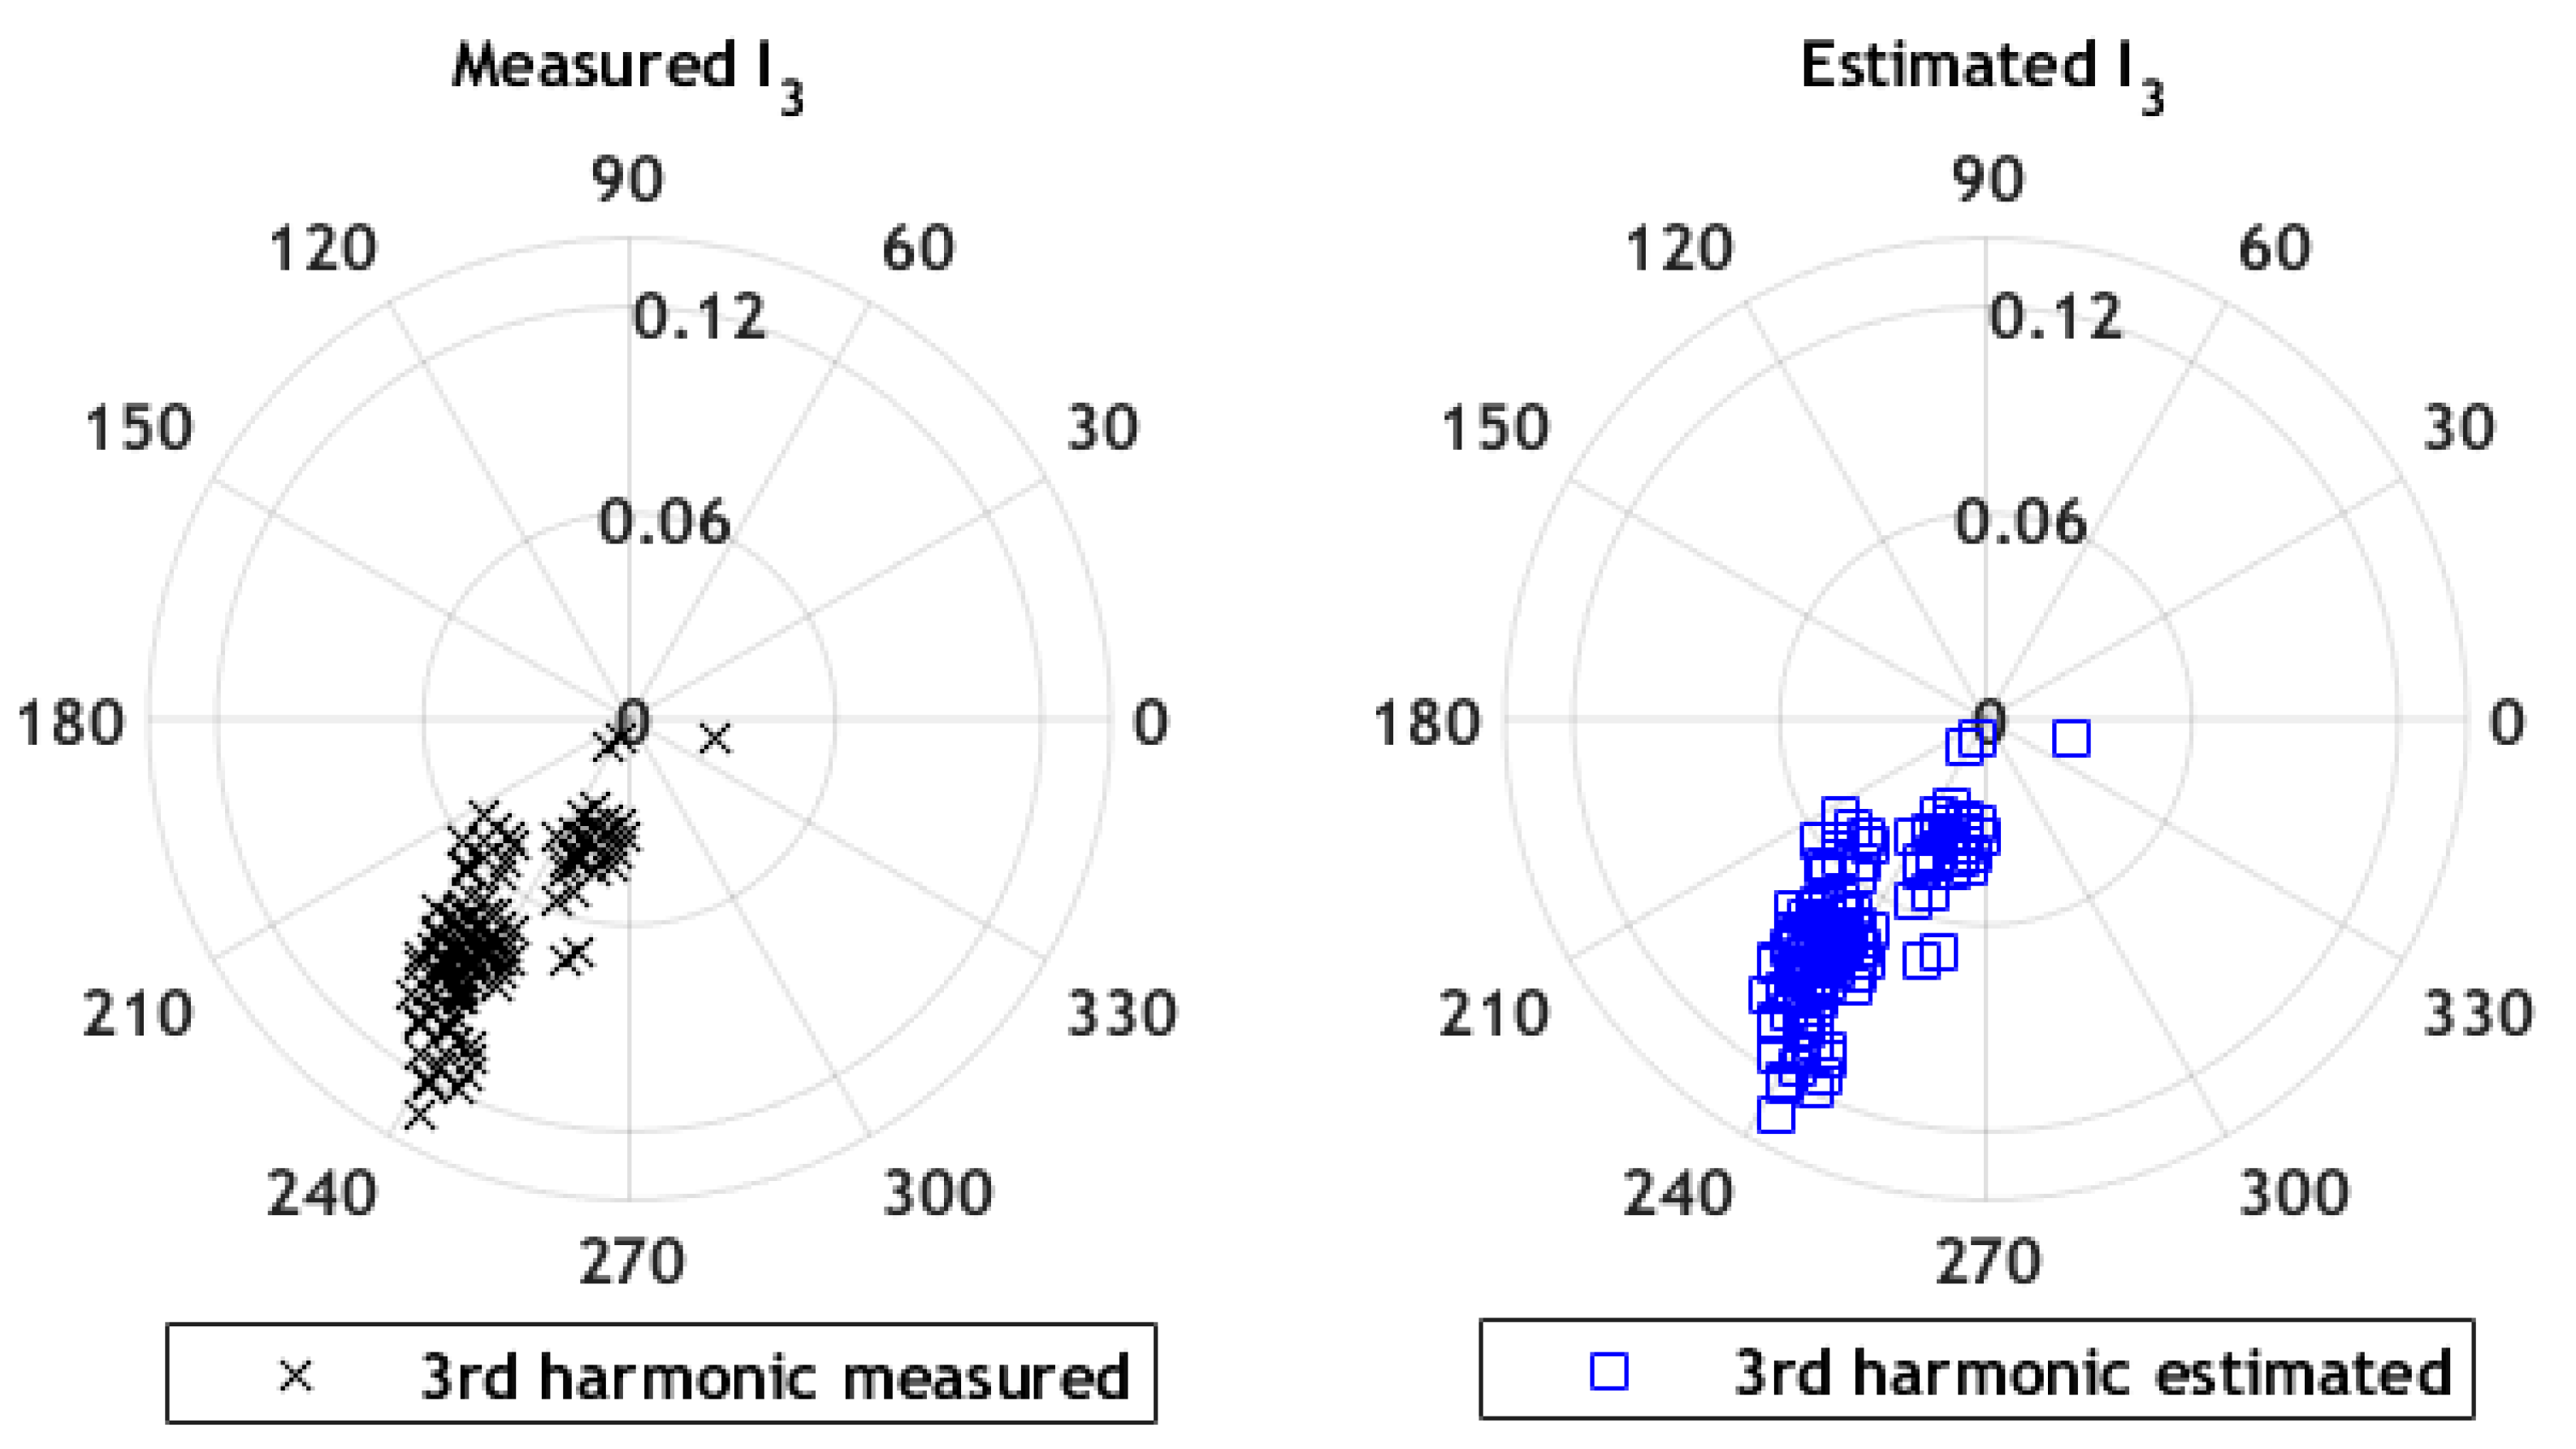
Figure 5 shows the third harmonic data of all the combinations used for comparison. The first graph represents the third harmonics’ phasors recorded by the measurement device for all combinations. The second part of the figure shows all estimated harmonics, calculated by the geometric addition of the individual third harmonic current component values of lamps present in any particular combination using Formula (5) with K = 2.
The actual measurement data of every load combination are compared with the respective aggregated sum of individual harmonic currents of lamps that are present in the combination. Each point is the difference in the estimated and measurement results from an exclusive combination. The magnitude difference is represented as a percentage. The difference in the phase angles of measured and estimated harmonics is expressed in degrees.
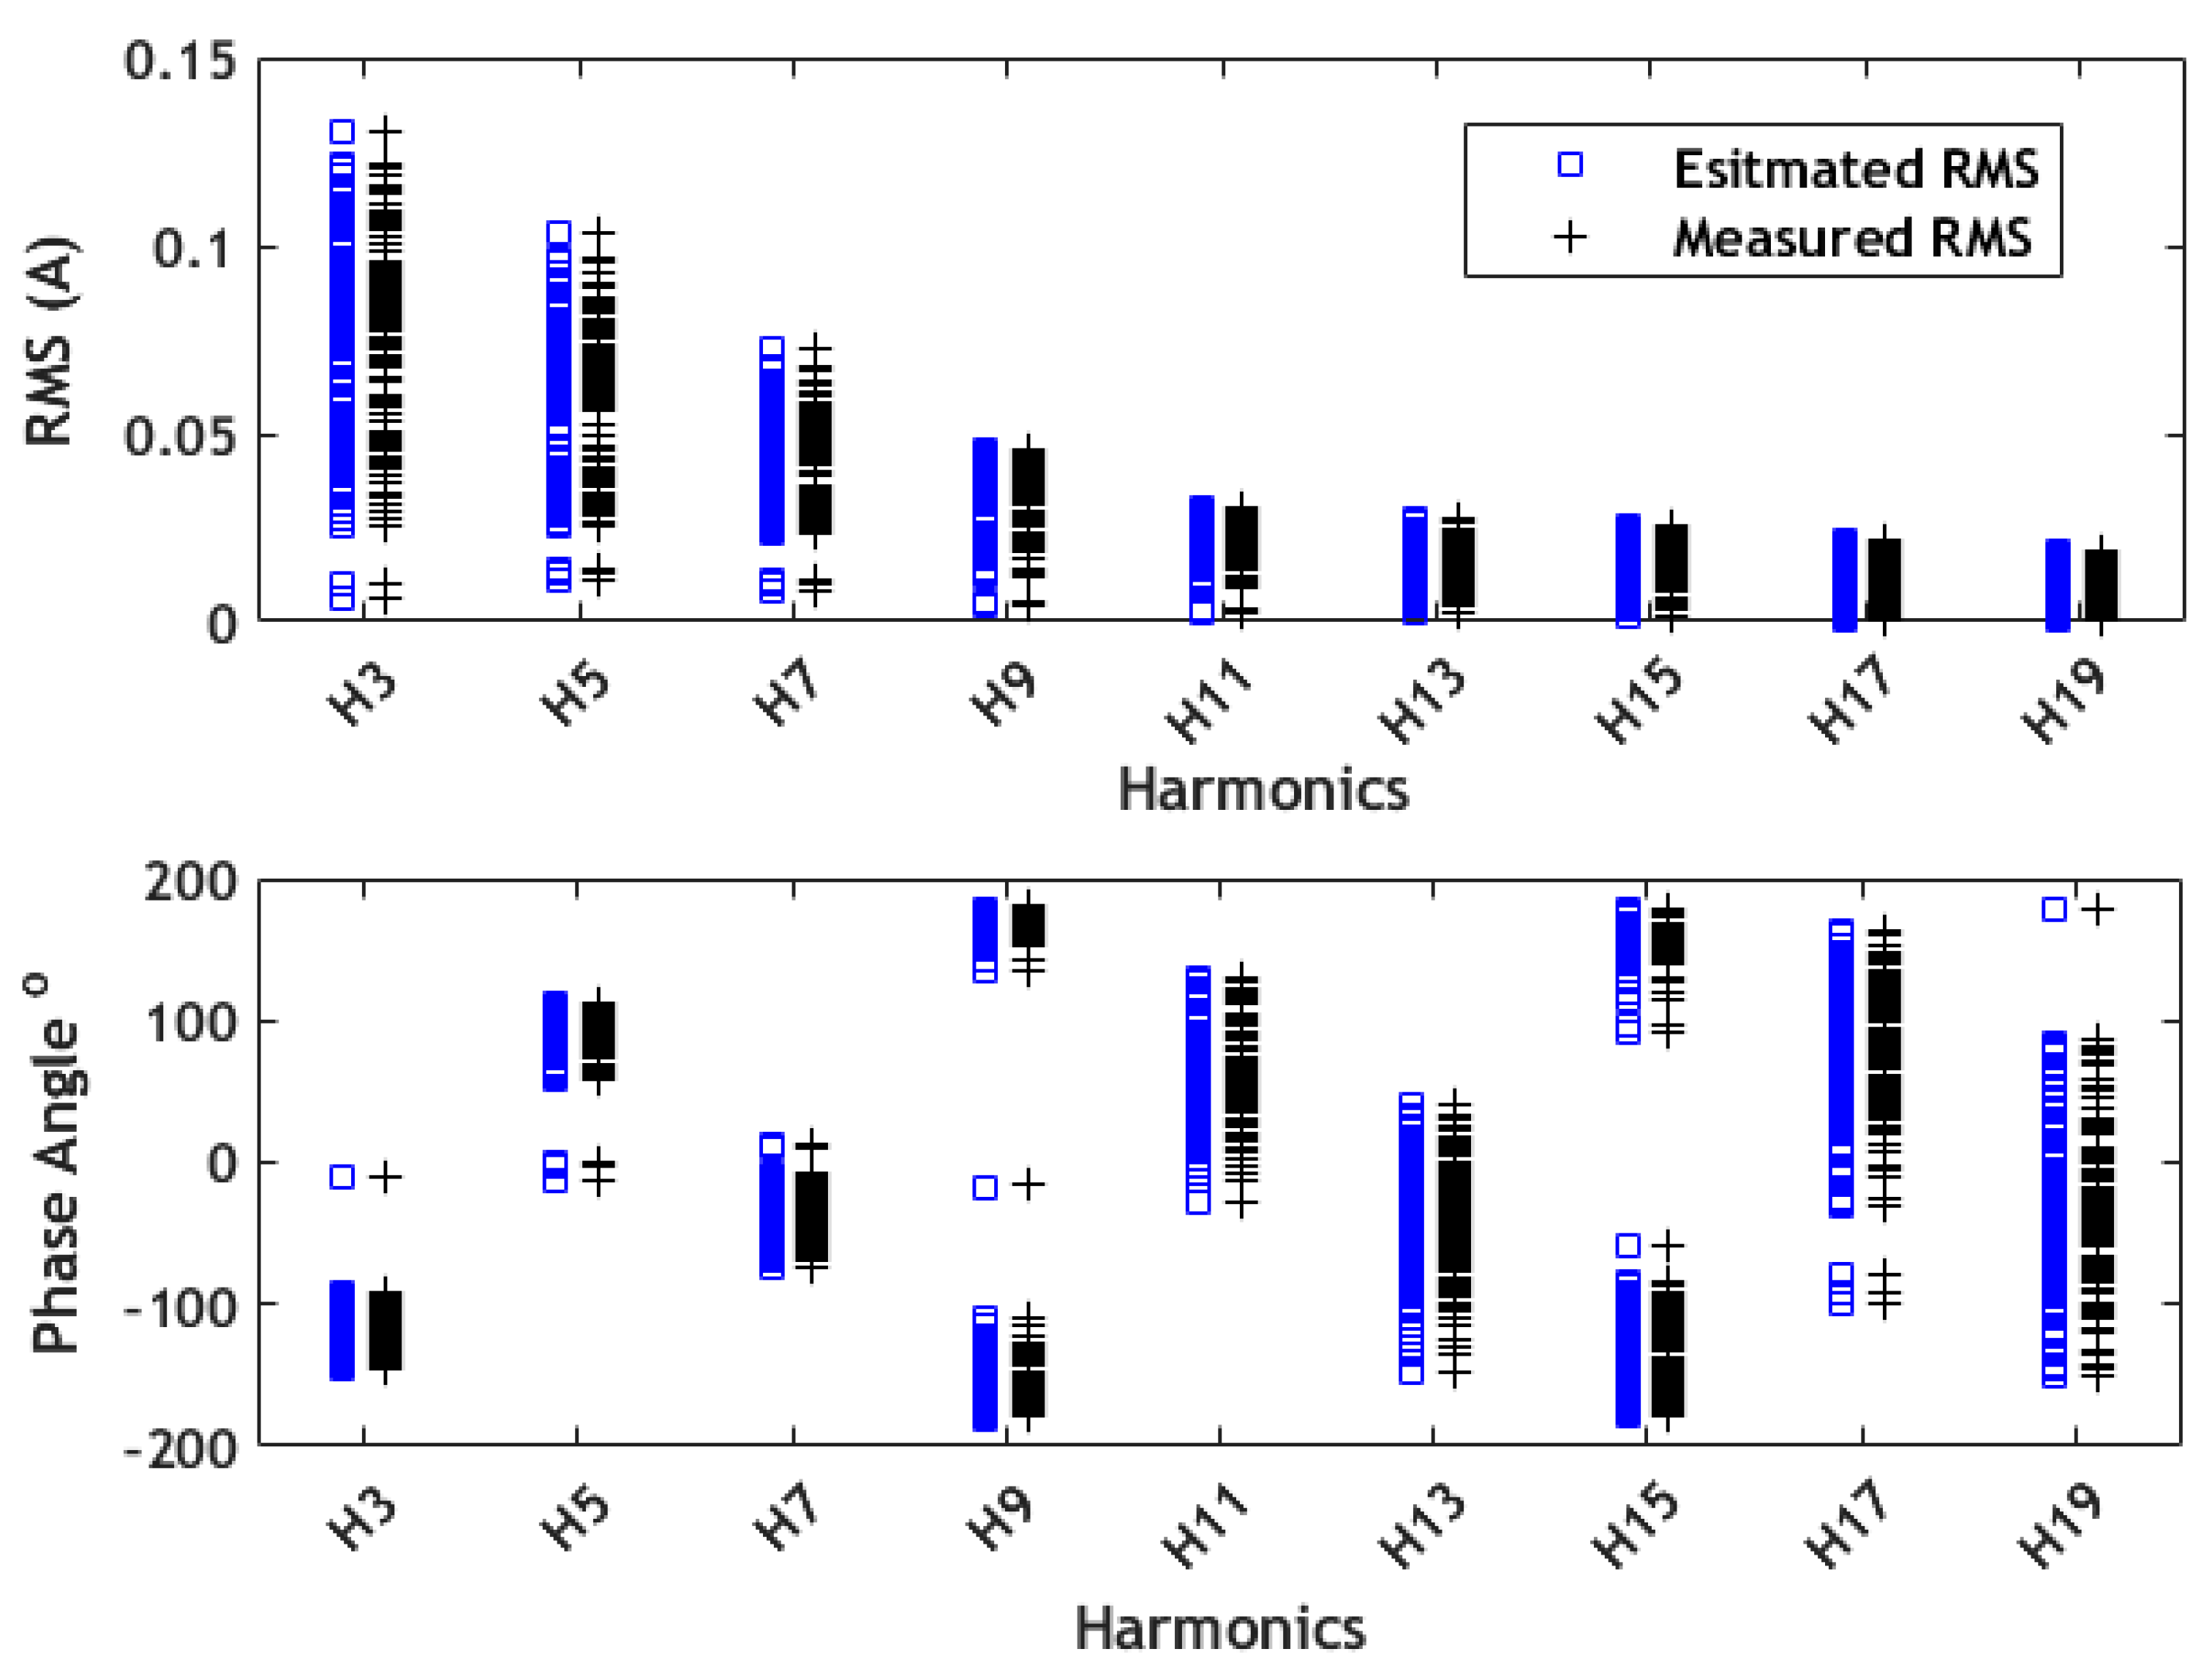
The geometric sum and measured values of the harmonics in different load combinations are demonstrated in Figure 6. Phase angles illustrate the spread of harmonic phasors. Harmonics with a broader spread of phase angle are likely to face more cancellation (see further); as shown in the second part of Figure 6, phase angles range practically from –180 to 180 degrees for the nineteenth harmonic. When multiple devices are connected at a common point, higher-order harmonics are more likely to face a harmonic cancellation effect.
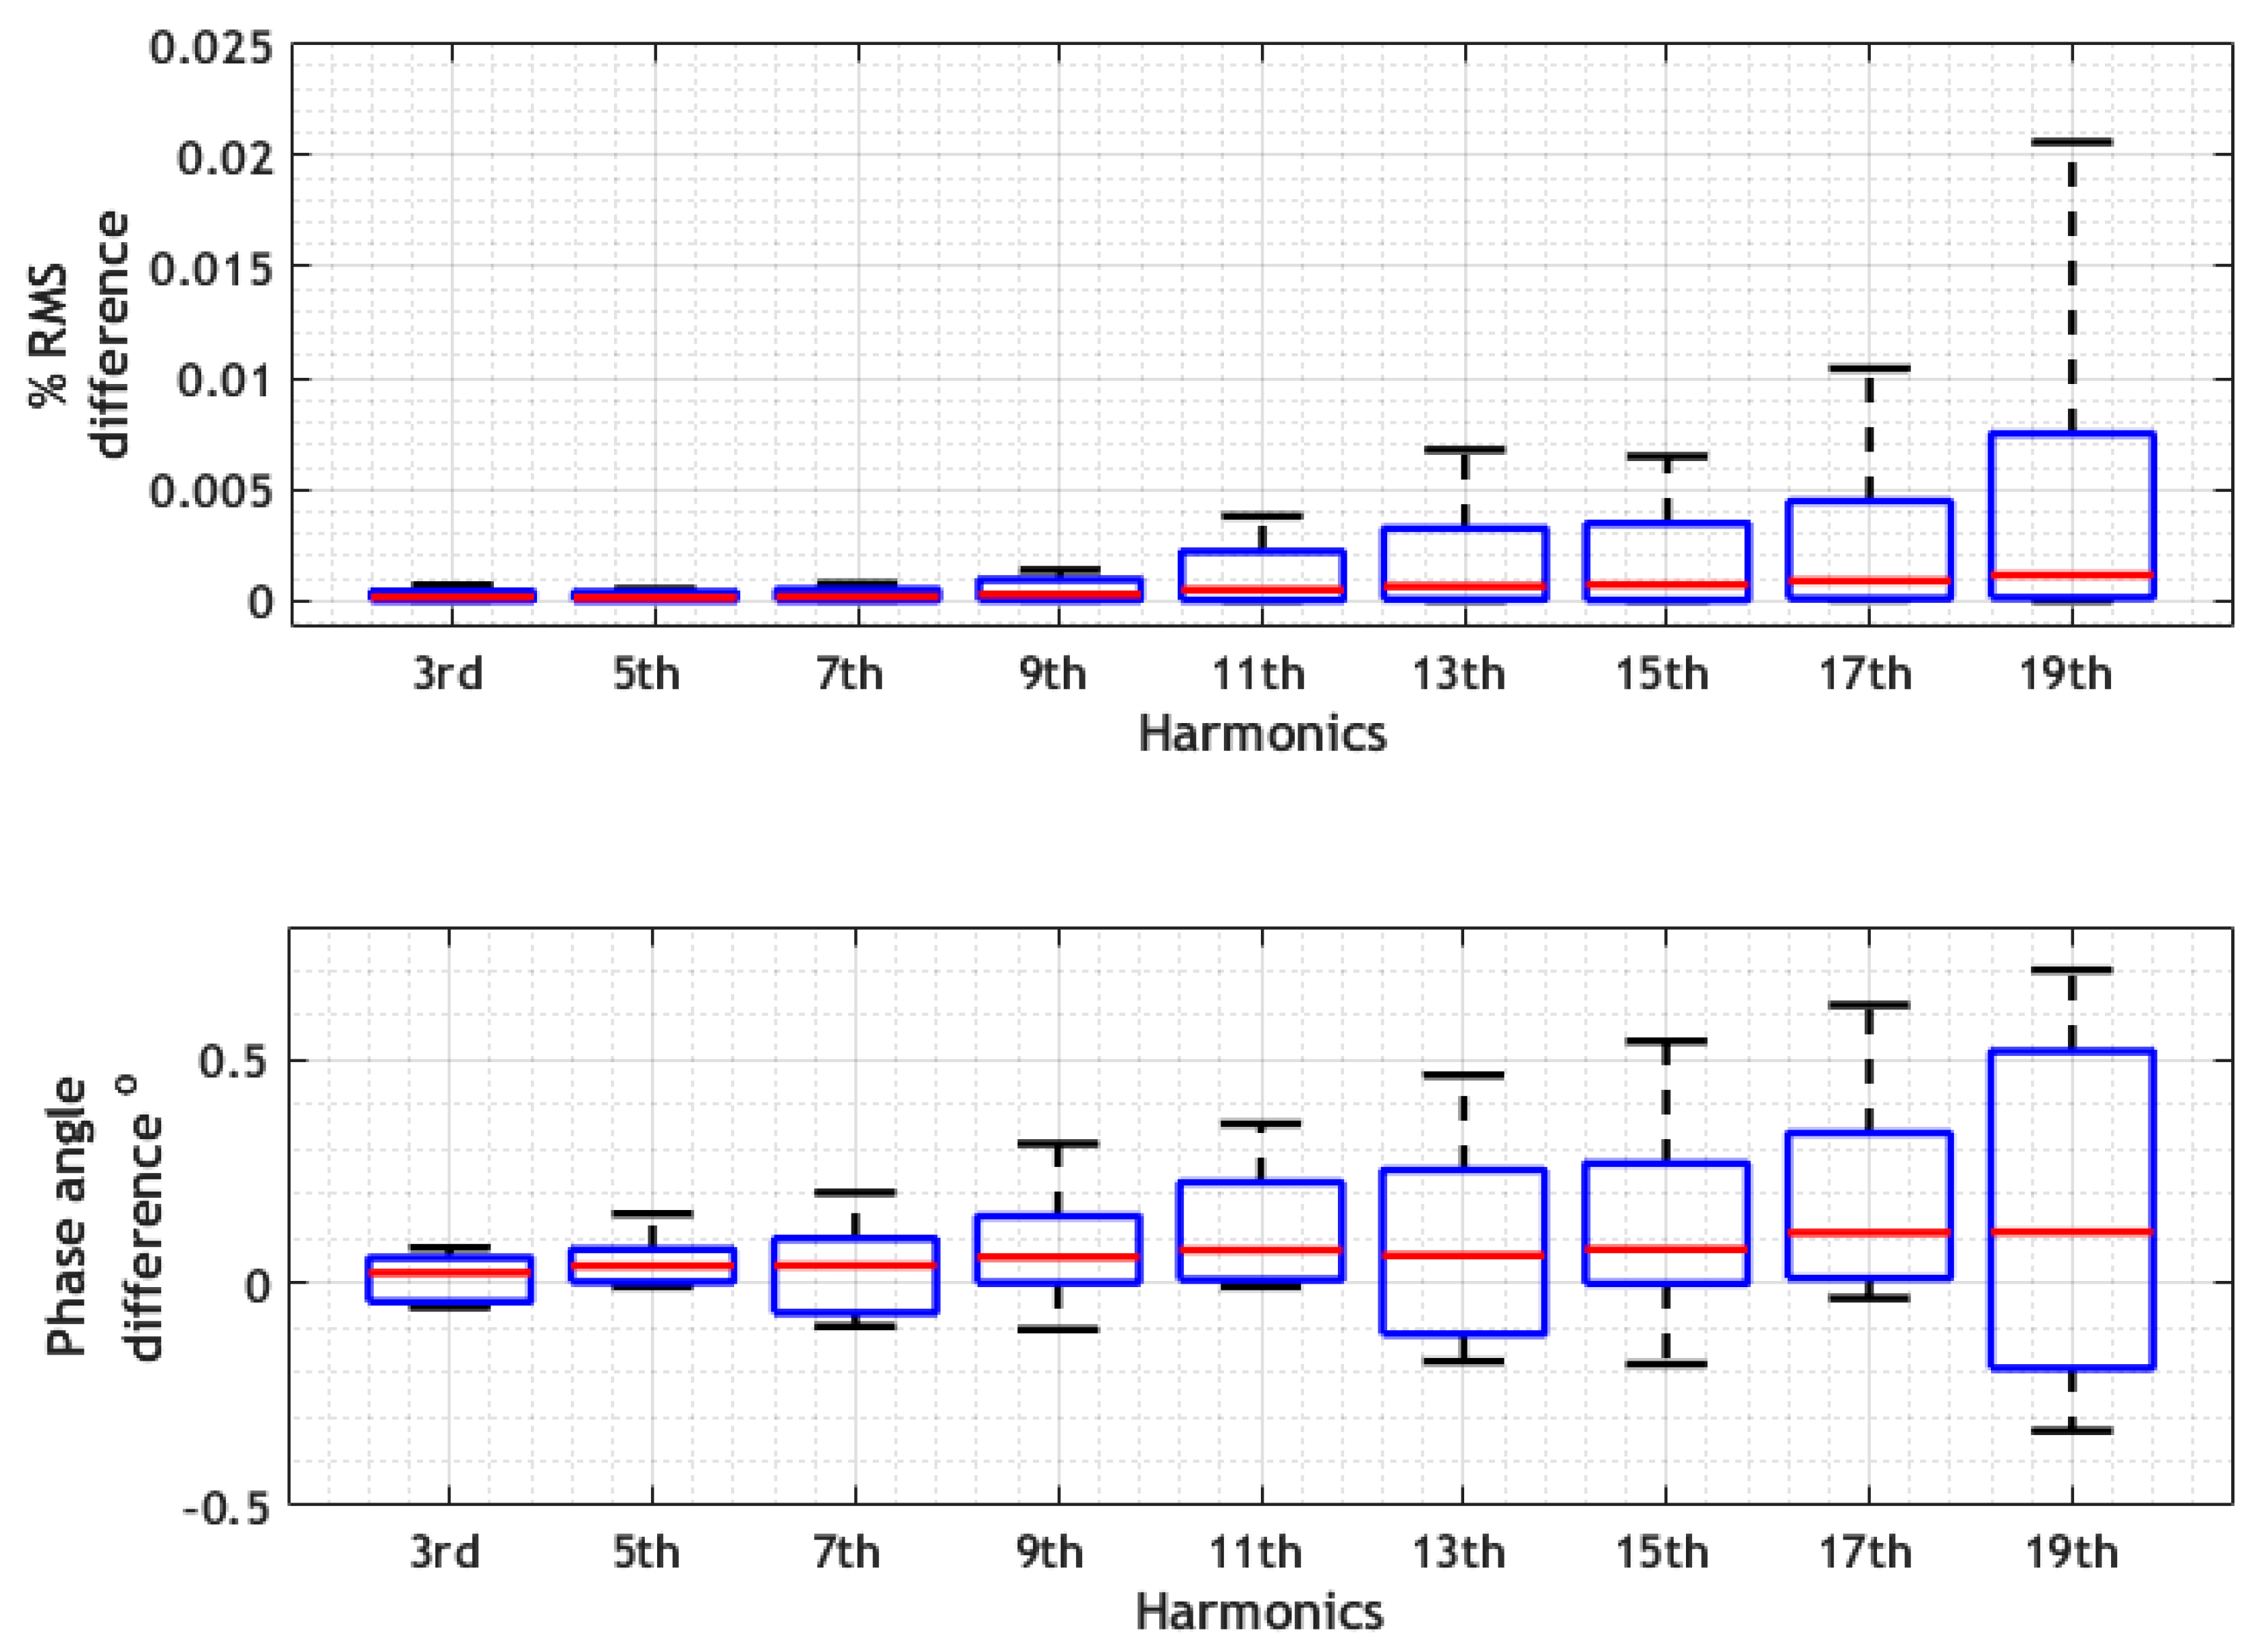
The top and bottom edges of the boxplot in Figure 7 show the 95th and 5th percentile values, while the middle red line indicates the mean value. The whiskers are extended towards extreme values. Figure 7 shows that a near-perfect harmonic summation is seen with a sinusoidal supply provided to loads. The mean difference in the estimated and measured values of all harmonics is very close to zero, which is evidence of the accurate estimation and measurement of load harmonics. The mean difference in the lower-order harmonics is close to zero from the third to the ninth harmonic. The previous study established that the higher-order harmonics have a wider spread on a complex plane, so the mean RMS difference in the higher-order comparison data is more significant than that of lower-order. In the second part of Figure 7, the phase difference in measured and estimated harmonic current increase with harmonic order is shown. The overall difference in phase angle remains below 0.5 degrees.
The verification above is important for the following context:
- (1)
- To verify that the harmonics presented with low magnitudes are handled with enough accuracy, and to reflect that if a higher number of such load current components with low magnitudes are accumulated, their totals are expected to have a relatively low order of error, both in magnitude and phase angle values.
- (2)
- While the equipment used for performing measurements of the actual LED lamp combinations is not capable of reliably supplying more than two or three lamps at a time, the analytical cumulative harmonic current analysis using (5) will provide results that are also applicable for higher numbers of LED lamps assumed to be used at the same time.
These assumptions will be used in the following analysis for the combinations where higher numbers of LEDs are used at the same time (2–16).
5. Aggregation Analysis and Harmonic Cancellation Estimation
It has been suggested that renewable-source converters would have an impact on the distribution network power quality and create distortions similar to non-linear loads. Massive LED-lamp inclusion to the loads would provide a healthy increase in the harmonic currents’ levels in the grids. More electric vehicles directly bring the high-power non-linear loads to the distribution networks. Utility engineers would need to be prepared to analyze the situation and determine the sufficient potential hosting capacity availability prior to the addition of new non-linear units to the grid.
Engineers usually do not have the tools to present harmonics’ phase angles, and usually present the harmonic RMS. This is used to compare the actual situation to that of [24]. If there is a need to estimate the added units’ impact on the distribution grid, observing the RMS harmonic currents only will create uncertainty in the estimation of the total load harmonic current. The simplest way to estimate the total RMS harmonic current is to add these currents arithmetically [25].
The harmonic cancellation refers to the cumulation of the harmonic currents in such a manner that the resulting RMS harmonic current is lower than the arithmetic sum [26,27,28]. The cases with arithmetic sum (in case only RMS measurements are available) and geometric sum (RMS and phase angle data are available) is presented here. The effect of harmonic cancellation can be estimated using a cancellation factor.
where N is the number of total individual loads.
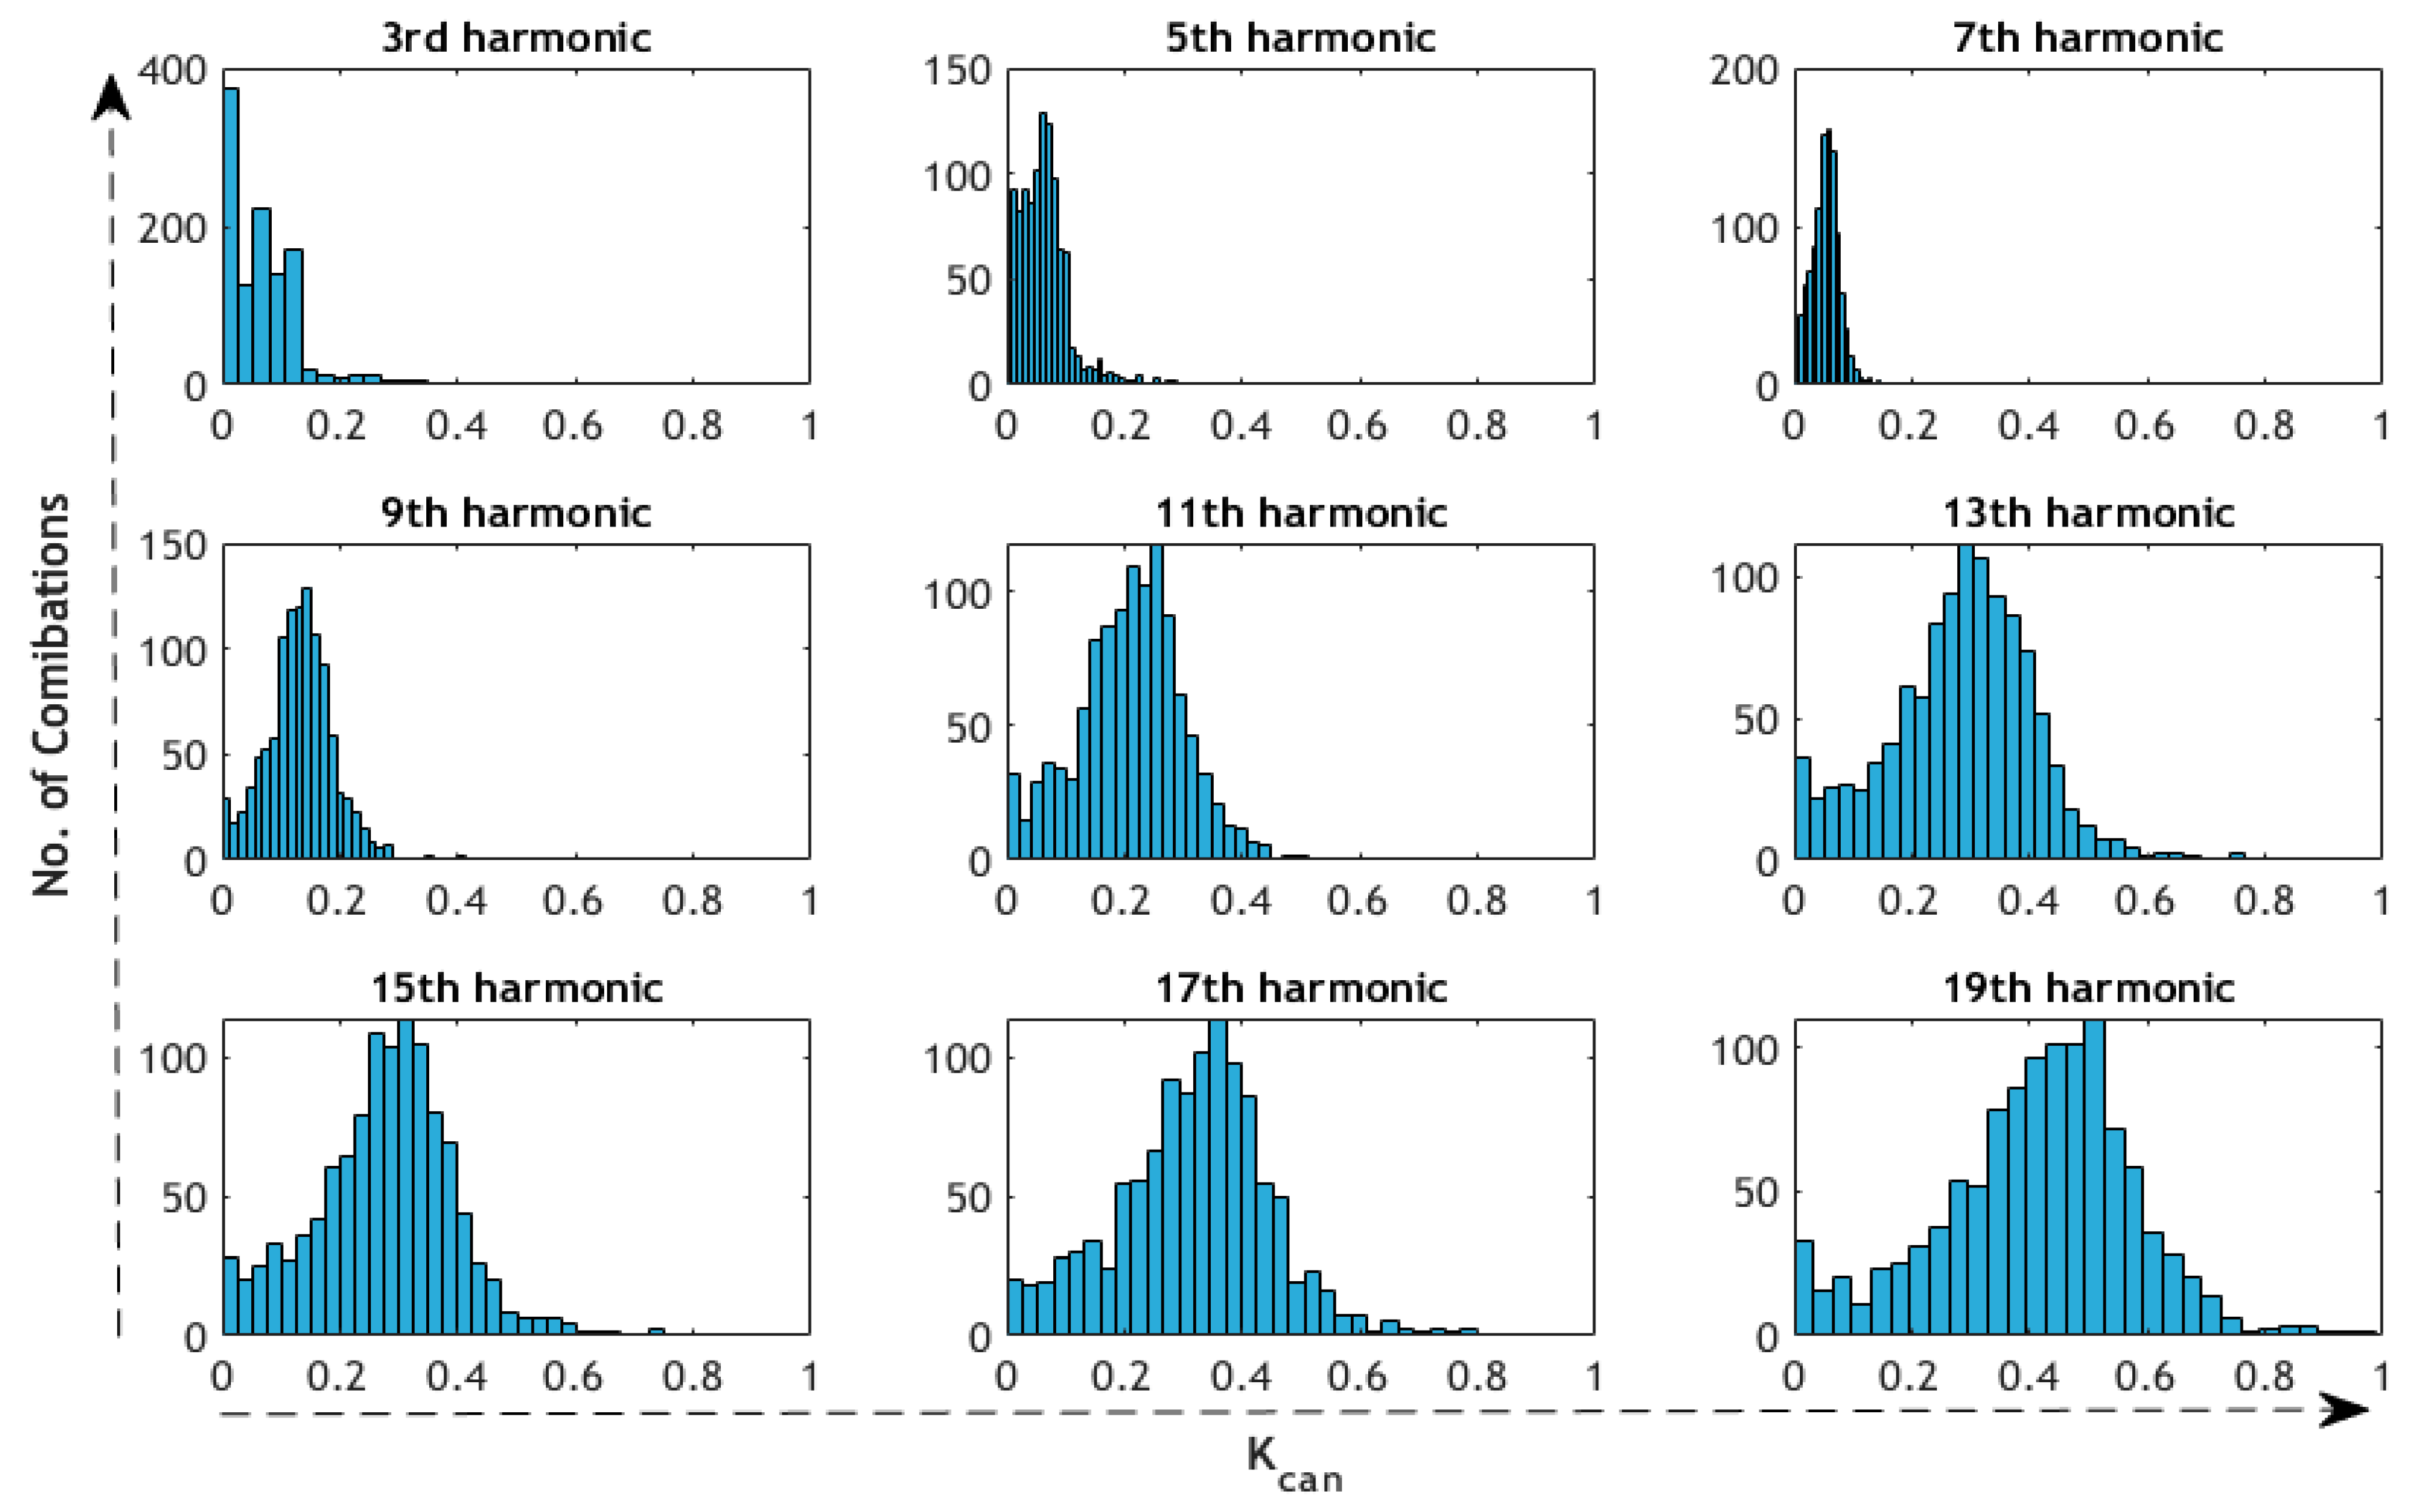
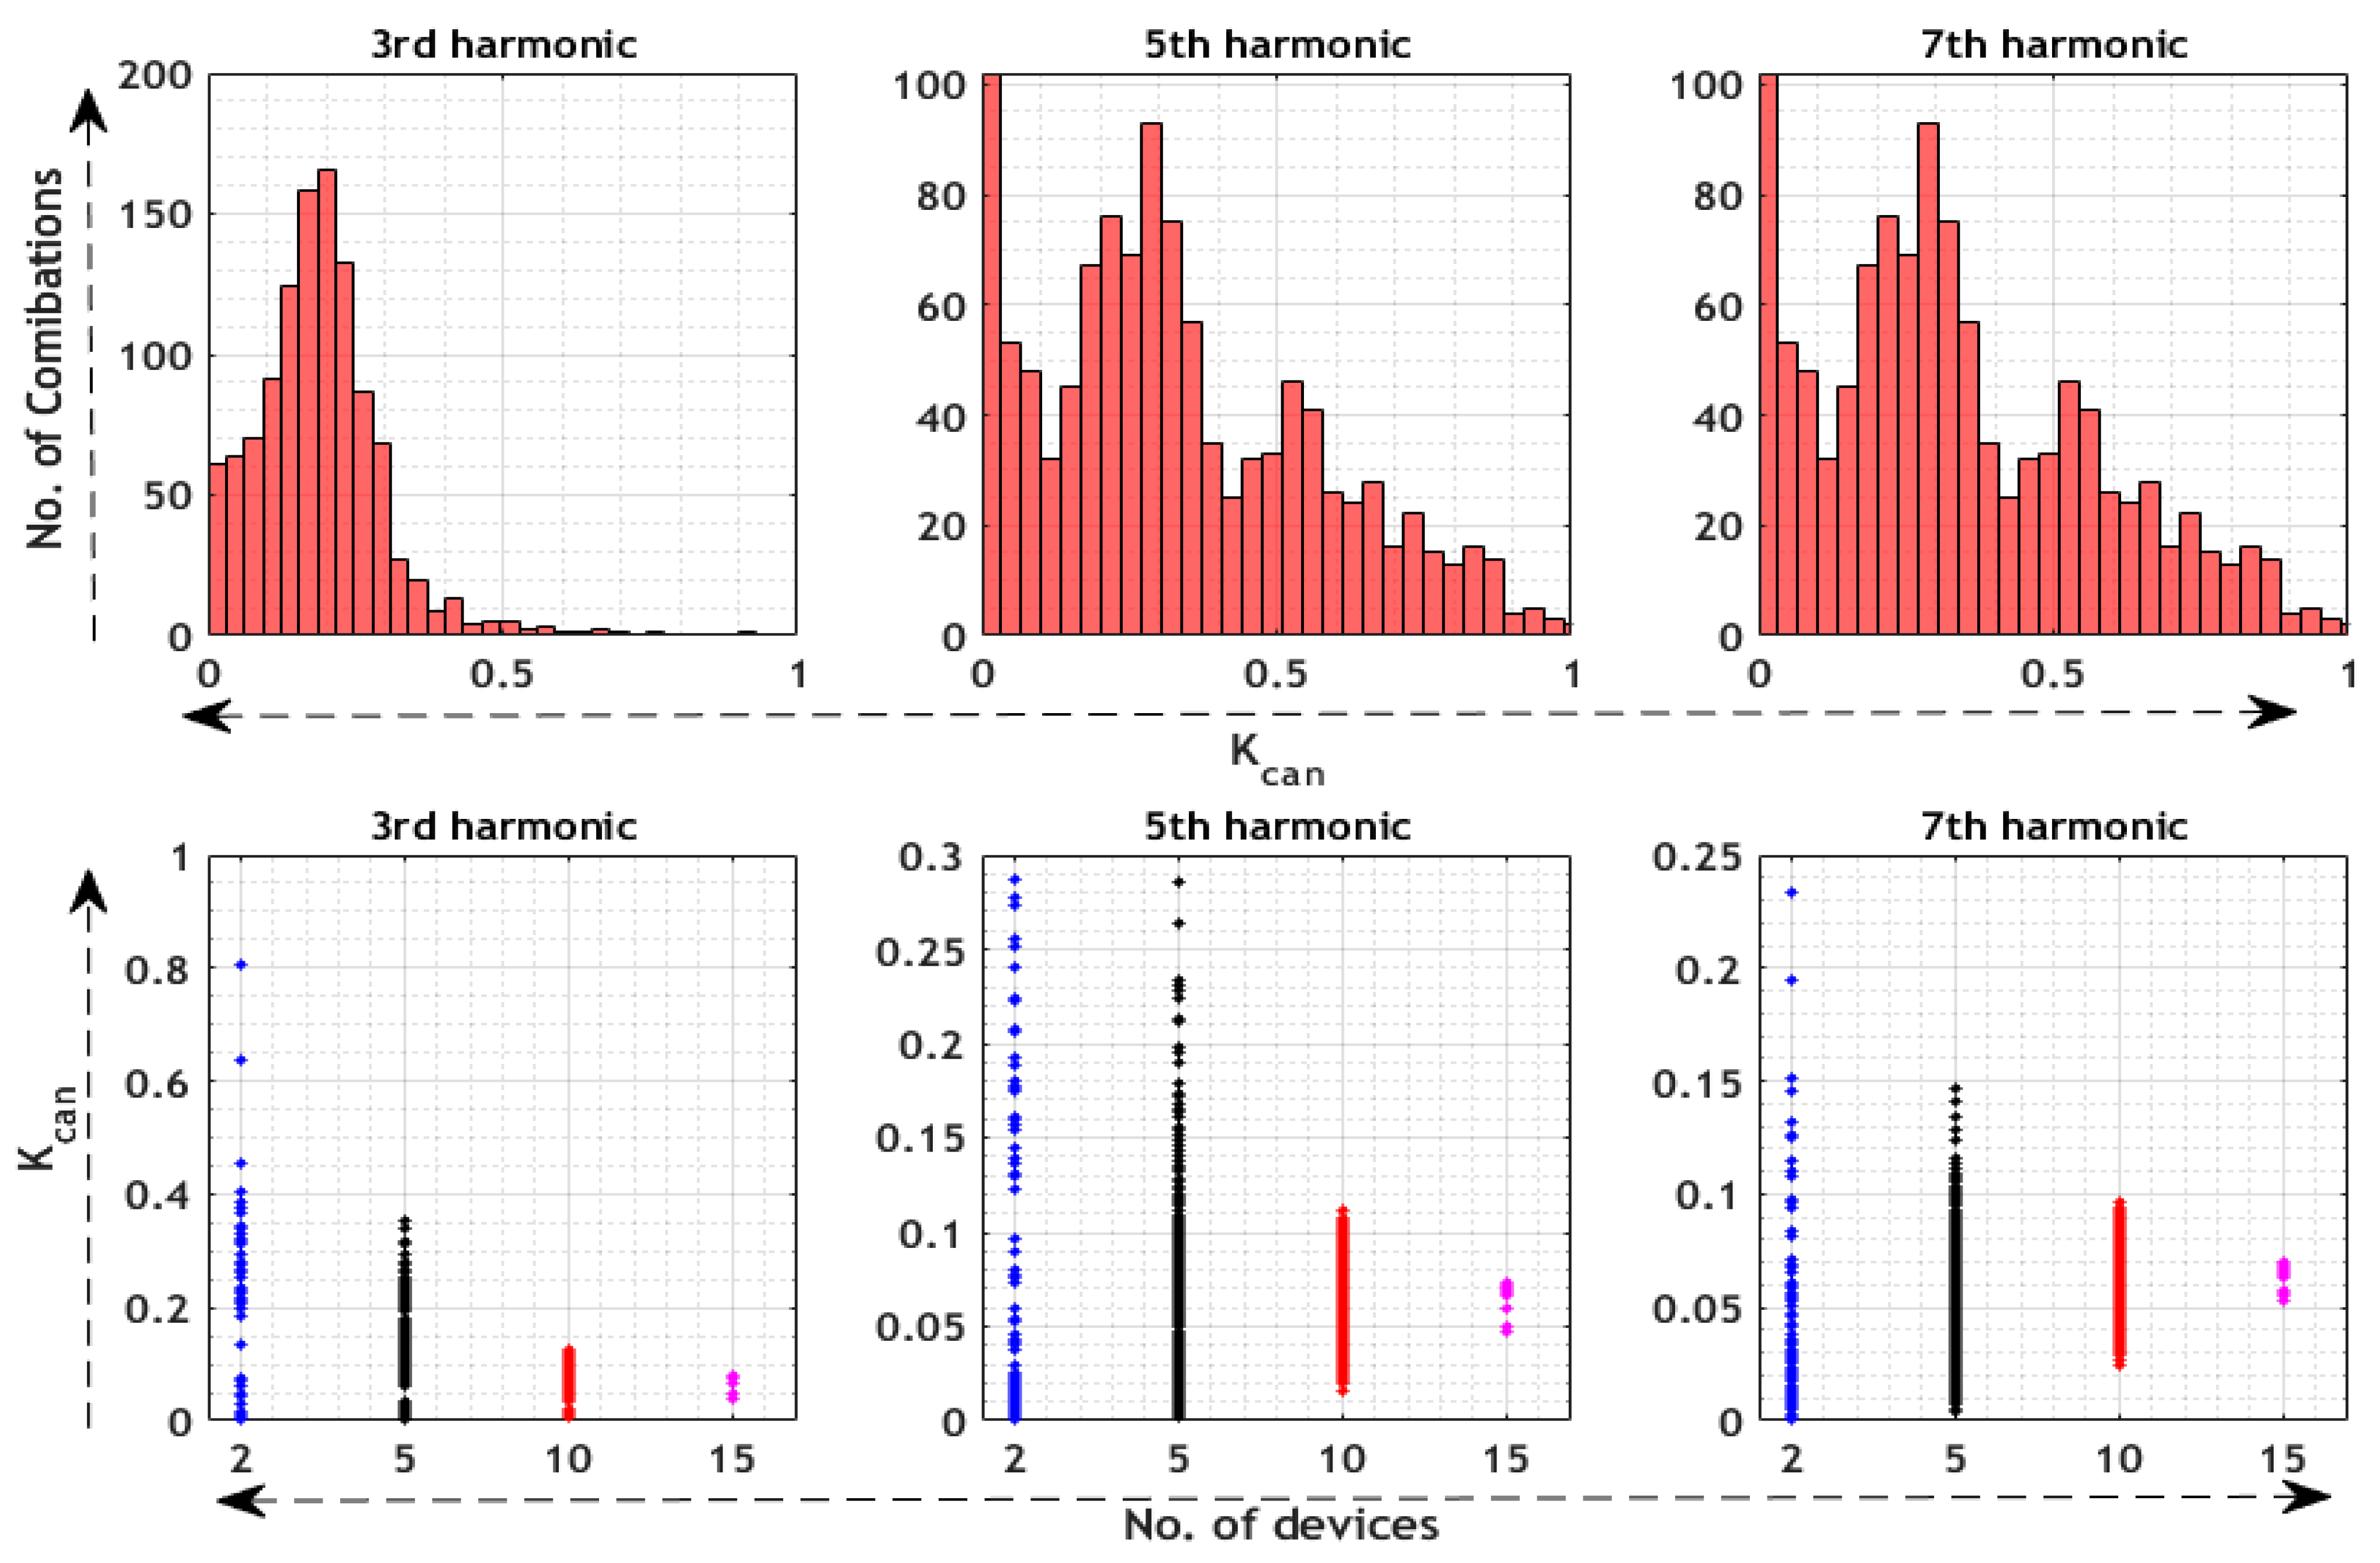
Figure 8 represents the histogram of the harmonic cancellation coefficient when multiple LEDs are connected simultaneously. It can be seen that the cancellation coefficient is around 0.5 for the majority of load scenarios in higher-order harmonics. As for some load combinations, cancellation coefficients even reach unity. With a greater number of connected loads, the cancellation coefficient increases. Kcan = 1 means that harmonic current will be cancelled out to 0 magnitude. It is examined in [23,29,30] that with the increase in the number of lamps, an individual current harmonic components reduction does not happen in a similar pattern for lower and higher-order harmonics. This is due to the fact that low-order harmonic phasors are closely aligned in comparison to high-order phasors on the complex plane. The resulting harmonic levels are decreased due to the cancellation effect, and high-order harmonics have more average reduction as compared to lower-harmonic orders.
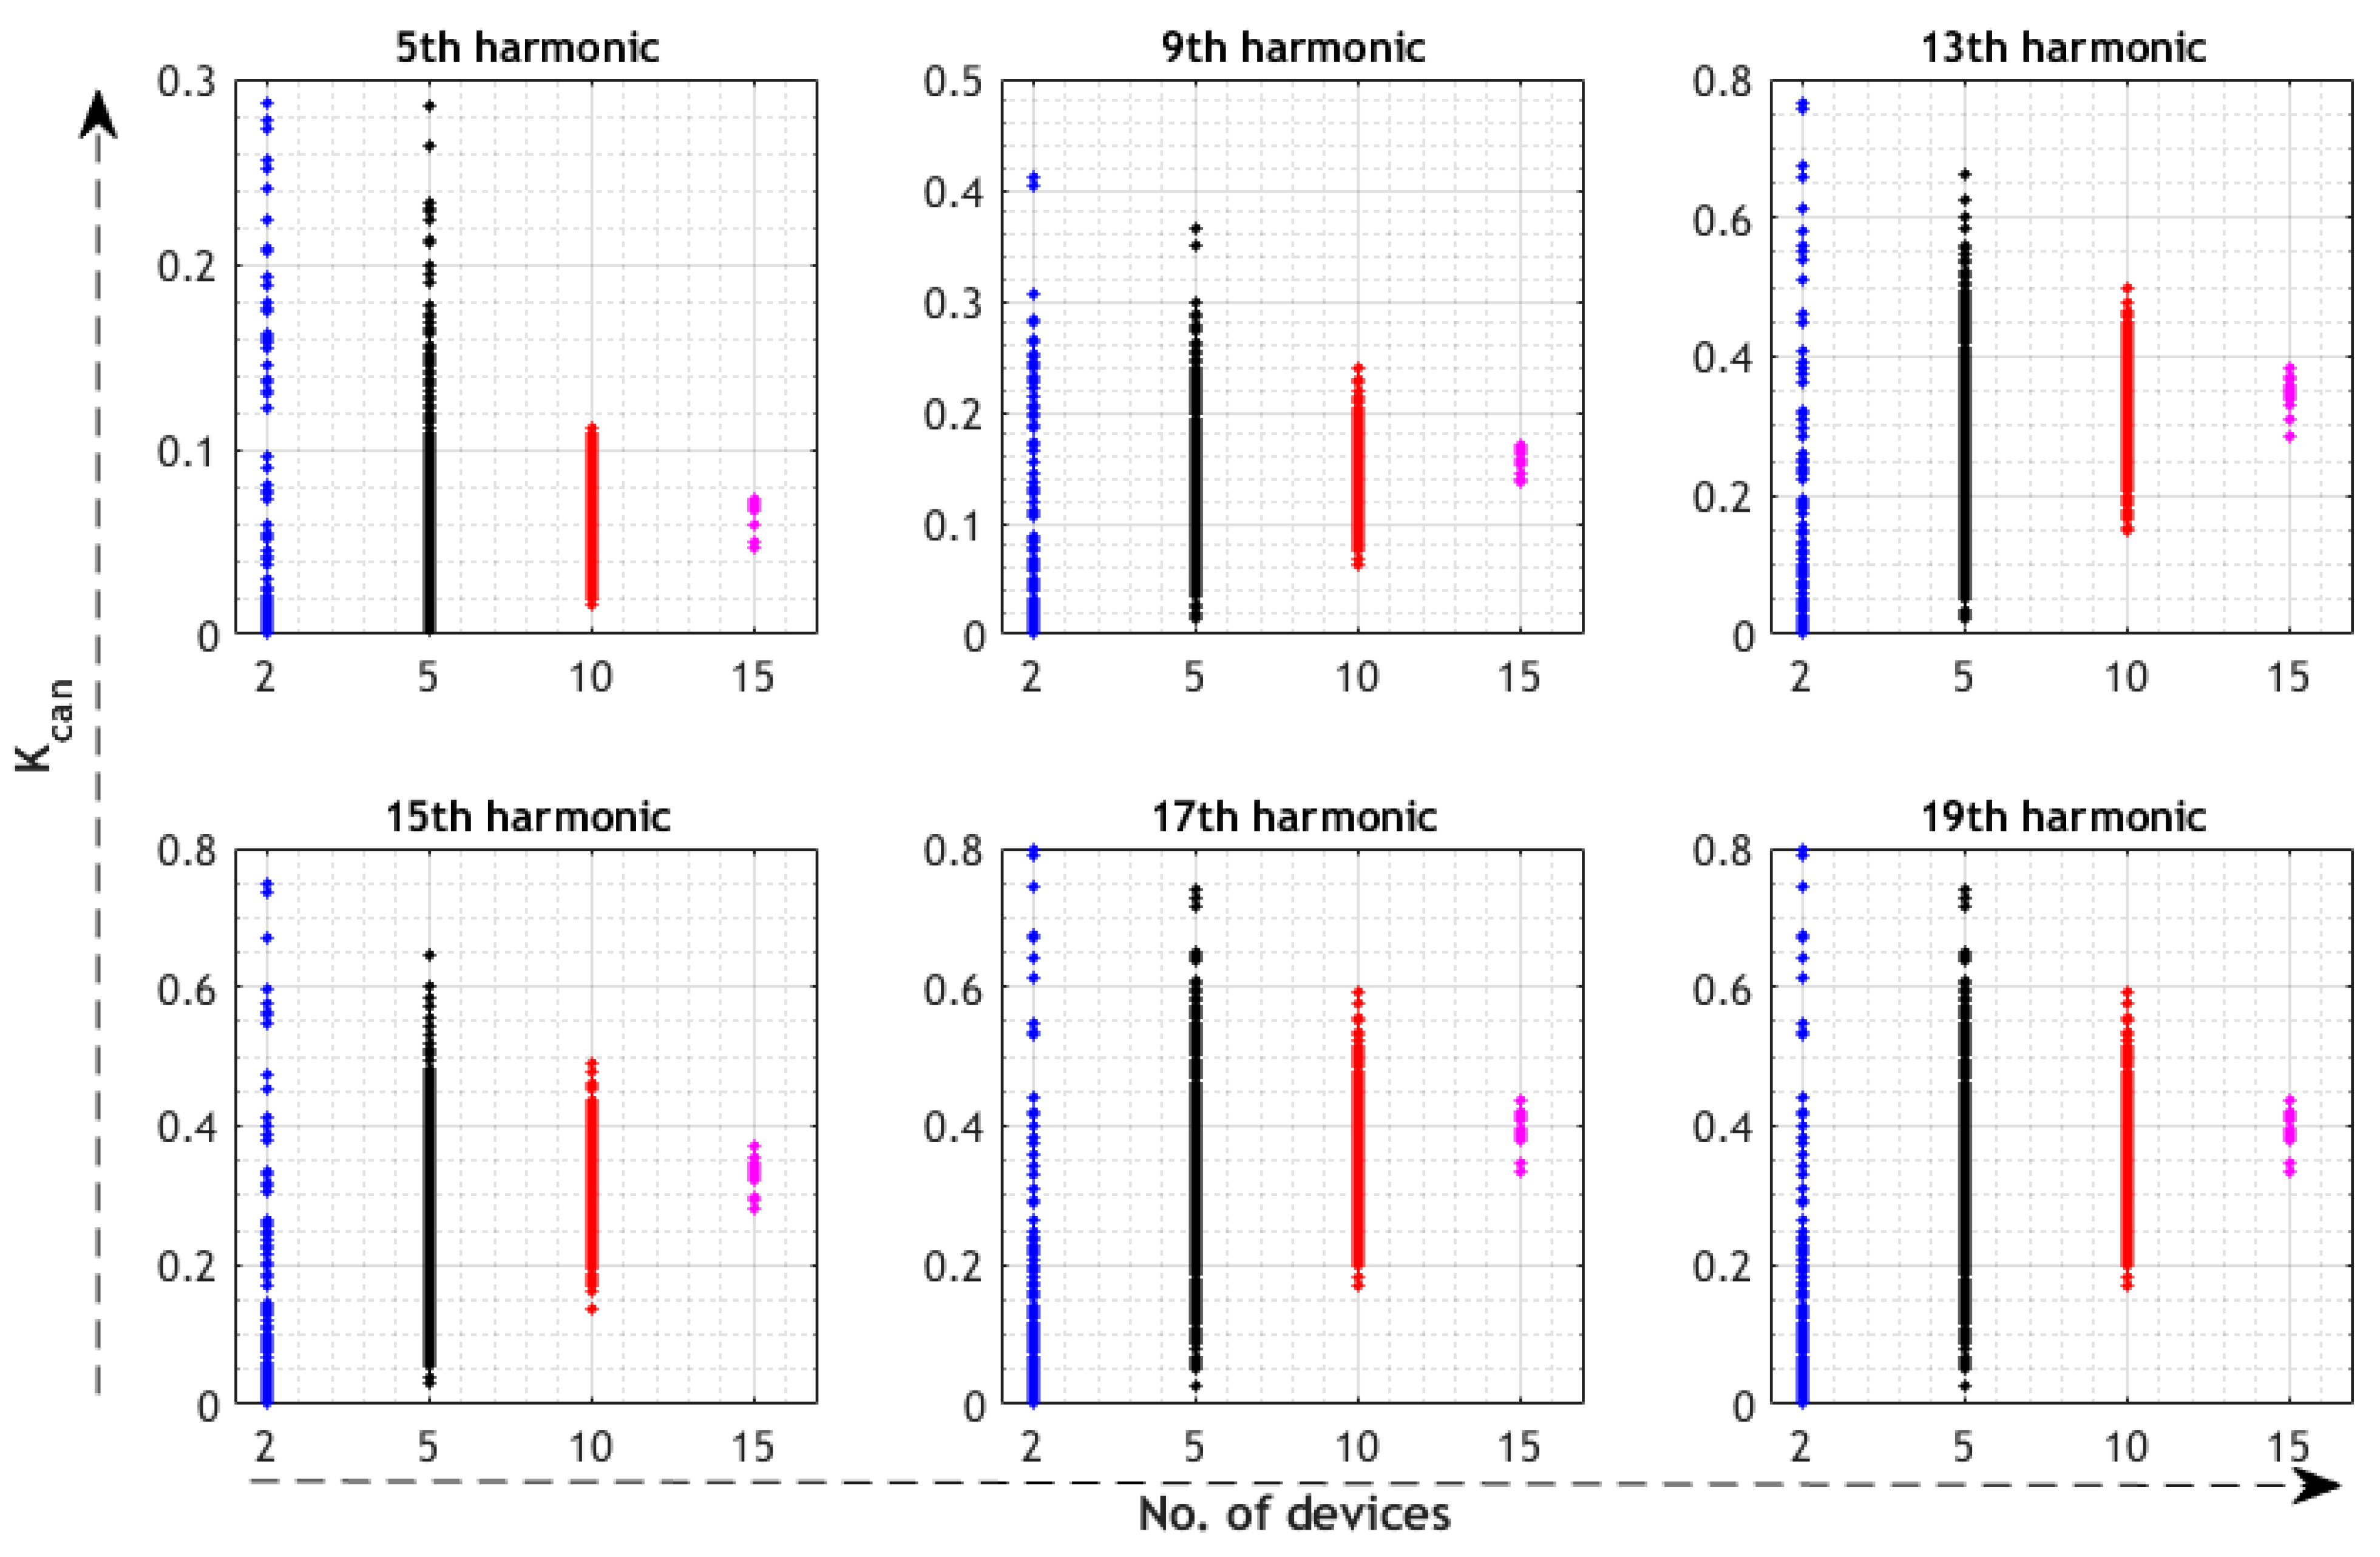
Figure 9 illustrates the cancellation coefficient for harmonics on the y-axis and the share of occurrence on the x-axis. More than a thousand different load scenarios are created by changing the number of loads connected at the same time. The occurrence of Kcan is higher and less scattered when the number of attached devices is increased.
The data presented in Table 3 were taken from [26]. This table summarizes the measured data EV onboard battery chargers for sinusoidal supply voltage and zero source impedance. Load scenarios are created by taking a particular combination of the EVs, and the harmonic cancellation factor is also calculated. The occurrence of Kcan of EVs is similar to the Kcan occurrence of LEDs for lower-order harmonics, as observed for the case of the fifth harmonic in Figure 9 and Figure 10. However, the distributions of the cancellation coefficients are spread further as compared to the LED lamps. This is because the EV charging loads have a different harmonic current profile than LEDs.
6. Conclusions
The harmonic currents are vital for any future load or renewable power infeed source assessment, as these are almost completely of non-linear nature. The presence of harmonic currents is in itself not a direct problem, as long as their levels in the grid are not too high. The supply will be compromised once the supply voltage harmonics of the grid increases, and will be above accepted standard levels due to the influence of the current harmonics. This means that exceeding the hosting capacity limits the capabilities of the grid. This paper addresses the basics of analysis for the addition of a significant number of non-linear endpoints to the grid, which are usable for the context of hosting capacity estimation.
The assessment of accuracy in harmonic summation and a brief investigation of the cancellation effect has been discussed in this study based on the analytic approach for the low-power load devices. Only odd harmonics are considered, starting from the 3rd to the 19th orders. Harmonic magnitudes and phase angles are seen to have a different spread of phasors on the complex plane. The harmonic cancellation effect is directly related to the number of loads connected to the point of common connection and is more visible for higher-order harmonics. In the results for lower-order harmonics, fundamental component harmonic cancellation does not emerge significantly and is below … 0.2 (3rd, 5th, …orders).
A measurement setup with a pure sine wave supply voltage is used to inject harmonic phasors to analyze the load combinations so that the aggregation and cancellation can be observed clearly. Compared to summation calculations, the resultant harmonic phasors were found to have a very miniscule difference from the phasor values measured when load combinations were connected simultaneously. It was found that while higher-order harmonics show different dispersion in magnitude and angle values than lower-order components, there are rather insignificant differences between calculated and measured values.
It is presented that the cancellation effect is more significant when the number of connected devices is increased. The cancellation coefficient of EV charging current harmonics is also compared with that of LED loads. It was observed that the cancellation coefficients of both load types show a similar distribution.
It can be seen that for the higher current harmonics, RMS-based analysis for perspective loads inclusion is not advised. The reason for this is that there is a high chance of harmonic cancellation when a large number of devices are connected to the grid. RMS-based estimation is pessimistic. It could provide an indication of higher than-actual-results that could impose some unjustified limits—for example, on the renewable energy source hosting capacity of the distribution networks. For a better assessment, analysis using more sophisticated measurement capabilities, including harmonic phase angle reporting, is advised.
It has to be noted that the supply voltage waveform provided by the utility typically contains a notable level of harmonics, which are injected by all the components connected to a utility grid. The analysis here is only presented for the sinewave voltage supply. For the real grid voltage waveform, the LED and EV harmonic currents could differ from the values provided in this paper. This will be investigated in more detail in upcoming research.
Author Contributions
Conceptualization, K.D. and L.K.; methodology, M.N.I.; software, K.D. and N.S.; validation, A.U.R., M.S. and H.H.; formal analysis, K.D. and M.S.; writing—original draft preparation, K.D.; writing—review and editing, L.K., M.N.I. and M.S. All authors have read and agreed to the published version of the manuscript.
Funding
This work was supported by the Estonian Council grant (PSG142).
Institutional Review Board Statement
Not applicable.
Informed Consent Statement
Not applicable.
Data Availability Statement
Data is contained within the article.
Acknowledgments
The authors thank the Natural Sciences and Engineering Research Council of Canada (NSERC) and New Brunswick Innovation Foundation (NBIF) for the financial support of the global project. These granting agencies did not contribute to the design of the study or the collection, analysis, and interpretation of data.
Conflicts of Interest
The authors declare no conflict of interest.
References
- Bollen, M.H.J.; Rönnberg, S.K. Hosting capacity of the power grid for renewable electricity production and new large consumption equipment. Energies 2017, 10, 1325. [Google Scholar] [CrossRef] [Green Version]
- Iqbal, M.N.; Kütt, L.; Lehtonen, M.; Millar, R.J.; Püvi, V.; Rassõlkin, A.; Demidova, G.L. Travel Activity Based Stochastic Modelling of Load and Charging State of Electric Vehicles. Sustainability 2021, 13, 1550. [Google Scholar] [CrossRef]
- Mulenga, E.; Bollen, M.H.J.; Etherden, N. A review of hosting capacity quantification methods for photovoltaics in low-voltage distribution grids. Int. J. Electr. Power Energy Syst. 2019, 115, 105445. [Google Scholar] [CrossRef]
- Bajaj, M.; Singh, A.K. Grid integrated renewable DG systems: A review of power quality challenges and state-of-the-art mitigation techniques. Int. J. Energy Res. 2020, 44, 26–69. [Google Scholar] [CrossRef]
- de Oliveira, T.E.C.; Carvalho, P.M.S.; Ribeiro, P.F.; Bonatto, B.D. PV hosting capacity dependence on harmonic voltage distortion in low-voltage grids: Model validation with experimental data. Energies 2018, 11, 465. [Google Scholar] [CrossRef] [Green Version]
- Liu, D.; Wang, C.; Tang, F.; Zhou, Y. Probabilistic assessment of hybridwind-pv hosting capacity in distribution systems. Sustainability 2020, 12, 2183. [Google Scholar] [CrossRef] [Green Version]
- Vinnal, T.; Puusepp, H.; Shabbir, N.; Iqbal, L.N. Case study of non-linear pv inverter devices attached to the lv distribution network. Agron. Res. 2020, 18, 2639–2652. [Google Scholar] [CrossRef]
- EN 50160:2010; Voltage Characteristics of Electricity Supplied by Public Distribution Networks. Cenelec: Newark, DE, USA, 2010.
- IEEE Standard II59-1995; IEEE Recommended Practice for Monitoring Electric Power Quality. IEEE: Piscataway, NJ, USA, 1995.
- Sezgin, E.; Gol, M.; Salor, O. Determination of harmonic current contributions of plants supplied from PCC based on state estimation. In Proceedings of the 2015 23nd Signal Processing and Communications Applications Conference (SIU), Malatya, Turkey, 16–19 May 2015; pp. 2062–2065. [Google Scholar] [CrossRef]
- Electromagnetic Compatibility (EMC)—Part 4–7: Testing and Measurement Techniques—General Guide on Harmonics and Interharmonics Measurements and Instrumentation, for Power Supply Systems and Equipment Connected Thereto; IEC: Geneva, Switzerland, 2002.
- Blanco, A.M.; Yanchenko, S.; Meyer, J.; Schegner, P. Impact of supply voltage distortion on the current harmonic emission of non-linear loads. Dyna 2015, 82, 150–159. [Google Scholar] [CrossRef]
- Peterson, B.; Rens, J.; Desmet, J. Harmonic emission assessment on a distribution network: The opportunity for the prevailing angle in harmonic phasors. CIRED—Open Access Proc. J. 2017, 1, 668–671. [Google Scholar] [CrossRef] [Green Version]
- Hansen, S.; Nielsen, P.; Blaabjerg, F. Harmonic cancellation by mixing nonlinear single-phase and three-phase loads. IEEE Trans. Ind. Appl. 2000, 36, 152–159. [Google Scholar] [CrossRef]
- Ye, G.; Cuk, V.; Cobben, J.F.G. A study on harmonic current summation using field measurement data. In Proceedings of the 2016 IEEE International Conference on Power System Technology (POWERCON), Wollongong, NSW, Australia, 28 September–1 October 2016; pp. 1–6. [Google Scholar] [CrossRef]
- Electromagnetic Compatibility (EMC)—Part 3-6: Assessment of Emission Limits for the Connection of Distorting Installations to MV, HV and EHV Power Systems; IEC: Geneva, Switzerland, 2008.
- Iqbal, M.N.; Lauri, K. Impact of Cable Impedance on the Harmonic Emission of LED Lamps. In Proceedings of the 21st International Scientific Conference on Electric Power Engineering (EPE), Prague, Czech Republic, 19–21 October 2020; pp. 1–6. [Google Scholar]
- Santos, A.; Duggan, G.P.; Young, P.; Frank, S.; Hughes, A.; Zimmerle, D. Harmonic cancellation within AC low voltage distribution for a realistic office environment. Int. J. Electr. Power Energy Syst. 2022, 134, 107325. [Google Scholar] [CrossRef]
- Iqbal, M.N.; Jarkovoi, M.; Kutt, L.; Shabbir, N. Impact of LED thermal stability to household lighting harmonic load current modeling. In Proceedings of the 2019 Electric Power Quality and Supply Reliability Conference (PQ) and 2019 Symposium on Electrical Engineering and Mechatronics (SEEM), Kärdla, Estonia, 12–15 June 2019. [Google Scholar] [CrossRef]
- Jarkovoi, M.; Iqbal, M.N.; Kutt, L. Analysis of harmonic current stability and summation of LED lamps. In Proceedings of the 2019 Electric Power Quality and Supply Reliability Conference (PQ) and 2019 Symposium on Electrical Engineering and Mechatronics (SEEM), Kärdla, Estonia, 12–15 June 2019; pp. 1–8. [Google Scholar] [CrossRef]
- Iqbal, M.N.; Kütt, L.; Asad, B.; Shabbir, N.; Rasheed, I. Time-dependent variations in current harmonic emission by LED lamps in the low-voltage network. Electr. Eng. 2021, 103, 1525–1539. [Google Scholar] [CrossRef]
- Electromagnetic Compatibility (EMC)—Part 4–30: Testing and Measurement Techniques—Power Quality Measurement Methods; IEC: Geneva, Switzerland, 2003.
- Iqbal, M.N.; Kutt, L.; Shabbir, N.; Asad, B. Comparison of Current Harmonic Emission by Different Lighting Technologies. In Proceedings of the 2020 IEEE 61th International Scientific Conference on Power and Electrical Engineering of Riga Technical University (RTUCON), Riga, Latvia, 5–7 November 2020; pp. 1–6. [Google Scholar] [CrossRef]
- Markiewicz, H.; Klajn, A. Standard EN 50160—Voltage Characteristics in Public Distribution Systems: Voltage Disturbances; European Copper Institute: Brussels, Belgium, 2004. [Google Scholar]
- Meyer, J.; Blanco, A.-M.; Domagk, M.; Schegner, P. Assessment of Prevailing Harmonic Current Emission in Public Low-Voltage Networks. IEEE Trans. Power Deliv. 2017, 32, 962–970. [Google Scholar] [CrossRef]
- Kutt, L.; Saarijarvi, E.; Lehtonen, M.; Molder, H.; Niitsoo, J. Estimating the harmonic distortions in a distribution network supplying EV charging load using practical source data—Case example. In Proceedings of the IEEE Power and Energy Society General Meeting, National Harbor, MD, USA, 27–31 July 2014. [Google Scholar] [CrossRef]
- Paget, M. Summary of Results: Round 13 of Product Testing. 2009; pp. 1–33. Available online: http://apps1.eere.energy.gov/buildings/publications/pdfs/ssl/caliper_round13_summary.pdf%5Cnpapers2://publication/uuid/86DAF28E-BE4C-480C-8775-898D90AD5627 (accessed on 16 November 2021).
- Iqbal, M.N.; Kütt, L.; Daniel, K.; Asad, B.; Ghahfarokhi, P.S. Estimation of harmonic emission of electric vehicles and their impact on low voltage residential network. Sustainability 2021, 13, 8551. [Google Scholar] [CrossRef]
- Kutt, L.; Saarijärvi, E.; Lehtonen, M.; Mõlder, H.; Niitsoo, J. Electric Vehicle Charger Load Current Harmonics Variations due to Supply Voltage Level Differences-Case Examples. In Proceedings of the 2014 International Symposium on Power Electronics, Electrical Drives, Automation and Motion, Ischia, Italy, 18–20 June 2014. [Google Scholar] [CrossRef]
- Iqbal, M.N.; Kütt, L.; Daniel, K.; Jarkovoi, M.; Asad, B.; Shabbir, N. Bivariate stochastic model of current harmonic analysis in the low voltage distribution grid. Proc. Est. Acad. Sci. 2021, 70, 190. [Google Scholar] [CrossRef]
Figure 1.
Determining the magnitude and phase angle difference of measured (brown) and calculated (blue) values.
Figure 1.
Determining the magnitude and phase angle difference of measured (brown) and calculated (blue) values.

Figure 2.
Measurement setup.

Figure 3.
Current harmonics in lamps.

Figure 4.
Measured harmonic currents’ RMS levels (with respect to RMS of fundamental harmonic current components) of 120 lamp combinations.
Figure 4.
Measured harmonic currents’ RMS levels (with respect to RMS of fundamental harmonic current components) of 120 lamp combinations.

Figure 5.
Third harmonic current vectors of all lamp combinations.

Figure 6.
Harmonic RMS and phase values of all lamp combinations.

Figure 7.
Percentage of RMS difference and phase angle difference in the calculated and measured results of LED loads.
Figure 7.
Percentage of RMS difference and phase angle difference in the calculated and measured results of LED loads.

Figure 8.
Harmonic cancellation effect of LED loads (no. of load scenarios/combinations on y-axis and cancellation coefficient on the x-axis) (number of combinations reported).
Figure 8.
Harmonic cancellation effect of LED loads (no. of load scenarios/combinations on y-axis and cancellation coefficient on the x-axis) (number of combinations reported).

Figure 9.
Harmonic cancellation coefficient of LED load devices operating at the same time.

Figure 10.
Harmonic cancellation effect of EV loads.


Table 1.
Parameters of lamps used for testing.
| Lamp No. | Lamp Rated Power (W) | Lamp Rated Luminance (Lm) | Measured THDI (%) |
|---|---|---|---|
| 1 | 14 | 1521 | 145 |
| 2 | 10 | 1055 | 164 |
| 3 | 9 | 810 | 135 |
| 4 | 12 | 1055 | 149 |
| 5 | 12 | 900 | 134 |
| 6 | 10 | 800 | 148 |
| 7 | 12 | 1055 | 152 |
| 8 | 9 | 1055 | 162 |
| 9 | 8 | 806 | 46 |
| 10 | 11 | 1060 | 28 |
| 11 | 9 | 806 | 139 |
| 12 | 10.5 | 1060 | 136 |
| 13 | 9.8 | 806 | 52.7 |
| 14 | 10 | 1055 | 135 |
| 15 | 11 | 1055 | 154 |
| 16 | 17 | 1521 | 134 |
Table 2.
Measured harmonics’ current characteristics for individual lamps.
| Lamp No. | I3 | ϴI3 | I5 | ϴI5 | I7 | ϴI7 | I13 | ϴI13 | I19 | ϴI19 |
|---|---|---|---|---|---|---|---|---|---|---|
| 1 | 0.059 | −123 | 0.048 | 97 | 0.036 | −40 | 0.013 | −34 | 0.01 | −38 |
| 2 | 0.04 | −128 | 0.035 | 87 | 0.028 | −55 | 0.011 | −92 | 0.009 | −100 |
| 3 | 0.034 | −120 | 0.028 | 101 | 0.021 | −33 | 0.008 | −19 | 0.007 | −18 |
| 4 | 0.05 | −126 | 0.042 | 91 | 0.032 | −49 | 0.012 | −60 | 0.009 | −69 |
| 5 | 0.046 | −116 | 0.036 | 108 | 0.025 | −22 | 0.011 | 13 | 0.007 | 32 |
| 6 | 0.035 | −127 | 0.029 | 89 | 0.023 | −52 | 0.009 | −69 | 0.008 | −81 |
| 7 | 0.049 | −128 | 0.041 | 89 | 0.032 | −53 | 0.011 | −71 | 0.009 | −82 |
| 8 | 0.034 | −136 | 0.03 | 73 | 0.025 | −76 | 0.009 | −141 | 0.006 | −154 |
| 9 | 0.015 | −6 | 0.008 | −10 | 0.005 | −15 | 0.001 | −39 | 0.0003 | −84 |
| 10 | 0.011 | −19 | 0.006 | −17 | 0.004 | −12 | 0.002 | −44 | 0.001 | −107 |
| 11 | 0.037 | −117 | 0.03 | 107 | 0.022 | −25 | 0.01 | −1 | 0.007 | 10 |
| 12 | 0.044 | −126 | 0.035 | 92 | 0.025 | −46 | 0.009 | −35 | 0.005 | −40 |
| 13 | 0.018 | −166 | 0.005 | 15 | 0.007 | 25 | 0.004 | 51 | 0.003 | 78 |
| 14 | 0.042 | −117 | 0.033 | 108 | 0.023 | −22 | 0.01 | 12 | 0.006 | 28 |
| 15 | 0.044 | −135 | 0.038 | 75 | 0.03 | −72 | 0.01 | −114 | 0.009 | −137 |
| 16 | 0.072 | −114 | 0.057 | 113 | 0.039 | −15 | 0.017 | 26 | 0.011 | 51 |
 |  |  |  |  | ||||||
Table 3.
Measured harmonics for individual EVs.
| EV No. | Prated (kW) | THDI (%) | I1 | ϴI1 | I3 | ϴI3 | I5 | ϴI5 | I7 | ϴI7 |
|---|---|---|---|---|---|---|---|---|---|---|
| 1 | 7.7 | 5.1 | 27.9 | −1 | 0.7 | 165 | 0.2 | 12 | 0.1 | 33 |
| 2 | 7.4 | 4.4 | 31.0 | −1 | 0.9 | 177 | 0.4 | 171 | 0.5 | 164 |
| 3 | 3.3 | 7.9 | 13.9 | 3 | 1.0 | −154 | 0.2 | −167 | 0.2 | −172 |
| 4 | 3.3 | 2.9 | 15.1 | 7 | 0.2 | −74 | 0.1 | −129 | 0.1 | −85 |
| 5 | 3.3 | 11.9 | 15.9 | 7 | 1.8 | −110 | 0.1 | 47 | 0.1 | −70 |
| 6 | 3.3 | 5.4 | 15.5 | 1 | 0.5 | −177 | 0.3 | −174 | 0.2 | −179 |
| 7 | 7.2 | 2.9 | 15.4 | 5 | 0.2 | −68 | 0.2 | −128 | 0.1 | −82 |
| 8 | 3.3 | 3.1 | 9.6 | 3 | 0.3 | −3 | 0.0 | −25 | 0.0 | −36 |
| 9 | 2.75 | 7.4 | 13.1 | 5 | 0.9 | −141 | 0.0 | 6 | 0.0 | −66 |
| 10 | 3.3 | 3.2 | 15.3 | 4 | 0.4 | −126 | 0.1 | −160 | 0.1 | −168 |
| 11 | 16.8 | 5.9 | 28.7 | 14 | 1.6 | −166 | 0.0 | −94 | 0.1 | −47 |
| 12 | 3.3 | 7.2 | 14.7 | 2 | 0.9 | −166 | 0.5 | −178 | 0.3 | 147 |
| 13 | 3.3 | 1.7 | 9.5 | 3 | 0.1 | −155 | 0.1 | −90 | 0.1 | −139 |
| 14 | 3.3 | 5.7 | 9.0 | 0 | 0.3 | 137 | 0.2 | 27 | 0.1 | −118 |
| 15 | 6.1 | 2.8 | 14.2 | 3 | 0.3 | −173 | 0.1 | 167 | 0.1 | −144 |
| 16 | 7.4/22 | 9.4 | 30.7 | 12 | 0.1 | 168 | 1.8 | 161 | 0.6 | 86 |
Publisher’s Note: MDPI stays neutral with regard to jurisdictional claims in published maps and institutional affiliations. |
© 2022 by the authors. Licensee MDPI, Basel, Switzerland. This article is an open access article distributed under the terms and conditions of the Creative Commons Attribution (CC BY) license (https://creativecommons.org/licenses/by/4.0/).
Share and Cite
MDPI and ACS Style
Daniel, K.; Kütt, L.; Iqbal, M.N.; Shabbir, N.; Rehman, A.U.; Shafiq, M.; Hamam, H. Current Harmonic Aggregation Cases for Contemporary Loads. Energies 2022, 15, 437. https://0-doi-org.brum.beds.ac.uk/10.3390/en15020437
AMA Style
Daniel K, Kütt L, Iqbal MN, Shabbir N, Rehman AU, Shafiq M, Hamam H. Current Harmonic Aggregation Cases for Contemporary Loads. Energies. 2022; 15(2):437. https://0-doi-org.brum.beds.ac.uk/10.3390/en15020437
Chicago/Turabian StyleDaniel, Kamran, Lauri Kütt, Muhammad Naveed Iqbal, Noman Shabbir, Ateeq Ur Rehman, Muhammad Shafiq, and Habib Hamam. 2022. "Current Harmonic Aggregation Cases for Contemporary Loads" Energies 15, no. 2: 437. https://0-doi-org.brum.beds.ac.uk/10.3390/en15020437
Note that from the first issue of 2016, this journal uses article numbers instead of page numbers. See further details here.