
Effects of Future Climate Change and Adaptation Measures on Summer Comfort of Modern Homes across the Regions of the UK


School of Engineering and Sustainable Development, Faculty of Computing, Engineering and Media, De Montfort University, Leicester LE1 9BH, UK
*
Author to whom correspondence should be addressed.
Energies 2022, 15(2), 512; https://0-doi-org.brum.beds.ac.uk/10.3390/en15020512
Submission received: 13 October 2021
/
Revised: 3 December 2021
/
Accepted: 7 December 2021
/
Published: 12 January 2022
(This article belongs to the Section G: Energy and Buildings)
Abstract
:The global climate is warming rapidly, with increasing frequency of severe events including heatwaves. Building insulation standards are improving to reduce emissions, but this can also lead to more overheating. Historically, UK house designers have not included adaptation measures to limit this. Most studies of the problem have had limited geographical or future climate scope. This study considers the comfort performance of a small modern house, in detached, semi-detached, and terrace (row) forms, but otherwise identical. Overheating is evaluated according to established criteria, including night-time bedroom hours over 26 °C. Simulations are carried out using median future weather years for current, 2030s, 2050s, and 2080s climates under medium- and high-emission scenarios for 14 regions of the UK. The results show a very large increase in overheating by the 2080s in all regions. With solar shading and natural ventilation, overheating is reduced considerably, maintaining comfort in most northern regions in the 2050s and a few northern regions in the 2080s. Differences between medium and high emissions are generally less than between different decades. Terraced (row) houses consistently overheat slightly more than semi-detached, with detached showing the least overheating.
1. Introduction
There is now widespread scientific agreement that the global climate is warming, mainly because of man’s activities. According to the IPCC [1], “Warming of the climate system is unequivocal, and since the 1950s, many of the observed changes are unprecedented over decades to millennia”, noting also fewer cold and more warm days and nights, and more heatwaves. Since this was published, there have been exceptional heatwaves in many parts of the world, including Europe in 2018 and in Siberia in 2020, where the temperature reached a record 38 °C, and there were major forest fires and melting of permafrost [2]. The authors conclude that the temperature “would be at least 2 °C cooler in a world without human influence”. In the northern European 2018 heatwave, many daily maximum temperatures surpassed previous records by a wide margin, and several locations in France recorded temperatures above 40 °C; the heat caused 1500 deaths in that country [3,4]. A new all-time temperature record of 38.7 °C was set for the UK in Cambridge in late July, in what the UK Met Office described as “brief but exceptional heatwave” [5]. In summer 2021, there was exceptional extreme weather around the world, with a severe heatwave in North America breaking previous Canadian temperature records by a large margin and causing many fires [6], a heatwave and fires in Greece, and devastating floods in Germany [7] and China [8]. All these events caused many deaths and were firmly linked to climate change by scientists.
The UK Climate Change Risk Assessment 2017 [9] notes that heat-related deaths could more than double by the 2050s, with urgent action needed to address the impacts of overheating and the urban heat island effect.
According to Committee on Climate Change Progress Report to the UK Parliament [10], UK homes in 2017 accounted for around 14% of total direct greenhouse gas emissions (71 MtCO2), from burning fuel (mainly gas) on site, and a further 6% indirectly for grid electricity (data from UK’s Department for Business, Energy, and Industrial Strategy, shown in Figure 3.1 in [10]). Direct and indirect emissions related to all buildings accounted for 30% of the UK total, including electricity. The UK has been successful in reducing carbon emissions over many years, but 75% of the reduction from 2012 to 2017 was from the power sector, while the average annual reduction in direct emissions over this period from residential was just 1% (Table 3.2 in [10]). Thus, there is great pressure to reduce emissions more quickly from buildings.
Proposed measures include upgrading existing homes, raising standards to make new buildings more efficient, and decarbonising heat. However, the report also acknowledges the risks of overheating and the need for better regulations at the design stage. Empirical studies, modelling, and analysis from first principles have demonstrated the tendency of well-insulated homes (whether refurbished or new build, but particularly the latter) to overheat [11,12,13,14,15,16,17]; although, large simulation studies have shown that overheating resulted from many factors, and insulation could increase or decrease overheating depending on the design [18,19]; Vandentorren et al. [20] note that in the 2003 heatwave in France, deaths were associated with lack of insulation and sleeping on the top floor. Most studies have only considered one or a small number of locations and usually one or a small number of future climate change scenarios and decades.
1.1. Reasons for Overheating
The influences on overheating are many and complex, but some key factors emerge, from both empirical and simulation studies, summarised in Table 1. While the relative effects of these will vary with each building and room, in the authors’ view the most important are typically: area of glazing and shading, ventilation, and insulation.
1.2. Future Climate Data for Simulation
Climate scenarios and datasets for the UK have evolved, and the relationships between them are summarised in Table 2. Most earlier projections were based on the UK Climate Impacts Programme 2002 (UKCIP02) [26] datasets. This used the four scenarios (taken from the Special Report on Emission Scenarios (SRES) [27] set of scenarios produced by the IPCC) described in Table 2. The actual data are generated by producing an ensemble of three simulations (different only due to the stochastic nature of the climate) for the A2 scenario in a global model for two 30 periods; the baseline period 1961–1990, and 2071–2100 representing the 2080s. Other periods and scenarios are derived from these using a rather complex process of regional models and scaling; this is described in detail in [26]. In this exercise, there was no probabilistic dataset, just a climate for different decades and emission scenarios.
The UKCIP02 data did not provide hourly weather files suitable for building simulation. To address this, a “morphing” technique was developed by Belcher et al. [31], which transformed a weather year for the current climate into a “future” weather year. Three algorithms are used, depending on the variable: a shift by adding the predicted future average change; a “stretch” of an hourly weather data parameter by multiplying it using the predicted relative monthly mean change, or a combination of these, the latter being used for temperature [22]. This was applied to the CIBSE test reference years (12 average real months combined), representing current climate for 14 different UK locations, and near-extreme CIBSE design summer years (selected on average temperature April to September, with 1 year in 8 exceedance) [32]. This process created future TRY and DSY years for different decades using the UKCIP02 projected climate changes [33].
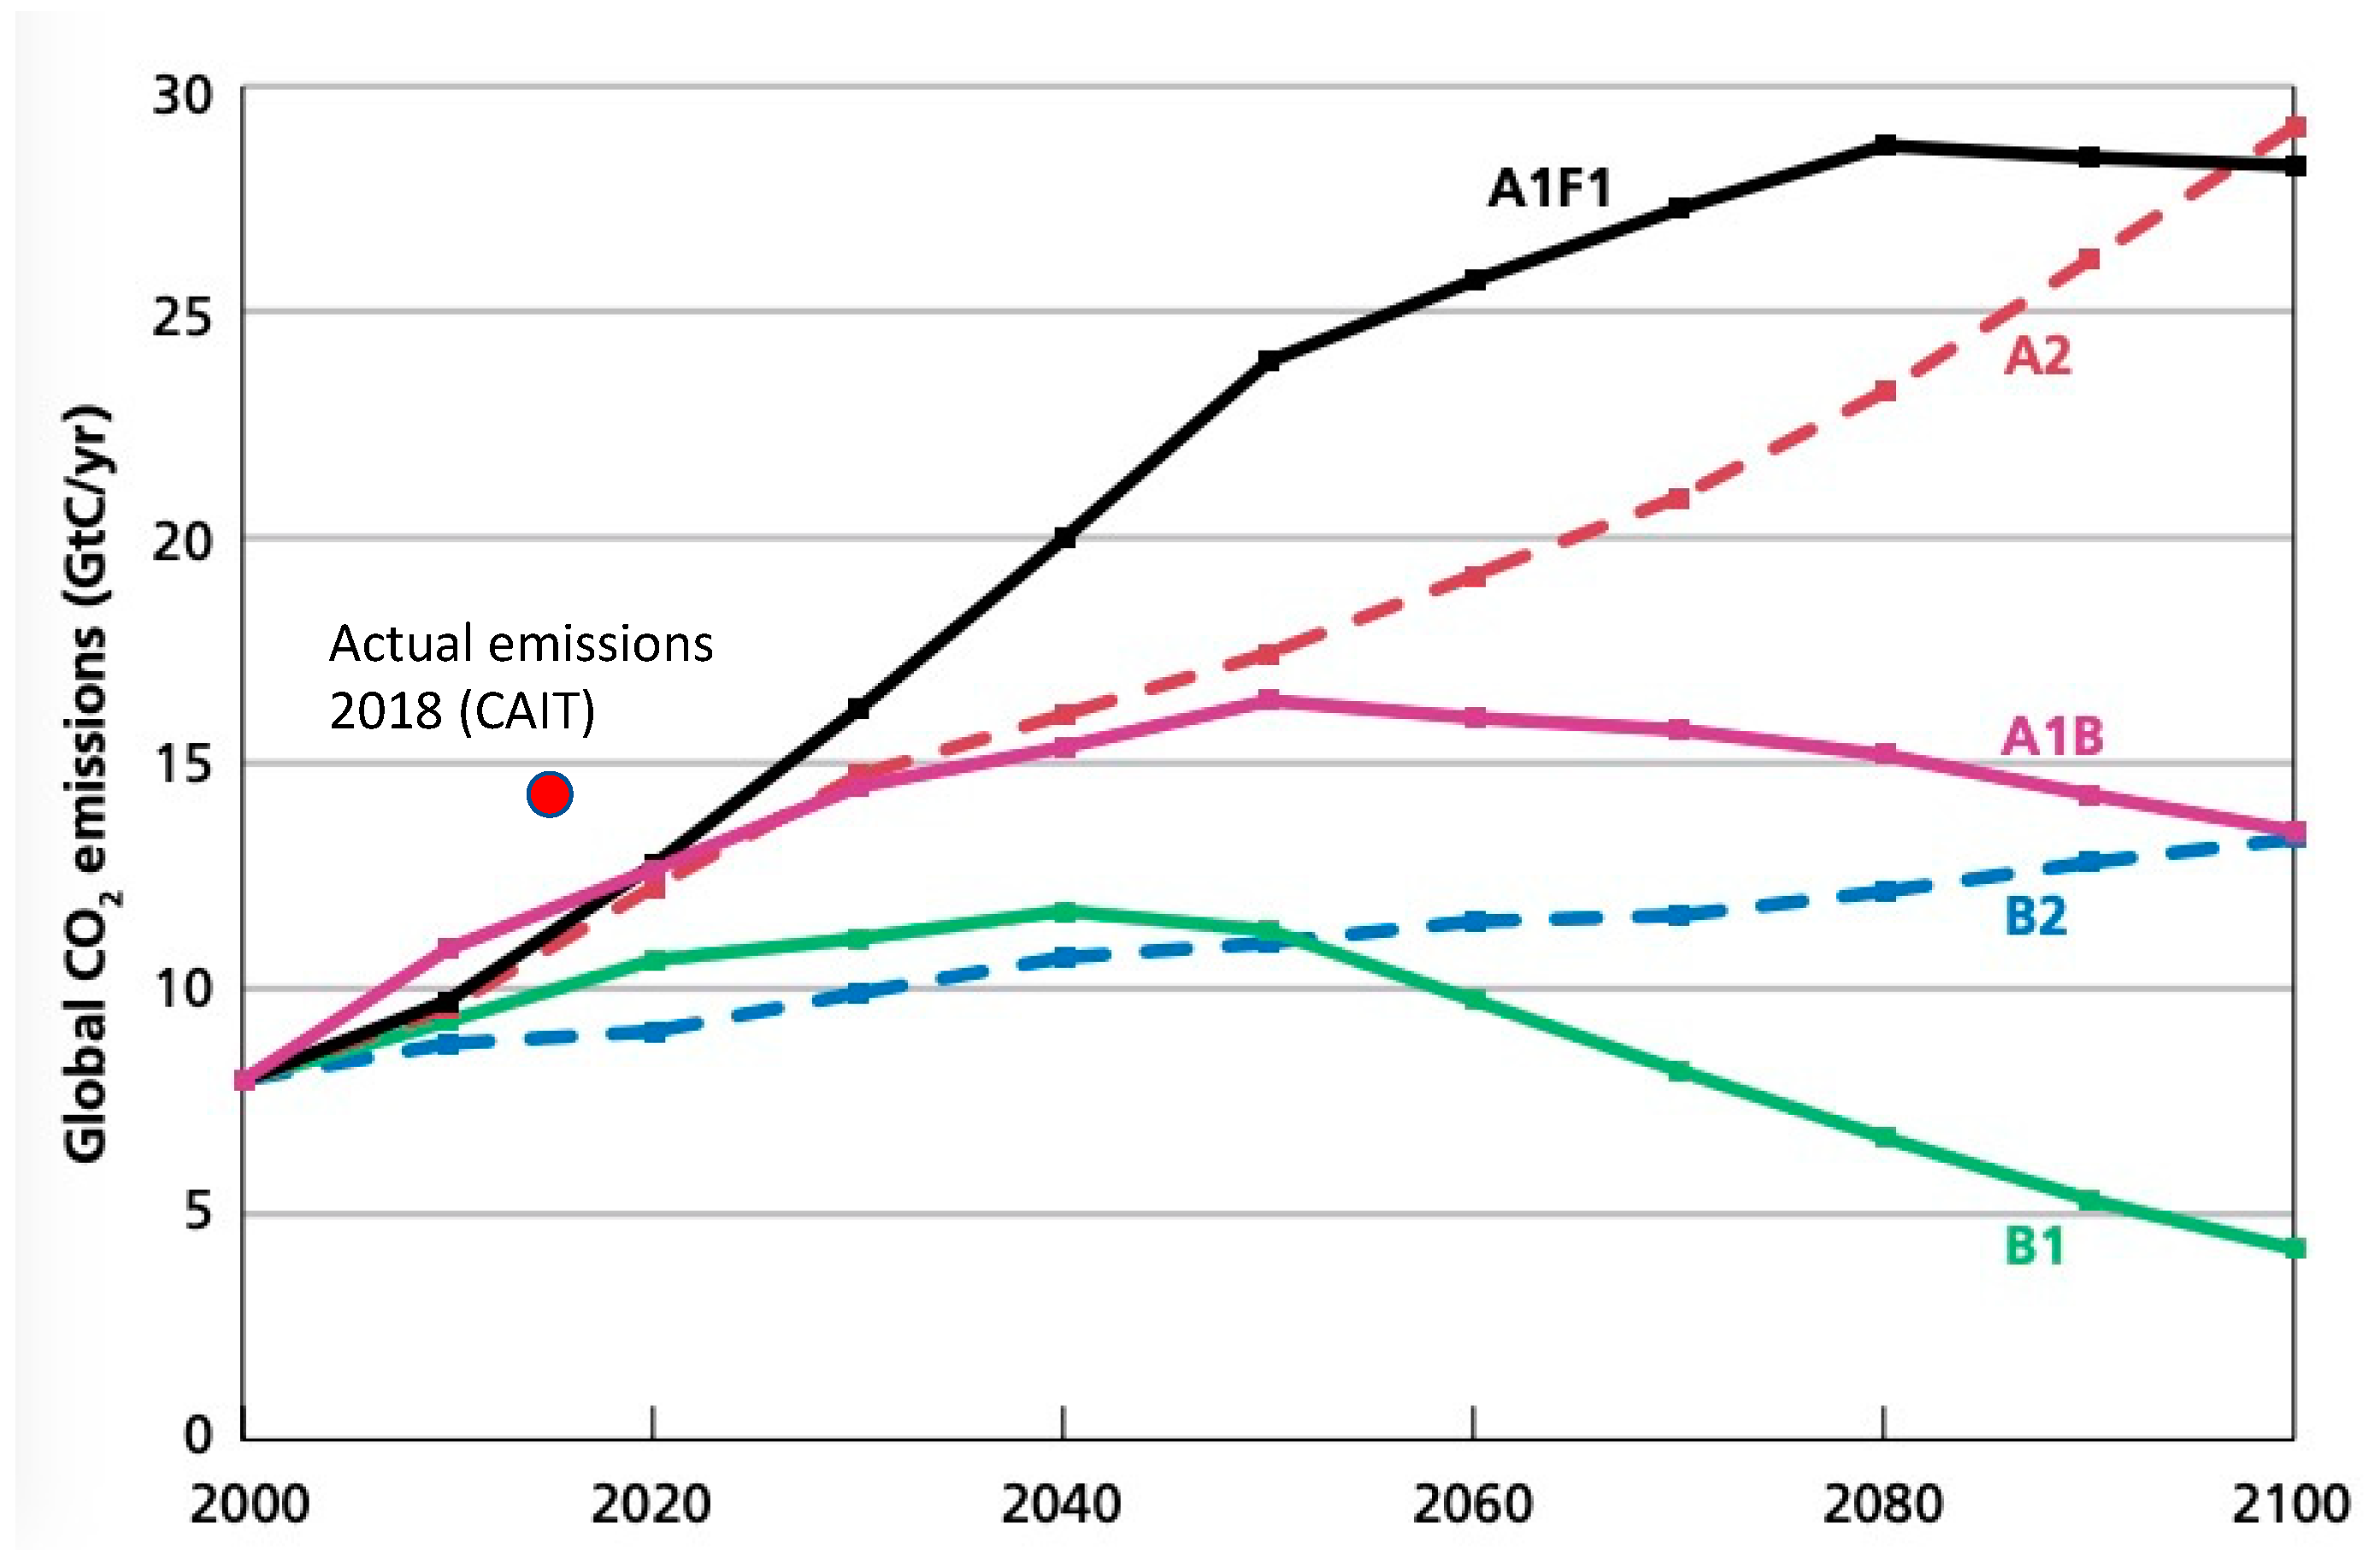
With much more computing power available for the UKCP09 (2009) dataset, there was improved spatial and temporal resolution, as well as improvements to the underlying climate science. This used three main emission scenarios, as listed in Table 2 and shown in Figure 1. Superimposed is a red dot showing actual emissions for 2018, using the Climate Analysis Indicators Tool (CAIT) dataset; data are lagged by 3 years, from Climate Watch [34]. This was 48.9 GtCO2 equivalent, which is 13.3 GtC, applying the conversion factor of 12/44. Climate Watch describes the CAIT data as “the most comprehensive included on Climate Watch and includes all sectors and gases.” Although caution is needed with any emissions estimate, this suggests the world is on track for emissions higher even than A1F1 at least in the short term, despite a temporary dip in 2019–2020 resulting from COVID-19.
These projections also provided a weather generator (WG), which can produce any number of stochastic weather years for the same climate (by slightly varying initial conditions). The WG uses rainfall to generate other variables using empirical statistical relationships. It has also been used to generate new sets of TRY and DSY weather years [33,35]. This has the advantage that any location can be used, down to the 5 km grid resolution of UKCP09—however, the link with the original TRY or DSY is lost, even if one of the 14 original CIBSE weather locations is used.
Climate for each decade is modelled over 30 years to represent the middle decade (for example, 2041 to 2070 for the 2050s climate). For each location and climate decade, the WG is run over the 30-year period, 100 times, to produce 100 × 30-year datasets; 3000 weather years in total. As there are 100 datasets, both TRYs and DSYs can be produced at a different level of risk (each month is ranked individually), for different UK regions, different decades, and different emission scenarios. The PROMETHEUS project produced these at the 10th, 33rd, 50th, 66th, and 90th percentiles for the regions of the UK. So, for example, the 33rd percentile TRY, consisting of the 33% January + 33% February +… 33% December has months with a 67/100 or approximately 2/3 chance of being exceeded in that decade, in terms of dry bulb temperature, if the modelling is correct; while the 90th percentile TRY has a 1 in 10 chance of being exceeded in that decade, per month, if the modelling is correct. For further details, see [33,35]. The 50th percentile or median TRY/DSY years correspond statistically to the UKCIP02 TRY/DSYs for the same scenario. (Note that percentile TRY or DSY years are not possible with historic data, as there is only one, real period of data, compared with the 100 periods produced by a WG.)
The most recent set of UK climate projections was published in 2018 and called UKCP18 [36]. This provides greater spatial resolution again, down to 2.2 km, and probabilistic risk data without using a weather generator, unlike UKCP09. It also uses a different set of emission scenarios, with different representative concentration pathways (RCPs), taking into account a better understanding of future changes in population, economic development, and mitigation. “The RCPs are expressed for future radiative forcing targets in 2100 of 2.6, 4.5, 6.0 and 8.5 W m-2, and these targets are incorporated into the names of the RCPs; RCP2.6, RCP4.5, RCP6.0 and RCP8.5 pathways” [36]. (Note that the label numbers are radiative forcing and not projected temperature rise.) The radiative forcing is the difference between average solar insolation absorbed by the Earth and energy radiated back to space; in a stable climate, these are in balance, so the value is zero. A comparison is made between these new scenarios and the UKCP09 in [30] and Table 3. Use of a weather generator is replaced by daily data from global and regional models and sub-daily data from 2.2 km regional projections. So far, weather data for building simulation from these projections are not generally available; although, the datasets produced in UKCP18 have the potential to provide the most scientifically rigorous weather data for this purpose. This study uses the 2009 high and medium scenarios (see Table 2); the high scenario most closely resembles the 2018 RCP 6.0 scenario, but there is no 2018 scenario corresponding to the 2009 medium scenario.
1.3. Previous Studies of Future Climate Impacts
There have been many simulation studies of the impact of future climate on UK dwellings, mostly in English locations. Some of these are summarised in Table 3. Study A shows that solar shading, high thermal mass, and appropriate ventilation can significantly reduce overheating, and that overheating increases dramatically for the 2080s. Study B shows that the maximum and mean internal temperatures in summer increase linearly with changes in the external maximum and mean temperatures, respectively, for a range of building types and current and future climate years and that high mass houses have consistently lower temperatures than low mass houses. Study C found mixed effects of insulation: internally retrofitted walls and floors tended to increase daytime temperatures, while window upgrades and roof insulation reduced these in the hottest periods; although, this study assumed that windows were closed at night.
In Study D of two highly insulated dwellings, using the three CIBSE TM 52 criteria [37], there was no overheating in the 2030s, a small amount in the 2050s, and failure of criteria 1 and 2 in all three rooms studied for both house types. Study E, with different dwelling types in each location shows little overheating in the 2030s or 2050s using a median weather year, but a large increase in overheating in the 2050s for the 90% probability (10% chance of exceedance) warmer weather year. Overheating was greatest in Oxford; shading was found to be very effective in mitigating overheating, and external insulation more effective than internal. Study F, linked to E, only considered the future Oxford climate. Four retrofit packages were applied to a range of existing house types, which all reduced overheating. A large amount of overheating was observed for the 90% probability 2080s year—from over 500 h in the detached and semi-detached and over 1200 h in the mid-terrace and purpose-built flat for all mitigation packages. Shading, high albedo external surfaces, and external insulation were noted as being effective; although, there were considerable differences in their impact between dwelling types. Study G used simulation and genetic algorithms to optimise five house types for energy use and overheating, varying orientation, wall type, insulation, and glazing (without shading). It showed that energy use and overheating are generally negatively correlated. Masonry construction was found to outperform timber frame due to the thermal bridging of the timber limiting insulation for energy reduction and thermal mass benefits of masonry for overheating. High levels of overheating, greater than 400 h, were found for the 2050s in even the optimised variants in most cases.

Table 3.
Summary of some studies on climate change impacts on UK dwellings using building simulation.
Table 3.
Summary of some studies on climate change impacts on UK dwellings using building simulation.
| Study | Built Form | Climate Scenarios | Temporal | Spatial |
|---|---|---|---|---|
| A—Climate change and the indoor environment: impacts and adaptation (CIBSE TM 36); 2005 [38] | 19th C semi-detached house; new-build house with 3 levels of thermal mass; 1960s flat; new-build flat. | UKCIP02: A2, A1F1, B2, B1; morphed design summer years (DSY) | 2020s 2050s 2080s | London Manchester Edinburgh |
| B—Changes in internal temperatures within the built environment as a response to a changing climate; 2010 [22] | Many combinations of future weather, ventilation, thermal mass, glazing, U-values, for house, school, apartment, office. | UKCIP02: low, medium–low, medium–high, and high emissions; morphed design summer years (DSY) | 2080s | London |
| C—Building characteristics as determinants of propensity to high indoor summer temperatures in London dwellings; 2012 [19] | 15 London dwelling archetypes, with 27 variants, different orientations, etc., 3456 combinations in total. | UKCP09, PROMETHEUS weather generator: 50th percentile of external temperature, 2050s, medium-emission scenario. | 2050s | London |
| D—Assessing energy use and overheating risk in net zero energy dwellings in UK; 2010 [14] | Detached and semi-detached dwellings; variants from typical stock 2010, to near zero carbon with renewable energy. | UKCP09, PROMETHEUS weather generator: high emissions, 50% probability (median) | 2030s 2050s 2080s | York |
| E—Preventing the overheating of English suburban homes in a warming climate, 2013 [39] | Detached, semi-detached, mid-terrace, flat typical of local stock in each area | UKCP09, PROMETHEUS weather generator: medium emissions 50% probability (median) and high emissions 90% probability [not exceeded]. | 2030s 2050s | Bristol, Oxford, Stockport. |
| F—Using UK climate change projections to adapt existing English homes for a warming climate, 2012 [40] | Detached, semi-detached, mid-terraced, and purpose-built flat, typical 1919–1980 England stock. | UKCP09, PROMETHEUS weather generator: high emissions, 90% probability. | 2030s 2050s 2080s | Oxford |
| G—Optimization of dwelling design under current and future climates using parametric simulations in EnergyPlus [41] | Detached, semi-detached, end- and mid-terraced, modern homes optimised for CO2 and overheating. | UKCP09, PROMETHEUS weather generator: medium (A1B) and high (A1F1) 50% probability (median). | 2050s | London (Heathrow) |
| H—Effect of window opening on summer comfort in UK dwellings in future climates [24] | Semi-detached. | UKCP09, PROMETHEUS weather generator: no more details. | 2030s 2050s 2080s | London Manchester Edinburgh Birmingham Belfast |
These examples illustrate the many dimensions that can be modelled. These include built form, design details (insulation, shading, etc.), orientation, location, climate decade, emission scenario, and in the case of probabilistic climate data, the risk level, as represented by percentile. The studies in Table 3 cover only one to five locations and one to three climate decades.
The aim of this paper is to present results for domestic overheating across all the 14 regions of the UK (see Table 4) and three future decades under two emission scenarios. This goes further than most previous work in its geographic and temporal dimensions.
2. Methods
In this study, IES-VE software (2018 version) from Integrated Environmental Solutions Limited was used to simulate regular terraced, semi-detached, and detached houses, for different regions of the UK, using future climate data. Summer comfort was then assessed for the base case, and with the addition of solar shading and ventilation across all the combinations of dwelling type, decade, location, and emission scenario (winter performance was not considered). Thermal simulations were carried out using the Apache program in IES-VE, supported by the Macroflow programme to model airflow through openings and between air spaces. This software has been widely used for building analysis in the UK both commercially and for research. Temperatures are calculated at the room level.
2.1. Climate Data
Test reference year (TRY) median (50th percentile) climate data for locations representing the 14 administrative regions of the UK were downloaded from the PROMETHEUS site [42] in EnergyPlus .epw format, for the 2030s, 2050s, and 2080s for the UKCP09 medium (A1B) and high (A1F1) carbon emission scenarios. The low scenario is not available from PROMETHEUS; in any case, it seems unlikely based on current trends and would cause the least overheating. Simulations used TRY 50 percentile years from PROMETHEUS.
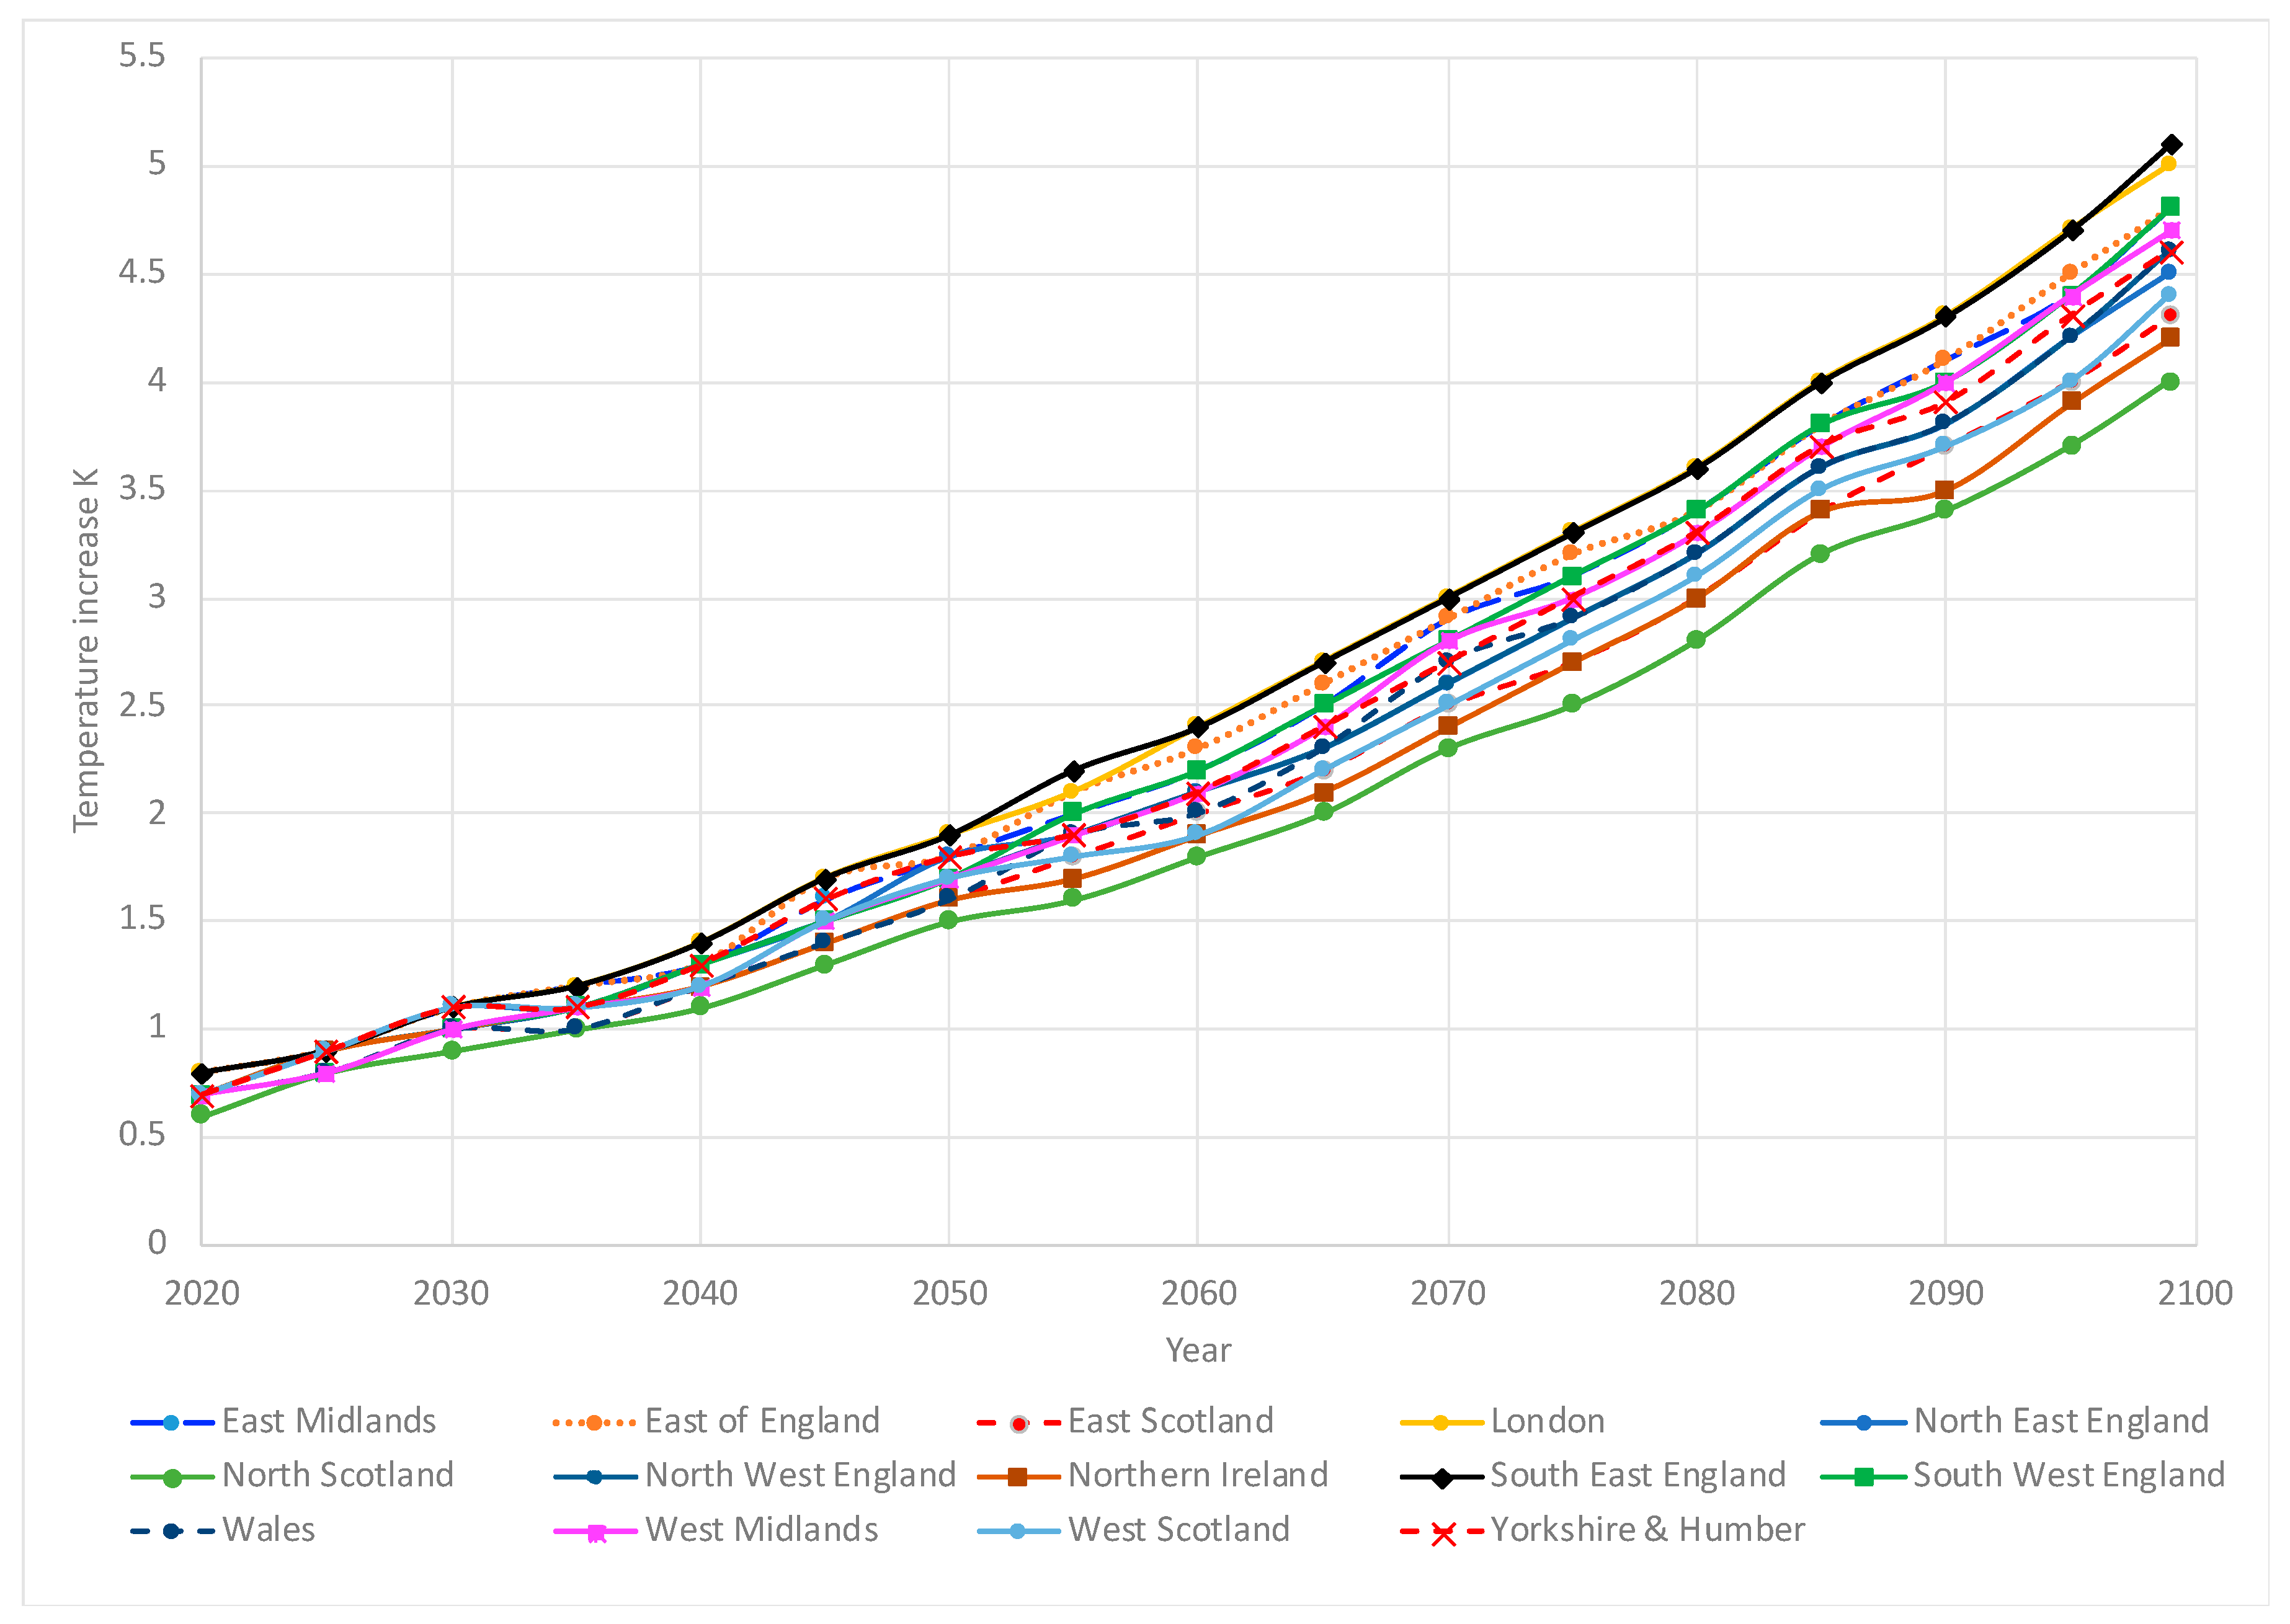
Figure 2 shows the temperature changes from the baseline for RCP 8.5, which is similar to the high scenario used here. The South East experiences the highest rise of just over 5 K, closely followed by London, with north Scotland showing the smallest rise of 4 K. The rate of rise is fairly constant for each site over the 80-year period, with a maximum rise of 0.4 K in any 5-year period at all the sites), and average rises per 5-year period of 0.21 to 0.27 K.
2.2. Building Models
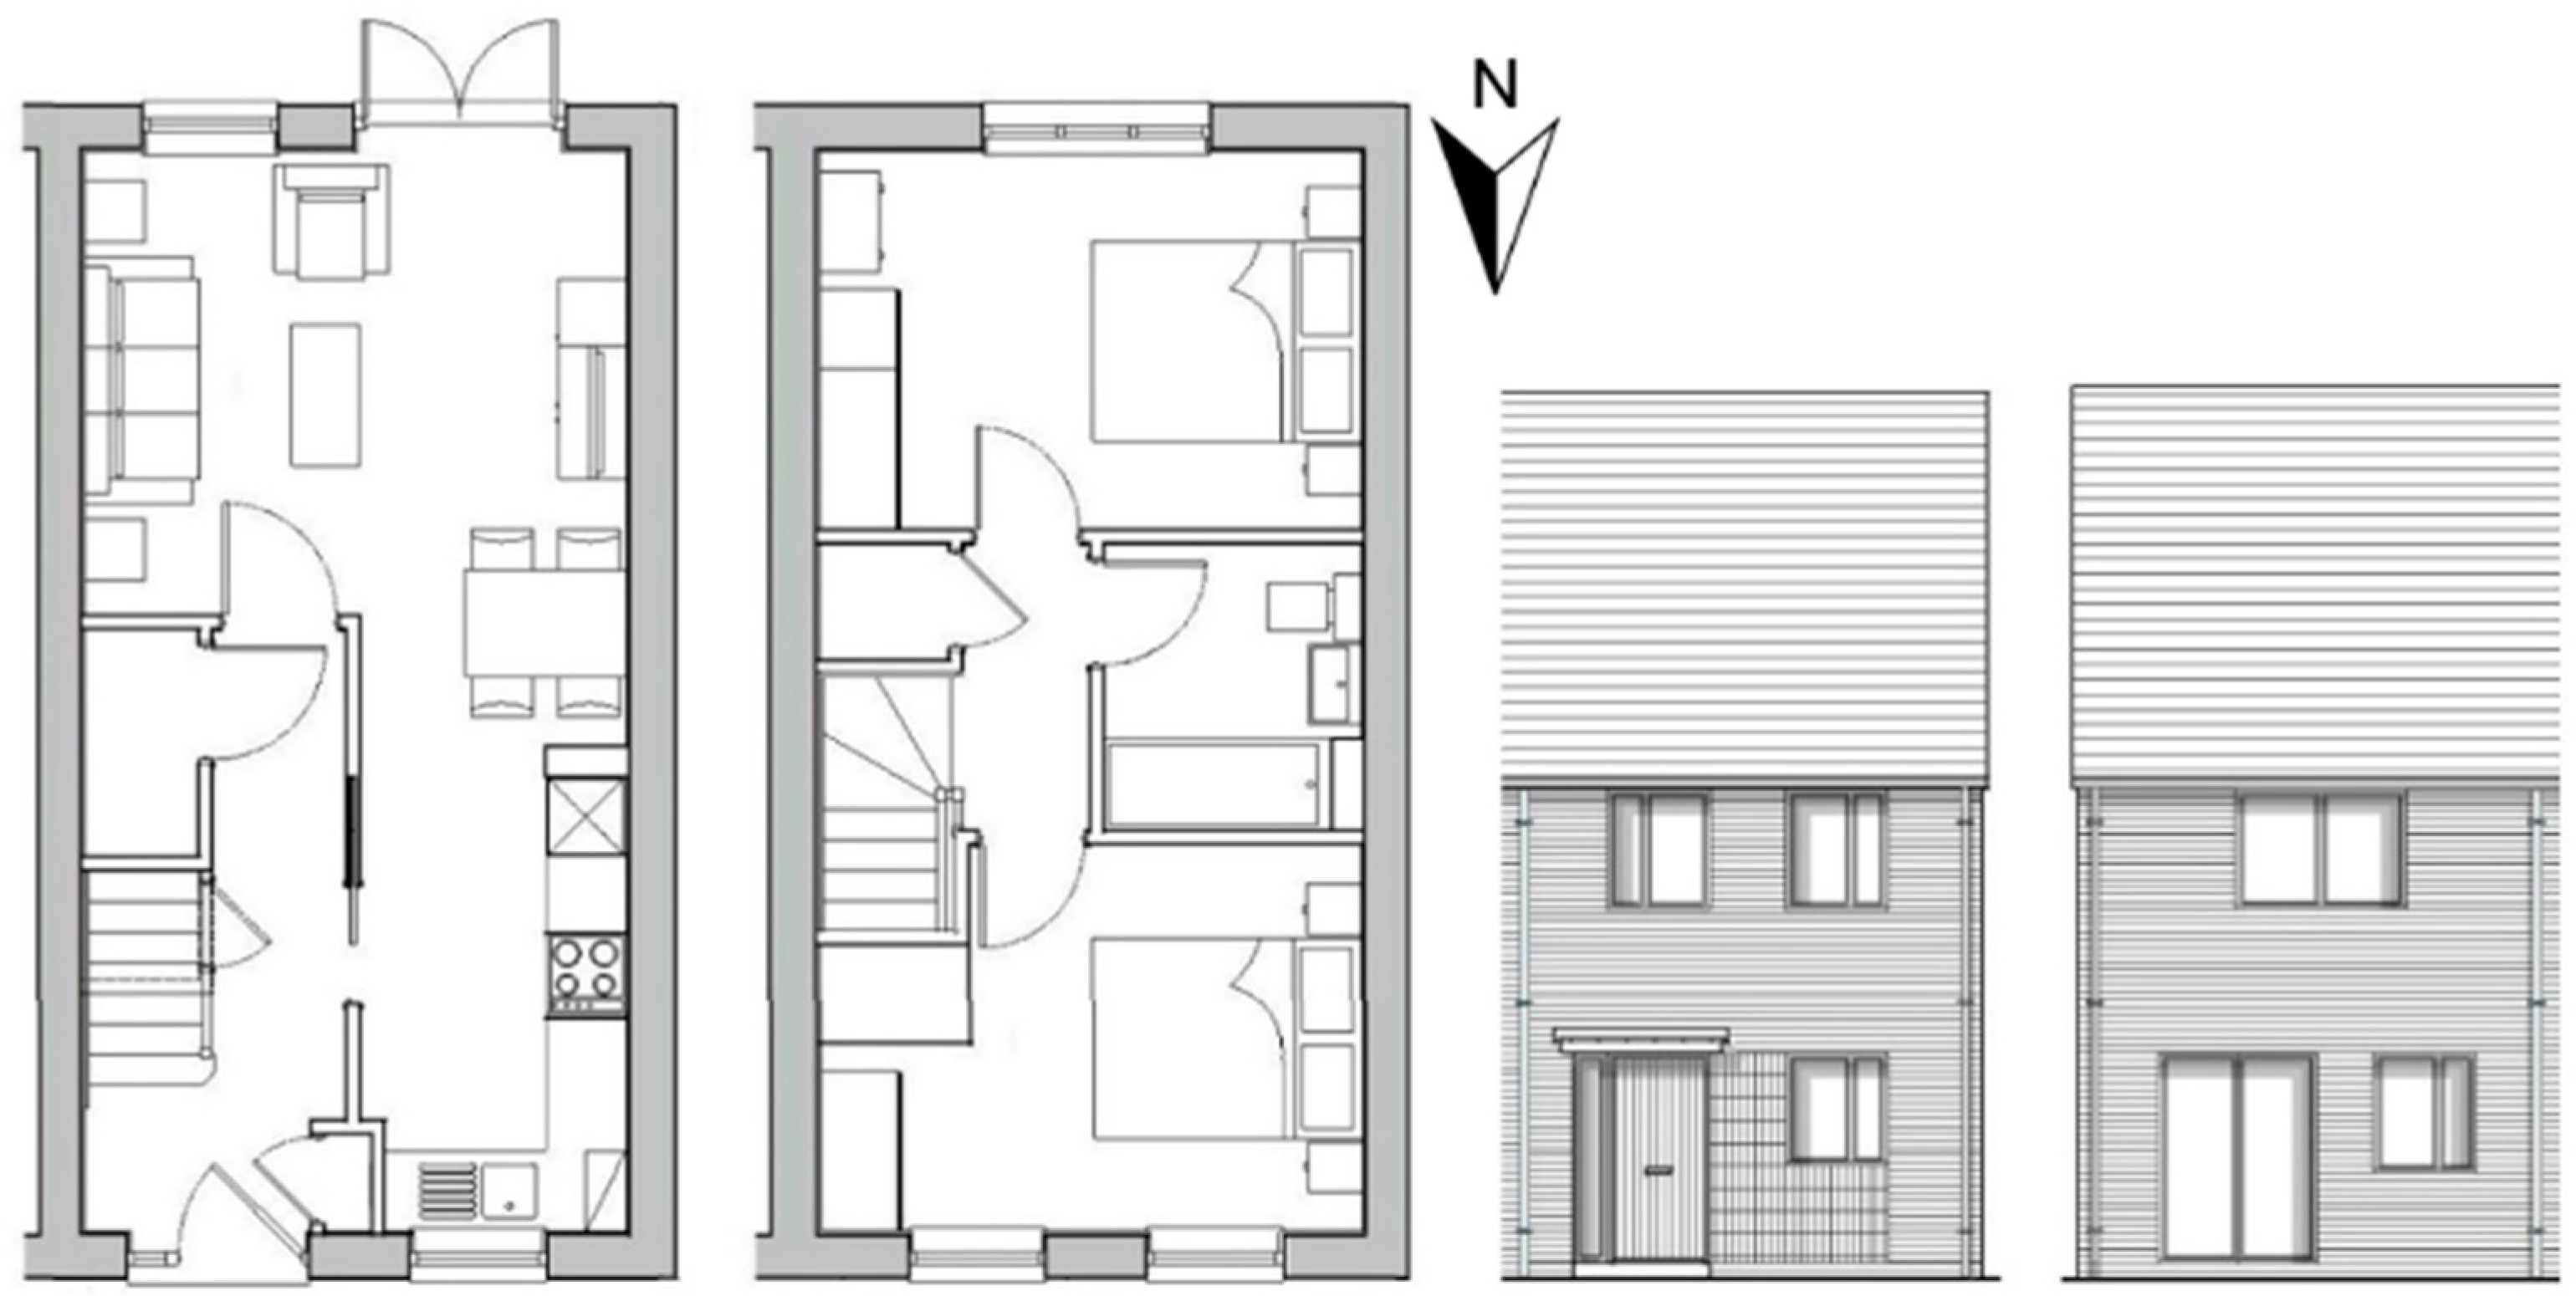
A generic modern dwelling was used, with lightweight construction and meeting the current England Building Regulations Part L [43]. It was based on a development in Cranbrook, Devon. Essentially, the same house was used in a terraced (or row) house form with adjacent properties on both sides; a semi-detached house with an adjacent property on one side; a detached house (shown in Figure 3). Front elevations face directly south, and rear elevations face north. By using the same basic house for all forms, differences in behaviour due to size, geometry, glazing, etc., are eliminated from the modelling. The model was created using VE 2017 IES Virtual Environment software v. 2017.4.0.0. All base model dwellings have a total floor area of 62 m2, living–dining room, WC, entrance hall on the ground floor, and two bedrooms (with master bedroom facing garden), family bathroom, and hall on the first floor. Front elevations of all buildings faced directly south, and so rear elevations faced north. None of base case houses had any solar shading.
Houses (similar to these) with at least two storeys make up 71% of the total English stock, and 51% of the stock has a floor area in the range 50–79 m2, according to [44] and associated data tables. UK homes built since 2010 have an average of 67.8 m2 of floor area and 2.95 bedrooms, according to [45]; although, this includes apartments. English homes with two bedrooms built since 2002 had an average floor area of about 63 m2 (data tables associated with [44]), which is almost the same as the area used here. Therefore, while both the total and modern stock are very diverse, the homes in the current study are typical of the smaller end of modern housing. In terms of occupancy, 33% of English homes are occupied by two adults (as in this study) and 18% by one person according to [44] and associated data table sheet AT1.3. However, this only gives household type, not numbers, so there will be more households with two people, for example a subset of “lone parent with dependent child(ren)”. In summary, more than one third of English homes are occupied by two people, and more than half by one or two people. Combining these statistics, it seems reasonable to conclude that the occupancy density (floor area per person) used in the study is typical, assuming smaller households tend to occupy smaller homes.
2.3. Constructions
The constructions were chosen as lightweight, typical of modern practice, and meeting the minimum insulation standards of the England 2010 and 2013 building regulations Approved Document Part L1A [44], as detailed in Table 5. Details of the constructions are given in Table 6. Part L1A applies throughout England; other similar codes apply in other devolved administrations of the UK. The climatic variation of England is not great, as it is a fairly small country, almost entirely below 1000 m and without any large mountain ranges.
2.4. Internal Heat Gains
It was assumed that the home was occupied by a retired couple who were always at home, in terms of metabolic gains. This is a very common scenario and similar to a person at home with one child. Many people are out at work or leisure during much of the day, and internal gains can have a significant effect on overheating, so one would expect such homes to have somewhat less overheating. However, night-time bedroom overheating would be little affected by daytime occupancy.
The following heat gains were used in simulations, using data from CIBSE Guide A [46], which is the standard reference for UK building services design parameters.
- People: 115 W per person (70 W sensible and 45 latent), from Table 6.3, CIBSE Guide A 2015, 24 h/day.
- Lighting: 10 W m−2 sensible heat gain, from Table 6.2, CIBSE Guide A 2015.
- General equipment and cooking: 5 W m−2 sensible heat gain for internal equipment (incl. cooking appliances) from Table 6.2, CIBSE Guide A 2015.
- Computer: 55 W sensible heat gain for personal computer and 70 W for PC monitor, from Tables 6.7 and 6.8, CIBSE Guide A 2015.
All gains were assumed to be present at all times. Hence, total gains are 62(10 + 5) + 140 + 55 + 70 = 1195 W or 19.27 W m−2.
2.5. Infiltration and Ventilation
A constant infiltration rate of 0.15 air changes per hour was provided at all times. When windows were closed, there was in addition fresh air ventilation of 10 litres per second per person (20 in total). With windows open, fresh air ventilation was driven by wind and stack effects, without the 10 litres per second per person fresh air.
For some simulations, natural ventilation was added. Calculations were carried out in peak summer conditions for London (wind speed 3 m.s−1, outside 28.3 °C, ground floor 28.9 °C, first floor 30.0 °C) for a combination of stack and wind ventilation, to achieve 0.024 m3s−1 on both the ground and first floors. This equates to 12 l s−1 per person, on each floor.
This resulted in louvres or openings in windows on the ground floor of 0.15 m2 total area, and on the first floor of 0.26 m2 total area, distributed over the windows. The same areas were used on the north and south facades only. It was assumed that vents on the north side were at the top of the windows and on the south side at the bottom, to increase stack ventilation. All louvres positioned on south side were 130 mm high; louvres positioned on north side ground floor were 260 mm high; louvres positioned on north side first floor were 130 mm high. All louvres were always open in the simulations when the external temperatures were at or below 25 °C; at higher temperatures, they were closed (this would not be realistic for cold weather, but we are only concerned with overheating here). The ventilation pattern is summarised in Table 7.
2.6. Solar Shading
Solar shading was added in some simulations to reduce overheating. This was in the form of a horizontal fin across the top of the south-facing windows, sufficient to completely shade the window at approximately the highest summer solar altitude angle at solar noon on 21 June (calculated for 52° N, corresponding to the south of England). There will be some solar penetration at other times when altitude is less, but much of the direct summer solar gain will be blocked with this shading. All windows were 1.2 m high; the resulting fin depth is 0.665 m—a significant size.
2.7. Thermal Comfort Analysis
Comfort was analysed according to CIBSE Technical Memorandum 59 [47]. This specifies that design summer years (DSY), which are generally warmer than TRYs, should be used for analysis. However, TRYs were used in these simulations, to understand typical rather than “hot” year behaviour. DSYs have warmer summers than TRYs (Section 1.2), so generally produce more overheating than the corresponding TRY; although, there are sometimes exceptions (it is possible for a TRY to have more very warm hours, which produce most of the overheating, even though the average summer temperature is lower than the DSY). Therefore, these results are conservative in terms of overheating; DSYs would be expected to produce, in most cases, more overheating.
TM59 states that a dwelling with predominantly natural ventilation is considered not to overheat if both of the following criteria are met:
- (a)
- For living rooms, kitchens, and bedrooms: the number of hours during which ΔT is greater than or equal to one degree (K) during the period May to September inclusive shall not be more than 3% of occupied hours. (CIBSE TM52 Criterion 1: Hours of exceedance).
- (b)
- For bedrooms only: to guarantee comfort during the sleeping hours the operative temperature in the bedroom from 10 pm to 7 am shall not exceed 26 °C for more than 1% of annual hours. (Note: annual hours between 22:00 and 07:00 for bedrooms is 3285 h, so 1% is 32.85 h; hence, 33 or more hours above 26 °C will be recorded as a fail).
TM59 states the following in relation to communal corridors: whilst there is no mandatory target to meet, if an operative temperature of 28 °C is exceeded for more than 3% of the total annual hours, then this should be identified as a significant risk.
Although there are no communal corridors in separate houses, this “optional criterion” was also used for rooms as an additional metric.
The following data were extracted from simulations:
- Number of hours that either bedroom exceeds 26 °C (if both, still counts as 1 h);
- Hours over 28 °C for the single living room, or either bedroom;
- Highest temperature recorded in either bedroom and living room.
In all cases, general overheating (a) was significantly smaller compared with overheating occurring in bedrooms (b), and general overheating only occurred when bedrooms were overheating as well.
Therefore, it was decided to use mainly bedroom overheating results; where results show overheating in bedrooms, there was also general overheating. Results are presented in hours of bedroom overheating between 22.00 and 07.00 per year, as defined in (b) above. Simulated hours of bedroom overheating were well over the 1% threshold in many cases; 500 h is 15.2%, 1000 h is 30.4%, and 1500 h is 45.7%.
2.8. Simulation Permutations
Simulations were carried out for all the permutations shown in Table 8 Hence, for 14 regions, there were 126 (3 × 14 × 3) simulations for the baseline climate and 756 simulations for three future decades, with two emission scenarios and three levels of heat reduction: 882 simulations in total.
Data were organised using Microsoft Excel, which was used for the Base case plots. A single dataset for all results was then imported into RStudio Version 1.4.1717, for further analysis and plots.
3. Results
The IES Apache model calculates temperatures at room level, so there is no “point” at which temperature is measured (although, of course, in reality, the air and radiant temperatures would vary within the rooms).
3.1. Base Case Fabric
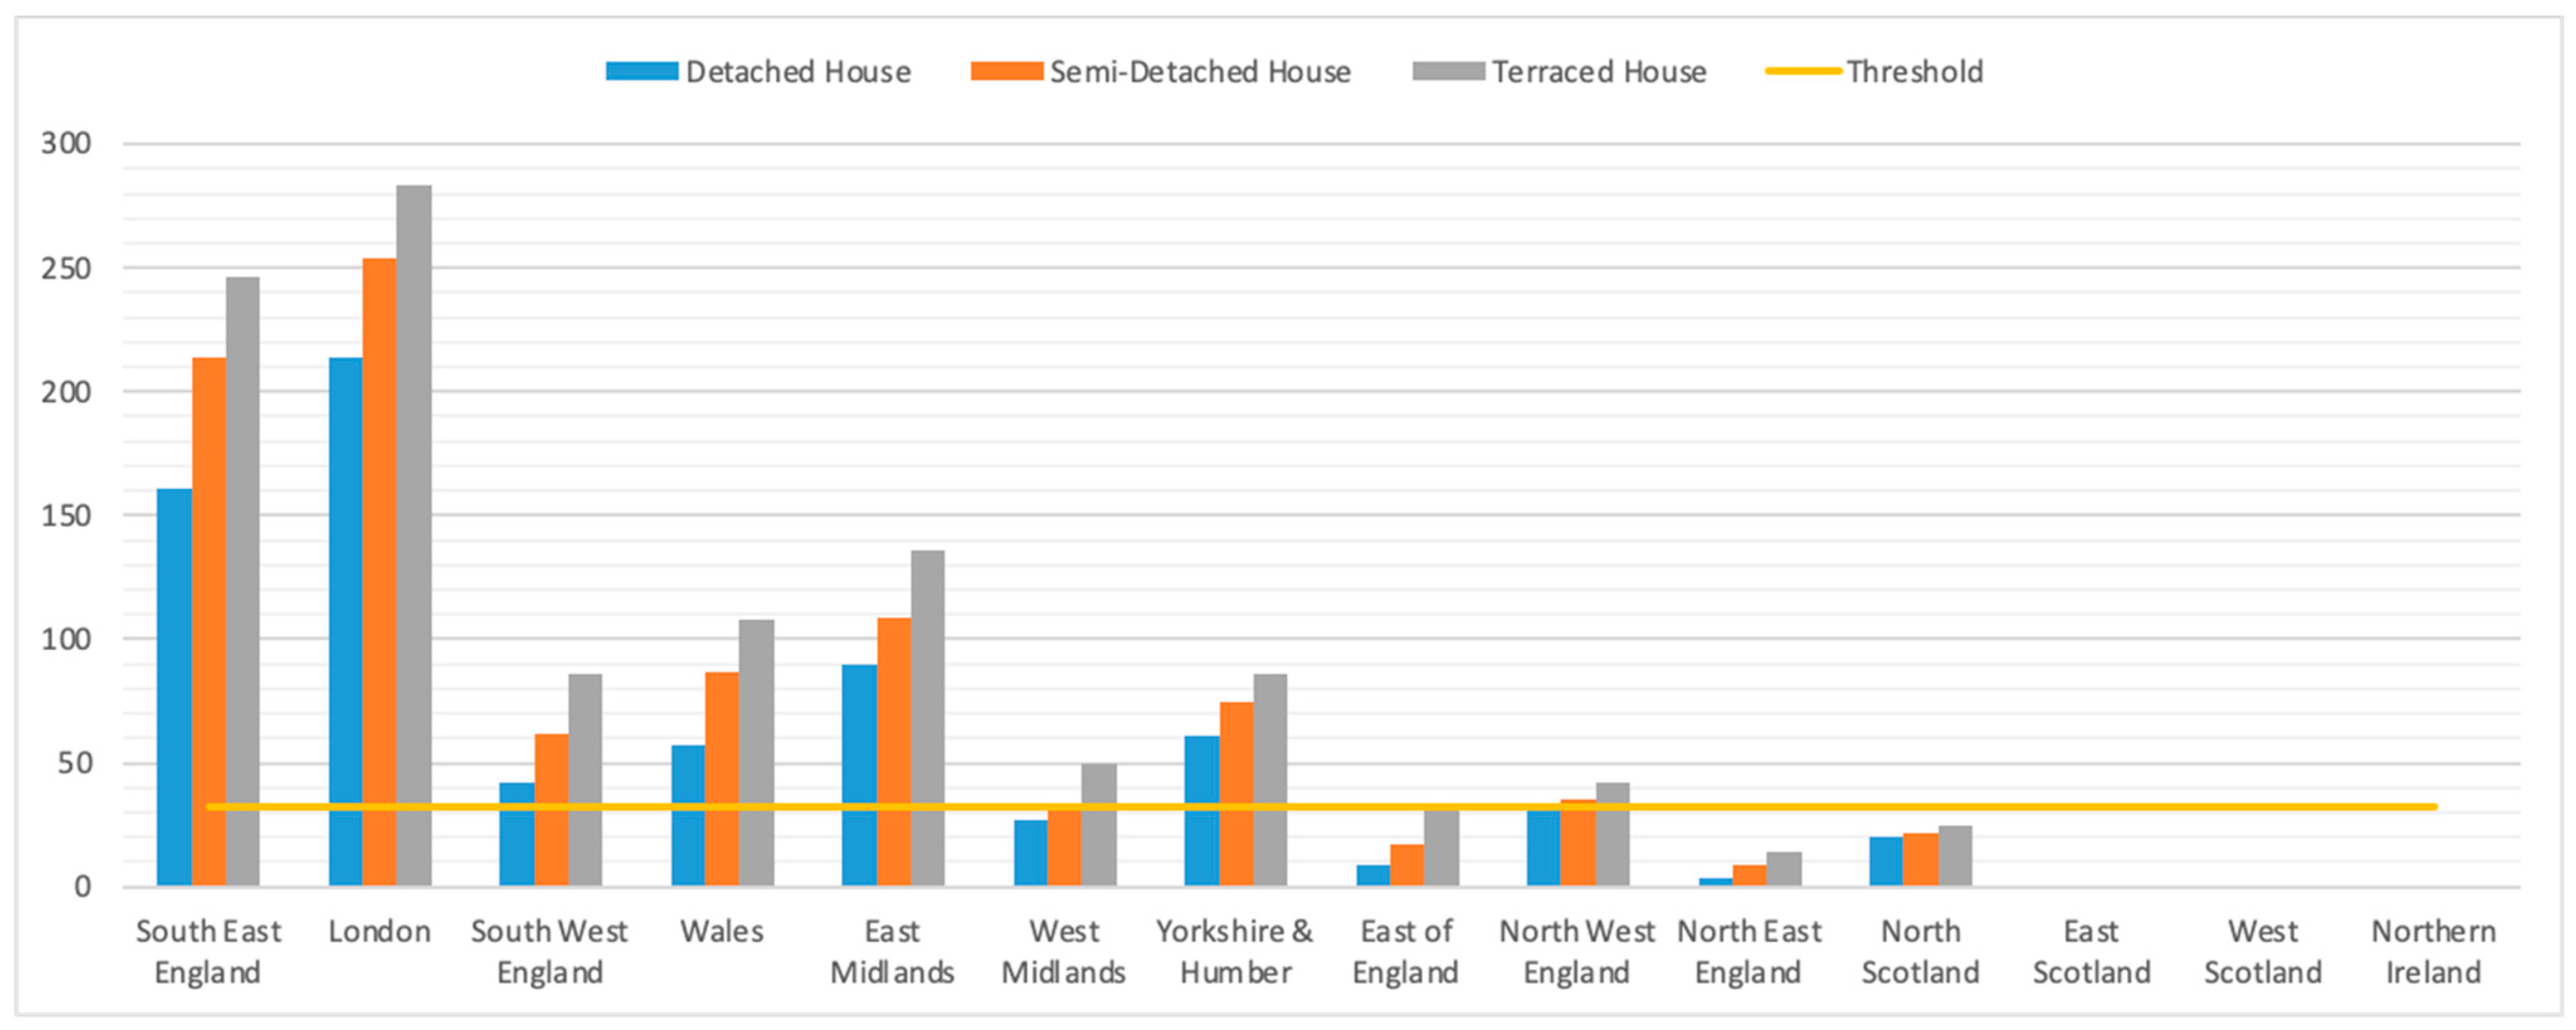
As there are so many permutations, a full set of charts is given only for the base model (no solar shading or extra ventilation) to show the effects of emissions and decade; note the y-axis scales vary with range of data. The yellow line shows the overheating threshold of 1% or 32 h.
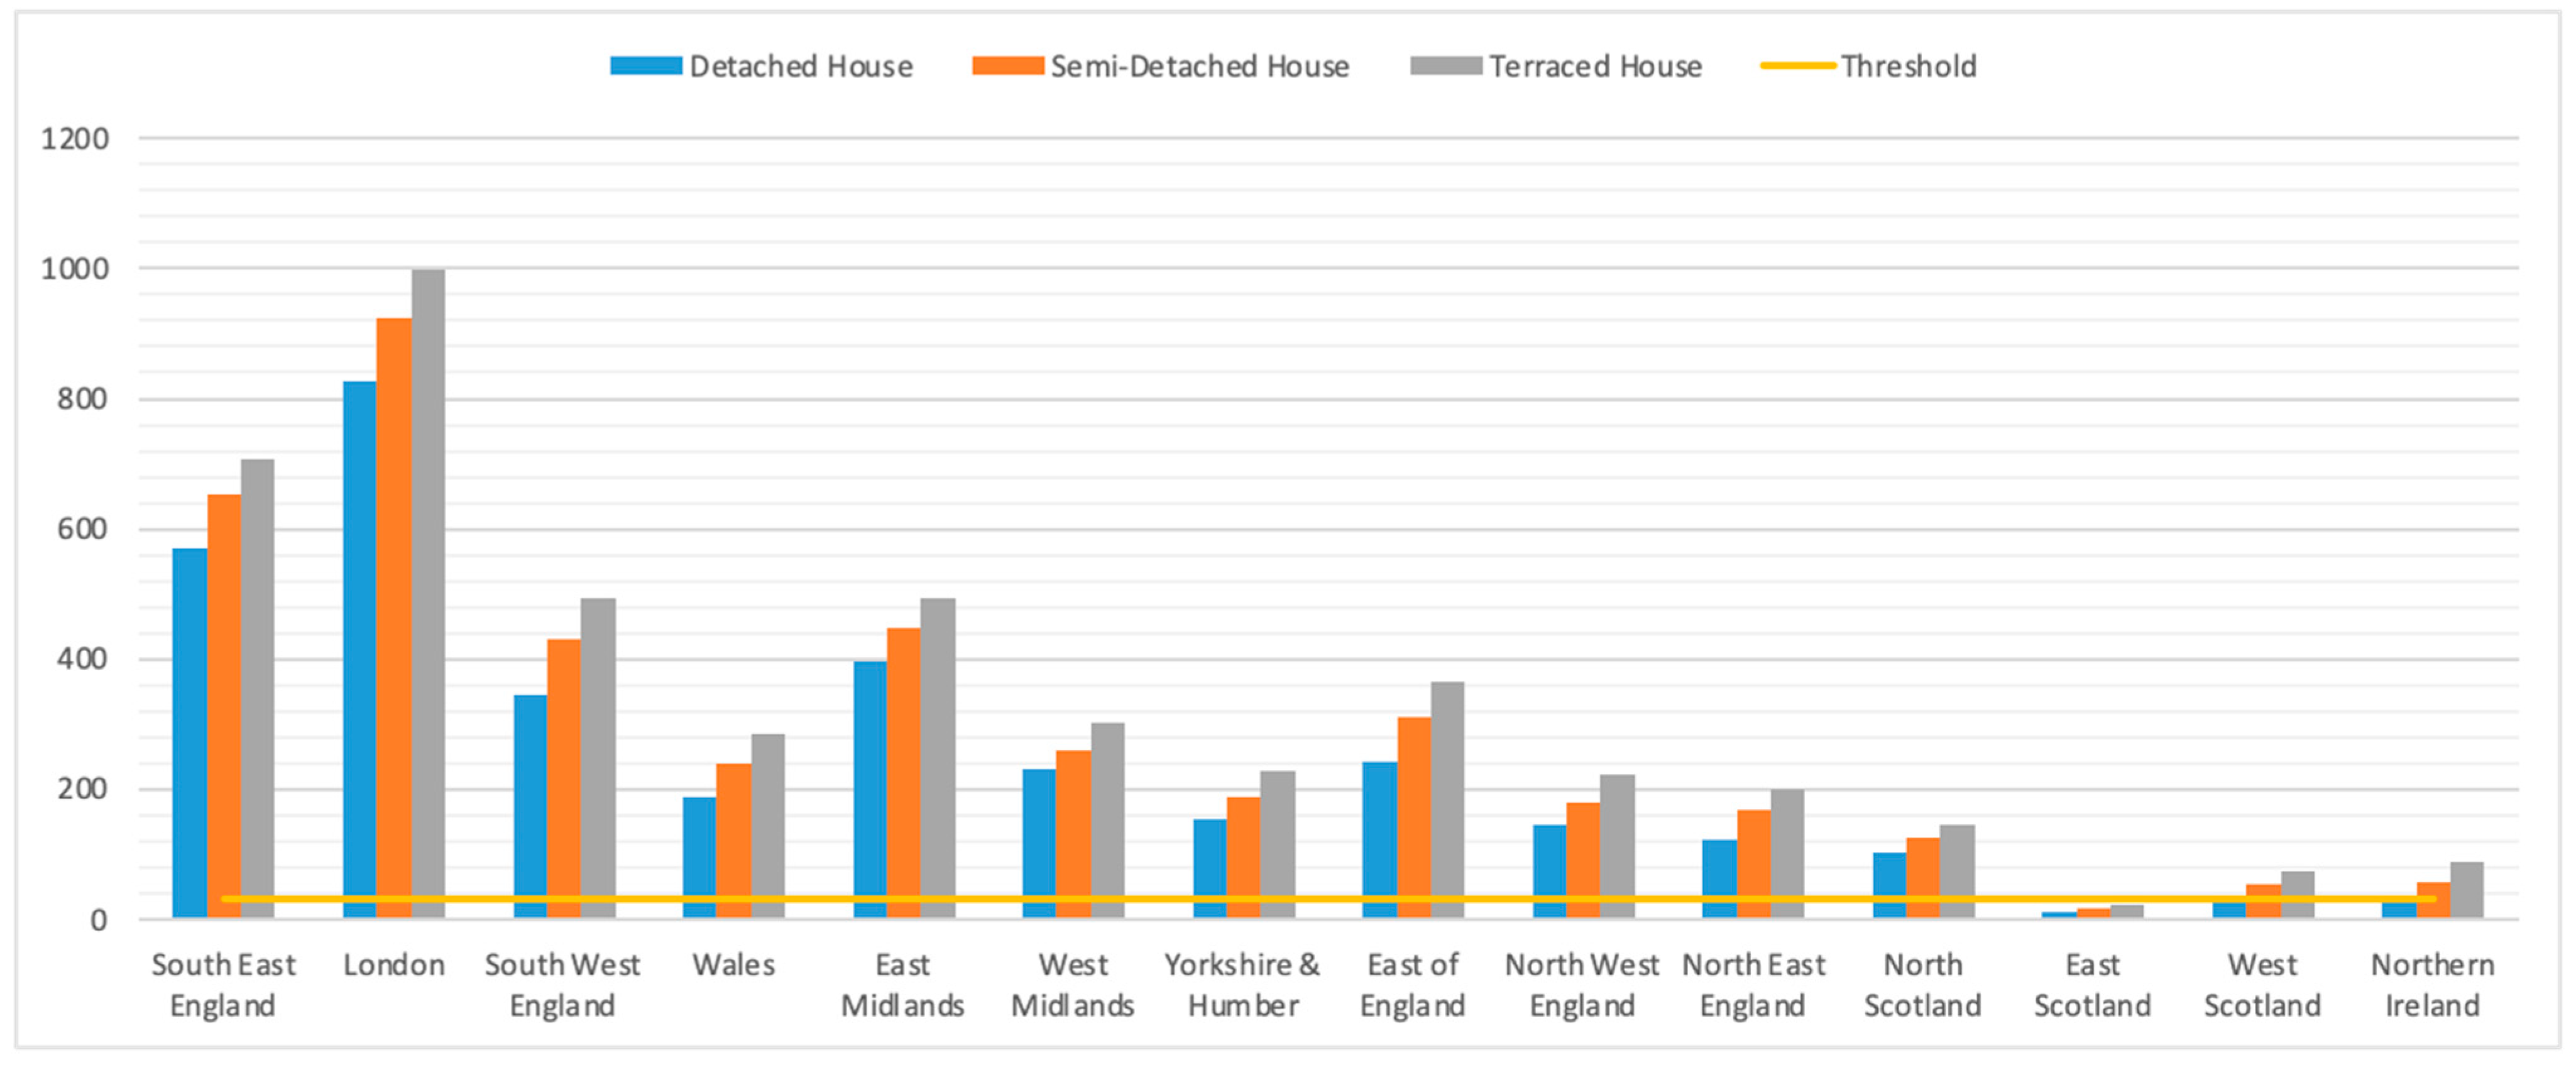
For current climate (Figure 4), 19 out of the 42 permutations (bars) are below the overheating threshold. Just London and South East England are well above the threshold for all house types and much higher than for other regions. Hours of overheating are consistently lowest for the detached, in the middle for the semi-detached, and highest for the terraced house. There are no hours over 26 °C for east and west Scotland and Northern Ireland, but surprisingly, north Scotland has a few hours, though below the threshold. Generally, overheating reduces for regions further north but with some anomalies; notably, North East England has less overheating than north-west and north Scotland, even though both Scottish regions are much further north. A similar general pattern is seen for all the scenarios considered, though at widely different scales.
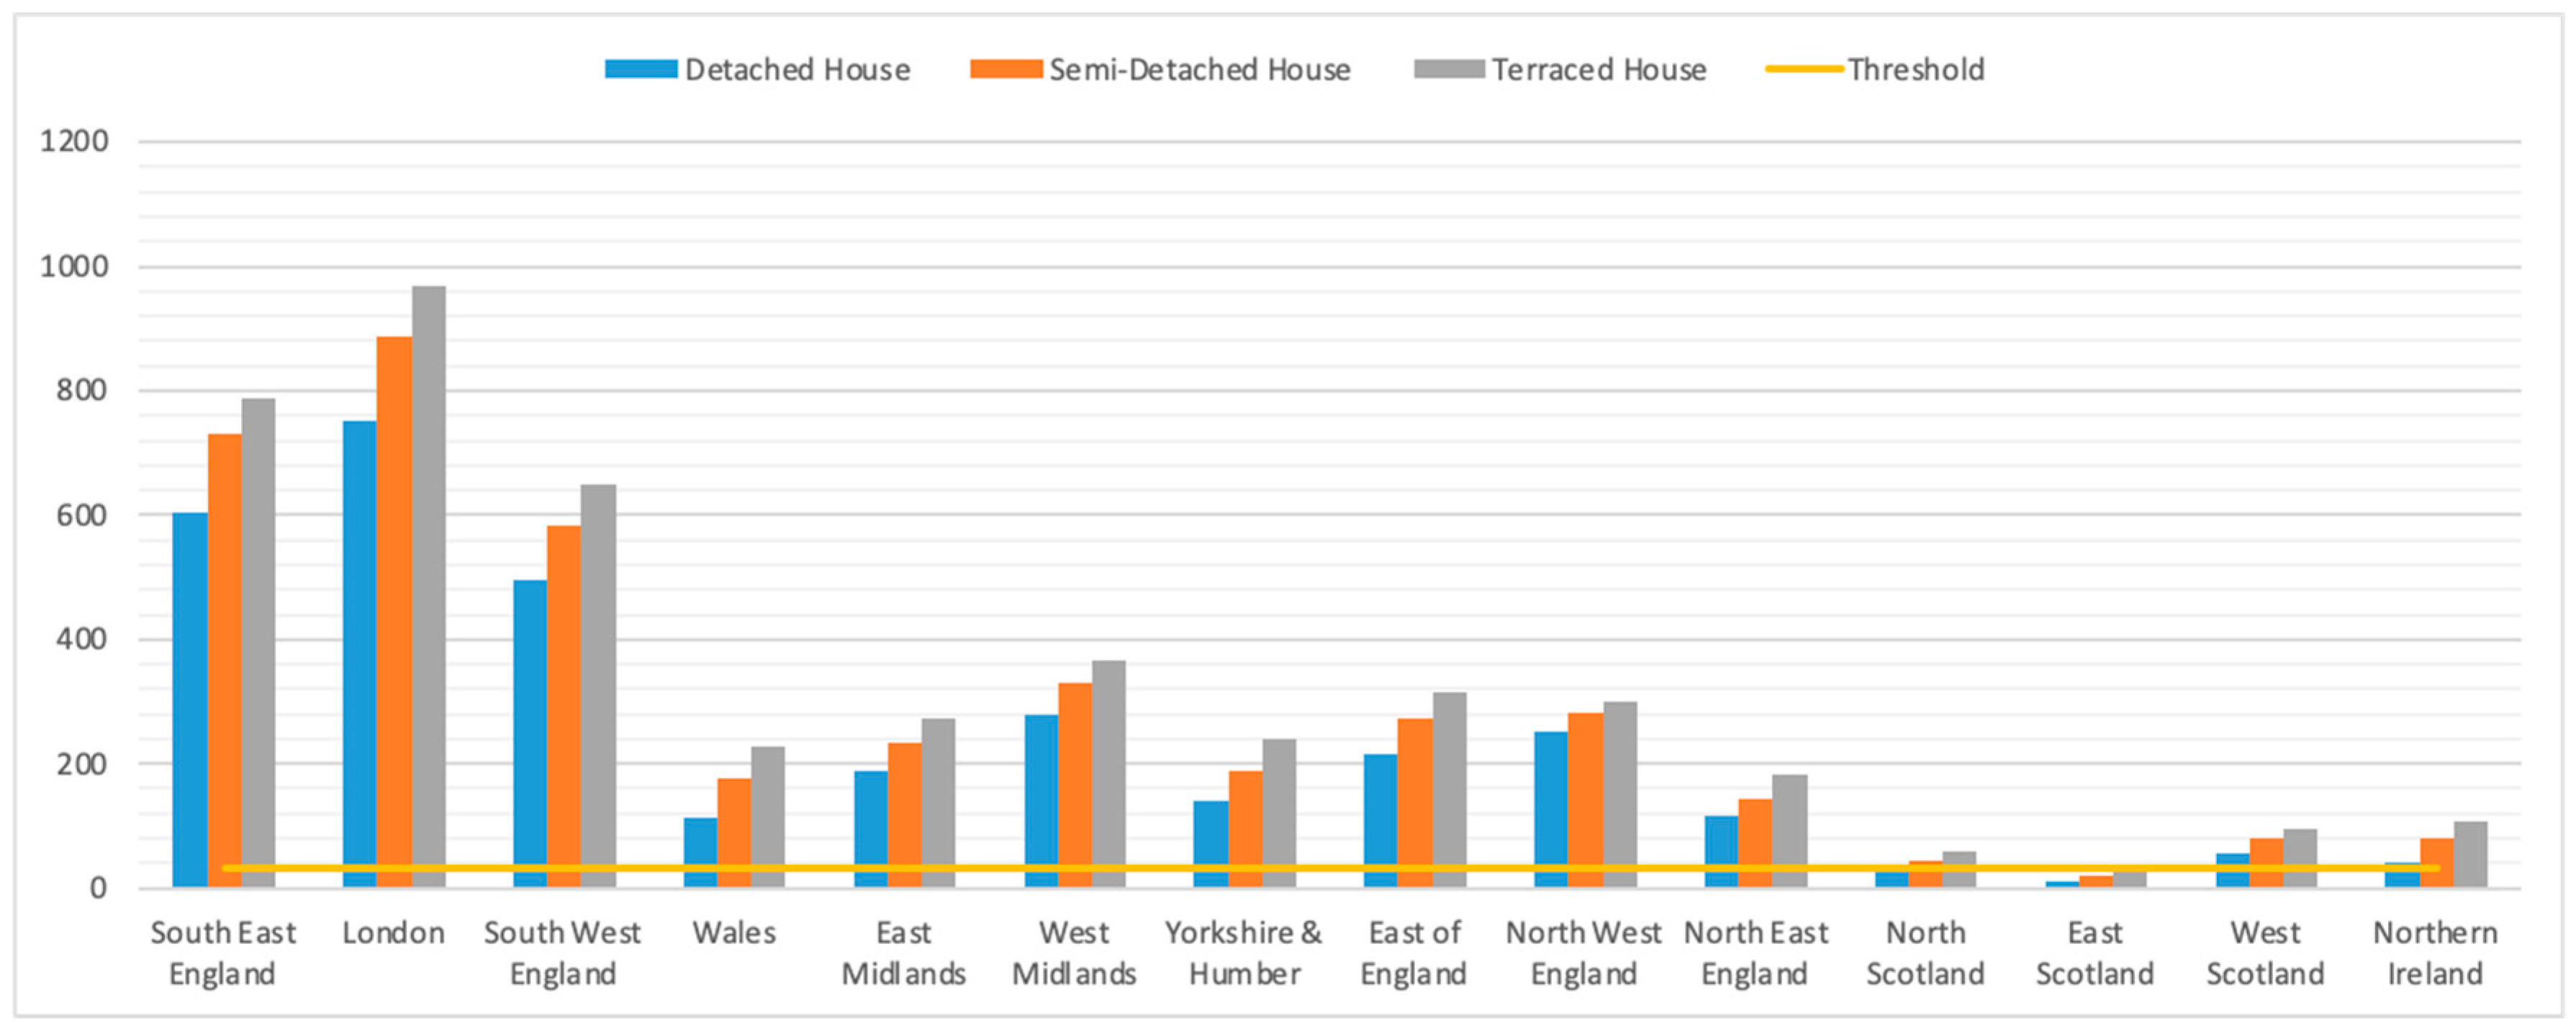
For the 2030s, there is a dramatic increase in overheating—noting the fourfold increase in the y-axis scales in Figure 5 and Figure 6. All northern regions now have some hours over 26 °C; only east Scotland has hours below the threshold for all house types for low emissions (Figure 5), just going slightly over for the terraced house only for high emissions (Figure 6). There is a similar pattern for both emission scenarios, but surprisingly, total overheating hours for all permutations are very slightly higher for “medium” (12,102 h) than “high” (11,959), a high/medium ratio of 0.988. London, the East Midlands, the east of England, North East England, and north Scotland all have fewer hours over 26 °C under medium emissions (for the East Midlands, more than 200 fewer hours for all house types). The detached house had 110 more overheating hours for “medium” over “high”, compared with just 11 and 31 more for the semi-detached and terraced houses, respectively, summed across all regions.
This may seem counterintuitive, but overheating is usually concentrated in a few hot days, while “average” weather years are selected using other statistics, which can produce unexpected results for overheating. Weather patterns as modelled under UKCIP09 in the different decades and scenarios may have been such that the eastern side of the country was cooler than the western side under “high” compared with “medium” emissions, due, for example, to pressure systems. Finally, the effects of emission differences are smaller in the 2030s than in later periods due to the cumulative effects of carbon dioxide levels.
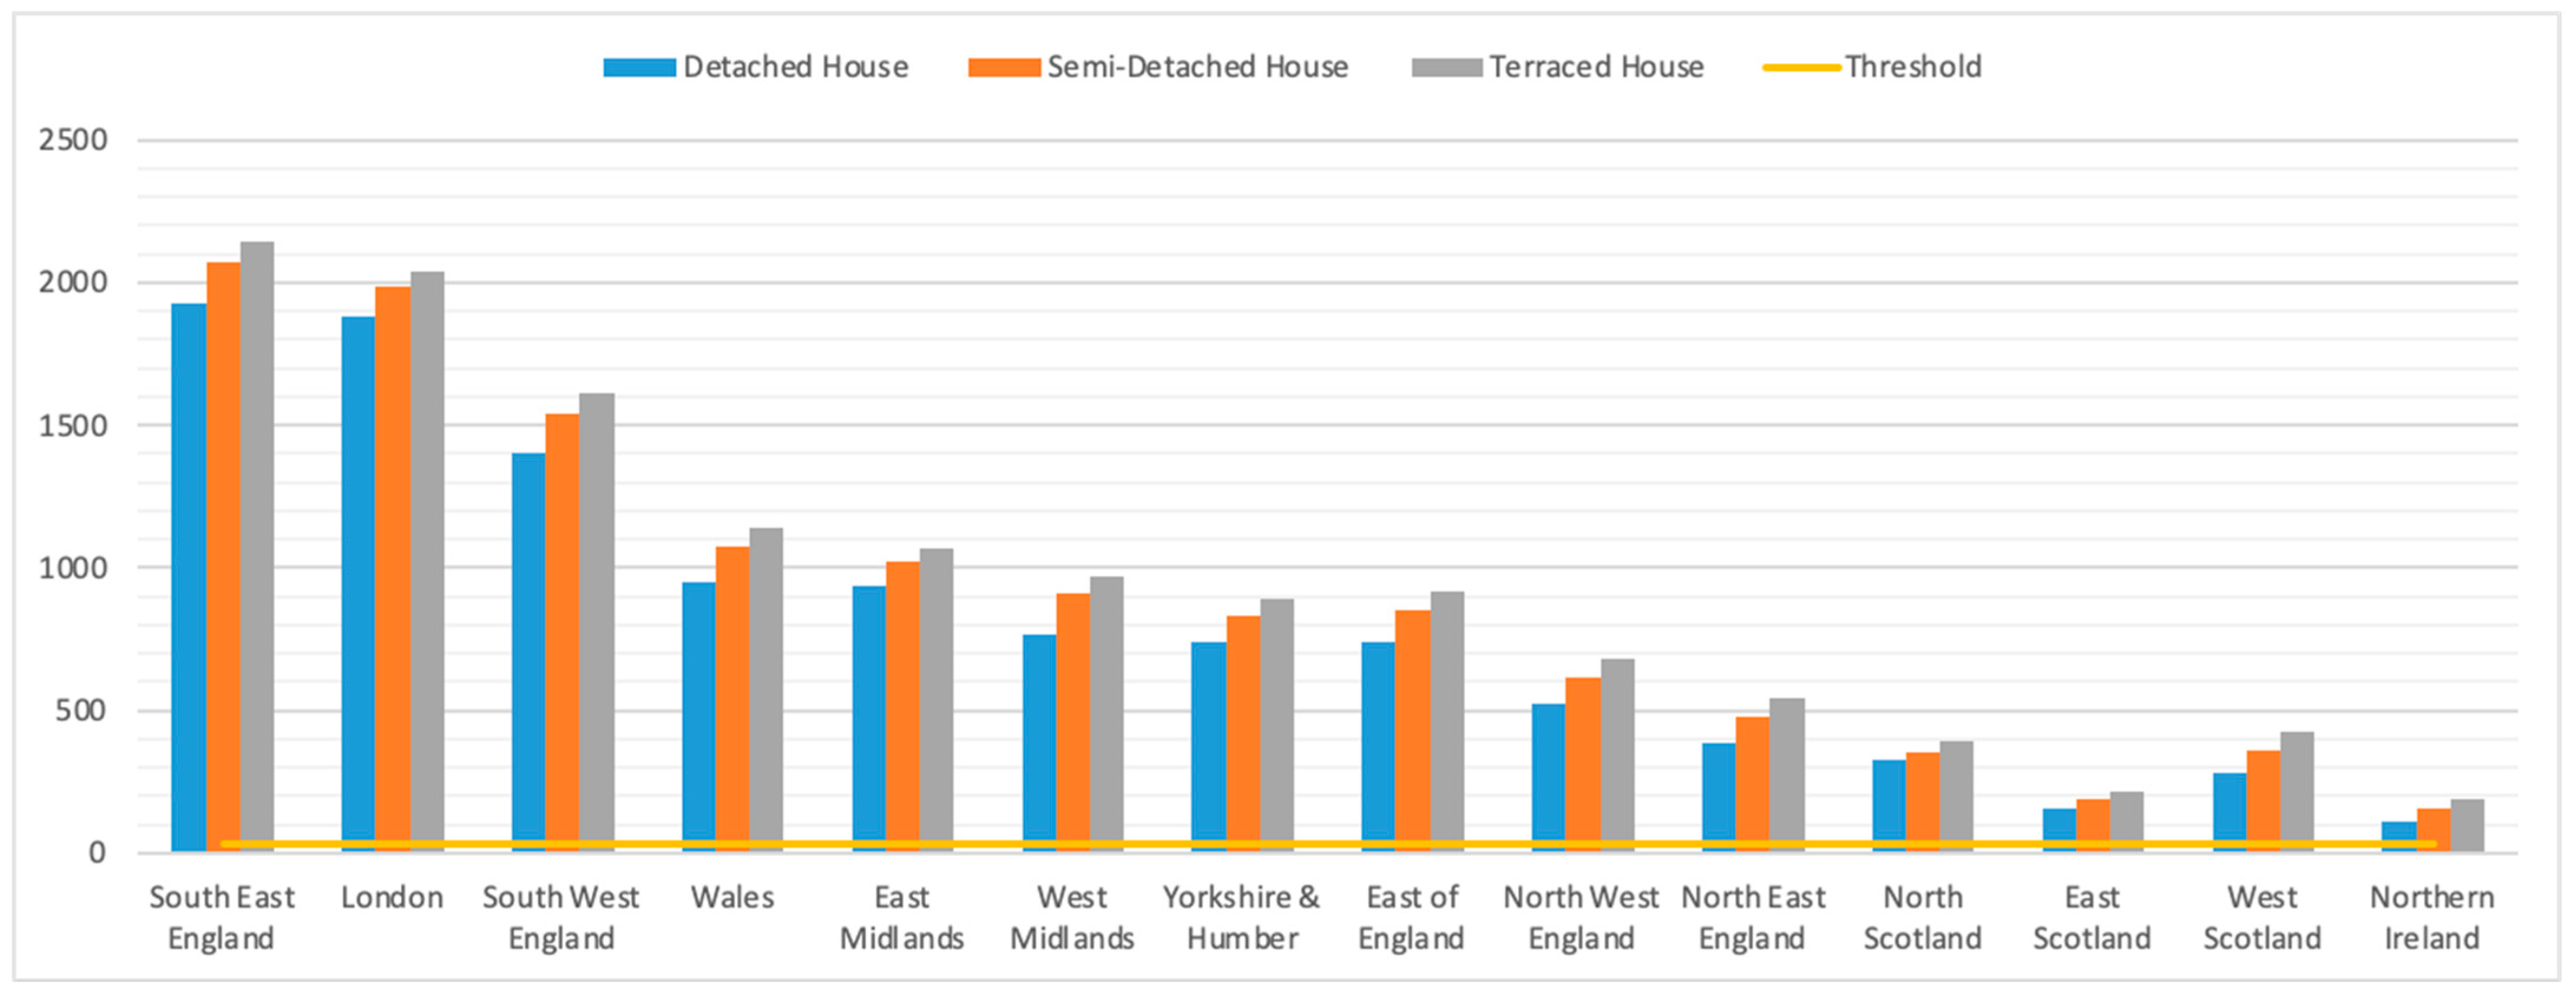
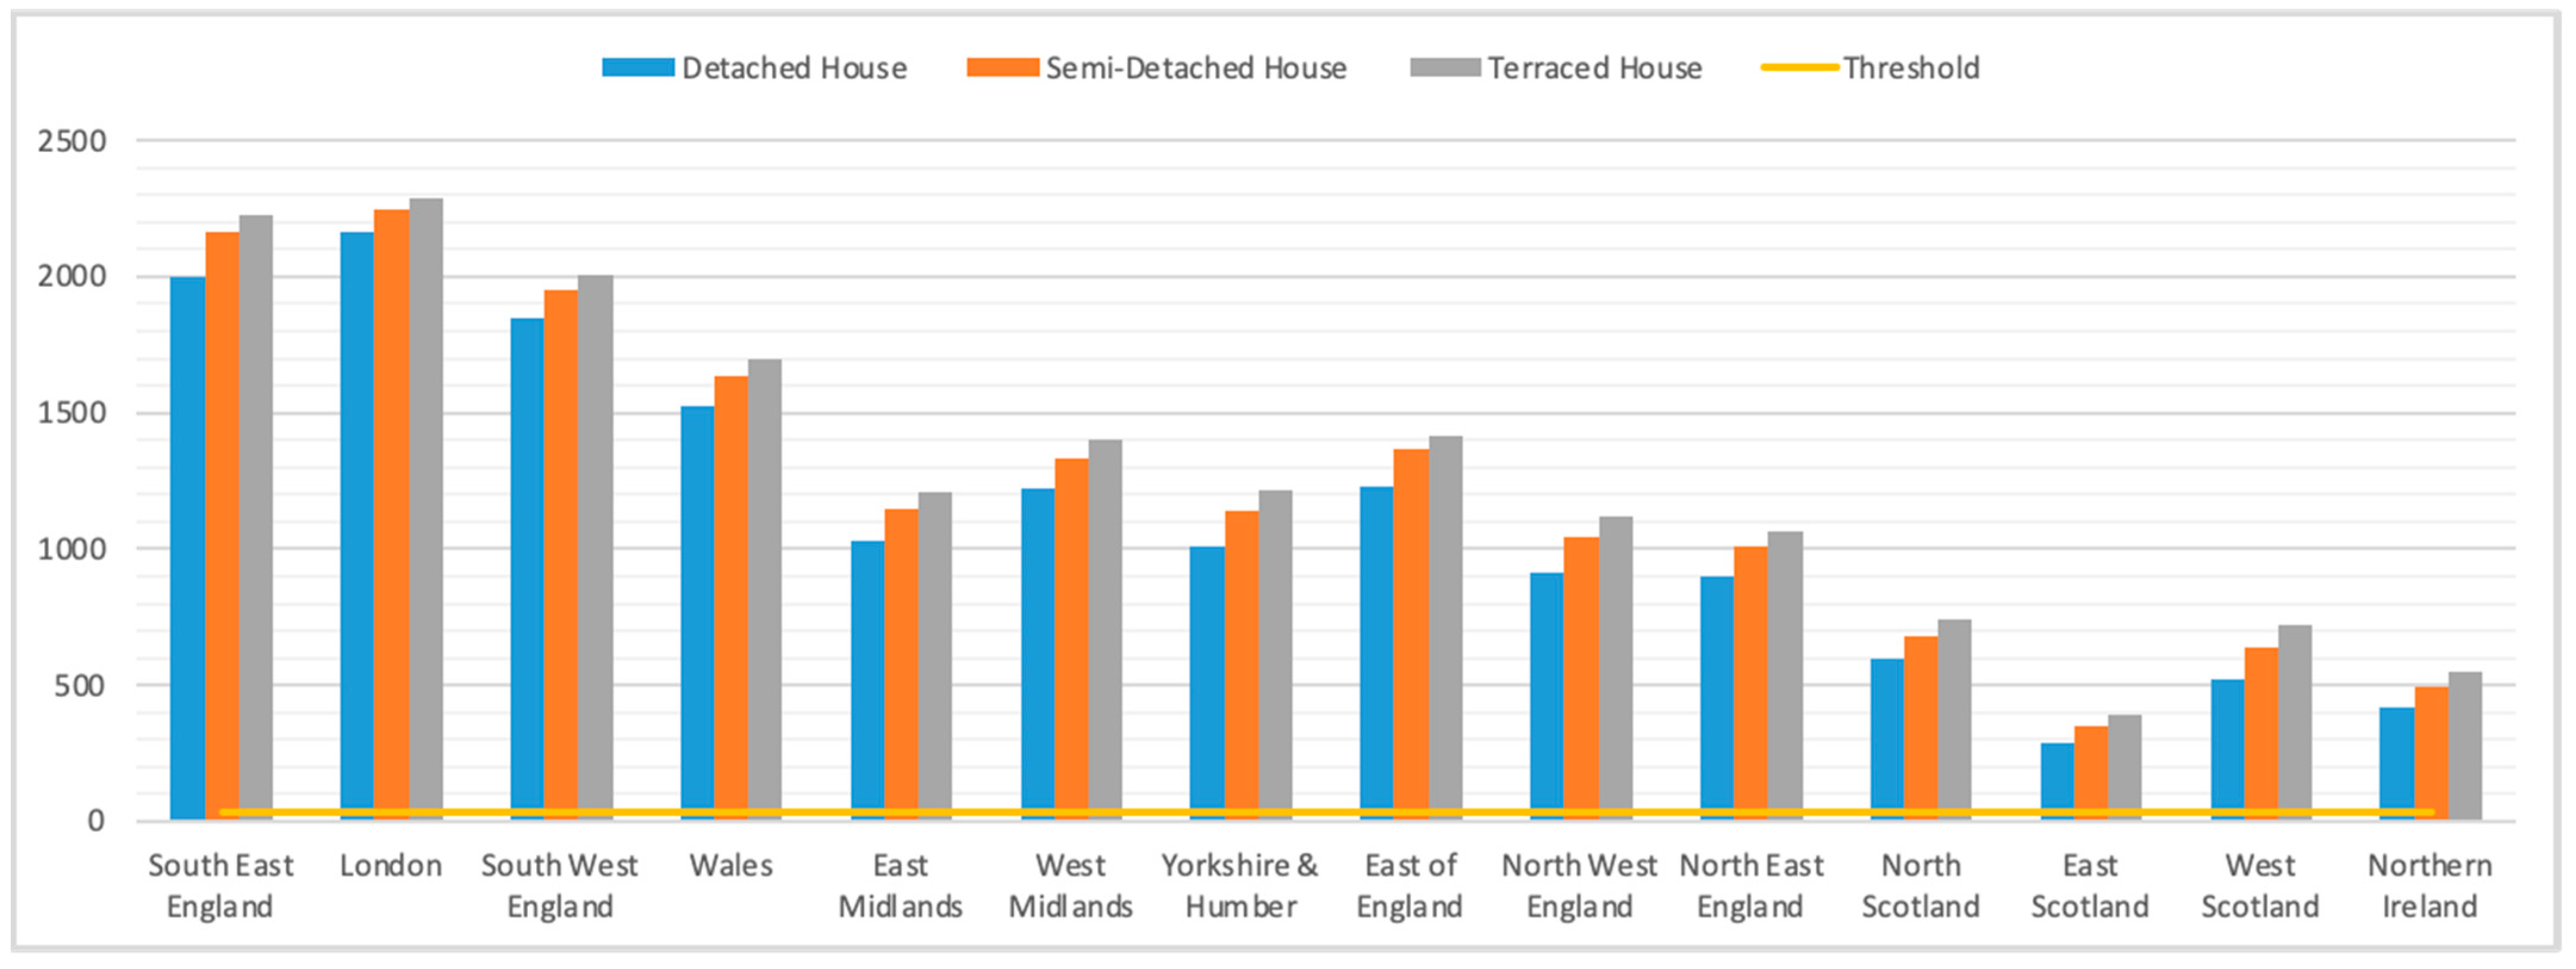
For the 2050s (Figure 7 and Figure 8), there is a large increase in overheating (noting a ×1.5 rescaling of the y-axis compared with 2030s charts, ×6 compared with current), with all house types exceeding 1000 h for South East England and London, and South West England under “high”. All scenarios are over the 32-h threshold except the detached house in east Scotland under “medium”. Again, some regions have less overheating under the “high” emissions, notably by a large amount for South East England and the East Midlands and by a few hours for the east of England and west Scotland; although, on average, higher emissions create more overheating. Across all scenarios, the “high” hours were 116.7% of the “medium” hours. Comparing the decades, 2050s medium hours are up 76%, and 2050s high hours are up 107% compared with the 2030s. The ranking of regions is also somewhat different between the emission scenarios, with South East England and London and the two Midlands regions switched between the emission scenarios. This is likely to be an artefact of the weather year selection process (the TRY selection process means that different regions will usually have morphed weather months from different years).
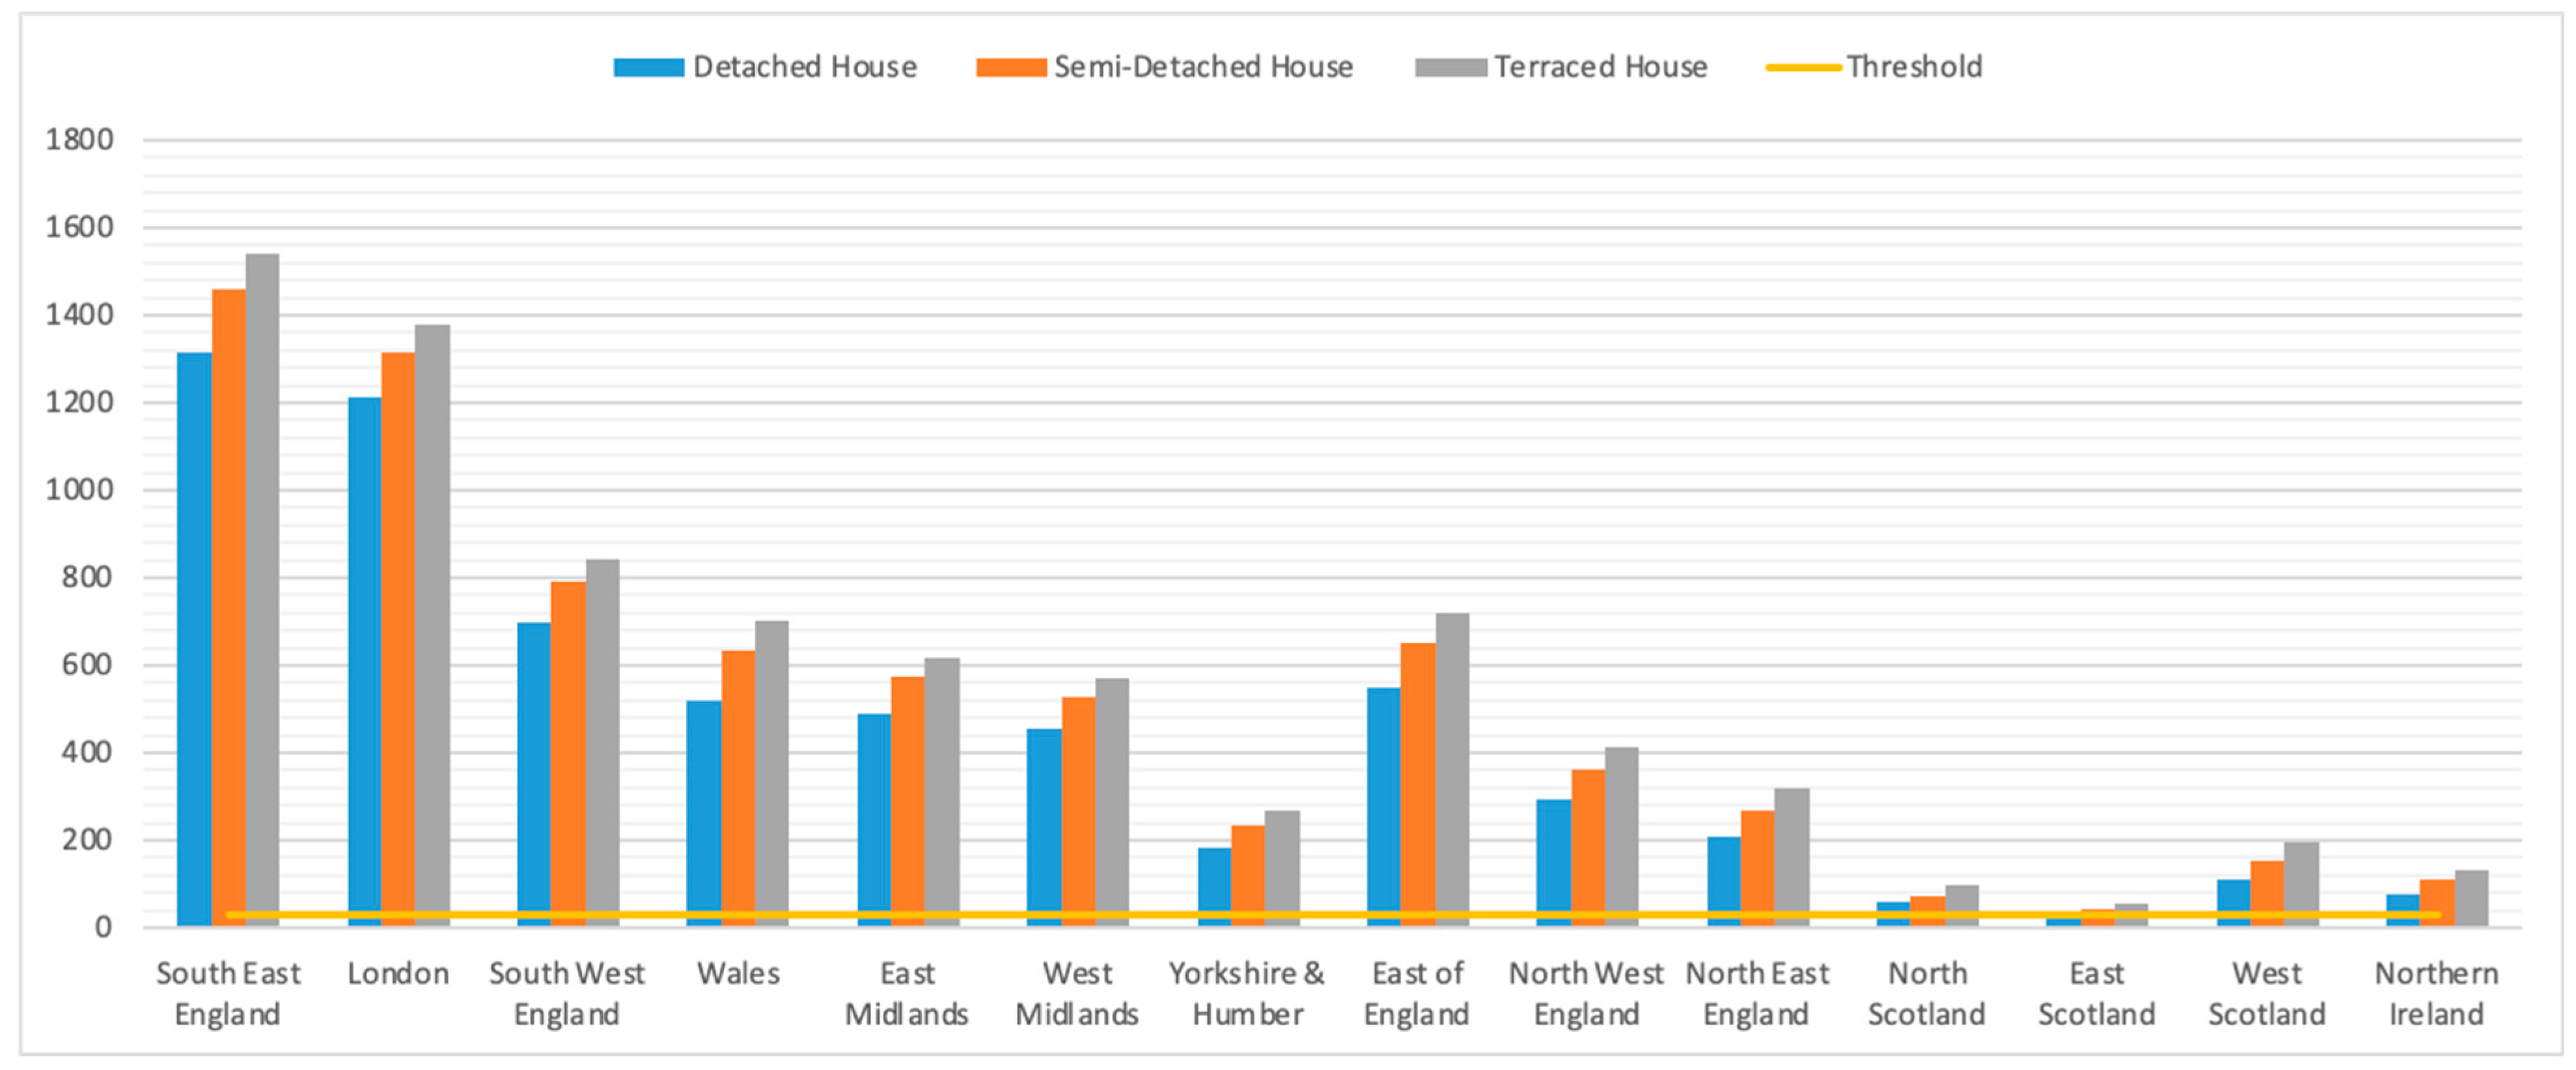
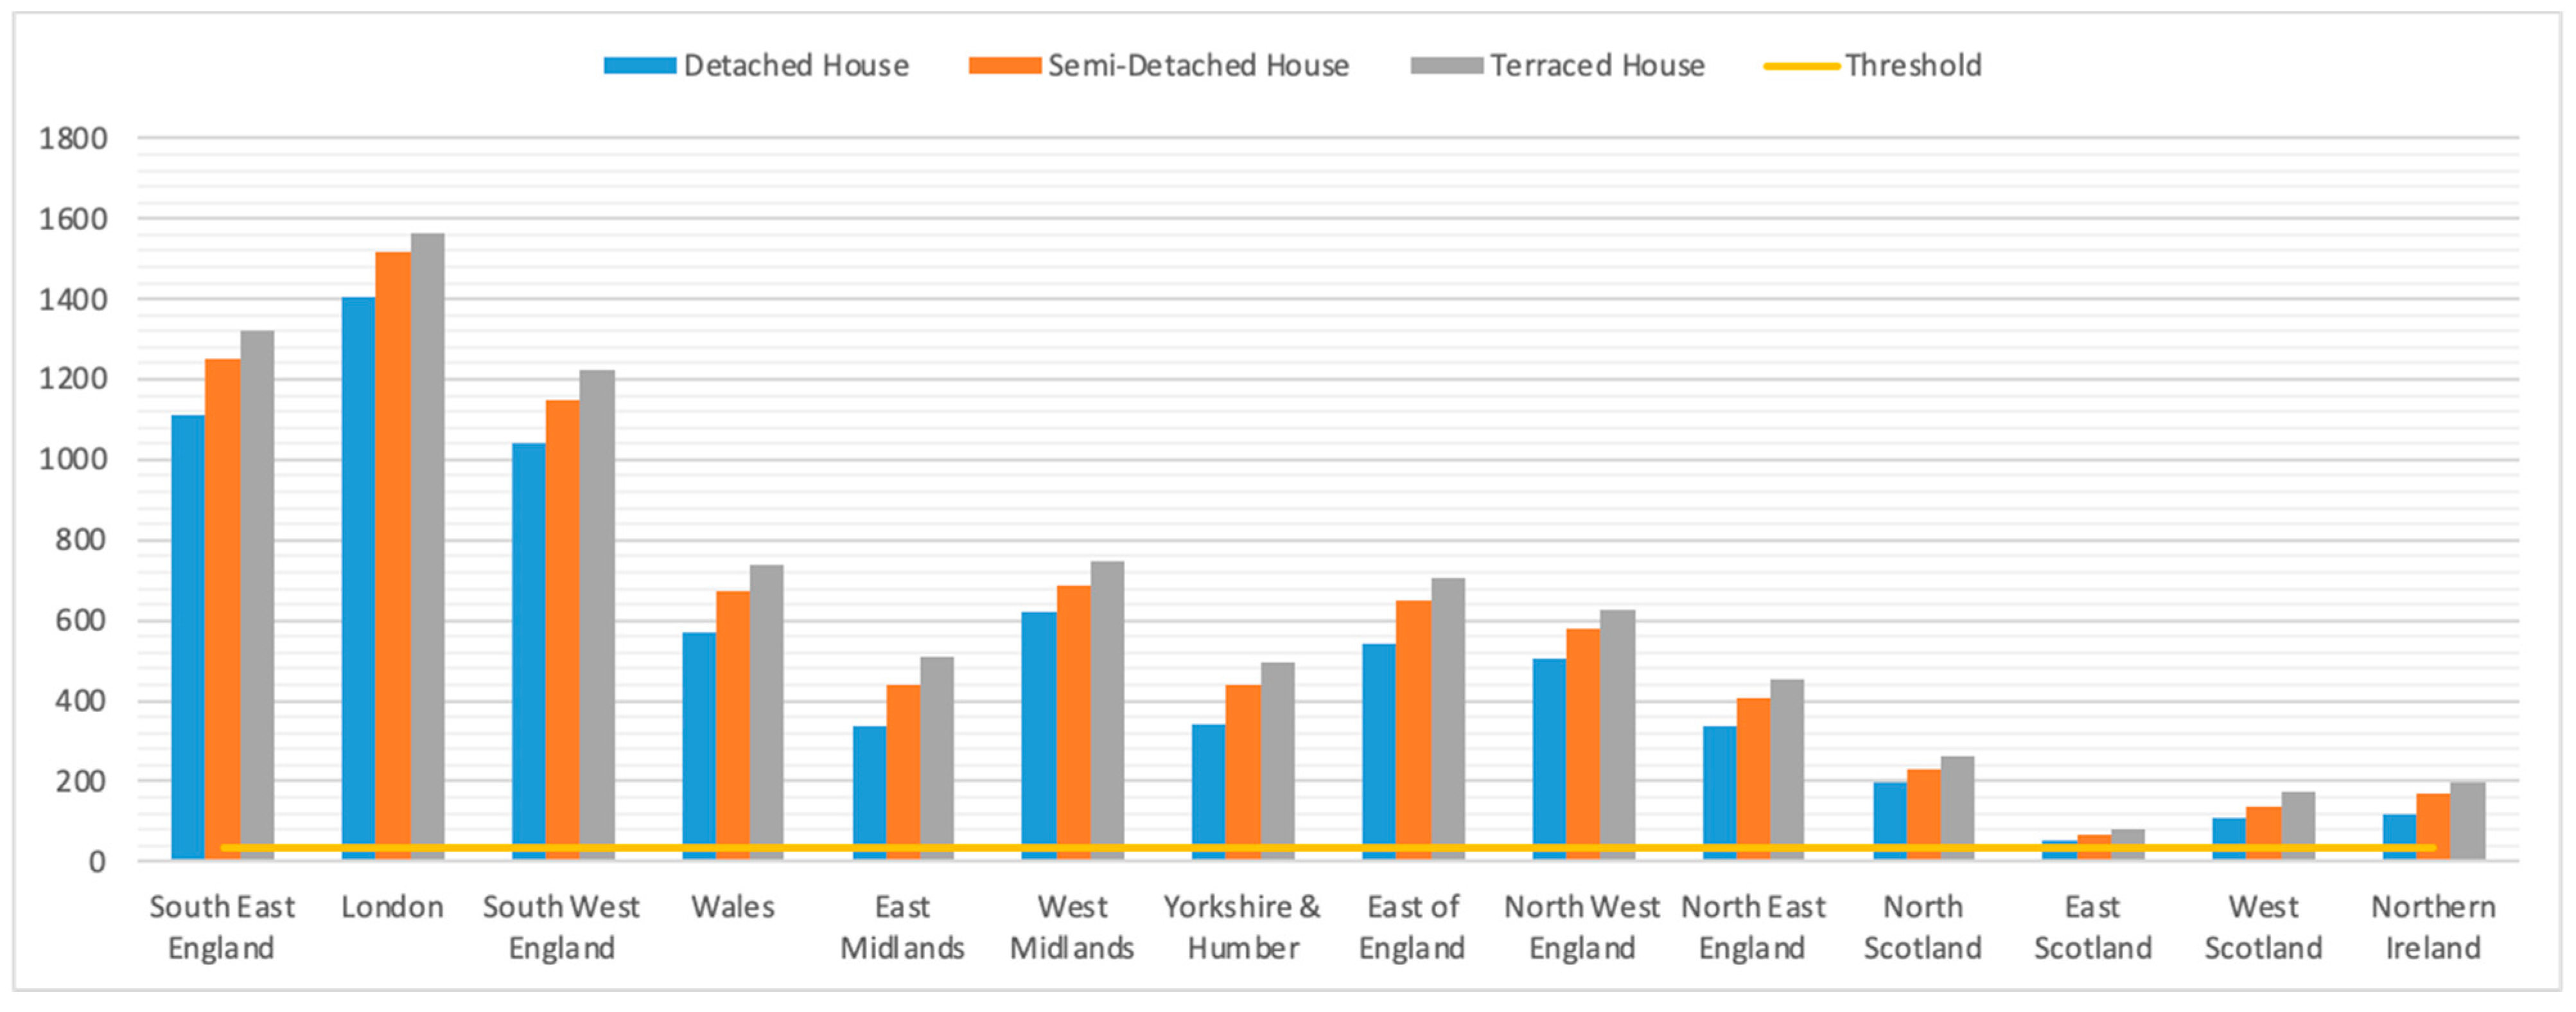
For the 2080s (Figure 9 and Figure 10), overheating increases by a large amount to over 2000 h in a few cases (2000 h is 61% of annual night hours), and over 500 h for both emission scenarios for all but the very northern regions; all scenarios are well over the threshold. Note the axes are scaled by ×1.39 compared with 2050s charts. Under both emission scenarios, north Scotland and Northern Ireland have the least overheating, with east Scotland distinctly lower under the “high” emissions; although, most regions increase a lot under “high”. Comparing the decades, 2080s medium hours for all region/house combinations are up 73%, and 2080s high hours are up 105% compared with the 2050s medium and high scenarios.
A useful though rather artificial metric is the hours over 26 °C averaged across the three house types and the 14 regions for a given decade and emission scenario (i.e., the total overheating hours divided by 42). This enables a UK-wide comparison of the scenarios, as summarised in Table 9 The difference between decades is much larger than between emissions within a decade. Although the percentage increase is very large from current to 2030s, this is from a low base of 65 h; absolute increases in hours are much larger into future decades.
3.2. Results with Solar Shading and Ventilation
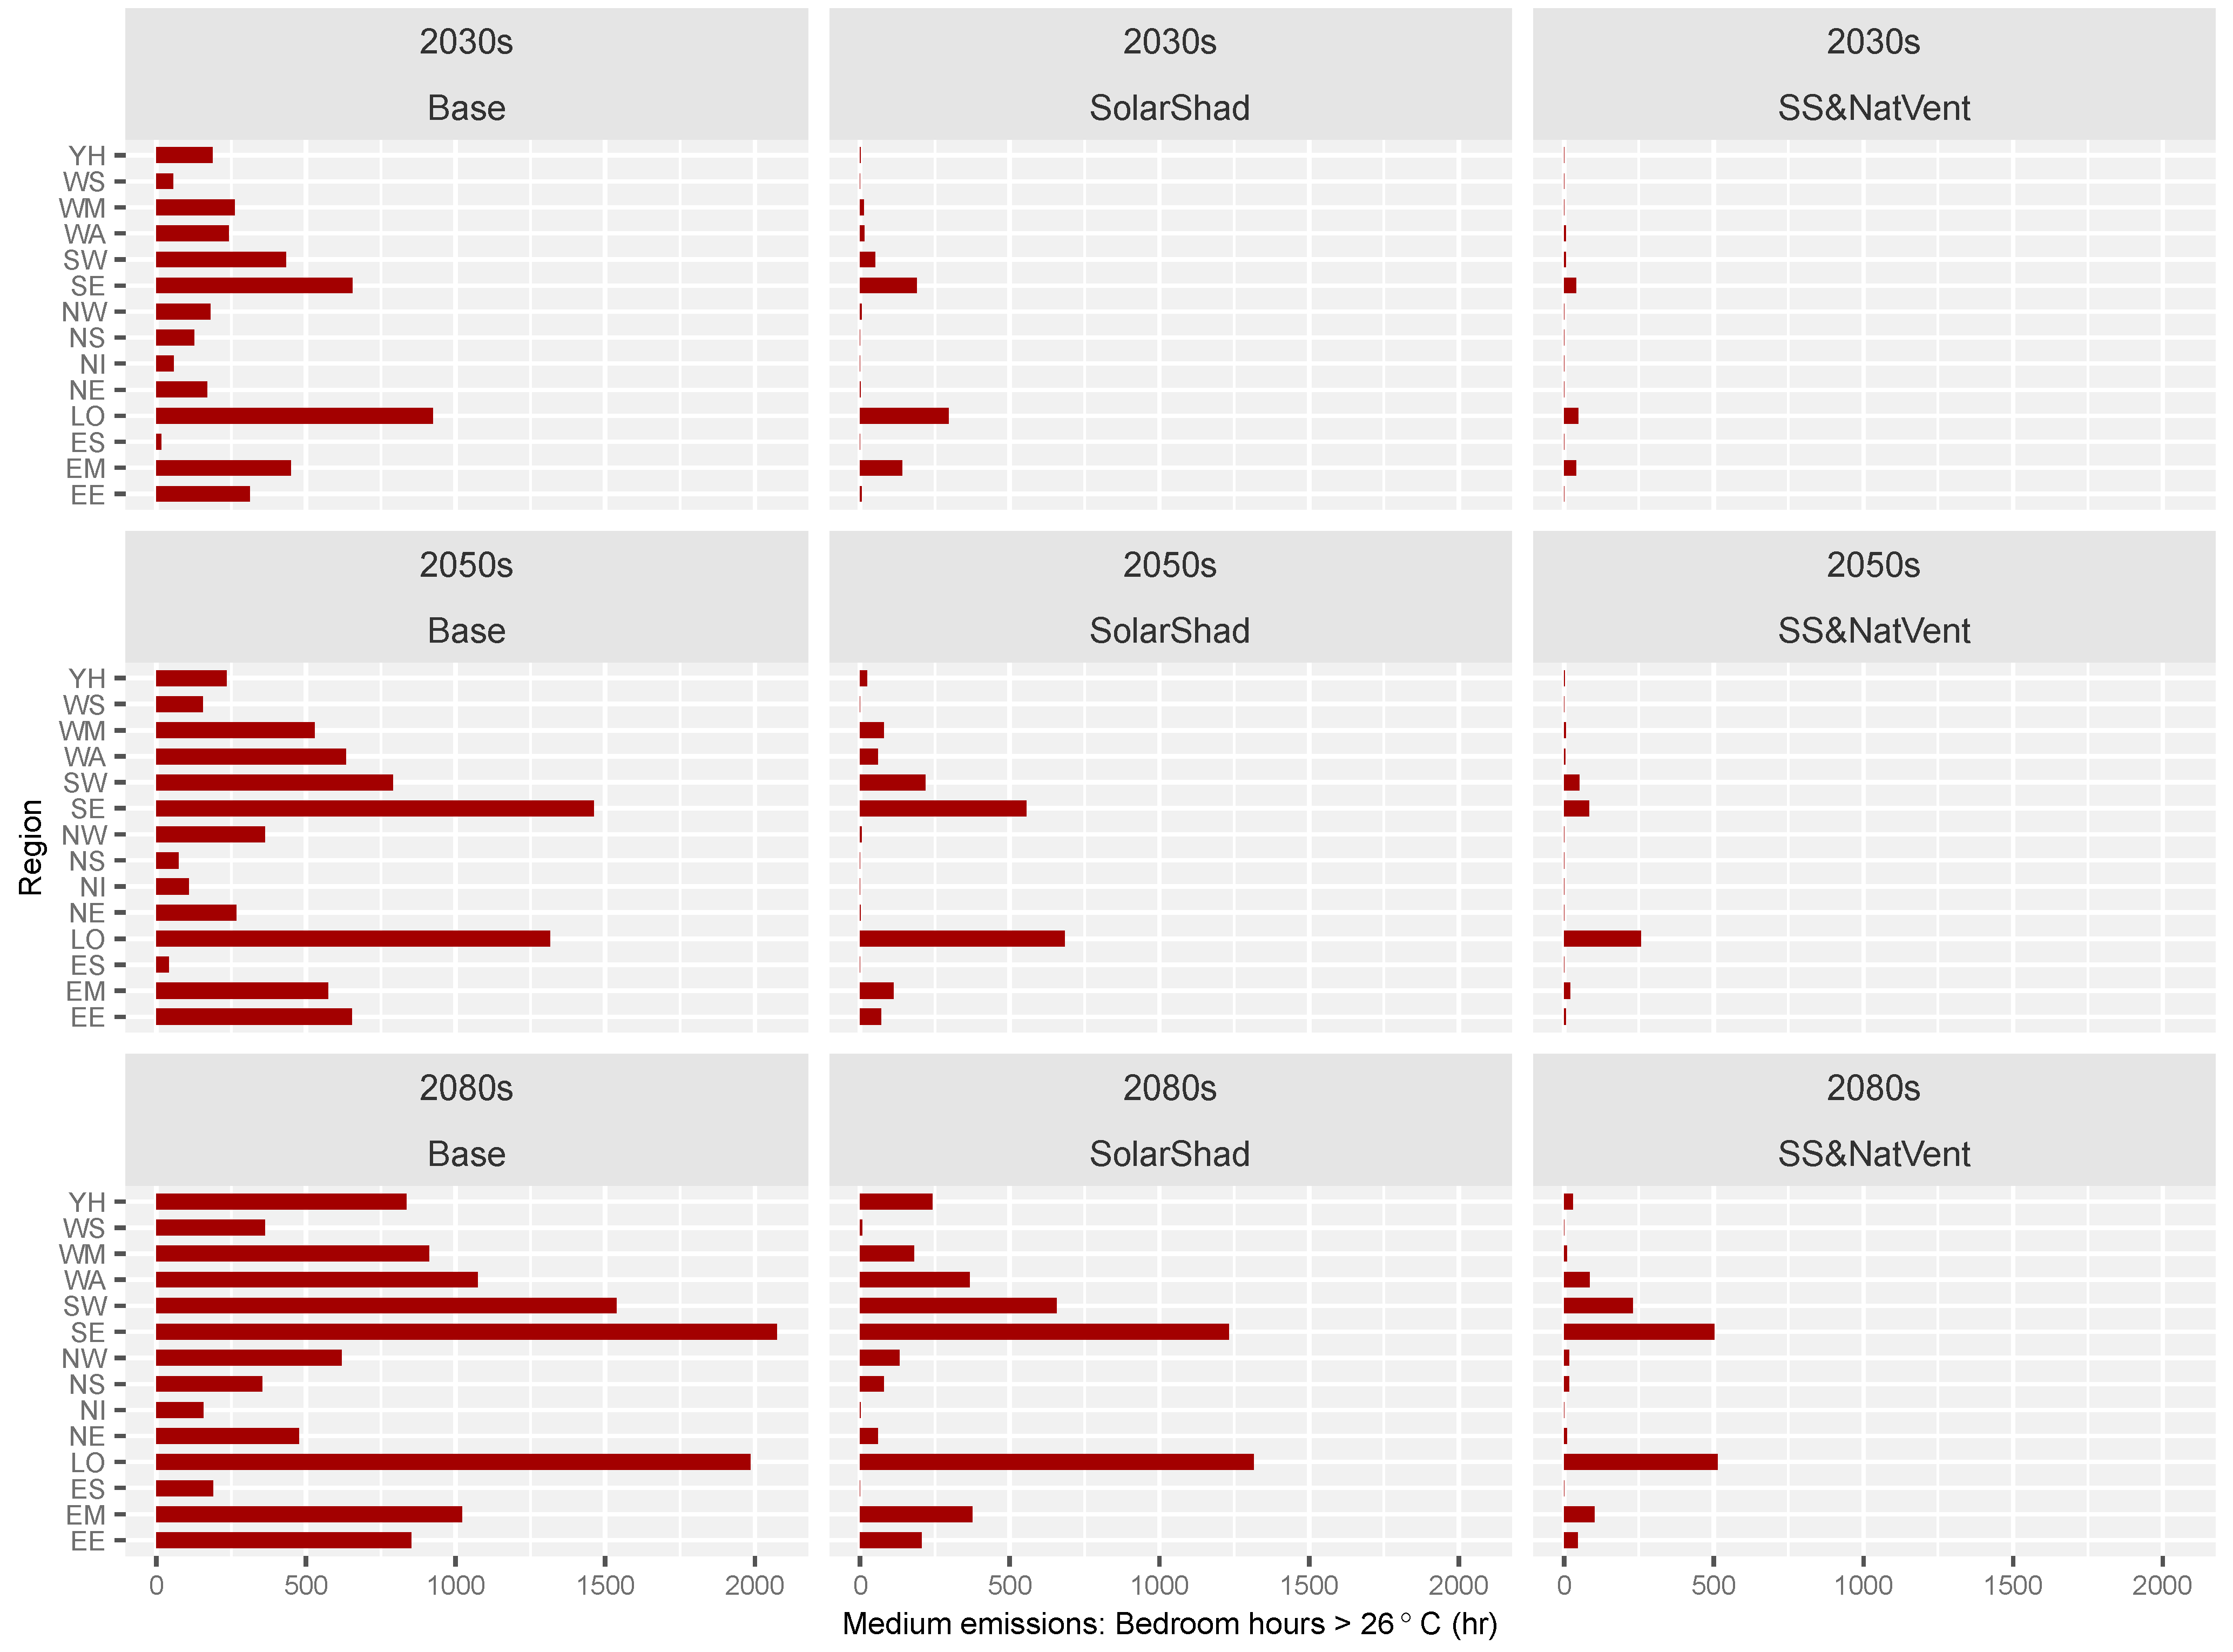
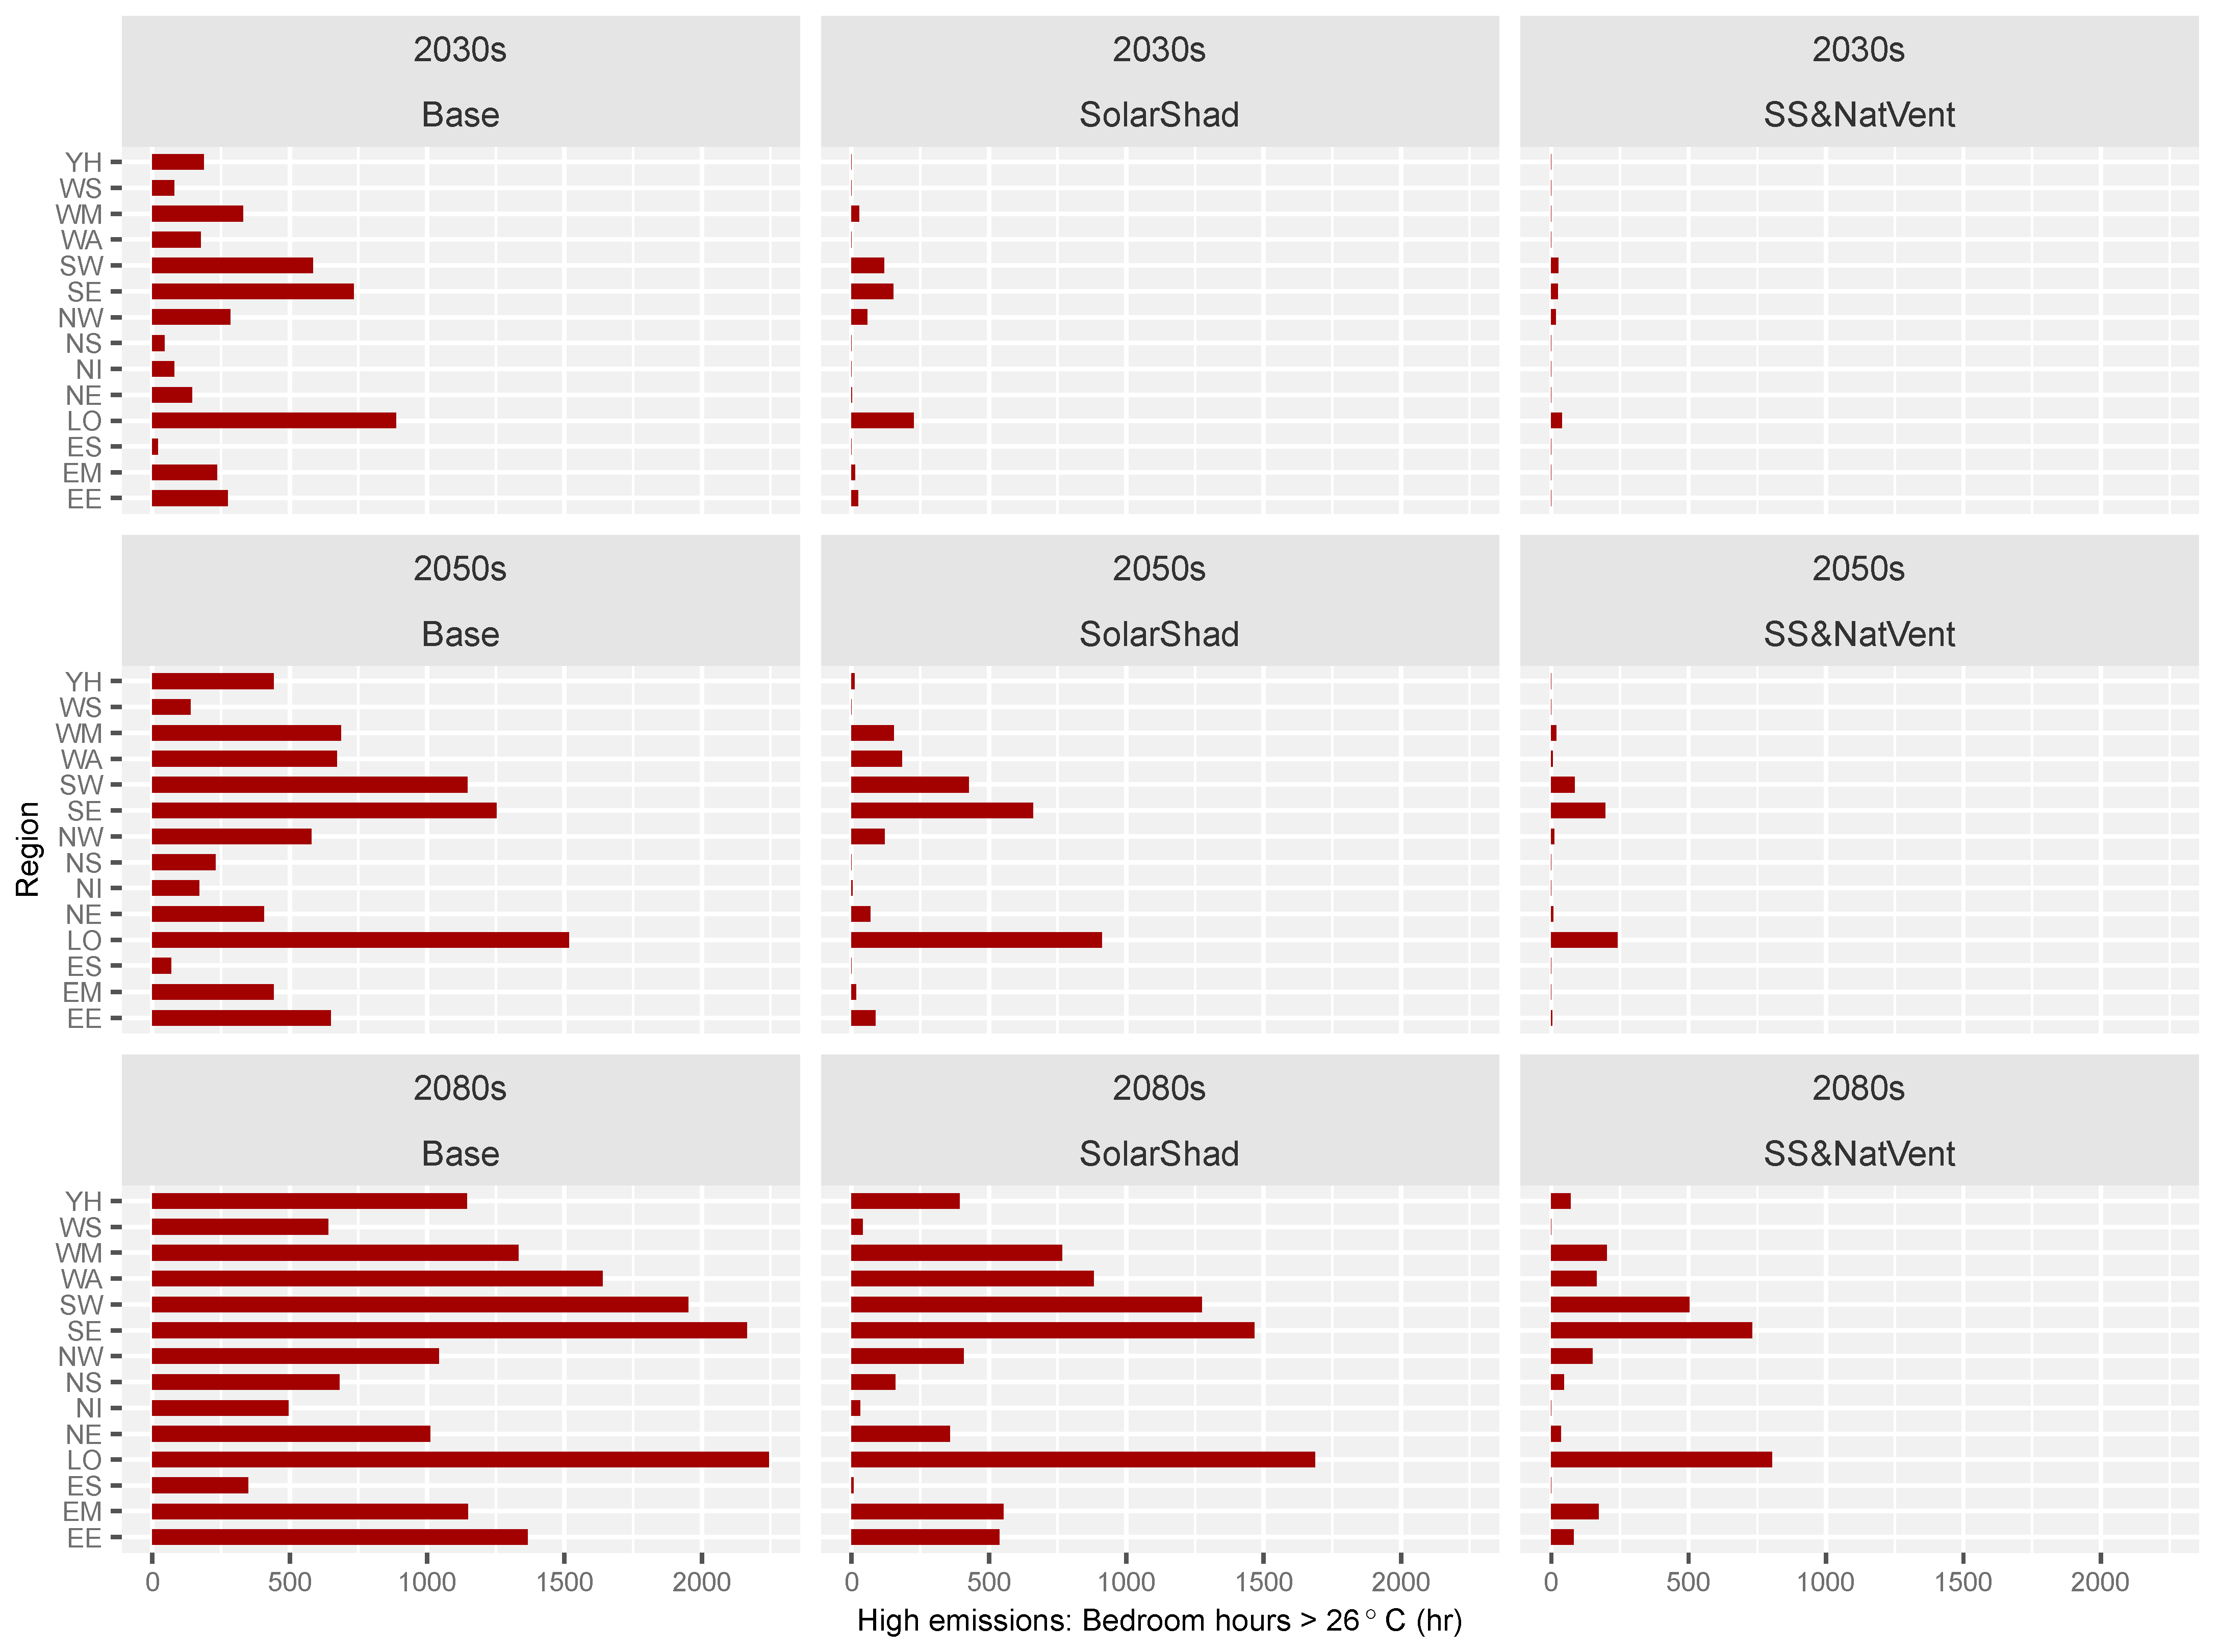
Because the results for the semi-detached house are not dissimilar to those for the terrace and detached forms, and always lie between the two, only results for the semi-detached are presented here, for the medium-emission scenario (Figure 11) and high-emission scenario (Figure 12) over three different future decades. As the hours range from zero up to nearly 2000 (61% of the total 3285 night hours) in the 2080s, compared with the 1% or 32 h comfort threshold, which is too small to see on the charts, Table 9 provides the numerical data for cases up to 200 h of overheating, or about 6% of total hours; cases meeting the 32 h criterion are shown with a tick. Under the base case without shading or ventilation, no regions meet the criterion (the lowest is east Scotland with 348 h).
The plots show that the solar shading causes a large reduction in overheating over the base case, and a further reduction when combined with natural ventilation, for all decade–emission combinations. By the 2080s under both medium and high scenarios, a few regions with at least shading meet the bedroom criterion, but no regions do for the base case.
As with the base case results, there is a significant increase in overheating from the 2030s to the 2050s, and a larger increase from 2050s to 2080s, for most regions with the extra measures. The most northerly regions have the least overheating, particularly the three in Scotland and in Northern Ireland. While the “ranking” of locations in terms of hours is generally similar between different scenarios, the order does vary as in the base case.
Table 10 shows that by the 2080s, under medium emissions, only three regions meet the 32 night hours criterion (b) with shading alone, and just two of these under high emissions. With ventilation added, seven regions meet the criterion under medium emissions, and three of these under high emissions. In all but two cases in Table 10 maximum room temperatures are below 30 °C. Therefore, even with shading and natural ventilation, most regions will overheat according to TM59, most by a large or very large amount, by the 2080s under medium- and high-emission scenarios. Almost all the regions meeting the night hours criterion under medium emissions, and all under high emissions or medium with shading only, are in Scotland or Northern Ireland. For medium with shading and ventilation, there are no regions meeting it in the southern half of the UK, except for the West Midlands under medium emissions.
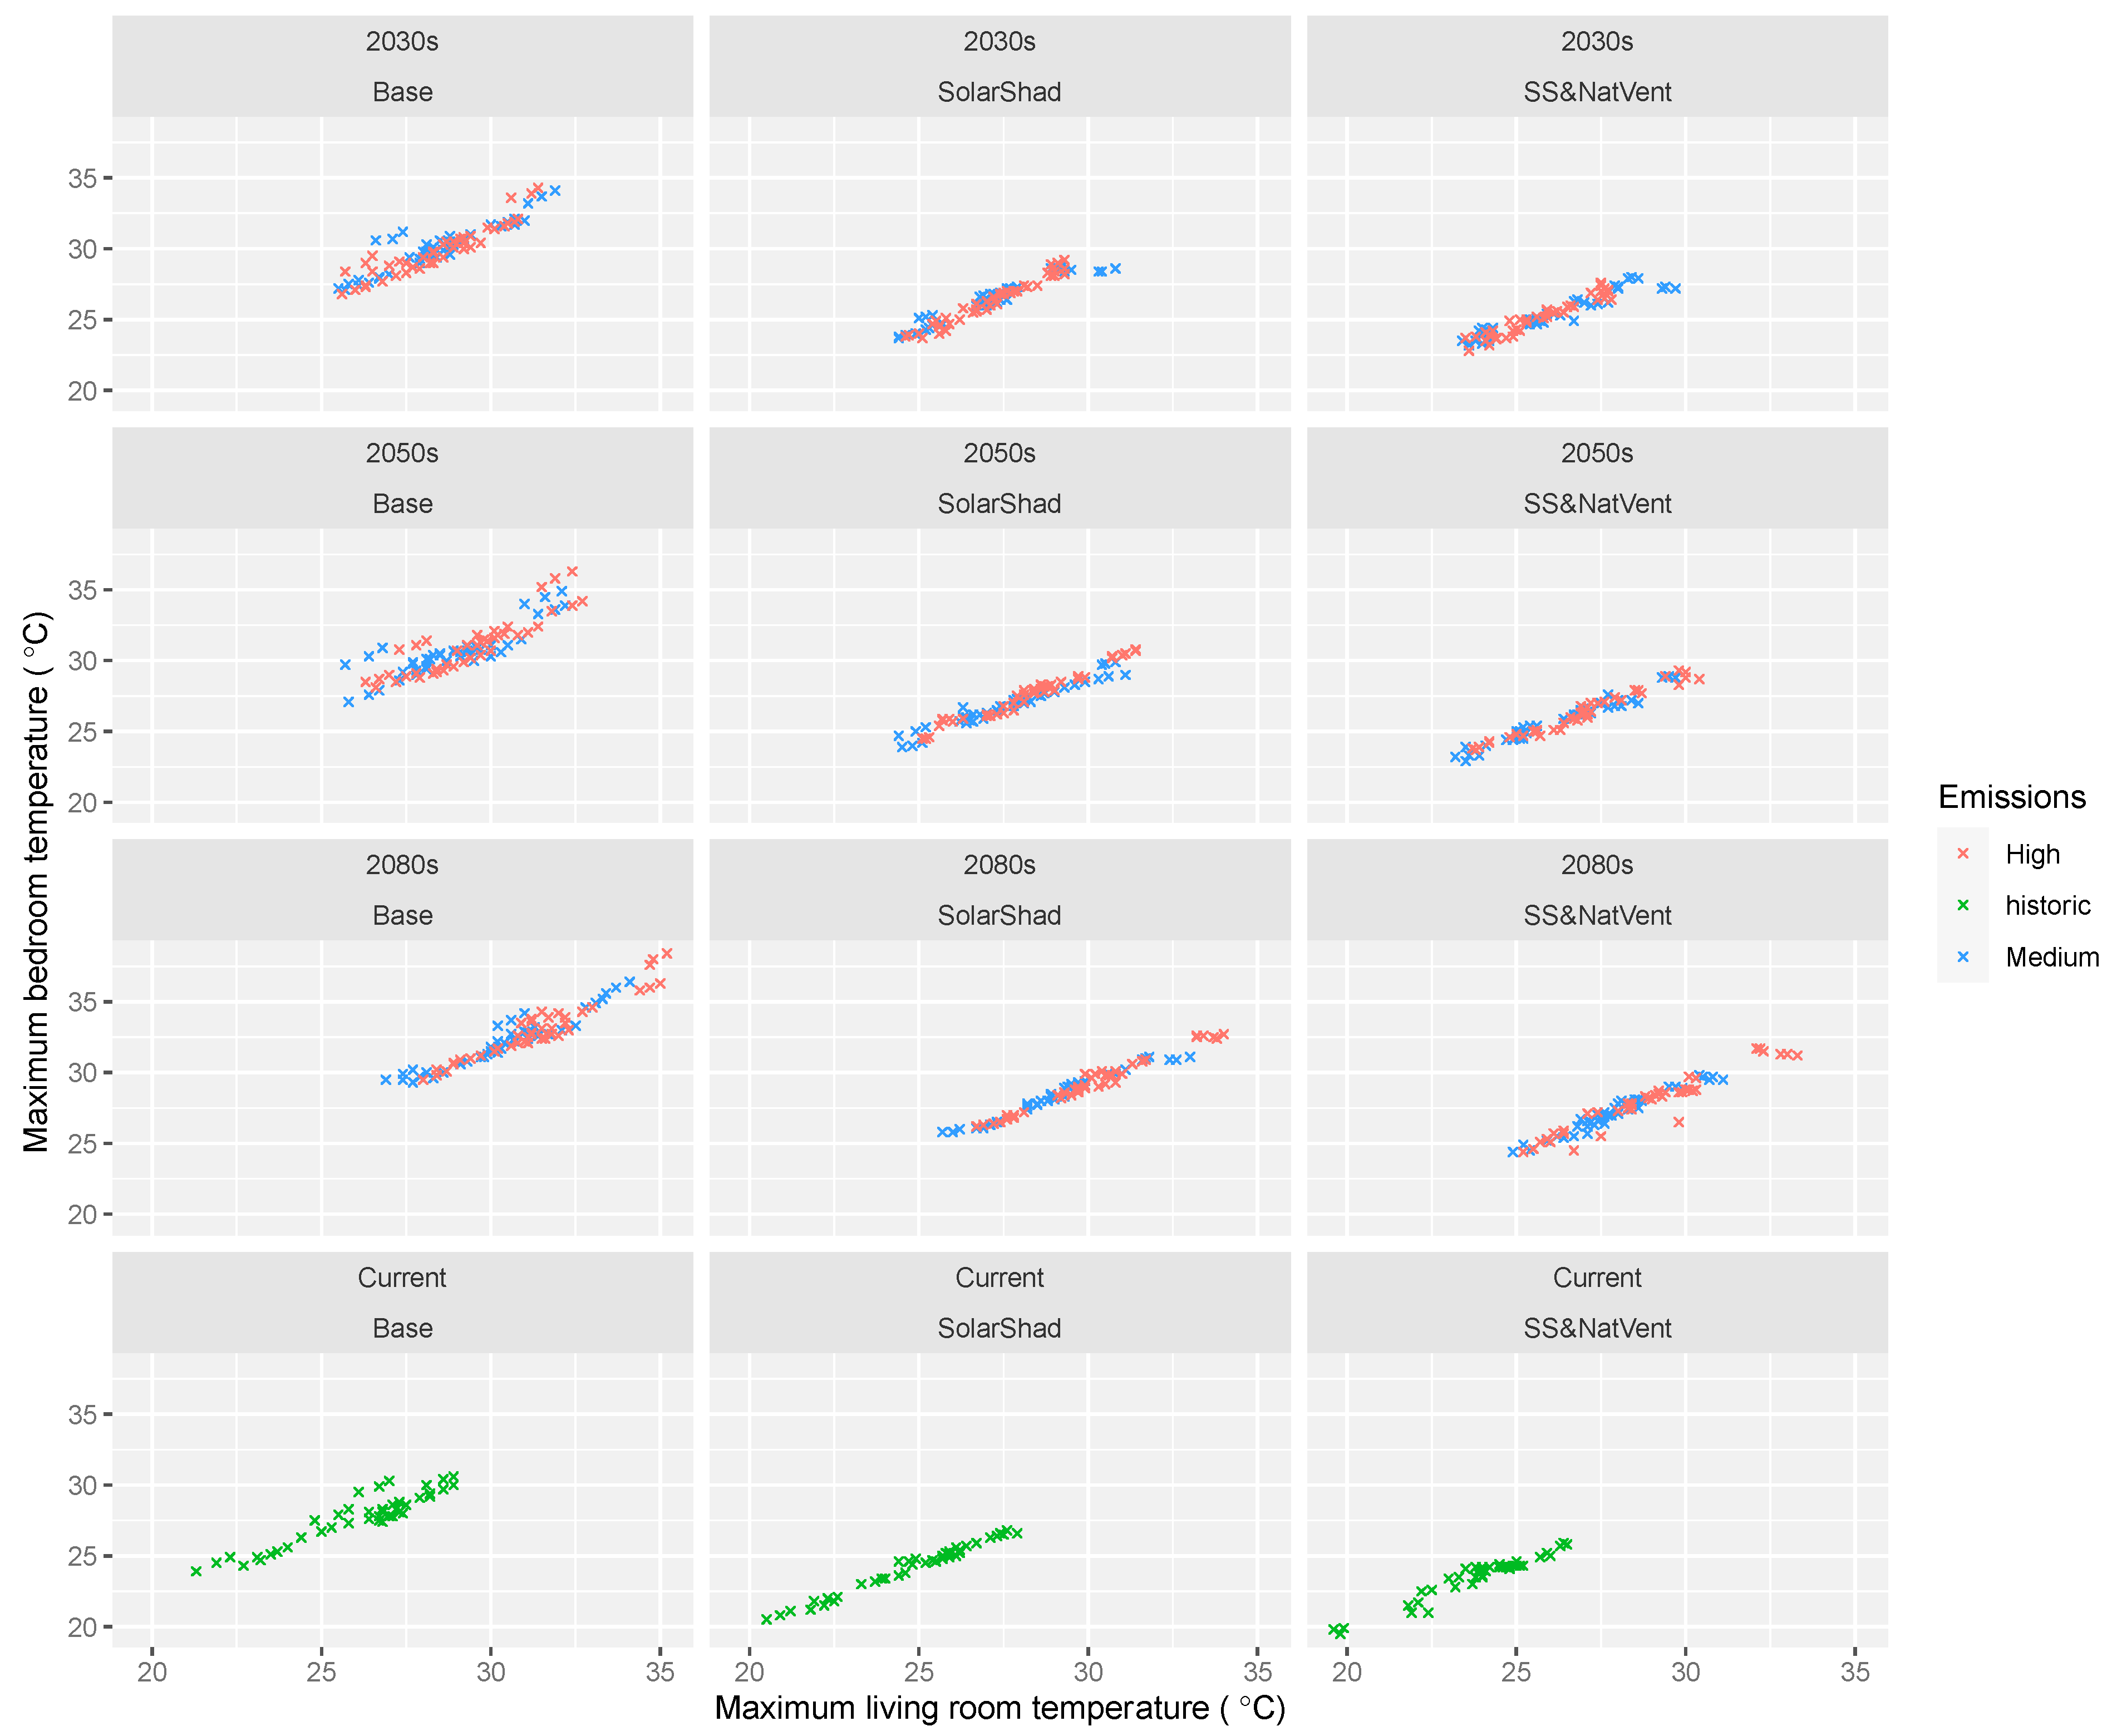
The effects of decade, emissions, and building operation are shown as scatterplots of bedroom maximum temperatures (either bedroom) against living room temperatures in Figure 13. Each plot shows one combination for all three house types and regions; medium- and high-emission cases are distinguished by colours within plots. In the simulations, windows were closed when the outside temperature exceeded 25 °C; this may tend to increase peak temperatures in the hotter weather in some situations. The results show that:
- As would be expected, the temperatures are strongly correlated in a linear way.
- Temperatures increase considerably in future decades (rows).
- Solar shading alone, and more so in combination with ventilation, produces a large reduction in temperatures compared with the base case in all scenarios (columns).
- The differences between medium (blue) and high (red) emissions are quite modest, and most noticeable in terms of the highest values
- In the base case (left column), for the current climate, all living room and almost all bedroom temperatures are below 30 °C, while for the 2080s, almost all bedroom values exceed 30 °C and almost all living rooms exceed 28 °C, with several values over 35 °C.
- For shading and ventilation (right column), for the current climate, all temperatures are below 27.5 °C, while for the 2080s, almost all exceed 25 °C, but there are few values over 30 °C.
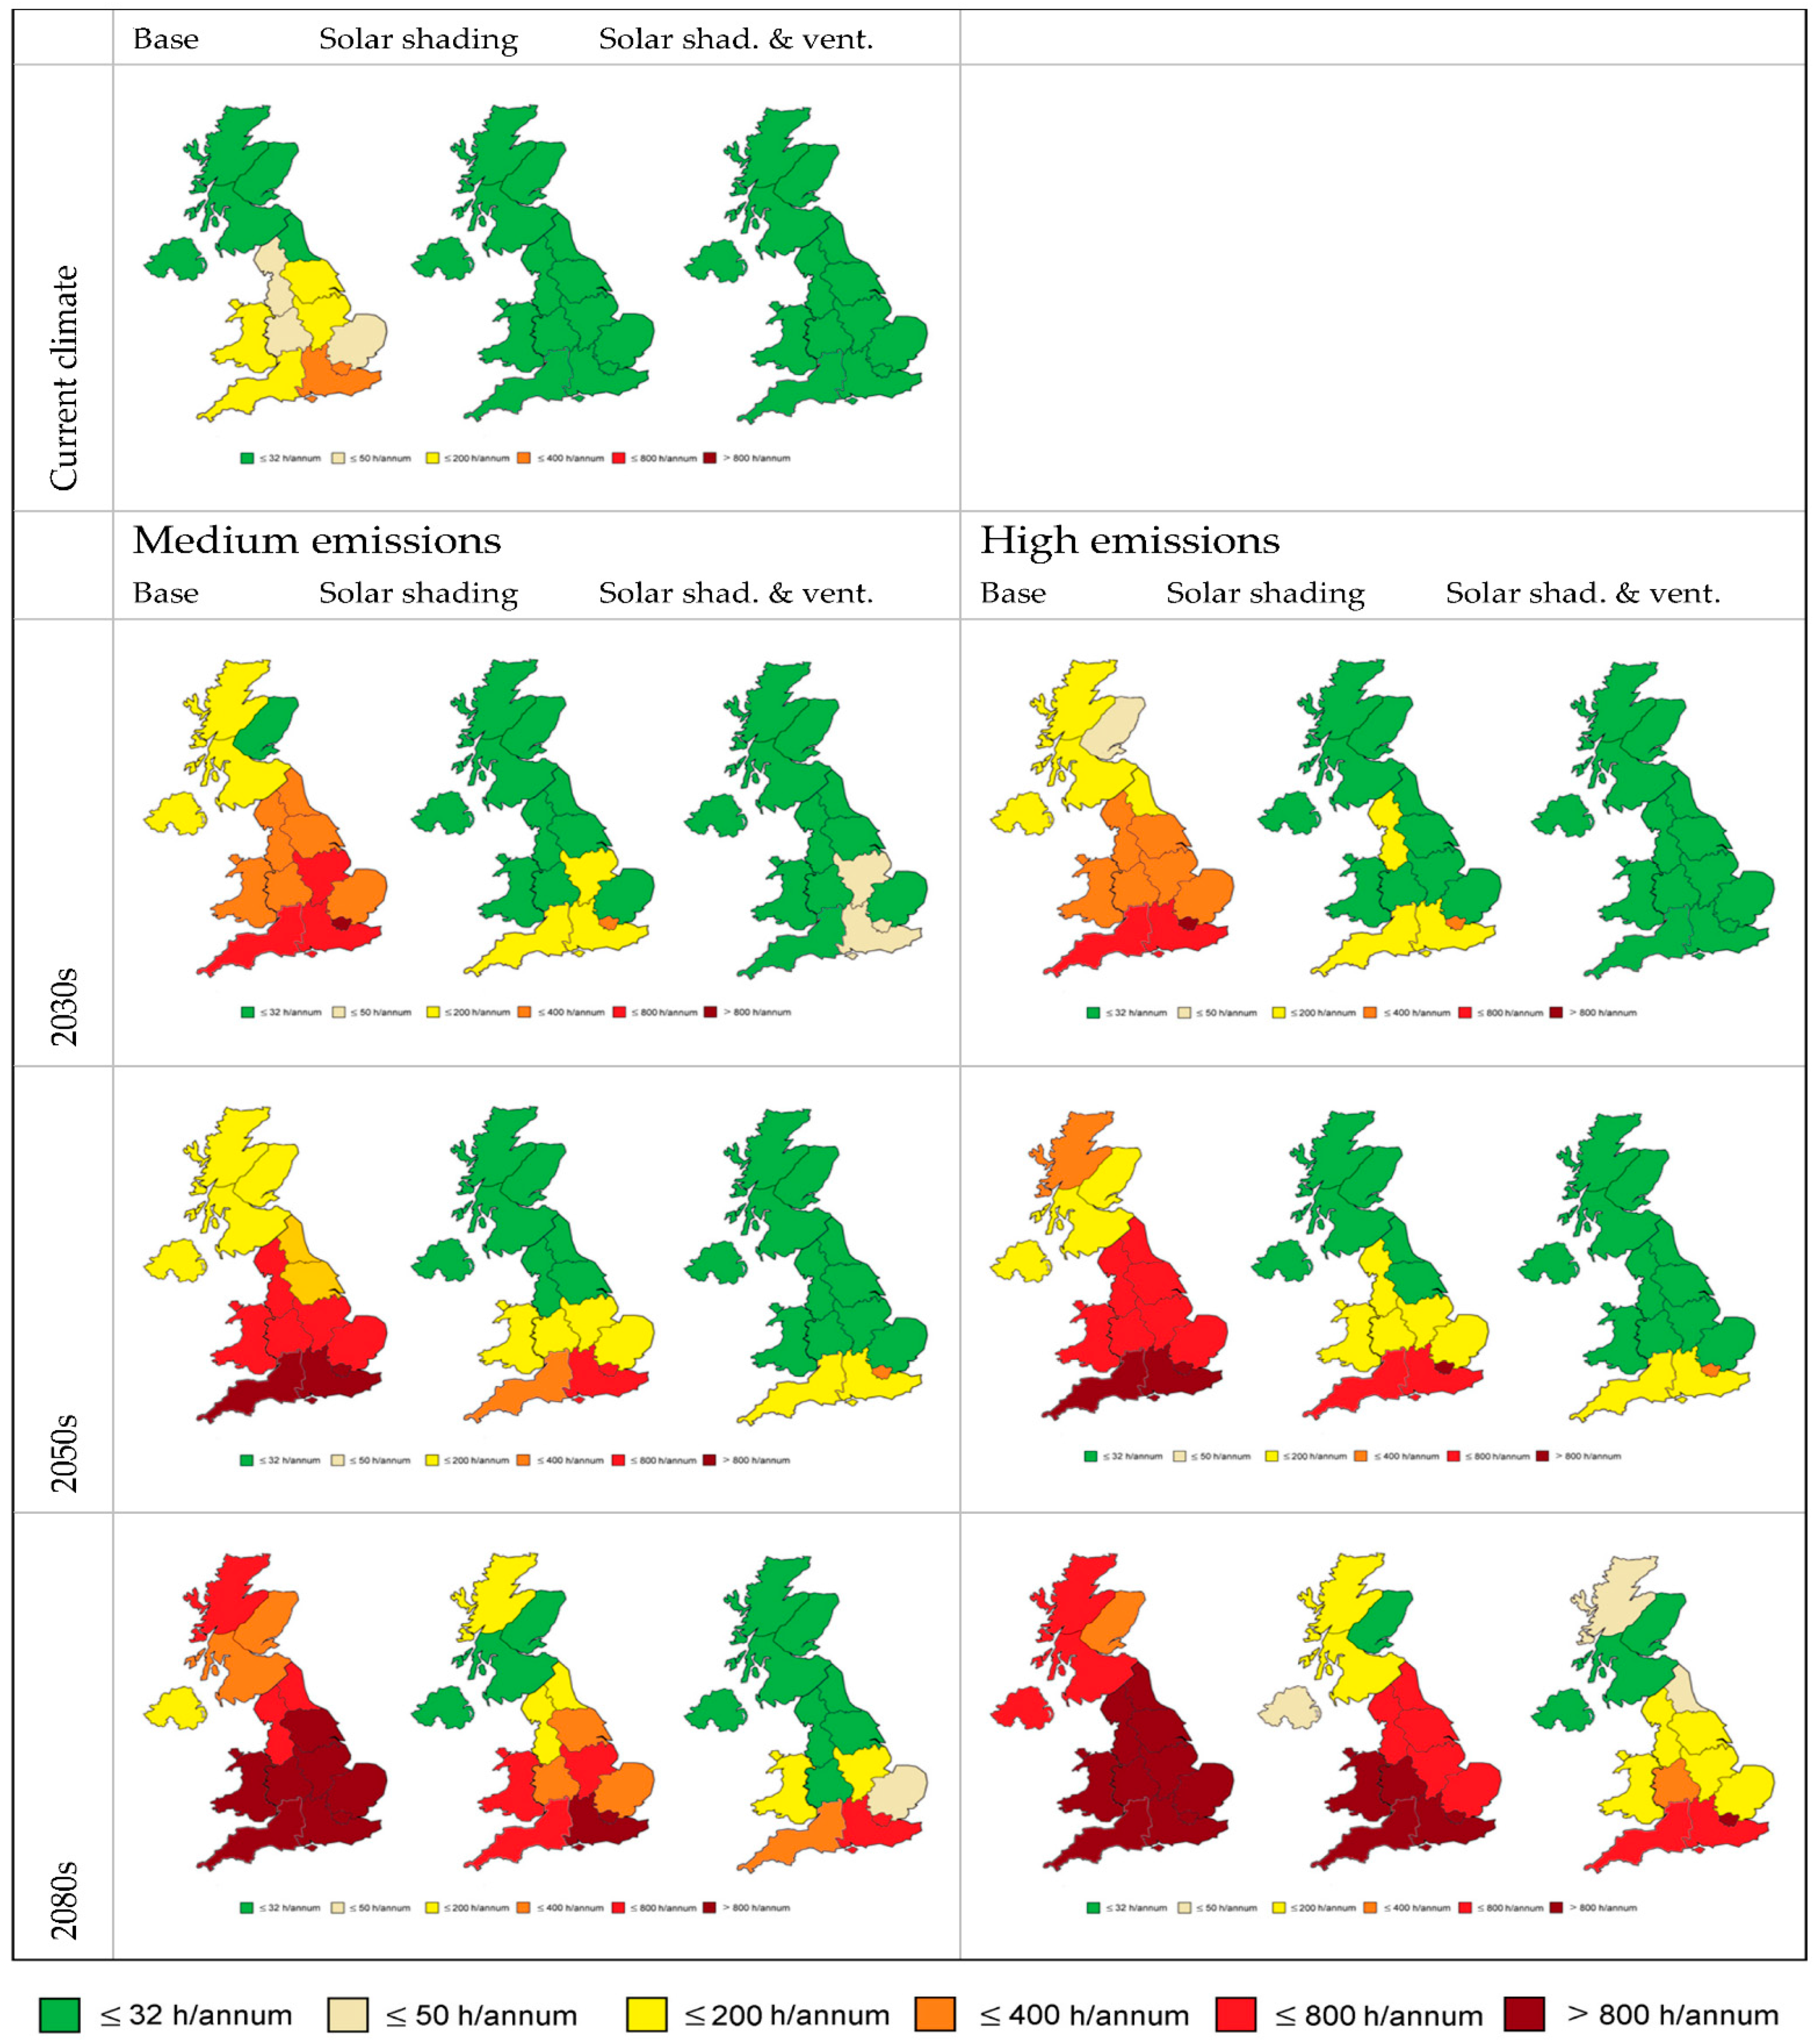
The geographical variation in overheating is shown in Figure 14. For each cell, the left-hand, centre, and right-hand maps show base case, solar shading, and solar shading plus ventilation operation, respectively. Operation clearly has a large effect on behaviour. Southern areas have the most overheating, and western regions tend to have more than those to the east of them. Surprisingly, northern Scotland has more overheating than eastern Scotland, which is more to the south also.
4. Discussion
This study of domestic summer comfort has only considered one type of construction and internal geometry, though in the three forms of terrace (row), semi-detached, and detached houses. It is also limited to a single-occupancy profile and rather high internal gains, which would tend to increase overheating. Three forms of operation were considered: base case, solar shading, and solar shading plus ventilation through openings. However, it does span current climate and three future decades, two carbon emission scenarios, and importantly, unlike many studies, all 14 regions of the UK.
The results show a dramatic increase in overheating through the century under both medium- and high-emission scenarios, with time being a more important factor than emission level. There is a large difference in overheating between the southern and northern parts of the UK, and between the base case and solar shading/opening ventilation operation. By the 2080s, all regions are overheating under the base case in both emission scenarios, but a few are not with solar shading, or solar shading plus ventilation.
The geographical variation is consistent with the work in CIBSE TM36 [38], which found much higher overheating in a new-build house for London compared with Manchester, and none for Edinburgh except for a small amount in the 2080s, under UKCIP02 medium–high emissions for the 2020s, 2050s, and 2080s. This study also found that solar shading and higher ventilation substantially reduced overheating. It also showed a similar pattern of results for a range of building types including non-domestic ones.
Similarly, Weng [24] found a large increase in overheating, modelling a semi-detached house over the 21st century using PROMETHEUS weather files, and a similar large increase with more northern sites in the order London > Birmingham > Manchester > Edinburgh > Belfast, consistent with the present study. Modelling older house types in smaller English cities, Gupta and Gregg [39] found most overheating in Oxford (south Midlands), followed by Bristol (SW) and much less in Stockport (NW), with large increases over the century; they also note the importance of shading amongst other measures to reduce this.
All simulations in the present study use the PROMETHEUS weather years [36], which have the same weather patterns as TRYs created from real weather data, but morphed to fit future climate statistics from statistically chosen years from UKCIP09, for example, with increased temperatures. Unfortunately, weather years for building design from the more recent UKCIP18 projections, which used a different approach to carbon emission projections, are not available. Many extreme weather events (droughts, rainfall, severe cold, and heatwaves) in the 21st century appear to be due to changes in the global weather system, such as a weaker and more erratic jet stream [48,49], which means that morphed historic weather may not be realistic in future decades, particularly for extreme weather such as heatwaves. The results have to be viewed with these caveats.
The dwellings considered are new builds with high levels of insulation and low infiltration, though nowhere near Passivhaus or likely future standards. Older houses have much less insulation and, even when retrofitted, are unlikely to reach modern standards. They are, therefore, likely to experience less overheating.
Although the modelling suggests very widespread and severe overheating towards the end of the century, in reality, householders will adapt, probably by installing mechanical cooling at least in some rooms. This would greatly reduce or eliminate overheating according to the criteria used here, though at a cost in money, energy, and carbon emissions. Fossil methane gas boilers are likely to be phased out over the next few decades to meet carbon reduction targets [50], with an expectation that a large proportion of these will be replaced by heat pumps; although, hydrogen and district heating may play a part too. Reversible heat pumps, which can provide both heating and cooling, would deliver cooling more efficiently than separate cooling-only units. Ground-source heat pumps would be more efficient than air-source heat pumps in summer, because the ground will be much cooler in hot weather than the air—and extracting heat from the home into the ground will also improve winter heating efficiency. However, ground source is much more expensive than air source. For cooling, delivery would have to be air based; retrofitting to radiators would not work for cooling. Reduced solar gain and improved ventilation will still help to reduce the hours of usage and amount of mechanical cooling. Higher ventilation would be possible in many cases, which would further reduce overheating except in very hot weather.
5. Conclusions
This study has provided results on future overheating under climate change across all regions of the UK, three future decades up to the 2080s, and two emission scenarios. It shows large geographic differences, large increases in overheating over the century, and the importance of solar shading and ventilation as mitigation measures. The results are broadly consistent with previous studies. Although only one type of “template” dwelling and occupancy was modelled, the patterns of results between the simulations due to location, climate scenario, and mitigation measure are likely to be broadly applicable across a much wider range, as other studies have found.
The current focus for new-build housing is to reduce heat losses and, hence, winter heating demand, but housebuilders, designers, and government policy need to take note of the need to future-proof homes against overheating by limiting solar gains and providing good natural ventilation options for passive cooling. As a revolution begins in domestic heating, low-carbon alternatives to methane boilers should also consider possible future cooling needs, particularly in the southern regions of the UK, such as ground-source heat pumps serving air systems.
Further work could extend the range of building types, occupancy patterns, and mitigation measures, such as more ventilation, and evaluate the amount of cooling needed to maintain comfort.
Updated weather years, based on the simulated weather patterns rather than weather generators, would increase confidence in the results for overheating, particularly in light of recent unprecedented and extreme weather patterns.
Author Contributions
Conceptualization, E.V.; methodology and results, E.V.; data curation, E.V and A.W.; writing, A.W. All authors have read and agreed to the published version of the manuscript.
Funding
This research received no external funding.
Data Availability Statement
Acknowledgments
The authors thank the PROMETHEUS team at the University of Exeter for providing the future weather files used in this research.
Conflicts of Interest
The authors declare no conflict of interest.
Abbreviations
| CAIT | Analysis Indicators Tool |
| CIBSE | Chartered Institution of Building Services Engineers |
| DSY | Design summer year (a “hot” summer, UK) |
| IPCC | Intergovernmental Panel on Climate Change (UN) |
| PROMETHEUS | Name of project to create future weather years, University of Exeter |
| RCP | Representative concentration pathway |
| SRES | Special Report on Emission Scenarios |
| TM | Technical Memorandum (CIBSE publication series) |
| TRY | Test reference year (an “average” year, UK) |
| UKCIP02 | UK Climate Impacts Programme 2002 |
| UKCIP09 | UK Climate Impacts Programme 2009 |
| UKCP18 | UK Climate Projections 2018 |
| WG | Weather generator |
References
- Stocker, T.F.; Qin, D.; Plattner, G.-K.; Tignor, M.; Allen, S.K.; Boschung, J.; Nauels, A.; Xia, Y. Assessment Report 5: Summary for Policymakers; Cambridge University Press: Cambridge, UK; New York, NY, USA, 2018. [Google Scholar]
- Ciavarella, A.; Cotterill, C.; Stott, P.; Kew, S.; Philip, S.; van Oldenborgh, G.J.; Skålevåg, A.; Lorenz, P.; Robin, Y.; Otto, F.; et al. Prolonged Siberian Heat of 2020; World Weather Attribution: Oxford, UK, 2020. [Google Scholar]
- Rösner, B.; Benedict, I.; van Heerwaarden, C.C.; Weerts, A.H.; Hazeleger, W.; Bissolli, P.; Trachte, K. Sidebar 7.3: The long heat wave and drought in Europe in 2018. In State of the Climate in 2018; American Meteorological Society: Boston, MA, USA, 2019; pp. S222–S237. [Google Scholar]
- Nauslar, N.; Brown, T.J.; McEvoy, D.J.; Lareau, N. State of the Climate in 2018; American Meteorological Society: Boston, MA, USA, 2019. [Google Scholar] [CrossRef] [Green Version]
- Kendon, M.; McCarthy, M.; Jevrejeva, S.; Matthews, A.; Sparks, T.; Garforth, J. State of the UK Climate 2019. Int. J. Climatol. 2020, 40, 1–69. [Google Scholar] [CrossRef]
- WMO. June Ends with Exceptional Heat. 2021. Available online: https://public.wmo.int/en/media/news/june-ends-exceptional-heat (accessed on 9 September 2021).
- Cornwall, W. Europe’s deadly floods leave scientists stunned. Science 2021, 373, 372–373. [Google Scholar] [CrossRef] [PubMed]
- Chik, H.; Xue, M. China floods: How Zhengzhou’s ‘once in a thousand years’ rainfall compares. South China Morning Post. 2021. Available online: https://flipboard.com/@SCMPNews/china-floods-how-zhengzhou-s-once-in-a-thousand-years-rainfall-compares/a-x7EuEfXaSeCCkSSeD3nivg%3Aa%3A2290161508-845d32bd09%2Fscmp.com (accessed on 9 September 2021).
- Committee on Climate Change. UK Climate Change—Risk Assessment 2017; HM Government: London, UK, 2016; p. 24.
- Committee on Climate Change. Reducing UK Emissions: 2018 Progress Report to Parliament; HM Government: London, UK, 2018.
- Dengel, A.; Swainson, M. Overheating in New Homes: A Review of the Evidence; NHBC Foundation: Milton Keynes, UK, 2012. [Google Scholar]
- Wright, D.L.; Haines, V.J.; Lomas, K.J. Overheating in UK homes: Adaptive opportunities, actions and barriers. In Proceedings of the 10th Windsor Conference: Rethinking Comfort, Windsor, UK, 12–14 April 2018; pp. 400–417. [Google Scholar]
- DCLG. Investigation into Overheating in Homes: Literature Review; DCLG: London, UK, 2012.
- Gupta, R.; Gregg, M. Assessing energy use and overheating risk in net zero energy dwellings in UK. Energy Build. 2018, 158, 897–905. [Google Scholar] [CrossRef] [Green Version]
- Fletcher, M.J.; Johnston, D.K.; Glew, D.W.; Parker, J.M. An empirical evaluation of temporal overheating in an assisted living Passivhaus dwelling in the UK. Build. Environ. 2017, 121, 106–118. [Google Scholar] [CrossRef]
- Porritt, S.M.; Cropper, P.C.; Shao, L.; Goodier, C.I. Ranking of interventions to reduce dwelling overheating during heat waves. Energy Build. 2012, 55, 16–27. [Google Scholar] [CrossRef]
- Taylor, M. Preventing Overheating, Investigating and Reporting on the Scale of Overheating in England, Including Common Causes and an Overview of Remediation Techniques; Good Homes Alliance: London, UK, 2014. [Google Scholar]
- Fosas, D.; Coley, D.A.; Natarajan, S.; Herrera, M.; Fosas de Pando, M.; Ramallo-Gonzalez, A. Mitigation versus adaptation: Does insulating dwellings increase overheating risk? Build. Environ. 2018, 143, 740–759. [Google Scholar] [CrossRef]
- Mavrogianni, A.; Wilkinson, P.; Davies, M.; Biddulph, P.; Oikonomou, E. Building characteristics as determinants of propensity to high indoor summer temperatures in London dwellings. Build. Environ. 2012, 55, 117–130. [Google Scholar] [CrossRef] [Green Version]
- Vandentorren, S.; Bretin, P.; Zeghnoun, A.; Mandereau-Bruno, L.; Croisier, A.; Cochet, C.; Ribéron, J.; Siberan, I.; Declercq, B.; Ledrans, M. August 2003 heat wave in France: Risk factors for death of elderly people living at home. Eur. J. Public Health 2006, 16, 583–591. [Google Scholar] [CrossRef] [PubMed] [Green Version]
- De Grussa, Z.; Andrews, D.; Lowry, G.; Newton, E.J.; Yiakoumetti, K.; Chalk, A.; Bush, D. A London residential retrofit case study: Evaluating passive mitigation methods of reducing risk to overheating through the use of solar shading combined with night-time ventilation. Build. Serv. Eng. Res. Technol. 2019, 40, 389–408. [Google Scholar] [CrossRef]
- Coley, D.; Kershaw, T. Changes in internal temperatures within the built environment as a response to a changing climate. Build. Environ. 2010, 45, 89–93. [Google Scholar] [CrossRef] [Green Version]
- Vardoulakis, S.; Dimitroulopoulou, C.; Thornes, J.; Lai, K.M.; Taylor, J.; Myers, I.; Heaviside, C.; Mavrogianni, A.; Shrubsole, C.; Chalabi, Z.; et al. Impact of climate change on the domestic indoor environment and associated health risks in the UK. Environ. Int. 2015, 85, 299–313. [Google Scholar] [CrossRef] [PubMed] [Green Version]
- Weng, K. Performance of UK Dwellings in Projected Future Climates. Energy Procedia 2017, 105, 3727–3732. [Google Scholar] [CrossRef]
- Building Regulations 2010: Approved Document K, Protection from Falling, Collision and Impact; HM Government: London, UK, 2013.
- Hulme, M.; Turnpenny, J.; Jenkins, G.J. Climate Change Scenarios for the United Kingdom: The UKCIP02 Scientific Report; Tyndall Centre, School of Environmental Sciences: Norwich, UK, 2002. [Google Scholar]
- IPPC. Special Report on Emission Scenarios (SRES): A Special Report of Working Group III of the Intergovernmental Panel on Climate Change; Cambridge University Press: Cambridge, UK, 2000; 599p. [Google Scholar]
- Murphy, J.M.; Sexton, D.M.H.; Jenkins, G.J.; Booth, B.B.; Brown, C.C.; Clark, R.T.; Collins, M.; Harris, G.R.; Kendon, E.J.; Betts, R.A.; et al. Climate Change Projections; Exeter, UK,, 2009; Available online: https://ueaeprints.uea.ac.uk/id/eprint/24961/ (accessed on 14 December 2021).
- Solomon, S.; Qin, D.; Manning, M.; Chen, Z.; Marquis, M.; Averyt, K.B.; Tignor, M.; Miller, H.L. (Eds.) Summary for Policymakers. In Climate Change 2007: The Physical Science Basis. Contribution of Working Group I to the Fourth Assessment Report of the Intergovernmental Panel on Climate Change; Cambridge University Press: Cambridge, UK; New York, NY, USA, 2007. [Google Scholar] [CrossRef]
- Met Office. UKCP18 Guidance: UKCP18 for UKCP09 Users; Met. Office: Exeter, UK, 2018.
- Belcher, S.E.; Hacker, J.N.; Powell, D.S. Constructing design weather data for future climates. Build. Serv. Eng. Res. Technol. 2005, 26, 49–61. [Google Scholar] [CrossRef]
- Levermore, G.J.; Parkinson, J.B. Analyses and algorithms for new Test Reference Years and Design Summer Years for the UK. Build. Serv. Eng. Res. Technol. 2006, 27, 311–325. [Google Scholar] [CrossRef]
- Mylona, A. The use of UKCP09 to produce weather files for building simulation. Build. Serv. Eng. Res. Technol. 2012, 33, 51–62. [Google Scholar] [CrossRef]
- World Resources Institute. Climatewatch. 2021. Available online: https://www.climatewatchdata.org/ (accessed on 22 September 2021).
- Eames, M.; Kershaw, T.; Coley, D. On the creation of future probabilistic design weather years from UKCP09. Build. Serv. Eng. Res. Technol. 2011, 32, 127–142. [Google Scholar] [CrossRef] [Green Version]
- Lowe, J.A.; Bernie, D.; Bett, P.; Bricheno, L.; Brown, S.; Calvert, D.; Clark, R.; Eagle, K.; Edwards, T.; Fosser, G.; et al. UKCP18 Science Overview Report. Met Off. 2019, 2, 1–73. [Google Scholar]
- CIBSE. Technical Memorandum 52: The Limits of Thermal Comfort: Avoiding Overheating in European Buildings; CIBSE: London, UK, 2013; pp. 1–25. [Google Scholar] [CrossRef]
- Hacker, J.; Holmes, M.; Belcher, S.; Davies, G. Climate Change and the Indoor Environment: Impacts and Adaptation (TM 36); Technical Memorandum, Chartered Institution of Building Services Engineers: London, UK, 2005. [Google Scholar]
- Gupta, R.; Gregg, M. Preventing the overheating of English suburban homes in a warming climate. Build. Res. Inf. 2013, 41, 281–300. [Google Scholar] [CrossRef]
- Gupta, R.; Gregg, M. Using UK climate change projections to adapt existing English homes for a warming climate. Build. Environ. 2012, 55, 20–42. [Google Scholar] [CrossRef]
- Wright, A.J.; Korolija, I.; Zhang, Y. Optimization of dwelling design under current and future climates using evolutionary algorithms in EnergyPlus. In CIBSE Technical Symposium 2013; Chartered Institution of Building Services Engineers: London, UK; Liverpool, UK, 2013. [Google Scholar]
- University of Exeter. Prometheus Downloads. Available online: https://emps.exeter.ac.uk/engineering/research/cee/research/prometheus/downloads/ (accessed on 23 September 2021).
- HM Government. Building Regulations: Approved Document L1A Conservation of Fuel and Power in New Dwellings (2013 Edition Incorporating 2016 Amendments—For Use in England); HM government: London, UK, 2017; pp. 16.1–16.128. [CrossRef]
- DCLG. English Housing Survey: Floor Space in English Homes—Main Report. Available online: https://assets.publishing.service.gov.uk/government/uploads/system/uploads/attachment_data/file/725085/Floor_Space_in_English_Homes_main_report.pdf (accessed on 26 November 2021).
- Garber, S. Shrinking Homes: The Average British House 20% Smaller than in 1970s. 2018. Available online: https://www.which.co.uk/news/2018/04/shrinking-homes-the-average-british-house-20-smaller-than-in-1970s/ (accessed on 14 December 2021).
- CIBSE. CIBSE Guide A: Environmental Design, 8th ed.; Chartered Institution of Building Services Engineers: London, UK, 2015. [Google Scholar] [CrossRef]
- CIBSE. Technical Memorandum 59: Design Methodology for the Assessment of Overheating Risk in Homes; CIBSE: London, UK, 2017. [Google Scholar]
- Lombrana, L.; Warren, H.; Sullivan, B. Heat, Floods, Fires: Jet Stream is Key Link in Climate Disasters. Available online: https://phys.org/news/2021-07-jet-stream-key-link-climate.html (accessed on 30 July 2021).
- McSweeney, R. Jet stream: Is climate change causing more ‘blocking’ weather events? (onlione). Carbon Brief 2020. Available online: https://www.carbonbrief.org/jet-stream-is-climate-change-causing-more-blocking-weather-events (accessed on 9 September 2021).
- HM Government. Energy White Paper: Powering Our Net Zero Future; HM Government: London, UK, 2020.
Figure 1.
Global annual CO2 emissions (expressed as gigatonnes of carbon equivalent) under the three IPCC SRES marker scenarios used in UKCP09: A1FI (black: high emissions), A1B (purple: medium emissions), and B1 (green: low emissions). Additionally shown dotted are two SRES emissions scenarios used in UKCIP02 but not in UKCP09: A2 (red: medium–high emissions) and B2 (blue: medium–low emissions). Reproduced from Figure 2.13 [28]. Red dot shows actual 2018 emissions from the Climate Watch website [34], CAIT dataset (3-year lag), in GtC/y, added by author.

Figure 2.
Temperature changes compared with 1981–2000 baseline (air at 1.5 m), for 2018 RCP 8.5, similar to the 2009 high-emission scenario used in this study. Chart created by author from UK Climate Projections User Interface (UKCP18 data).
Figure 2.
Temperature changes compared with 1981–2000 baseline (air at 1.5 m), for 2018 RCP 8.5, similar to the 2009 high-emission scenario used in this study. Chart created by author from UK Climate Projections User Interface (UKCP18 data).

Figure 3.
Ground and first floor layout, front and rear elevations of generic house; semi-detached form (other forms the same except for adjacency of other similar homes with party walls between).
Figure 3.
Ground and first floor layout, front and rear elevations of generic house; semi-detached form (other forms the same except for adjacency of other similar homes with party walls between).

Figure 4.
Base model annual bedroom overheating with PROMETHEUS current climate data; line shows 32 h overheating threshold.
Figure 4.
Base model annual bedroom overheating with PROMETHEUS current climate data; line shows 32 h overheating threshold.

Figure 5.
Base model annual bedroom overheating with PROMETHEUS 2030s, medium emissions climate data; line shows 32 h overheating threshold.
Figure 5.
Base model annual bedroom overheating with PROMETHEUS 2030s, medium emissions climate data; line shows 32 h overheating threshold.

Figure 6.
Base model annual bedroom overheating with PROMETHEUS 2030s, high-emissions climate data; line shows 32 h overheating threshold.
Figure 6.
Base model annual bedroom overheating with PROMETHEUS 2030s, high-emissions climate data; line shows 32 h overheating threshold.

Figure 7.
Base model annual bedroom overheating with PROMETHEUS 2050s, medium emissions climate data; line shows 32 h overheating threshold.
Figure 7.
Base model annual bedroom overheating with PROMETHEUS 2050s, medium emissions climate data; line shows 32 h overheating threshold.

Figure 8.
Base model annual bedroom overheating with PROMETHEUS 2050s, high-emissions climate data; line shows 32 h overheating threshold.
Figure 8.
Base model annual bedroom overheating with PROMETHEUS 2050s, high-emissions climate data; line shows 32 h overheating threshold.

Figure 9.
Base model annual bedroom overheating with PROMETHEUS 2080s, medium emissions climate data; line shows 32 h overheating threshold.
Figure 9.
Base model annual bedroom overheating with PROMETHEUS 2080s, medium emissions climate data; line shows 32 h overheating threshold.

Figure 10.
Base model annual bedroom overheating with PROMETHEUS 2080s, high-emissions climate data; line shows 32 h overheating threshold.
Figure 10.
Base model annual bedroom overheating with PROMETHEUS 2080s, high-emissions climate data; line shows 32 h overheating threshold.

Figure 11.
Results for medium-emission scenario in different decades: for base case, with solar shading (SolarShad), and solar shading combined with ventilation (SS&NatVent).
Figure 11.
Results for medium-emission scenario in different decades: for base case, with solar shading (SolarShad), and solar shading combined with ventilation (SS&NatVent).

Figure 12.
Results for high-emission scenario in different decades: for base case, with solar shading (SolarShad), and solar shading combined with ventilation (SS&NatVent).
Figure 12.
Results for high-emission scenario in different decades: for base case, with solar shading (SolarShad), and solar shading combined with ventilation (SS&NatVent).

Figure 13.
Scatterplots of maximum bedroom temperatures against maximum living room temperatures under different cases for all regions, house types, and building operation.
Figure 13.
Scatterplots of maximum bedroom temperatures against maximum living room temperatures under different cases for all regions, house types, and building operation.

Figure 14.
Maps showing hours of bedroom overheating by region, decade, and emissions scenario.

Table 1.
Key factors affecting overheating in dwellings.
| Factor | Mechanisms |
|---|---|
| Area of glazing and shading | Large areas of glazing, other than north facing, collect solar gain. UK homes generally have no window shading, which can cause excessive solar gain [21]. |
| Built form and surroundings | Building shape, orientation, and surroundings will affect solar gain, natural ventilation, and shading. Shading from trees or other buildings will reduce overheating. |
| Thermal mass | In general, thermal mass at internal surfaces will reduce peak daytime temperatures. However, it also tends to maintain higher night-time temperatures. Can be effective in conjunction with night cooling [22,23]. |
| Ventilation: Openable windows/area openable Ability to cross ventilate Noise Safety/security limited opening | Larger openable area increases ventilation for cooling; many homes have limited opening area, sometimes for safety reasons. Wind-driven ventilation is much more effective across different façades; natural ventilation is, thus, reduced in homes with only one façade (typically flats). Even where windows can be physically opened, they may be kept shut due to external noise or security concerns [24] Windows may have restrictors limiting opening to 100 mm in some settings [25], severely limiting ventilation, though this is not required for UK homes in general. |
| Airtightness (infiltration) | Air-tight dwellings will lose less heat, particularly at night; typically associated with modern homes, so hard to separate from higher levels of insulation. |
| Insulation | As noted, this has been linked to overheating. However, it is strongly correlated with air tightness and in some cases modern lightweight construction, so hard to separate out effects. It can of course also reduce heat gain from outside, so reduce overheating. |
| Heat gain from communal heating/hot water pipes | Linked to significant heat gains particularly in some apartment blocks and communal corridors. |
| Internal gains | High internal gains from occupants, appliances, and lighting; more efficient appliances and lights will reduce this. |
Table 2.
Emission scenarios used in UKCIP02 and UKCIP09 modelling of future climate, from Appendix 5 (p107) [26], and [28,29]; ticks indicate inclusion of scenario in UKCIP data. Notes indicate nearest UKCP18 equivalent.
| SRES Storyline/CO2 ppm in 2100/est. Temperature Rise | UKCIP02/Label | UKCP09/Label | Outline |
|---|---|---|---|
| A1F1 *: A1 variant F1, reliance on fossil fuel 920 ppm, 4.0 K | ✓ High emissions | ✓ High [this study] | Very rapid economic growth, a global population that peaks in mid-21st century then declines, and rapid introduction of new and efficient technologies. Increased cultural and social interaction, with a convergence of regional per capita income. |
| A1B: A1 variant B, balanced across all fuel sources, 2.8 K | ✓ Medium [this study] | Very rapid economic growth, a global population that peaks in mid-21st century then declines, and rapid introduction of new and efficient technologies. Increased cultural and social interaction, with a convergence of regional per capita income. | |
| A2: 820 ppm, 3.4 K | ✓ Medium–high Emissions | A very heterogeneous world characterised by self-reliance and preservation of local identities. Population continues to grow but economic growth and technological change are slower than other storylines. | |
| B2 #: 605 ppm, 2.4 K | ✓ Medium–low Emissions | A world with lower population growth than A2, accompanied by intermediate levels of economic development, with less rapid and more diverse technological change than in B1 and A1. | |
| B1 †: 540 ppm, 1.8 K | ✓ Low emissions | ✓ Low | The same population dynamics as A1, but a transition toward service and information economies, with lower material consumption and widespread introduction of clean and efficient technologies. |
Notes (see [30]). * most similar to UKCP18 RCP8.5; # most similar to UKCP18 RCP6.0; † most similar to UKCP18 RCP4.5.
Table 4.
List of UK regions and weather sites.
| East Midlands—Leicester | Northern Ireland—Belfast |
| East of England—Norwich | South East England—Portsmouth |
| East Scotland—Aberdeen | South West England—Bristol |
| London | Wales—Cardiff |
| North East England—Newcastle upon Tyne | West Midlands—Birmingham |
| North Scotland—Fort William | West Scotland—Glasgow |
| North West England—Manchester | Yorkshire and Humber—Leeds |
Table 5.
Maximum U values required for new-build housing in England and used in model (assuming CIBSE resistance values, with BS EN ISO 6946 “normal” external resistances 0.04 m2 K W−1).
Table 5.
Maximum U values required for new-build housing in England and used in model (assuming CIBSE resistance values, with BS EN ISO 6946 “normal” external resistances 0.04 m2 K W−1).
| Fabric | U Value (W m−2 K−1) Part L. | U Value (W m−2 K−1) in Model |
|---|---|---|
| Roof | 0.20 | 0.195 |
| Wall | 0.30 | 0.299 |
| Floor | 0.25 | 0.249 |
| Windows | 2.00 | 2.00 |
Table 6.
Details of constructions.
| Construction/Material | Thickness mm | Conductivity W m−1K−1 | Density kg m−3 | Spec. Heat Capacity J kg−1 K−1 | Resistance m2 K W−1 |
|---|---|---|---|---|---|
| Ground floor construction | |||||
| Insulation | 85 | 0.025 | 700 | 1000 | 3.4 |
| Reinforced concrete | 100 | 2.3 | 2300 | 1000 | 0.0435 |
| Cavity | 50 | - | - | - | 0.21 |
| Chipboard flooring | 20 | 0.13 | 500 | 1600 | 0.1538 |
| External wall construction | |||||
| Brickwork | 112.5 | 0.84 | 1700 | 800 | 0.1339 |
| Cavity | 50 | - | - | - | 0.18 |
| Polyurethane board | 50 | 0.025 | 30 | 1400 | 2 |
| Concrete block | 150 | 0.19 | 600 | 1000 | 0.7895 |
| Gypsum/plasterboard | 12 | 0.16 | 801 | 837 | 0.075 |
| Roof construction | |||||
| Roofing felt | 20 | 0.19 | 960 | 837 | 0.1053 |
| Insulation | 140 | 0.03 | 40 | 1450 | 4.6667 |
| Membrane | 0.1 | 1 | 1100 | 1000 | 0.0001 |
| Cavity | 50 | - | - | - | 0.16 |
| Plasterboard | 12.5 | 0.21 | 700 | 1000 | 0.0595 |
| External window construction | |||||
| Pilkington K 6 mm | 6 | 1.06 | 0.0057 | 0.69 | 1.526 |
| Cavity | 12 | - | 0.3247 | - | - |
| Pilkington K 6 mm | 6 | 1.06 | 0.0057 | 0.69 | 1.526 |
| External door construction | |||||
| Plywood | 45 | 0.13 | 500 | 1500 | 0.3462 |
Table 7.
Summary of infiltration and ventilation.
| Type and Condition | Details | +Infiltration 0.15 ach = 6.2 l s−1 | Total House Airflow |
|---|---|---|---|
| Louvres open, 24 l s−1 both floors when Tout < 25 °C | 48 ls−1 | 6.2 l s−1 | 54.2 l s−1 |
| Windows closed, trickle vents, 10 l s−1 per person, when Tout ≥ 25 °C | 20 l s−1 (2 people) | 6.2 l s−1 | 26.2 l s−1 |
Table 8.
Permutations of dwelling, regions (location), decade, and emission scenario used in simulations.
Table 8.
Permutations of dwelling, regions (location), decade, and emission scenario used in simulations.
| Dwelling Type | Region, Location, and [Two Letter Abbreviation for Plots] * | Decade | Emission Scenarios | Heat Reduction |
|---|---|---|---|---|
| Detached Semi-detached Terrace (3) | London (Heathrow) [LO]; South East England (Portsmouth) [SE]; South West England (Bristol) [SW]; West Midlands (Birmingham) [WM]; East Midlands (Leicester) [EM]; east of England (Norwich) [EE]; Wales (Cardiff) [WA]; North West England (Manchester) [NW]; North East England (Newcastle) [NE]; Yorkshire and Humber (Leeds) [YH]; west Scotland (Glasgow) [WS]; east Scotland (Aberdeen) [ES]; north Scotland (Fort William) [NS]; Northern Ireland (Belfast) [NI] (14) | Baseline 1981–2000 2030s 2050s 2080s (4: 1 baseline, 3 future) | Historic/baseline Future: Medium High (3: 1 baseline, 2 future) | Baseline With window ventilation With window ventilation and solar shading (3) |
* For most England regions, the normal abbreviation is used, e.g., SW for South West. Only Scotland regions end in S (east, north, and west + S). Wales is one region (WA); although, the site, Cardiff, is in the south.
Table 9.
Summary of average overheating hours between decades and emission scenarios.
| Average Overheating Hours | |||
|---|---|---|---|
| Current | 65 | ||
| Emissions, future | Medium | High | Ratio |
| 2030s | 288 | 285 | 99% |
| 2050s | 506 | 590 | 117% |
| 2080s | 877 | 1212 | 138% |
| Ratio periods | Time period ratios | ||
| 2030/current | 441% | 436% | |
| 2050/2030 | 176% | 207% | |
| 2080/2050 | 173% | 205% | |
| 2080/2030 | 304% | 426% | |
Table 10.
Cases for 2080s where bedroom overheating is below 200 h, for shading and shading and natural ventilation.
Table 10.
Cases for 2080s where bedroom overheating is below 200 h, for shading and shading and natural ventilation.
| Region | Emissions | Operation | Bed Hr > 26 °C | Max T Beds 1 | Max T Living Room 2 | Hours > 28 °C 3 | Criterion (b) Met |
|---|---|---|---|---|---|---|---|
| East Scotland (Aberdeen) [ES] | Medium | Shade | 0 | 25.8 | 26.0 | 0 | ✓ |
| Northern Ireland (Belfast) [NI] | Medium | Shade | 2 | 26.1 | 26.9 | 0 | ✓ |
| West Scotland (Glasgow) [WS] | Medium | Shade | 6 | 26.3 | 27.1 | 0 | ✓ |
| North East England (Newcastle) [NE] | Medium | Shade | 59 | 28.0 | 28.6 | 14 | |
| North Scotland (Fort William) [NS] | Medium | Shade | 79 | 28.4 | 29.1 | 21 | |
| North West England (Manchester) [NW] | Medium | Shade | 131 | 27.8 | 28.5 | 23 | |
| West Midlands (Birmingham) [WM] | Medium | Shade | 180 | 27.7 | 28.5 | 18 | |
| East Scotland (Aberdeen) [ES] | Medium | Shade and nat. vent | 0 | 24.9 | 25.2 | 0 | ✓ |
| Northern Ireland (Belfast) [NI] | Medium | Shade and nat. vent | 0 | 26.7 | 26.9 | 0 | ✓ |
| West Scotland (Glasgow) [WS] | Medium | Shade and nat. vent | 0 | 25.5 | 26.2 | 0 | ✓ |
| North East England (Newcastle) [NE] | Medium | Shade and nat. vent | 10 | 27.0 | 27.4 | 0 | ✓ |
| West Midlands (Birmingham) [WM] | Medium | Shade and nat. vent | 10 | 26.5 | 27.2 | 0 | ✓ |
| North West England (Manchester) [NW] | Medium | Shade and nat. vent | 16 | 26.6 | 27.4 | 0 | ✓ |
| North Scotland (Fort William) [NS] | Medium | Shade and nat. vent | 17 | 27.5 | 27.9 | 0 | ✓ |
| Yorkshire and Humber (Leeds) [YH] | Medium | Shade and nat. vent | 30 | 27.2 | 27.6 | 0 | |
| East of England (Norwich) [EE] | Medium | Shade and nat. vent | 46 | 27.9 | 28.5 | 8 | |
| Wales (Cardiff) [WA] | Medium | Shade and nat. vent | 85 | 28.0 | 28.1 | 3 | |
| East Midlands (Leicester) [EM] | Medium | Shade and nat. vent | 101 | 28.1 | 28.6 | 16 | |
| East Scotland (Aberdeen) [ES] | High | Shade | 6 | 26.3 | 26.9 | 0 | ✓ |
| Northern Ireland (Belfast) [NI] | High | Shade | 30 | 27.0 | 27.8 | 0 | ✓ |
| West Scotland (Glasgow) [WS] | High | Shade | 40 | 26.7 | 27.6 | 0 | |
| North Scotland (Fort William) [NS] | High | Shade | 158 | 28.8 | 29.7 | 30 | |
| East Scotland (Aberdeen) [ES] | High | Shade and nat. vent | 0 | 24.6 | 25.5 | 0 | ✓ |
| Northern Ireland (Belfast) [NI] | High | Shade and nat. vent | 0 | 25.9 | 26.4 | 0 | ✓ |
| West Scotland (Glasgow) [WS] | High | Shade and nat. vent | 0 | 25.3 | 25.9 | 0 | ✓ |
| North East England (Newcastle) [NE] | High | Shade and nat. vent | 35 | 27.2 | 27.4 | 0 | |
| North Scotland (Fort William) [NS] | High | Shade and nat. vent | 47 | 28.2 | 28.9 | 13 | |
| Yorkshire and Humber (Leeds) [YH] | High | Shade and nat. vent | 71 | 27.5 | 28.3 | 6 | |
| East of England (Norwich) [EE] | High | Shade and nat. vent | 83 | 27.8 | 28.4 | 8 | |
| North West England (Manchester) [NW] | High | Shade and nat. vent | 151 | 28.8 | 30.1 | 34 | |
| Wales (Cardiff) [WA] | High | Shade and nat. vent | 165 | 28.8 | 30.0 | 38 | |
| East Midlands (Leicester) [EM] | High | Shade and nat. vent | 173 | 28.7 | 29.2 | 19 |
Notes: 1. Maximum temperature in either bedroom. 2. Maximum temperature in living room (there is only one). 3. Hours any main room (living room, both bedrooms) is over 28 °C; if more than one room, still counts as 1 h.
Publisher’s Note: MDPI stays neutral with regard to jurisdictional claims in published maps and institutional affiliations. |
© 2022 by the authors. Licensee MDPI, Basel, Switzerland. This article is an open access article distributed under the terms and conditions of the Creative Commons Attribution (CC BY) license (https://creativecommons.org/licenses/by/4.0/).
Share and Cite
MDPI and ACS Style
Wright, A.; Venskunas, E. Effects of Future Climate Change and Adaptation Measures on Summer Comfort of Modern Homes across the Regions of the UK. Energies 2022, 15, 512. https://0-doi-org.brum.beds.ac.uk/10.3390/en15020512
AMA Style
Wright A, Venskunas E. Effects of Future Climate Change and Adaptation Measures on Summer Comfort of Modern Homes across the Regions of the UK. Energies. 2022; 15(2):512. https://0-doi-org.brum.beds.ac.uk/10.3390/en15020512
Chicago/Turabian StyleWright, Andrew, and Eduardas Venskunas. 2022. "Effects of Future Climate Change and Adaptation Measures on Summer Comfort of Modern Homes across the Regions of the UK" Energies 15, no. 2: 512. https://0-doi-org.brum.beds.ac.uk/10.3390/en15020512
Note that from the first issue of 2016, this journal uses article numbers instead of page numbers. See further details here.