
Dynamic Correlation between Crude Oil Price and Investor Sentiment in China: Heterogeneous and Asymmetric Effect


1
Guangzhou Institute of International Finance, Guangzhou University, Guangzhou 510006, China
2
School of Economics and Statistics, Guangzhou University, Guangzhou 510006, China
3
Department of Economics and Finance, Portsmouth Business School, University of Portsmouth, Portsmouth PO1 3DE, UK
*
Author to whom correspondence should be addressed.
Energies 2022, 15(3), 687; https://0-doi-org.brum.beds.ac.uk/10.3390/en15030687
Submission received: 8 December 2021
/
Revised: 9 January 2022
/
Accepted: 14 January 2022
/
Published: 18 January 2022
(This article belongs to the Special Issue Global Market for Crude Oil II)
Abstract
:This paper aims to explore the dynamic relationships between the crude oil price (shocks) and investor sentiment. Specifically, this paper utilizes web crawler to construct Chinese investor sentiment index. The structural vector autoregression (SVAR) model is then used to decompose the crude oil price shocks into three types of oil price shocks. Finally, the wavelet coherence analysis (WTC) is employed to study the dynamic correlation between crude oil price (shocks) and investor sentiment in the time and frequency domain, and their asymmetric dynamic correlation under different trends of crude oil price. Using data from February 2013 to June 2021, our empirical results suggest the heterogeneous dynamic correlations and lead-lag relationships exist between crude oil price (shocks) and investor sentiment over different time and frequency domains. In addition, there are asymmetric dynamic correlations and lead–lag relationships between crude oil price (shocks) and investor sentiment under different trends of crude oil price.
1. Introduction
Crude oil prices and investor sentiment is crucial for our economic development. Crude oil, as a core source of energy, is essential for the global economy. Oil price fluctuations affect a country’s economic development and social stability through various channels. For instance, increase in oil prices results in the increase in production cost of goods and services, leading to further inflation, and affect social stability and consumer confidence. Existing works mainly explore the impact of crude oil price on macroeconomic variables, such as gross domestic product [1,2,3,4], the consumer price index [5,6], inflation [7,8,9], interest rate [10,11], financial cycle [12], stock market [13,14,15,16,17,18], investments [19], unemployment [20], economic policy uncertainty [21,22], and so on. Boubaker and Raza [16] employed a multivariate autoregressive moving average generalized autoregressive conditional heteroskedasticity corrected Dynamic Conditional Correlation (VARMA-GARCH-cDCC) model and wavelet multiresolution analysis to investigate the spillover effects of volatility and shocks between oil prices and the BRICS stock markets at different time horizons. Their results manifested that oil price and stock market prices are directly affected by their own news and volatilities and indirectly affected by the volatilities of other prices and wavelet scale. However, oil price fluctuations also affect microeconomic activity, such as stock pricing [23], consumption [24,25,26], investor concern [27,28,29], investor sentiment [30,31,32], and so on. For instance, crude oil prices may influence investor sentiment through both the real economy and the stock market. Investor sentiment is a belief about future cash flows and investment risks. On the one hand, oil price shock impacts macroeconomic, thus affects investors’ confidence and sentiment towards their economic activities. On the other hand, fluctuations in the price of crude oil have an effect on the stock market. The fluctuation of the stock market affects the decision making of investors and leads to the change of investor sentiment. Therefore, fully understanding the relationship between crude oil prices and investor sentiment is crucial for our economic development.
Although a number of studies have focused on the relationship between crude oil price and investor sentiment, there is no consensus about the nexus between oil price and investor sentiment. The nexus between oil prices and investor sentiment is complex. Firstly, crude oil price exerts effects on investor sentiment. On the one hand, crude oil price exerts positive effects on investor sentiment. Li and Ouyang [33] used the investor sentiment index based on the China Securities Investor Protection Fund Corporation’s monthly survey and employed Bayesian inference structural vector autoregression (SVAR) model to investigate the impact of structural oil price shocks on China’s investor sentiment. They found that oil supply shocks and consumption demand shocks exert positive influence on China’s investor sentiment, the effects of which are mainly transmitted by affecting investor’s confidence in Chinese economic fundamentals and the international economic environment. Decomposing the real price of crude oil by SVAR model, KILIAN and PARK [34] explore the impacts of crude oil demand and supply shocks on the real crude oil price. Their results showed that demand or supply shocks for crude oil contributed to U.S. real stock returns. On the other hand, crude oil price exerts negative impacts on investor sentiment. Employing a SVAR model, Ding et al. [35] investigated the contagion effect of international crude oil price fluctuations on Chinese stock market investor sentiment. Their results implied that the international crude oil price negatively affect Chinese stock market investor sentiment and the average contagion delay 8 months. He, Zhou, Xia, Wen, and Huang [31] constructed individual investor sentiment by using data from the American Association of Individual Investors. They revealed that oil prices exert negative impacts and significant long-run and short-run asymmetric effects on individual investor sentiment.
Secondly, investor sentiment plays a role in crude oil price. Based on monthly, weekly, and daily data from 1986 to 2016, Qadan and Nama [36] used parametric and nonparametric methods to reveal that investor sentiment has a significant impact on oil prices. Yao, Zhang, and Ma [27] constructed a proxy for investor attention in crude oil market by aggregating the Google search volume index (GSVI) and employ SVAR model to investigate the impact of investor attention on WTI crude oil price. They found that investor attention have a significant and negative impact on WTI crude oil price between January 2004 and November 2016. Choi et al. [37] used weekly actual position data during 1996–2006 from the COT report to study whether actual position-based investor sentiment is useful in predicting price movements in crude oil. They found that investor sentiments have an insignificant influence on futures price movements in subsequent periods. In addition, some literature forecast crude oil price based on text and web-based sentiment. For instance, Zhao et al. [38] proposed a new hybrid oil price forecasting model based on web-based sentiment analysis. They found that a quasi-linear relationship exists between oil price and web text sentiment. Li et al. [39] also proposes a novel crude oil price forecasting method based on online media text mining. Wu et al. [40] believed that the social media information can reflect oil market factors and exogenous factors, and their study implied that social media information contributes to forecasting oil price, oil production, and oil consumption.
Thirdly, an interaction between crude oil prices and investor sentiment was proven. From the perspective of both the time and the frequency domains, Ye, Hu, He, Ouyang, and Wen [32] employed wavelet coherence analysis to investigate the interaction between crude oil prices and investor sentiment. Their results indicated that crude oil prices lead investor sentiment and the co-movement between crude oil prices and investor sentiment change with time and frequency. Apergis, Cooray, and Rehman [30] employed a quantile regression method to find a statistically significant association between oil and natural gas prices and investor sentiment. In addition, He and Zhou [41] analyzed the interaction between oil price shocks and investor sentiment by constructing linear and nonlinear causality approach, time-varying parameter (TVP) VAR model and NARDL model. Their results indicated that oil-specific demand shock exerts a positive effect on investor sentiment over time, and has positive and asymmetric effects on investor sentiment in the short-run. However, oil supply shock or aggregate demand shock have an insignificant impact on investor sentiment. Furthermore, He, Zhou, Xia, Wen, and Huang [31] employed Hiemstra and Jones test, the Diks and Panchenko test, and the TVP-SVAR model to investigate the interaction between crude oil prices and individual investor sentiment. Their results showed that bidirectional nonlinear Granger causality exists between crude oil prices and individual investor sentiment, and the interactions between them are time-varying. Under extreme shocks, Wang et al. [42] explored the causality between the crude oil futures market and investor sentiment by introducing an extended Granger causality approach in the time and frequency domains. They found that the crude oil futures market and investor sentiment show dynamic causality at different frequencies. Additionally, the extreme shock-related causal linkages from the frequency perspective indicate that short-term causality performs better than medium- and long-term causality.
To summarize, a branch of literature has focused on the relationship between crude oil prices and investor sentiment, and has achieved some interesting results. However, there are several aspects worthy of further study. On the one hand, the heterogeneous dynamic correlation and its lead–lag relationship between various crude oil price shocks and investor sentiment in the time and frequency domain yet to be investigated. On the other hand, the asymmetric dynamic correlation and its lead–lag relationship between crude oil price and investor sentiment under different trends of crude oil price has not been explored.
In this paper, we take a fresh look at the dynamic relationship between crude oil prices and investor sentiment. First, this paper exploits a web crawler to construct a Chinese investor sentiment index. The structure vector autoregression model is then utilized to decompose the crude oil price shocks into three oil price shocks, namely crude oil supply shocks, aggregate demand shocks, and oil-specific demand shocks, respectively. Finally, this paper employs the wavelet coherence analysis to study the dynamic correlation between oil price (shocks) and investor sentiment in the time and frequency domain, and further explore the asymmetric dynamic correlation between them in the time and frequency domain under different trends of oil price.
Based on these, this paper yields several main conclusions. First, heterogeneous dynamic correlations and lead–lag relationships exist between crude oil price (shocks) and investor sentiment over different time and frequency domains. In addition, there are asymmetric dynamic correlations and lead–lag relationships between crude oil price (shocks) and investor sentiment under different trends of crude oil price.
The contribution of this paper is to extend the literature on the dynamic relationships between the crude oil price and investor sentiment. On the one hand, our analysis helps shed light on the heterogeneous dynamic correlation between crude oil price shocks and investor sentiment in the time and frequency domain in China. Additionally, the results imply that dynamic correlation and its lead–lag relationship between various crude oil price shocks and investor sentiment in the time and frequency domain in China are heterogeneous. On the other hand, we complement the literature on the dynamic correlation and its lead–lag relationship between crude oil price shocks and investor sentiment by taking a systematic look at asymmetry under different trends of crude oil price. In our monthly observations from January 2011 to June 2021, we find the asymmetry dynamic correlation and its lead–lag relationship between crude oil price shocks and investor sentiment under different trends of crude oil price.
The remainder of this paper is organized as follows. We begin in Section 2, by providing a conceptual framing for our empirical approach. To do so, we introduce the wavelet coherence analysis method and the methods used to decompose the crude oil price and measure investor sentiment. Then, we describe our data. In Section 3, we establish the basic results described above, focusing on heterogeneous dynamic correlation between crude oil prices and investor sentiment. In Section 4, we present our empirical results on the asymmetric dynamic correlation between crude oil prices and investor sentiment under different trends of oil price. Section 5 concludes.
2. Methods and Data
In this section, we provide a conceptual framing for our empirical approach and data. The wavelet coherence analysis method employed to investigate the dynamic correlation between crude oil price (shocks) and investor sentiment is introduced in Section 2.1. In addition, measurement of crude oil price shocks and investor sentiment and their corresponding data source are present in Section 2.2.
2.1. Wavelet Coherence Analysis Method
Existing studies of the method used to investigate the relationship between crude oil prices and investor sentiment suffer from two limitations. On the one hand, numerous studies have attempted to examine the correlation between oil prices and investor sentiment based on Granger tests [31]. Their results reveal a bidirectional nonlinear Granger causality between crude oil prices and individual investor sentiment. Wang, Ma, Niu, and Liang [42] introduced an extended Granger causality approach in the time and frequency domains to explore the causality between the crude oil futures market and investor sentiment under extreme shocks. On the other hand, the traditional time series method often considers the time and frequency domains separately, which cannot analyze the relationship between oil prices and investor sentiment comprehensively. He and Zhou [41] employed a TVP-VAR model to discover that the oil-specific demand shock exerts positive effect on investor sentiment over time. These two limitations leave areas for further research in this paper.
Wavelet coherence analysis (WTC) is a powerful tool to analyze the dynamic relationships between crude oil prices (shocks) and investor sentiment. First, rather than subdividing the crude oil prices (shocks) and investor sentiment time series into several sample periods, as in other methods, WTC analysis allows us to analyze the dynamic correlation between crude oil prices (shocks) and investor sentiment during different regimes by decomposing crude oil prices (shocks) and investor sentiment time series into a localized frequency. Second, WTC analysis can measure the dynamic co-movement relationships and lead–lag relationships between crude oil prices (shocks) and investor sentiment at various frequencies. Thirdly, WTC analysis offers us an opportunity to conduct a comprehensive three-dimensional analysis between the crude oil prices (shocks) and investor sentiment by simultaneously considering the time and frequency domains, as well as the strength of the correlation between them [43,44]. Additionally, other methods often consider the time and frequency domains separately. Therefore, to comprehensively conduct the dynamic co-movement relationships between crude oil prices (shocks) and investor sentiment at various time and frequencies, we employ a wavelet coherence analysis method to identify the co-movements.
Next, we briefly introduce the wavelet coherence analysis approach. According to Maraun and Kurths [45], wavelet coherence is defined in terms of smoothing over time and scale, and the amount of smoothing depends on the choice of wavelet and scale. For given crude oil price (shocks) time series and investor sentiment time series , the specific form of the continuous wavelet transformation and corresponding to their wavelet function are as follows:
where the bar shows the complex conjugation, is the location parameter to provide the exact position of the wavelet. denotes the scale parameter of the wavelet, and it has an inverse relation to frequency.
To conduct the WTC analysis and wavelet phase difference analysis, we select complex value analysis wavelets containing both amplitude and phase information. In particular, the wavelet transform of crude oil price (shocks) can be decomposed into the real part and the imaginary part , or amplitude and phase .
Morlet wavelets can capture both the amplitude information and the phase information of the wave. Due to the advantages of Morlet wavelets, we exploit WTC analysis under Morlet’s specification [32]. The Morlet wavelet can be expressed as follows:
where is the dimensionless frequency and denotes time. Furthermore, the correlation between the crude oil price (shocks) and investor sentiment in different time and frequency domains can be obtained by the cross-wavelet transform:
where and are the wavelet transforms of crude oil price (shocks) series and investor sentiment series , respectively, and the bar means the complex conjugation. The cross-wavelet power can be defined as , which depicts the local covariance of the crude oil price (shocks) and investor sentiment in the time and frequency domains. Additionally, the cross-wavelet transform shows the area in the timescale space with high common power. However, the correlation of the low power area in the cross-wavelet transform is not significant, and it is difficult to obtain deterministic conclusions [32]. Therefore, it is necessary to introduce the complex wavelet coherence :
where is a smoothing operator in time and scale. The wavelet coherence is defined as the absolute value of the complex wavelet coherence and can be expressed as
Although WTC analysis can reveal the correlation of crude oil price (shocks) and investor sentiment in the time and frequency domains, it fails to provide information about the lead–lag relationship between them. Therefore, a phase difference tool was introduced into our research framework. Similar to the wavelet transform, the complex wavelet coherence can be expressed in polar form , and the phase differences of the time series and are as follows:
where . If , there is no phase difference between the crude oil price (shocks) and investor sentiment at a specific frequency. When , crude oil price (shocks) and investor sentiment are positively related and crude oil price (shocks) leads investor sentiment. When , crude oil price (shocks), and investor sentiment are positively related, while investor sentiment leads crude oil price (shocks). There is a negative co-movement between the crude oil price (shocks) and investor sentiment if . When , crude oil price (shocks) and investor sentiment are negatively related and investor sentiment leads crude oil price (shocks). When , crude oil price (shocks) and investor sentiment are negatively related, while crude oil price (shocks) leads investor sentiment.
Furthermore, the phase patterns of crude oil price (shocks) and investor sentiment are clearly presented by the arrows in their wavelet coherency maps. Specifically, the arrows point right if crude oil price (shocks) and investor sentiment are positively related and point left if crude oil price (shocks) and investor sentiment are negatively related. Moreover, the leads or lags relationship of crude oil price (shocks) and investor sentiment can also be obtained from the arrows. The arrows pointing left and down or right and up imply that crude oil price (shocks) leads investor sentiment, while the arrows points left and up or right and down, investor sentiment leads crude oil price (shocks).
Our data cover crude oil price (shocks) and Chinese investor sentiment for the period from February 2013 to June 2021. Measurement of crude oil price (shocks) and Chinese investor sentiment and data sources are described in the following subsections.
2.2. Variables Measurement and Data Source
In this subsection, we mainly decompose the crude oil price shocks into three types of crude oil price shocks and measure Chinese investor sentiment based on web crawler.
2.2.1. Crude Oil Price Shock Decomposition
Throughout the paper, following the seminal work of Kilian [46], we work with a SVAR model to decompose the crude oil price shock into crude oil supply shocks, aggregate demand shocks, and oil-specific demand shocks. More specifically, crude oil supply shocks refer to shocks to the current physical availability of crude oil. Aggregate demand shocks are defined as the shocks of fluctuations in the global business cycle on current crude oil demand. Oil-specific demand shocks denote shocks driven by change in the precautionary demand for crude oil. Our dataset consists of global crude oil production, real economic activity index combined with real crude oil price span from February 2011 to June 2021.
The SVAR model based on monthly data for is exploited to decompose the crude oil price shocks. denotes the logarithmic difference in crude oil production in thousand barrels pumped per day (averaged by month), which indicates changes in crude oil production. is the index of real global economic activity constructed by Kilian [46], measuring the state of global real economic activity. refers to the real crude oil price, which is the nominal oil price deflected by the US consumer price index. The SVAR model is represented as follows:
where represents the serially and mutually uncorrelated vector of structural innovation. Assuming that is a matrix with recursive structure, so according to , the reduced form errors can be decomposed as Formula (9).
where represents three oil price shocks, is the crude oil supply shocks, denotes the aggregate demand shocks, refers to the oil-specific demand shocks. All three oil price shocks can be obtained.
To decompose the crude oil price shocks, we mainly use data including crude oil prices, the US consumer price index, crude oil production, and the global economic activities index. Specifically, we collect the monthly spot price of WTI (Cushing, OK WTI Spot Price FOB) from U.S. Energy Information Administration as the proxy for nominal crude oil prices. The U.S. consumer price index data are used to obtain crude real oil prices from nominal oil prices, which can be obtained from the U.S. Bureau of Labor Statistics. In addition, the global crude oil production is in millions of barrels pumped per day (averaged by month) and the data are available from U.S. Energy Information Administration. According to the comparison of Funashima [47], which indicated that real shipping costs lead world industrial production, the Kilian economic index [46] is selected as a proxy of global economic activities. The Kilian economic index was developed based on the cost of shipping and the data can be obtained from the Federal Reserve Bank of Dallas (Available online: https://www.dallasfed.org/research/igrea (accessed on 9 October 2021)). Considering the availability of data, we used monthly data spanning February 2011 to June 2021.
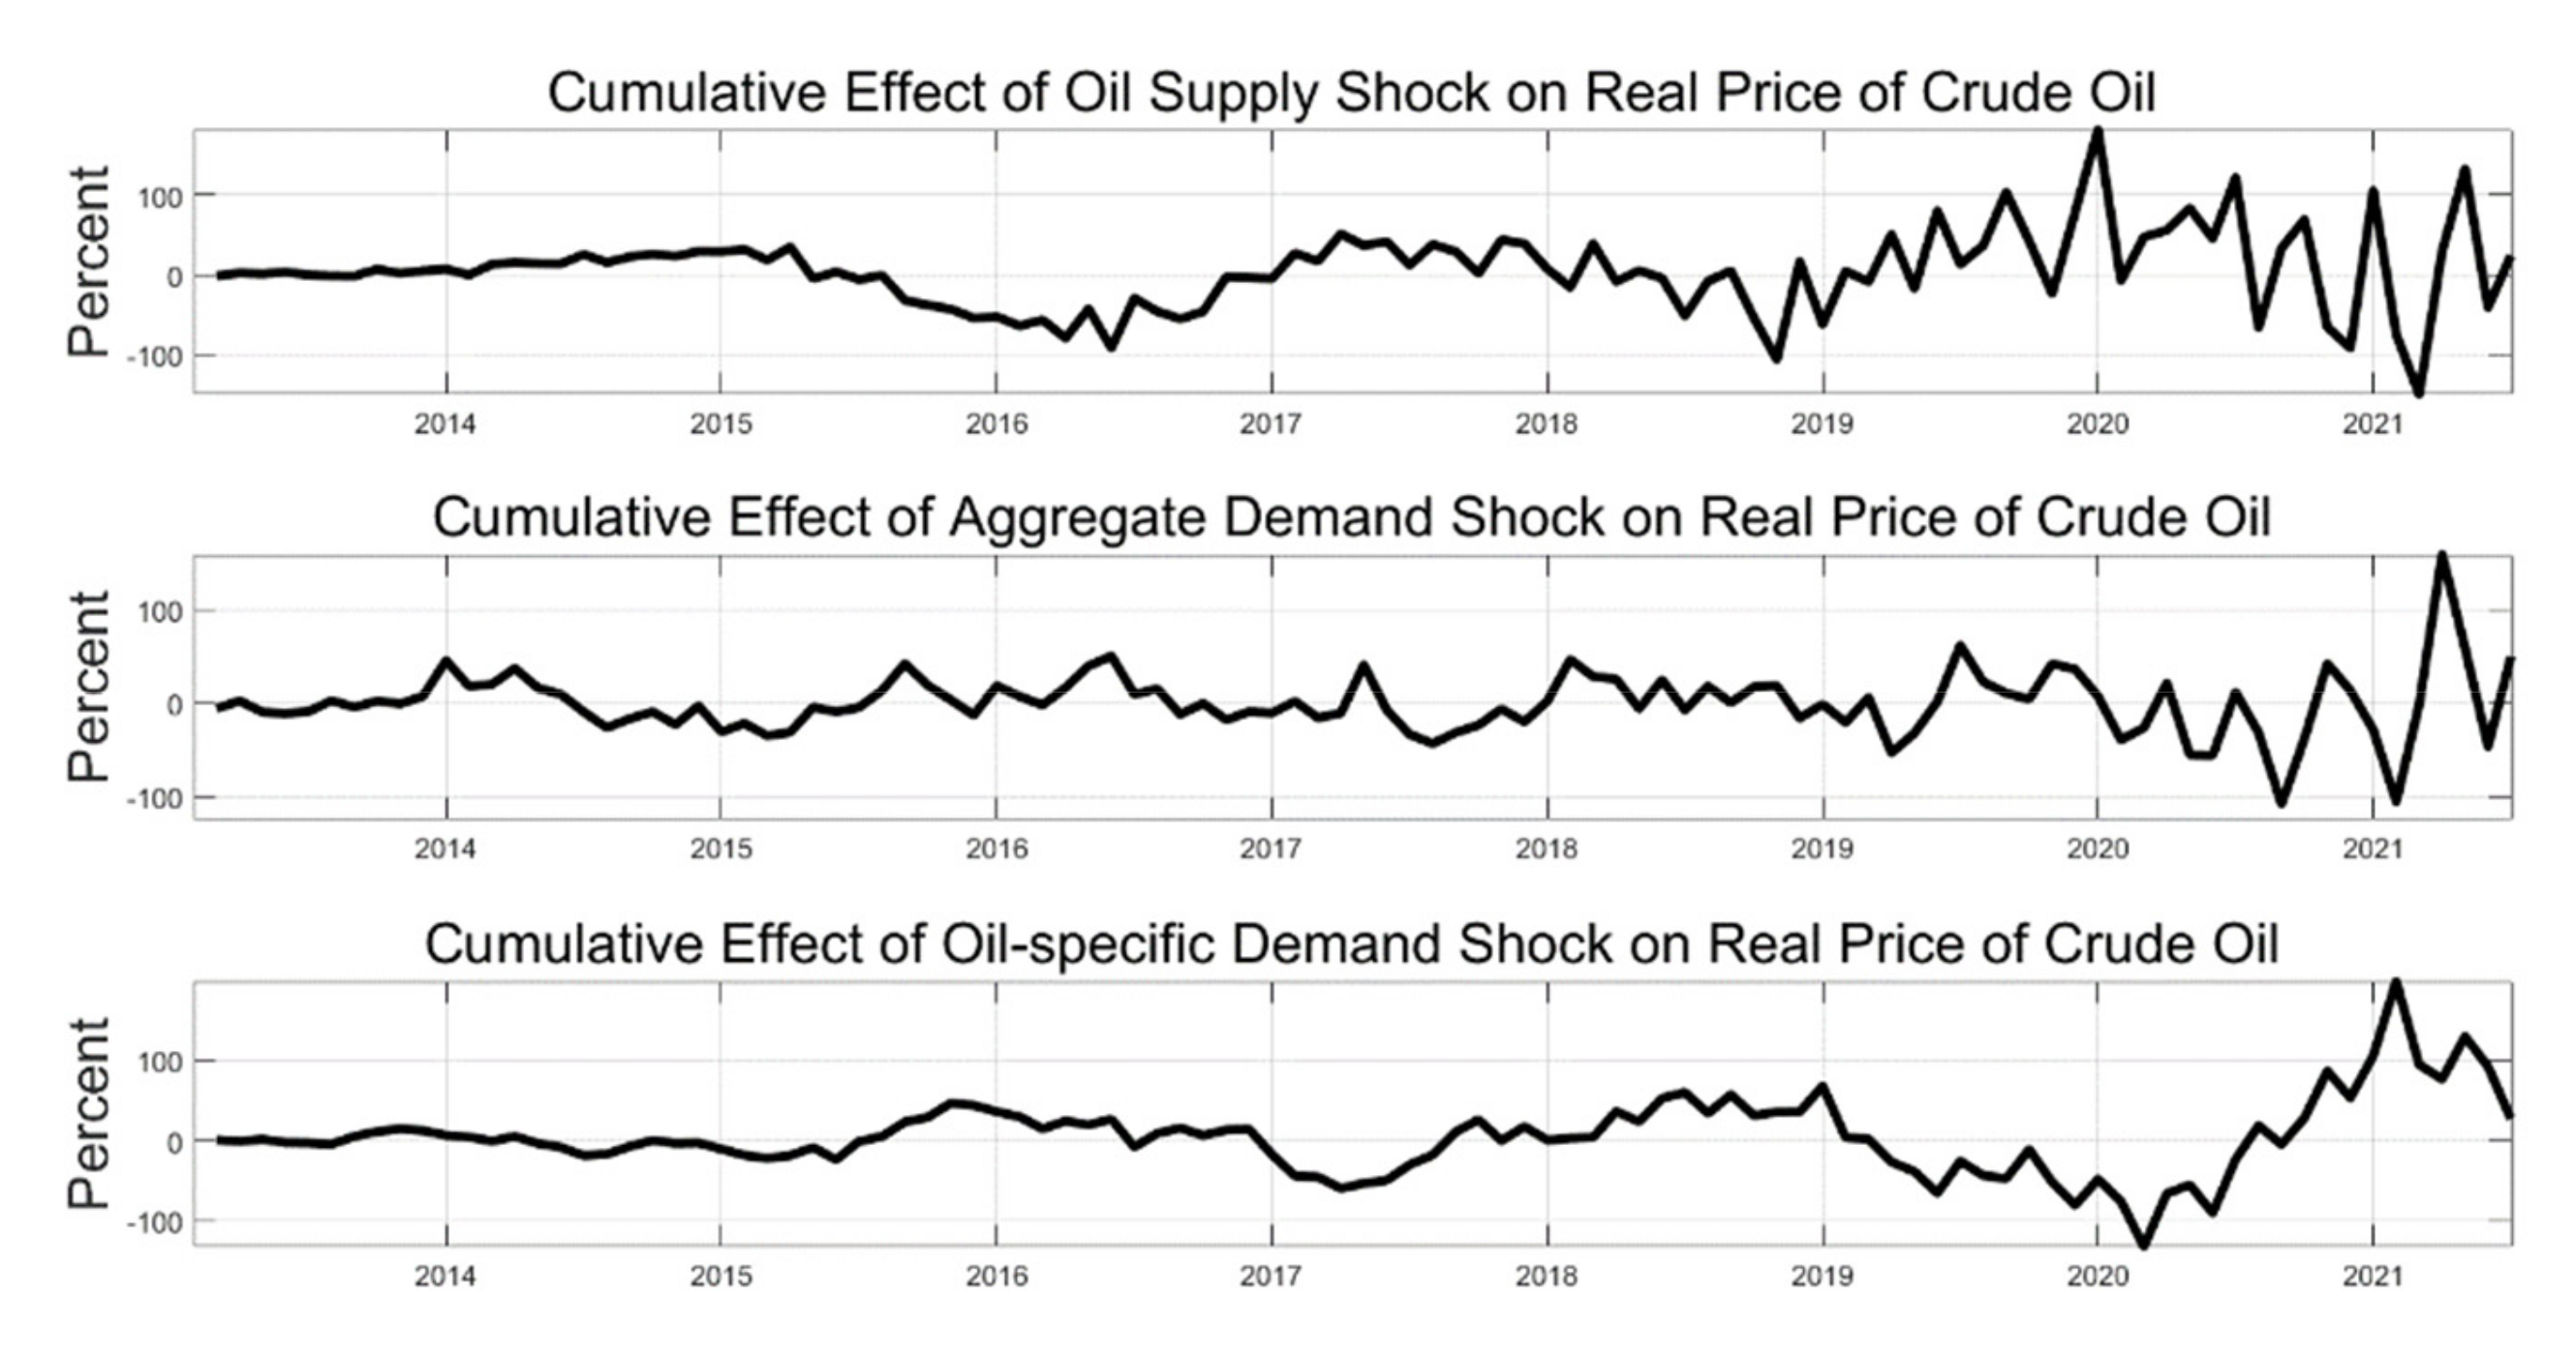
The cumulative effects of three oil price shocks on real crude oil price obtained from the SVAR model are presented in Figure 1.
The cumulative impacts of three oil price shocks on oil prices are heterogeneous. Figure 1 plots the cumulative impacts of oil supply shocks, aggregate demand shocks, and oil-specific demand shocks on crude oil prices over the period from February 2013 to June 2021. Clearly evident in the figure is the fact that the trends of cumulative effects of three crude oil price shocks on real crude oil price are heterogeneous. First, from the first panel of Figure 1, we can realize that the cumulative impacts of oil supply shocks on crude oil prices can be divided into three phases. The cumulative effects of oil supply shocks are positive and minorly increased from February 2013 to March 2015. After that, the cumulative effects gradually decreased and turn negative until March 2016. Thereafter, the cumulative effects of oil supply shocks are increased and fluctuated dramatically. The reason may be that due to the COVID-19 pandemic, the drops in supply results in crude oil prices volatility [48]. Second, as can be seen from the second panel of Figure 1, the cumulative effects of aggregate demand shocks on crude oil prices are fluctuant. Before February 2019, the cumulative effects fluctuated moderately, while the cumulative effects of aggregate demand shocks fluctuated dramatically after February 2019. Third, as shown in the third panel of Figure 1, the cumulative effects of oil-specific demand shocks on real crude oil price can be divided into three phases. Before September 2015, the cumulative effects are maintained at a comparatively low level. The cumulative effects showed two periods of decline, from 2015 to 2017, and from 2019 to 2020. Since 2020, the cumulative effects fluctuate substantially and keep rising. Perhaps not surprisingly, there are heterogeneous cumulative effects of three various crude oil price shocks on oil prices due to various meanings of crude oil shocks. To sum up, the cumulative effects of three various crude oil price shocks on crude oil prices are heterogeneous.
2.2.2. Investor Sentiment
Existing investor sentiment measurement methods are classified into three categories: survey method, market variable method, and text analysis method [49]. First, the survey method collects individuals’ views and attitudes on the current or future economic conditions and the trend of the financial market through telephone, email and other questionnaires [50]. Then, investigators aggregated these questionnaire results into an investor sentiment index. Second, a market variable method based on some subjective and objective basic indicators, such as trading volume, the dividend premium, the closed-end fund discount, and so on, are widely used to construct investor sentiment [51,52]. Third, investor sentiment, based on text data, also arouse wide attention [53], for example Google trends and Baidu index [54,55].
Inevitably, there are some drawbacks to these methods. Although the survey method directly measures investor sentiment, its implementation cost is high, the frequency of constructing sentiment index is low, the time span is short, and is also susceptible to subjective factors. Considered comprehensively with various market variables, a market variable method is more objective. However, the indicators relying on market data are likely to be the combined result of many economic factors, rather than actual investor sentiment. In addition, key variables may be omitted in the process of selecting basic indicators, which affect the completeness of the measurement.
Differently from the above traditional investor sentiment indicators, investor sentiment constructed on textual analysis method and web crawler has significant advantages. First, compared with large-scale manual survey data, data mining is more rapid and accurate to obtain online text information, which is more efficient. Secondly, open social platforms truly restore investors’ thoughts and opinions, freeing information transmission from constraints, such as time and region, and updating opinions at any time. Therefore, we attempt to exploit textual analysis method and web crawler to construct investor sentiment in this paper.
In this paper, the Baidu trend was selected to investigate the trend of Chinese investor sentiment. At present, the most widely used network search data are Google search data. However, the most widely used search engine is Baidu in China because of the Internet restrictions and habits. Therefore, the Baidu search index is more in line with the actual investor sentiment in China. According to the search volume of Internet users in Baidu, Baidu Index takes keywords as the statistical object, and it analyzes and calculates the weighted sum of search frequency of each keyword in Baidu web search. Therefore, using Baidu index to construct China’s investor sentiment index is appropriate.
Three steps are needed when constructing an investor sentiment index based on textual analysis method. The first step is selecting Chinese keywords, which can accurately and comprehensively reflect the Chinese investor sentiment. On the one hand, Chinese keywords are required to have a high correlation with the stock market. On the other hand, the keywords need to be kept for a period of time and rich in change to realize the dynamic monitoring of the stock market. According to these requirements, we select 50 Chinese keywords (including 25 positive sentiment keywords and 25 negative sentiment keywords) related to investor sentiment in the stock market from a Chinese sentiment dictionary for finance. The keywords of the Baidu index in translation are presented in Appendix A Table A1.
The second step is to analyze word frequency of related keywords. In view of Baidu in China, the search engine market holds the absolute advantage; this paper intends to use the Baidu index data of each keyword as the index of the number of searches of each keyword. According to the list of keywords, input each keyword into the Baidu index and extract the daily time series data of the search volume of each keyword. Because the Baidu index does not provide the downloading function of search data, this paper obtains the daily time series data of keywords in batches based on the crawler program.
Finally, we construct an investor sentiment index. The keyword search volumes serve as the score of investor sentiment. The daily scores are added to get the monthly scores of investor sentiment. Then to get the final monthly investor sentiment index, we divide the monthly total positive sentiment scores by the monthly total negative sentiment scores and subtract 1. The final monthly investor sentiment index based on text data (IS) at t month can be expressed as follows.
where denotes the total positive sentiment at t month, refers to the total negative sentiment score at t month. greater than 0 indicates that positive sentiment is higher than negative sentiment at t month, while less than 0 indicates that negative sentiment is higher than positive sentiment at t month.
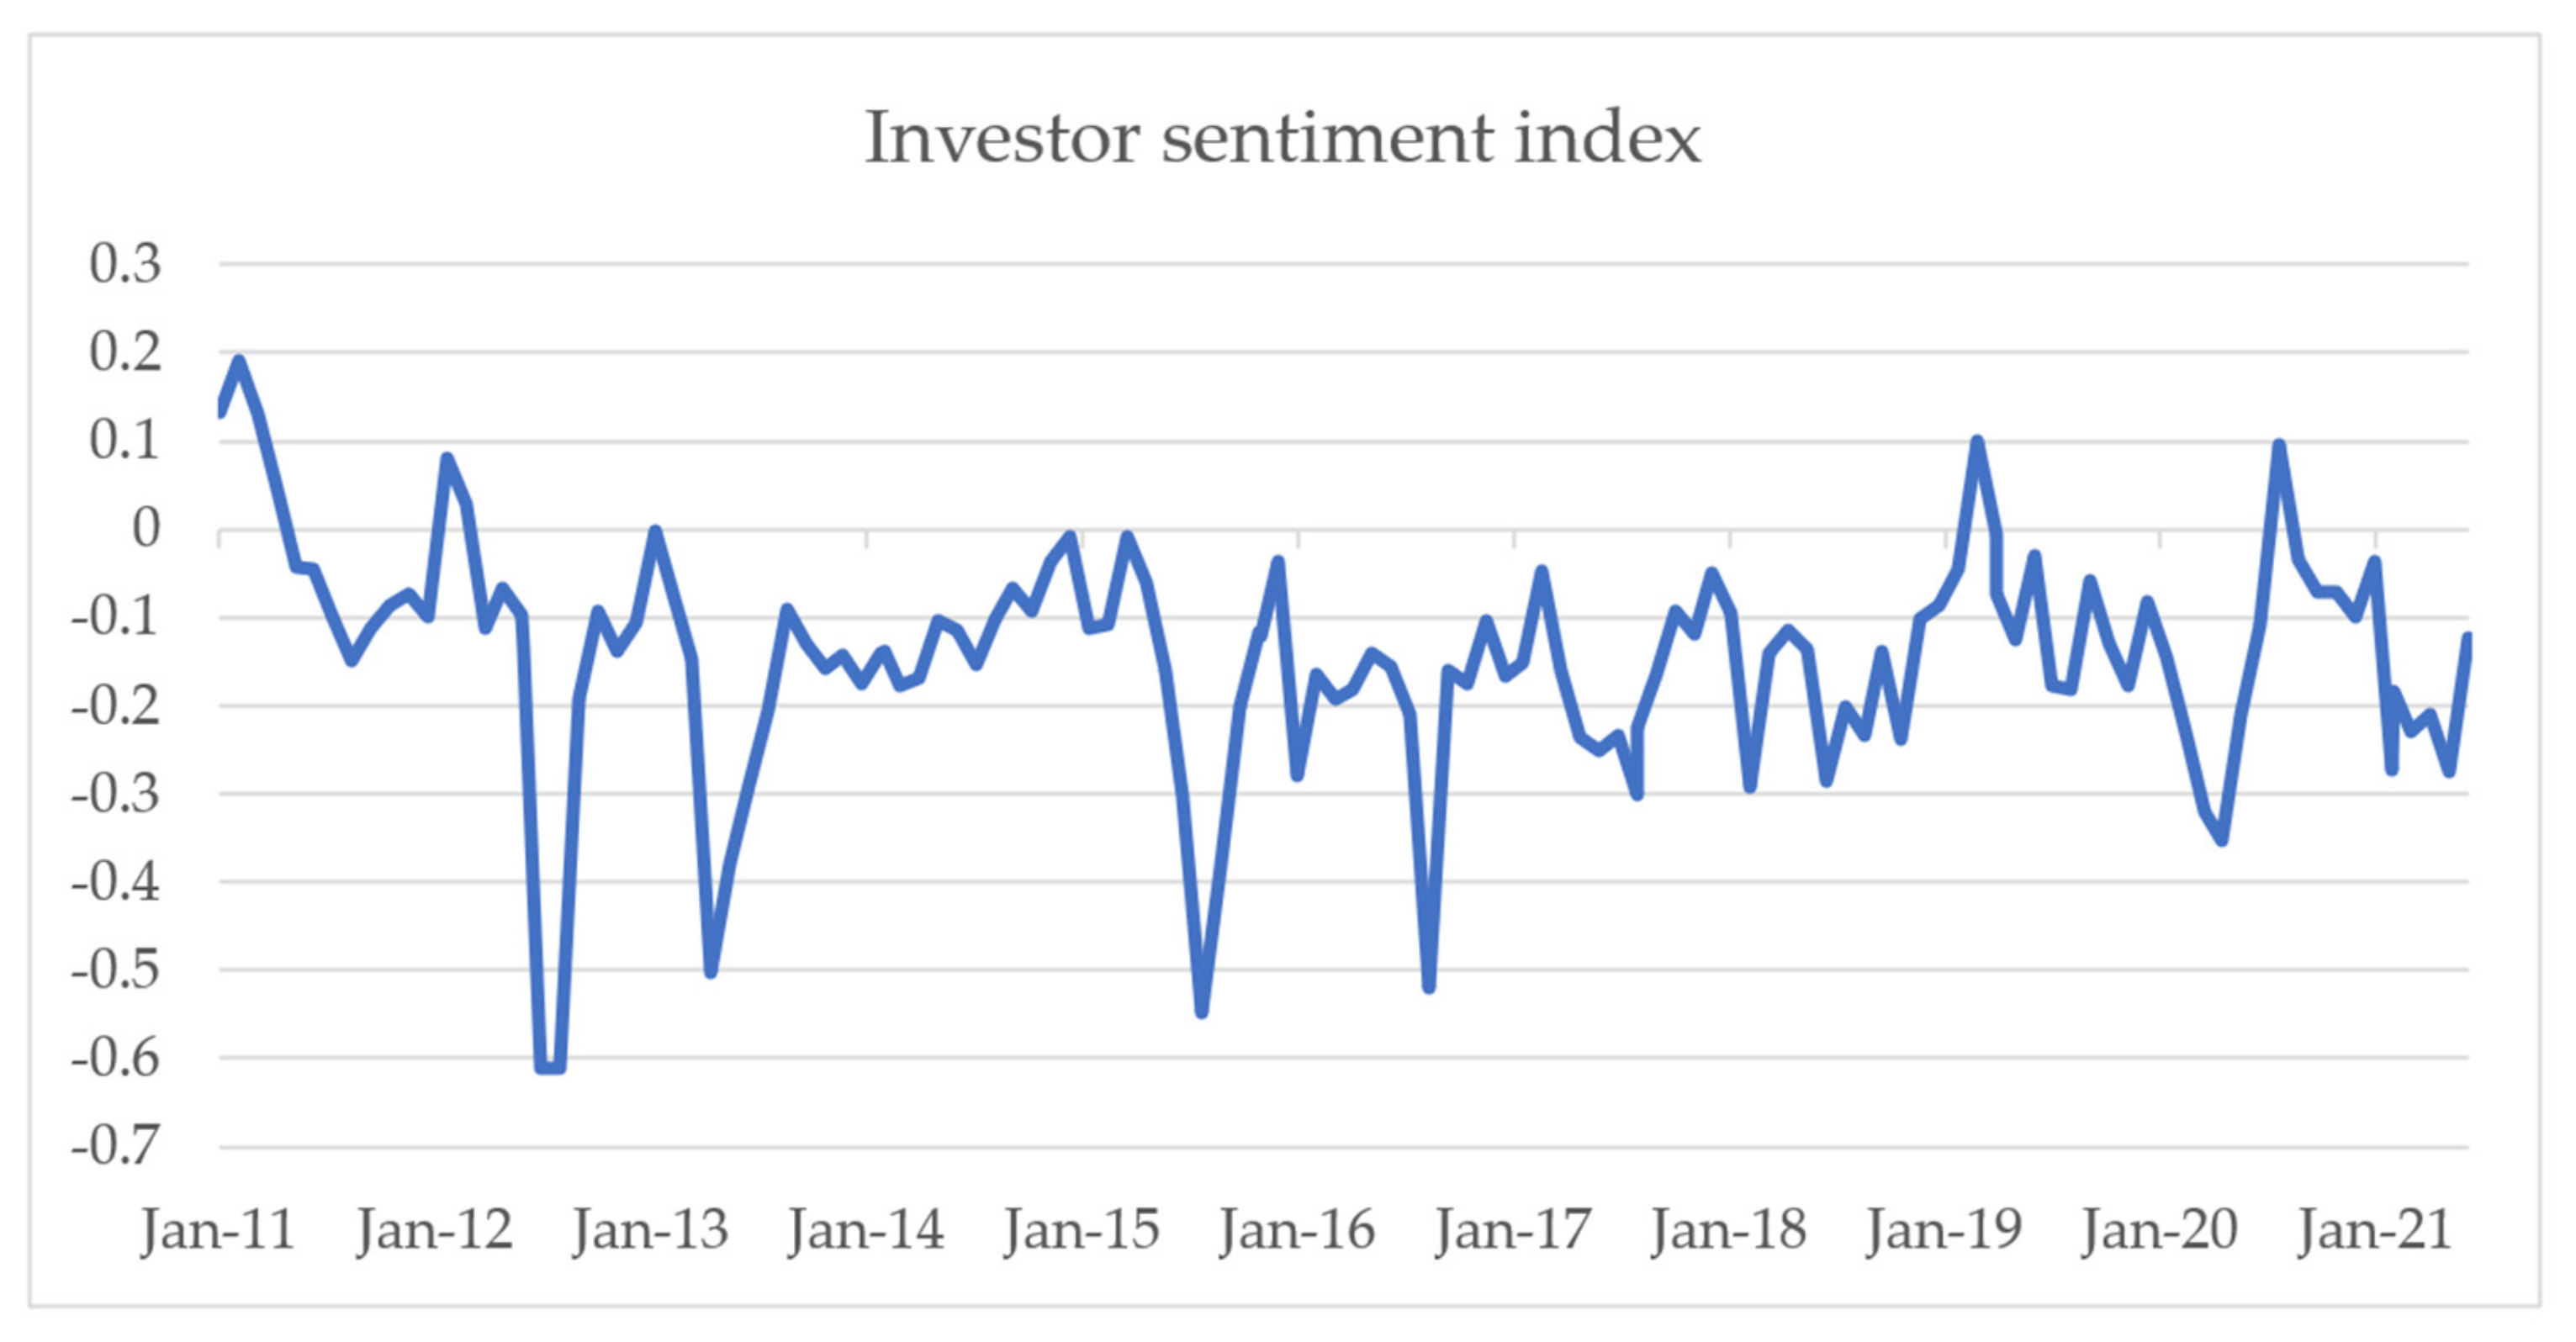
The data come from the Baidu index official website, which span from January 2011 to June 2021. The investor sentiment index constructed by text analysis method and web crawler is presented in Figure 2.
Investor sentiment fluctuates wildly between January 2011 and June 2021. Figure 2 demonstrate the trends of investor sentiment from January 2011 to June 2021. From the trends of investor sentiment, we can know that investor sentiment is volatile, which illustrate that investor sentiment can be an effective response to external shocks. First, most of investor sentiment index are less than zero, which reveal that the investor sentiment is negative for most of the period from February 2011 to June 2021. Second, with the occurrence of special events, investor sentiment fluctuates violently. For instance, from May 2012 to August 2012, investor sentiment turned sharply negative and then negative sentiment turned small until March 2013. In addition, the stock market crash in China began on 15 June 2015, leading to a sharp downturn in investor sentiment in July 2015. Moreover, in August 2016, the establishment of Xiongan New Area in China and the strong rise of Chinese manufacturing restored investors’ confidence in the stock market, and investor sentiment rose. Furthermore, in 2020, the outbreak of COVID-19 cast a shadow over China’s economy and the world economy. Many uncertainties brought about by this cast a shadow over the stock market, which led to a sharp decline in investor sentiment. Additionally, investor sentiment also fluctuates substantially at several periods, such as April 2013, May 2017, February 2018, February 2019, January 2021, and so on.
3. Heterogeneous Dynamic Correlation between Crude Oil Prices and Investor Sentiment
In this section, we provide the heterogeneous dynamic correlation between crude oil prices (shocks) and investor sentiment. First, we conduct a WTC analysis and the phase difference method to test the co-movement and lead-lag relationships between crude oil prices and investor sentiment over the time and frequency domains simultaneously in Section 3.1. Then, in Section 3.2, we further investigate the heterogeneous dynamic correlation between various crude oil prices shocks and investor sentiment by decomposing the crude oil prices shocks into crude oil supply shocks, aggregate demand shocks, and oil-specific demand shocks.
3.1. Crude Oil Prices and Investor Sentiment
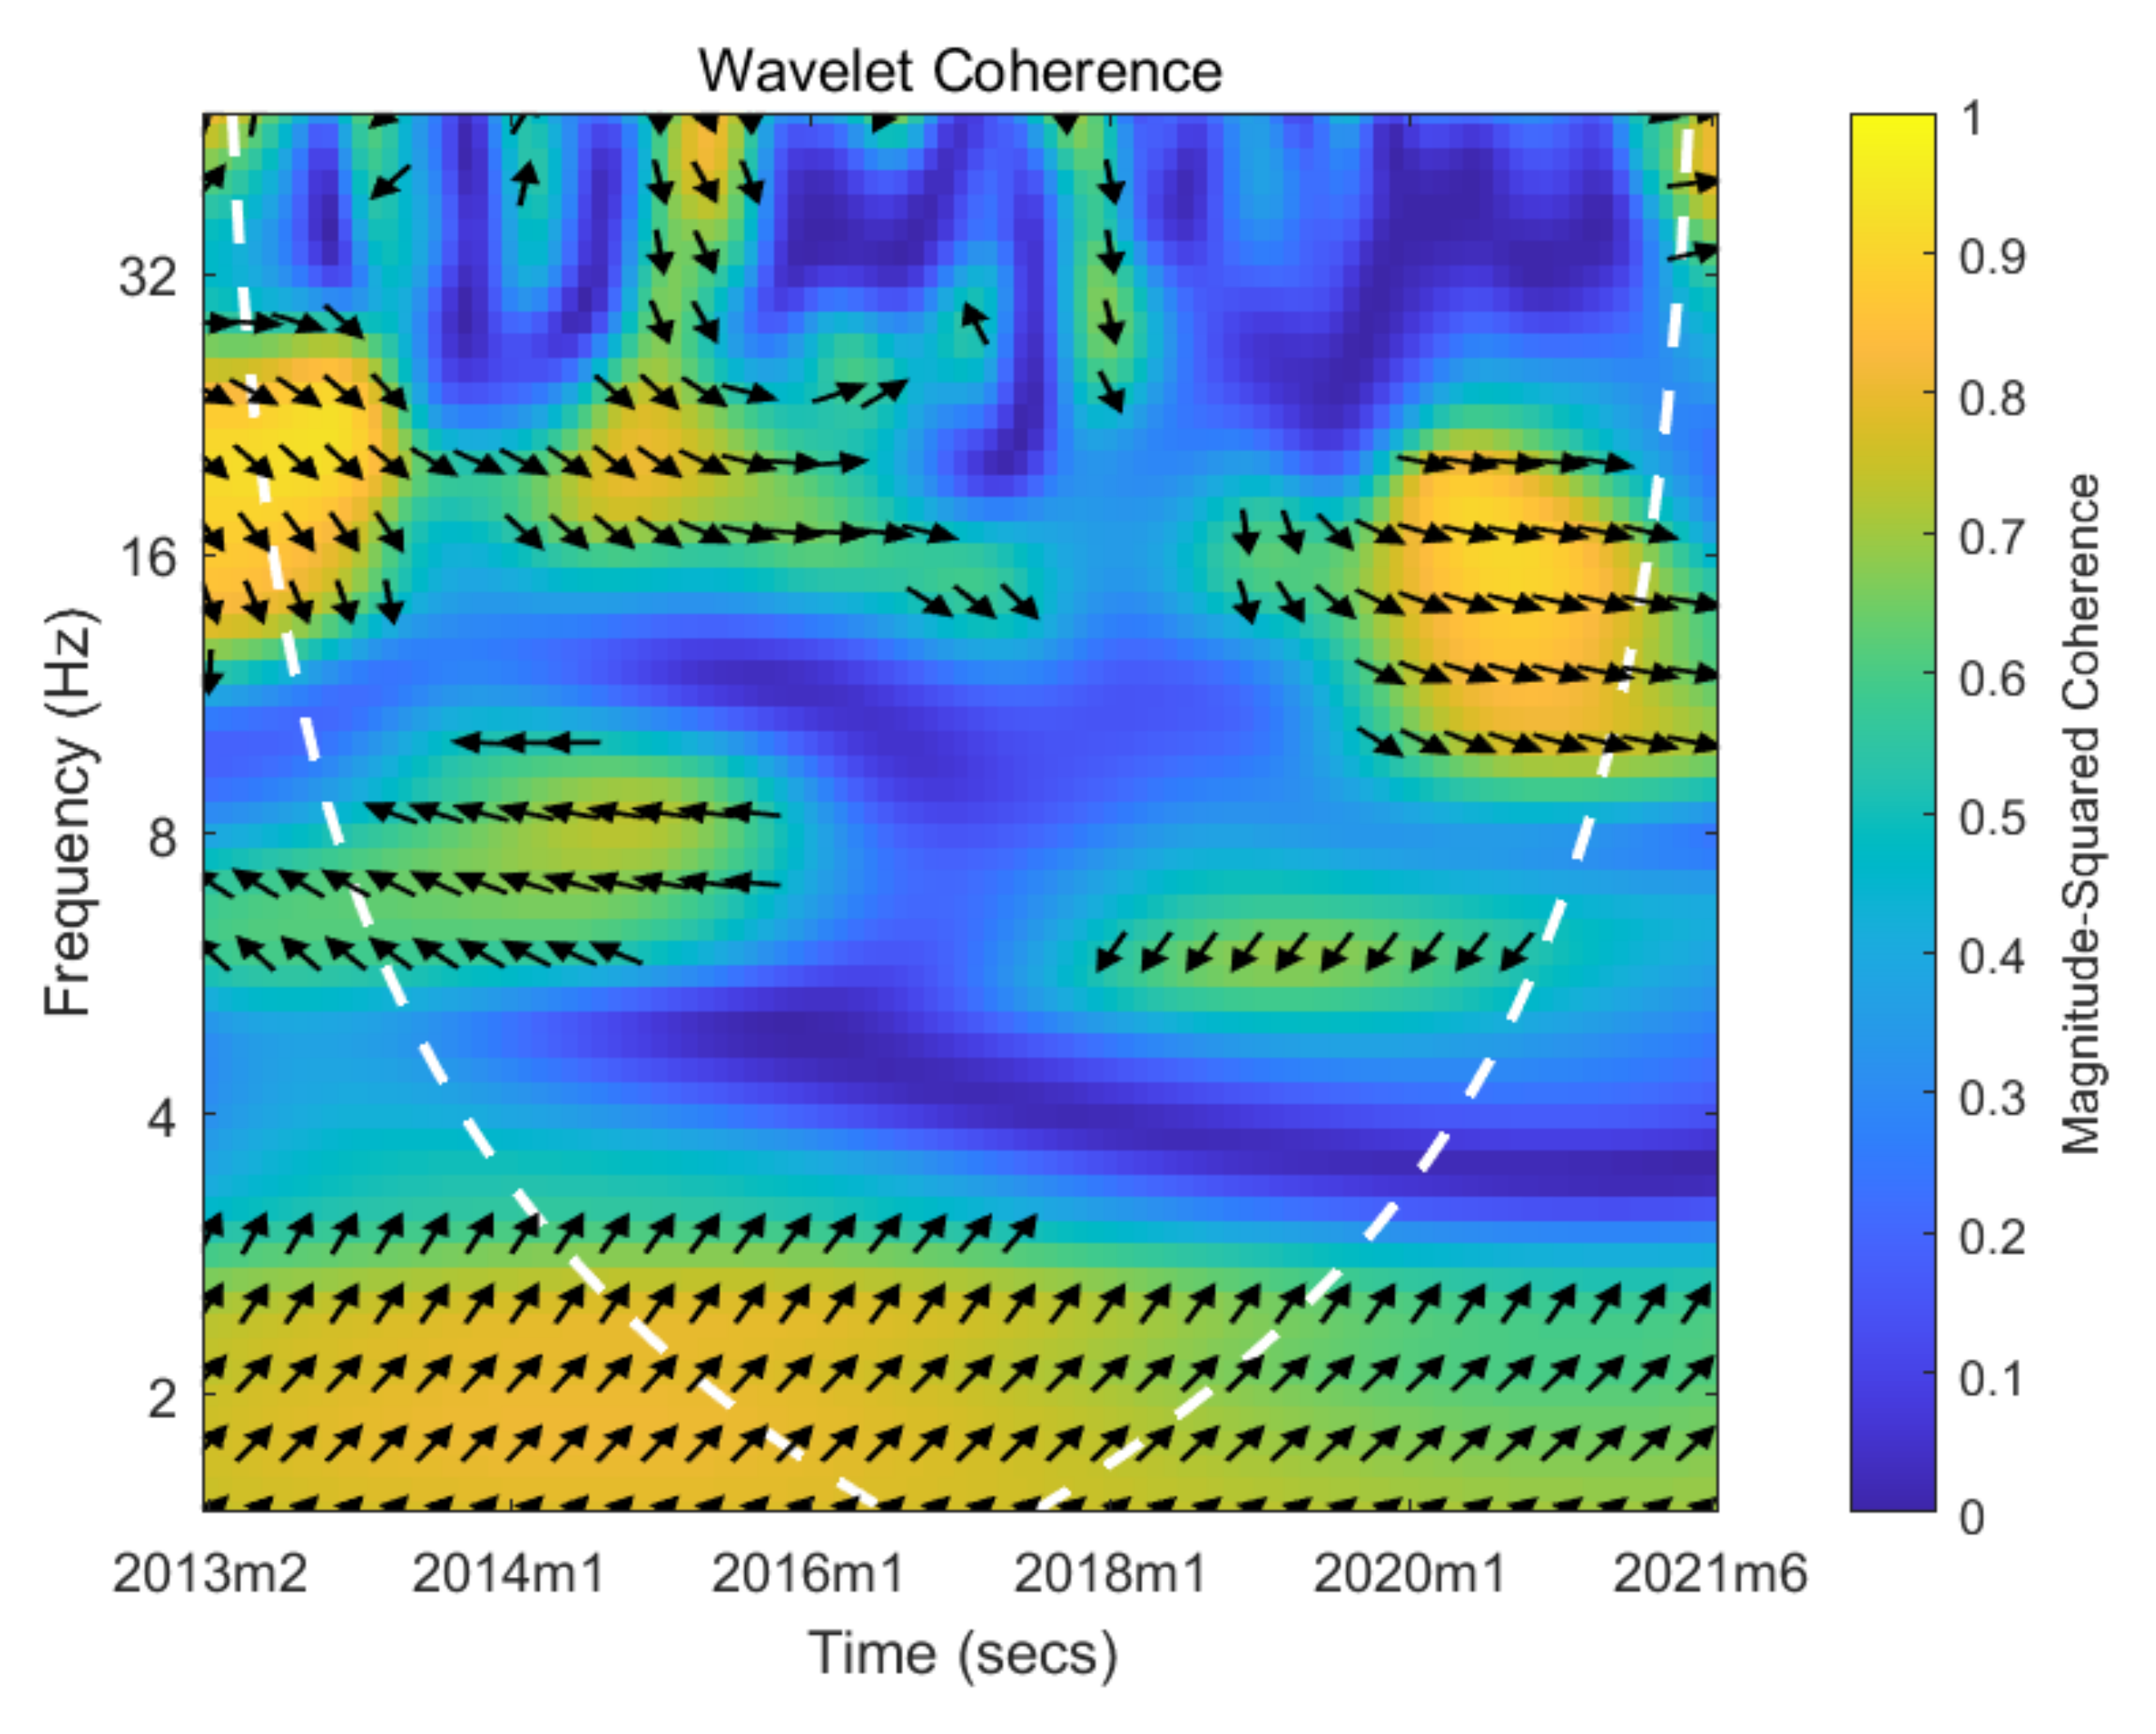
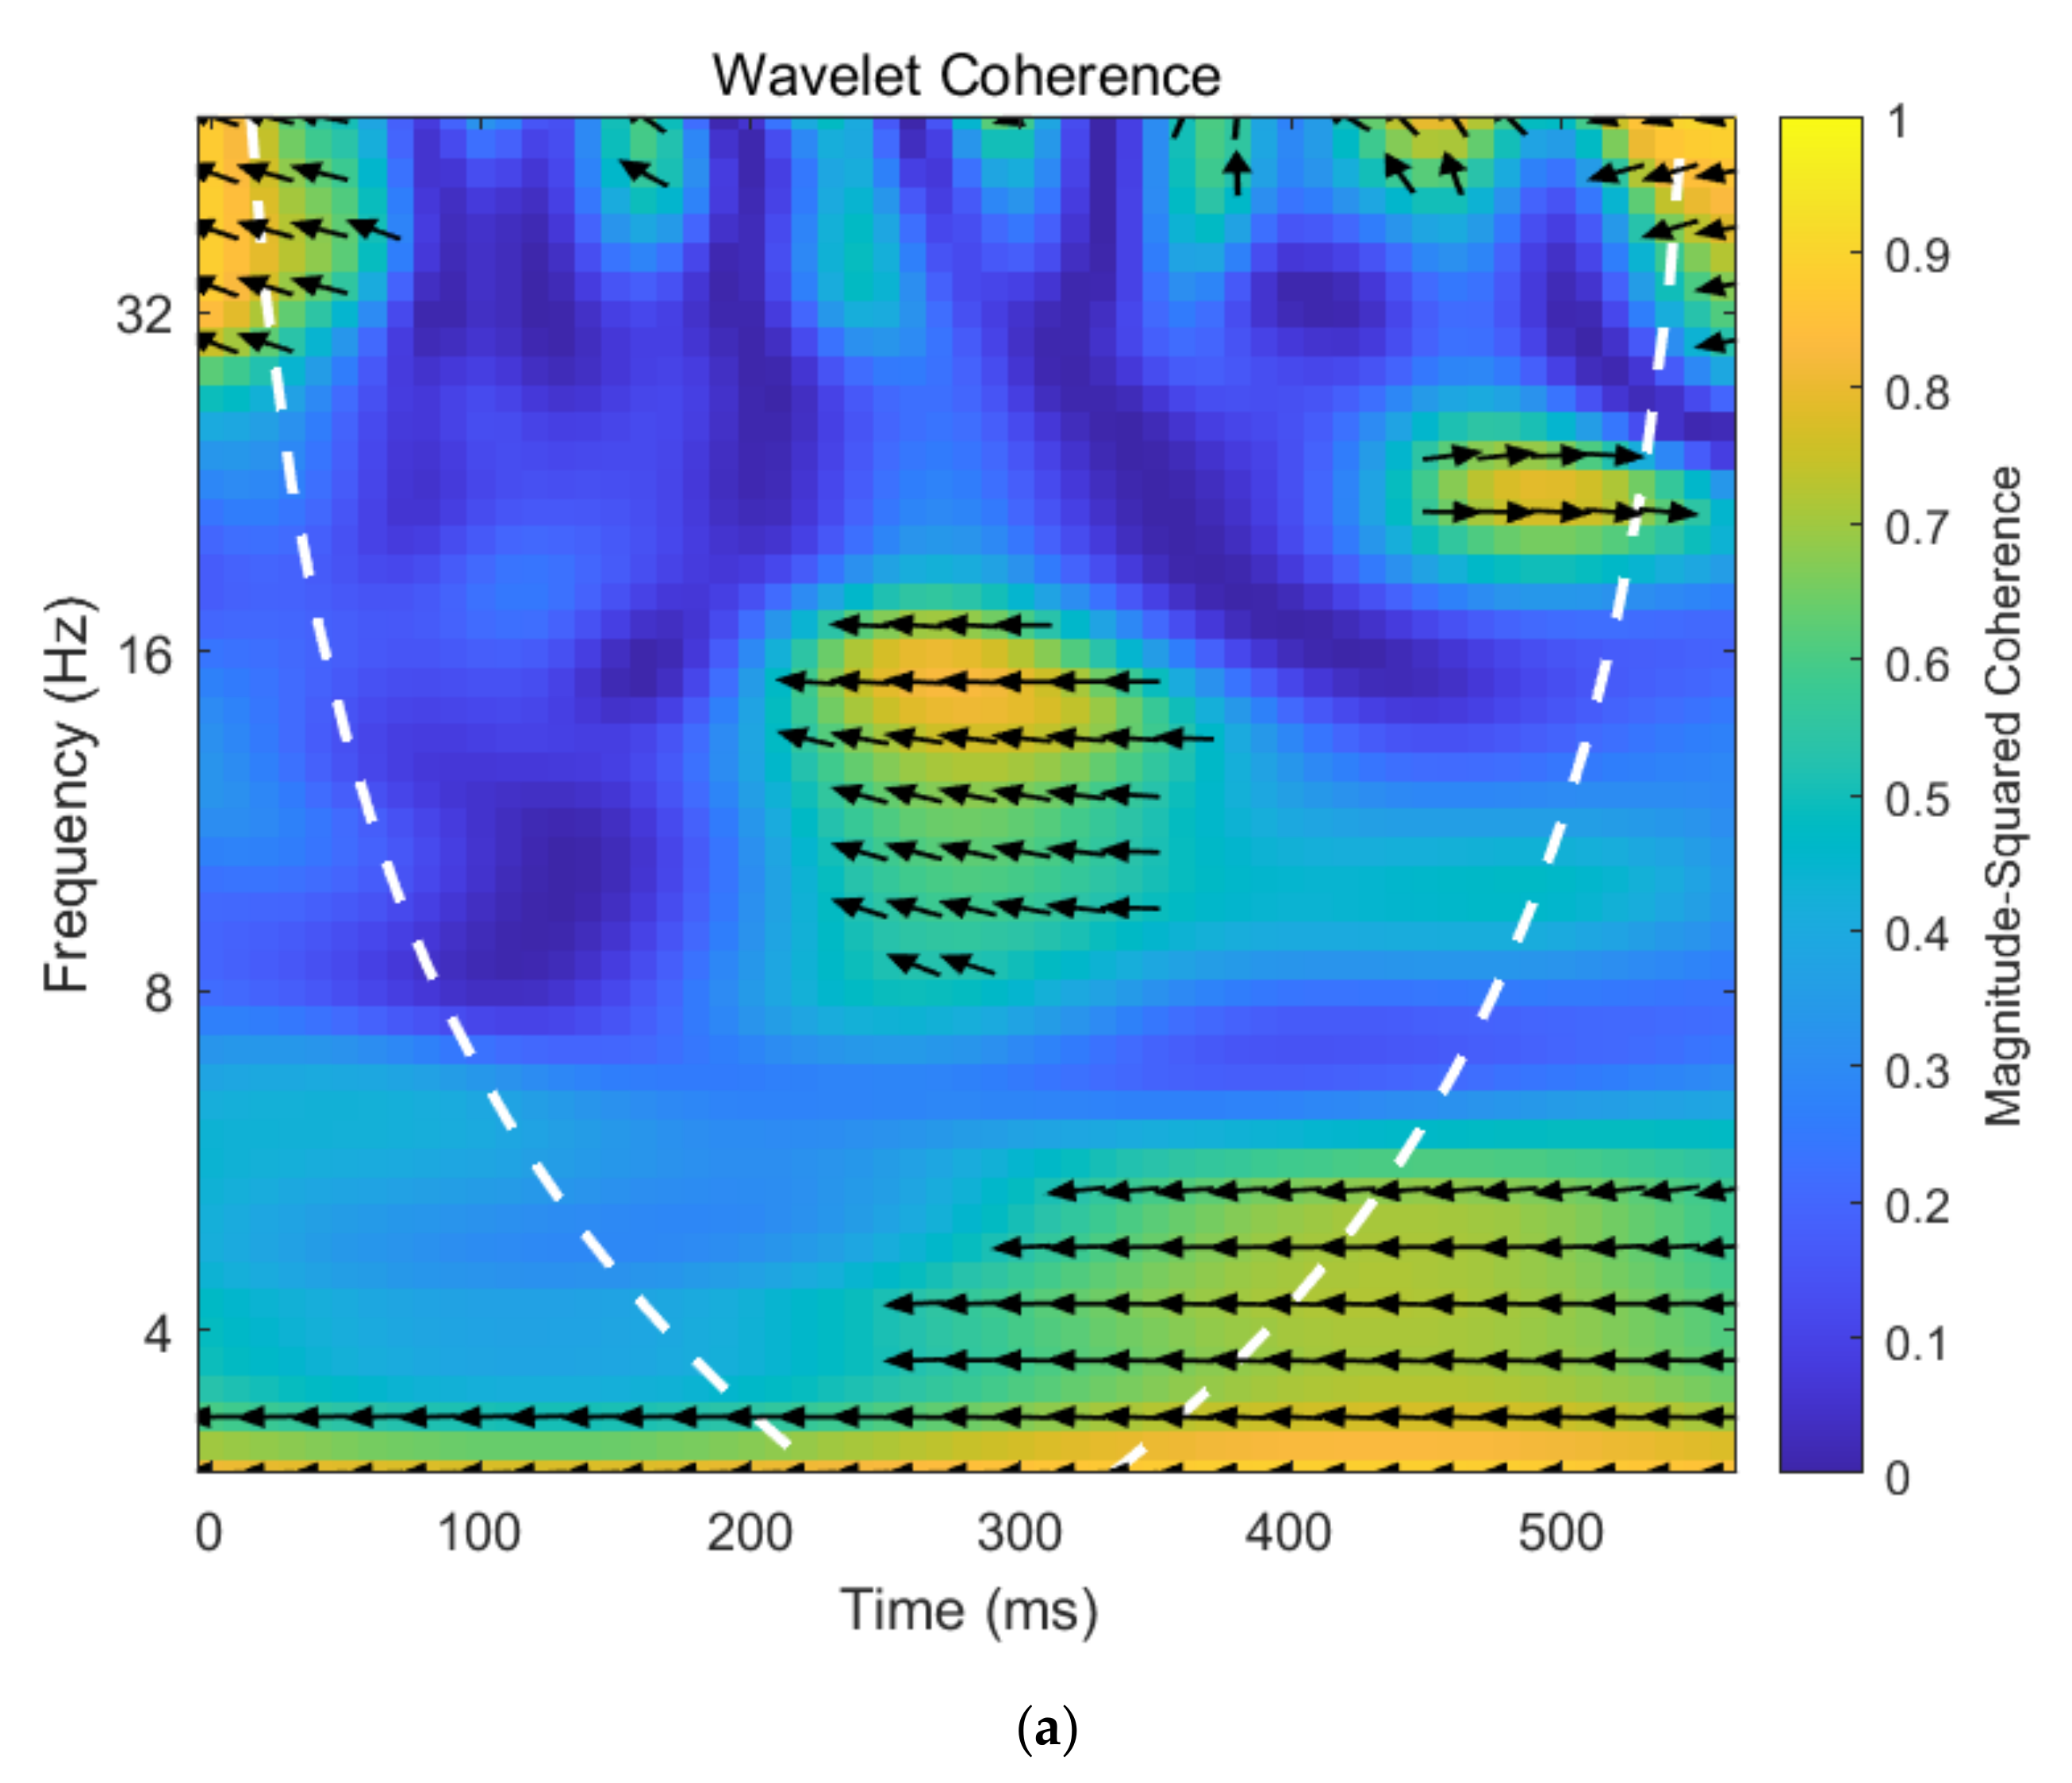
The WTC analysis and the phase difference method are employed to conduct the co-movement and lead–lag relationships between crude oil prices and investor sentiment. Figure 3 presents the wavelet coherency map of crude oil prices and investor sentiment.
Crude oil prices are positively correlated with investor sentiment. Figure 3 intuitively shows the wavelet coherency map of crude oil prices and investor sentiment under various time and frequency domains. As can be seen from Figure 3, most of arrows pointing right indicate a positive relationship between crude oil prices and investor sentiment. This result provides a shred of evidence that with the increase in crude oil prices, investors’ expectations of current and future market conditions also increase. Changes in crude oil prices will release a signal of the market, which affect investors’ expectations of current and future market and their sentiment.
The lead–lag relationship between crude oil price and investor sentiment is heterogeneous at different frequencies. The direction of the arrow in the Figure 3 also can reveal the lead–lag relationship between crude oil prices and investor sentiment. When the arrow points to the upper left or lower right, indicating that the phase change in investor sentiment is ahead of crude oil prices. When the arrow points to the lower left or upper right, manifesting that the phase change in crude oil prices is ahead of investor sentiment. First, from Figure 3, the arrows at the bottom left mostly point to the upper right, which reveal that crude oil prices lead investor sentiment in the relatively low frequency during January 2011 to June 2016. Secondly, the large area in the middle of the Figure 3 indicates that the dynamic relationship of investor sentiment and crude oil prices is not significant at the middle frequency. Thirdly, the arrows at the upper of Figure 3 mostly point to the lower right, which indicates that investor sentiment lead crude oil prices in the relatively high frequency. Therefore, the lead–lag relationship between crude oil price and investor sentiment is heterogeneous at various frequencies.
3.2. Heterogeneous Dynamic Correlation
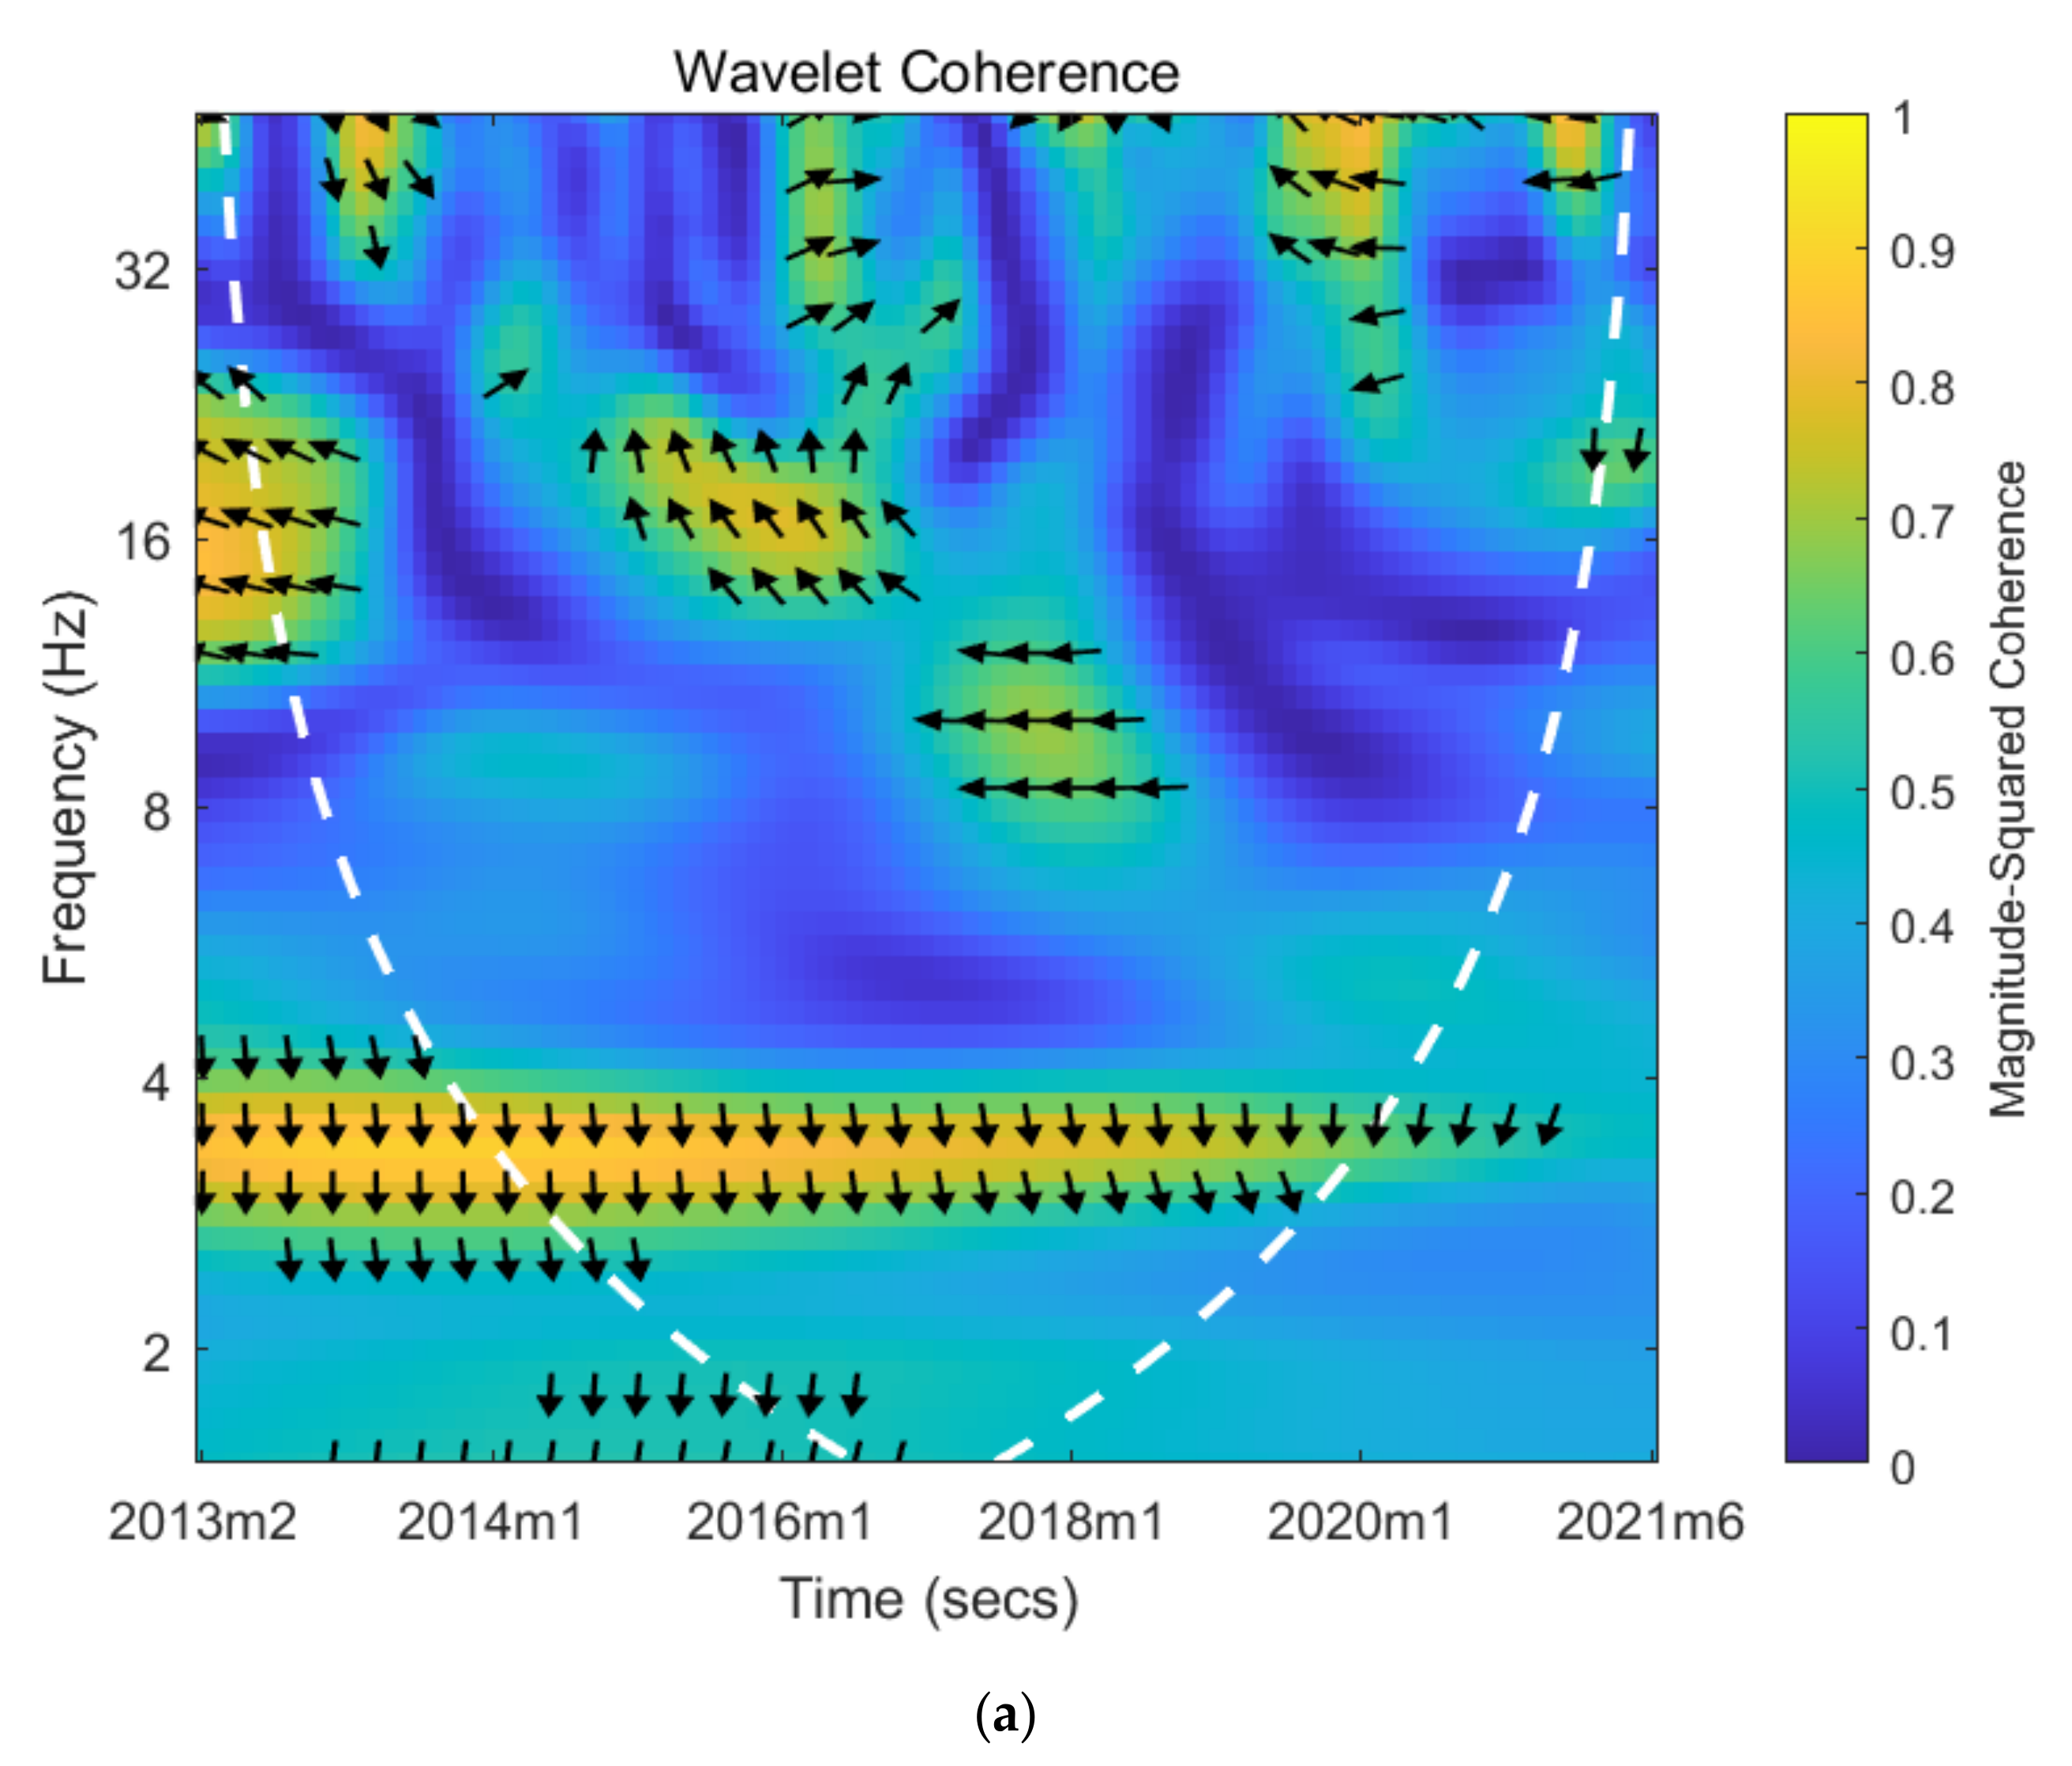
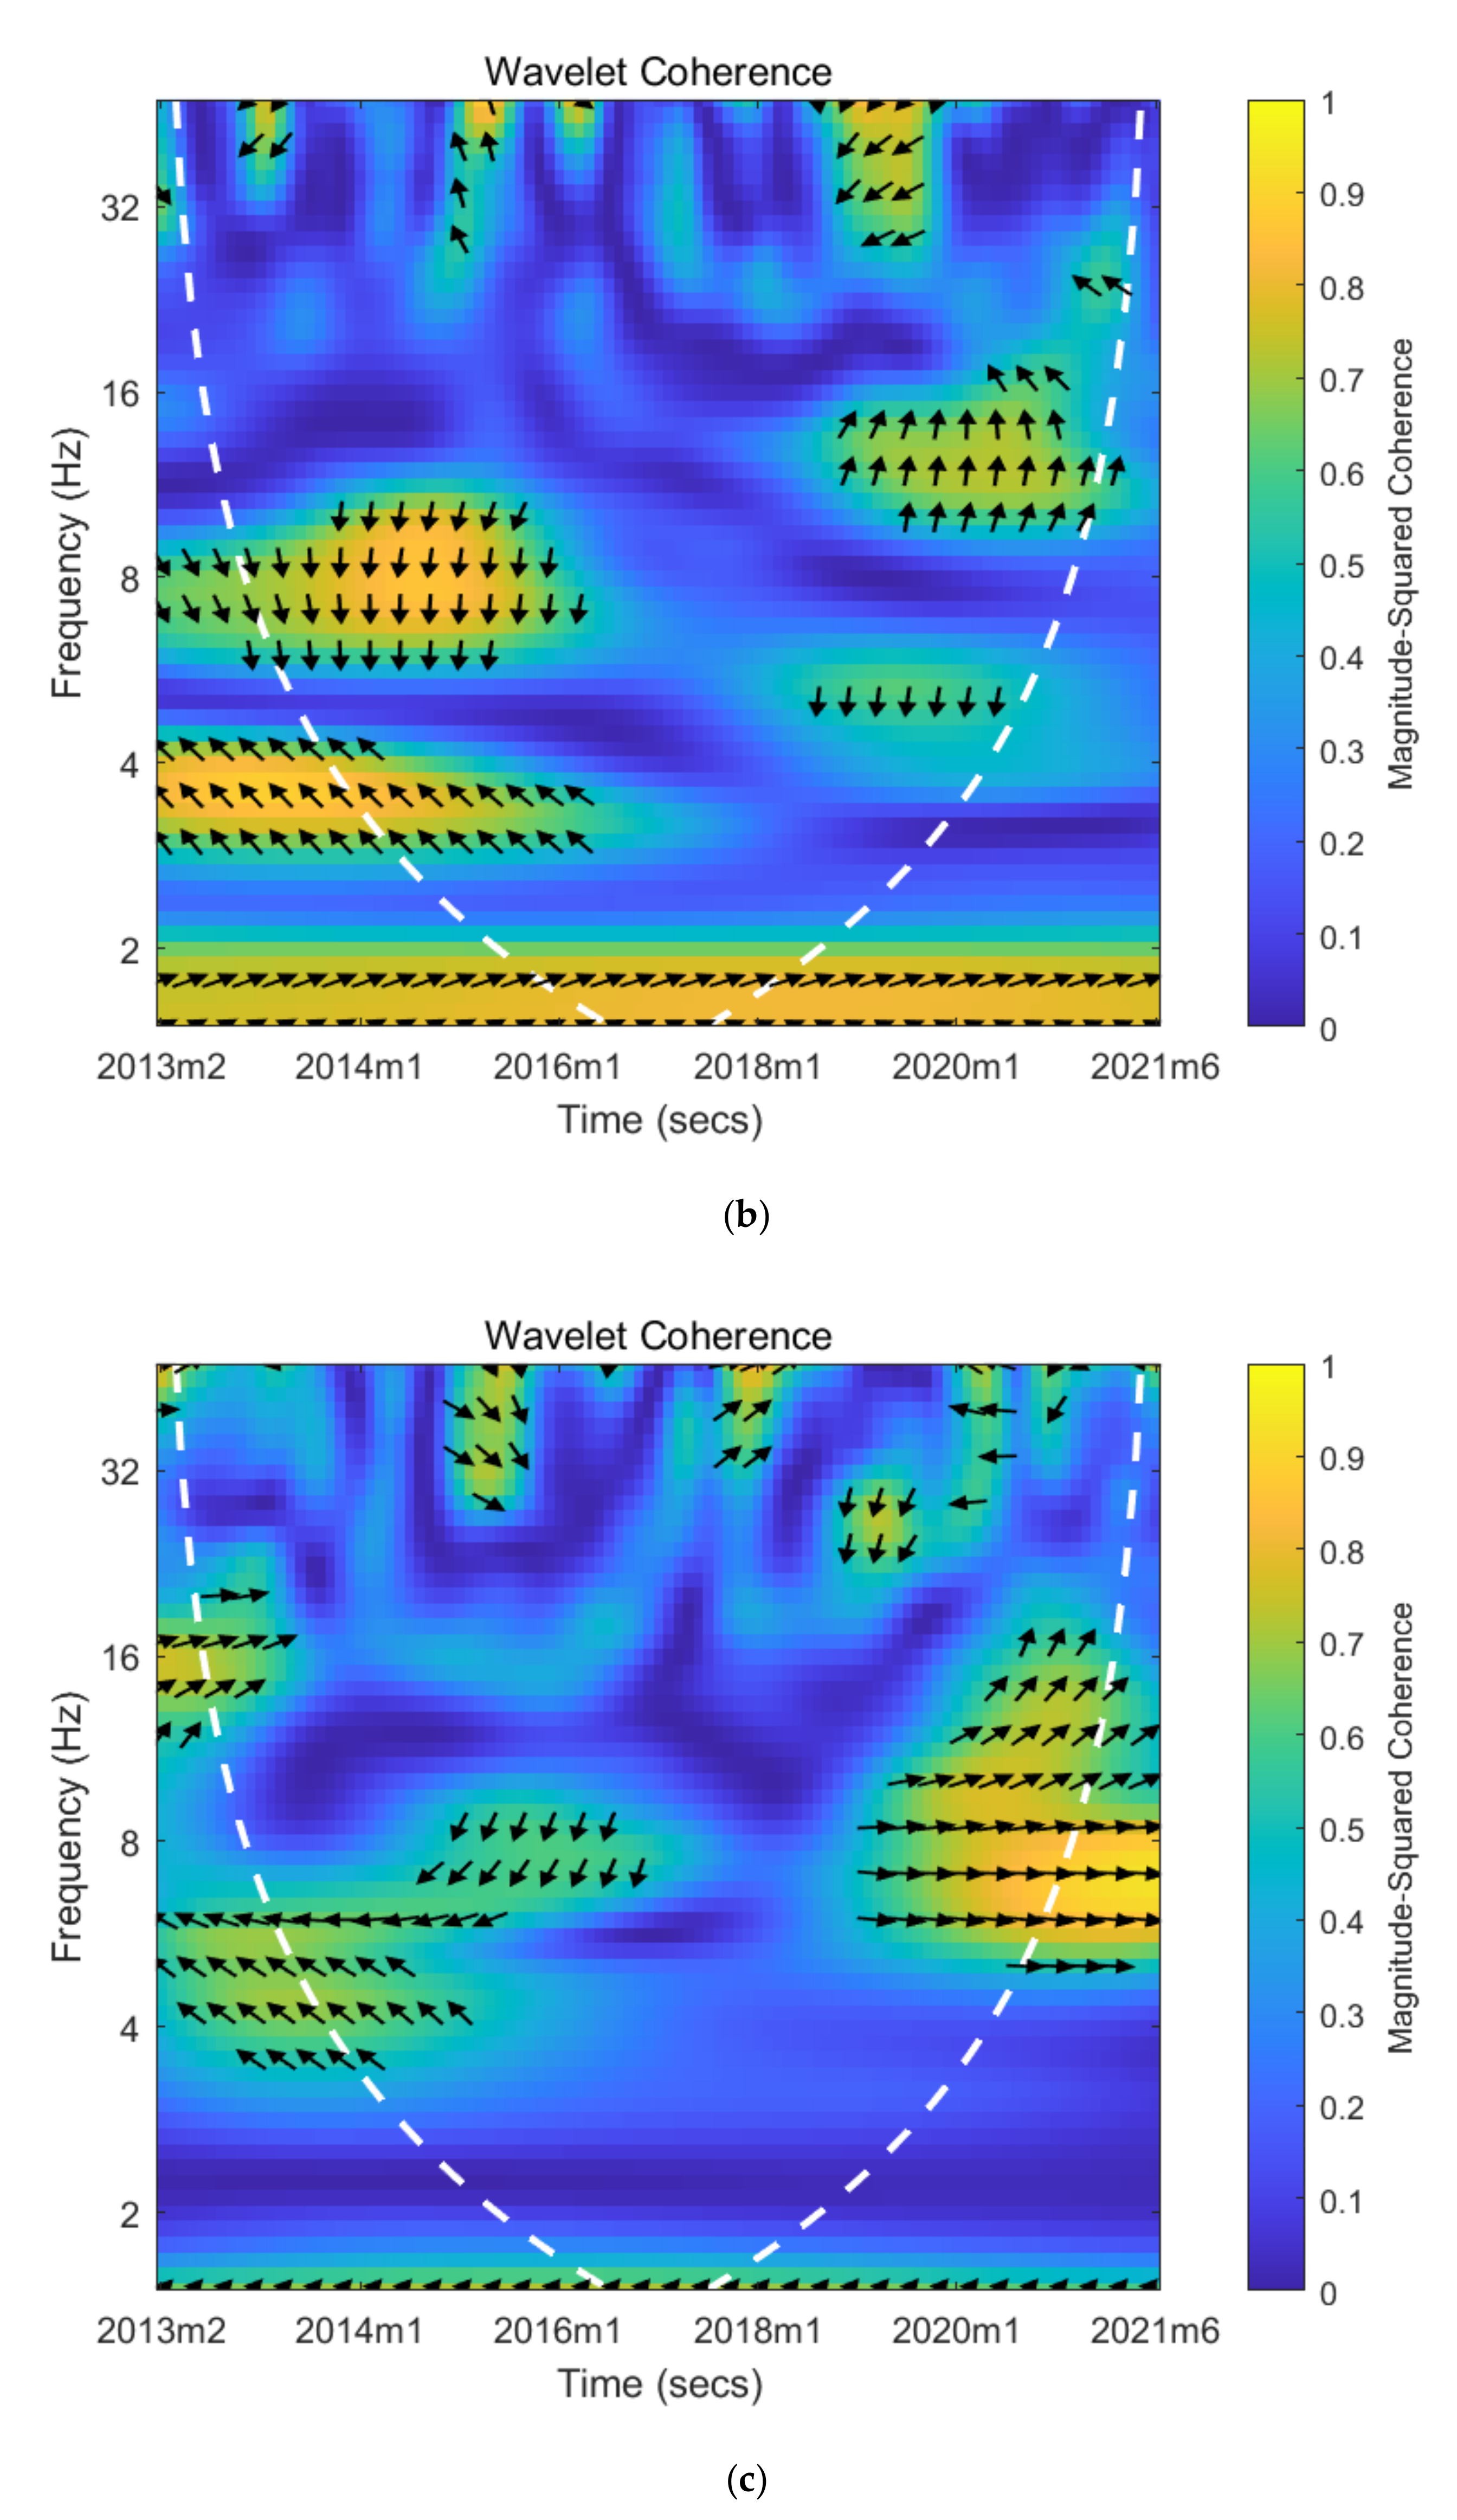
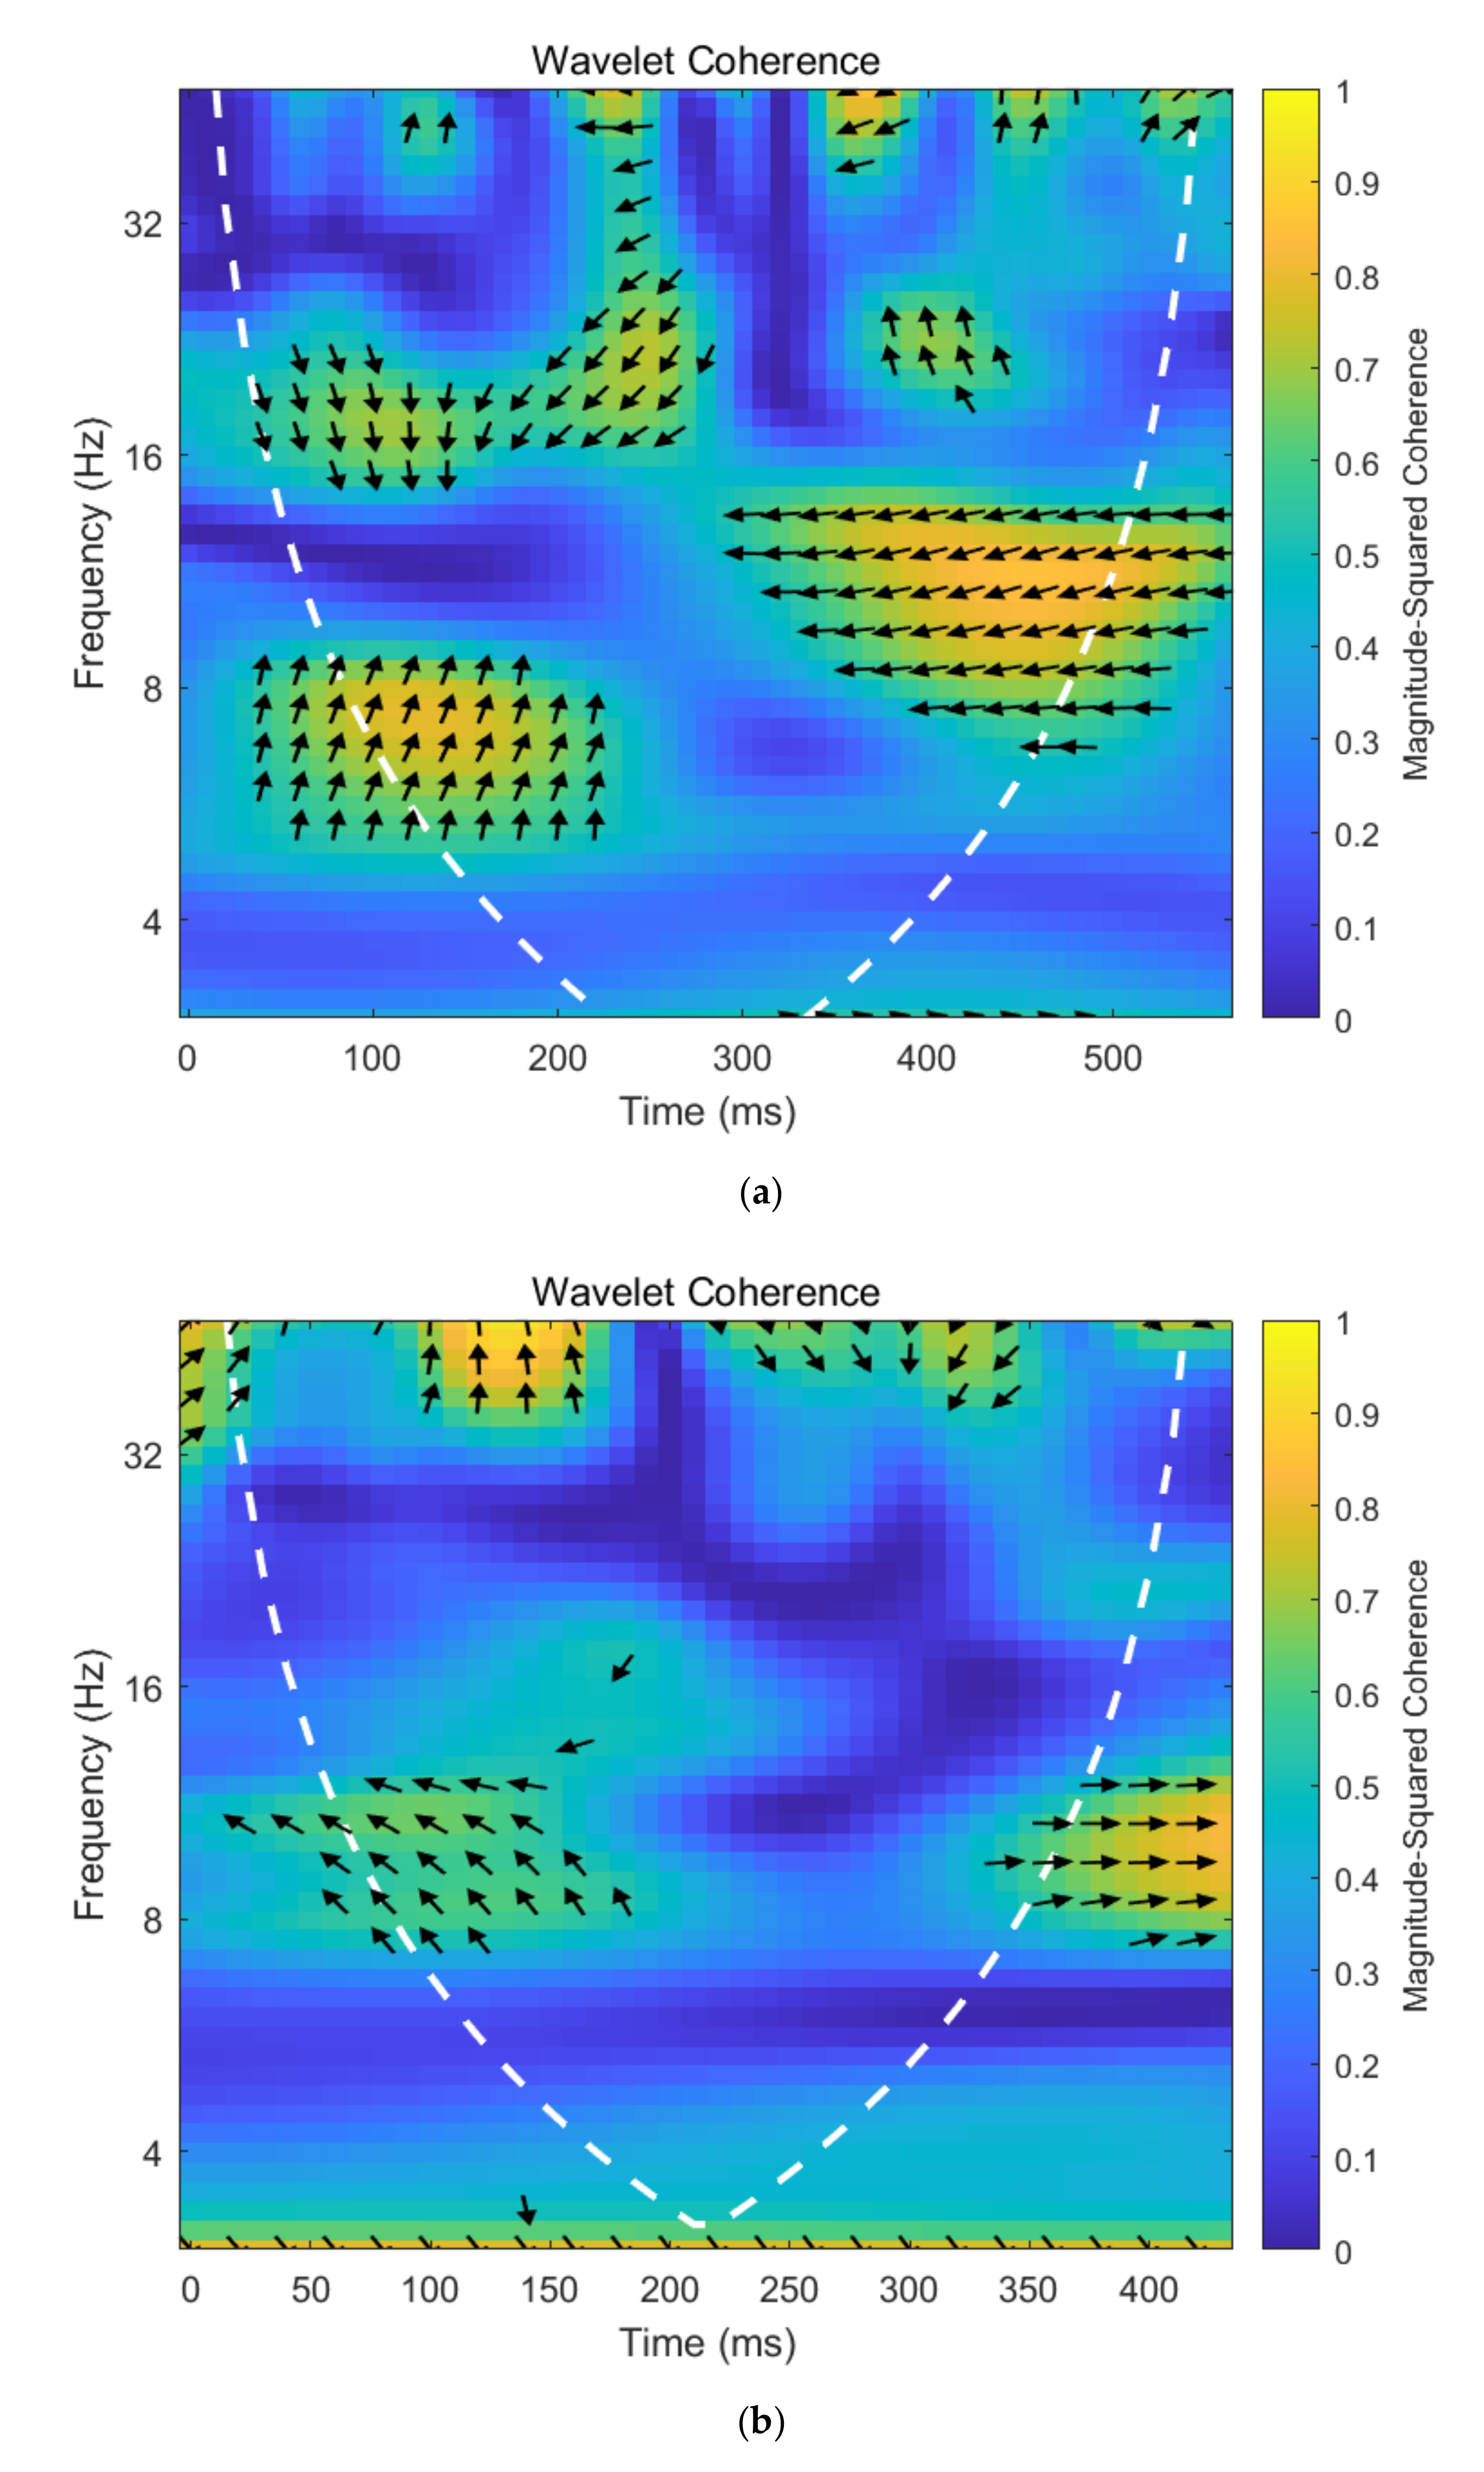
In this subsection, we attempt to further investigate the heterogeneous dynamic correlation between various crude oil prices shocks and investor sentiment by decomposing the crude oil prices shocks into oil supply shocks, aggregate demand shocks, and oil-specific demand shocks. Figure 4 presents the various wavelet coherency map between different crude oil prices shocks and investor sentiment. Among Figure 4, Figure 4a shows the wavelet coherency map of oil supply shocks and investor sentiment, Figure 4b presents the wavelet coherency map of aggregate demand shocks and investor sentiment, while Figure 4c exhibits the wavelet coherency map of oil-specific demand shocks and investor sentiment.
The dynamic correlation between various crude oil prices shocks and investor sentiment are heterogeneous. Figure 4 show the three wavelet coherency maps between oil supply shocks, aggregate demand shocks, and oil-specific demand shocks and investor sentiment, respectively. The heterogeneity of various crude oil prices shocks and investor sentiment are mainly reflected in two folds. On the one hand, the correlation between different oil price shocks and investor sentiment are heterogeneous. Specifically, there is a positive correlation between oil supply shocks and investor sentiment from Figure 4a. Most of the arrows pointing right indicate a positive relationship between oil supply shocks and investor sentiment. Secondly, in Figure 4b, most of arrows point to the left, which indicates a negative relationship between aggregate demand shocks and investor sentiment. Thirdly, a large insignificant area in Figure 4c manifests an insignificant dynamic correlation between oil-specific demand shocks and investor sentiment. In conclusion, the dynamic correlation between various crude oil prices shocks and investor sentiment are heterogeneous.
On the other hand, the lead–lag relationship between different oil price shocks and investor sentiment at various frequency are heterogeneous. Specifically, from Figure 4a, the arrows at the bottom left mostly point to the lower right, revealing that investor sentiment lead oil supply shocks at the low frequency. Second, the arrows in Figure 4b mostly point to the upper right and lower left, revealing that aggregate demand shocks lead investor sentiment. Thirdly, the arrows at the middle of the Figure 4c points to the upper right and lower left, indicating that crude oil prices lead oil-specific demand shocks in the middle frequency. In sum, the lead–lag relationship between various crude oil price shocks and investor sentiment are heterogeneous at various frequencies.
4. Asymmetric Dynamic Correlation between Crude Oil Prices and Investor Sentiment under Different Trends of Oil Price
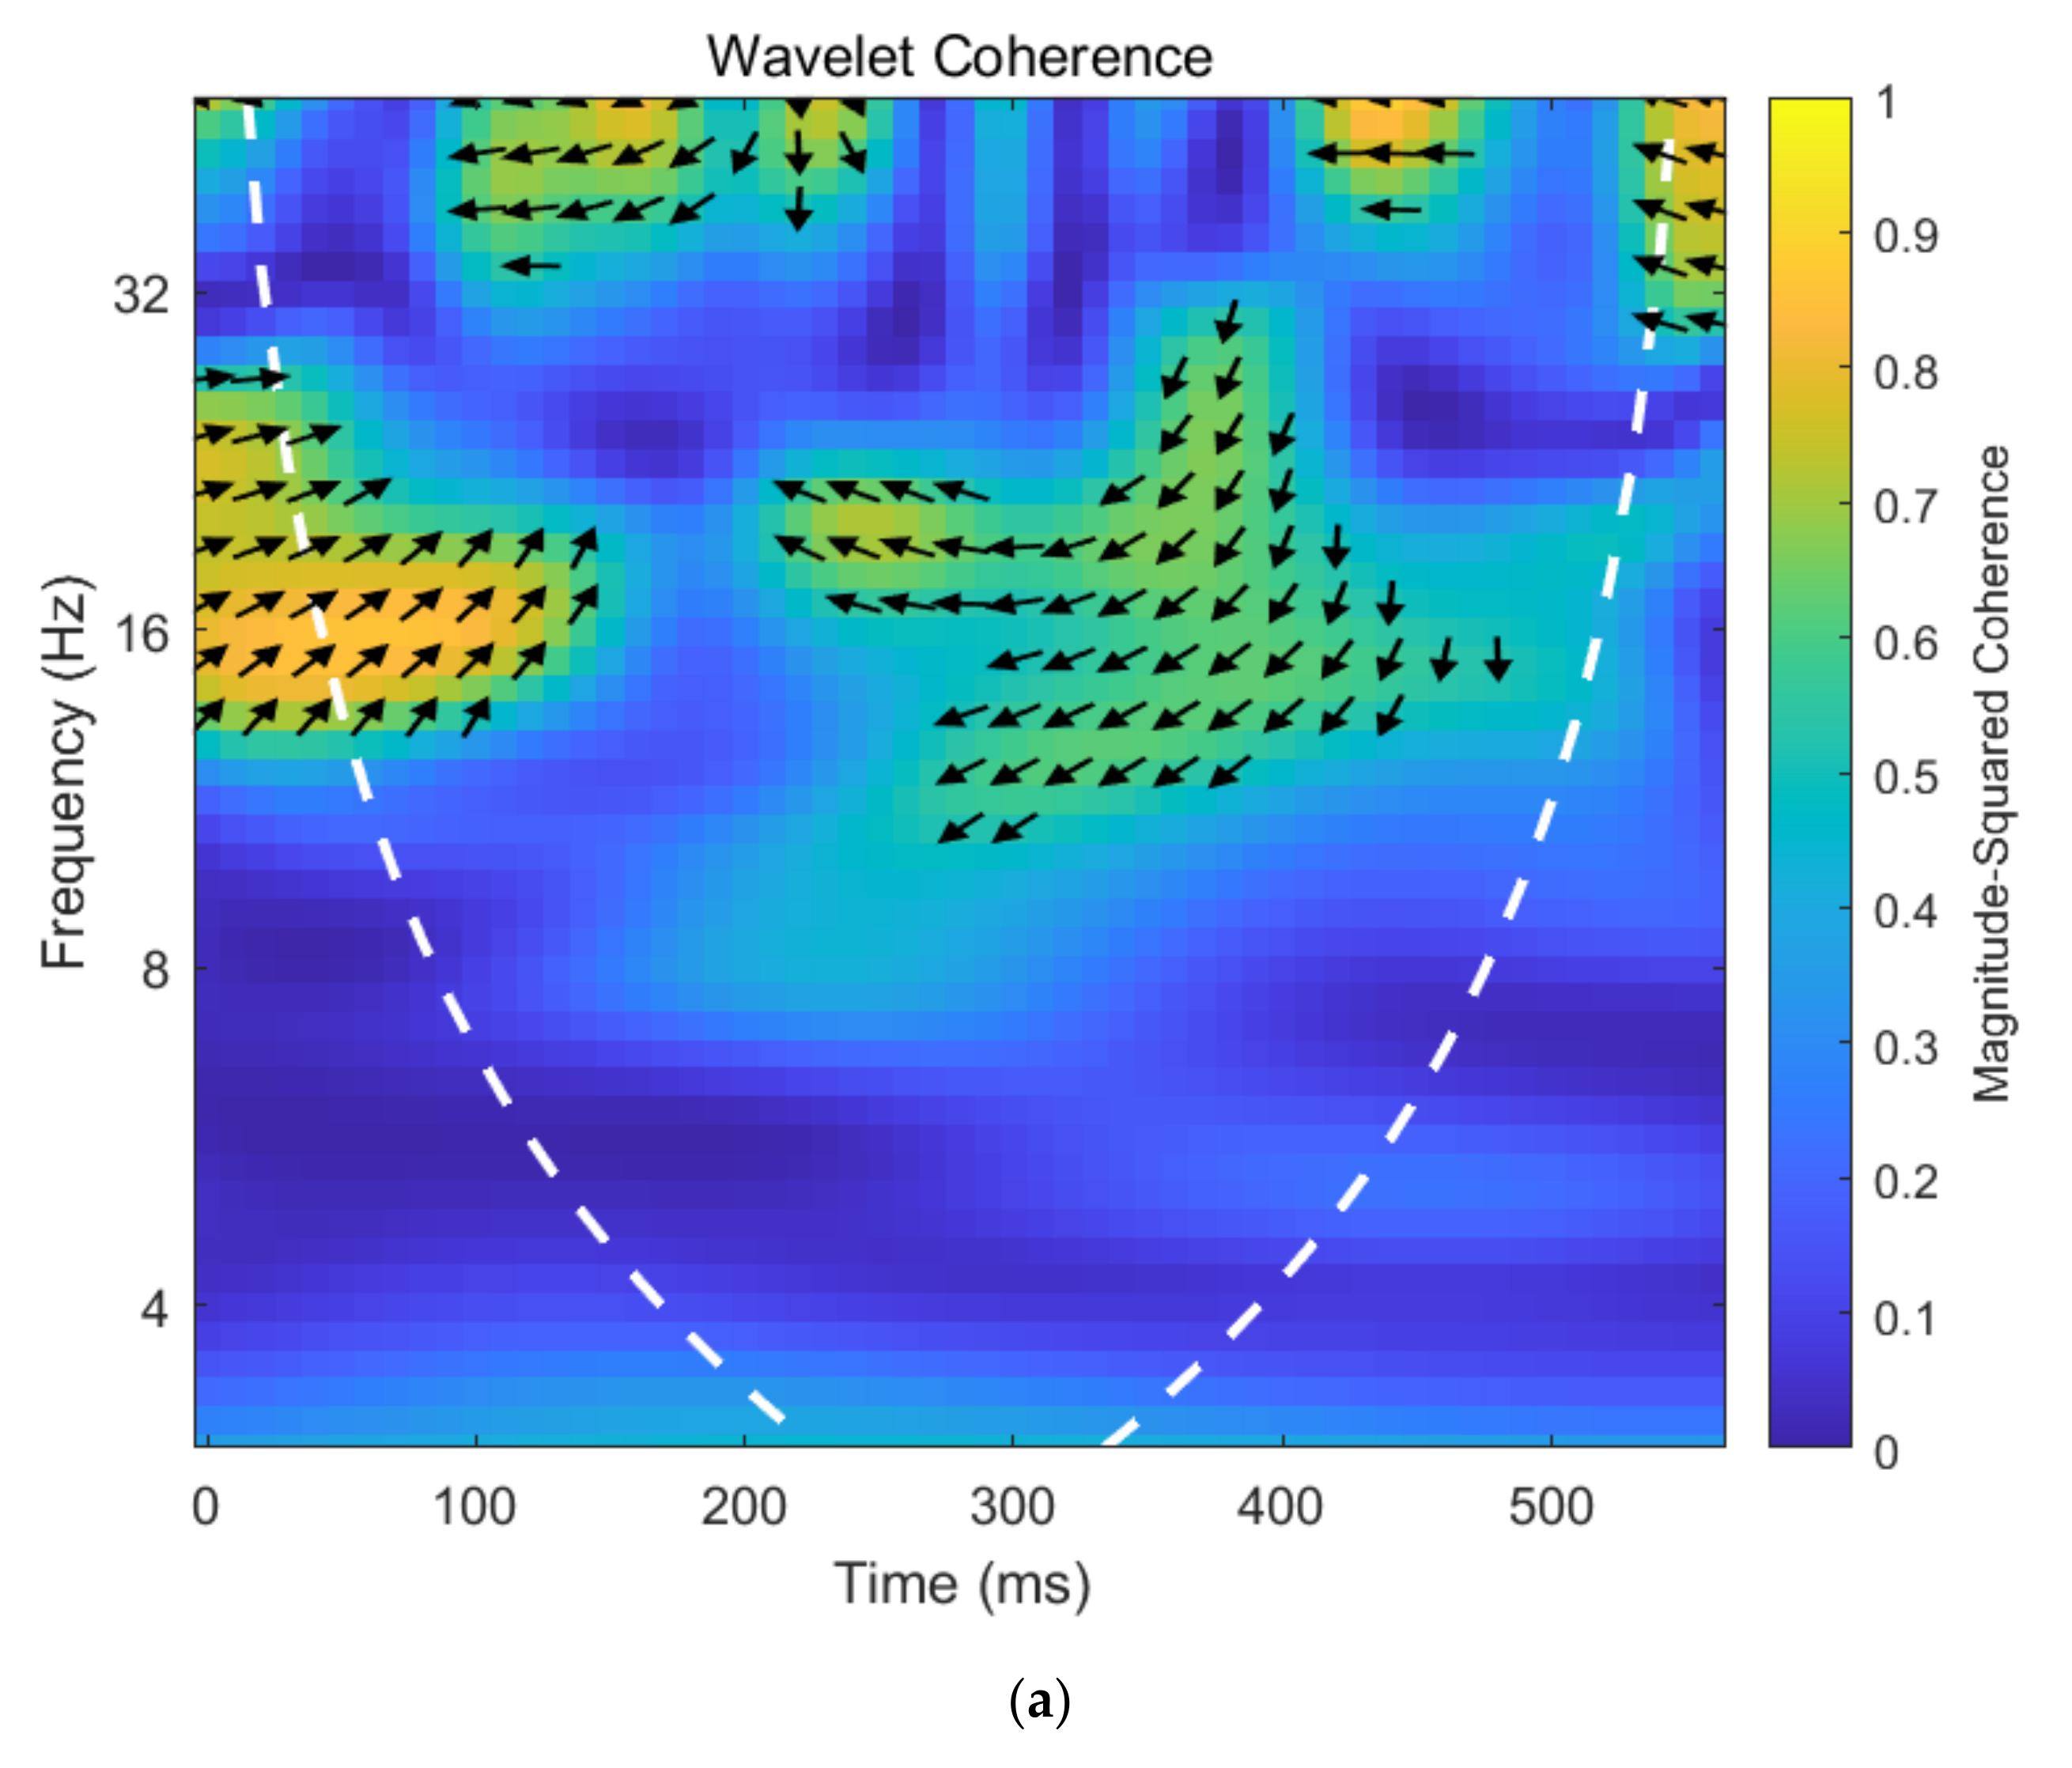
In this section, we attempt to further explore the asymmetric dynamic correlation between crude oil prices (shocks) and investor sentiment under different trends of crude oil price. The period is divided into the up and down period on the basis of trends of crude oil price. First, we attempt to investigate the asymmetric dynamic correlation between crude oil prices and investor sentiment under different trends of oil price. Then, we further investigate the asymmetric dynamic correlation between crude oil price shocks and investor sentiment under different trends of oil price.
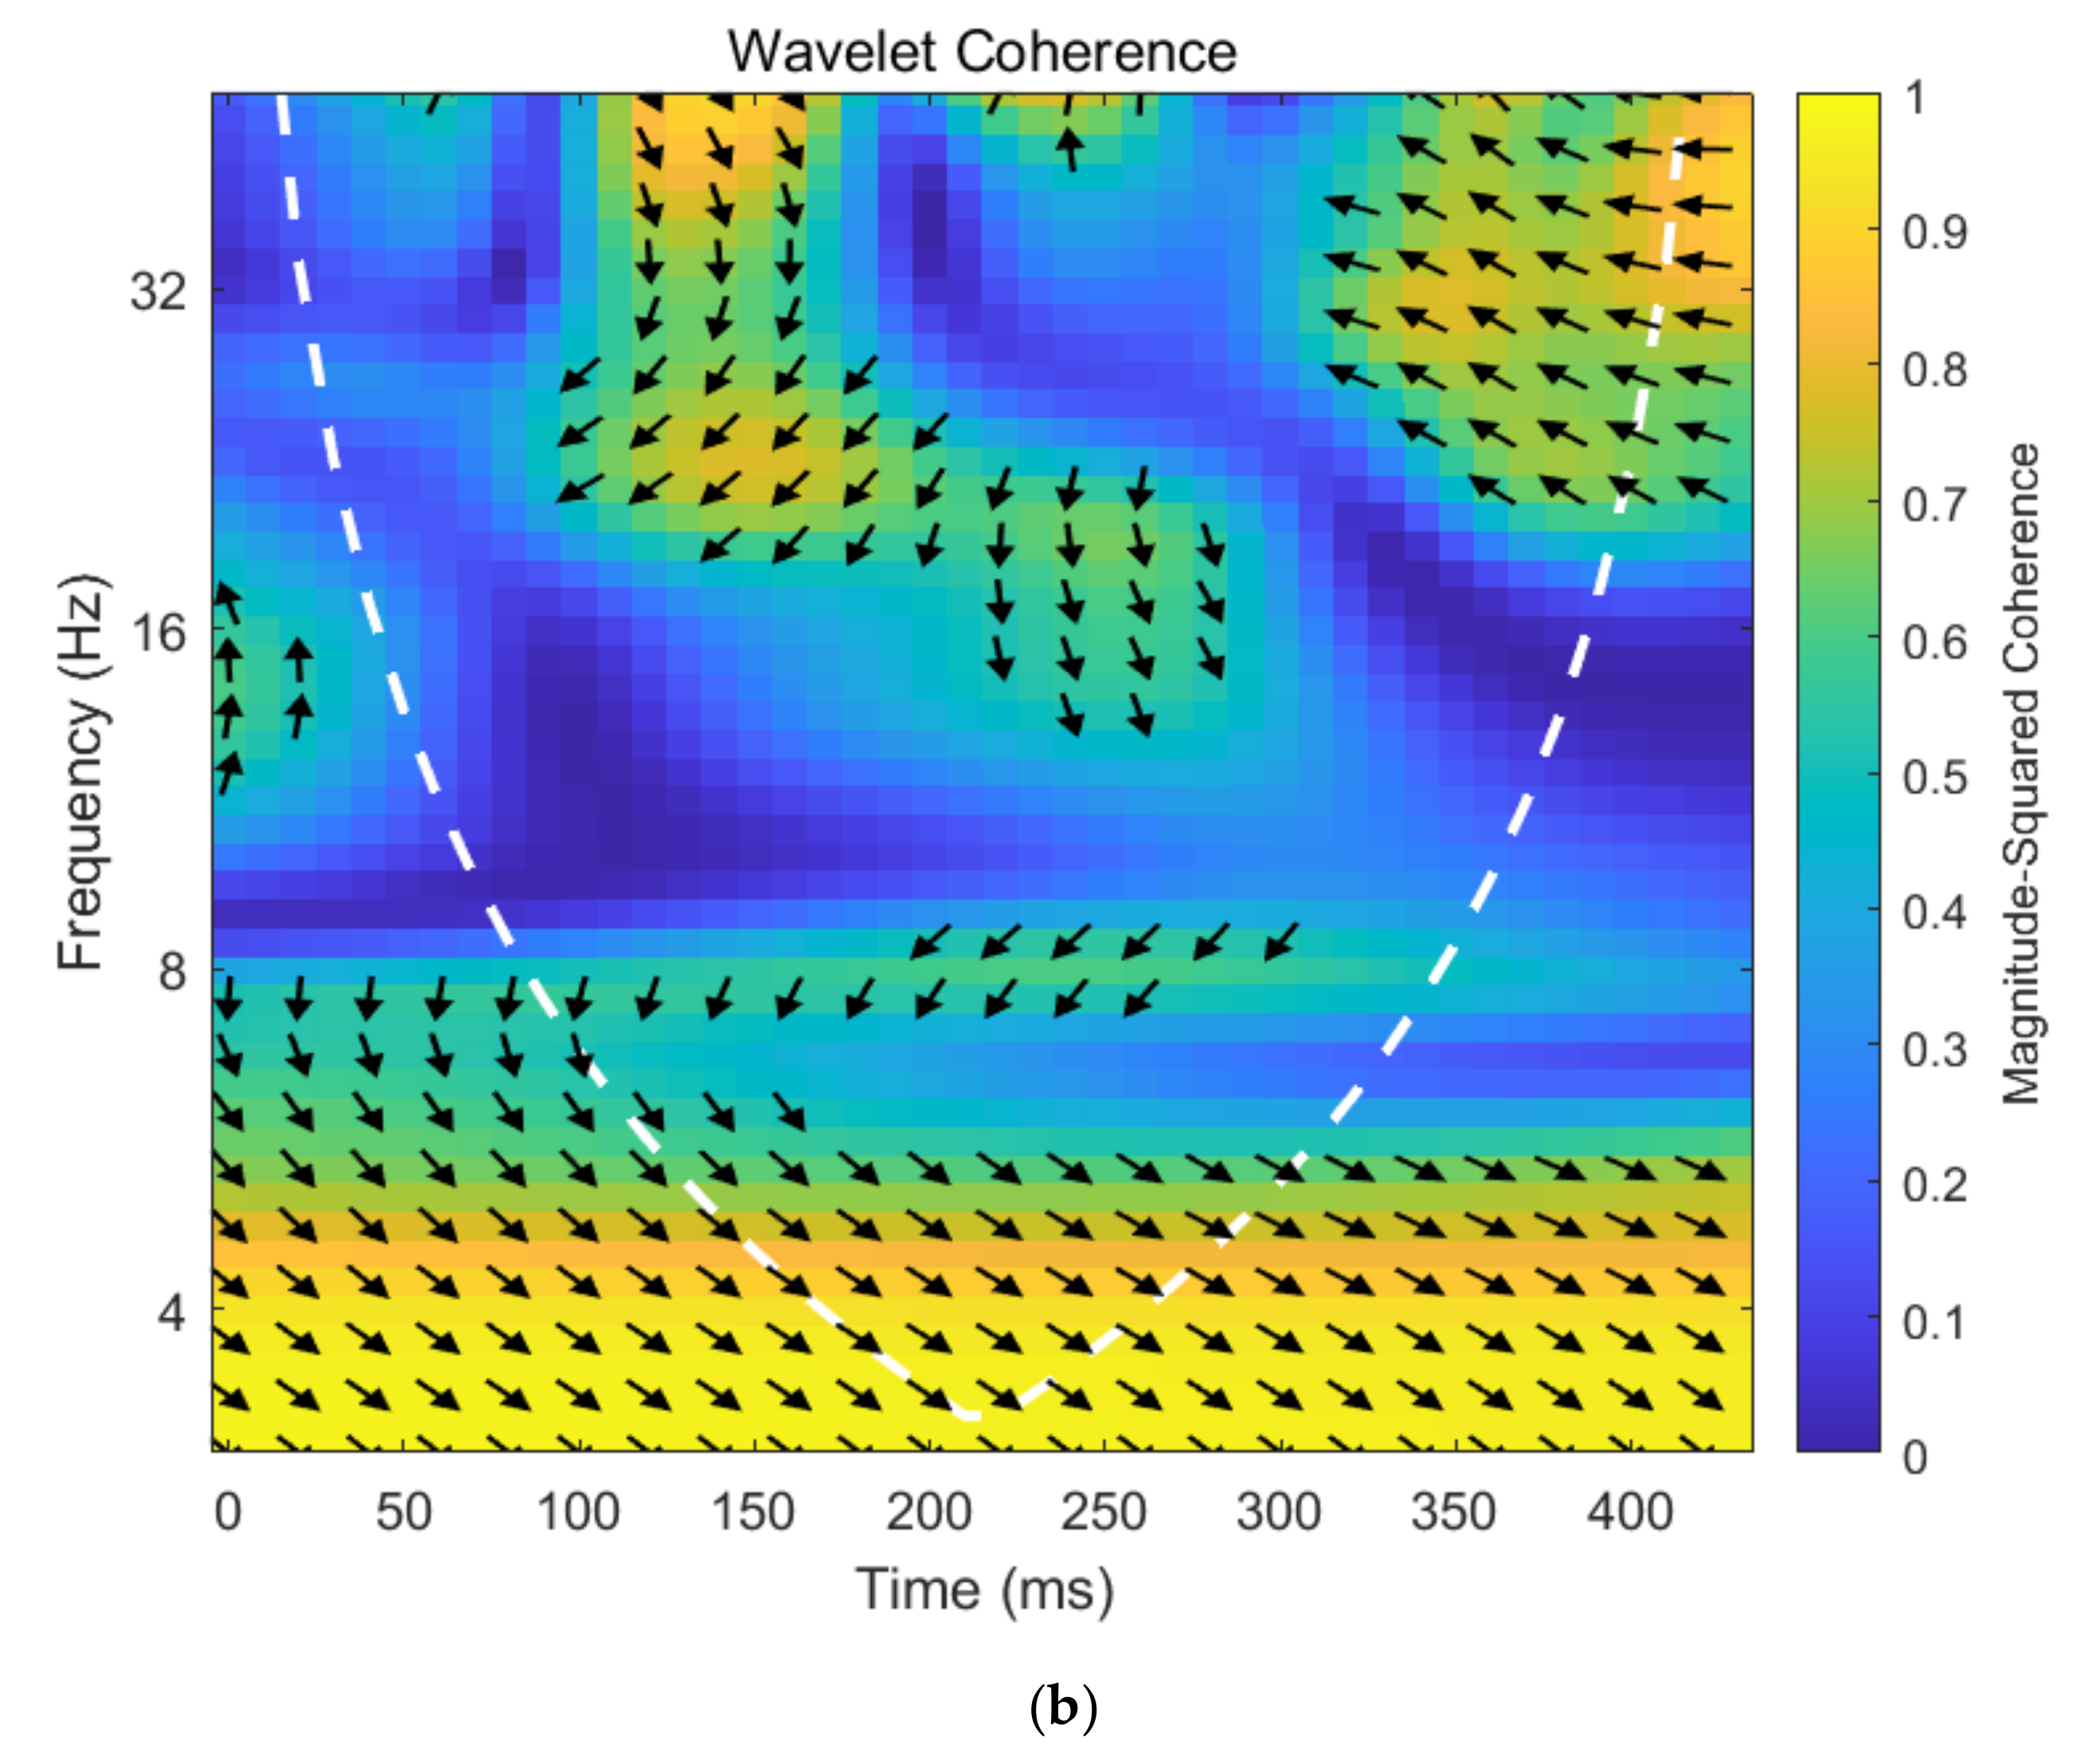
Figure 5 plots the wavelet coherency map between crude oil prices and investor sentiment under different trends of crude oil. Figure 5a presents the wavelet coherency map of crude oil prices and investor sentiment when the crude oil price rises, while Figure 5b exhibits the wavelet coherency map of crude oil prices and investor sentiment when the crude oil price falls.
Asymmetric dynamic correlation exists between crude oil prices and investor sentiment under different trends of crude oil price. Figure 5 intuitively shows the wavelet coherency map of crude oil prices and investor sentiment under different trends of crude oil price. From the top of Figure 5a, most of the arrows pointing left imply a negative relationship between crude oil prices and investor sentiment at high frequency during periods of rising oil prices. However, at the bottom of Figure 5a there is a small coherence coefficient, which manifest that no significant dynamic correlation between crude oil prices and investor sentiment at the relatively low frequency during periods of rising oil prices. In addition, most of arrows point to the right in Figure 5b, which provides us with evidence that crude oil prices are positively related to investor sentiment during periods of falling oil prices. In short, dynamic correlation between crude oil prices and investor sentiment under different trends of crude oil price is asymmetric.
The lead–lag relationship between crude oil price and investor sentiment under different trends of crude oil price is also asymmetric. First, the arrows in the significant area at the top of Figure 5a mostly point to lower left, which demonstrate that crude oil prices lead investor sentiment at the relatively high frequency during periods of rising oil prices. However, the arrows at the bottom of Figure 5a demonstrate that there is no co-movement between crude oil prices and investor sentiment at the relatively low frequency during periods of rising oil prices. Second, most of arrows point to upper right at the bottom of Figure 5b, which indicate crude oil prices lead investor sentiment at the relatively low frequency during periods of falling oil prices. Moreover, most of arrows point to upper left and lower right at the top of Figure 5b, which imply that the phase change in investor sentiment is ahead of crude oil prices at the relatively high frequency during periods of falling oil prices. All in all, the lead–lag relationship between crude oil price and investor sentiment is asymmetric under different trends of crude oil price.
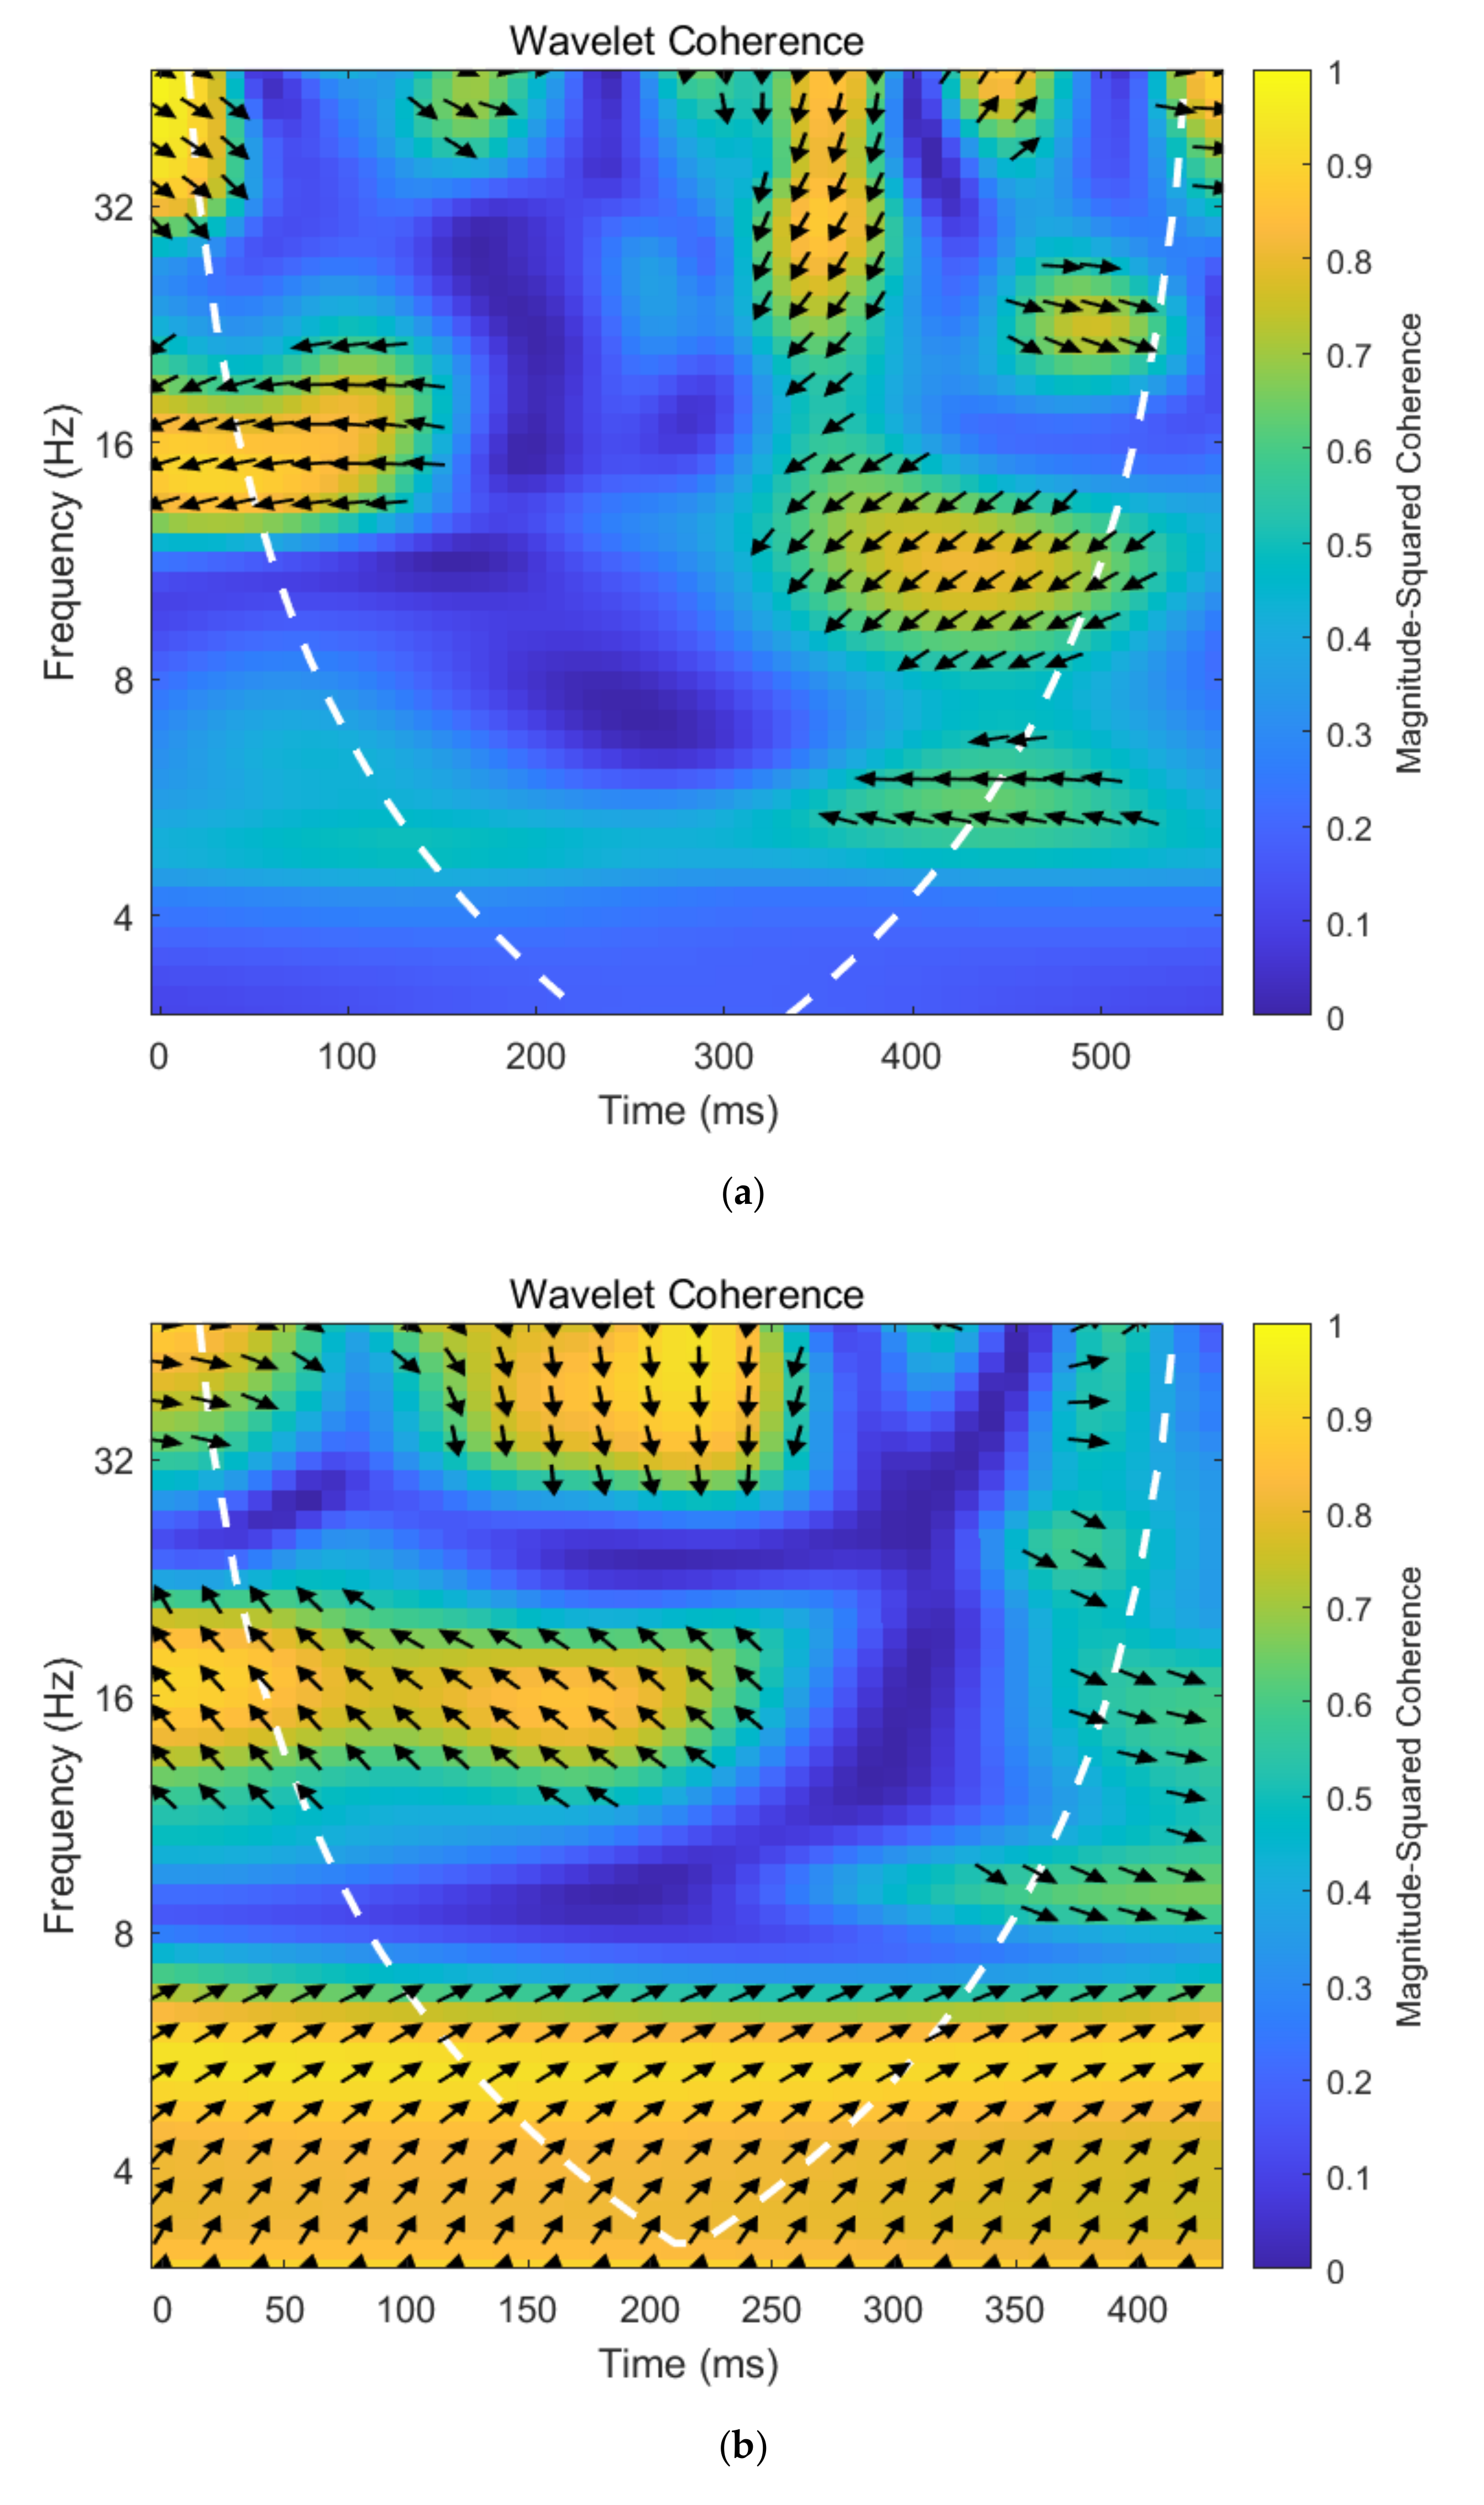
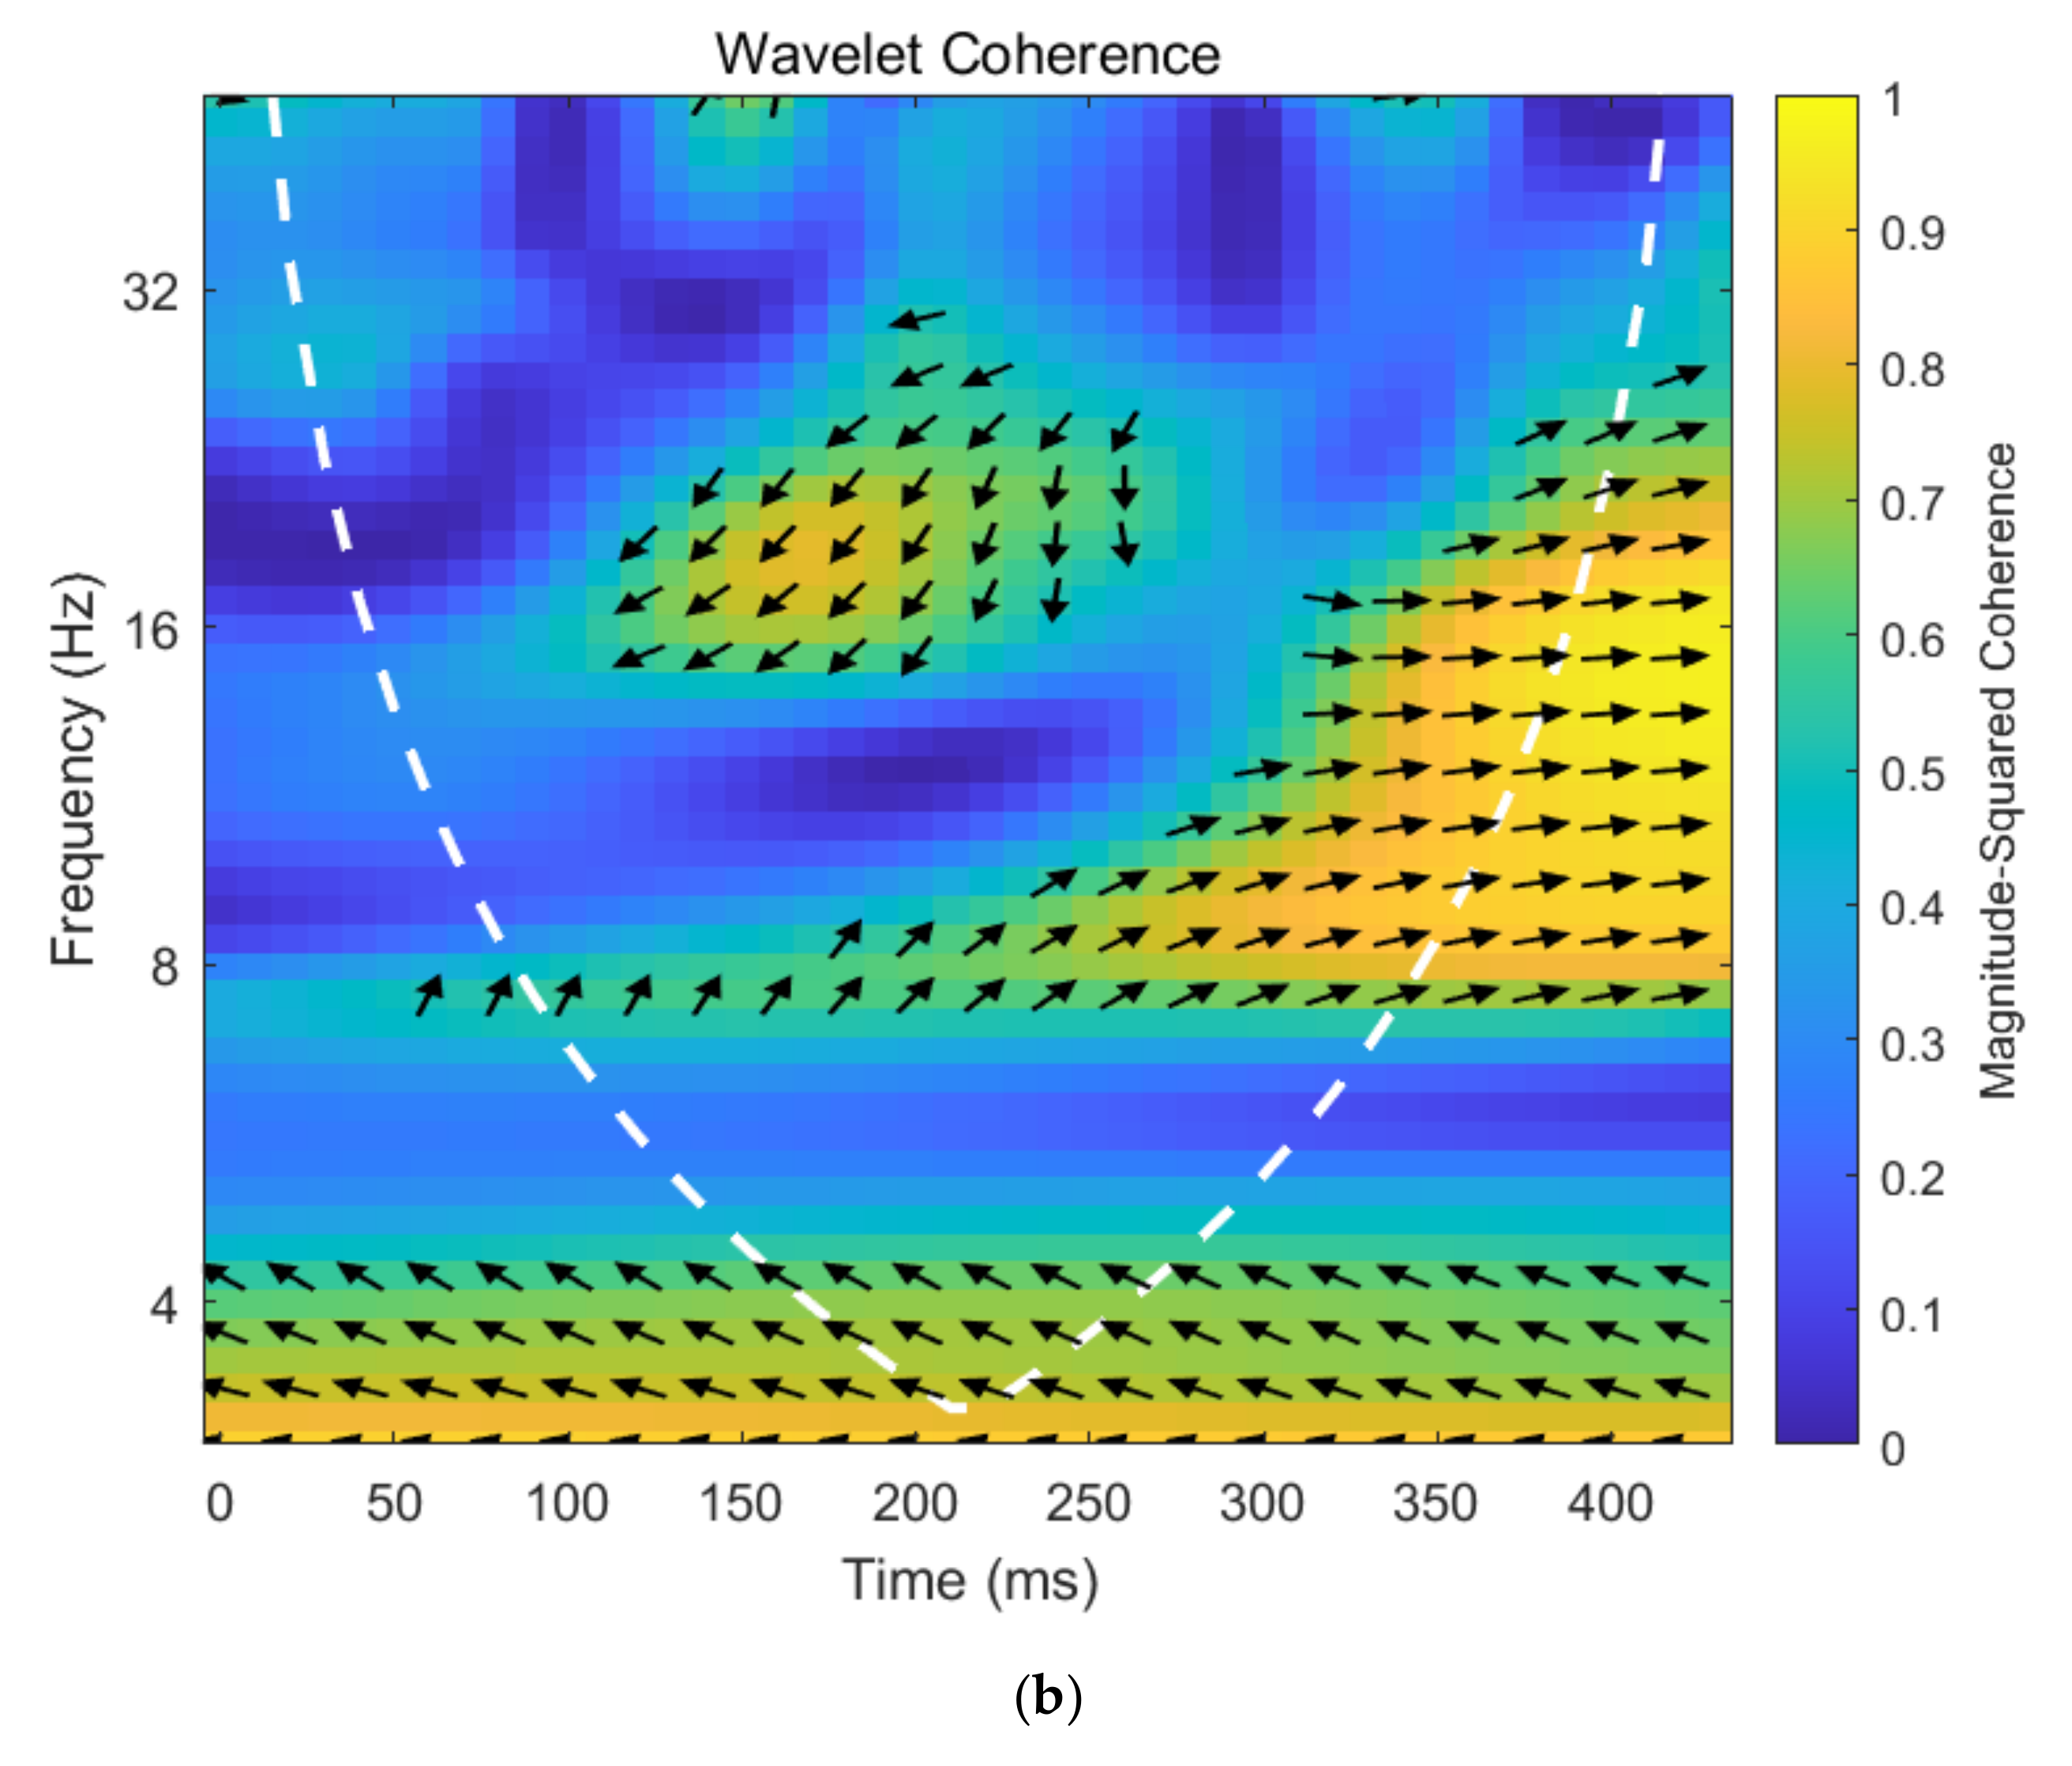
Figure 6 plots the wavelet coherency map between oil supply shocks and investor sentiment under different trends of crude oil. Figure 6a presents the wavelet coherency map of oil supply shocks and investor sentiment when the crude oil price rises, while Figure 6b exhibits the wavelet coherency map of oil supply shocks and investor sentiment when the crude oil price falls.
Asymmetric dynamic correlation exists between oil supply shocks and investor sentiment under different trends of crude oil price. Figure 6 plots the wavelet coherency map of oil supply shocks and investor sentiment under different trends of crude oil price. First, from Figure 6a, we can see a large blue area, the coherence coefficient between oil supply shocks and investor sentiment is very small, which indicated that the dynamic relationship between oil supply shocks and investor sentiment is not significant during periods of rising oil prices. Second, arrows at the bottom of Figure 6b point to the right, manifesting that oil supply shocks are positively related to investor sentiment at a relatively low frequency during periods of falling oil prices. The arrows at the top of Figure 6b point to the left, indicating that oil supply shocks are negatively related to investor sentiment at a relatively high frequency during periods of falling oil prices. In conclusion, the dynamic correlation between oil supply shocks and investor sentiment are asymmetric under different trends of crude oil price.
The lead–lag relationship between oil supply shocks and investor sentiment under different trends of crude oil price are also asymmetric. First, the insignificant area in Figure 6a shows no co-movement between oil supply shocks and investor sentiment during periods of rising oil prices. Second, most of the arrows point to the upper left and lower right at the top and bottom of Figure 6b, this demonstrates that the phase change in investor sentiment is ahead of oil supply shocks during periods of falling oil prices. Given the above, the lead–lag relationship between oil supply shocks and investor sentiment are asymmetric under different trends of crude oil price.
Figure 7 plots the wavelet coherency map between aggregate demand shocks and investor sentiment under different trends of crude oil. Figure 7a presents the wavelet coherency map of aggregate demand shocks and investor sentiment when the crude oil price rises, while Figure 7b exhibits the wavelet coherency map of aggregate demand shocks and investor sentiment when the crude oil price falls.
Asymmetric dynamic correlation exists between aggregate demand shocks and investor sentiment under different trends of crude oil price. Figure 7 draws the wavelet coherency map of aggregate demand shocks and investor sentiment under different trends of crude oil price. First, at the middle of Figure 7a, most of the arrows point to the left and show the negative correlation between aggregate demand shocks and investor sentiment during periods of rising oil prices. Second, from Figure 7b, it is easy to see that the coherence coefficient between aggregate demand shocks and investor sentiment is very small, which demonstrates the insignificant dynamic relationship between aggregate demand shocks and investor sentiment during periods of falling oil prices. In brief, dynamic correlation are asymmetric between aggregate demand shocks and investor sentiment under different trends of crude oil price.
The lead–lag relationship between aggregate demand shocks and investor sentiment under different trends of crude oil price are also asymmetric. First, most of the arrows point to the lower left at the middle of Figure 7a, this indicates that aggregate demand shocks lead investor sentiment during periods of rising oil prices. Second, the insignificant area in Figure 7b shows no co-movement between aggregate demand shocks and investor sentiment during periods of falling oil prices. In short, the lead–lag relationship between aggregate demand shocks and investor sentiment are asymmetric under different trends of crude oil price.
Figure 8 plots the wavelet coherency map between oil-specific demand shocks and investor sentiment under different trends of crude oil. Figure 8a presents the wavelet coherency map of oil-specific demand shocks and investor sentiment when the crude oil price rises, while Figure 8b exhibits the wavelet coherency map of oil-specific demand shocks and investor sentiment when the crude oil price falls.
Asymmetric dynamic correlation exists between oil-specific demand shocks and investor sentiment under different trends of crude oil price. Figure 8 plots the wavelet coherency map of oil-specific demand shocks and investor sentiment under different trends of crude oil price. First, from Figure 8a, the coherence coefficient between oil-specific demand shocks and investor sentiment is rarely significant. This indicated that dynamic relationship between oil-specific demand shocks and investor sentiment is almost insignificant during periods of rising oil prices. Second, most of arrows point to right in Figure 8, which indicating that oil-specific demand shocks are positively related to investor sentiment at middle frequency during periods of falling oil prices. In conclusion, dynamic correlation is asymmetric between oil-specific demand shocks and investor sentiment under different trends of crude oil price.
The lead–lag relationship between oil-specific demand shocks and investor sentiment under different trends of crude oil price are also asymmetric. First, weak co-movement between oil-specific demand shocks and investor sentiment was found from Figure 8a during periods of rising oil prices. Then, most of arrows point to upper right in Figure 8, demonstrating oil-specific demand shocks lead investor sentiment at middle frequency during periods of falling oil prices. To summarize, the lead–lag relationship between oil-specific demand shocks and investor sentiment are asymmetric under different trends of crude oil price.
5. Conclusions
This paper attempts to extend the literature on heterogeneous and asymmetric dynamic correlation between crude oil price (shocks) and Chinese investor sentiment. On the one hand, we shed light on the heterogeneous dynamic correlation between crude oil price shocks and investor sentiment in the time and frequency domain in China and yield heterogeneous results. On the other hand, we complement the literature on the dynamic correlation and its lead–lag relationship between crude oil price shocks and investor sentiment by taking a systematic look at asymmetry under different trends of crude oil price. Based on data from February 2013 to June 2021, this paper first utilizes web crawler to construct Chinese investor sentiment index. The SVAR model is then used to decompose the crude oil price shocks into crude oil supply shocks, aggregate demand shocks, and oil-specific demand shocks. Finally, the wavelet coherence analysis is employed to explore the heterogeneous dynamic correlation between crude oil price (shocks) and investor sentiment in the time and frequency domain, and the asymmetric dynamic correlation between them under different trends of crude oil price. The conclusion can be drawn as follows:
On the one hand, heterogeneous dynamic correlations and lead-lag relationships exist between crude oil price (shocks) and investor sentiment over different time and frequency domains. Specifically, first, crude oil price is positively correlate to investor sentiment and their lead–lag relationships are heterogeneous at different frequency. Second, the dynamic correlation between various crude oil prices shocks and investor sentiment are heterogeneous. Oil supply shocks positively correlate with investor sentiment and aggregate demand shocks negatively correlate with investor sentiment, while dynamic correlation between oil-specific demand shocks and investor sentiment is insignificant. Thirdly, the lead–lag relationship between different oil price shocks and investor sentiment at various frequency are heterogeneous. For instance, investor sentiment lead oil supply shocks at the low frequency, aggregate demand shocks lead investor sentiment, and crude oil prices lead oil-specific demand shocks in the middle frequency.
On the other hand, asymmetric dynamic correlations and lead–lag relationships exist between crude oil price (shocks) and investor sentiment under different trends of crude oil price. Specifically, first, there is a negative dynamic relationship between crude oil prices and investor sentiment and crude oil prices lead investor sentiment at high frequency and insignificant dynamic correlation and no co-movement at the relatively low frequency during periods of rising oil prices, while crude oil prices are positively related to investor sentiment during periods of falling oil prices. Crude oil prices lead investor sentiment at the relatively low frequency and investor sentiment leads crude oil prices at the relatively high frequency during periods of falling oil prices. Second, insignificant dynamic relationship and no co-movement exists between oil supply shocks and investor sentiment during periods of rising oil prices, while oil supply shocks are positively and negatively related to investor sentiment at relatively low and high frequency, respectively, and investor sentiment leads oil supply shocks during periods of falling oil prices. Third, aggregate demand shocks are negatively correlated to investor sentiment and aggregate demand shocks lead investor sentiment during periods of rising oil prices, while there is insignificant dynamic relationship and no co-movement between aggregate demand shocks and investor sentiment during periods of falling oil prices. Forth, there is almost insignificant dynamic relationship and weak co-movement between oil-specific demand shocks and investor sentiment during periods of rising oil prices, while oil-specific demand shocks are positively related to investor sentiment and the former leads the latter at middle frequency during periods of falling oil prices.
These conclusions provide a more detailed exhibition of the heterogeneous and asymmetric dynamic correlation between crude oil price (shocks) and Chinese investor sentiment. Our study yields some important implications. First, policies that seek to decrease the risk in the crude oil futures market should consider different shocks of crude oil, given the heterogeneous and asymmetric dynamic correlation between crude oil price (shocks) and Chinese investor sentiment. Additionally, investors should fully consider the impact of crude oil prices and shocks based on the conditions of different crude oil shocks and different trends of crude oil, and then adjust the portfolio strategy or decision making in time to reduce investment risk.
However, this paper is not without limitations. For instance, we ignore the heterogeneous influence of crude oil price fluctuations on the investment behaviors of Chinese investors and global investors. A first direction for further research would be to explore the dynamic co-movement relationship between crude oil prices, as well as oil price shocks and investor sentiment or investment behaviors in different countries and compare the potential similarities and differences in the dynamic co-movement relationship. Furthermore, it could be another valuable area that introducing event study methodology to analyze the relationship between crude oil price (shocks) and investor sentiment [56].
Author Contributions
Conceptualization, Z.L., Z.H. and P.F.; methodology, Z.L., Z.H. and P.F.; software, Z.H.; validation, Z.L. and P.F.; formal analysis, Z.L. and P.F.; investigation, Z.L., Z.H. and P.F.; resources, Z.H.; data curation, Z.H.; writing—original draft preparation, Z.H.; writing—review and editing, Z.L. and P.F.; visualization, Z.L., Z.H. and P.F.; supervision, Z.L. and P.F.; project administration, Z.H.; funding acquisition, Z.H. All authors have read and agreed to the published version of the manuscript.
Funding
This research was funded by the Innovation Research for the Postgraduates of Guangzhou University, grant number 2020GDJC-D05.
Acknowledgments
Authors would like to thank Guangzhou University for sponsoring this research. In addition, authors would like to thank the editor and anonymous reviewers for their patient and valuable comments on earlier versions of this paper.
Conflicts of Interest
The authors declare no conflict of interest.
Appendix A
The appendix displays the keywords of the Baidu index in translation in Table A1. Since this paper studies the impact of crude oil price shock on Chinese investor sentiment, in practice, Chinese keywords are used as keywords to construct Chinese investor sentiment index. The investor sentiment is divided into positive and negative sentiment. The positive sentiment includes 25 Chinese keywords, while the negative sentiment also includes 25 Chinese keywords.

Table A1.
Keywords of the Baidu index in translation.
| Sentiment Type | Keywords |
|---|---|
| Positive sentiment | skyrocketing, soaring, surging, stock god, good stock, fine stock, positive, optimist, bull, bull market, up, rise, holding, trading limit, potential stocks, surge, rebound, rally, harden, Long, make a lot of money, bullish, record highs, gains |
| Negative sentiment | crash, withdrawal, cut losses, fall, bearish, plunging, trapped, volatility, garbage stocks, fill fall, below, stop, step empty, catch, cash, jump, rush high fall, diving, delist, fall, bear market, banker, low, short, stock disaster |
References
- Lardic, S.; Mignon, V. The impact of oil prices on GDP in European countries: An empirical investigation based on asymmetric cointegration. Energy Policy 2006, 34, 3910–3915. [Google Scholar] [CrossRef]
- Benhmad, F. Dynamic cyclical comovements between oil prices and US GDP: A wavelet perspective. Energy Policy 2013, 57, 141–151. [Google Scholar] [CrossRef]
- Nusair, S.A. The effects of oil price shocks on the economies of the Gulf Co-operation Council countries: Nonlinear analysis. Energy Policy 2016, 91, 256–267. [Google Scholar] [CrossRef]
- Bergmann, P. Oil price shocks and GDP growth: Do energy shares amplify causal effects? Energy Econ. 2019, 80, 1010–1040. [Google Scholar] [CrossRef] [Green Version]
- Razmi, F.; Azali, M.; Chin, L.; Habibullah, M.S. The role of monetary transmission channels in transmitting oil price shocks to prices in ASEAN-4 countries during pre- and post-global financial crisis. Energy 2016, 101, 581–591. [Google Scholar] [CrossRef]
- Chen, S.L.; Ouyang, S.Y.; Dong, H. Oil Price Pass-Through Into Consumer and Producer Prices With Monetary Policy in China: Are There Non-linear and Mediating Effects. Front. Energy Res. 2020, 8, 35. [Google Scholar] [CrossRef] [Green Version]
- Zakaria, M.; Khiam, S.; Mahmood, H. Influence of oil prices on inflation in South Asia: Some new evidence. Resour. Policy 2021, 71, 102014. [Google Scholar] [CrossRef]
- Hammoudeh, S.; Reboredo, J.C. Oil price dynamics and market-based inflation expectations. Energy Econ. 2018, 75, 484–491. [Google Scholar] [CrossRef]
- Salisu, A.A.; Isah, K.O.; Oyewole, O.J.; Akanni, L.O. Modelling oil price-inflation nexus: The role of asymmetries. Energy 2017, 125, 97–106. [Google Scholar] [CrossRef]
- Arora, V.; Tanner, M. Do oil prices respond to real interest rates? Energy Econ. 2013, 36, 546–555. [Google Scholar] [CrossRef] [Green Version]
- Wang, Y.S.; Chueh, Y.L. Dynamic transmission effects between the interest rate, the US dollar, and gold and crude oil prices. Econ. Model. 2013, 30, 792–798. [Google Scholar] [CrossRef]
- Liu, Y.; Li, Z.; Xu, M. The Influential Factors of Financial Cycle Spillover: Evidence from China. Emerg. Mark. Financ. Trade 2020, 56, 1336–1350. [Google Scholar] [CrossRef]
- Alsalman, Z.; Herrera, A.M. Oil Price Shocks and the U.S. Stock Market: Do Sign and Size Matter? Energy J. 2015, 36, 171–188. [Google Scholar] [CrossRef]
- Hwang, I.; Kim, J. Oil price shocks and the US stock market: A nonlinear approach. J. Empir. Financ. 2021, 64, 23–36. [Google Scholar] [CrossRef]
- Degiannakis, S.; Filis, G.; Arora, V. Oil Prices and Stock Markets: A Review of the Theory and Empirical Evidence. Energy J. 2018, 39, 1–46. [Google Scholar] [CrossRef] [Green Version]
- Boubaker, H.; Raza, S.A. A wavelet analysis of mean and volatility spillovers between oil and BRICS stock markets. Energy Econ. 2017, 64, 105–117. [Google Scholar] [CrossRef]
- Lyócsa, Š.; Todorova, N. What drives volatility of the U.S. oil and gas firms? Energy Econ. 2021, 100, 105367. [Google Scholar] [CrossRef]
- Li, Z.; Ao, Z.; Mo, B. Revisiting the Valuable Roles of Global Financial Assets for International Stock Markets: Quantile Coherence and Causality-in-Quantiles Approaches. Mathematics 2021, 9, 1750. [Google Scholar] [CrossRef]
- Wu, Y.; Ma, S. Impact of COVID-19 on energy prices and main macroeconomic indicators—evidence from China’s energy market. Green Financ. 2021, 3, 1019. [Google Scholar] [CrossRef]
- Kocaarslan, B.; Soytas, M.A.; Soytas, U. The asymmetric impact of oil prices, interest rates and oil price uncertainty on unemployment in the US. Energy Econ. 2020, 86, 104625. [Google Scholar] [CrossRef]
- Jeris, S.S.; Nath, R.D. Covid-19, oil price and UK economic policy uncertainty: Evidence from the ARDL approach. Quant. Financ. Econ. 2020, 4, 503–514. [Google Scholar] [CrossRef]
- Su, R.; Du, J.; Shahzad, F.; Long, X. Unveiling the Effect of Mean and Volatility Spillover between the United States Economic Policy Uncertainty and WTI Crude Oil Price. Sustainability 2020, 12, 6662. [Google Scholar] [CrossRef]
- Luo, C.; Li, Z.; Liu, L. Does investor sentiment affect stock pricing? Evidence from seasoned equity offerings in China. Natl. Acc. Rev. 2021, 3, 115–136. [Google Scholar] [CrossRef]
- Alsalman, Z.N.; Karaki, M.B. Oil Prices and Personal Consumption Expenditures: Does the Source of the Shock Matter? Oxf. Bull. Econ. Stat. 2019, 81, 250–270. [Google Scholar] [CrossRef]
- Wang, Y.S. Oil price effects on personal consumption expenditures. Energy Econ. 2013, 36, 198–204. [Google Scholar] [CrossRef]
- Zhang, D.Y.; Broadstock, D.C.; Cao, H. International oil shocks and household consumption in China. Energy Policy 2014, 75, 146–156. [Google Scholar] [CrossRef]
- Yao, T.; Zhang, Y.J.; Ma, C.Q. How does investor attention affect international crude oil prices? Appl. Energy 2017, 205, 336–344. [Google Scholar] [CrossRef]
- Balcilar, M.; Demirer, R.; Ulussever, T. Does speculation in the oil market drive investor herding in emerging stock markets? Energy Econ. 2017, 65, 50–63. [Google Scholar] [CrossRef]
- Li, Z.; Dong, H.; Floros, C.; Charemis, A.; Failler, P. Re-examining Bitcoin Volatility: A CAViaR-based Approach. Emerg. Mark. Financ. Trade 2021, 1–19. [Google Scholar] [CrossRef]
- Apergis, N.; Cooray, A.; Rehman, M.U. Do Energy Prices Affect U.S. Investor Sentiment? J. Behav. Financ. 2017, 19, 125–140. [Google Scholar] [CrossRef]
- He, Z.; Zhou, F.; Xia, X.; Wen, F.; Huang, Y. Interaction between Oil Price and Investor Sentiment: Nonlinear Causality, Time- Varying Influence, and Asymmetric Effect. Emerg. Mark. Financ. Trade 2019, 55, 2756–2773. [Google Scholar] [CrossRef]
- Ye, Z.; Hu, C.; He, L.; Ouyang, G.; Wen, F. The Dynamic Time-frequency Relationship between International Oil Prices and Investor Sentiment in China: A Wavelet Coherence Analysis. Energy J. 2020, 41, 251–270. [Google Scholar] [CrossRef]
- Li, P.; Ouyang, Y. How oil price shocks affect investor sentiment: New evidence from China. Appl. Econ. Lett. 2021, 1–9. [Google Scholar] [CrossRef]
- Kilian, L.; Park, C. The impact of oil price shocks on the US Stock market. Int. Econ. Rev. 2009, 50, 1267–1287. [Google Scholar] [CrossRef]
- Ding, Z.; Liu, Z.; Zhang, Y.; Long, R. The contagion effect of international crude oil price fluctuations on Chinese stock market investor sentiment. Appl. Energy 2017, 187, 27–36. [Google Scholar] [CrossRef]
- Qadan, M.; Nama, H. Investor sentiment and the price of oil. Energy Econ. 2018, 69, 42–58. [Google Scholar] [CrossRef]
- Choi, S.; Song, M.; Kim, S.I. Does Investor’s Sentiment Predict Prices Movements? A Case Study of the NYMEX Petroleum Futures Markets. Korea Energy Econ. Rev. 2008, 7, 53–73. [Google Scholar]
- Zhao, L.-T.; Zeng, G.-R.; Wang, W.-J.; Zhang, Z.-G. Forecasting Oil Price Using Web-based Sentiment Analysis. Energies 2019, 12, 4291. [Google Scholar] [CrossRef] [Green Version]
- Li, X.; Shang, W.; Wang, S. Text-based crude oil price forecasting: A deep learning approach. Int. J. Forecast. 2019, 35, 1548–1560. [Google Scholar] [CrossRef]
- Wu, B.; Wang, L.; Wang, S.; Zeng, Y.-R. Forecasting the U.S. oil markets based on social media information during the COVID-19 pandemic. Energy 2021, 226, 120403. [Google Scholar] [CrossRef]
- He, Z.; Zhou, F. Time-varying and asymmetric effects of the oil-specific demand shock on investor sentiment. PLoS ONE 2018, 13, e0200734. [Google Scholar] [CrossRef] [Green Version]
- Wang, L.; Ma, F.; Niu, T.; Liang, C. The importance of extreme shock: Examining the effect of investor sentiment on the crude oil futures market. Energy Econ. 2021, 99, 105319. [Google Scholar] [CrossRef]
- Tastan, H.; Sahin, S. Low-frequency relationship between money growth and inflation in Turkey. Quant. Financ. Econ. 2020, 4, 91–120. [Google Scholar] [CrossRef]
- Mabrouk, A.B. Wavelet-based systematic risk estimation: Application on GCC stock markets: The Saudi Arabia case. Quant. Financ. Econ. 2020, 4, 542–595. [Google Scholar] [CrossRef]
- Maraun, D.; Kurths, J. Nonstationary Gaussian processes in wavelet domain: Synthesis, estimation, and significance testing. Phys. Rev. E 2007, 75, 016707. [Google Scholar] [CrossRef] [Green Version]
- Kilian, L. Not all oil price shocks are alike: Disentangling demand and supply shocks in the crude oil market. Am. Econ. Rev. 2009, 99, 1053–1069. [Google Scholar] [CrossRef] [Green Version]
- Funashima, Y. Global economic activity indexes revisited. Econ. Lett. 2020, 193, 109269. [Google Scholar] [CrossRef]
- Awan, T.M.; Khan, M.S.; Haq, I.U.; Kazmi, S. Oil and stock markets volatility during pandemic times: A review of G7 countries. Green Financ. 2021, 3, 15–27. [Google Scholar] [CrossRef]
- Huang, Z.; Li, Z. What reflects investor sentiment? Empirical evidence from China. Data Sci. Financ. Econ. 2021, 1, 235–252. [Google Scholar] [CrossRef]
- Liston, D.P. Sin stock returns and investor sentiment. Q. Rev. Econ. Financ. 2016, 59, 63–70. [Google Scholar] [CrossRef]
- Baker, M.; Wurgler, J. Investor Sentiment and the Cross-Section of Stock Returns. J. Financ. 2006, 61, 1645–1680. [Google Scholar] [CrossRef] [Green Version]
- Baker, M.; Wurgler, J. Investor sentiment in the stock market. J. Econ. Perspect. 2007, 21, 129–151. [Google Scholar] [CrossRef] [Green Version]
- Das, S.R.; Chen, M.Y. Yahoo! for Amazon: Sentiment Extraction from Small Talk on the Web. Manag. Sci. 2007, 53, 1375–1388. [Google Scholar] [CrossRef] [Green Version]
- Han, L.; Lv, Q.; Yin, L. Can investor attention predict oil prices? Energy Econ. 2017, 66, 547–558. [Google Scholar] [CrossRef]
- Li, S.; Zhang, H.; Yuan, D. Investor attention and crude oil prices: Evidence from nonlinear Granger causality tests. Energy Econ. 2019, 84, 104494. [Google Scholar] [CrossRef]
- Li, Z.; Chen, L.; Dong, H. What are bitcoin market reactions to its-related events? Int. Rev. Econ. Financ. 2021, 73, 1–10. [Google Scholar] [CrossRef]
Figure 1.
The cumulative effects of crude oil price shocks. From top to bottom, figures plot the cumulative effects of the oil supply shocks, aggregate demand shocks, and oil-specific demand shocks on the real WTI oil spot price, respectively. The data span from February 2013 to June 2021.
Figure 1.
The cumulative effects of crude oil price shocks. From top to bottom, figures plot the cumulative effects of the oil supply shocks, aggregate demand shocks, and oil-specific demand shocks on the real WTI oil spot price, respectively. The data span from February 2013 to June 2021.

Figure 2.
Trends of investor sentiment index. The data span from January 2011 to June 2021.

Figure 3.
The wavelet coherency map of crude oil prices and investor sentiment. The data span from February 2013 to June 2021. Time and frequency are represented on the horizontal and the vertical axis, respectively. The color of a region from blue to yellow implies the coherence correlation between crude oil prices and investor sentiment become greater. The arrows show the correlation and lead lag relationship between crude oil prices and investor sentiment.

Figure 4.
The various wavelet coherency map between different crude oil prices shocks and investor sentiment. (a) shows the wavelet coherency map of oil supply shocks and investor sentiment, (b) presents the wavelet coherency map of aggregate demand shocks and investor sentiment, while (c) exhibits the wavelet coherency map of oil-specific demand shocks and investor sentiment. The data span from February 2013 to June 2021. Time and frequency are represented on the horizontal and the vertical axis, respectively. The color of a region from blue to yellow implies the coherence correlation between crude oil prices shocks and investor sentiment become greater. The arrows show the correlation and lead lag relationship between crude oil prices shocks and investor sentiment.


Figure 5.
The wavelet coherency map between crude oil prices and investor sentiment under different trends of crude oil price. (a) exhibits the wavelet coherency map of crude oil prices and investor sentiment under rising trend in crude oil prices, while (b) presents the wavelet coherency map of crude oil prices and investor sentiment under down trend in crude oil prices. The color of a region from blue to yellow in a wavelet coherency map implies the coherence correlation between crude oil prices and investor sentiment become greater. The arrows show the correlation and lead lag relationship between crude oil prices and investor sentiment.

Figure 6.
The wavelet coherency map between oil supply shocks and investor sentiment under different trends of crude oil price. (a) exhibits the wavelet coherency map of oil supply shocks and investor sentiment under rising trend in crude oil prices, while (b) presents the wavelet coherency map of oil supply shocks and investor sentiment under down trend in crude oil prices. The color of a region from blue to yellow implies the coherence correlation between oil supply shocks and investor sentiment become greater. The arrows show the correlation and lead lag relationship between oil supply shocks and investor sentiment.


Figure 7.
The wavelet coherency map between aggregate demand shocks and investor sentiment under different trends of crude oil price. (a) exhibits the wavelet coherency map of aggregate demand shocks and investor sentiment under rising trend in crude oil prices, while (b) presents the wavelet coherency map of aggregate demand shocks and investor sentiment under down trend in crude oil prices. The color of a region from blue to yellow implies the coherence correlation between aggregate demand shocks and investor sentiment become greater. The arrows show the correlation and lead–lag relationship between aggregate demand shocks and investor sentiment.

Figure 8.
The wavelet coherency map between oil-specific demand shocks and investor sentiment under different trends of crude oil price. (a) exhibits the wavelet coherency map of oil-specific demand shocks and investor sentiment under rising trend in crude oil prices, while (b) presents the wavelet coherency map of oil-specific demand shocks and investor sentiment under down trend in crude oil prices. The color of a region from blue to yellow implies the coherence correlation between oil-specific demand shocks and investor sentiment become greater. The arrows show the correlation and lead–lag relationship between oil-specific demand shocks and investor sentiment.


Publisher’s Note: MDPI stays neutral with regard to jurisdictional claims in published maps and institutional affiliations. |
© 2022 by the authors. Licensee MDPI, Basel, Switzerland. This article is an open access article distributed under the terms and conditions of the Creative Commons Attribution (CC BY) license (https://creativecommons.org/licenses/by/4.0/).
Share and Cite
MDPI and ACS Style
Li, Z.; Huang, Z.; Failler, P. Dynamic Correlation between Crude Oil Price and Investor Sentiment in China: Heterogeneous and Asymmetric Effect. Energies 2022, 15, 687. https://0-doi-org.brum.beds.ac.uk/10.3390/en15030687
AMA Style
Li Z, Huang Z, Failler P. Dynamic Correlation between Crude Oil Price and Investor Sentiment in China: Heterogeneous and Asymmetric Effect. Energies. 2022; 15(3):687. https://0-doi-org.brum.beds.ac.uk/10.3390/en15030687
Chicago/Turabian StyleLi, Zhenghui, Zimei Huang, and Pierre Failler. 2022. "Dynamic Correlation between Crude Oil Price and Investor Sentiment in China: Heterogeneous and Asymmetric Effect" Energies 15, no. 3: 687. https://0-doi-org.brum.beds.ac.uk/10.3390/en15030687
Note that from the first issue of 2016, this journal uses article numbers instead of page numbers. See further details here.