
Private Hospital Energy Performance Benchmarking Using Energy Audit Data: An Italian Case Study

 , , , , and
Abstract
:1. Introduction
1.1. Energy Consumption in Hospitals
1.2. Energy Benchmarking
2. Materials and Methods
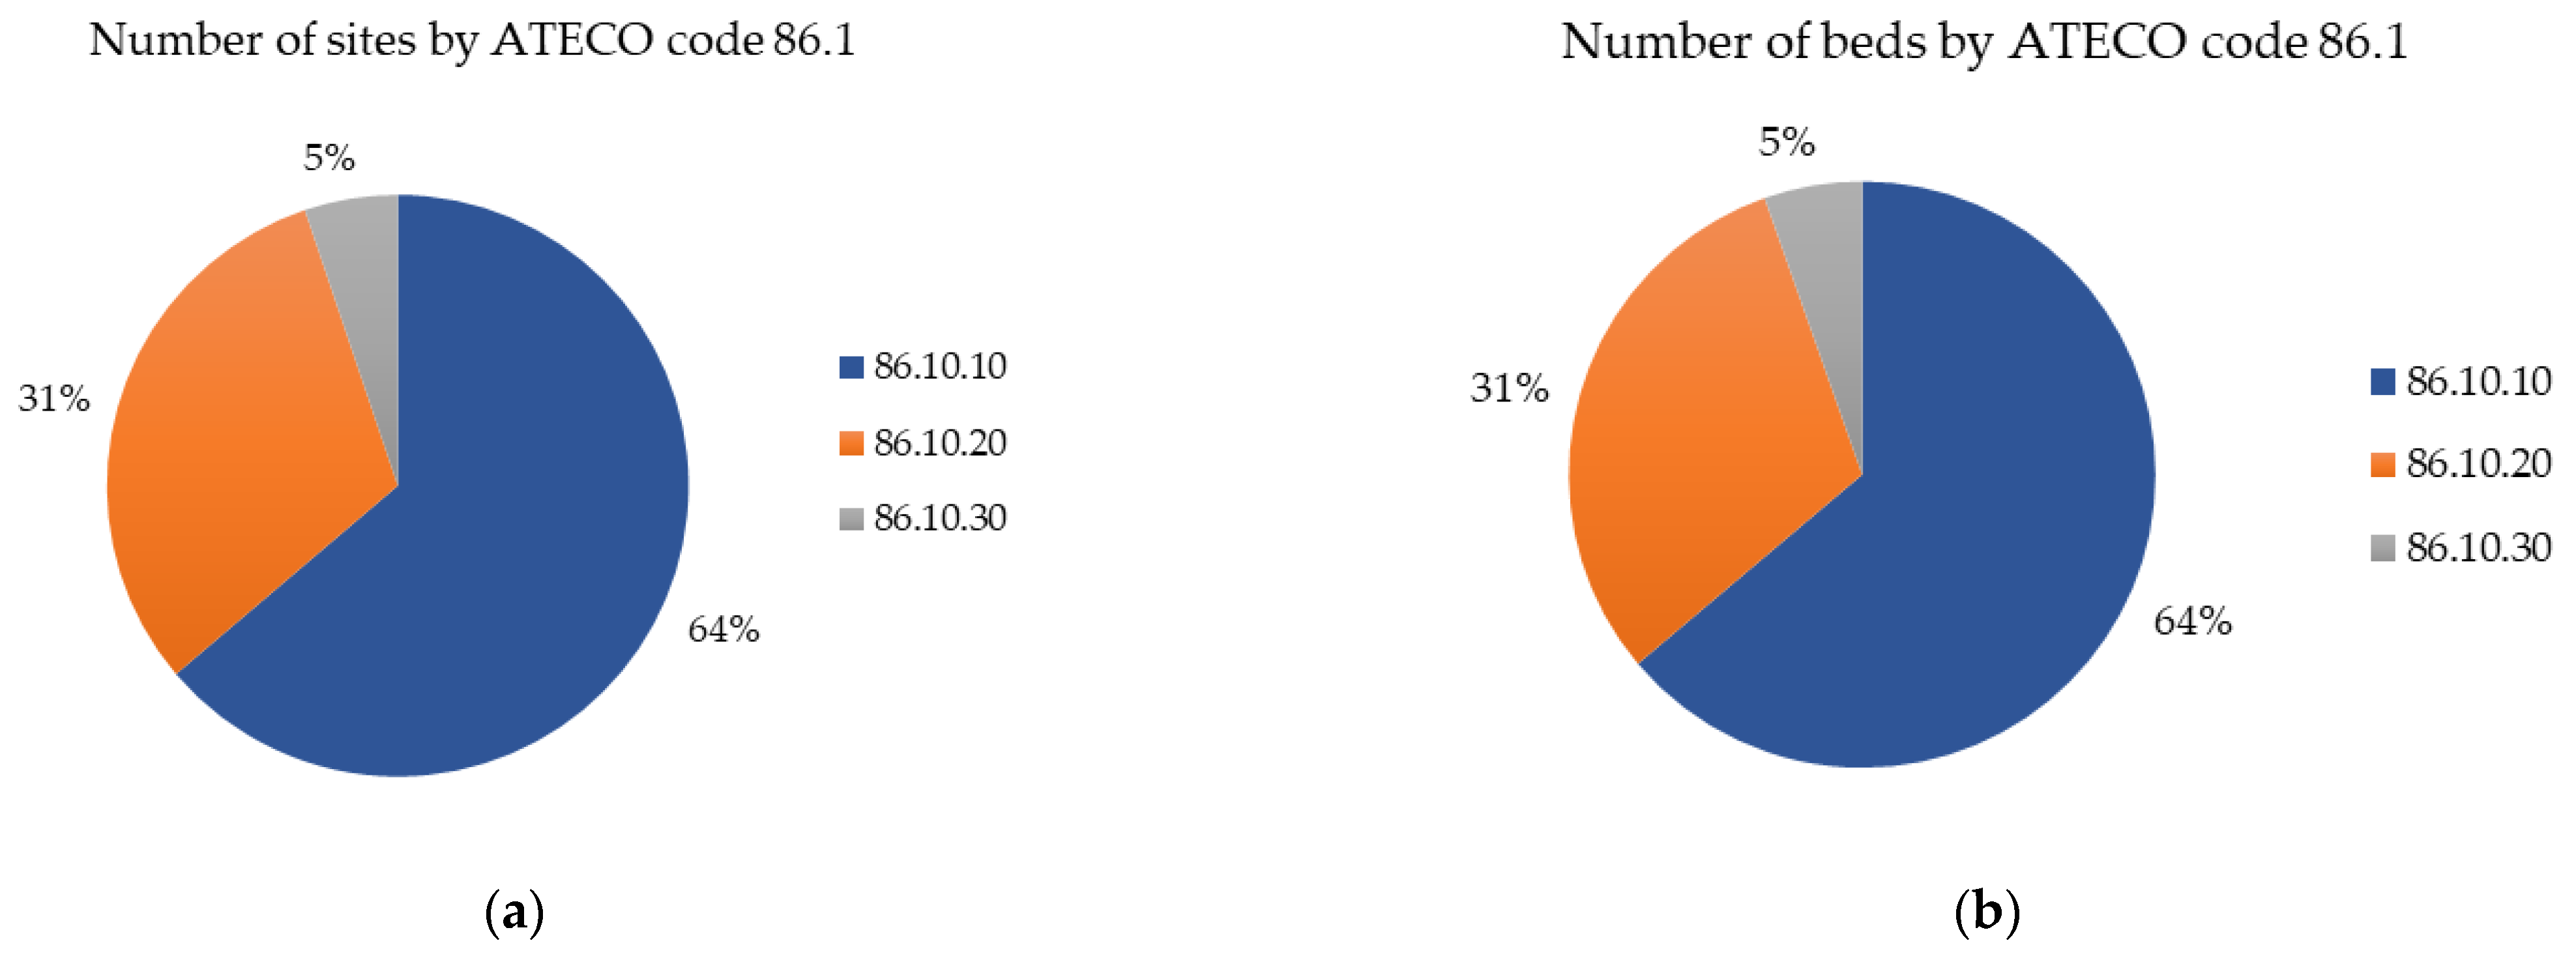
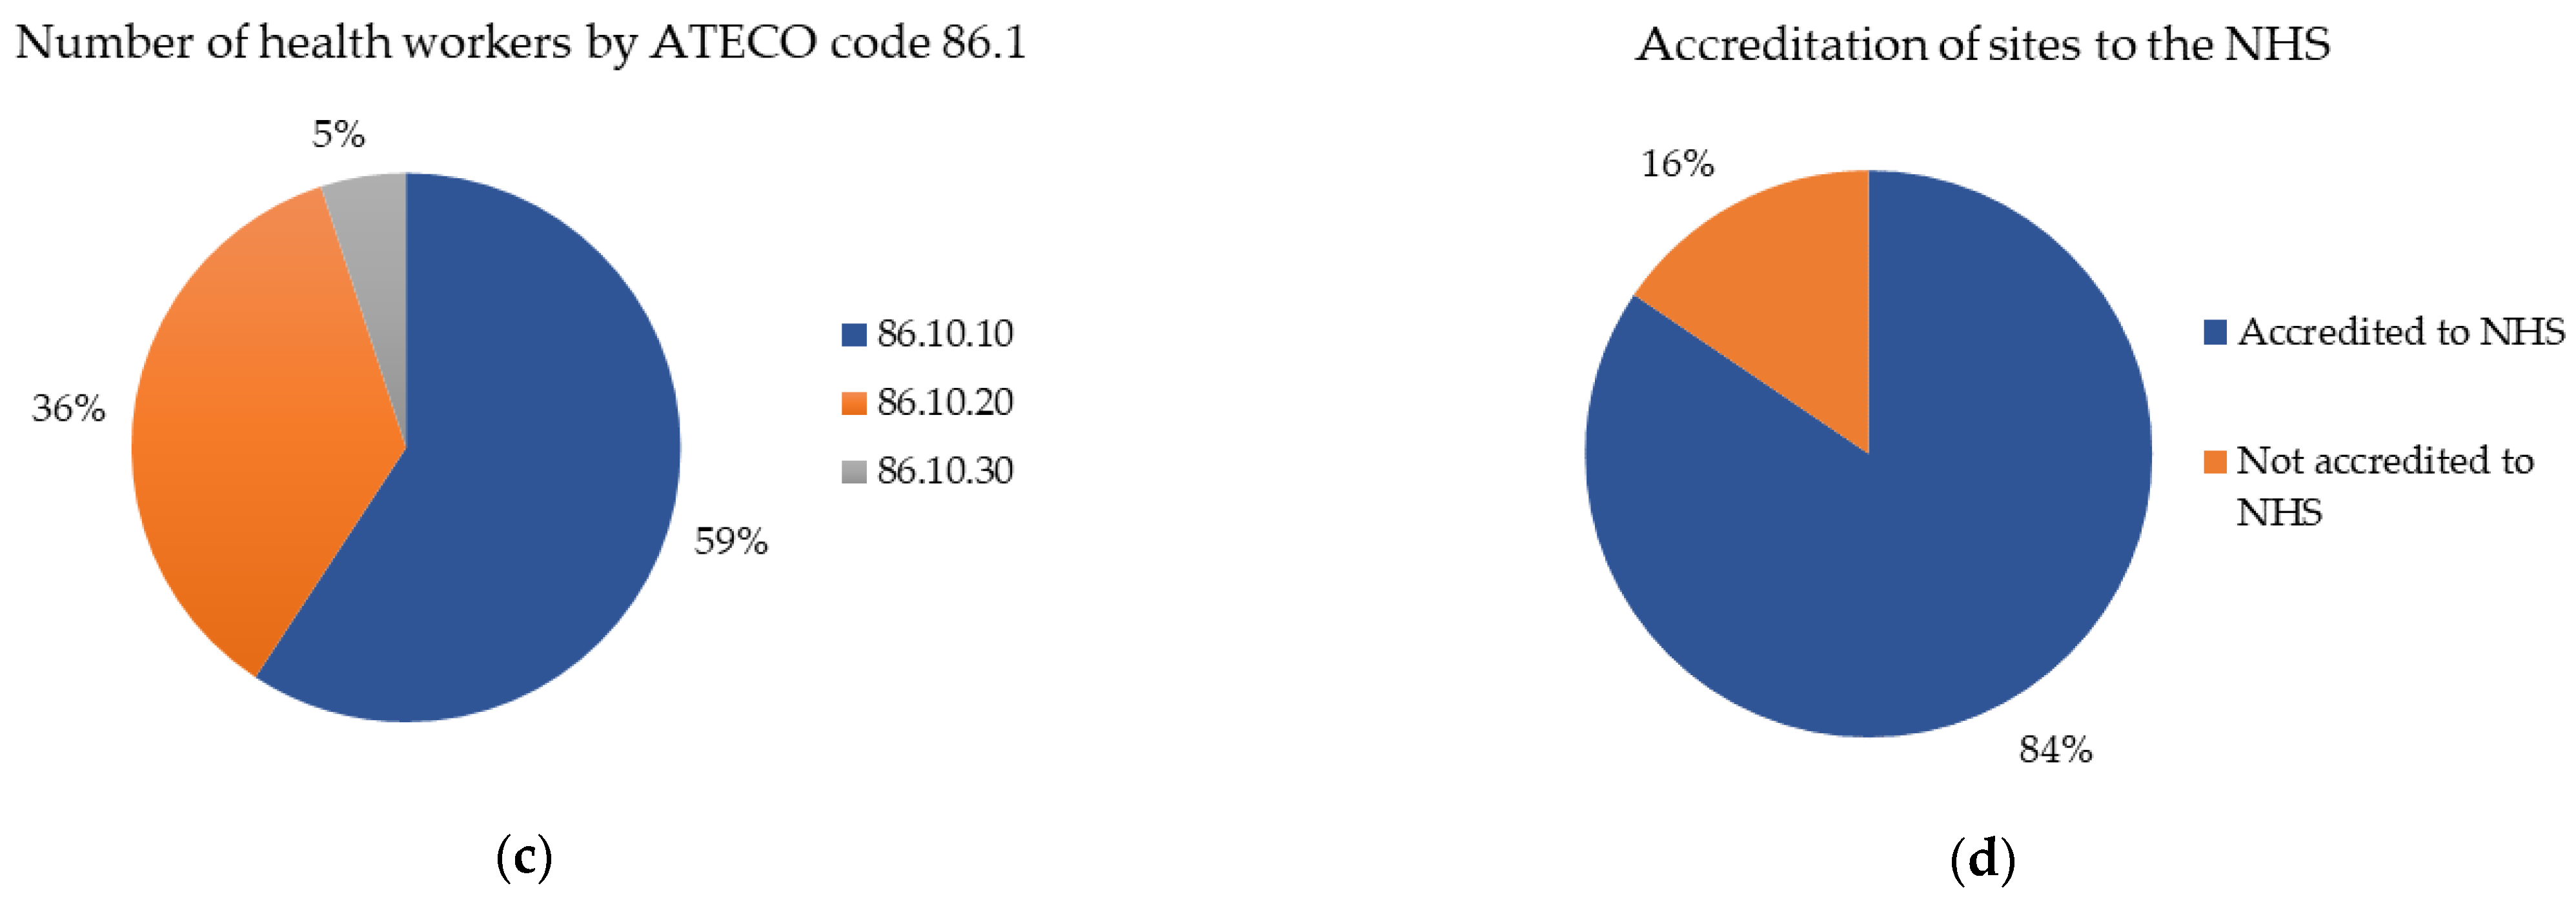
2.1. Data Collection and Preprocessing
- Data of the site, or the identification of the same, the name, the city, the VAT number, the NACE code of belonging and the accreditation or not to the National Health Service (NHS);
- General details of the structure, i.e., the covered area, the health workers, the beds, and the presence or absence of the swimming pool;
- Overall consumption of electricity, heating, and cooling relating to each site;
- Consumption and data relating to two macro-areas into which it is possible to divide a hospital structure, a part for hospitalizations, and a part for diagnosis and therapy.
2.2. Data Analysis
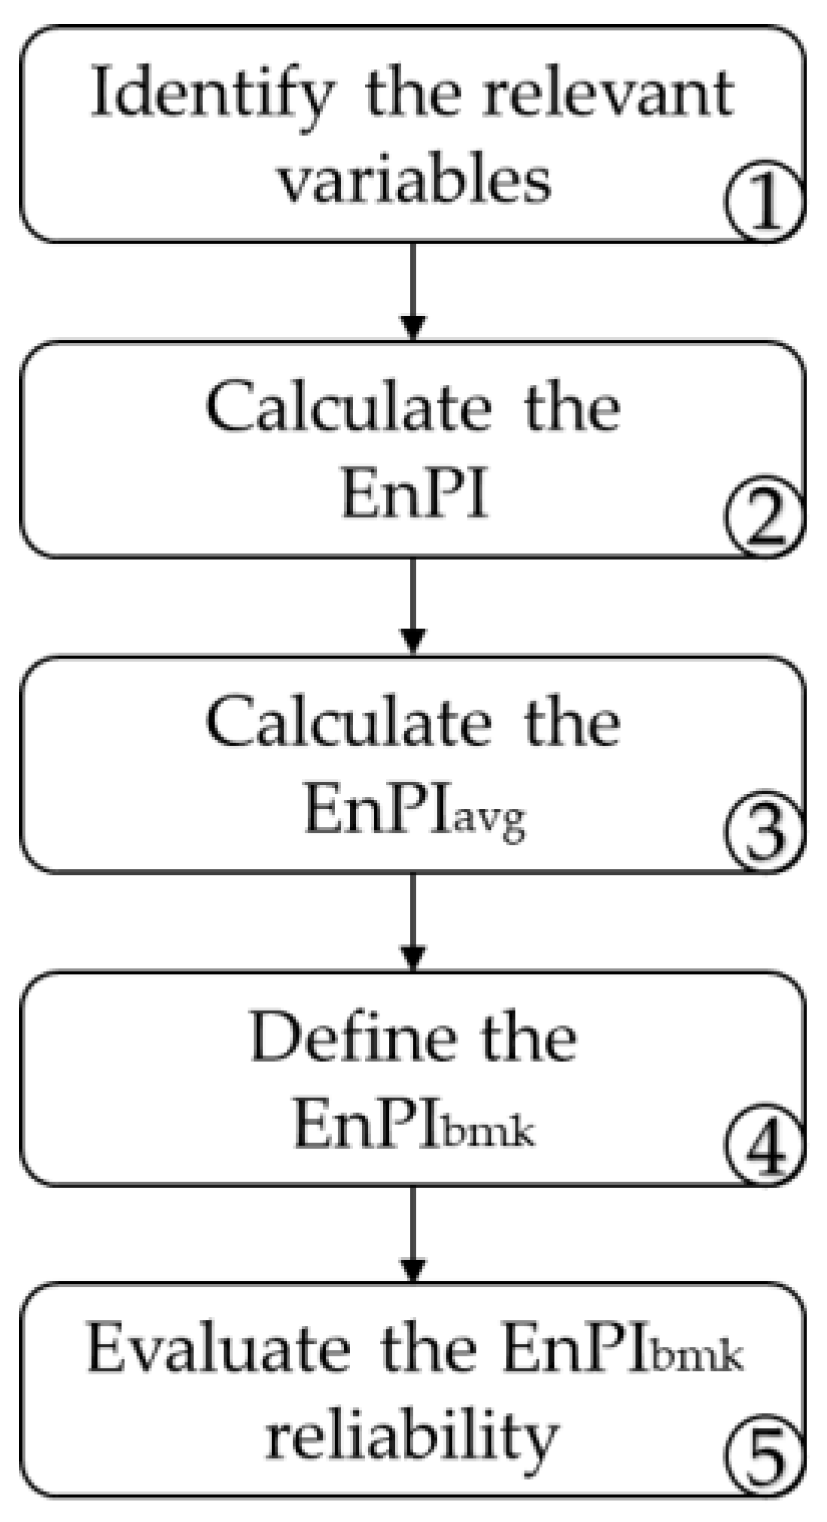
2.2.1. ENEA Methodology
- Identification of the relevant variables;
- Calculation of the energy performance indicators (EnPI) for each site;
- Calculation of the average energy performance indicators (EnPIavg);
- Definition of the EnPIbmk;
- Evaluation of the reliability of the EnPIbmk.
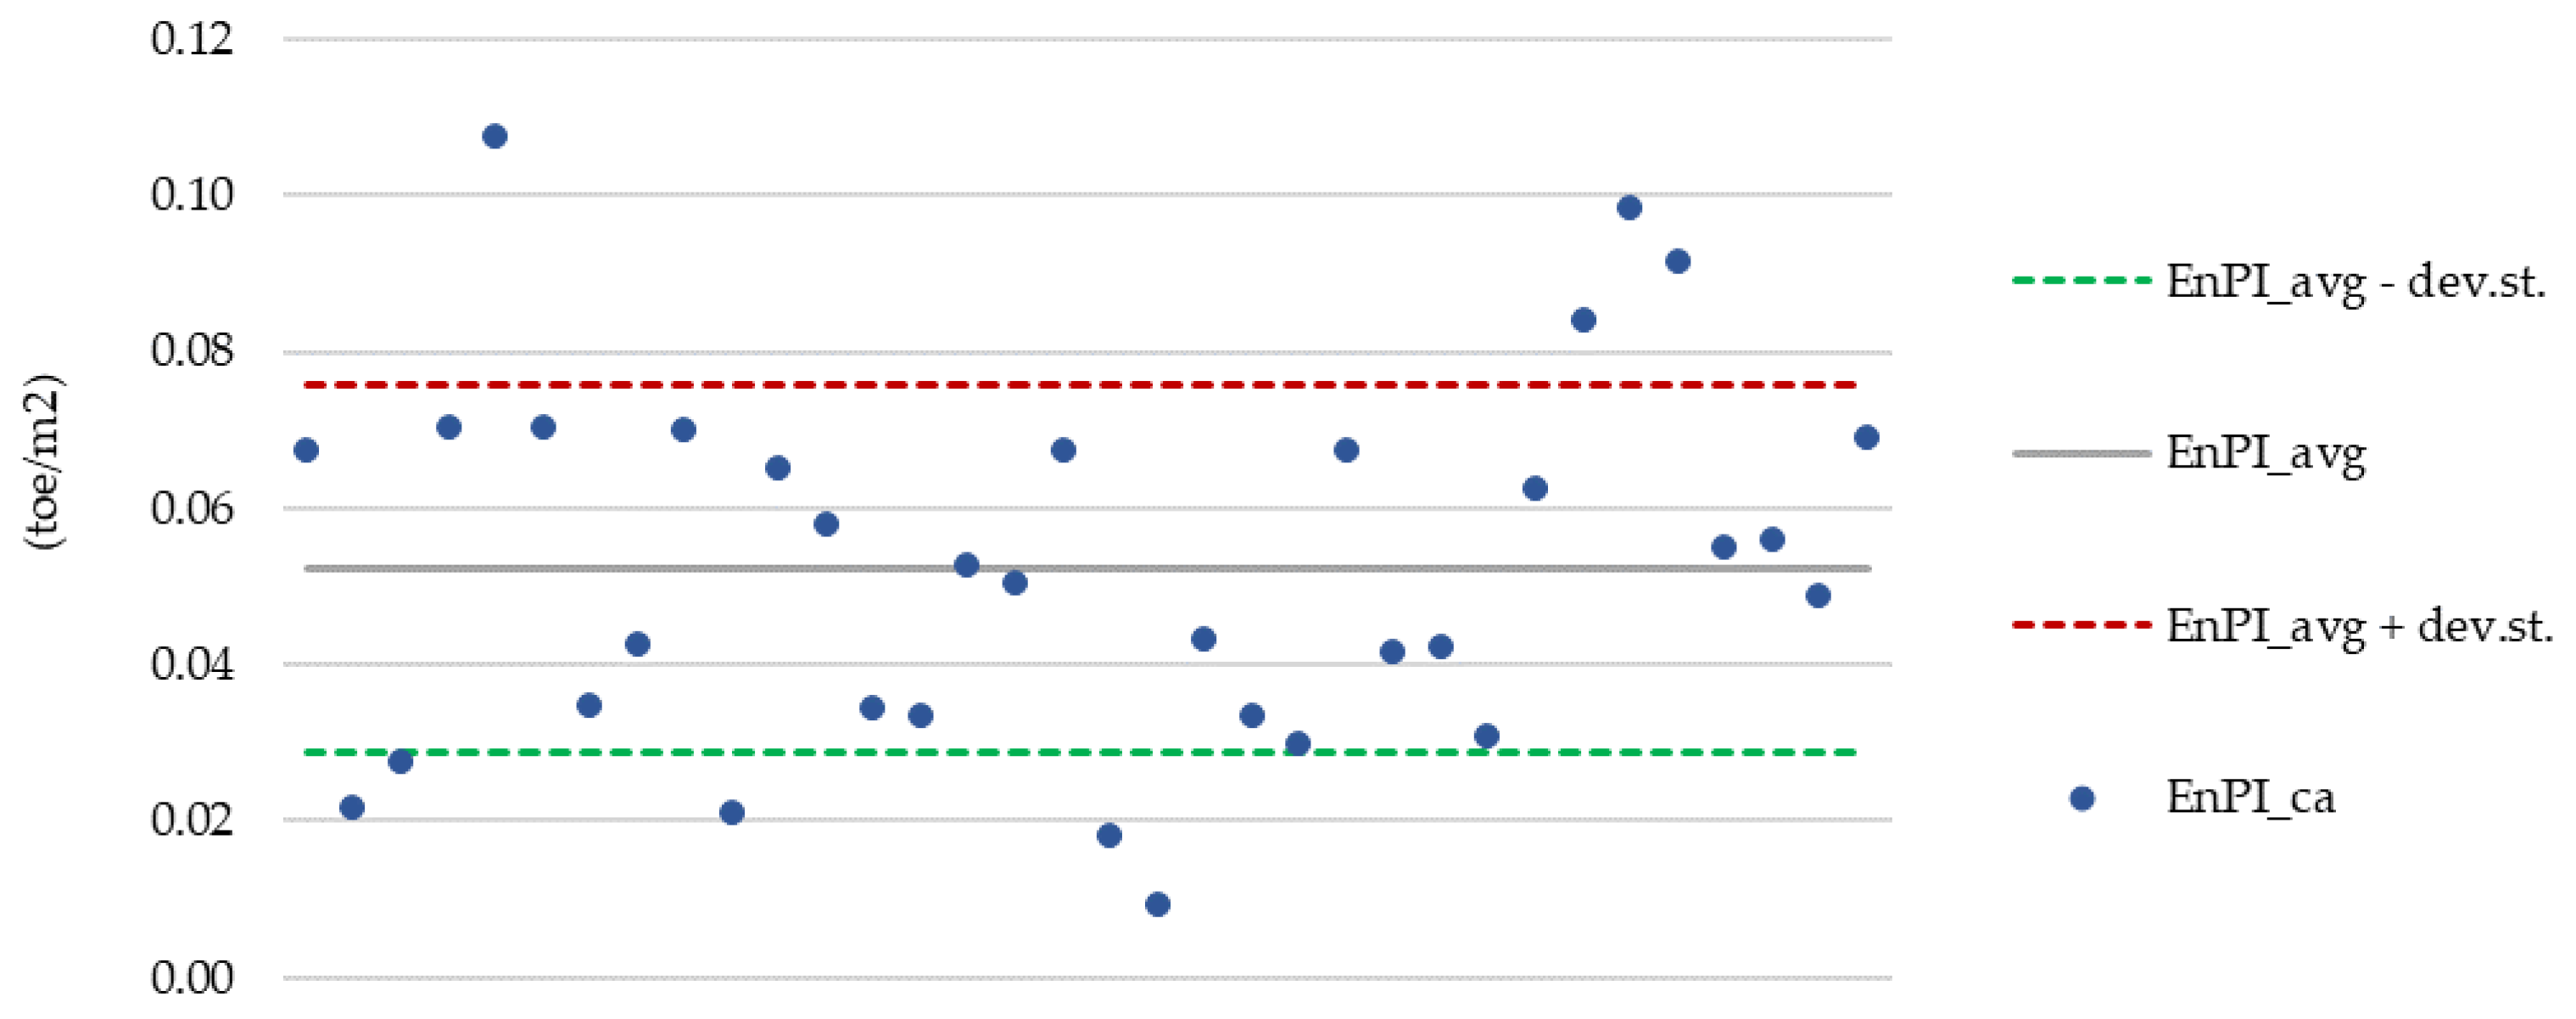
- “High” if the ratio is less than 20%;
- “Average” if the ratio is between 20% and 60%;
- “Low” if the ratio is greater than 60%.
2.2.2. EPA Methodology
3. Results
3.1. ENEA Results
3.1.1. Energy Performance Indicators: Generality of the Structure
- The covered area (ca) in square meters;
- The number of health workers (hw);
- The number of beds (b).
3.1.2. Energy Performance Indicators: Hospitalizations
3.1.3. Energy Performance Indicators: Diagnosis and Therapy
3.2. EPA Results
- Those belonging to the ATECO code 86.10.30;
- Those with a swimming pool inside.
- Health workers per square meter (employee/m2);
- Beds per square meter (bed/m2);
- Heating degree days (°C);
- Cooling degree days (°C).
4. Discussion
5. Conclusions
Author Contributions
Funding
Institutional Review Board Statement
Informed Consent Statement
Data Availability Statement
Conflicts of Interest
References
- Grassi, W.; Testi, D.; Menchetti, E.; Della Vista, D.; Bandini, M.; Niccoli, L.; Grassini, G.L.; Fasano, G. Valutazione dei Consumi nell’edilizia Esistente e Benchmark Mediante Codici Semplificati: Analisi di Edifici Ospedalieri. Available online: https://www.enea.it/it/Ricerca_sviluppo/documenti/ricerca-di-sistema-elettrico/governance/rse117.pdf (accessed on 8 November 2021).
- Mori, A.; Lavinia, C. Caratterizzazione Energetica Delle Strutture Sanitarie del Mezzoggiorno d’Italia. 2015. Available online: https://iris.enea.it/handle/20.500.12079/6728 (accessed on 8 November 2021).
- Mori, A.; Martini, S.; Muzi, G. Energetic Characterization of the “G. Brotzu” Hospital Enterprise, San Michele Hospital in Cagliari, According to the Programme Agreement with the Italian Ministry of Economic Development. Energ. Ambiente E Innov. 2010, 5, 72–86. [Google Scholar]
- García-Sanz-Calcedo, J.; López-Rodríguez, F.; Cuadros, F. Quantitative Analysis on Energy Efficiency of Health Centers According to Their Size. Energy Build. 2014, 73, 7–12. [Google Scholar] [CrossRef]
- Christiansen, N.; Kaltschmitt, M.; Dzukowski, F. Electrical Energy Consumption and Utilization Time Analysis of Hospital Departments and Large Scale Medical Equipment. Energy Build. 2016, 131, 172–183. [Google Scholar] [CrossRef]
- García-Sanz-Calcedo, J.; Gómez-Chaparro, M.; Sanchez-Barroso, G. Electrical and Thermal Energy in Private Hospitals: Consumption Indicators Focused on Healthcare Activity. Sustain. Cities Soc. 2019, 47, 101482. [Google Scholar] [CrossRef]
- Sheppy, M.; Pless, S.; Kung, F. Healthcare Energy End-Use Monitoring; National Renewable Energy Lab: Golden, CO, USA, 2014.
- Borges de Oliveira, K.; dos Santos, E.F.; Neto, A.F.; de Mello Santos, V.H.; de Oliveira, O.J. Guidelines for Efficient and Sustainable Energy Management in Hospital Buildings. J. Clean. Prod. 2021, 11, 129644. [Google Scholar] [CrossRef]
- Seifert, C.; Damert, M.; Guenther, E. Environmental Management in German Hospitals—A Classification of Approaches. Sustainability 2020, 12, 4428. [Google Scholar] [CrossRef]
- Ji, R.; Qu, S. Investigation and Evaluation of Energy Consumption Performance for Hospital Buildings in China. Sustainability 2019, 11, 1724. [Google Scholar] [CrossRef] [Green Version]
- Bawaneh, K.; Ghazi Nezami, F.; Rasheduzzaman, M.; Deken, B. Energy Consumption Analysis and Characterization of Healthcare Facilities in the United States. Energies 2019, 12, 3775. [Google Scholar] [CrossRef] [Green Version]
- Chung, M.; Park, H.-C. Comparison of Building Energy Demand for Hotels, Hospitals, and Offices in Korea. Energy 2015, 92, 383–393. [Google Scholar] [CrossRef]
- UNI CEI EN 16231: 2012; Energy Efficiency Benchmarking Methodology; European Committee for Standardization: Brussels, Belgium, 2012.
- Dahlan, N.Y.; Mohamed, H.; Kamaluddin, K.A.; Abd Rahman, N.M.; Reimann, G.; Chia, J.; Ilham, N.I. Energy Star Based Benchmarking Model for Malaysian Government Hospitals—A Qualitative and Quantitative Approach to Assess Energy Performances. J. Build. Eng. 2022, 45, 103460. [Google Scholar] [CrossRef]
- González González, A.; García-Sanz-Calcedo, J.; Rodríguez Salgado, D. Evaluation of Energy Consumption in German Hospitals: Benchmarking in the Public Sector. Energies 2018, 11, 2279. [Google Scholar] [CrossRef] [Green Version]
- Singer, B.C. Hospital Energy Benchmarking Guidance—Version 1.0; Lawrence Berkeley National Lab. (LBNL): Berkeley, CA, USA, 2009. [Google Scholar] [CrossRef] [Green Version]
- Hwang, D.K.; Cho, J.; Moon, J. Moon Feasibility Study on Energy Audit and Data Driven Analysis Procedure for Building Energy Efficiency: Bench-Marking in Korean Hospital Buildings. Energies 2019, 12, 3006. [Google Scholar] [CrossRef] [Green Version]
- Kim, D.W.; Kim, Y.M.; Lee, S.E. Development of an Energy Benchmarking Database Based on Cost-Effective Energy Performance Indicators: Case Study on Public Buildings in South Korea. Energy Build. 2019, 191, 104–116. [Google Scholar] [CrossRef]
- Arjunan, P.; Poolla, K.; Miller, C. EnergyStar++: Towards More Accurate and Explanatory Building Energy Benchmarking. Appl. Energy 2020, 276, 115413. [Google Scholar] [CrossRef]
- Ma, H.; Du, N.; Yu, S.; Lu, W.; Zhang, Z.; Deng, N.; Li, C. Analysis of Typical Public Building Energy Consumption in Northern China. Energy Build. 2017, 136, 139–150. [Google Scholar] [CrossRef]
- de Oliveira Veloso, A.C.; Gonçalves de Souza, R.V.; dos Santos, F.N. Energy Benchmarking for Office Building Towers in Mild Temperate Climate. Energy Build. 2020, 222, 110059. [Google Scholar] [CrossRef]
- Shang, L.; Lee, H.W.; Dermisi, S.; Choe, Y. Impact of Energy Benchmarking and Disclosure Policy on Office Buildings. J. Clean. Prod. 2020, 250, 119500. [Google Scholar] [CrossRef]
- Estrella Guillén, E.; Samuelson, H.W.; Cedeño Laurent, J.G. Comparing Energy and Comfort Metrics for Building Benchmarking. Energy Build. 2019, 205, 109539. [Google Scholar] [CrossRef]
- Benchmarking and Building Performance Standards Policy Toolkit. Available online: https://www.epa.gov/statelocalenergy/benchmarking-and-building-performance-standards-policy-toolkit (accessed on 8 November 2021).
- Bruni, G.; De Santis, A.; Herce, C.; Leto, L.; Martini, C.; Martini, F.; Salvio, M.; Tocchetti, F.A.; Toro, C. From Energy Audit to Energy Performance Indicators (EnPI): A Methodology to Characterize Productive Sectors. The Italian Cement Industry Case Study. Energies 2021, 14, 8436. [Google Scholar] [CrossRef]
- Degree Days Calculation. Available online: https://www.degreedays.net (accessed on 8 November 2021).
- ENEA; Assoimmobiliare Benchmark Di Consumo Energetico Degli Edifici per Uffici in Italia. 2021. Available online: https://www.enea.it/it/Stampa/File/Rapporto_BenchmarkConsumiUffici_EneaAssoimmobiliare_2019.pdf (accessed on 8 November 2021).
- EN ISO 50001:2018; Energy Management Systems—Requirements with Guidance for Use; ISO: Geneva, Switzerland, 2018.
- ENERGY STAR Score for Hospitals (General Medical and Surgical). Available online: https://www.energystar.gov/buildings/tools-and-resources/energy-star-score-hospitals-general-medical-and-surgical (accessed on 8 November 2021).


| ATECO Code | Description | Number of Audits |
|---|---|---|
| 86.10.10 | General hospitals and nursing homes | 89 |
| 86.10.20 | Specialist hospitals and nursing homes | 47 |
| 86.10.30 | Institutes, clinics, and university polyclinics | 9 |
| 86.10.40 | Hospitals and long-term nursing homes | 0 |
| Sample Sites | EnPIbmk | EnPIavg ± st.dev | Reliability |
|---|---|---|---|
| ATECO 86.10.10 | EnPIbmk_ca (toe/m2) | 0.052 ± 0.023 | Average |
| EnPIbmk_hw (toe/health worker) | 2.101 ± 0.950 | Average | |
| EnPIbmk_b (toe/bed) | 4.275 ± 2.593 | Low | |
| ATECO 86.10.20 | EnPIbmk_ca (toe/m2) | 0.050 ± 0.031 | Low |
| EnPIbmk_hw (toe/health worker) | 2.278 ± 0.875 | Average | |
| EnPIbmk_b (toe/bed) | 7.268 ± 7.453 | Low | |
| ATECO 86.10.10 accredited to NHS | EnPIbmk_ca (toe/m2) | 0.049 ± 0.023 | Average |
| EnPIbmk_hw (toe/health worker) | 1.959 ± 0.902 | Average | |
| EnPIbmk_b (toe/bed) | 3.738 ± 2.010 | Average | |
| ATECO 86.10.20 accredited to NHS | EnPIbmk_ca (toe/m2) | 0.057 ± 0.030 | Average |
| EnPIbmk_hw (toe/health worker) | 2.426 ± 0.867 | Average | |
| EnPIbmk_b (toe/bed) | 8.546 ± 7.711 | Low |
| Hospital Ward | Reliability EnPIbmk_dh | Reliability EnPIbmk_sh |
|---|---|---|
| Overall areas of hospitalization (ward present in 24 sites) | Low | Average EnPIbmk_sh (toe/m2) = 0.042 ± 0.021 |
| Intensive care (ward present in 12 sites) | Low | Low |
| Day surgery (ward present in 10 sites) | Low | Average EnPIbmk_sh (toe/m2) = 0.051 ± 0.021 |
| Dialysis (ward present in 2 sites) | - | - |
| Gyms and rehabilitation (ward present in 12 sites) | Low | Low |
| Hospital Ward | Reliability EnPIbmk_ns | Reliability EnPIbmk_ss |
|---|---|---|
| Operating block (activity provided by 23 sites) | Low | Low |
| Sterilization (activity provided by 12 sites) | Low | Low |
| Radiology and diagnostic imaging (activity provided by 27 sites) | Low | Low |
| First aid (activity provided by 10 sites) | Low | Low |
| Functional and endoscopic examinations (activity provided by 25 sites) | Low | Low |
| Transfusion center (activity provided by 4 sites) | Low | Low |
| Laboratory diagnostics (activity provided by 19 sites) | Low | Low |
| Variable | Results | |
|---|---|---|
| Dependent variable | Energy use intensity | |
| Observations | 38 | |
| R2 | 0.5108 | |
| Adjusted R2 | 0.4677 | |
| Standard error | 0.0188 | |
| Coefficients | Significance | |
| Intercept | 0.06965 | 0.00004 |
| Health workers per square meter | 1.47221 | 0.00000 |
| Beds per square meter | −2.70713 | 0.00409 |
| Cooling degree days | −0.00015 | 0.02352 |
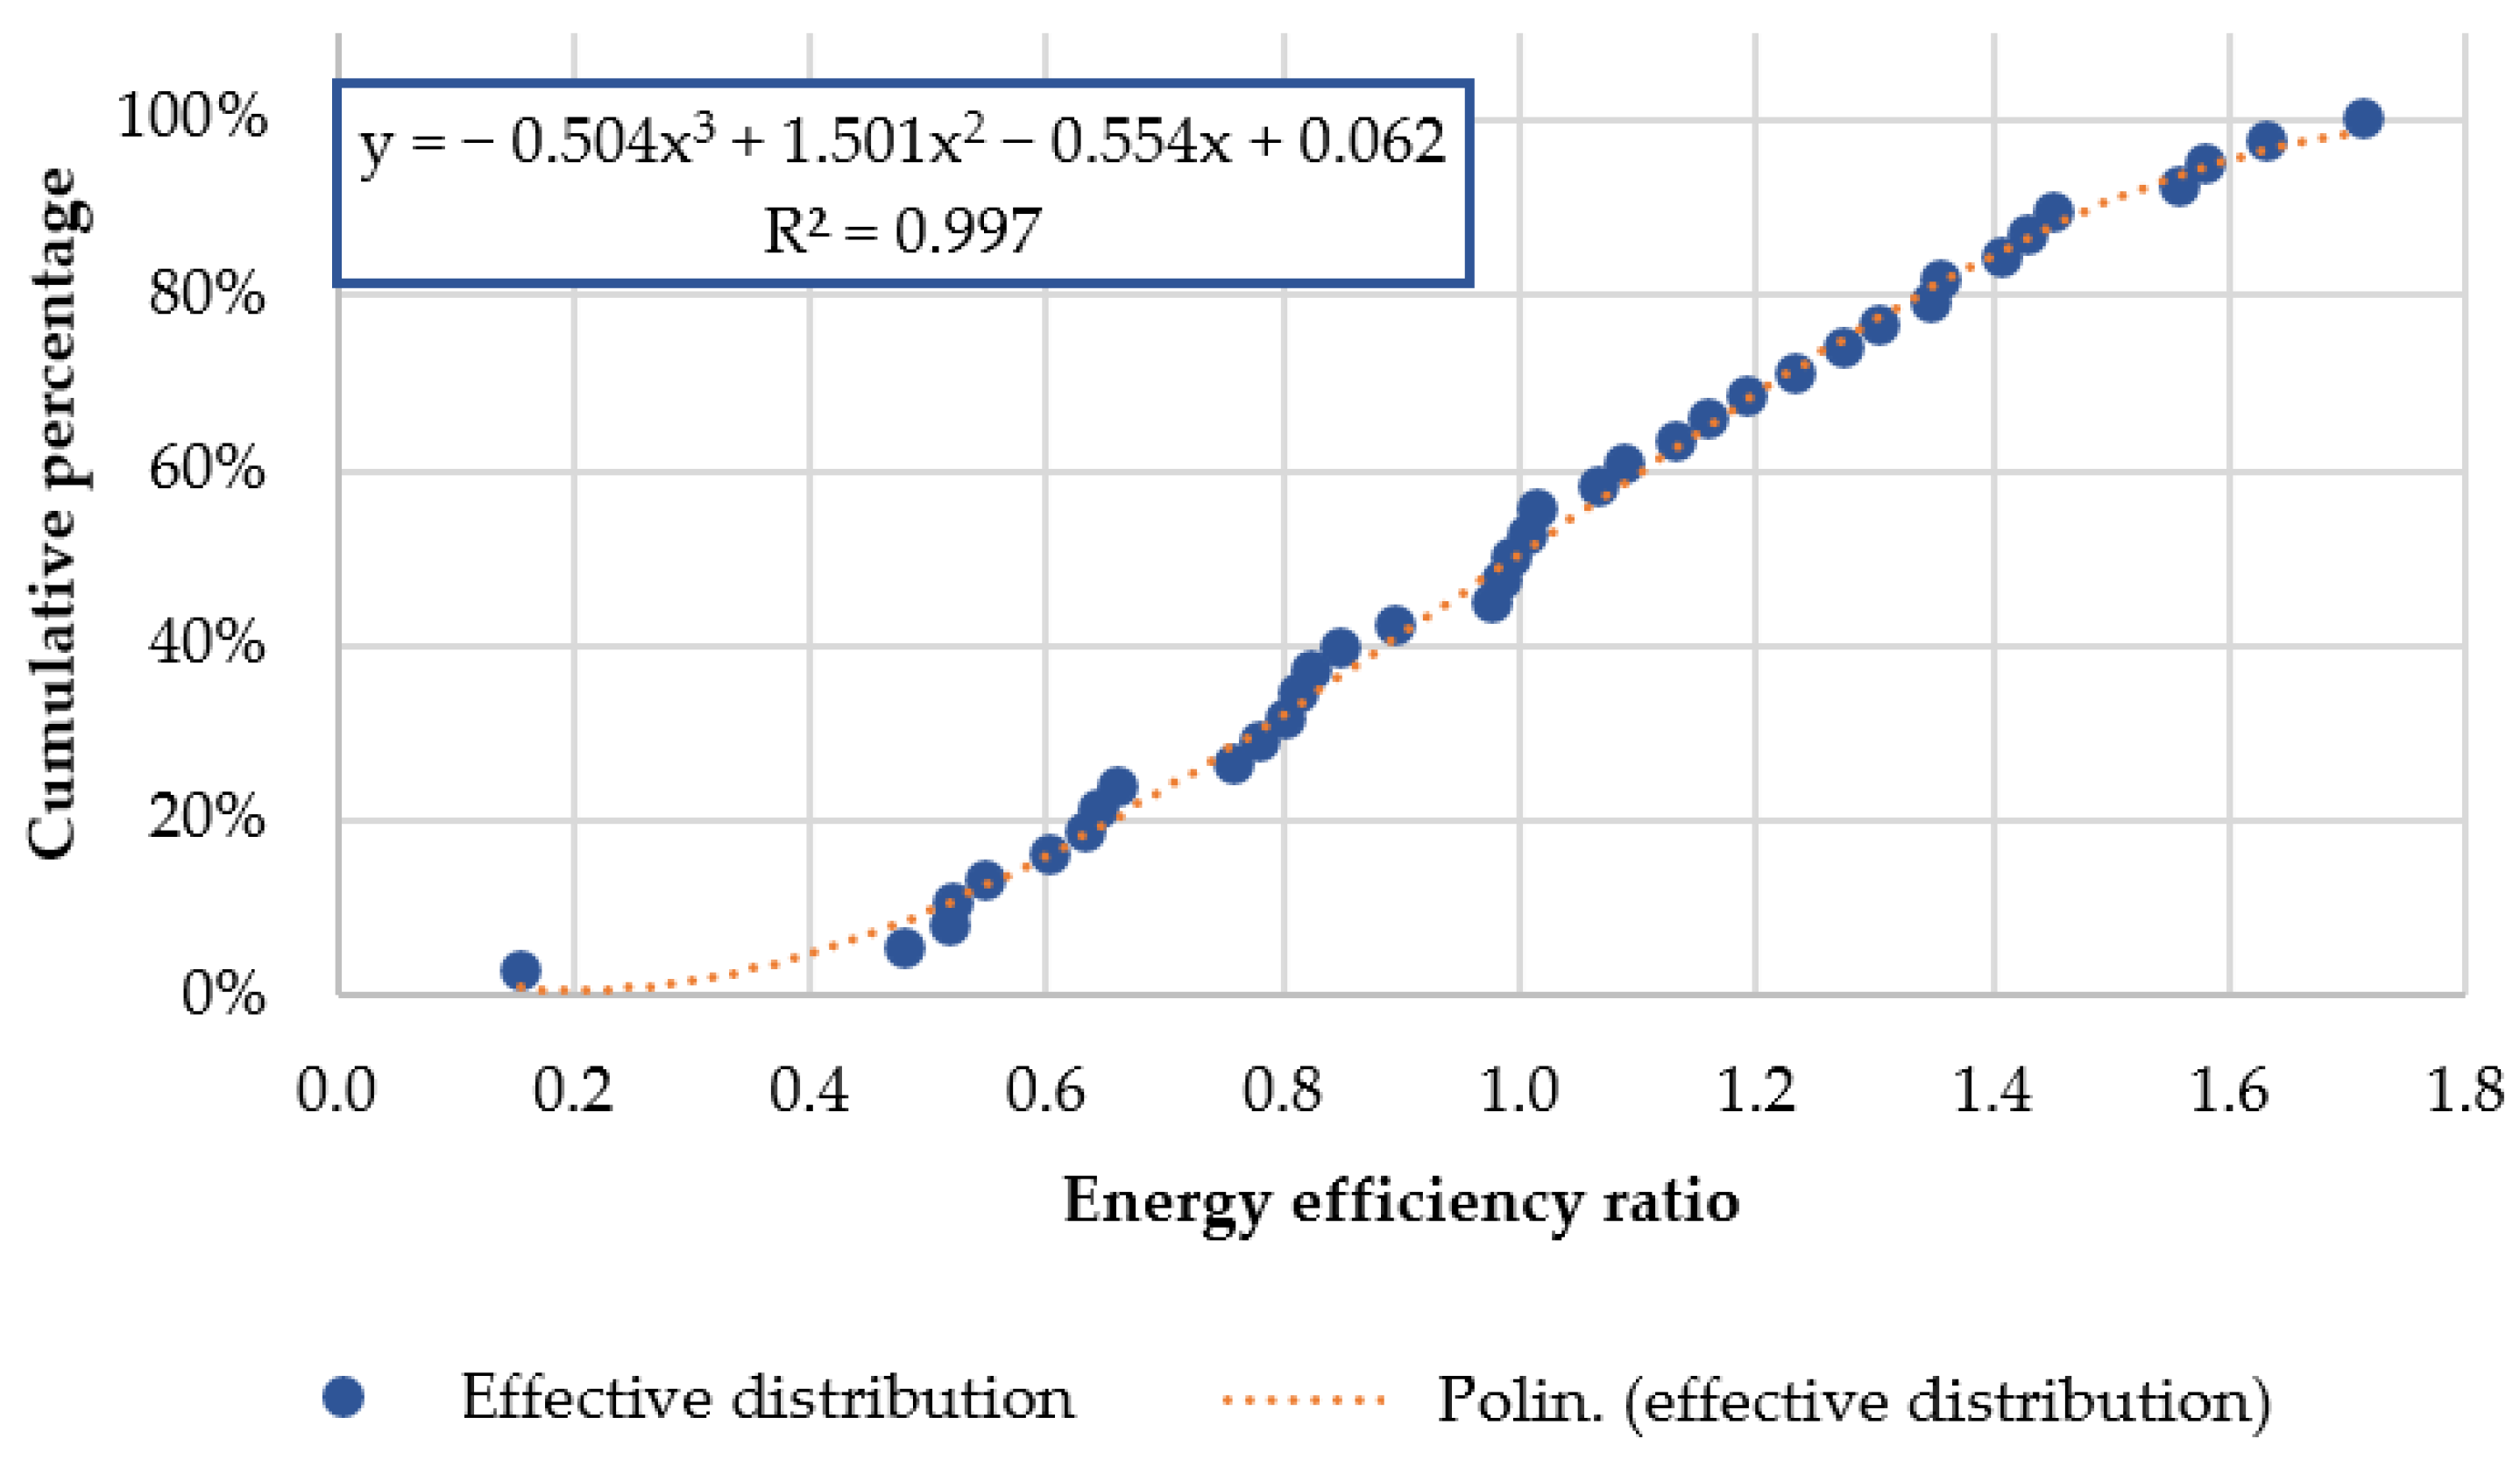
| Variable | Results | |
|---|---|---|
| Dependent variable | Cumulative percentage | |
| Observations | 38 | |
| R2 | 0.9965 | |
| Adjusted R2 | 0.9962 | |
| Standard error | 0.0180 | |
| Coefficients | Significance | |
| Intercept | 0.06177 | 0.04378 |
| Health workers per square meter | −0.55418 | 0.00001 |
| Beds per square meter | 1.50108 | 0.00000 |
| Cooling degree days | −0.50357 | 0.00000 |
| ENEA | EPA | ||
|---|---|---|---|
| ENEA methodology results | Results for structure A | EPA methodology results | Results for structure A |
| EnPIbmk_ca (toe/m2) = 0.049 ± 0.023 | EnPI_ca (toe/m2) = 0.042 | EUI predicted (toe/m2) = 0.065 | EUI actual (toe/m2) = 0.042 |
| EnPIbmk_hw (toe/health worker) = 1.959 ± 0.902 | EnPI_hw (toe/health worker) = 1.396 | EER = 0.63 | - |
| EnPIbmk_b (toe/bed) = 3.738 ± 2.010 | EnPI_b (toe/bed) = 5.641 | Cumulative percentage = 18% | - |
| ENEA | EPA | ||
|---|---|---|---|
| ENEA methodology results | Results for structure B | EPA methodology results | Results for structure B |
| EnPIbmk_ca (toe/m2) = 0.057 ± 0.030 | EnPI_ca (toe/m2) = 0.063 | EUI predicted (toe/m2) = 0.051 | EUI actual (toe/m2) = 0.063 |
| EnPIbmk_hw (toe/health worker) = 2.426 ± 0.867 | EnPI_hw (toe/health worker) = 3.231 | EER = 1.24 | - |
| EnPIbmk_b (toe/bed) = 8.546 ± 7.711 | EnPI_b (toe/bed) = 4.951 | Cumulative percentage = 72% | - |
Publisher’s Note: MDPI stays neutral with regard to jurisdictional claims in published maps and institutional affiliations. |
© 2022 by the authors. Licensee MDPI, Basel, Switzerland. This article is an open access article distributed under the terms and conditions of the Creative Commons Attribution (CC BY) license (https://creativecommons.org/licenses/by/4.0/).
Share and Cite
Dadi, D.; Introna, V.; Santolamazza, A.; Salvio, M.; Martini, C.; Pastura, T.; Martini, F. Private Hospital Energy Performance Benchmarking Using Energy Audit Data: An Italian Case Study. Energies 2022, 15, 806. https://0-doi-org.brum.beds.ac.uk/10.3390/en15030806
Dadi D, Introna V, Santolamazza A, Salvio M, Martini C, Pastura T, Martini F. Private Hospital Energy Performance Benchmarking Using Energy Audit Data: An Italian Case Study. Energies. 2022; 15(3):806. https://0-doi-org.brum.beds.ac.uk/10.3390/en15030806
Chicago/Turabian StyleDadi, Daniele, Vito Introna, Annalisa Santolamazza, Marcello Salvio, Chiara Martini, Tiberio Pastura, and Fabrizio Martini. 2022. "Private Hospital Energy Performance Benchmarking Using Energy Audit Data: An Italian Case Study" Energies 15, no. 3: 806. https://0-doi-org.brum.beds.ac.uk/10.3390/en15030806