Article

Home Energy Forecast Performance Tool for Smart Living Services Suppliers under an Energy 4.0 and CPS Framework

by
Filipe Martins Rodrigues
1,2,*,
Carlos Cardeira
2,
João M. F. Calado
1,2 and
Rui Melicio
2,3
1
Instituto Superior de Engenharia de Lisboa, Instituto Politécnico de Lisboa, Rua Conselheiro Emídio Navarro, 1959-007 Lisboa, Portugal
2
IDMEC, Instituto Superior Técnico, Universidade de Lisboa, Av. Rovisco Pais, 1049-001 Lisboa, Portugal
3
ICT, Universidade de Évora, Rua Romão Ramalho, 59, 7000-645 Évora, Portugal
*
Author to whom correspondence should be addressed.
Submission received: 17 October 2021 / Revised: 5 January 2022 / Accepted: 21 January 2022 / Published: 28 January 2022
(This article belongs to the Special Issue The Energy Consumption and Load Forecasting Challenges)

Abstract

:
Industry 4.0 is a paradigm consisting of cyber-physical systems based on the interconnection between all sorts of machines, sensors, and actuators, generally known as things. The combination of energy technology and information and technology communication (ICT) enables measurement, control, and automation to be performed across the distributed grid with high time resolution. Through digital revolution in the energy sector, the term Energy 4.0 emerges in the future electric sector. The growth outlook for appliance usage is increasing and the appearance of renewable energy sources on the electric grid requires strategies to control demand and peak loads. Potential feedback for energy performance is the use of smart meters in conjunction with smart energy management; well-designed applications will successfully inform, engage, empower, and motivate consumers. This paper presents several hands-on tools for load forecasting, comparing previous works and verifying which show the best energy forecasting performance in a smart monitoring system. Simulations were performed based on forecasting of the hours ahead of the load for several households. Special attention was given to the accuracy of the forecasting model for weekdays and weekends. The development of the proposed methods, based on artificial neural networks (ANN), provides more reliable forecasting for a few hours ahead and peak loads.

1. Introduction

The fourth industrial revolution has been labelled Industry 4.0, which is characterized by the widespread implementation of cyber–physical systems (CPS) applied to manufacturing processes. The brand name Industry 4.0 promoted the debate about the future of the industrial sector in Germany a few years ago. In the meantime, using this brand name, many research and development, industries, and policy measures have been started [1,2] with priority in the digital area. In addition, the level of instrumentation and interconnection is laying the infrastructure for the incorporation of more intelligence and cognitive computing.
Nowadays, Industry 4.0 considers Internet-of-Things (IoT) to develop and implement cyber–physical artefacts with the ability to communicate and work together in real-time with cloud-enabled services and humans. Furthermore, it brings together several technologies and security concerns that need to be addressed for providing products that are recurrent to the customers and market competition for the future of Industry 4.0 Interconnected Things (I4IT) [3]. Industry 4.0 intends to contribute to the strict integration of humans in services and manufacturing processes to promote continuous improvement and aim for activities that add value and prevent waste. This contribution to the current needs of economic sectors involves digitization and intelligence in service and manufacturing processes.
However, the smart networking potential and digitization depicts a potential to allow us to meet the requirements mentioned above and will thus constitute the keystone of future energy infrastructures [4].
The liberalization of energy markets introduced enhanced competitiveness of this economic sector and the growing use of renewable energy resources (RES) imposes greater complexity to the process of energy transition. Both energy transition and energy market liberalization complexities could be accommodated with the digitization and integration of the energy infrastructures to create an Internet of Energy (IoE). Energy 4.0 is leveraged by the digitization scope of Industry 4.0. It provides opportunities for the energy sector to establish new business models, sustainable energy production, and delivery strategies [5,6].
Energy is the key point for sustainable development, be it economic, social, or environmental [7]. Fossil fuel provides nearby 90% of the world energy supplies, and is particularly responsible for the carbon emissions causing local, regional, and global environmental concerns [8]. In the past decades, global energy consumption has highly increased [9]. Many energy consumption projections are observing that the expected global energy demand patterns, in the near future, are not sustainable [8]. It is foreseen that world energy consumption will grow by 65% before 2030 if the current global energy consumption pattern continues [9].
Decreasing the dependence on fossil fuels through the placement of renewable energy generation sources and improved approaches for electricity consumption management will decrease carbon emissions [10]. The fossil fuel dependency, its environmental negative impact, and energy price volatility, have encouraged and increased the adoption of enhanced approaches aiming at energy efficiency and improvements in electric power systems [11,12]. One of those observed changes is concerned with the deployment of decentralized local and microgeneration from RES [12]. The trend to use RES to address electricity generation is increasing, not only in remote localized communities [13]. Another change is the use of Smart Grids (SG) to add management, control, and communication capabilities to the energy delivery infrastructure to move electricity around it as efficiently and economically as possible [13]. Although SGs could solve many of the contemporary challenges, new control issues are emerging, namely, with the growing role of RES [13]. The SG enables interaction between the generation and load to optimally deliver energy based on the operation conditions [13]. Thus, the SG allows the coupling of volatile energy sources aiming to match supply and demand in real-time in the highly complex energy infrastructure.
For a prosperous future, based on sustainability from both the economic and secure environment points of view, it is crucial to adopt efficient energy management approaches able to assure the proper allocation of available resources. Thus, several new techniques to accurately forecast energy needs were reported in the last decade, contributing to efficient energy demand management [9]. One of those techniques is demand-side energy management (DSM), which was defined as the implementation of policies and measures so that energy consumption is controlled, regulated, and reduced [11]. The importance of demand-side energy management and individual load forecasting is becoming critical [14]. The DSM programs have reappeared, with the goal of reshaping demand based on generation [12]. The progression of power systems towards a more efficient and active grid foresees the optimization of electricity usage by actively controlling some controllable end-use load, as well as the maximization of the integration of RES [12]. However, this active role requires monitoring in real-time electric consumption, manageable demand, microgeneration, storage systems, and electricity prices to decide on-demand response actions, including buying/selling electricity [12]. On this basis, tailored products or services can be developed, such as demand-response programs, which award discounts to consumers allowing utilities to control their appliances. All of these concerns must be addressed in order to automatically reproduce consumers’ decisions by combining various inputs and aiming to meet various preferences without compromizing the comfort and quality of energy services provided [12]. The challenges allied with the decision and consumer satisfaction goes through access to information on the evolution of consumption in real time. In [3], architecture is proposed that offers added value services for enabling Smart Home and Smart Living under an Industry 4.0 paradigm.
One of the ongoing promising solutions is Smart Home Energy Management (SHEM) [11]. However, this application needs measurement and communication between home appliances, households and utilities that are supported by advanced metering infrastructure (AMI) technology [15]. A SHEM is a major component of a smart home that enables the homeowner, the utility, and others, to monitor, manage and store energy. Information about load profiles and energy consumption usage patterns can be acquired by a smart meter (SM). This information can subsequently be utilized to improve individual-level prediction accuracy or to assist utilities in developing demand response operations and structuring tariff structures [15].
Most of the household energy supplied is not necessary and the consumer aims to reduce the energy bill, while the utility is to shave the load peak [12]. The challenges related to SHEM and possible solutions are energy factors that contribute to a consumer’s electricity bill. One of these issues relies on the load models needed for solving related scheduling optimization problems. To develop a SHEM system, it is important to typify correctly the demand and loads of the residential sector according to the standard use of the appliance, working regimes, technical restrictions and level of control degree. Despite the fact that power usage is variable, home consumers have a common portfolio of appliances, making it easy to establish a resemblance [12]. This paper is based on previous works, namely [16,17,18], where the authors looked to answer the challenges of energy consumption forecasting and peak load in the next hour ahead. The tools proposed by the authors use the historical databases of hourly power consumption from previous weeks, model development, and predictive algorithms based on the artificial neural networks (ANN), Fourier series (SF), and generalized reduced gradient (GRG). It is possible to generate a model of electrical energy for each household from the knowledge of its curve and load profile [16,17]. Tools for providing an accurate short-term load forecast (STLF) will enhance the quality of the DSM and SG performance.
In these articles, the following techniques were compared: Fourier series, generalized reduced gradient and artificial neural networks. All techniques were compared and result in the favour of the ANNs that were able to cope with the non-linear natural of the load estimation process.
The final goal of this work is the development of a tool to be implemented in an energy management system for forecasting demand and for controlling domestic energy resources in a SG scenario. It aims to develop a tool capable of contributing to the scheduling of appliances, and provide minimizing costs without changing the level of comfort and safety, knowing the load profile curve of the power electricity consumption of each family house can be developed into a model for optimizing the electrical energy to be implemented in a smart device.
This paper is organized as follows: Section 2 presents the state of the art. Section 3 describes the methodology used in the paper: artificial neural network approaches. Section 4 presents case studies and results. Finally, concluding remarks are given in Section 5.

2. State of the Art Research

Over the next few decades, digitization will be a powerful driver and will be the new fresh wave of innovation for all communities. Digitization is the networking of people and things by combining real and virtual worlds [19].
Nowadays, it is a consensus that electrical load forecasting assisted by the artificial intelligence method plays a vital role in the effective success of the SG [20,21]. One of these digitalization opportunities is in performing and improving STLF [22].
As mentioned in the introduction section, there will be an exceptional increase in the complexity of our energy system. The current methods that are used will be unable to manage this unprecedented energy system complexity [4]. Currently, the electricity infrastructure is not designed to handle the volatile supply of electricity from RES. In the future, wind and solar power will increasingly be incorporated into the grid [4].
Coordinated cooperation between all key players and a strict control system will make it possible to take full advantage of the opportunities provided by digitization, and at the same time, meet the policy goals of countries’ energy transition [4,19]. The digitization and the potential provided by smart networking, such as SG, IoT or Internet-of-People (IoP), will represent a major inflexion point for future energy systems and provide an opportunity to address these challenges [4]. The process of digitization is already taking place at a fast pace. Digitization is having a great impact on the various scientific, economic and social sectors, namely in social structures and work [4,19]. SGs reply in real time to react and deal with variations in wind and solar radiation conditions, to combine both industrial generating facilities and private consumers. The measurement, control, and automation of the distribution network ensured by the integration of energy technology, information, and communication technology (ICT) can be carried out with high granularity [4,19]. Digitization and power system integration can solve the complexity of the energy transition by creating an IoE [4,19]. Additionally, the implementation of new distribution and service models arises from the wide implementation of ICT. They can help by providing incentives for people to improve their energy use habits [4,19]. The result is an IoE in which electricity producers and distributors, storage facilities, and consumers may independently control and improve both their operations [4]. This will be required to define resources for the optimization of a truthful migration and an integration of the existing infrastructure. The success of the energy transition depends on the adequate supply of technological, social, and business innovations [4,19].
SGs are an absolute requirement and are not just an additional option. There has been a significant amount of research in SG and AMI areas over the last decade. One of the important research areas is studying several methods and forecasting household electricity load techniques for using smart meter data [15]. It begins with a set of time-series analyses and is extended today to the recent machine learning approaches, mostly centred on aggregate electricity consumption.
The prediction of the hourly load, carried out for the next hour, next day, or next week ahead, is usually mentioned as STLF [16,17,18]. STLF plays an important role in the operation of power systems and is intended to forecast system load over a short time interval in a wide range of time leads [23]. Over the last decades, attention has been dedicated to modelling STLF with artificial neural networks (ANN) [24]. ANN is a well-established machine learning technique that has been successfully applied to a large set of daily life problems, such as stock market forecasting, weather forecast, and energy consumption forecasting [25]. The ANNs provide solutions based on used previously accumulated data [16,17,18].
The main reason for ANNs becoming so widespread lies in their ability to learn difficult-to-model complex relationships [24]. Techniques and ideas for executing or improving STLF abound in the technical literature [26]. Several innovative strategies for energy demand forecasting models have been utilized in recent decades to correctly anticipate future energy needs [26,27].
In addition to ANNs, other machine learning models used for STLF are the support vector regression (SVR), least squares support vector regression (LS-SVR), regression trees (RT), and fuzzy logic (FL). In forecasting problems, probabilistic models, such as the Markov process, or time series models, such as the autoregressive integrated moving average (ARIMA), have also been used [15]. One of the newest techniques on load forecasting models is deep learning (DP), which is a new extension of ANNs and already provided results in residential load forecasting. This technique has caught the research community’s attention due to its ability to use large amounts of data [15]. Lately, the progress and use of the IoT produce a huge amount of data that enable the adoption of the deep neural network (DNN) in diverse research fields [14]. In [14] ANN forecasting models for daily and yearly loads are trained by individual customers’ electricity consumption data and regional meteorological elements. They use a large amount of data, several hidden layers (#4), and neurons (#150) in each layer.
It is known that STLF is influenced by many factors, such as the weather, the development of the economy, social events (e.g., soccer finals, upcoming concerts, novel last ending, etc.), weekdays, weekends, and days off. The past load daily and weekly collected, the weather data and the calendar are the most widely used factors in load prediction. It is difficult to establish a model that has a relationship between the loads and the variables that influence the loads, such as working days, weekends or holiday activities, weather parameters or seasonal variations, etc., as STLF is mainly affected by several factors [24,28,29,30].
These are the main factors that make the modelling process so difficult. However, several methods for load forecast modelling have been reported in the last decades [15,31]. Another challenge is estimating model parameters, which are based on historical data that may be out of date or do not indicate short-term load patterns changes [24].
However, forecasting at the aggregate level is a relatively easier task due to smoother load profiles [30]. On the other hand, residential load forecasting (stand-alone level) is a more challenging task. Household demand changes quickly as domestic appliances are turned on and off. The contribution of daily, weekly, and annual cycle effects in the corresponding time series data and variations on load caused by the random usage of appliances by end-users is a challenge for the STLF [30,31,32].
More precise information about the household, such as occupancy level, house size, and the quantity of appliances, is considered in [32] to strengthen the input set and enable more extensive interpretations of the results. They also come to the conclusion that, while there may be a significant number of such characteristics, the key challenge is determining the best candidates (features) for an input set without increasing forecasting computing costs.
In [17,33], a method based on electric appliances and occupancy patterns is presented. Inputs are the area, number of inhabitants, appliances (kitchen, entertainment), cooling, lighting, heating, and hot water. In [16,18,34,35] ANNs and a Boolean metering system are used as forecast techniques to model hourly energy consumption and load profile.
Therefore, it is necessary to deepen these research works and improve energy load forecasting tools for the next hour ahead that can be used in SHEM or “energy box”, particularly on weekdays and weekends.
Following this challenge, this paper presents an implementation of an ANN-based several-hour-ahead load curve forecasting. The models proposed have used residential historical load databases of the hourly electric load from previous weeks (6 to 8 weeks) at the same season. The proposed forecasting models for several hours ahead can provide reasonable outputs, considering that they did not use temperature, other weather data, or more detailed information about the household. The tool described above can be put into smart devices as SM and the needed data can be downloaded in real time by CPS.

3. Methodology

3.1. Artificial Neural Network Approach

The load forecast is based on actual past loads collected from households [24]. Historical data demonstrate a STLF correlation between the total power demand and household behavior, such as day of the week or special days. The relationships between the load and these factors are difficult to define, although, within the same season load behavior of the current week is similar to the previous week or even weeks [36]. This statement will be tested and evaluated in our line of research with the application of AI techniques.
In this study, ANNs were used to find the relationships between the load and selected factors because ANNs can decipher complex non-linear relations. In the forecasting methods applied, ANNs employed all the days data were available in the database to learn the trend of the energy consumption pattern of each household. However, learning all the days of data is not a simple task for a STLF. In this work, ANNs for several hour ahead load forecasting are used [16,18]. The multi-layer perceptron (MLP) network architecture and learning algorithms were selected as described in [16,18,37] to achieve the desired performance for the forecasting model evaluated. The ANN proposed has three layers in a feedforward configuration. Each layer has a feedforward full connection. Inputs to the ANNs are the previous hourly loads taken from the historical household electric energy consumption data and applied an encoding approach for these hourly loads. In the present case, ANNs are being trained and tested using electric energy consumption data obtained from historically taken direct measurements in the households, from the database in [16,18,37]. In the hidden layer, the number of neurons was implemented by a procedure to identify the required and optimized number of neurons. This procedure will be described henceforth in this paper.
To evaluate the hourly energy consumption forecasting for a usual day, the use of 3 methods was proposed. In each, new network was built, which is shown in Table 1.
For each household, the ANN training and validation process used 5 to 7 weeks of these historical electric energy data (depending on the logged hourly load). Integers from 1 to 24 are used to distinguish the hour of the day, and integers from 1 to 7 are added to distinguish between the days of weekdays.
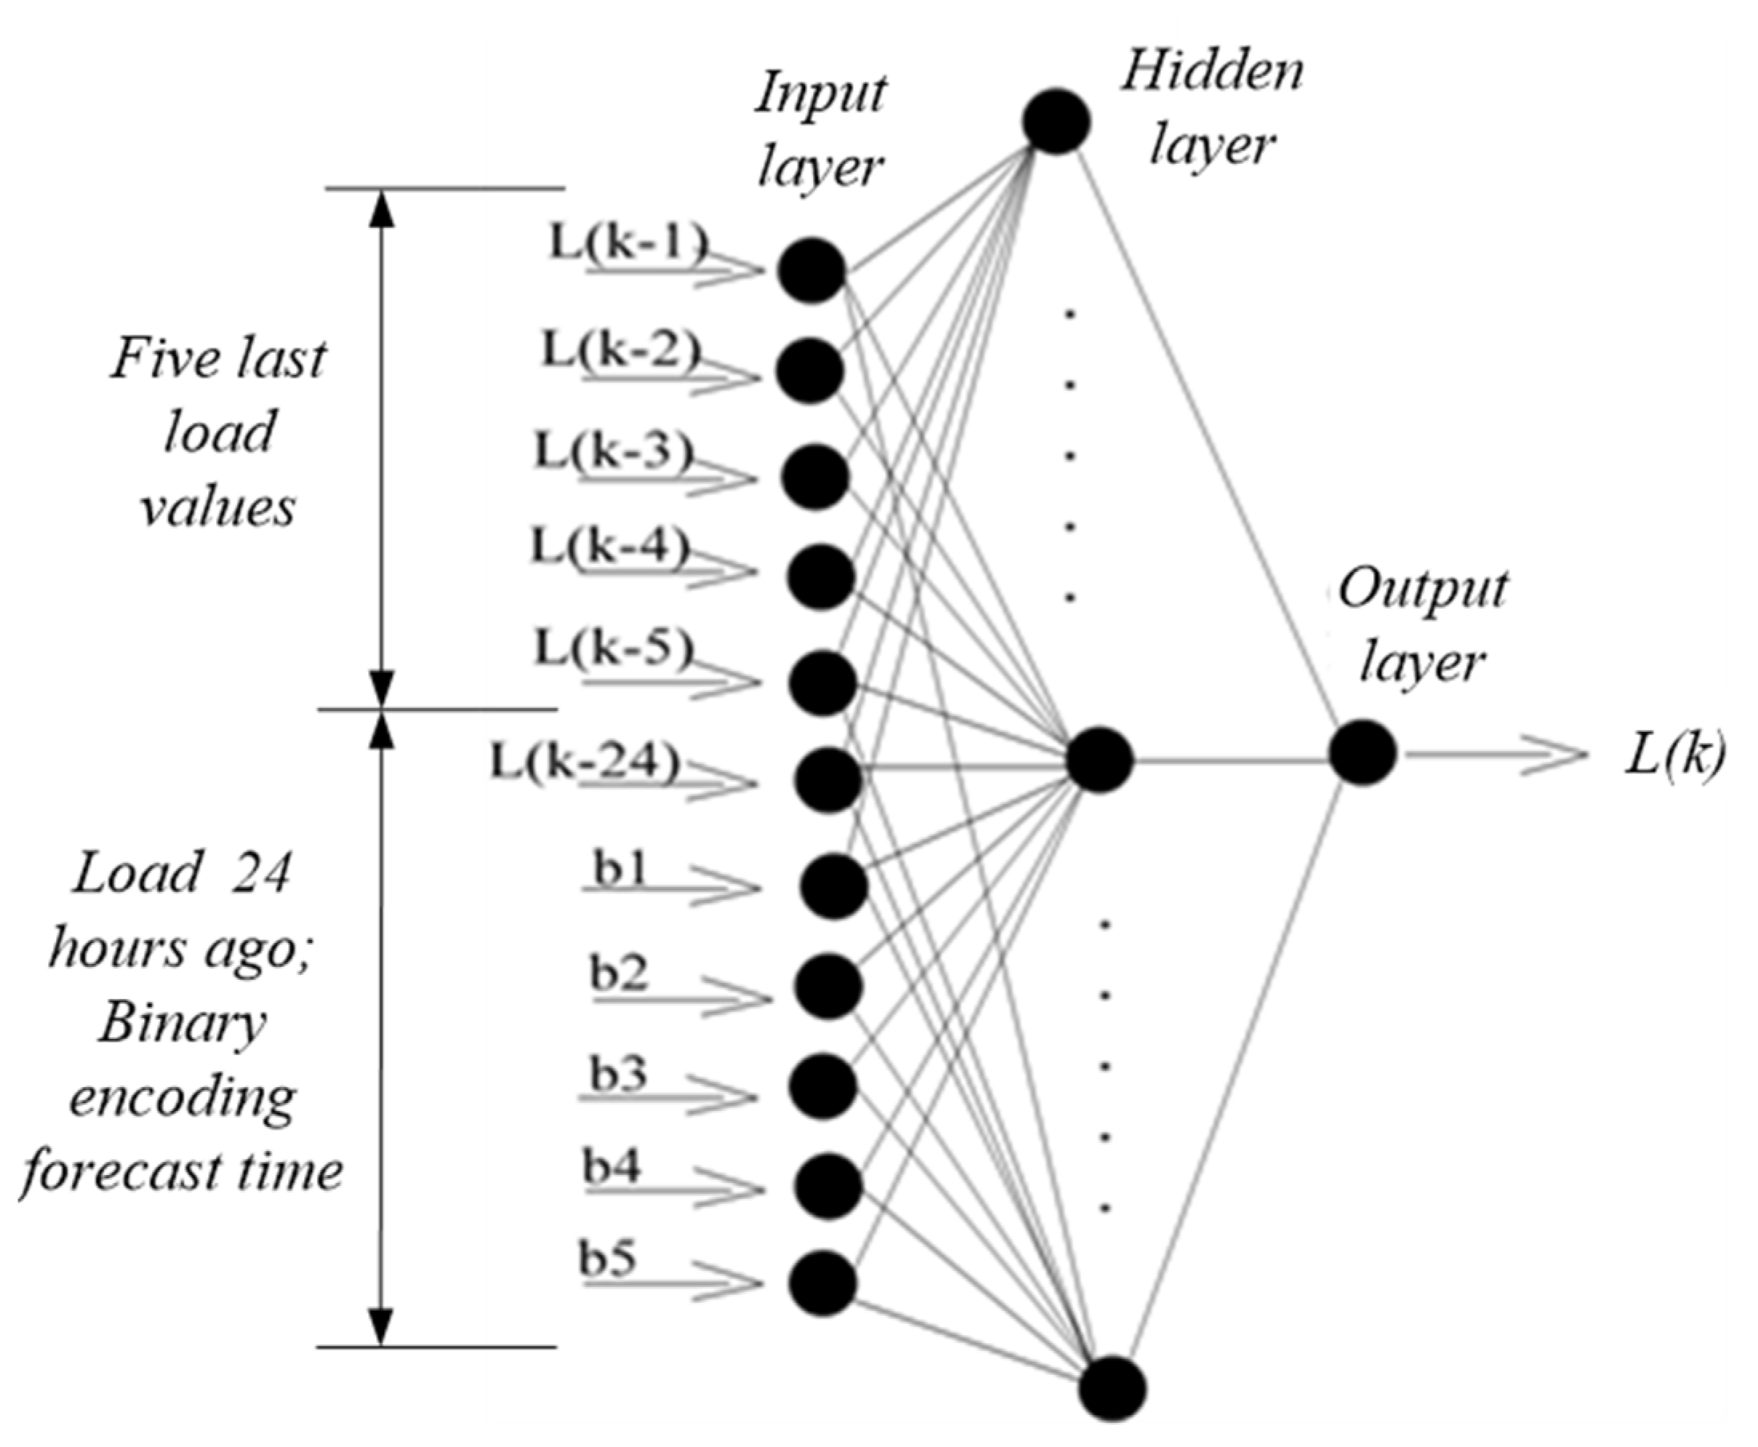
To find the best fit and consequently the best forecasting tool, three ANN models are proposed and compared. In Method I, the forecast hourly load is based on an ANN model using a binary input code for the hour, as used in [4,14]. See Figure 1.
Method II did not use binary encoding. The ANN model used an integer number as an encoding time of an hour (1, …, 24) of the day where it occurred energy consumption. This model used 7 data in the input layer, the same hourly load mentioned in Method I, and added the integer number of the corresponding hour for the last input as an encoding time. The 3rd Method, Method III, completes the latter Method. Using 8 data input, the same hourly load as used in both Methods I and II, the integer number of the hour added the integer number of the day (1—Monday, …, 7—Saturday). Both are used in the input ANN models as an encoding time.
The ANN learning process in this research adopts well-known backpropagation and Levenberg-Marquardt (LM) training algorithms and the activation function hyperbolic tangent sigmoid (HTSF) and pure line (PF) in the hidden and output layers, respectively, performed using the software tool (nntool from MATLAB). Sigmoid and the hyperbolic tangent sigmoid function (HTSF) may lead to saturation of the backpropagation algorithms because of the exponential tendency to grow or lessen the backpropagation of the error signal. In theory, the ReLu activation function, despite being non-differentiable in the origin, can be efficiently retro-propagated, but this may lead to the non-activation of neurons, also called the “Death or Neurons”. In this work, besides PF, the activation function used was HTSF because the output is centred in zero and demonstrates good convergence, despite presenting low convergence and saturation. Further work will exploit other activation functions, such as Leaky ReLU, Maxout, or Softmax. The adaptive moment optimization (Adam) is a replacement optimization algorithm for a classical stochastic gradient descent (SGD) procedure. However, Adam, in some state-of-the-arts results, does not converge to an optimal solution and do not generalize as well as SGD with momentum, which encourages the use of popular optimization algorithms.
The gradient descent is the simplest optimization algorithm. It updates the network parameters in the direction in which the performance function derivate is most negative. Although it does require more memory than other algorithms, the LM algorithm demonstrates faster convergence for networks that contain up to a few hundred weights (as it is for our cases) [38,39,40], as shown in [16,18,37].
The general practice for training the MLP networks starts by dividing the data into three subsets: training, validation, and test sets. The training set is used for computing the gradient and updating the network weights and biases. The validation set measures the model error during the ANN training, which normally decreases. When the network begins to overfit the data, the error on the validation set typically rises. The test set error is independent and is not used during training. The test set is used to compare outputs targets (actual energy load) and the computed values by the ANN. In a typical setup, 70% of the data is used for training, 15% for validation, and 15% for testing.
In this work, the regularization and early stopping methods are used for improving generalization. In the early stopping method, the available data is divided into three subsets, as mentioned above. The other method for improving generalization is called regularization. A performance function frequently used for training feedforward, ANN is the mean square errors (MSE). If predictions deviate too much from actual results, the loss function will increase. Gradually, with the help of the optimization function, the loss function learns to reduce the error in prediction. Using this performance function forces the network to adjust the corresponding weights and biases, and this compels the network response to minimize the performance function. Early stopping and regularization can ensure network generalization when we apply them properly. When we use regularization, it is important to train the network until it reaches convergence. The MSE and the network parameters reach steady values when the network converges.
Validation is a technique for evaluating how the training results will generalize. The purpose of the cross-validation technique is to define a dataset to test the ANN model in the training process, to limit overfitting, and be aware of how the model will be generalized to a new dataset. For early stopping, care must be taken not to use an algorithm that converges too fast.
The learning process is interrupted when the curve corresponding to the validation data decreases to a minimum error value and before it starts to grow in the learning process. In all tests performed and using the validation data subset, it was considered that, if during six consecutive iterations of the learning process the error does not decrease, the learning process is interrupted. By testing several different initial conditions, the network robustness and performance is assessed.
For low-sized datasets, Bayesian regularization (BR) gives better generalization performance than early stopping, because BR does not require that a validation dataset be separate from the training dataset. BR handles the overfitting problem effectively as long as the models are not too complex. The BR approach involves a probability distribution of network weights. As a result, the forecasting of the ANN is also a probability distribution [41]. Hereby, among the techniques mentioned above and due to inaccuracy performance, the early stopping was used in the training process.
MSE is defined in (1).
M S E = 1 N i = 1 N ( e i ) 2
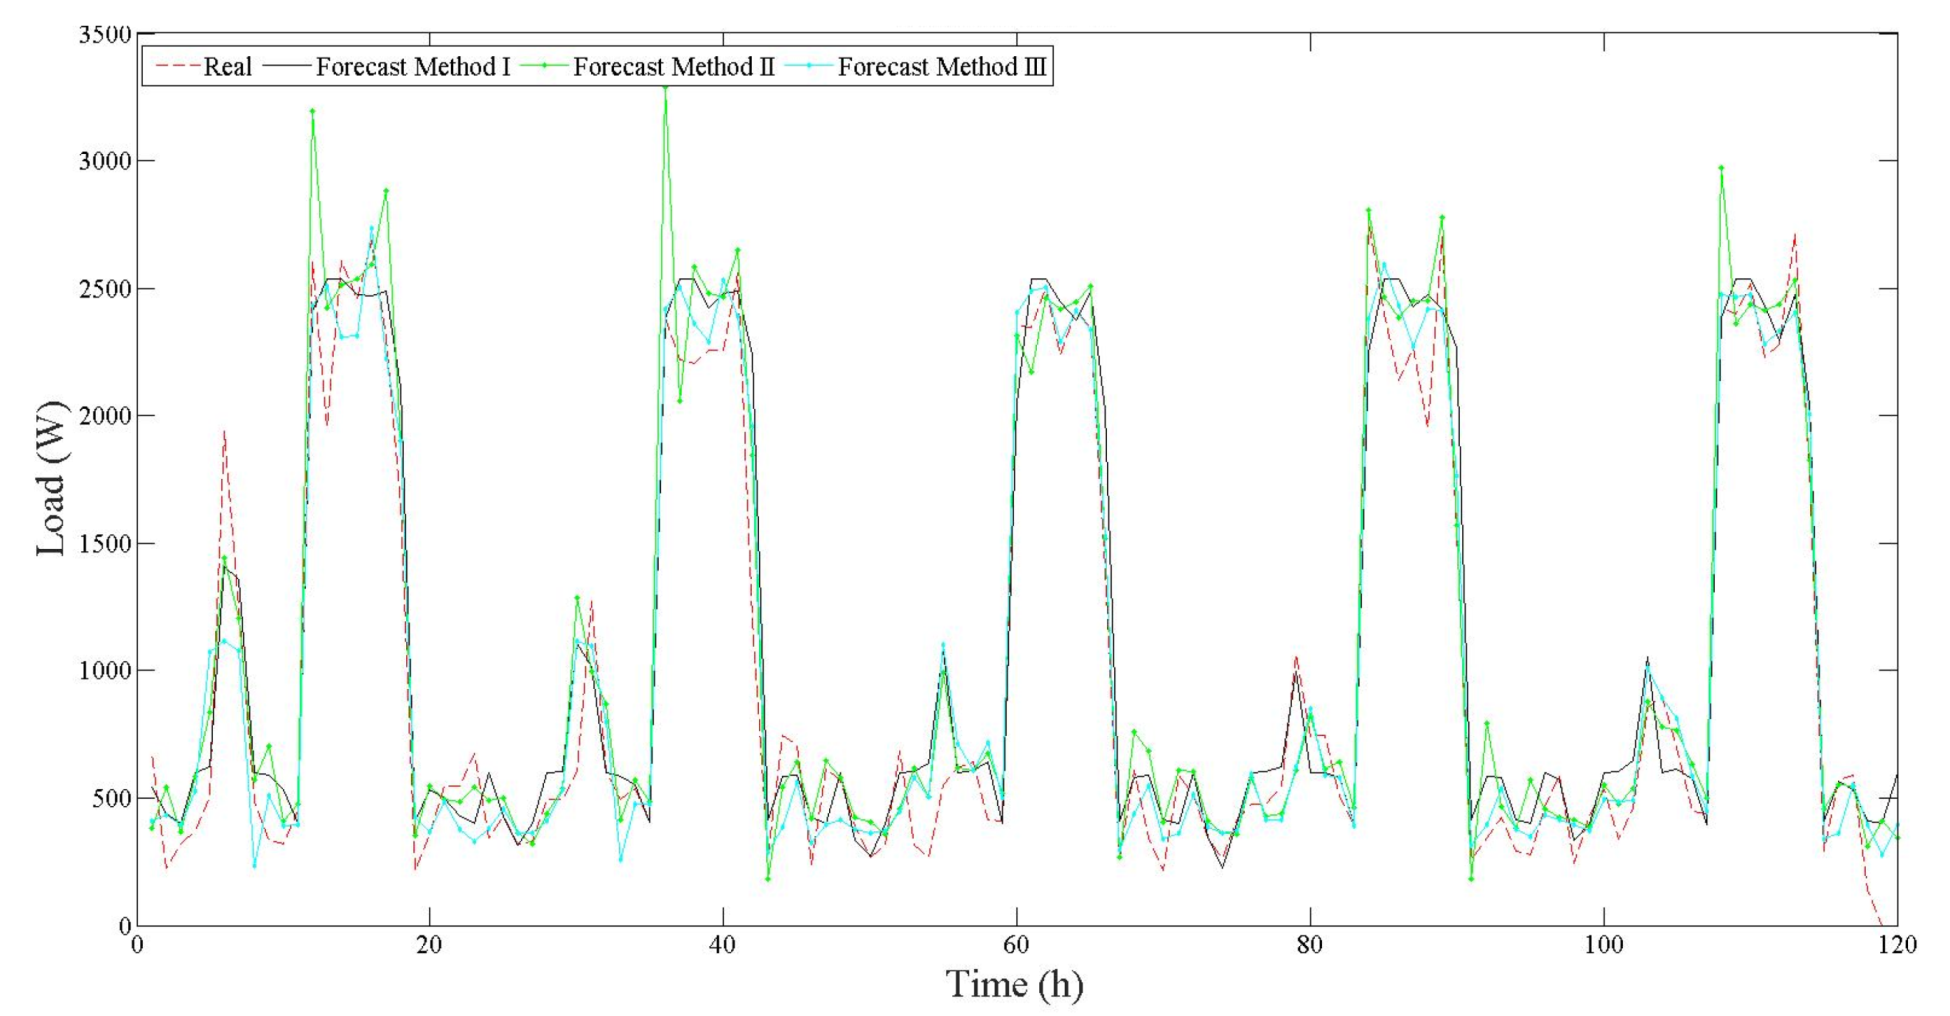
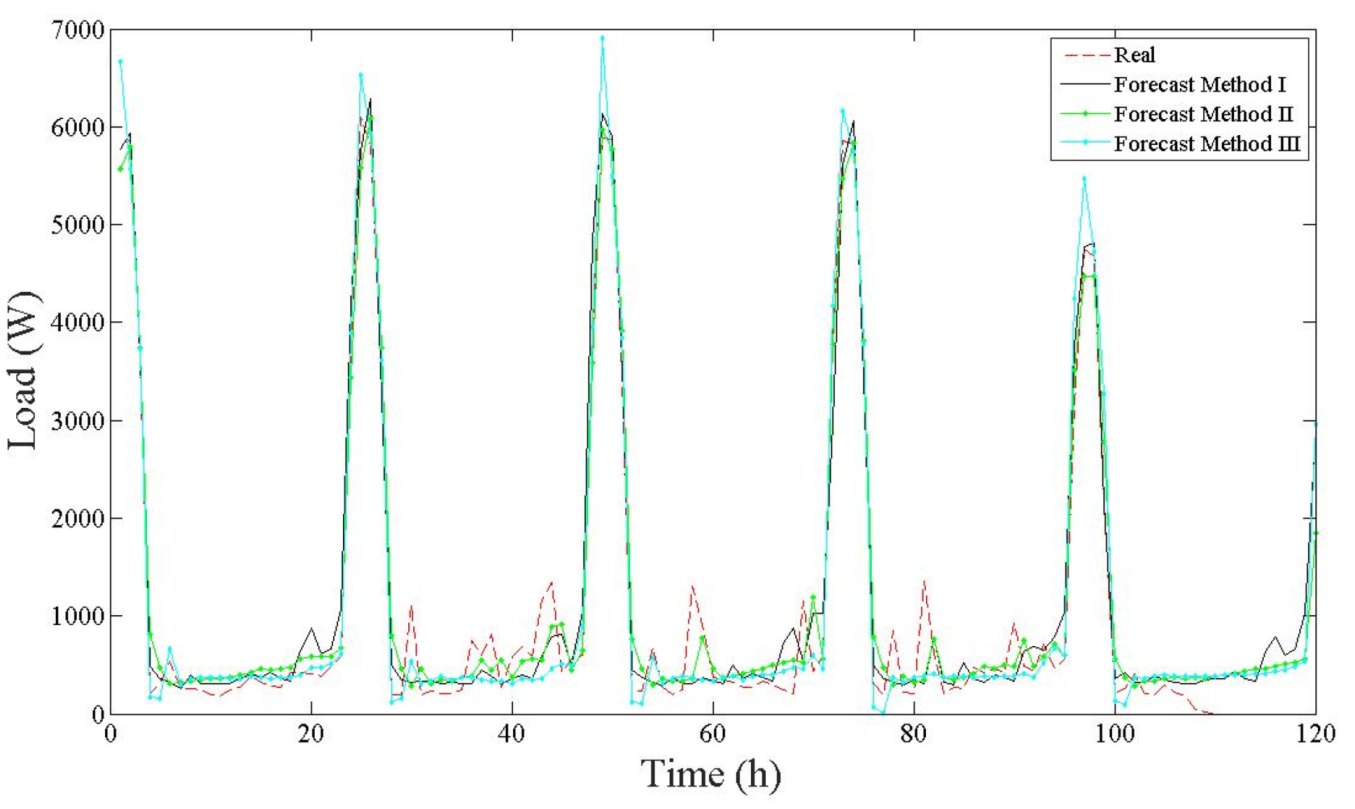
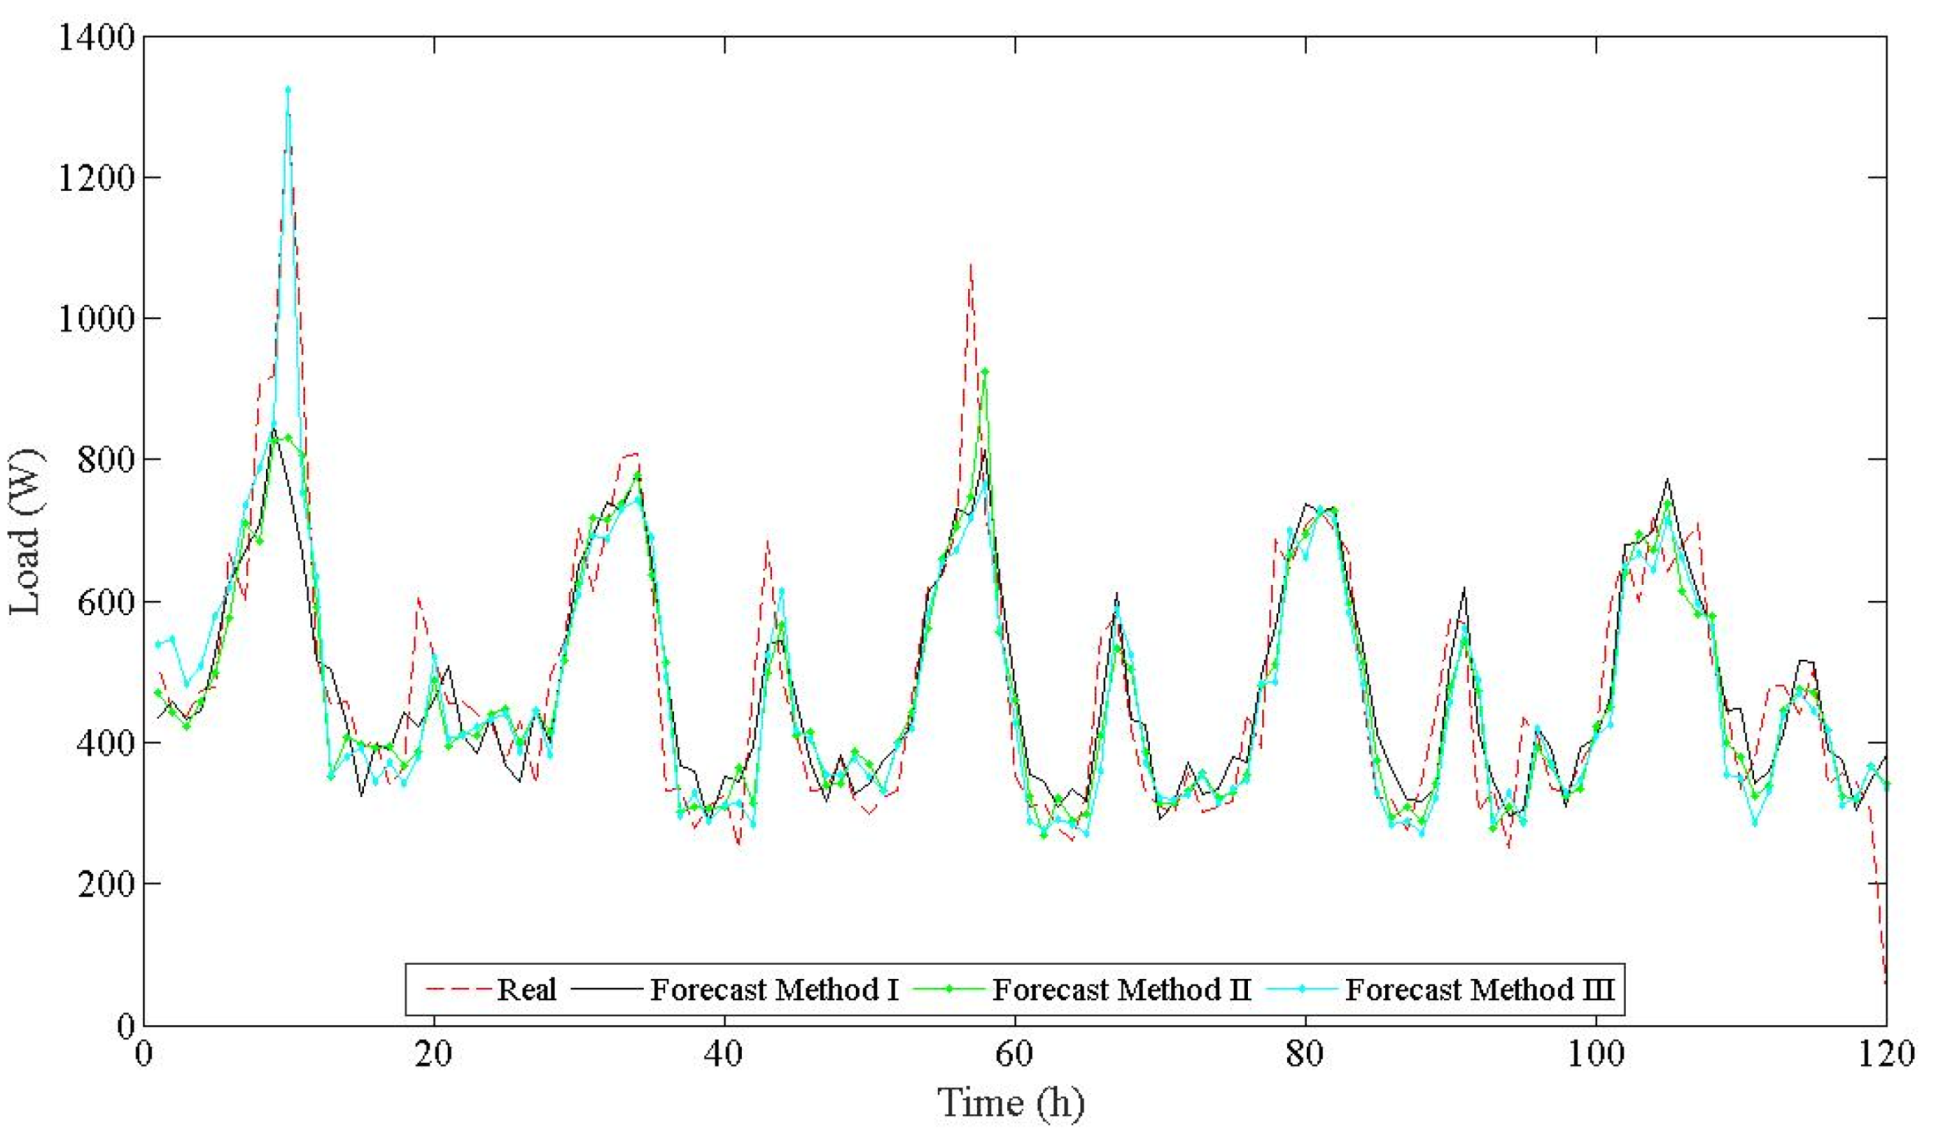
Thereby, the load forecast produced by the ANN can be compared to the actual load data and the error is calculated. Then, the forecasting correlation and error values of outputs are compared with the test set, as well as the shape of the load profile distribution. The effectiveness of this approach is analyzed by forecast outputs results; we will show the performance of the different methods studied in this work.

3.2. Automated Training Process
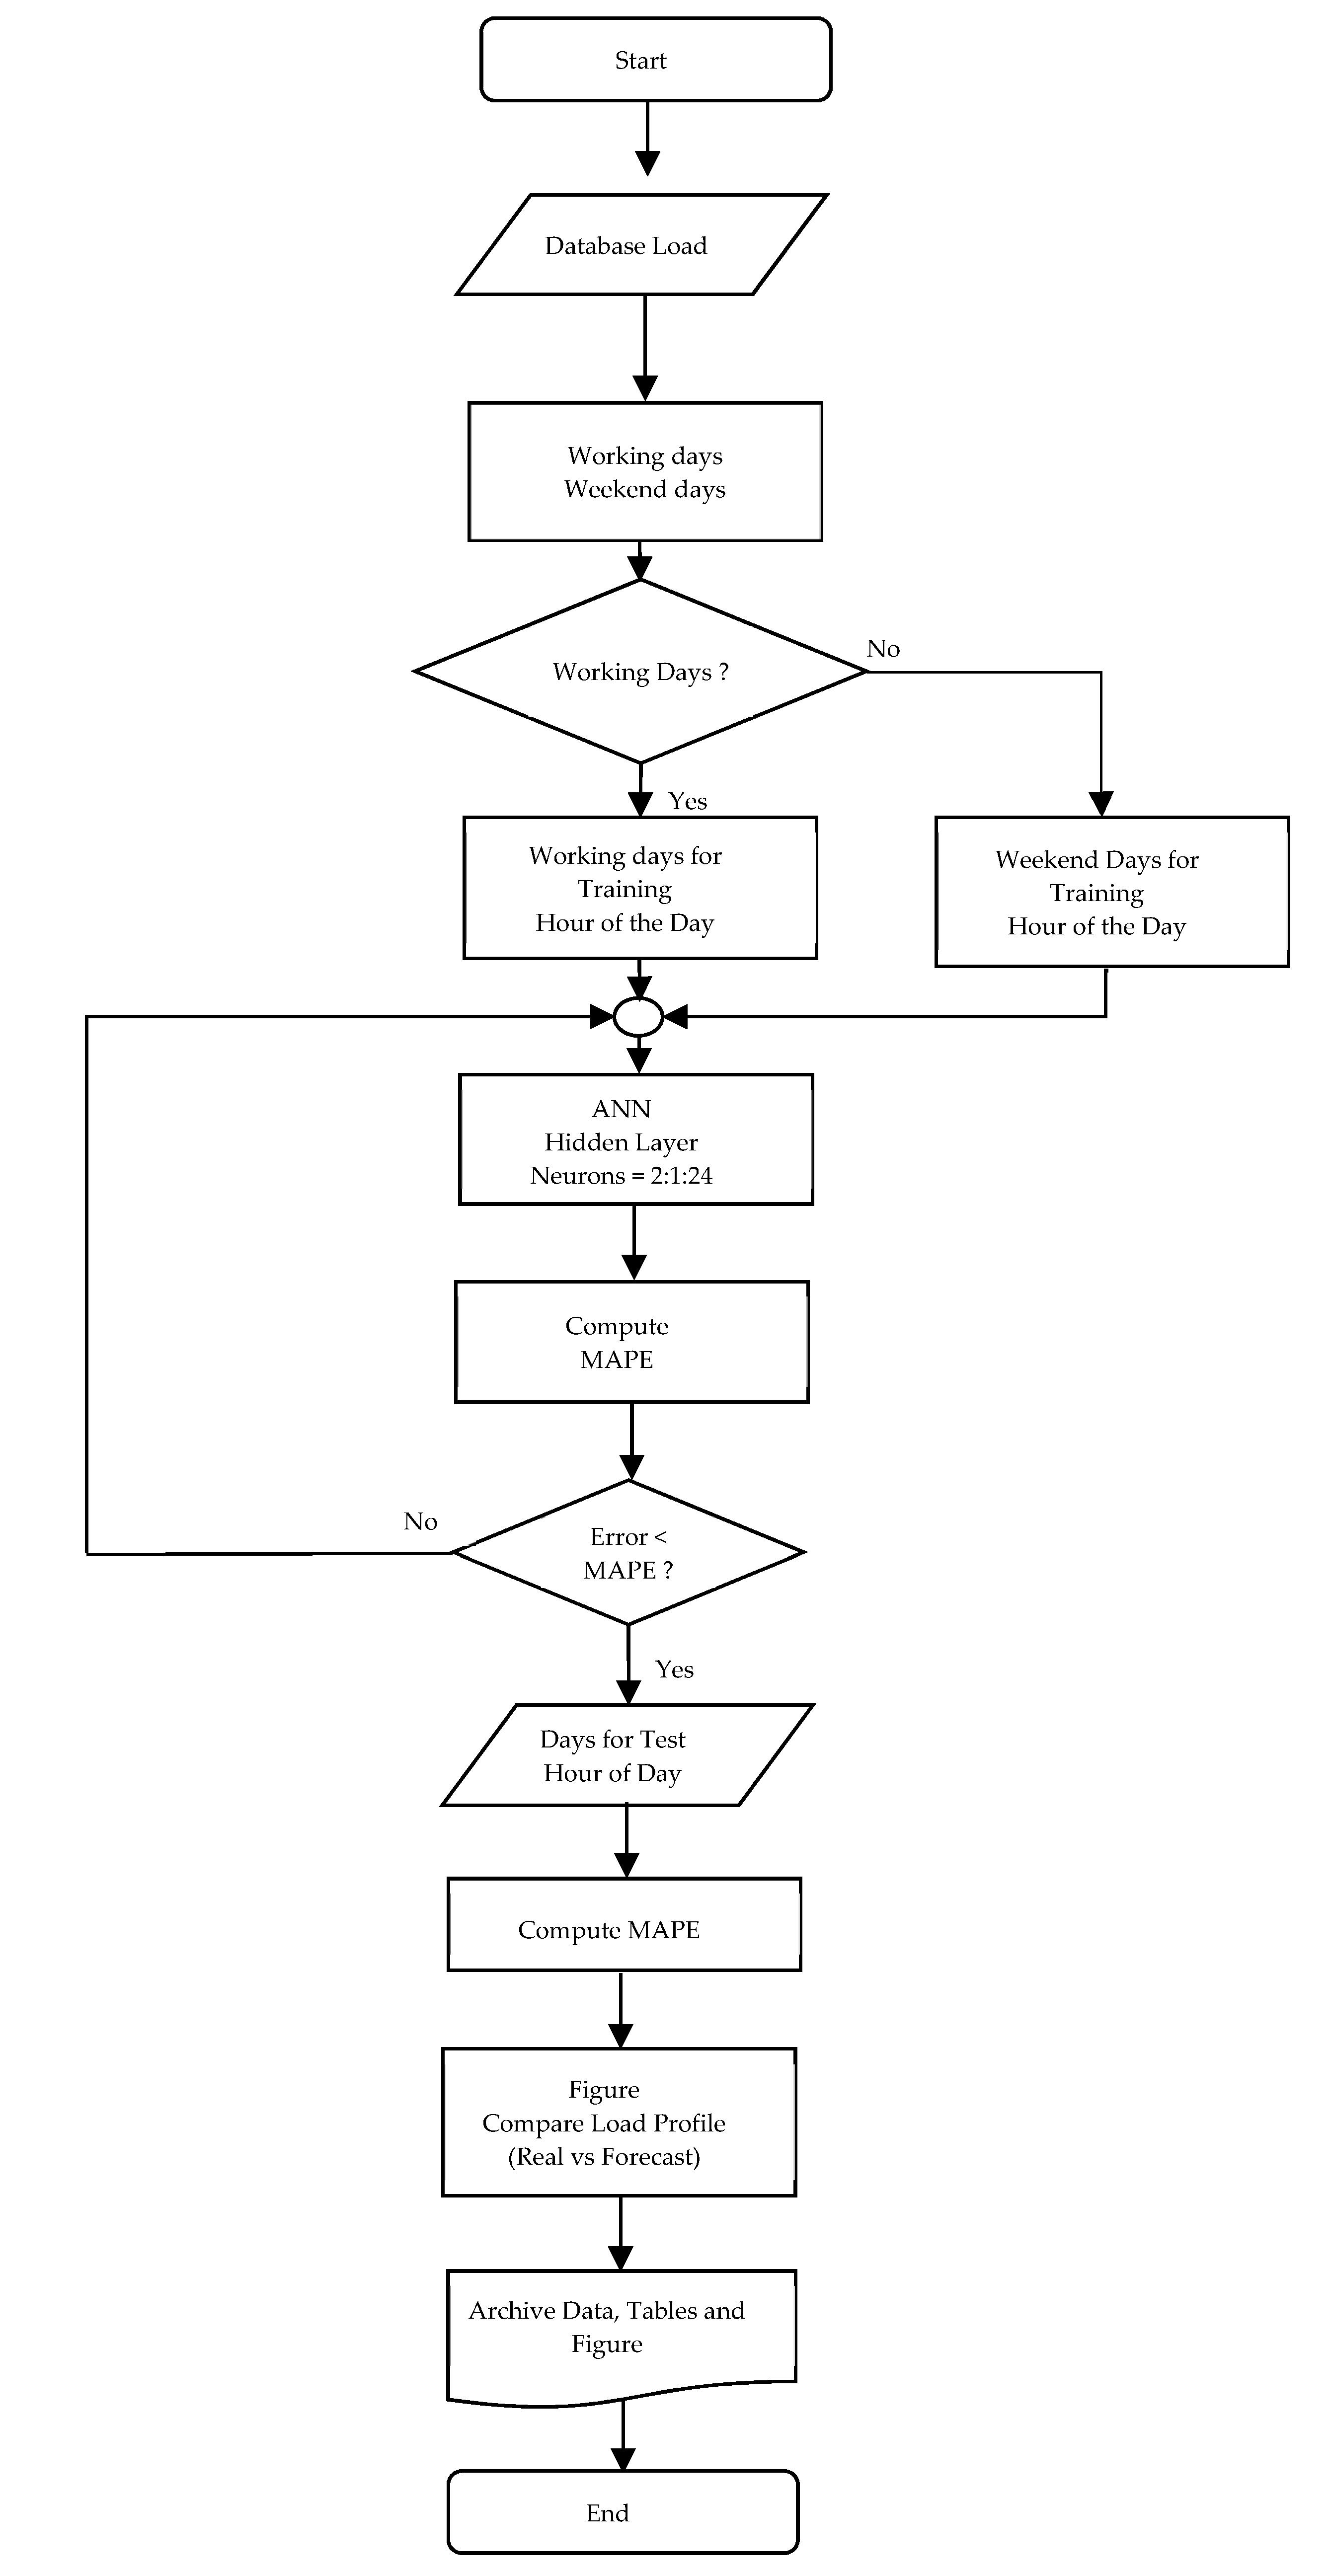
As shown in Figure 2, to automate the trial and error, a script was developed in MATLAB. This application was able to automatically train the proposed ANN by changing the number of neurons in the hidden layer, after computing the mean absolute percentage error (MAPE), or the mean absolute percentage deviation (MAPD).
The learning process begins by dividing the data from [16,18,37] into 3 subsets, and the LM training method was used with MSE as a performance function. MSE measures the network’s performance and the LM algorithm updates weight and bias values according to the Levenberg-Marquardt optimization algorithm. In many cases, LM can obtain lower MSE than any of the other algorithms tested [41,42].
To change the number of neurons in the hidden layer, the used criteria to stop the network training process are as follows:
  • Minimum gradient magnitude;
  • Maximum number of cross-validation increases;
  • Maximum training time;
  • Minimum performance value;
  • Maximum number of training epochs (iterations).
During training, the progress is constantly updated in the training window. The most interesting are the gradient magnitude, number of cross-validation checks, and performance value. The magnitude of the gradient and number of cross-validation checks are used to terminate the training process. The gradient becomes smaller as the training achieves a minimum performance value. The number of cross-validation checks represents the number of successive iterations that the validation performance fails to decrease. It has been considered that if this number reaches 6, the training will stop. These limits can be adjusted, and criteria can be changed by setting the parameters. In this research, it was verified that most of the training did stop by the number of cross-validation checks. After the maximum has been reached and the MAPE reach the proposed value, all the learning procedures end. If the proposed value of MAPE is not reached, the neural network will retrain, changing the number of neurons to obtain the best relationships between the actual and forecast load. The neurons’ number changing is performed by an increase of one unit until it reaches the established maximum value. In our case, the minimum value is 2 and the maximum value is 24 neurons.

3.3. Forecasting Performance

MAPE is defined as:
M A P E ( % ) = 1 N i = 1 N | L A i L F i | L A i × 100
where LA is the actual hourly load, LF is the forecasted hourly load, N is the number of hours, and i is the hour index.
In the study cases, the standard deviation of errors (SDE) is another criterion used, given by:
S D E = 1 N i = 1 N ( e i e ¯ ) 2
e i = L F L A
e ¯ = 1 N i = 1 N e i
where ei is the forecast error at hour i and e ¯ is the average error of the forecasting period. SDE is just the square root of the MSE. MSE are measures of error that indicate whether the forecasts are biased, i.e., whether they tend to be disproportionately positive or negative. Therefore, minimizing the MSE implicitly minimizes the bias as well as the variance of the errors [43].
Hourly load consumption may rise or drop at specific hours [38,42]. In statistics, the MAPE is a measure of method accuracy for constructing fitted time-series values. It usually expresses accuracy as a percentage and is defined by (2). Hence, the average load was used in (2) to avoid the problem caused by actual loads close to zero. The MAPE is also often used for purposes of reporting because it is expressed in percentage terms, which makes sense for identifying “big” errors [44].
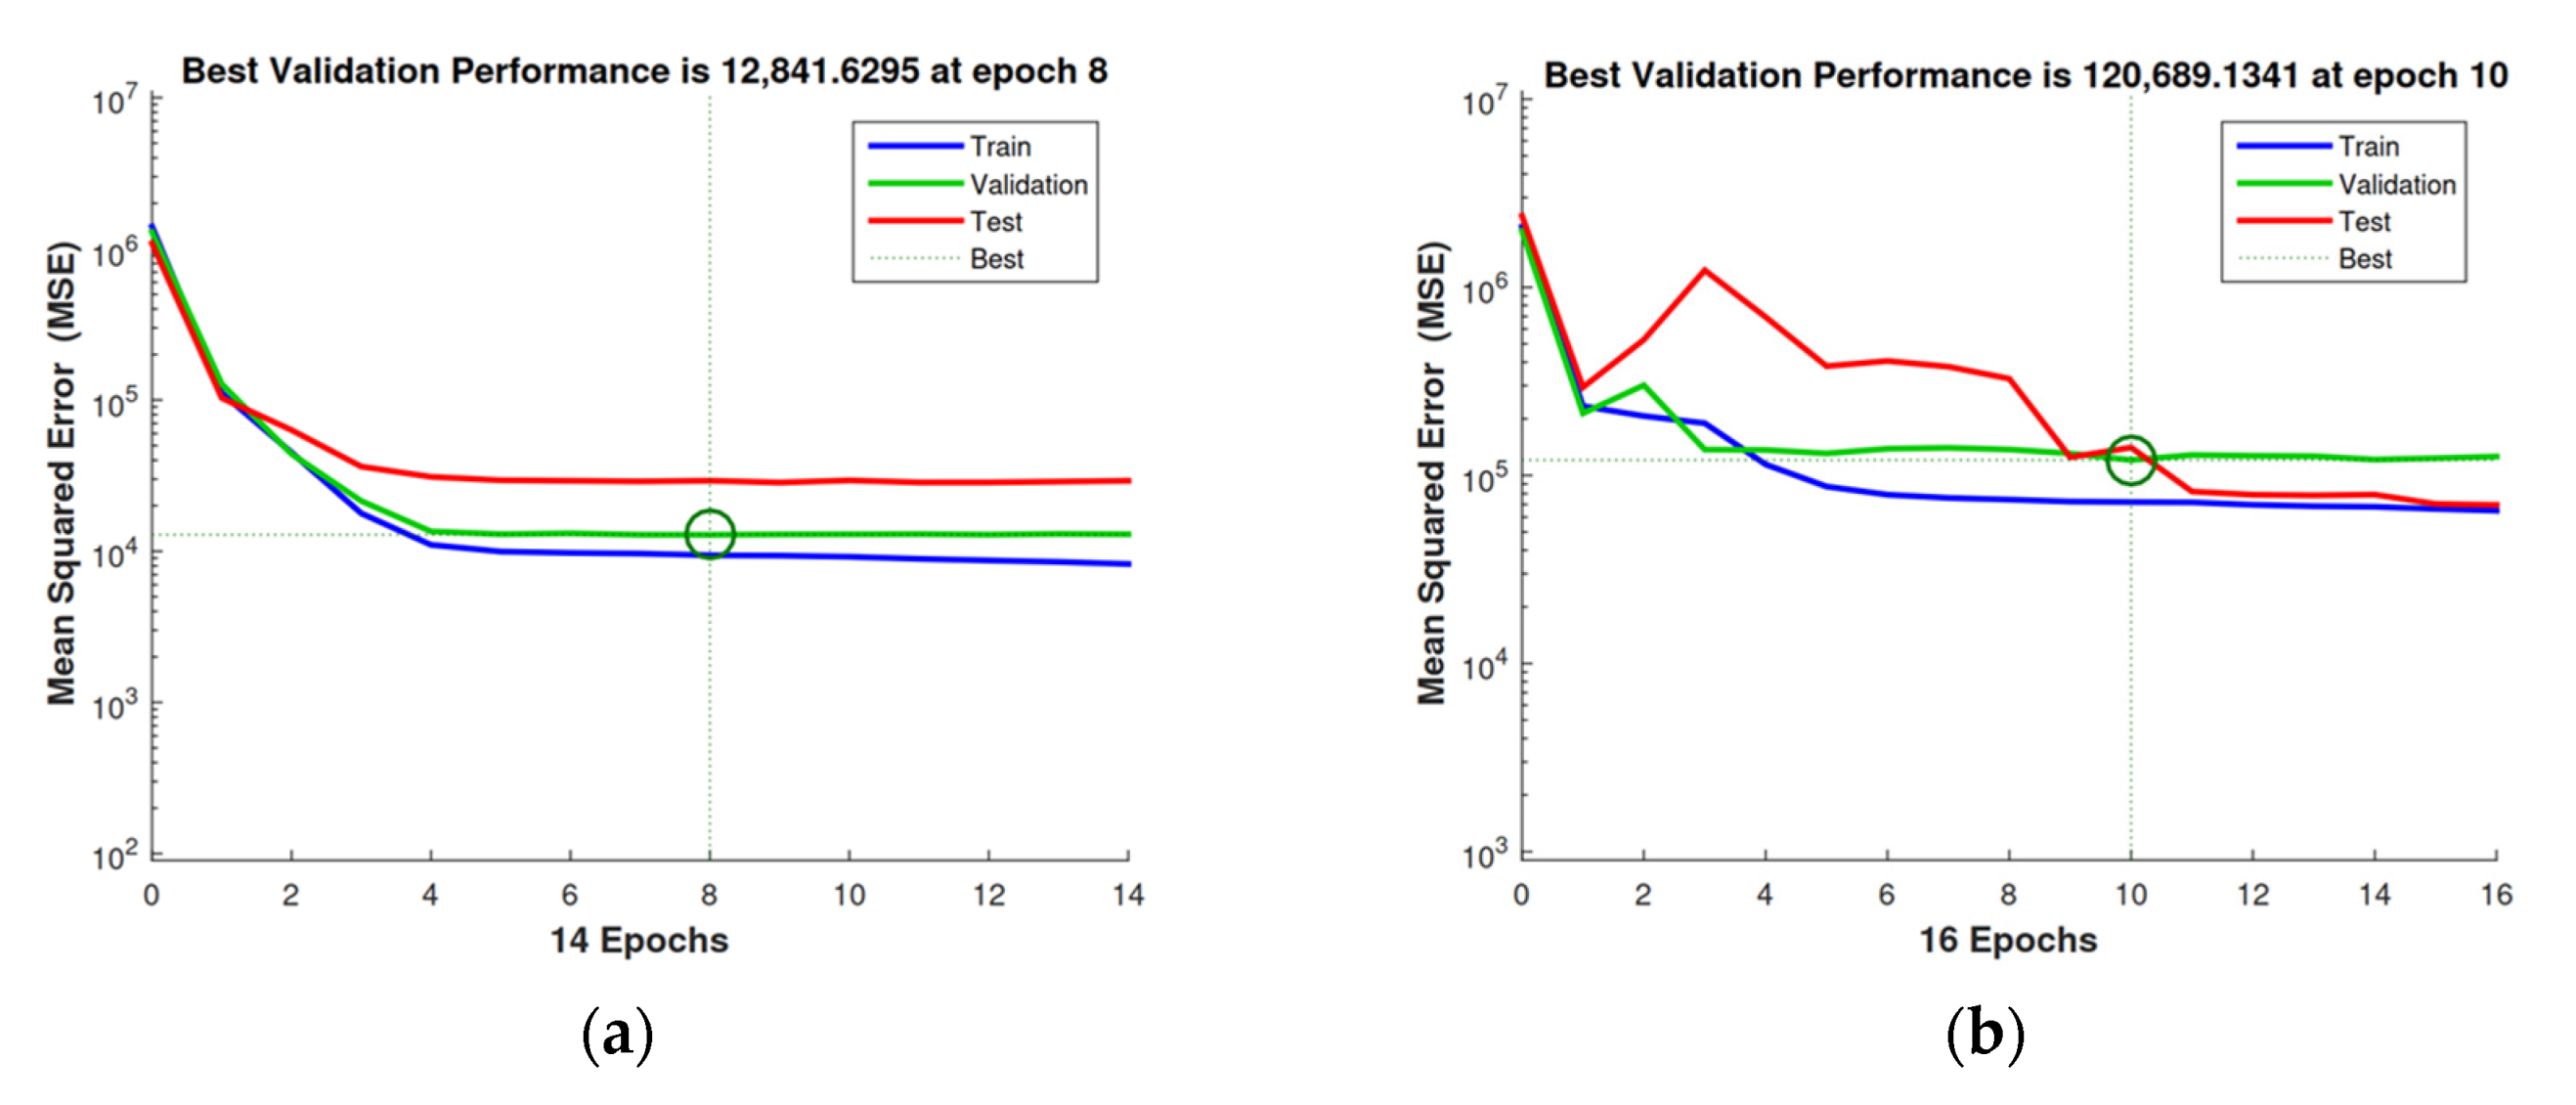
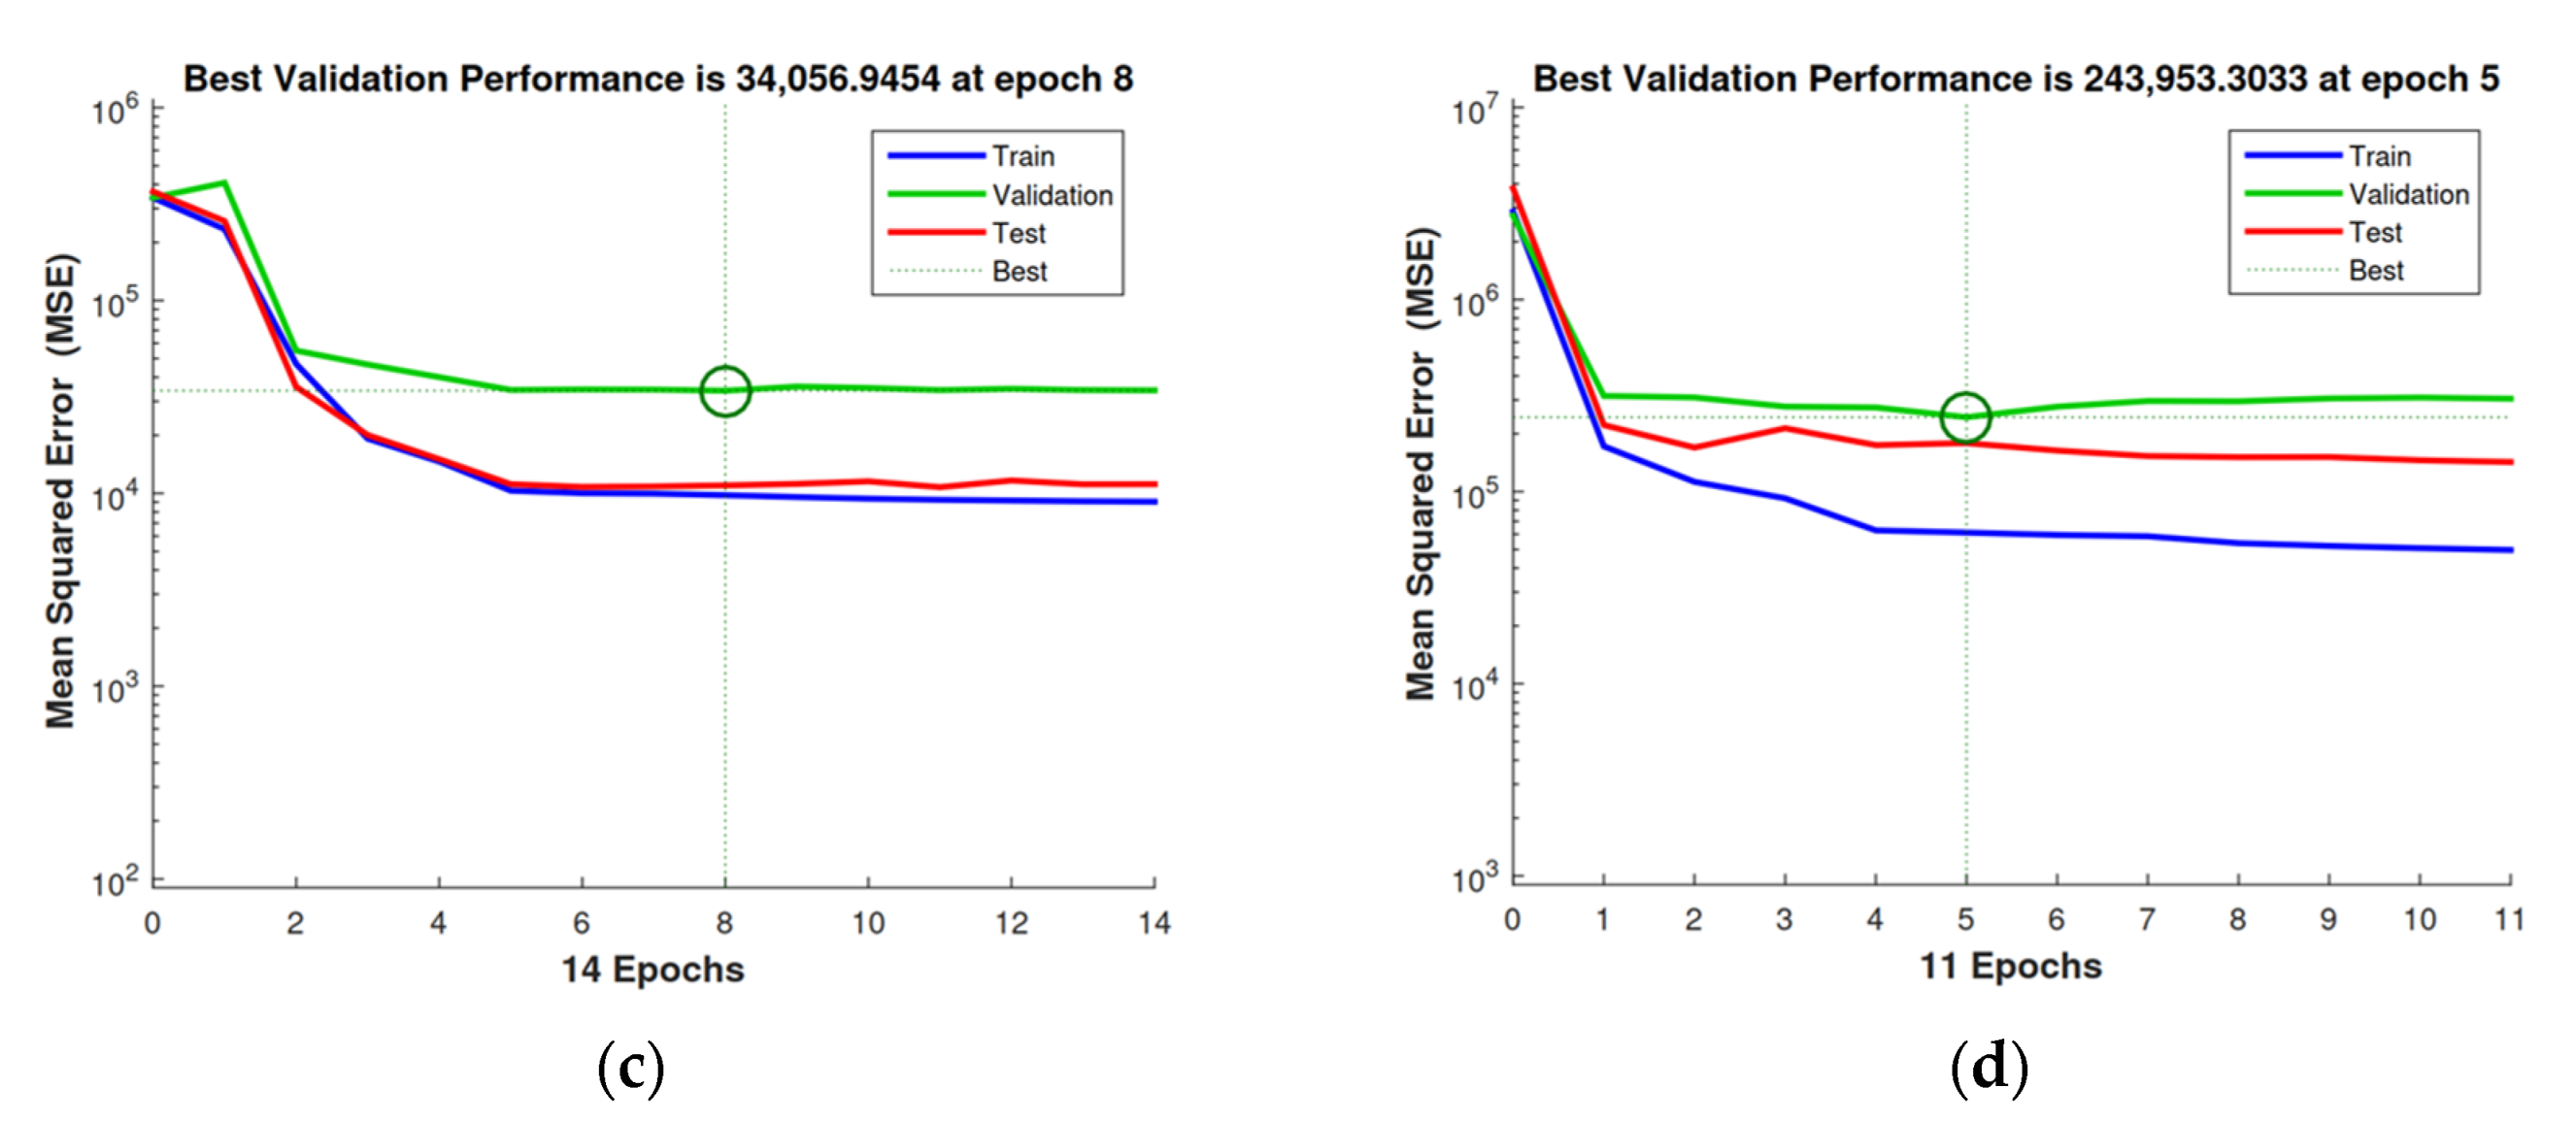
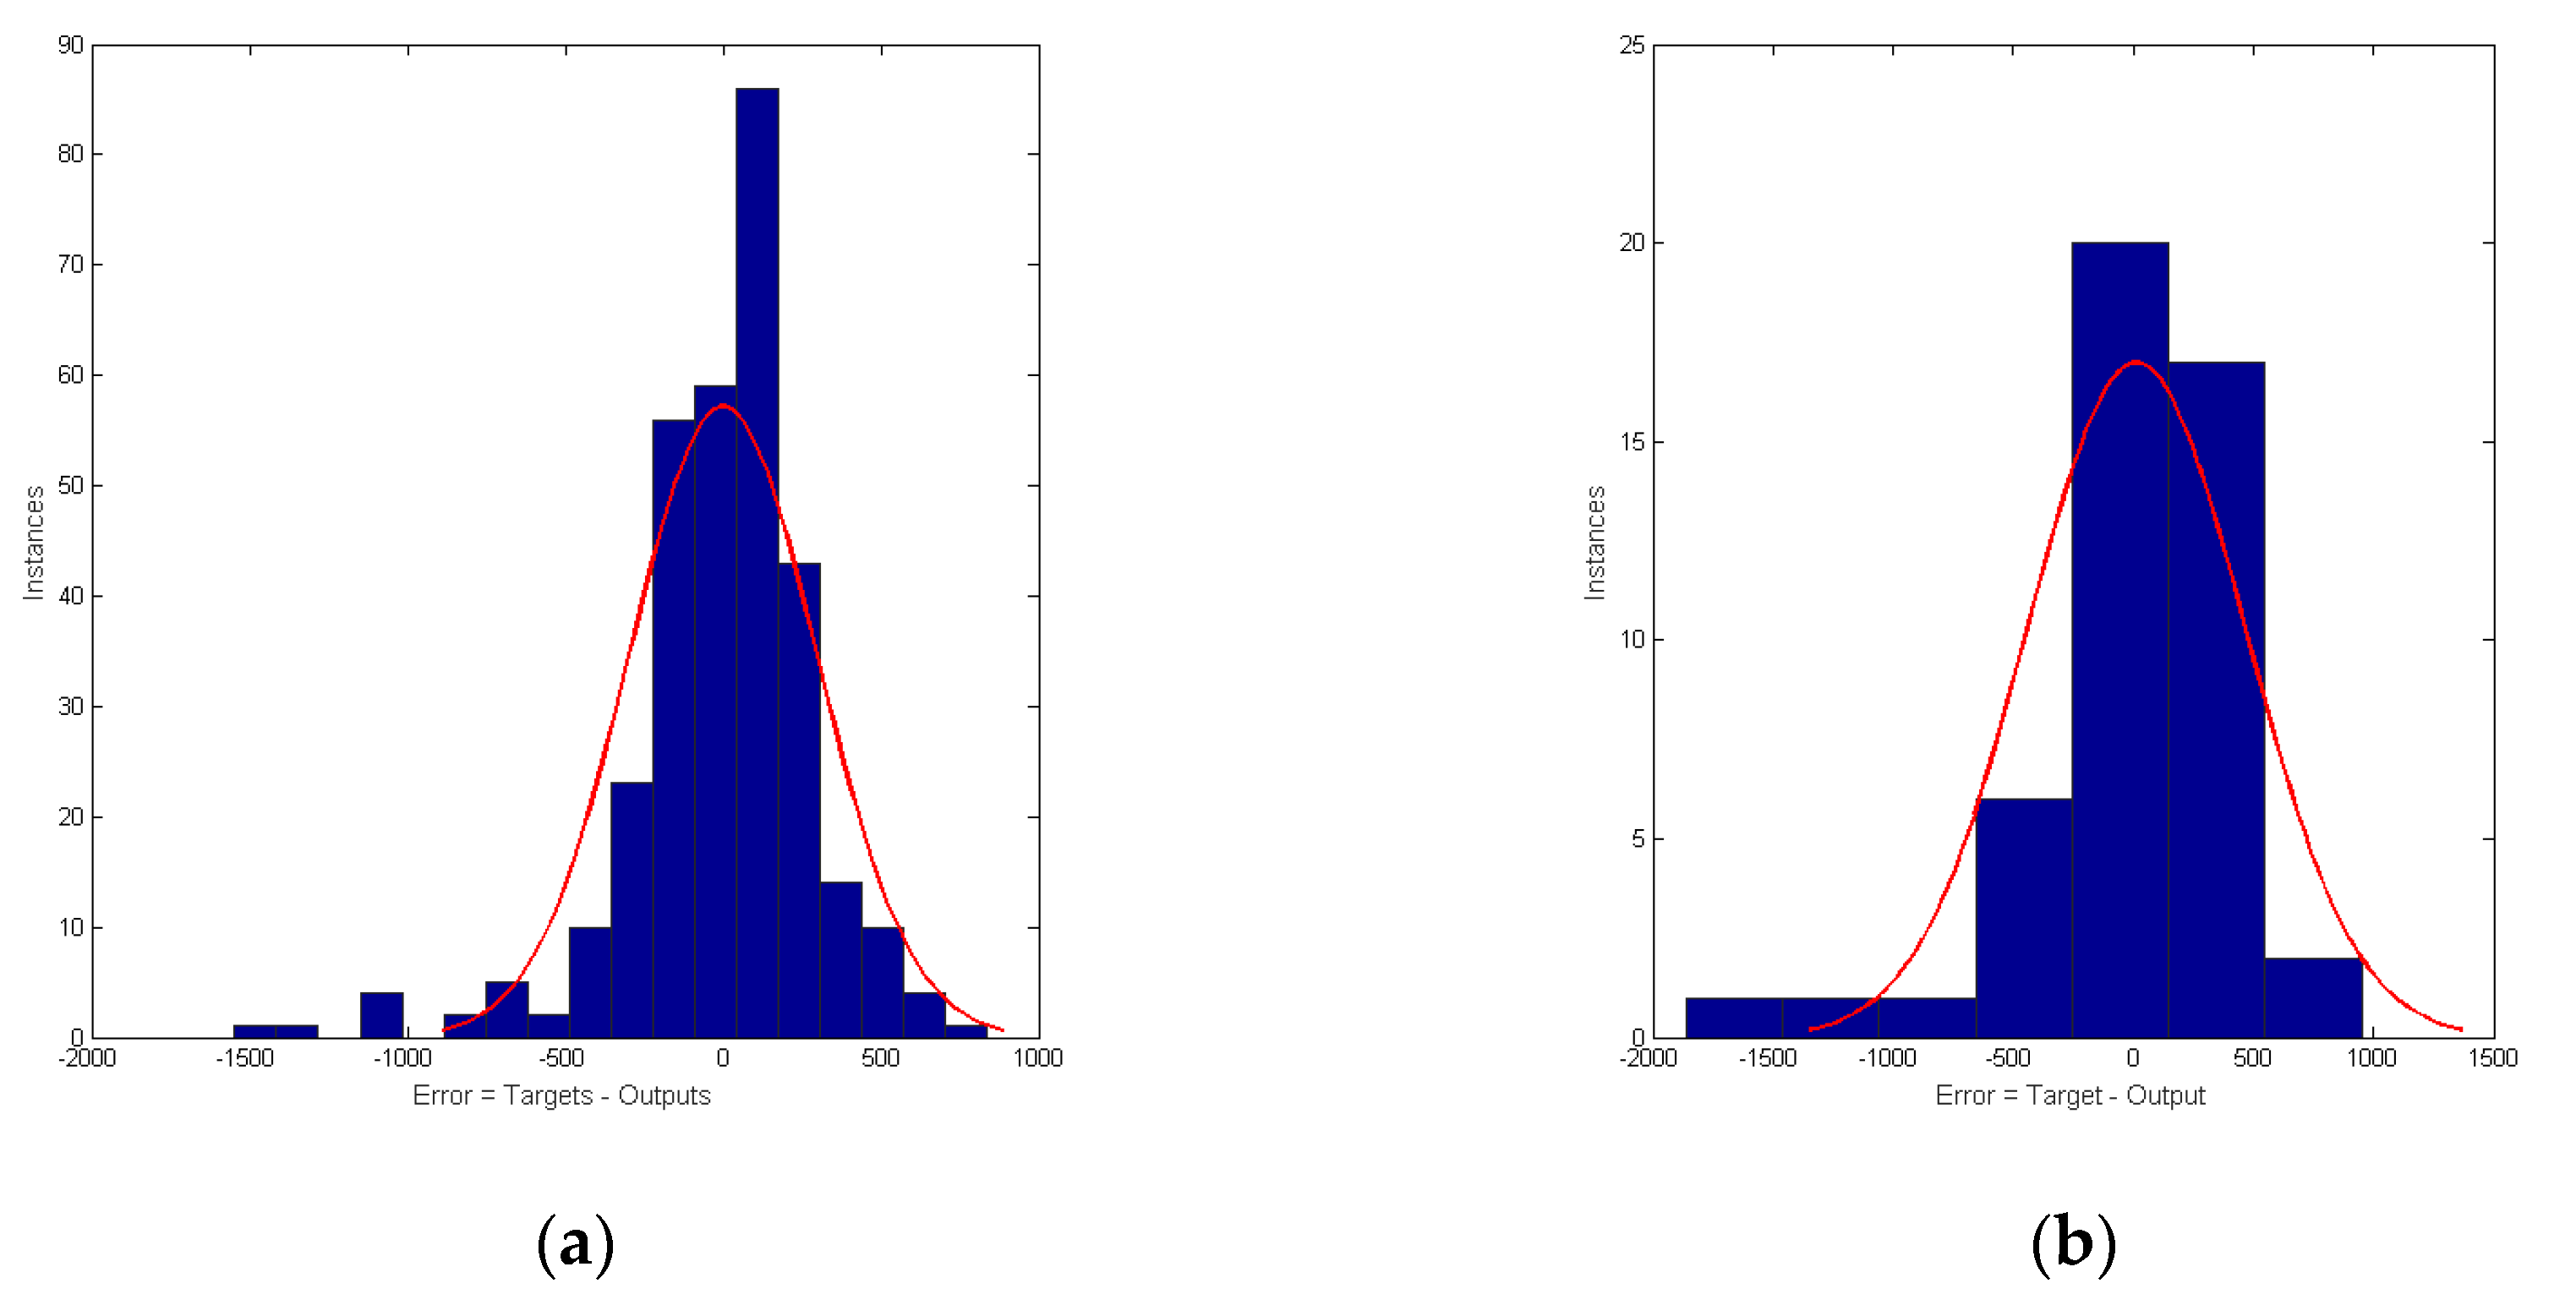
Figure 3 shows the MSE resulting from the training of the energy dataset of a randomly selected household.
MAPE and SDE values for hour-ahead forecasting in different hours of the day are presented in the case studies section. As it can be verified, the MSE starts with high values and, with the training, each epoch tries to reduce the error and stabilize. The MATLAB nntool identifies and marks the best time performance. 
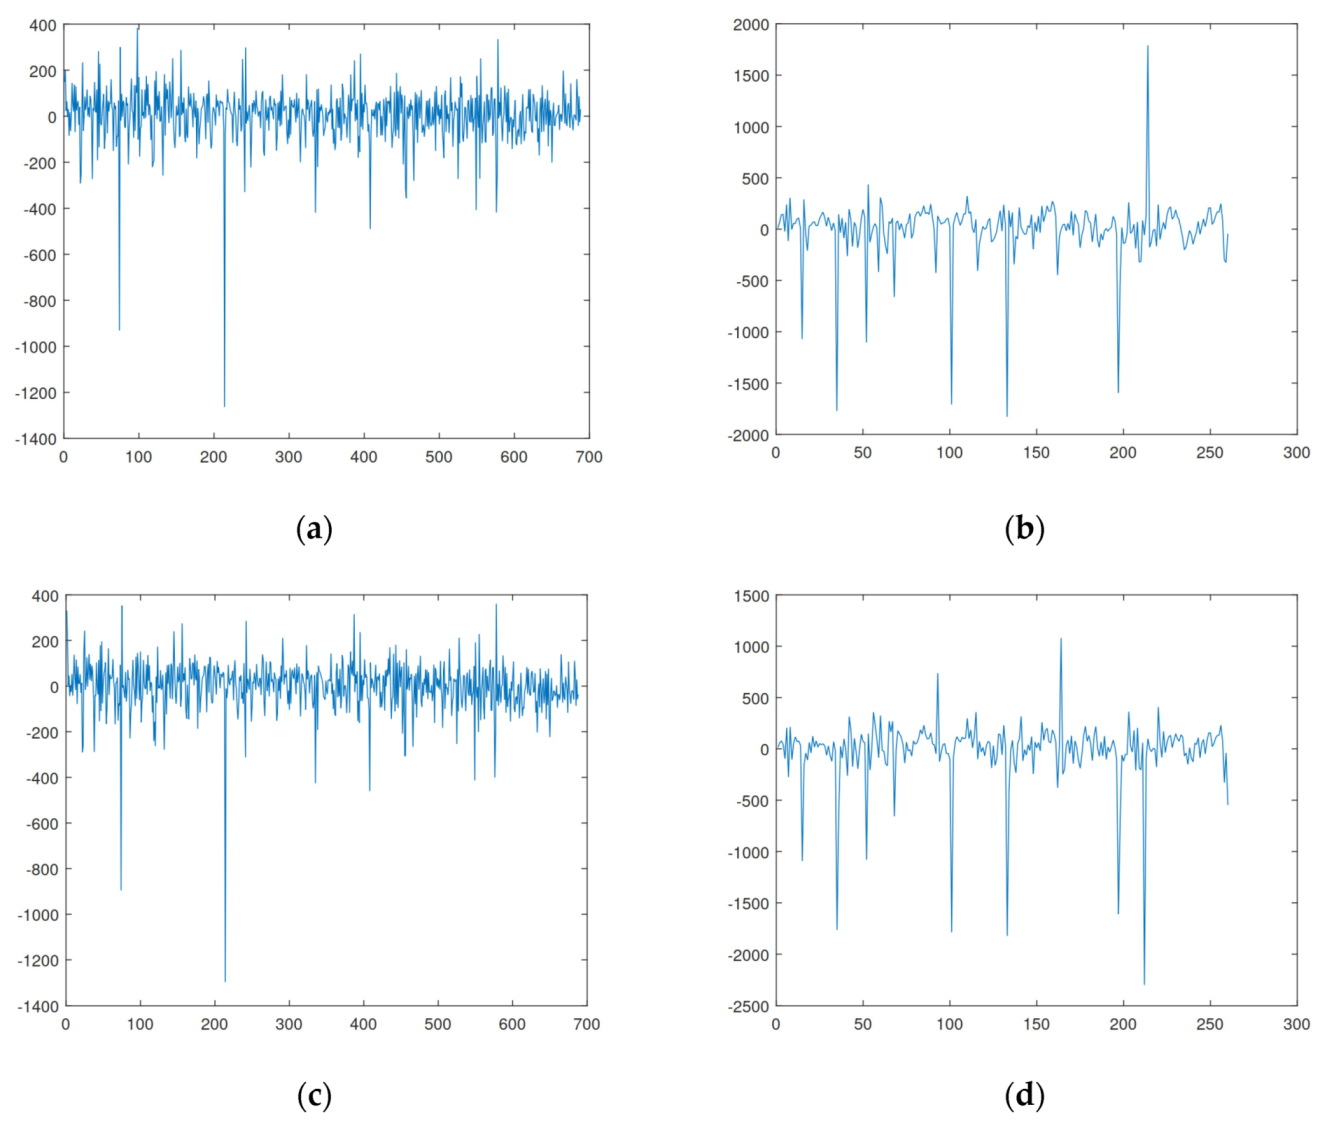
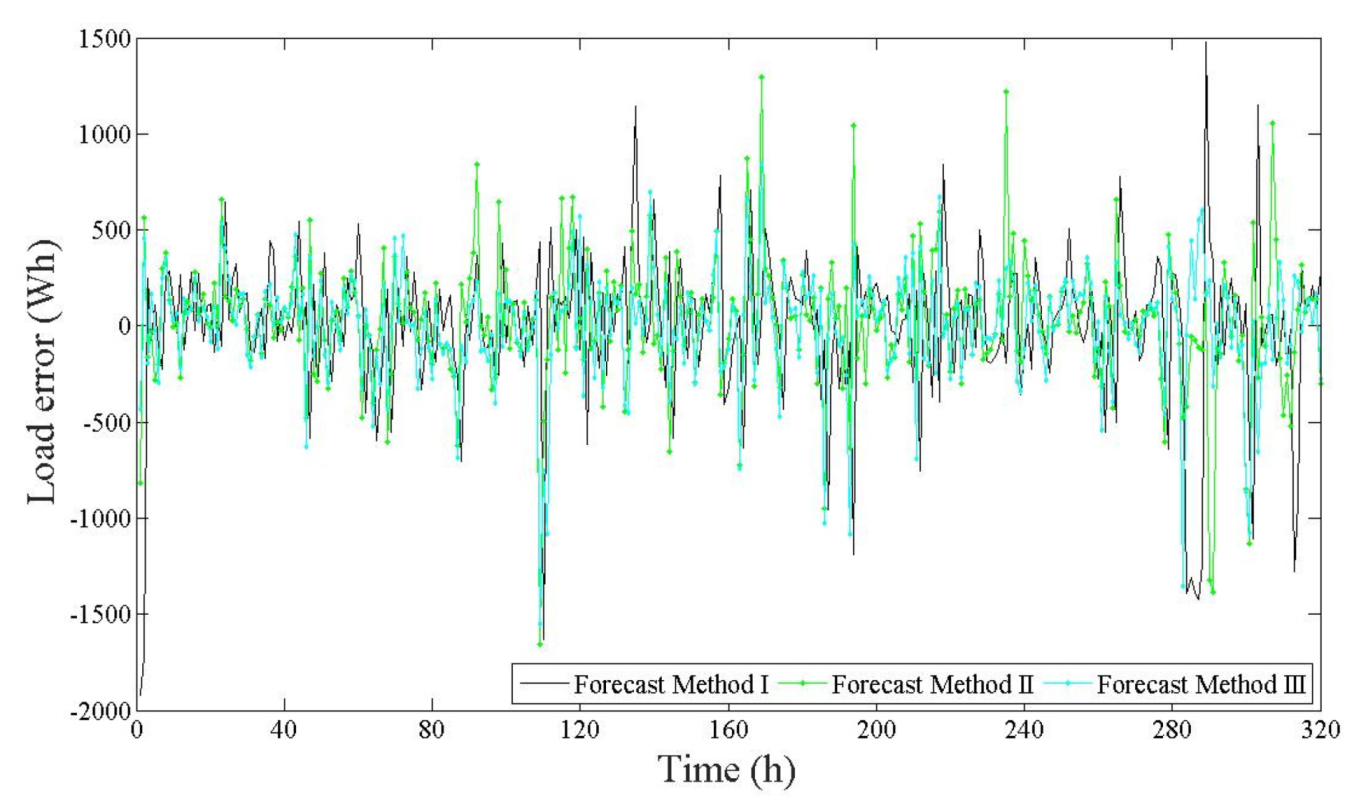
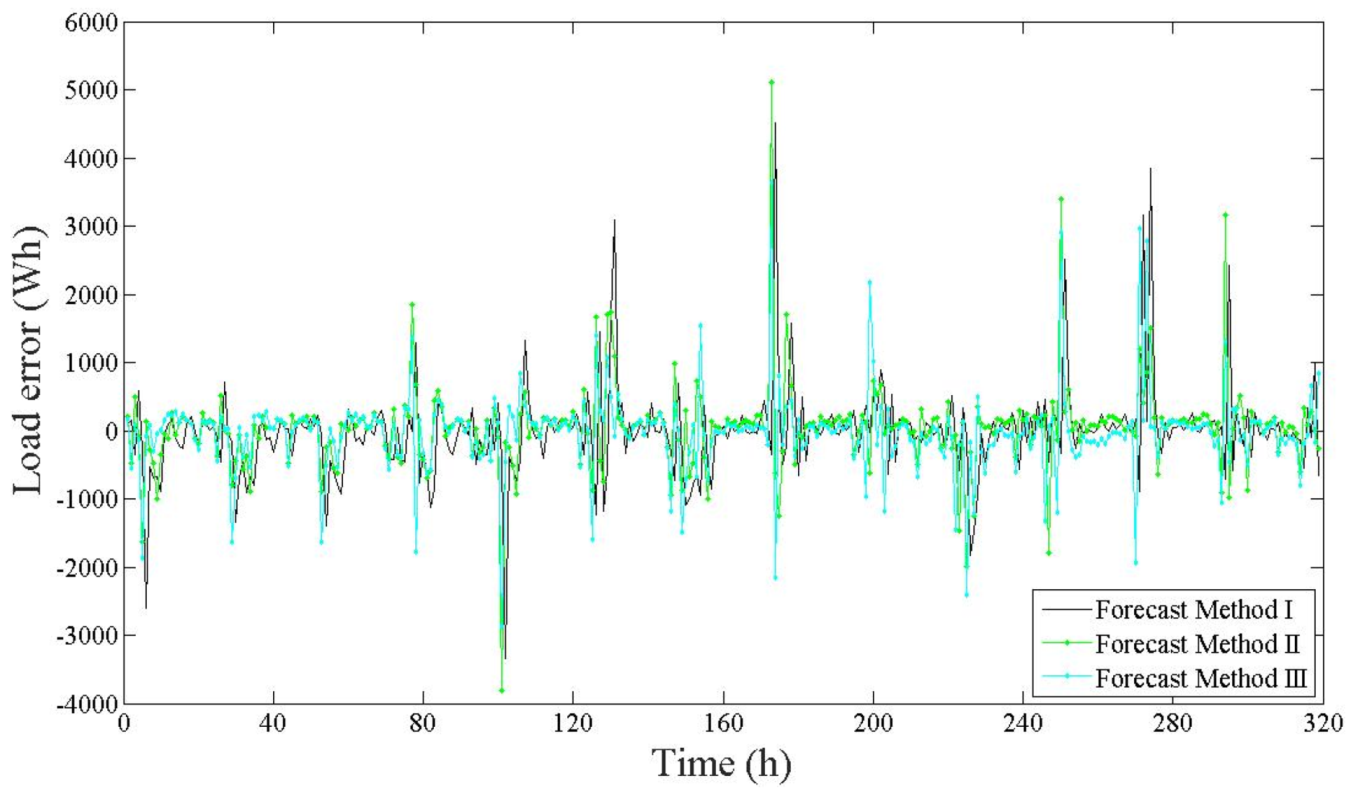
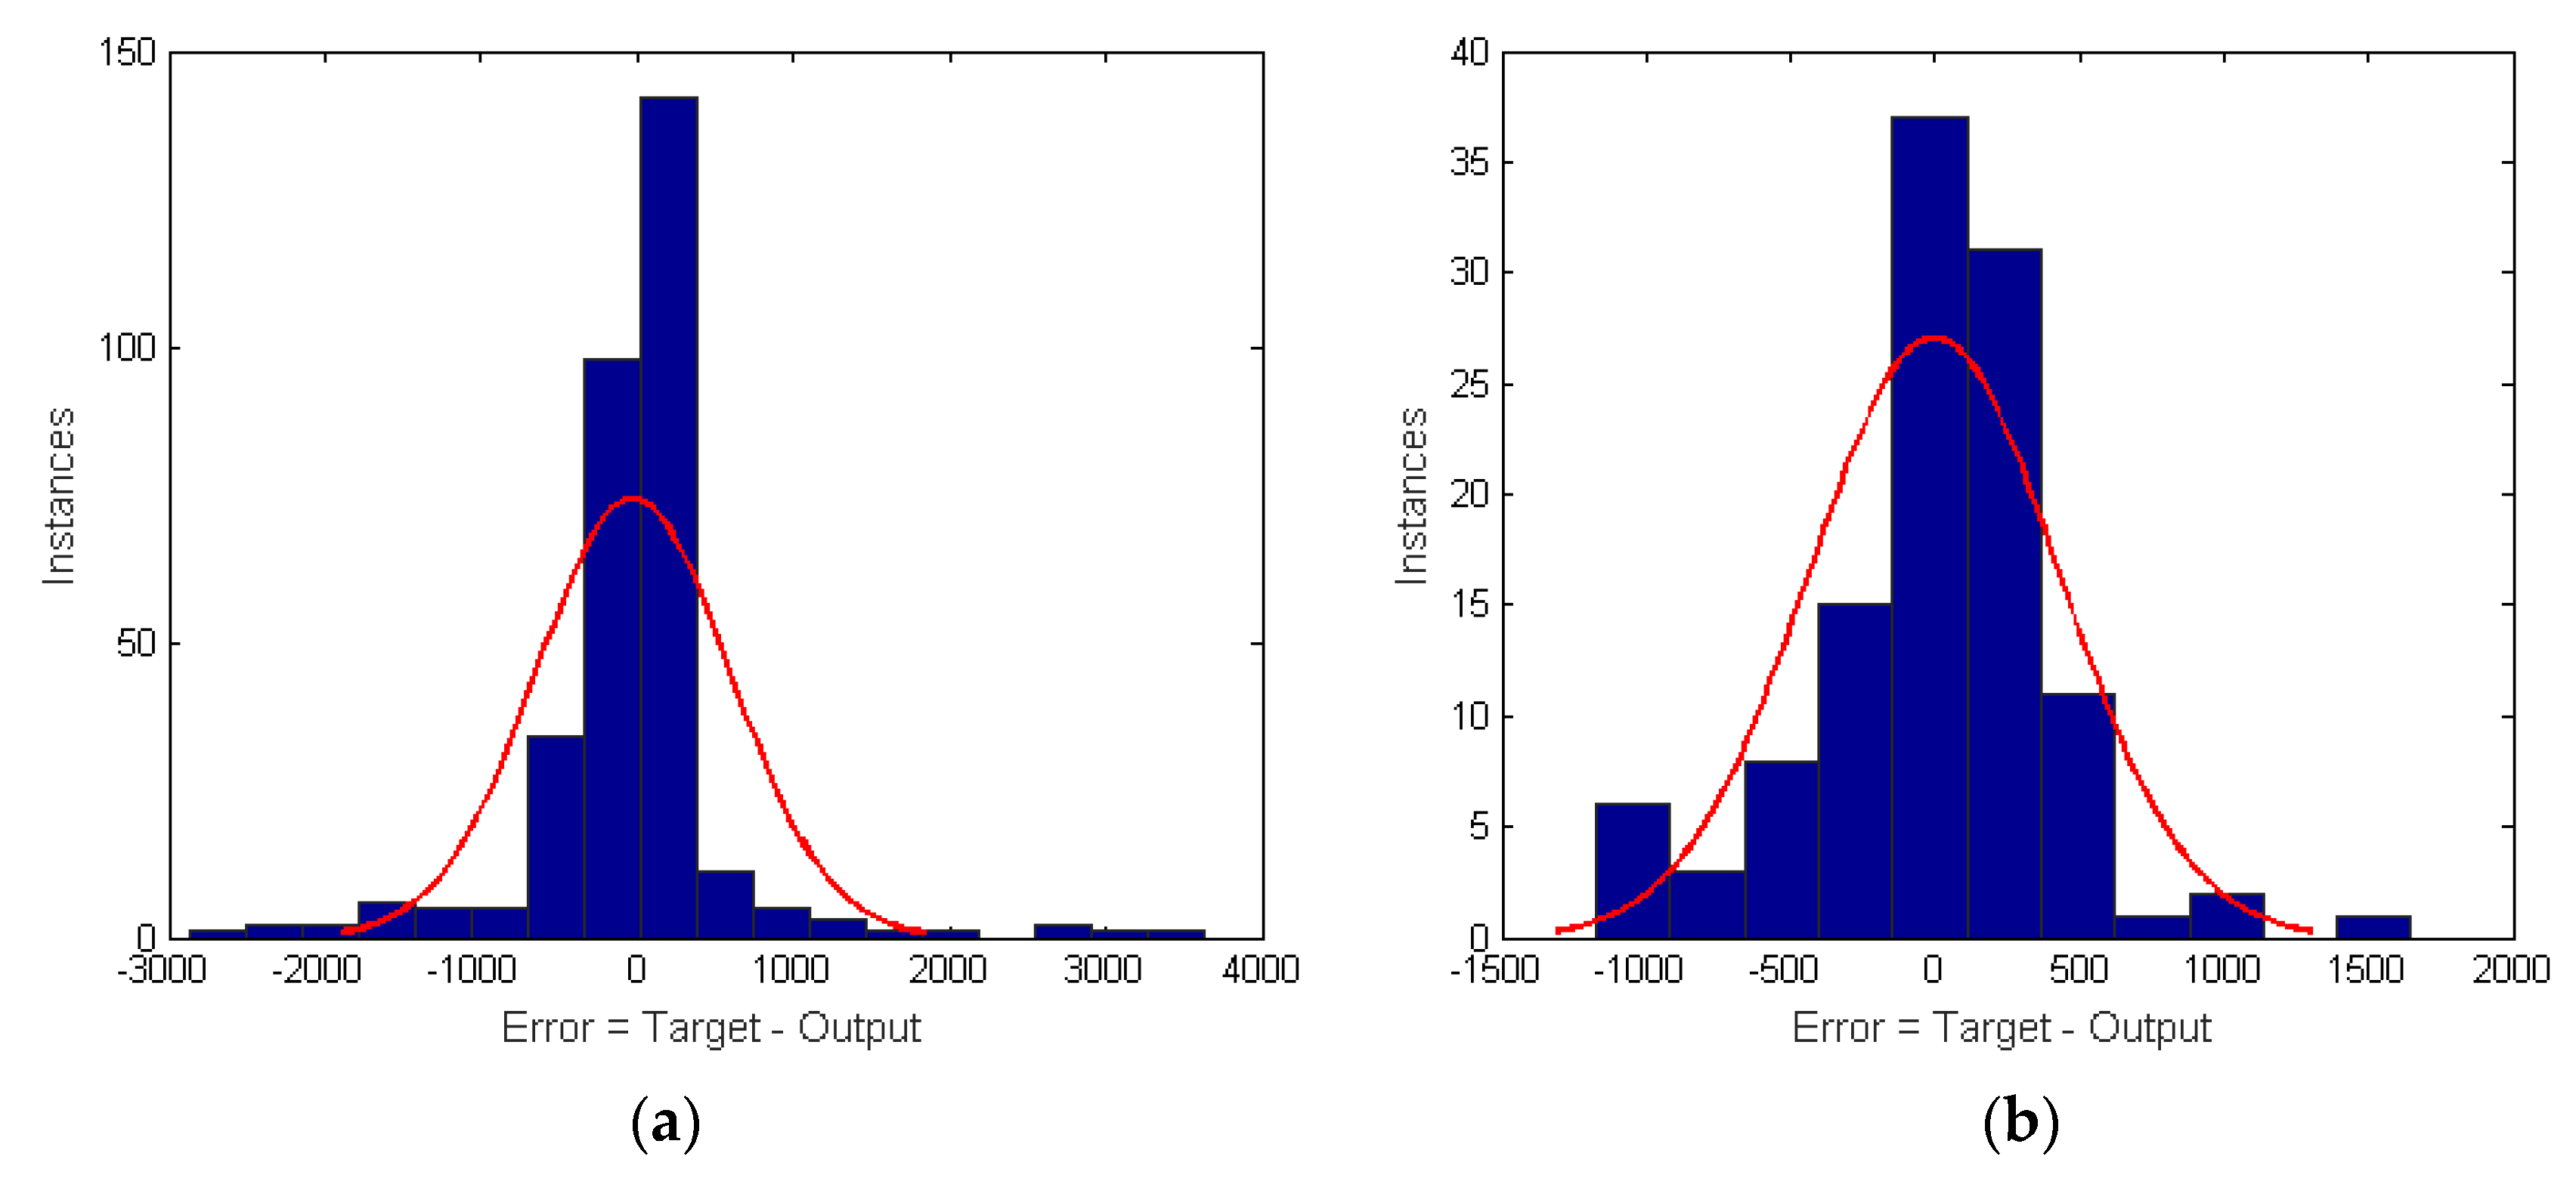
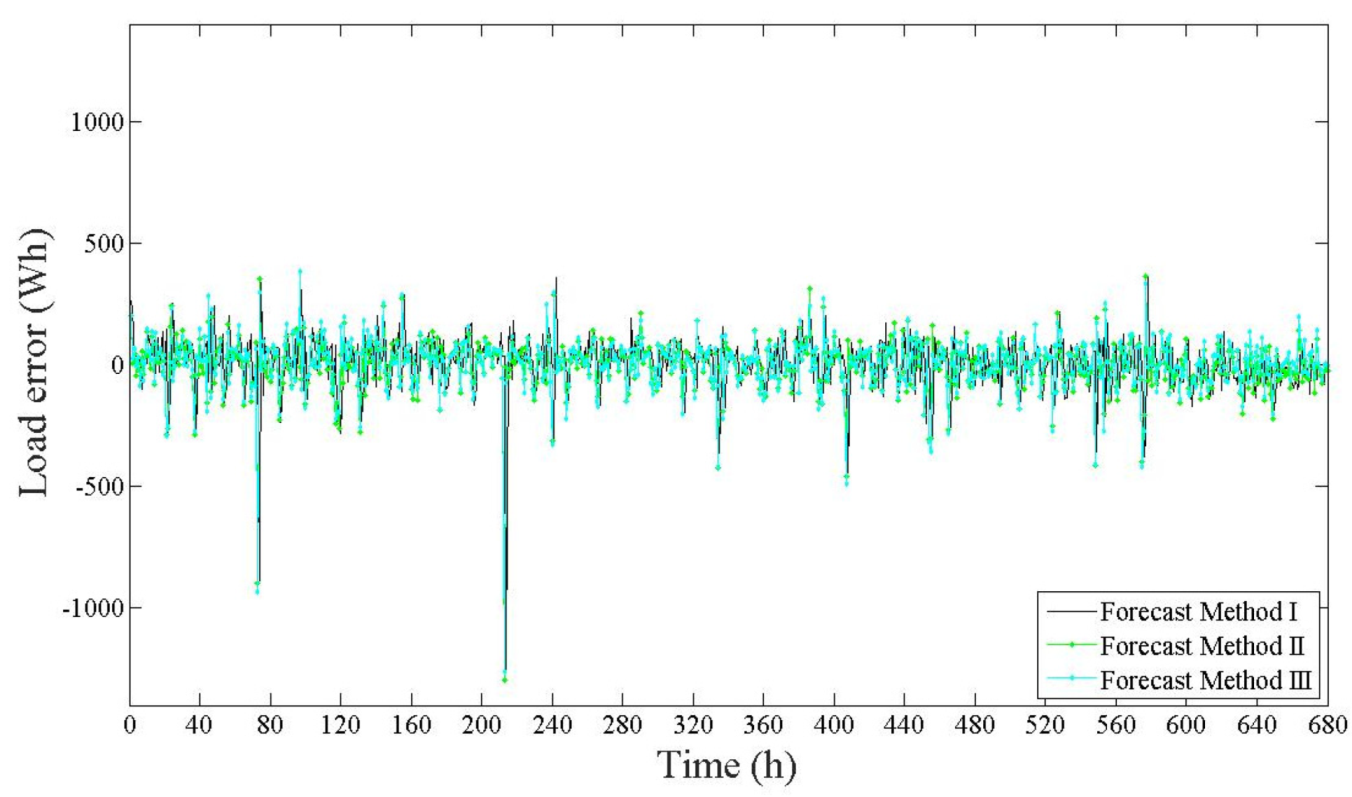
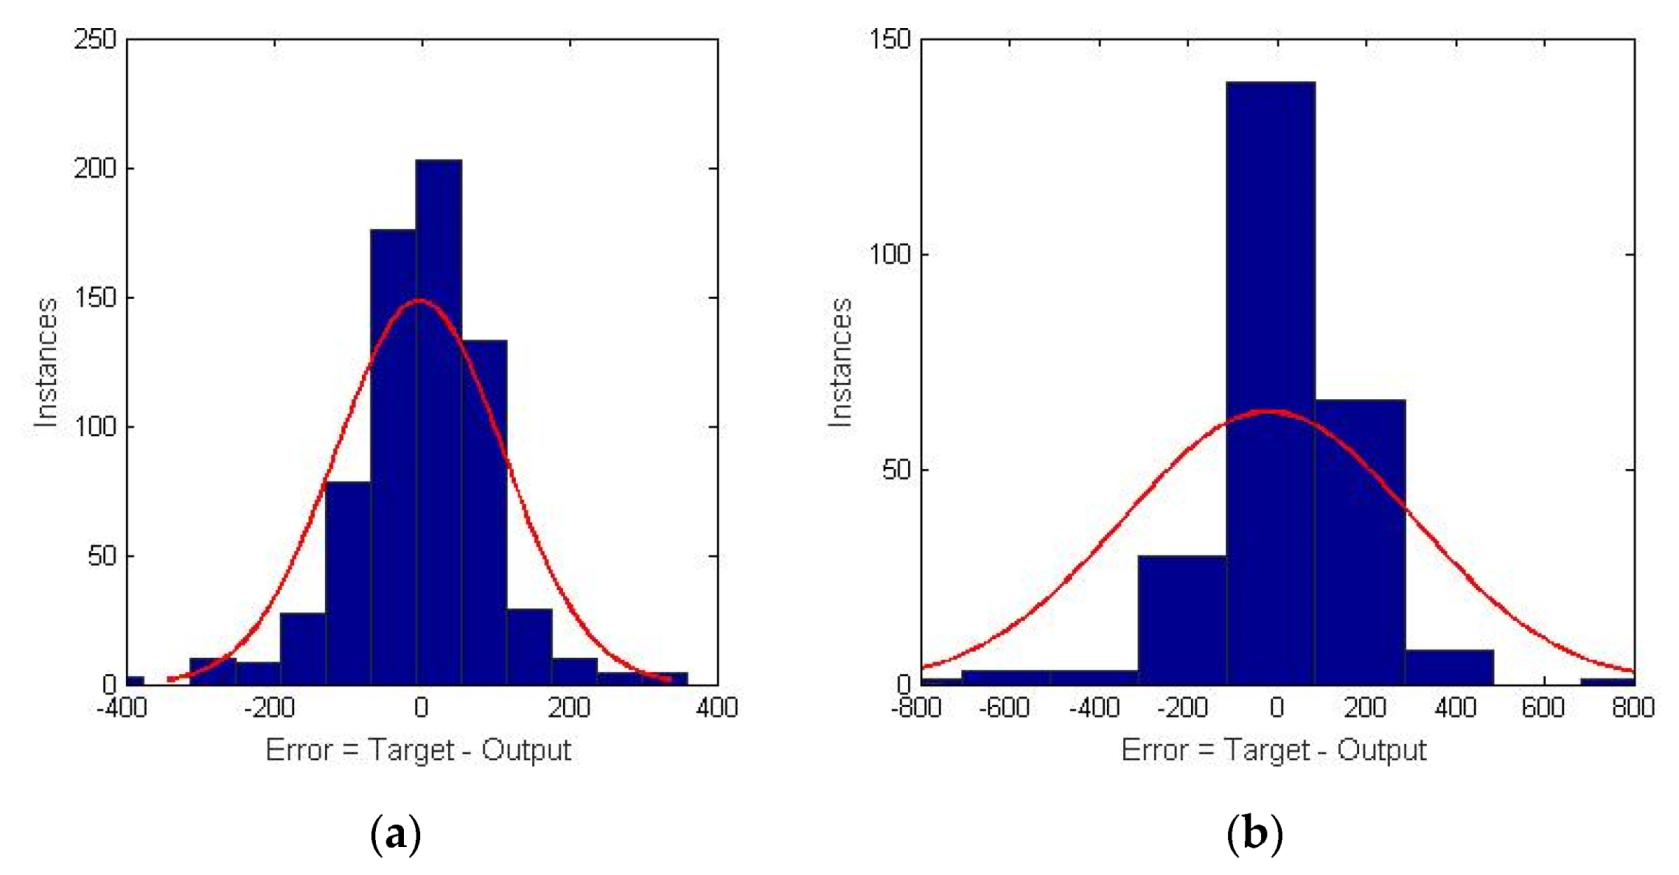
Figure 4 shows the errors resulting from the training.
This study is not a m-class classification problem and does not intend to be a classifier. The receiver operating characteristic (ROC) curves are effective for measuring classifier accuracy in binary-class problems as the f-measure, and for cases of m-class, the kappa statistical metric is applied as a scalar meter of accuracy.

4. Case Studies

ANNs were used to forecast the electric energy load for working days and weekend days. The first ANN model, Method I, used Boolean encoding systems in the input layer, as implemented in [16,18], i.e., 11 inputs (six previous load inputs + five binary for encoding time) in the input layer and one output layer. For Method II, the ANN model does not use a Boolean encoding system. For the encoding, the ANN model used an integer number corresponding to the hour (1, …, 24). Hence, the ANN used seven inputs in the input layer and one output layer. Method III is similar to Method II, with one more input for encoding the day of the week. Table 2 demonstrates the structure of the architecture and the parameters of ANN.
Three study cases were performed to validate the three proposed models mentioned above [16,18,37].
The proposed ANNs are trained by repeating the BP learning set, changing the numbers of neurons in the hidden layer each time the lower error is not reached. The number of neurons achieved for the best forecasting results is shown in Table 3.
The neurons’ number variation per household in Table 3 is justified by the profile of occupation, area, and location. The results with the lowest number of neurons by method and household typology were adopted as standard, as they presented the smallest error.

4.1. Case 1

For the three models mentioned above, in the hidden layer, the numbers of neurons were determined by the best MAPE (see Table 3) and identified by the “Best Fit” in Table 4. The results are presented in Table 4 and Figure 5.
The figures legends that follow have the following correspondences with the study methods and are indicated in Table 1: Method I—bin; Method II—hours; Method III—day.
Figure 6 demonstrates the error forecast during the training process. The three methods demonstrate an acceptable error for energy household forecasting.
An error histogram is shown in Figure 7, and the comments are:
  • The normal distribution (in red) presents a similar mean and standard deviation as the forecasted. There is a close fit between the normal distribution and the forecasted errors;
  • The model is acceptable without consistency issues.

4.2. Case 2

As in Case 1, Table 3 shows the numbers of neurons in the hidden layer that were determined by the best MAPE values and are identified by the “Best Fit” in Table 5, below. The results set by ANNs are presented in Table 5 and Figure 8. In Figure 9, the error forecast during the training process can be observed.
In both, the three methods confirm an acceptable error for similar forecasting. However, the result from Table 5 demonstrates worse forecasting performance than Case 1. Perhaps the explanation is the number of inputs, or the data is not enough to provide forecasting as well as expected. The error histogram is plotted, as shown in Figure 10. Similarly to the previous case, it follows the analysis of histograms that let it make the same observations as those is indicated in Case 1.

4.3. Case 3

As in Case 1 and 2, the numbers of neurons in the hidden layer are shown in Table 3. They were determined by the best MAPE values and are identified by the “Best Fit” in Table 6, below. The results produced by the ANNs are presented in Table 6 and Figure 11.
Figure 12 shows the error forecast during the training process. The three methods confirm an acceptable error for similar forecasting. However, the result from Table 6 shows a better forecasting performance than Case 1 and Case 2. Perhaps the explanation is that the number of inputs is enough to provide forecasting as well as predictability.
The error histogram is plotted as shown in Figure 13. Similarly to the previous cases, it follows the analysis of histograms that let it make the same observations as those indicated in Case 1 and Case 2.

5. Results and Discussion

The ANN model was trained using the hourly data from the previous weeks up to the actual hour for the next load of hours ahead for a random household. According to the results, it seems that there are enough learning data. It was demonstrated that the load based on several and selected days—working days and weekends—improved the accuracy of hourly load forecasting.
In these case studies, the results are reasonable because of the following considerations:
  • The values of the final mean–square errors are acceptable;
  • Test set errors and cross-validations have similar characteristics;
  • No significant overfitting has occurred by iteration. The training phase stopped when the validation error increased for six iterations, which occurred at different epochs (epochs 8, 10, 8, and 5).
The assessment of the ANN performance is based on the shape of the load profile distribution (see Figure 4, Figure 7 and Figure 10) and the following criteria: MAPE and SDE. The forecasting error values of the outputs were calculated as shown in Table 4, Table 5 and Table 6.
The results show a generalized conclusion: the forecasted hourly load curve is closer to the actual load curve, which indicates that the proposed forecasting methods are satisfactory for the domestic sector.
It can also be observed in histograms (Figure 6, Figure 9 and Figure 12) that power demand during the weekend is different from the working days.
In general, the hour-ahead forecast error gradually weakens because the error of an hour contains the error of the preceding hour. MAPE and SDE results show that the proposed methods are satisfactory in forecasting hourly and peak loads.
That means the proposed forecasting methods are suitable tools for forecasting hourly loads ahead for households. The proposed ANNs models have the advantage of dealing only with a few weeks’ history time window and consequently without using exogenous variable inputs. The proposed approach has the advantage of being used in electronic measurement equipment and improving the management of SG and DSM programs.
Table 7 and Table 8 present the forecast error values of the different methods applied in the different households presented in these case studies and those presented in [16,18,37].

6. Conclusions

This paper presented several methods for short-term load forecasting to apply in the residential sector. The methods are based on ANNs and a historical hourly load window of a 6 to 8 week approach, which achieved good performance for a random household.
Neural-network-based load forecasting models were developed, implemented, and trained with actual hourly energy data from [16,18,37] and ended with satisfactory results. The LM algorithm is used to train the ANNs. Special attention was paid to model accurately for weekday and weekend days for the same household. The accuracy of the estimation was measured by comparing the simulated outputs from the network with actual data. Simulations were performed to verify the forecast skill of the proposed methods for hour-ahead load forecasting for several random households and revealed the hourly load forecast results. Figures show that the forecasted from the three methods and actual load curves are close to each other. The results of MAPE and SDE did not demonstrate a clear increasing trend error with the increased hour ahead until the fourth day. As for the performance of the ANNs developed for the simulation of weekend days, the errors calculated were greater than those calculated for weekdays. Probably, the origin of this performance difference lies in the smaller number of input data for ANN training. Only 2 out of 7 days of data were used for weekend day consumption. The results of the three methods do not have significant differences. Thus, it can be concluded that the hour-ahead load forecasting of the analyzed households can use a less complex ANN network that results in less computational effort. Thus, the simplified forecasting model can be applied to devices that do not have a large availability of memory and/or CPU, such as smart meters. On the other hand, families in a condition of energy poverty can benefit from this energy forecast, as they have a relatively regular load profile [45].
The estimated load was analyzed using a performance-based statistical analysis tool. The error distribution is not far from a normal distribution. The distribution function is another way to check the good ANN consistency. In comparison with previous works [16,18,37], the error results are of the same order of magnitude.
Thereby, the tools can be performed well and can be deployed in SHEM or an “energy box” of a residential or small building.
Beyond the traditional forecasting for the next day, the forecasting for the next hour of a random household is also required for SG systems and DSM programs to operate the power system reliably and economically.
This paper is also a contribution to support the design of solutions for Smart Living service providers under the Industry 5.0 vision.

Author Contributions

Conceptualization, F.M.R.; methodology, F.M.R., C.C., J.M.F.C. and R.M.; software, F.M.R.; validation, F.M.R., C.C., J.M.F.C. and R.M.; investigation, F.M.R., C.C., J.M.F.C. and R.M.; writing—original draft preparation, F.M.R.; writing—review and editing, C.C., J.M.F.C. and R.M.; supervision, C.C., J.M.F.C. and R.M. All authors have read and agreed to the published version of the manuscript.

Funding

This research received no external funding.

Institutional Review Board Statement

Not applicable.

Informed Consent Statement

Not applicable.

Data Availability Statement

Not applicable.

Acknowledgments

This work was supported by FCT, through IDMEC, under LAETA, project UIDB/50022/2020 and FCT under the ICT (Institute of Earth Sciences) project UIDB/04683/2020.

Conflicts of Interest

The authors declare no conflict of interest.

References

  1. Hirsch-Kreinsen, H. “Industry 4.0” as Promising Technology: Emergence, Semantics and Ambivalent Character; Technische Universität Dortmund: Dortmund, Germany, 2016; ISSN 1612-5355. [Google Scholar]
  2. Zhong, R.Y.; Xu, X.; Klotz, E.; Newman, S.T. Intelligent Manufacturing in the Context of Industry 4.0: A. Review. Engineering 2017, 3, 616–630. [Google Scholar] [CrossRef]
  3. Batista, N.C.; Melicio, R.; Mendes, V.M.F. Services enabler architecture for smart grid and smart living services providers under Industry 4.0. Energy Build. 2017, 141, 16–27. [Google Scholar] [CrossRef] [Green Version]
  4. Albach, H.; Meffert, H.; Pinkwart, A.; Reichwald, R. Management of Permanent Change—New Challenges and Opportunities for Change Management. In Management of Permanent Change; Springer Gabler: Wiesbaden, Germany, 2015; pp. 3–21. [Google Scholar]
  5. Gomes, I.L.R.; Pousinho, H.M.I.; Melicio, R.; Mendes, V.M.F. Optimization of Wind Power Producer Participation in Electricity Markets with Energy Storage in a Way of Energy 4.0. In Proceedings of the International Joint Conference SOCO’17-CISIS’17-ICUTE’17, León, Spain, 6–8 September 2017; pp. 91–101. [Google Scholar]
  6. Ghobakhloo, M.; Fathi, M. Industry 4.0 and opportunities for energy sustainability. J. Clean. Prod. 2021, 295, 126427. [Google Scholar] [CrossRef]
  7. Jebaraj, S.; Iniyan, S. A review of energy models. Renew. Sustain. Energy Rev. 2006, 10, 281–311. [Google Scholar] [CrossRef]
  8. Oyedepo, S.O. On energy for sustainable development in Nigeria. Renew. Sustain. Energy Rev. 2012, 16, 2583–2598. [Google Scholar] [CrossRef]
  9. Suganthi, L.; Samuel, A.A. Energy models for demand forecasting—A review. Renew. Sustain. Energy Rev. 2012, 16, 1223–1240. [Google Scholar] [CrossRef]
  10. Ozturk, Ilhan. Energy dependency and energy security: The role of energy efficiency and renewable energy sources. Pak. Dev. Rev. 2016, 52, 309–330. [Google Scholar]
  11. Saad Al-Sumaiti, A.; Ahmed, M.H.; Salama, M.M. Smart home activities: A literature review. Electr. Power Compon. Syst. 2014, 42, 294–305. [Google Scholar] [CrossRef]
  12. Soares, A.; Gomes, A.; Antunes, C.H. Domestic load characterization for demand-responsive energy management systems. In Proceedings of the 2012 IEEE International Symposium on Sustainable Systems and Technology (ISSST), Boston, MA, USA, 16–18 May 2012; pp. 1–6. [Google Scholar]
  13. Eltamaly, A.M.; Mohamed, M.A.; Alolah, A.I. A novel smart grid theory for optimal sizing of hybrid renewable energy systems. Sol. Energy 2016, 124, 26–38. [Google Scholar] [CrossRef]
  14. Ryu, S.; Noh, J.; Kim, H. Deep neural network based demand side short term load forecasting. Energies 2016, 10, 3. [Google Scholar] [CrossRef]
  15. Yildiz, B.; Bilbao, J.I.; Dore, J.; Sproul, A.B. Recent advances in the analysis of residential electricity consumption and applications of smart meter data. Appl. Energy 2017, 208, 402–427. [Google Scholar] [CrossRef]
  16. Rodrigues, F.; Cardeira, C.; Calado, J.M.F. The daily and hourly energy consumption and load forecasting using artificial neural network method: A case study using a set of 93 households in Portugal. Energy Procedia 2014, 62, 220–229. [Google Scholar] [CrossRef] [Green Version]
  17. Rodrigues, F.; Cardeira, C.; Calado, J.M.F.; Melício, R. Load profile analysis tool for electrical appliances in households. In Proceedings of the Energy Economics Iberian Conference, Lisbon, Portugal, 4–5 February 2016; pp. 1–8. [Google Scholar]
  18. Rodrigues, F.; Cardeira, C.; Calado, J.M.F.; Melício, R. Energy household forecast with ANN for demand response and demand side management. In Proceedings of the International Conference on Renewable Energies and Power Quality-ICREPQ, Renewable Energy and Power Quality Journal (RE&PQJ), Madrid, Spain, 4–6 May 2016; pp. 1–8. [Google Scholar]
  19. Kagermann, H. Change through digitization—Value creation in the age of Industry 4.0. In Management of Permanent Change; Springer Gabler: Wiesbaden, Germany, 2015; pp. 23–45. [Google Scholar]
  20. Vardakas, J.S.; Zorba, N.; Verikoukis, C.V. A survey on demand response programs in smart grids: Pricing methods and optimization algorithms. Commun. Surv. Tutor. 2015, 17, 152–178. [Google Scholar] [CrossRef]
  21. Rahman, M.M.; Shakeri, M.; Tiong, S.K.; Khatun, F.; Amin, N.; Pasupuleti, J.; Hasan, M.K. Prospective Methodologies in Hybrid Renewable Energy Systems for Energy Prediction Using Artificial Neural Networks. Sustainability 2021, 13, 2393. [Google Scholar] [CrossRef]
  22. Qiu, J.; Liu, J.; Hou, Y.; Zhang, J. Use of real-time/historical database in smart grid. In Proceedings of the 2011 International Conference on Electric Information and Control Engineering, Wuhan, China, 15–17 April 2011. [Google Scholar]
  23. Khan, A.R.; Mahmood, A.; Safdar, A.; Khan, Z.A.; Khan, N.A. Load forecasting, dynamic pricing and DSM in smart grid: A review. Renew. Sustain. Energy Rev. 2016, 54, 1311–1322. [Google Scholar] [CrossRef]
  24. Mandal, P.; Senjyu, T.; Urasaki, N.; Funabashi, T. A neural network based several-hour-ahead electric load forecasting using similar days approach. Int. J. Electr. Power Energy Syst. 2006, 28, 367–373. [Google Scholar] [CrossRef]
  25. Berriel, R.F.; Lopes, A.T.; Rodrigues, A.; Varejão, F.M.; Oliveira-Santos, T. Monthly energy consumption forecast: A deep learning approach. In Neural Networks (IJCNN), Proceedings of the International Joint Conference on IEEE, Anchorage, AK, USA, 14–19 May 2017; IEEE: New York, NY, USA, 2009; pp. 4283–4290. [Google Scholar]
  26. Kyriakides, E.; Polycarpou, M. Short term electric load forecasting: A tutorial. In Trends in Neural Computation; Springer: Berlin/Heidelberg, Germany, 2007; pp. 391–418. [Google Scholar]
  27. Metaxiotis, K.; Kagiannas, A.; Askounis, D.; Psarras, J. Artificial intelligence in short term electric load forecasting: A state-of-the-art survey for the researcher. Energy Convers. Manag. 2003, 44, 1525–1534. [Google Scholar] [CrossRef]
  28. Tasre, M.B.; Ghate, V.N.; Bedekar, P.P. Hourly load forecasting using artificial neural network for a small area. In Proceedings of the 2012 International Conference on Advances in Engineering, Science and Management (ICAESM), Nagapattinam, India, 30–31 March 2012; pp. 379–385. [Google Scholar]
  29. Tasre, M.B.; Ghate, V.N.; Bedekar, P.P. Comparative analysis of hourly load forecast for a small load area. In Proceedings of the 2012 International Conference on Computing, Electronics and Electrical Technologies (ICCEET), Nagapattinam, India, 30–31 March 2012; pp. 80–85. [Google Scholar]
  30. Lusis, P.; Khalilpour, K.R.; Andrew, L.; Liebman, A. Short-term residential load forecasting: Impact of calendar effects and forecast granularity. Appl. Energy 2017, 205, 654–669. [Google Scholar] [CrossRef]
  31. Ghofrani, M.; Hassanzadeh, M.; Etezadi-Amoli, M.; Fadali, M.S. Smart meter based short-term load forecasting for residential consumers. In Proceedings of the North American Power Symposium (NAPS), Boston, MA, USA, 4–6 August 2011; pp. 1–5. [Google Scholar]
  32. Tascikaraoglu, A.; Sanandaji, B.M. Short-term residential electric load forecasting: A compressive spatio-temporal approach. Energy Build. 2016, 111, 380–392. [Google Scholar] [CrossRef]
  33. Siano, P. Demand response and smart grids—A survey. Renew. Sustain. Energy Rev. 2014, 30, 461–478. [Google Scholar] [CrossRef]
  34. Deng, R.; Yang, Z.; Chow, M.Y.; Chen, J. A survey on demand response in smart grids: Mathematical models and approaches. In IEEE Transactions on Industrial Informatics; IEEE: New York, NY, USA, 2015; pp. 570–582. [Google Scholar]
  35. Zebulum, R.S.; Vellasco, M.; Guedes, K.; Pacheco, M.A. Short-term load forecasting using neural nets. In Natural to Artificial Neural Computation; Springer: Berlin/Heidelberg, Germany, 1995; pp. 1001–1008. [Google Scholar]
  36. Al-Shareef, A.J.; Muhammad, E.A.; Al-Judaibi, E. Next 24-Hours Load Forecasting Using Artificial Neural Network (ANN) for the Western Area of Saudi Arabia. Eng. Sci. 2008, 19, 15. [Google Scholar] [CrossRef]
  37. Rodrigues, F.; Cardeira, C.; Calado, J.M.F. Neural Networks Applied to Short Term Load Forecasting: A Case Study. In Smart Energy Control Systems for Sustainable Buildings; Springer: Cham, Switzerland, 2017; pp. 173–197. [Google Scholar]
  38. Catalão, J.P.D.S.; Mariano, S.J.P.S.; Mendes, V.M.F.; Ferreira, L.A.F.M. Short-term electricity prices forecasting in a competitive market: A neural network approach. Electr. Power Syst. Res. 2007, 77, 1297–1304. [Google Scholar] [CrossRef] [Green Version]
  39. Catalão, J.P.S.; Mariano, S.J.P.S.; Mendes, V.M.F.; Ferreira, L.A.F.M. An artificial neural network approach for short-term electricity prices forecasting. In Proceedings of the International Conference on Intelligent Systems Applications to Power Systems, (ISAP 2007), Kaohsiung, Taiwan, 5–8 November 2007; pp. 1–6. [Google Scholar]
  40. Catalão, J.P.D.S.; Pousinho, H.M.I.; Mendes, V.M.F. An artificial neural network approach for short-term wind power forecasting in Portugal. In Proceedings of the 15th International Conference on Intelligent System Applications to Power Systems, (ISAP′09), Curitiba, Brazil, 8–12 November 2009; pp. 1–5. [Google Scholar]
  41. Lera, G.; Pinzolas, M. Neighborhood based Levenberg-Marquardt algorithm for neural network training. IEEE Trans. Neural Netw. 2002, 13, 1200–1203. [Google Scholar] [CrossRef] [PubMed]
  42. Zayani, R.; Bouallegue, R.; Roviras, D. Levenberg-Marquardt learning neural network for adaptive predistortion for time-varying HPA with memory in OFDM systems. In Proceedings of the Signal Processing Conference, Lausanne, Switzerland, 25–29 August 2008; pp. 1–5. [Google Scholar]
  43. Lehmann, E.L.; Casella, G. Theory of Point Estimation, 2nd ed.; Springer: Berlin/Heidelberg, Germany, 2006. [Google Scholar]
  44. Tofallis, C. A better measure of relative prediction accuracy for model selection and model estimation. J. Oper. Res. Soc. 2015, 66, 1352–1362. [Google Scholar] [CrossRef] [Green Version]
  45. Kayri, M. Predictive abilities of bayesian regularization and Levenberg–Marquardt algorithms in artificial neural networks: A comparative empirical study on social data. Math. Comput. Appl. 2016, 21, 1–11. [Google Scholar] [CrossRef]
Figure 1. ANN model used in [4,14].
Energies 15 00957 g001
Figure 2. Proposed flowchart to optimize the MAPE.
Energies 15 00957 g002
Figure 3. (a) H85—MSE of Method II—Workdays; (b) H85—MSE of Method II—Weekend; (c) H85—MSE of Method III—Working days; (d) H85—MSE Method III—Weekend.
Energies 15 00957 g003aEnergies 15 00957 g003b
Figure 4. (a) H85—Errors of Method II—Workdays; (b) H85—Errors of Method II—Weekend; (c) H85—Errors of Method III—Working days; (d) H85—Errors Method III—Weekend.
Energies 15 00957 g004
Figure 5. Forecast hourly load of working days of household No 71.
Energies 15 00957 g005
Figure 6. Training error for forecast hourly load of working days of household No 71.
Energies 15 00957 g006
Figure 7. (a) Household No 71—Working days forecast error distribution; (b) household No 71—Weekend forecast error distribution.
Energies 15 00957 g007
Figure 8. Forecast hourly load of working days of household No 73.
Energies 15 00957 g008
Figure 9. Training error for forecast hourly load of working days of household No 73.
Energies 15 00957 g009
Figure 10. (a) Household No 73—Working days forecast error distribution; (b) household No 73—Weekend forecast error distribution.
Energies 15 00957 g010
Figure 11. Forecast hourly load of working days of household No 85.
Energies 15 00957 g011
Figure 12. Training error for forecast hourly load of working days of household No 85.
Energies 15 00957 g012
Figure 13. (a) Household No 85—Working days forecast error distribution; (b) household No 85—Weekend forecast error distribution.
Energies 15 00957 g013
Table 1. ANN inputs and neurons used.
InputsNumber of Neurons Used in the Input Layer
hk five last hour’s history load (k = 1, …, 5)5
hk last 24th hour’s load1
bi,j One of the following encoding forecast time (i,j):
 Method I—Binary (i = 1, …, 5); split
 for workdays and weekends;
5
 Method II—Hour (i = 1, …, 24); split
 for workdays and weekends;
1
 Method III—Day and hour:
  Workday (i = 1, …, 24; j = 1, …, 5)1 + 1
  Weekend (i = 1, …, 24; j = 6, 7)1 + 1
Table 2. ANNs network parameters.
Network ParametersMethods
IIIIII
Number of values used in each household:
 Training70% available in DataBase
 Validation15% available in DataBase
 Tested15% available in DataBase
Number of layers3
Initial weights and biasesRandomly between 0 and 1
Number of neurons in the input layer1178
Number of neurons in the hidden layerTable 3
Number of neurons in the output layer1
Activation functionSigmoid
Learning algorithmLevenberg-Marquardt
Method for avoiding overfittingEarly stopping criteria by MSE
OptimizerGradient descent and Gauss-Newton
Table 3. Neurons of hidden layer.
Neurons
HouseholdIIIIII
H712189
H739611
H853114
Table 4. Forecasting error values of the outputs.
Household No 71
MAPE (%)SDE
IIIIIIIIIIII
Working Days
Best Fit16.2915.4015.4121.0519.5819.79
1st17.7018.2921.0249.5552.8860.41
2nd16.1918.4517.3452.2656.5950.14
3rd15.9712.7814.0641.6730.9136.36
4th17.3113.5515.2348.6037.2140.65
5th191.50192.45196.42349.90354.97350.45
Weekend
Best Fit34.8078.8123.1848.7878.8165.37
Saturday25.4191.4718.0785.7691.4770.40
Sunday29.26128.8828.72114.48128.88108.18
Table 5. Forecasting error values of the outputs.
Household No 73
MAPE (%)SDE
IIIIIIIIIIII
Working Days
Best Fit23.9822.6323.2738.4932.0539.45
1st15.7812.6711.0647.7832.7940.63
2nd21.7523.7022.4467.6770.3466.36
3rd23.8321.5821.7190.5071.0975.34
4th14.5617.3318.1660.6461.7056.62
5th161.13171.66166.94589.78540.99589.56
Weekend
Best Fit27.0622.0327.4067.9758.7673.43
Saturday27.1622.5128.5399.8189.69122.17
Sunday23.9423.3722.9189.5677.8280.23
Table 6. Forecasting error values of the outputs.
Household No 85
MAPE (%)SDE
IIIIIIIIIIII
Working Days
Best Fit13.0914.4813.908.408.808.05
1st18.1316.2112.5825.5824.2718.11
2nd11.9512.9914.0814.1016.8717.22
3rd10.7314.0213.0116.9319.1718.58
4th9.9213.5514.6011.9515.4016.71
5th200.45204.09205.7957.2151.4751.71
Weekend
Best Fit28.8718.6521.5320.1724.3731.14
Saturday29.1414.6321.3480.6223.0546.29
Sunday16.7424.5921.1440.3242.8242.10
Table 7. Statistical analysis of the forecasting MAPE (%) values of the outputs.
H64H65H71H73H85
MethodIIIIIIIIIIIIIIIIIIII
1st Day16.0021.5016.2915.4015.4123.9822.6323.2713.0914.4813.90
2nd Day10.0019.3017.7018.2921.0215.7812.6711.0618.1316.2112.58
3rd Day12.9023.5016.1918.4517.3421.7523.7022.4411.9512.9914.08
Table 8. Statistical analysis of the forecasting SDE values of the outputs.
H64H65H71H73H85
MethodIIIIIIIIIIIIIIIIIIII
1st Day23.0017.0021.0519.5819.7938.4932.0539.458.408.808.05
2nd Day9.0021.0049.5552.8860.4147.7832.7940.6325.5824.2718.11
3rd Day14.0022.0052.2656.5950.1467.6770.3466.3614.1016.8717.22
Publisher’s Note: MDPI stays neutral with regard to jurisdictional claims in published maps and institutional affiliations.

