
An Assessment of the Net Fluid Balance in the Alberta Basin
by
Mahendra Samaroo
1,*, 
Rick Chalaturnyk
1,
Maurice Dusseault
2,
Richard Jackson
3,
Arndt Buhlmann
4 and
Hans Custers
4 1
Department of Civil and Environmental Engineering, University of Alberta, Edmonton, AB T6G 2R3, Canada
2
Department of Earth and Environmental Sciences, University of Waterloo, Waterloo, ON N2L 3G1, Canada
3
Geofirma Engineering, Ottawa, ON K1R 1A2, Canada
4
Alberta Department of Energy, Edmonton, AB T5K 2G6, Canada
*
Author to whom correspondence should be addressed.
Energies 2022, 15(3), 1081; https://0-doi-org.brum.beds.ac.uk/10.3390/en15031081
Submission received: 11 January 2022
/
Revised: 28 January 2022
/
Accepted: 29 January 2022
/
Published: 1 February 2022
(This article belongs to the Special Issue State of the Art Geo-Energy Technology in North America)
Abstract
:Net fluid balance in the Alberta Basin has been negative over the last 60 years because extensive fluid production has consistently exceeded injection during this period. However, future gigaton-scale carbon sequestration, among other activities, can result in future cumulative fluid injection exceeding extraction (i.e., a positive net fluid balance). The in-situ net fluid balance (i.e., total fluids produced minus total fluids injected) in this basin over the period 1960–2020 shows that a liquids deficit of 4.53 × 10⁹ m3 and a gas deficit of 6.05 × 10¹² m3 currently exist. However, fluid deficits are more significant in the upper stratigraphic intervals (located more than 1 km above the Precambrian Basement) than in the stratigraphic intervals located within 1 km of the Precambrian Basement in most geographic regions. This observation indicates that greater sustainable injection capacity for large-scale fluid injection may exist in the upper stratigraphic intervals (located at more than 1 km above the Precambrian Basement), reducing the potential for generating induced seismicity of concern. Additionally, while fluid depletion rates consistently increased over most of the last 60 years in the Alberta Basin, this trend appears to have changed over the past few years. Such analysis of regional net fluid balance and trends may be useful in assessing regional sustainable fluid storage capacity and managing induced seismicity hazards.
1. Introduction
Public policy developed on the basis of foundational science and evidence is essential for managing societal risk [1]. Empowering policymakers with sufficient information to make informed decisions significantly improves the likelihood of developing and implementing strategic public policy that mitigates risk, improves community resilience, and enhances public trust. Effective critical information for such purposes focuses on what results are known rather than the uncertainties or the process by which such information is derived [2].
Significant research has been conducted on developing methods to quantify the hazards associated with large-volume subsurface fluid injection and storage over the last century (e.g., [3]). These efforts intensified over the last two decades, focusing on developing methods to assess site performance risks and enhance public confidence in (future) large-scale carbon capture and storage activities [4]. These methods and frameworks have traditionally focused on project-scale injected fluid containment assurance, conformance, injection pressure and injectivity risks, with limited emphasis on the potential for generating felt induced seismicity (e.g., [5,6,7]). Such emphasis on containment and conformance with little focus on induced seismicity generation and its impacts on infrastructure and inhabitants is reflected in the published risk assessments for major fluid injection projects conducted in the Western Canadian Sedimentary Basin (WCSB) (e.g., [8,9,10,11,12,13,14,15,16,17]).
The potential to generate induced seismicity that can affect surface infrastructure and population is a key hazard that should also be a consideration of risk assessments conducted for large-volume fluid injection projects. Fluid injection into even underpressured formations hydraulically connected to the geological basement significantly increases seismicity risk even in stable intraplate areas, and minor increases in pore pressure (as low as 0.8 kPa in some cases) are capable of reactivating critically stressed faults and triggering seismicity [18,19,20]. Meanwhile, over its lifetime, an industrial-scale carbon dioxide injection project has the potential to pressurize basin-scale radii of up to 100 km by more than 100 kPa, even though the actual injected fluid plume may be constrained to linear dimensions of under 10 km [21,22,23].
A common element in current seismicity root-cause hypotheses is that deep basement faults pose the greatest hazard [24,25,26,27], and the existence of a hydraulic connection from the injection horizon to the Precambrian basement greatly increases the likelihood of seismicity of concern [28,29,30,31,32,33]. A principal hazard factor identified to date is the proximity of the injection horizon to the crystalline basement (i.e., a proxy that considers the probability of hydraulic connection and poroelastic stress transfer between the injection horizon and the crystalline basement), with a threshold vertical distance of 1 km or less considered hazardous [25,26,34,35,36,37]. The other hazard factor is the volume of fluid injected, with the number and size of potential seismic events generally proportional to the cumulative volume of fluid injected [38,39,40,41,42,43]. Management of these two factors has been shown to be a practical tool for managing the potential for occurrence and controlling induced seismicity of concern in high-volume fluid injection projects [44,45,46,47]. In addition, the net fluid balance (the difference between fluid injected into and fluid removed from the same zone in the subsurface) has the most impact on changing subsurface pore pressure over time; projects that maintain a balance between fluid injection and withdrawal generate fewer seismic events [48]. Regional or basin-scale fluid budgets that maintain a zero or negative net fluid balance, particularly within one kilometre of the Precambrian basement, could help reduce the potential for generating seismic events of concern in large-scale injection projects [37,49].
Deep injection of large fluid volumes is likely to increase significantly in the WCSB, arising from a substantial increase in energy-related carbon sequestration activities. Concurrently, a future energy transition is expected to substantially reduce the amount of hydrocarbon fluids removed from this basin. These macro-trends have the potential to increase injection-formation pore pressures in this basin. Consequently, there is a need to evaluate the net fluid budget in this basin to assess and sustainably manage its fluid injection capacity. In cases of industrial-scale fluid injection, even in underpressured reservoirs, basin-wide fluid injection budget assessment (and management) is an essential requirement for mitigating the potential for generating induced seismicity of concern [37,46].
This paper uses widely available measured (high confidence) volumetric data collected regularly for production and royalty accounting to construct a regional-scale net fluid balance for the Alberta Basin (a sub-basin within the WCSB) for the period 1960–2020. Such regional-scale net fluid balance assessments may be useful to policymakers and regulators for determining sustainable regional and basin-scale subsurface fluid storage capacity, managing basin-scale fluid budgets, and mitigating fluid-injection-related hazards such as induced seismicity. This evaluation shows that the largest fluid deficits (and sustainable fluid injection capacity) in the Alberta Basin exist in the stratigraphic horizons located more than 1 km above the Precambrian basement in select geographic locations. In addition, this evaluation also demonstrates that regional-scale fluid budget assessments can be conducted with relative ease using available information collected for production (volumetric) accounting purposes.
2. Materials and Methods
The considerable extent of the Alberta Basin and the geological and stratigraphic variations across its geography necessitates the use of a sector-based approach to isolate regional net fluid balance trends and identify areas in which proactive subsurface basin fluid management may be required. The use of production and royalty accounting data to estimate in-situ volumes requires conversion of surface volumes to subsurface volumes to account for differences between the surface measurement and subsurface reservoir conditions.
2.1. Subdivision of the Alberta Basin into Distinct Geology/Industrial Activity Regions
The Petroleum Services Association of Canada (PSAC) subdivision of the geographic regions within the Alberta Basin defines seven areas that are geologically distinct and/or have common (unique) resource characteristics. Each of these seven areas corresponds to a specific (predominant) type of geologic interest in the oil and gas industry [50,51]. This subdivision has been used since the early 1970s to characterize geographic patterns of oil and gas activity across the Alberta basin. These include oil and natural gas exploration, drilling, production, reserves, and cost statistics (e.g., the annual AER ST98 industry activity statistical reports) as well as PSAC-area specific benchmarks for well depths, drilling, and completion costs (e.g., the semi-annual PSAC Well Cost study). This subdivision is therefore suitable for characterizing trends in net fluid balance and industrial activity patterns within the Alberta Basin since each area is illustrative of the underlying geology and industrial activity types and is used to benchmark its historical, current and future industrial activity levels [51,52]. Figure 1 below shows the seven PSAC areas in Alberta.
Within the Alberta Basin, the thickness of the package of dipping sedimentary rocks exceeds six kilometres in the southwest (adjacent to the Rocky Mountain Foothills). However, it thins to zero in the northeast due to depositional thinning and erosion [53,54]. Consequently, common (median) well depths to the formations of interest in each region vary, with well depths being the shallowest in the northeast (in AB6) and increasing to the southwest (in AB1) as the thickness of the sedimentary package increases.
Since the predominant type of geologic interest in each area varies, the levels of industrial activity in each area also vary as a function of the market conditions during each period for the specific type of oil and gas products. Major (current) geologic interest in areas AB1, AB2, AB3, AB5, and AB7 are the deep (kilometre-scale) natural gas liquids-rich Duvernay Formation shale (Figure 1), with AB2 accounting for more than half of Alberta’s natural gas production and most of its condensate production in 2019 [52]. These areas are expected to account for most of Alberta’s industrial activity for the production of higher-value light crude oil, natural gas, and natural gas liquids over the next decade [52]. The availability of ample low-cost nearby subsurface pore space for the disposal of the large quantities of produced waste fluids (flowback) is vital for the commercial feasibility of hydraulic fracturing technology currently used to extract natural gas and condensates from shale formations [55,56].
Shallow (around 500 m deep) bitumen deposits are the predominant geologic interest in AB4, AB6, and much of AB7. Approximately three million barrels per day of crude bitumen were produced from these areas in 2020 [52]. Mining and steam-based oil extraction technologies used to produce bitumen in these areas dispose of large quantities of liquid process wastes (such as produced fluids, mine dewatering fluids, and boiler blowdown) by injection into saline aquifers, while the in-situ thermal facilities in this region extract large quantities of water from these saline aquifers to generate steam used in bitumen production. However, current understanding of the hydrologic link between surface water bodies, shallow groundwater, and deep saline aquifers is limited at the regional scale, and detailed studies are required to assess the scale of anthropogenic-induced changes (if any) on the regional hydrologic balance of this area [57,58].
Historically, oil and gas activity in AB5 has been the production of conventional oil and natural gas deposits, which have been largely depleted [52]. While this area also contains liquid-rich shale formations, production activity over the next decade is anticipated to be lower than in other areas, because of lower well-productivity rates and higher production/supply costs associated with industrial-scale operations near-urban environments [52].
2.2. Calculation of Formation Volume Factors for Each Injection/Production Horizon in the Alberta Basin
The net fluid balance (also referred to as the net cumulative volume) is often used to characterize the fluid storage capacity of a formation. It consists of the cumulative volume of fluids (oil, gas, and water) removed from a formation minus the cumulative volume of fluid injected (liquids and gases) injected into the same formation over its production history [59]. Alberta maintains an extensive (auditable) dataset containing the monthly volumes of fluids removed from and injected into each well drilled in the province since 1960, with such volumetric measurements collected under surface (often referred to as stock tank) conditions. However, calculation of the net fluid balance within each formation requires correction of the volumes of fluids measured at surface conditions to the volumes they occupied in the subsurface, using the respective formation volume factors (FVF) for each fluid and corresponding formation depth (i.e., temperature and pressure) [59]. Schuenemeyer (2005) provides a method for required for conversion of stock tank volumes to in-situ volumes shown in Equation 1 below [60]:
where RV and ST are the reservoir and stock-tank volumes of fluid (in the same volume units), FVF is the (dimensionless) formation volume factor specific to the corresponding formation (pressure and temperature) from which the fluid was removed. Estimates of formation volume factors for oil and gas extracted from each formation can be calculated using (empirical, imperial-unit specific) relationships developed by Verma and Bird, provided that the depth at which such fluids have been extracted from or injected into and the corresponding API oil gravity (in the case of oil) are known [61]. These relationships are provided below, as Equations (2)–(13):
where FVFo and FVFg are the formation volume factors for oil and gas, respectively. F is a correction factor, GOR is the corrected gas/oil ratio (in ft3/barrel), sgg is the formation solution specific gravity, og is the corrected oil gravity (in API units), t is the formation-specific temperature (in degrees Fahrenheit), ag is the API oil gravity, GORu is the corrected gas/oil ratio (in ft3/barrel), p is the formation pressure (in psi), and TD is the formation depth (in feet). The commercially available geoSCOUT® database contains well-specific monthly fluid injection and production stock tank volume, production, injection, and well depth records for over 610,000 wells in the Alberta Basin. The average API gravity of oil produced from each PSAC area is characteristic of that area because of its unique geological setting, with an average API gravity of 10 within AB6 and AB7, average API gravity of 25 within AB1, AB2, AB3, and AB5 and an average API gravity of 15 within AB4 [62].
RV = FVF × ST,
FVFo = 0.972 + 0.000147 × (F) 1.175,
F = GOR × (sgg/og)0.5 + 1.25 × t,
og = 141.5/(ag + 131.5),
GOR = 0.86 GORu (when GORu ≤ 1200),
GOR = (0.86 + 0.24 × sin2 [(GORu − 1200) × π/(2000)] (when 1200 < GORu < 2250),
GOR = 1.1 × GORu (when GORu ≥ 2250,
GORu = sgg × [(p + 14.7) × 10 0.0125 × ag/(18 × 10 0.00091 × t)] 1.2,
sgg = ((0.1402 × ln (p+14.7) − 0.4227) + (0.1369 × ln (t) + 0.0156) + (0.1704 × ln (ag) + 0.1469))/3,
p = 1000 × TD/2,
t = 19 × TD + 30,
FVFg = 752.2 × (1 − e−0.05728 × TD), when 0 < TD/1000 ≤ 5.67,
FVFg = 113.3 + 21.1 × TD − 0.81 × TD2 + 0.0116 × TD3, when 5.67 < TD/1000 ≤ 30,
The monthly measured production and injection (stock tank) fluid volume records for each of the approximately 610,000 wells in Alberta for January 1960–December 2020 were extracted from the geoSCOUT® database (about 63 million production records) for each PSAC area, along with the respective total vertical depth (TVD) of each well. The TVD, characteristic API gravity of the corresponding PSAC area and Equations (2)–(3) above were then used to calculate oil and gas FVFs for the stock-tank fluid volume records for each production and injection wells in the Alberta Basin. The calculated FVFs were subsequently used to convert the stock tank oil and gas volume records for each well to in-situ reservoir volumes, following Equation 1. No correction was applied to produced and injected water volumes reported for each well since water (including water containing dissolved gas) is considered essentially incompressible under most reservoir conditions [63]. Steam volumes were also uncorrected since steam is measured and reported in cold-water-equivalent volumes. Steam injected into the subsurface is used for thermal oil recovery and ultimately becomes water in the subsurface. However, in the formation net fluid balance reported below, injected steam is accounted for as a gas since it is in the gas phase at the point of entry into the formation. All data aggregation, processing, and computation was conducted using the R statistical software package (R: A language and environment for statistical computing, https://www.R-project.org/, last accessed on 14 January 2022).
2.3. Calculation of the Distance between the Injection/Production Horizon and the Precambrian Basement
The vertical distance between the injection/production horizon of each well and the Precambrian basement (i.e., the depth to Precambrian basement) was calculated using the TVD of each well and the depth of the Precambrian basement, obtained from the Alberta Geological Survey’s Precambrian Structure depth contours available in Pana et al. [64]. The depth to the Precambrian basement (i.e., a measure of the proximity of the injection/production horizon to the basement) was calculated by subtracting the TVD of each well from the depth of the Precambrian basement in the geographic location of the corresponding well.
2.4. Calculation of the Net Fluid Balance in Each Sub-Region and Stratigraphic Horizon Relative to the Precambrian Basement in the Alberta Basin
Production/injection wells and the associated calculated in-situ volumetric data were grouped geographically by PSAC area and stratigraphically in one-kilometre increments of vertical depth to the Precambrian basement. The in-situ liquid and gas net fluid balance volume (i.e., the volume injected—volume removed) for each geographic and stratigraphic horizon was then calculated and plotted as a function of vertical distance from the Precambrian basement.
These records were then grouped by decade, for the period January 1960–December 2020, to identify significant trends that may have occurred because of market or other changes in types and scales of industrial activity. In some cases, net fluid balance volumes are represented as the cube root of cubic meters in the charts, which is necessary to show the net change (positive or negative) in in-situ fluids balance as well as extreme changes in net volumes. The vertical scale represents the vertical depth to the Precambrian basement (i.e., not the TVD) averaged geographically across the entire PSAC area.
2.5. Calculation of In-Situ Formation Pressure Changes in the Alberta Basin over the Period 1960–2020
In Alberta, an oil or gas pool is essentially an accumulation of oil or gas that is (structurally) separate from another such accumulation, and approximately 65,000 oil and gas pools exist in the Alberta Basin [65,66]. A common feature of many of the conventional oil and gas pools located in stratigraphic traps is the presence and hydrodynamic support of underlying regional saline aquifers [67,68]. Measurement of the initial (virgin) and subsequent annual in-situ pool pressures is a regulatory requirement for all oil and gas operators; consequently, an extensive public dataset is also available in the geoSCOUT® database. However, while this dataset contains approximately 325,000 in-situ pool pressure-data records, these only cover approximately 7000 distinct oil and gas pools. Pressure variations in such pools indicate pressure variations in the hydraulically connected underlying saline aquifer systems that support the hydrocarbon columns and are consequently representative of subsurface pressure changes across this basin.
The first recorded and most recent pressure measurements for corresponding depth intervals in each pool were identified and extracted from the available data, using R. The variance between the first recorded in-situ pressure measurement and the most recent pressure measurement (as a function of the first recorded pressure measurement) was then calculated for each depth horizon for which data was available in each pool. Pools with a pressure increase (i.e., most recent pressure > initial pressure at same depth interval in the same pool) were grouped into a pressure increase category. In contrast, pools with a pressure decrease (i.e., most recent pressure < initial pressure at same depth interval in the same pool) were grouped into a decrease category in each stratigraphic depth horizon. The calculated pool-pressure variance data were then grouped according to the PSAC area in which they were located and the distance to the Precambrian basement. This data was then used to calculate the average (percentage) pressure increase/decrease and the respective proportion of pools showing changes in each PSAC area and depth increment to the Precambrian Basement.
3. Results
The calculated net in-situ fluid balances in each geographic area, in 1 km stratigraphic increments from the Precambrian basement, are presented in the sub-sections below. This information can help inform the development of regional fluid injection and disposal-related policies and manage fluid budgets for each region in the Alberta Basin. Such policies and fluid budgets may be essential when the current and projected levels of industrial activity and the historical occurrence of seismic activity and seismic hazard potential in each area are considered, as outlined below.
3.1. Basin-Wide Total Stock-Tank Fluid Balance over the Period 1960–2020
Analysis of the stock tank volumes of fluids injected and extracted (i.e., produced) from the Alberta Basin over the last 60 years (1960–2020) shows that the volume of both gases and liquids removed (on average) exceeded the respective volumes of each injected over the same period by approximately an order of magnitude (Table 1).
Table 1 shows that, at a macro-scale, the basin has so far experienced extensive depressurization (depletion) due to oil and gas production during the period 1960–2020. Furthermore, analysis of the decade-by-decade net (volume injected minus volume withdrawn) stock-tank gas and liquids over this period indicates that depletion of both liquids and gases accelerated progressively over most of the last six decades (Table 2).
This observation is consistent with the expected trend of increasing extraction rates of combined hydrocarbon fluids from the Alberta Basin for the period in which published data are available (1972–2015) [50]. However, actual depletion rates depend on the type, geographic location, depth, and scale of industrial activities, which can fluctuate significantly within short periods (as a function of market fluctuations, regulatory and policy changes, and other factors).
3.2. Basin-Wide Total Stock-Tank Fluid Balance Trends over the Period 1960–2020 and Potential Implications
Figure 2 shows the analysis of the annual net (stock-tank volume injected—stock-tank volume extracted) gas and liquid balance in the Alberta Basin over the period 1960–2020. This figure shows that while removal has historically exceeded injection over the last 60 years and the depletion rate has increased over time, significant recent changes in both trends are evident.
The change in trend in the net gas balance over the period 2006–2010 correlates with the development and expansion of the thermal bitumen industry and the increase in large volume (steam and non-condensable) gas-phase injection characteristic of this industry. Figure 2 also shows an abrupt reversal in the historical depletion trend in net gas and liquid balances over the last two years (2018–2020). This result indicates that there may be recent changes occurring in the type and scale of industrial activity occurring in the basin that can reverse the basin-wide depletion trends that have been occurring over the last 60 years.
Major, policy-driven changes in the type of energy produced and consumed in Canada are developing, which may change how pore space in the Alberta Basin has been used since the development of the oil and gas industry. The proposed Net-Zero Emissions Accountability Act formalizes Canada’s objective to achieve net-zero emissions in all sectors of society by 2050 [69]. The subsurface injection of captured CO2 from major industrial emissions is fundamental for achieving this goal [70]. Therefore, the possibility exists that fluid injection into the Alberta Basin could substantially exceed fluid removal within the next 30 years.
However, the volume removed from the basin can be used to derive an upper-bound estimate of a theoretical sustainable storage capacity within depleted oil and gas formations since a current key regulatory criterion used in approving injection projects is the requirement that the post-injection formation pressure shall not exceed the original virgin reservoir pressure [68,71]. A simple comparison (at standard temperature and pressure) of Alberta’s annual (2017) CO2 emissions of 273 Mt of CO2 [72] and the net gas difference presented in Table 1 above show that approximately 10 years of captured industrial CO2 emissions would be equivalent to all of the net gas extracted from the Alberta Basin over the last 60 years. Other initiatives such as the use of natural gas to produce blue hydrogen in Alberta as a substitute for liquid transportation fuels would require approximately 203 Mt/year of carbon capture and storage capacity [73], which would exceed the net gas balance from the Alberta Basin in approximately 10 years. Meanwhile, one gigawatt of installed open-loop geothermal electricity generation (operating at a water flow rate of 20 kg/s to produce one megawatt of electric power [74]) has the potential to reinject in eight years the same amount of fluid as the net liquids balance of the basin over the last 60 years.
These simple calculations highlight the need for a strategic evaluation of the proposed future use of the subsurface in this basin since the scale of future injection can reverse the historical basin depletion trend that has occurred to date. This depletion trend may have been instrumental in the success of large-scale injection to date in this basin, and fluid volume injection greater than fluid volume removed from this basin (i.e., basin re-pressurization) could increase associated future capacity, containment, and induced seismicity risks. Sustained basin-wide fluid injection consistently exceeding fluid removal over long periods increases the likelihood of recipient formations being exposed to pressures above their initial discovery pressures, which could increase the probability of loss of injection containment and induced seismicity [21,75,76,77]. Large-scale injection of fluids into deep, laterally extensive, undepleted formations can result in significant and extensive pressure changes (because of the low pore compressibility of these formations) unless such pressure build-up is attenuated by basin-scale migration of resident brine into and through the caprock, basement rock, and lateral flow boundaries [21]. Additionally, the magnitude of the pressure build-up response to industrial-scale carbon sequestration should be carefully evaluated against the regional scale hydrologic conditions because of the capacity of such pressure build-up to trigger the large-scale movement of brine vertically and laterally at a regional-scale [21]. Such pressure build-up and fluid displacement also increase the risk of loss of injection containment from legacy wells that were poorly abandoned [78]. Previous basin-scale hydrological studies have noted that saline aquifers in the Alberta Basin are interconnected laterally and vertically at a regional scale and provide hydrodynamic drive to most oil and gas formations [79]. Large-scale lateral or vertical movement of brine would thus be undesirable because of the potential to affect regional hydrology and current oil and gas extraction activities.
Therefore, large-scale injection from net-zero activities could overwhelm long-term disposal capacity within the Alberta Basin and adversely affect disposal activities essential for the oil sands, shale oil, and other industries. Basin-scale migration of fluids could trigger changes to regional hydrological regimes, affecting top/bottom water in thermal oil sands extraction or water drive in conventional oil and gas operations, which could adversely impact the economics of oil and gas extraction. However, there is still debate on the degree of interaction between the basin-scale saline flow systems in the deformed and undeformed parts of the basin, between the basement and sedimentary succession and the true magnitude and direction of formation water flow in the various flow systems [79,80,81]. Consequently, the actual impacts of basin-scale changes in formation pore pressures may be difficult to predict accurately unless the regional and basin-scale hydrological understanding is improved. Recent studies have suggested that vertical connectivity between discrete regional flow systems may be greater than previously hypothesized in some cases, while stratigraphic fluid density contrasts may control the mobility of deep saline fluids [79,81]. Uncertainty on the basin-scale interaction between the saline flow systems and the associated driving forces can have important implications on the stability of storage and disposal zones and the sustainability of water withdrawal [79,81]. Currently, the onus is on project proponents to evaluate the suitability of the receiving formation and potential risks arising from high volume injection at a project scale within the basin [54,68,71].
High volume fluid injection into under-pressured or pressure-depleted subsurface formations is considered attractive from an earthquake triggering perspective because of the lower pore pressures at the start of injection, which reduce injection operating costs and allow for the injection of large volumes of fluid before pressures increase to virgin reservoir pressures [82]. However, as previously noted, large-scale injection into such formations should be avoided when they are within one kilometre of the Precambrian basement or where evidence exists to indicate a hydraulic connection with the Precambrian basement [25,26,34,36,37]. Limited unknown geologic hazards are typically encountered during large-scale fluid injection into depleted producing formations not in proximity to or in contact with the basement rocks. Over a century of experience in the natural gas storage industry has shown few failures, the majority of which occurred because of wellbore integrity problems [77,83,84,85,86].
3.3. Assessment of the Net In-Situ Fluid Balance in Area AB1
Area AB1 comprises the eastern flank of the Rocky Mountains foothills (Figure 1) and includes the deepest part of the Alberta Basin, with a sediment depth exceeding 6 km in some locations. The predominant geologic interest in this area has historically been, and is expected to continue to be, dry gas [52]. This area has also been the most seismically active region in the province from 1922 up to 2010 due to regional tectonic activity in the Rocky Mountain region [87,88,89]. One of the first recorded injection-induced seismic events of concern in Alberta (the Magnitude 5.1 Snipe Lake event) occurred in this area in 1970 [90,91]. Oil and gas-related induced seismicity has also occurred in this area (near Rocky Mountain House) since the 1970s and has been attributed to extensive gas extraction from (i.e., depletion of deep) Devonian carbonate reservoirs at depths of approximately 4 km (approximately 2 km above the Precambrian basement) [92,93].
Figure 3a,b show the calculated net in-situ gas and liquid balances across AB1 over the last six decades. This analysis indicates that over this period, the total volumes of liquid and gas extracted exponentially exceeded the respective volumes injected at all depth intervals relative to the Precambrian basement. During the past six decades, extensive gas depletion has been notable in the depth zone approximately 2–4 km from the Precambrian basement across AB1. This result is consistent with extensive regional gas production activity over this period [52]. While a similar trend is noted in the net liquid balance in this area, the level of depletion is lower in the stratigraphic horizons adjacent to the Precambrian basement, and the volume of liquids injected even marginally exceeded the volume of liquids extracted in the deeper stratigraphic horizons during the 1970s and 1980s.
Therefore, the net fluid balance trend for this PSAC area indicates that there is an extensive net negative fluid balance within the stratigraphic horizons located at the depth interval of 2–4 km from the Precambrian basement. However, this analysis also indicates that net fluid balance within the stratigraphic horizons located up to 2 km from the Precambrian basement within PSAC 1 has experienced limited fluid depletion. Consequently, far greater sustainable fluid storage capacity is available in the stratigraphic horizons located at 2–4 km from the Precambrian basement. Conversely, fluid injection and storage capacity is limited in the 0–2 km stratigraphic intervals in area AB1.
3.4. Assessment of the Net In-Situ Fluid Balance in Area AB2
Area AB2 is located adjacent to the eastern flank of the Rocky Mountain Foothills (Figure 1) and contains the second deepest part of the Alberta Basin, with a sediment depth exceeding 6 km in some locations. The predominant geologic interests in this area are tight oil, wet gas, and natural gas liquids (mostly in the Duvernay Formation [94], Figure 1), and production activity is anticipated to increase significantly in this area over the next decade [52]. Most of the oil and gas-related induced seismicity that has occurred in the Alberta Basin to date has occurred within this area and has been linked to hydraulic fracturing injection, with some events associated with water disposal or production-related depletion [42,93,95,96,97].
Figure 4a,b show the calculated net in-situ gas and liquid balances across AB2 over the last six decades. This analysis indicates that the total volumes of both liquids and gases extracted also exponentially exceeded the respective volumes injected at all depth intervals relative to the Precambrian basement in this area. In addition, accelerating liquids and gas depletion rates are evident in the stratigraphic zones from approximately 3 km above to the top of the Precambrian basement. This trend is also consistent with the current deep basin tight oil and gas industrial activity in this area [52].
The net fluid balance trend across AB2 shows an extensive net negative fluid balance in the stratigraphic horizons located within 3 km of the Precambrian basement. However, this analysis also indicates that the shallowest stratigraphic horizons in PSAC 2 have experienced limited fluid depletion. Consequently, there may be substantially greater sustainable fluid storage capacity within the stratigraphic intervals located within 3 km of the Precambrian basement within this area. Figure 4a,b may provide an upper-bound estimate of the sustainable fluid storage capacity in these stratigraphic intervals in AB2.
3.5. Assessment of the Net In-Situ Fluid Balance in Area AB3
Area AB3 is in southeastern Alberta (Figure 1) and encompasses a shallower part of the Alberta Basin with a sediment depth of up to 3 km. The predominant geologic interests in this area are dry gas, and heavy and light crude. While traditional conventional oil and gas production activity has decreased over the last decade, light oil production is projected to increase in the next decade as operators benefit from low production costs and established infrastructure in this area [52].
Figure 5a,b show the calculated in-situ net gas and liquid balances across AB3 over the last six decades. This analysis indicates that the total volumes of both liquids and gases extracted exponentially exceeded the respective volumes injected at all depth intervals relative to the Precambrian basement in this area. Accelerating depletion of liquids and gas is evident in all zones, with shallow gas depletion consistently increasing over the last six decades. Over the last decade, the depletion rate decelerated in the deeper stratigraphic horizons in this area. This trend is consistent with the oil and gas industrial activity and forecasts in this area [52].
The net fluid balance trend across AB3 indicates an extensive net negative fluid balance (and sustainable fluid storage capacity) available in all stratigraphic horizons in this area.
3.6. Assessment of the Net In-Situ Fluid Balance in Area AB4
Area AB4 is in east-central Alberta (Figure 1) and encompasses a shallower part of the basin with a sediment depth of up to 3 km. The predominant geologic interests in this area are light and ultra-heavy crude, with limited shallow dry gas. While conventional oil and gas production activity has decreased over the last decade in this area, production of light density crude is expected to increase over the next decade [52].
Figure 6a,b show the calculated net gas and liquid balances across AB4 over the last six decades. This analysis indicates that the total volumes of both liquids and gases extracted also exponentially exceeded the respective volumes injected at all depth intervals relative to the Precambrian basement in this area.
Extensive gas depletion is evident in all stratigraphic horizons over six decades, with a gas depletion-rate deceleration occurring in the last two decades. However, the consistent six-decade exponential increase in liquids depletion adjacent to the Precambrian basement in this area is notable. While there is extensive sustainable fluid storage capacity within the near-Precambrian basement intervals in this area, this exponentially increasing depletion trend may be significant in assessing regional subsurface storage capacity or near-basement saline aquifer flow characteristics in AB4.
3.7. Assessment of the Net In-Situ Fluid Balance in Area AB5
Area AB5 is in central Alberta in the center of the basin (Figure 1) and encompasses an area with a sedimentary cover of up to 4 km deep. The predominant geological interests in this area have historically been conventional oil and gas. However, they have evolved to tight oil in the east—southeastern region and subsurface fluid injection and storage-related activities in the central area.
Figure 7a,b show the calculated net in-situ liquid and gas balances across AB5 over the last six decades. This analysis also indicates that the total volumes of both liquids and gases extracted exponentially exceeded the respective volumes injected at all depth intervals relative to the Precambrian basement in this area. Extensive gas depletion is notable in the deeper stratigraphic horizons over the past six decades. However, in the stratigraphic zones adjacent to the Precambrian basement, the depletion rates for liquids have consistently decelerated over the last five decades, while gas depletion rates have also decelerated over the last three decades.
While extensive sustainable fluid storage capacity appears to exist within this area, increasing injection rates and decreasing extraction rates may be reversing the historical regional depletion trend. This trend may be of significance in assessments of regional subsurface storage capacity and near-basement saline aquifer flow characteristics for this area, especially considering the potential for large-scale fluid injection in the basal saline aquifers from future carbon capture and storage activities [70,98,99].
3.8. Assessment of the Net In-Situ Fluid Balance in Area AB6
Area AB6, located in northeastern Alberta, overlaps the Athabasca Oil Sands Region (Figure 1), encompasses an area with a sedimentary cover of up to 2 km deep. The predominant geologic interest in this area is its laterally extensive bitumen deposits, which are extracted using mining and steam-based technologies (steam-assisted gravity drainage and cyclic steam stimulation—SAGD and CSS). These deposits produced approximately three million barrels per day of bitumen in 2020 [52].
A comprehensive understanding of the regional (saline) groundwater systems is important for the success of both thermal and mining production technologies in this area since imprecise knowledge of the regional hydrogeology can impact bitumen extraction project feasibility [100,101,102]. The commercial feasibility of both SAGD and CSS bitumen production methods requires long term stability and predictability of groundwater interaction with production activities over the project lifetime since unanticipated groundwater variations can materially impact operating (such as steam generation or pit dewatering) costs and project revenues (by altering the volume of recoverable oil) [100,103,104,105,106]. Thus, comprehensive knowledge of current regional saline aquifer flow systems and future changes of such systems (e.g., created by new large-scale injection projects, for instance) could be necessary for the continued commercial success of bitumen production projects in this area. Thermal projects extract large quantities of saline source water for bitumen production while mining projects conduct extensive pit dewatering, and both inject large amounts of spent process water within this region, which has the potential to alter regional-scale hydrogeological regimes [100]. However, hydrogeological studies are currently conducted on a project level and a case-by-case basis and the cumulative impacts of all projects on regional groundwater systems have not been quantified to date [57,101]. Therefore, changes to the saline regional-scale hydrodynamic flow regimes (particularly hydrostatic head increases) may be undesirable because of the potential to affect the feasibility of current and future bitumen extraction in this area.
Figure 8a,b show the calculated in-situ net liquid and gas balances across AB6 over the last six decades. The in-situ thermal projects in this area are located at around 600 m depth, which is within 1 km of the Precambrian basement. The sedimentary depth in the eastern section of this area varies between 0.5 and 1.5 km [107,108]. This analysis shows that extensive gas depletion occurred in all stratigraphic horizons in this area during the first four decades, reflecting gas production. However, this trend reversed in the lower stratigraphic horizon within the last two decades, with net gas injection substantially exceeding gas extraction while the gas depletion trend continued in the upper stratigraphic horizon. The increase in net gas balance in the lower stratigraphic horizon corresponds to the period of development and growth of the SAGD industry in this area and reflects the injection of steam and non-condensable gases for bitumen production. However, the reservoir pressure-balanced nature of SAGD operations suggests that there may be limited potential for the increase in gas injection in the lower stratigraphic horizons to interact with the regional hydrodynamic flow systems in this area. This area’s calculated in-situ net liquid balance shows exponentially increasing liquids extraction within both stratigraphic zones, with a substantial increase within the last decade. This result includes an increase in bitumen production, source water extracted for steam generation, and spent process water injected from operations in this area.
It is possible that the closed-circuit mechanics of gas injection and the large-scale saline water withdrawal characteristic of thermal bitumen recovery could mitigate the potential for a pore pressure increase in the Precambrian basement zone within this area, and therefore reduce the possibility for induced seismicity triggered by pore pressure increase. In addition, in situ stress levels are anticipated to be lower in Precambrian basement within this area because of the shallow depth, which reduces the probability of occurrence of large magnitude induced events. However, the trend and scale of liquid and gas net fluid balance changes in this area in the last two decades may warrant an analysis of the potentially complex interaction between the net fluid balance and the regional scale hydrodynamic flow systems. Such an analysis may help estimate the sustainable net fluid balance capacity of this area and the potential to accommodate other types of subsurface activities in conjunction with current operations. In addition, an analysis of the impacts (if any) to the regional scale hydrodynamic flow systems could be instrumental in developing a future regional scale subsurface capacity management strategy. Recent watershed-scale studies conducted in this area provide first-order estimates of sustainable yields for near-surface (<150 m deep) aquifers and could help future assessments of cross-formation flows and cumulative effects [109].
3.9. Assessment of the Net In-Situ Fluid Balance in Area AB7
Area AB7 is in northwestern Alberta (Figure 1) and encompasses an area with sediments up to 4 km deep. The predominant geologic interests in this area have historically been conventional oil, gas, and bitumen but have more recently evolved to tight oil and gas in the southwestern region.
Figure 9a,b show the calculated in-situ net liquid and gas balances over the last six decades in area AB7. This analysis indicates that total volumes of gases and liquids exponentially exceeded the respective volumes injected at all depths relative to the Precambrian basement.
Extensive extraction of both liquids and gases and associated depletion are notable in the stratigraphic zones up to approximately 2 km from the Precambrian basement. However, the depletion rate of both liquids and gases in the near basement stratigraphic zone in this area has shown a consistent exponential decrease in the last two decades. While there appears to be significant potential for sustainable storage capacity within formations in this area, this trend may be of significance in regional assessments.
3.10. Trends in Calculated Net In-Situ Fluid Balance within Each Area
While the assessment above summarizes of the net fluid balance in each area, it can obscure recent or short-term changes in fluid injection/extraction patterns within each area. The annual in-situ gas and liquid fluid balance trends over the last 60 years, presented in Figure 10, Figure 11 and Figure 12, are useful for identifying short-term and recent variations.
Figure 10 shows the annual net gas balance trend over the period 1960–2020 in each area. This figure indicates that while depletion is evident in all areas, the annual gas depletion trend appears stable in areas AB1, AB3, and AB4, while gas depletion is accelerating in areas AB2 and AB7.
However, the annual gas-depletion trend deceleration is notable in areas AB5 and AB6. The short-term spikes in gas injection volumes shown in AB6 are not data processing artifacts since they correlate with annual variations in steam and other (non-steam) gas-phase injection volumes (Figure 11).
The volume of steam and gas injected is a function of bitumen recovery technology and the project’s commercial criteria, which vary temporally as a function of oil and gas market conditions for the corresponding period. Figure 12 shows the annual net liquid balance trend over the same period in each area. This figure shows that liquid depletion is also prevalent in all areas, with stable liquid depletion levels evident in AB1, AB2, AB3, AB4, and AB7. However, an accelerated liquids depletion trend is notable in area AB6, while AB5 shows a consistent deceleration in the depletion trend.
This analysis indicates that notable regional-scale changes in annual net fluid balance trends appear to be occurring in areas AB5 and AB6 that could be of significance in future sustainable basin subsurface storage capacity assessments and pore space policy considerations. Regional-scale management of subsurface fluid injection cumulative effects may be warranted in the future to maintain a sustainable fluid budget (and storage capacity) in these areas and mitigate adverse effects on current subsurface pore space users. This need may be critical, especially under scenarios of potential large-scale increases in fluid injection, such as those contemplated by industry’s net-zero initiatives that propose carbon capture and storage in these areas.
3.11. In Situ Formation Pressure Changes in the Alberta Basin over the Period 1960–2020
Industrial-scale injection of fluids into or removal of fluids from the subsurface have the potential to trigger basin-scale changes in hydrologic flow systems [110]. Despite its historical economic importance and the extent of industrial activity, limited basin-scale studies have been completed on the hydrologic flow systems and their interconnectivity within the Alberta Basin. Moreover, such studies have been done in a piecemeal fashion both geographically and stratigraphically [111]. The entire WCSB is, however, generally accepted to be a classic example of a gravity-driven flow basin [53,106,112] because of the overall elevation diminution from the southwest to the northeast.
Within the Alberta Basin, Bachu (1995) proposed that the basin-scale flow is controlled by two mega-hydrodynamic (stratigraphic) flow systems consisting of a deeper (pre-Cretaceous) northeastward carbonate dominated (high salinity) aquifer flow system and a shallower (post-Jurassic) southwestward sandstone (lower salinity) aquifer flow system, as shown in Figure 13 [106]. According to Bachu (1995), the deep (high salinity) aquifer flow system is driven by basin topography with a recharge in Montana and the Alberta Rocky Mountains and discharge in northeastern Alberta and Saskatchewan, while the shallower (post-Jurassic) southwestward sandstone (lower salinity) aquifer flow system is driven by erosional rebound in intervening shale sequences. These mega-hydrodynamic flow systems hydraulically connect at a regional scale west to east along pre-Cretaceous unconformities in the central portion of the basin, and salinity-gradient controlled buoyancy retards cross-formation flow of waters driven by hydraulic head gradients in each and between these two systems [106,111]. Vertical cross-formation flow through high permeability carbonate (Upper Devonian Wabamun and Grosmont) sequences creates a long-range regional-scale drain effect and forms sub-hydrostatic (underpressured) systems, which control regional-scale flow systems and are fundamental for hydrodynamic trapping of hydrocarbons and injected waste fluids [106,111].
Large-scale alteration of hydraulic heads in the regional sub-hydrostatic systems or the salinity of either flow system could alter the flow of formation waters between these two mega-hydrodynamic regimes. Basin-scale or regional alteration of the hydraulic head or brine density of either or both mega-hydrodynamic flow systems is also likely to alter fluid interaction with the Precambrian basement since the basal saline aquifers are a part of the pre-Cretaceous flow system, and these directly overly the Precambrian basement. An industrial-scale CO2 injection project, for instance, (without brine management) can materially increase saline aquifer formation pressures and displace brine at a basin (100 km) scale over its injection lifetime, even though the injected fluid plume linear dimensions may be constrained to under 10 km [21,22,110].
Such changes could affect the feasibility of conventional oil, thermal bitumen, and oil sands extraction (by changing hydraulic heads, altering stratigraphic/hydrodynamic traps, impacting top/bottom water or basal pressure) as well as increase the potential for the occurrence of crystalline basement related induced seismicity (by increasing pore pressure in basement faults). Proposed industrial-scale net-zero and decarbonization initiatives that utilize CO2 sequestration could potentially induce such regional or basin-scale alterations of the hydraulic head and density within the Alberta Basin, depending on the cumulative volumes injected over time, unless the injection volumes and net fluid balance are sustainably managed. Additionally, since major surface water drainage systems are interconnected with both flow systems [111], and high salinity brine discharges into some drainage systems [58], hydraulic head increases have the potential to increase saline mass flux discharge rates into surface water systems. Hydraulic head increases also increase the risk of loss of containment of injected waste and saline fluids from deep formations, through legacy (improperly) abandoned wells, to shallow groundwater or surface [78,113].
Table 3 below shows the calculated pressure changes in hydrocarbon pools (for which data was available) over the last 60 years across the various PSAC areas in the Alberta Basin, relative to the distance to the Precambrian Basement.
This data indicates that the in-situ pressure has decreased on average in most pools for which data is available across each of the stratigraphic depth horizons used in this assessment. However, this assessment also indicates that the in-situ pressure may have increased substantially in select pools in some areas. This increase is noticeable in AB5, in which approximately one-third of the pools appear to have experienced in-situ pressure increases of over 100% in the 2–3 km and 0–1 km depth to Precambrian basement range. This observation is consistent with the findings of the net fluid balance assessment above and suggests that a detailed regional fluid budget evaluation may be necessary within AB5 to maintain a sustainable fluid budget in the future. A net fluid balance approach may be a useful tool for such an assessment, as well as in subsequent associated regional management strategies.
However, several researchers have previously noted that the data quality of the in-situ formation-pressure measurement records is quite variable, with over 85% of this pressure data being rejected as being of low quality in one case [100,114]. An analysis of the annual pressure survey records from select pools indicates considerable scatter in the bottom-hole pressure recordings contained in the data set originating from the pool pressure surveys (Figure 14).
Bottomhole pressure data is collected in active (producing/injecting) pools using pressure-recording equipment located in production or injection wells, and current rules stipulate minimum production/injection well shut-in requirements to obtain a stabilized reservoir pressure [115]. However, the possibility may exist that, in some cases (especially in an active commercial production environment), production well shut-in requirements may not always be stringently followed, leading to insufficient shut-in and recording of un-stabilized reservoir pressures. Therefore, there is some uncertainty regarding the actual magnitude of in-situ formation pressure changes since the quality of the pool-pressure survey records is uncertain.
4. Discussion
This assessment shows that widely available measured production and injection volumetric data collected for production and royalty accounting purposes can be useful for evaluating basin-scale net fluid balance. Such an assessment may be a valuable complemental tool for assessing induced seismicity hazards (in near-Precambrian basement injection intervals), the potential for regional-scale hydrologic flow system changes and sustainable regional- or basin-scale fluid storage capacity in industrial-scale fluid-injection scenarios. Such an assessment could also be an essential policy and regulatory tool for managing sustainable basin-scale fluid budgets.
Table 4 below shows the net in-situ fluid balance in the Alberta Basin, and this information is also presented graphically in accompanying Figure 15 and Figure 16. Table 4 (and Figure 15 and Figure 16) show that oil and gas production has resulted in extensive in-situ fluid deficits in all regions and stratigraphic zones of interest in the Alberta Basin. However, the largest fluid deficits available in Alberta are due to gas production from the oil and gas reservoirs in the upper stratigraphic zones (located more than 1 km from the Precambrian basement) in AB1, AB2, AB3, AB5, and AB7 (Figure 15). In the stratigraphic zones located within 1 km from the Precambrian basement, relatively large fluid deficits are only present in AB2, AB5, and AB7. Consequently, significantly larger sustainable storage capacity for injected fluids in the near Precambrian basement interval is available in AB2, AB5, and AB7, compared to other areas in this basin.
These fluid deficits have also resulted in significant depletion (depressurization) of most of the Alberta oil pools assessed in this study, which enhances their apparent suitability for long-term industrial-scale storage of waste fluids. However, consideration of the net fluid balance in each area within this basin as an indicator of upper capacity limit for injected fluid may help to reduce the potential for occurrence of adverse fluid-injection related subsurface effects. Specifically, active consideration of the magnitude of the net fluid balance in the near-Precambrian basement stratigraphic intervals (particularly in seismogenic areas in this basin) could be an important component of the array of efforts to mitigate the potential for future industrial-scale fluid injection activities generating induced seismicity of concern.
Since a negative fluid balance can be correlated to a lower injection-induced seismicity hazard, then the extensive capacity in the near Precambrian basement zone within areas AB2, AB5, and AB7, and the limited capacity in this zone in all other areas, may be observations worth considering in risk assessments conducted for industrial-scale injection projects proposed in these areas. Conversely, however, while the extensive fluid deficits are evident in the stratigraphic zones located more than 1 km above the Precambrian basement, the extent of the vertical separation between the base of groundwater protection and the proposed injection zone may also be a parameter that could be useful in such risk assessments.
Maintaining a formational, regional, or basin-scale net negative fluid balance in the near-Precambrian basement zone may be an essential part of a basin fluid budget management strategy to limit subsurface pore pressure increase and potential for loss of containment and induced seismicity, as well as a valuable tool in evaluating the sustainable fluid storage capacity of a basin. However, in basins in which interconnected buoyancy-driven flow systems exist, the impact of regional-scale fluid density changes may be important to consider, in addition to assessment of the net fluid balance and fluid budget. In such basins, regional-scale changes in formation fluid density from industrial-scale fluid injection or fluid transfers increase the likelihood of basin-wide changes in hydrologic flow systems, which could impact other pore-space users. Therefore, basin-scale net fluid balance and the implications of regional-scale formation-fluid density changes could be key factors limiting the sustainable fluid storage capacity of such basins under industrial-scale fluid-injection scenarios.
5. Conclusions
The net fluid balance in the Alberta Basin may be an important consideration in future assessments of its capacity as a storage repository for injected fluids produced from evolution in the energy landscape to meet future energy needs (i.e., massive CO2 injection projections). The average net fluid balance in this basin has been negative over the last 60 years, primarily because oil and gas extraction consistently exceeded injection in the basin over this period (Figure 2a,b), which may have helped to mitigate hazards associated with high-volume fluid disposal activities to date. However, energy transition and net-zero initiatives increase the probability of a future positive, sustained net fluid balance from increasing industrial-scale injection of large volumes of fluids exceeding dwindling oil and gas removal from the basin. A positive net fluid balance may increase the likelihood of occurrence of larger induced seismic events, as well as regional-scale changes to the two mega-hydrodynamic flow systems in this basin.
A net fluid balance strategy for the management of fluid injection project cumulative effects may help to reduce the potential for the occurrence of pore pressure and reservoir induced-seismicity occurrence, in addition to mitigating potential adverse impacts to current industrial pore space users. Currently, areas AB5 and AB6 appear to have experienced significant changes to the net fluid balance over the last two decades. In AB5, gas depletion rates have decreased by an order of magnitude in the near-Precambrian basement zone during this period. In AB6, gas injection has increased by 350% and liquids extraction by approximately 350% in the near-Precambrian basement zone over the last two decades. Therefore, future cumulative effects management attention may be required if these trends continue in these two regions. In addition to an assessment of the net fluid balance, regional-scale assessments should also consider the hydrogeological impacts of large-scale changes in formation brine density, considering its importance in controlling flow between the two mega-hydrodynamic flow systems in the Alberta Basin.
Assessment of the cumulative effects of sustained large volume fluid injection and extraction projects within a complex and hydraulically interconnected basin may be important to mitigate unintended effects. Such cumulative effects include the potential for basin-scale reservoir pressurization, which has been traditionally overlooked in carbon capture and storage capacity assessments conducted to date [116,117]. Basin-scale considerations, such as regional reservoir pressurization and net fluid balance, may be limiting factors that could constrain maximum sustainable (safe) fluid storage capacity in Alberta. Future assessments could also consider the distance to the base of groundwater protection as a proxy for fluids moving out of the injection horizons towards non-saline groundwater formations.
To our knowledge, this research provides the first known estimate of regional sustainable fluid storage capacity in this basin as well as a methodology to estimate regional net fluid balance, using currently available data. The methodology and estimates presented herein may be useful to other researchers in evaluating sustainable regional storage capacity and the potential for induced seismicity generation from large-scale fluid injection in Alberta and similar basins.
Author Contributions
Conceptualization, M.S., R.C., M.D., R.J. and H.C.; Methodology, M.S., R.C. and M.D.; Software, M.S. and A.B.; Validation, A.B.; Formal analysis, M.S.; Investigation, M.S.; Resources, M.S. and H.C.; Data curation, M.S. and A.B.; Writing—original draft preparation, M.S.; Writing—review and editing, R.C., M.D., R.J. and H.C.; Visualization, M.S. and R.C.; Supervision, R.C.; Project administration, M.S. All authors have read and agreed to the published version of the manuscript.
Funding
This research received no external funding.
Institutional Review Board Statement
Not applicable.
Informed Consent Statement
Not applicable.
Data Availability Statement
All source data used in this study is available in the geoSCOUTTM database, available from geoLOGIC Systems at https://www.geologic.com (last accessed on 14 January 2022) and from the Alberta Geologic Survey’s Open Data Portal at https://geology-ags-aer.opendata.arcgis.com (last accessed on 14 January 2022).
Acknowledgments
The authors would like to acknowledge geoLOGIC Systems for the data and software systems used in this study. All geoLOGIC Systems data and software is © 2020. The authors would also like to thank the R Core Team (2020) for the use of R: A language and environment for statistical computing (https://www.R-project.org/ accessed on 28 January 2020) as well as the Alberta Department of Energy, the University of Alberta, and the University of Waterloo for support provided over the course of this study. The authors would also like to thank the anonymous reviewers who helped to improve the quality of this paper.
Conflicts of Interest
The authors declare no conflict of interest.
References
- Aven, T.; Renn, O. Improving government policy on risk: Eight key principles. Reliab. Eng. Syst. Saf. 2018, 176, 230–241. [Google Scholar] [CrossRef]
- Jones, L.M. Resilience by Design: Bringing Science to Policy Makers. Seismol. Res. Lett. 2015, 86, 294–301. [Google Scholar] [CrossRef]
- Evans, D.J. An Appraisal of Underground Gas Storage Technologies and Incidents for the Development of Risk Assessment Methodology; Health and Satefy Executive: Bootle, UK, 2008. [Google Scholar]
- Pawar, R.J.; Bromhal, G.S.; Carey, W.; Foxall, W.; Korre, A.; Ringrose, P.S.; Tucker, O.; Watson, M.N.; White, J.A. Recent advances in risk assessment and risk management of geologic CO2 storage. Int. J. Greenh. Gas Control 2015, 40, 292–311. [Google Scholar] [CrossRef] [Green Version]
- Bourne, S.; Crouch, S.; Smith, M. A risk-based framework for measurement, monitoring and verification of the Quest CCS Project, Alberta, Canada. Int. J. Greenh. Gas Control 2014, 26, 109–126. [Google Scholar] [CrossRef]
- U.S. Department of Energy. Risk Assessment Report for the FutureGen Project Environmental Impact Statement. 2006; p. 398. Available online: https://www.energy.gov/sites/prod/files/EIS-0394-DEIS-RiskAssessmentReport-2007.pdf (accessed on 16 October 2021).
- Duncan, I.J. Developing a Comprehensive Risk Assessment Framework for Geological Storage of CO2. 2014. Available online: https://www.osti.gov/servlets/purl/1170168 (accessed on 16 October 2021).
- Smith, S.A.; Sorensen, J.A.; Steadman, E.N.; Harju, J.A. Acid gas injection and monitoring at the Zama oil field in Alberta, Canada: A case study in demonstration-scale carbon dioxide sequestration. Energy Procedia 2009, 1, 1981–1988. [Google Scholar] [CrossRef] [Green Version]
- Smith, S.A.; Sorensen, J.A.; Steadman, E.N.; Harju, J.A. Plains CO2 Reduction (PCOR) Partnership (Phase II)—Zama Field Validation Test Regional Technology Implementation Plan—Task 3 Deliverable D52. 2010. Available online: https://undeerc.org/pcor/newsandpubs/pdf/SAS-D52_Zama_RTIP-Re-revised-June10FINAL.pdf (accessed on 16 October 2021).
- Shell Canada Quest Subsurface Team. Quest Storage Development Plan. 2011. Available online: https://open.alberta.ca/dataset/46ddba1a-7b86-4d7c-b8b6-8fe33a60fada/resource/5555eb2e-6d86-4419-97a3-8d3de7c5b702/download/storagedevelopmentplan.pdf (accessed on 16 October 2021).
- Jones, J.P.; Brydie, J.R.; Perkins, E.H. Investigation of potential far field impacts on freshwater resources related to CO2 storage: A case study of the HARP project site in Alberta, Canada. Energy Procedia 2013, 37, 3792–3799. [Google Scholar] [CrossRef] [Green Version]
- Soltanzadeh, M. Regional-Scale Geomechanical Characterization of the Devonian Sedimentary Succession West of the Athabasca Area in Support of Potential CO2 Storage Operations. 2014. Available online: https://albertainnovates.ca/focus-areas/clean-resources/project-library/ (accessed on 16 October 2021).
- Longworth, H.L.; Dunn, G.C.; Semchuck, M. Underground disposal of acid gas in Alberta, Canada: Regulatory concerns and case histories. Presented at the SPE Gas Technology Symposium, Calgary, AB, Canada, 28 April– 1 May 1996. [Google Scholar] [CrossRef]
- Alshuhail, A.A.; Lawton, D.C.; Isaac, H.J. Geophysical characterization of the Devonian Nisku Formation for the Wabamun Area CO2 sequestration project (WASP), Alberta, Canada. Energy Procedia 2011, 4, 4696–4703. [Google Scholar] [CrossRef] [Green Version]
- Enhance Energy and Northwest Redwater Partnership. The Alberta Carbon Trunkline and Clive Injection Facility Knowledge Sharing Report 2016. 2017. Available online: https://open.alberta.ca/dataset/f66db190-751e-4ad2-8a26-60809244a28e/resource/a94e61ab-8333-4f95-8380-a023fd12f849/download/ccsactlreport2016.pdf (accessed on 16 October 2021).
- Goodarzi, S.; Settari, A. Geomechanical Modelling and Analysis Wabamun Area CO2 Sequestration Project (WASP). 2010. Available online: https://www.ucalgary.ca/wasp/Geomechanical%20Numerical%20Modeling.pdf (accessed on 16 October 2021).
- Alberta Energy. Carbon Capture and Storage Summary Report of the Regulatory Framework Assessment. 2013. Available online: https://open.alberta.ca/dataset/5483a064-1ec8-466e-a330-19d2253e5807/resource/ecab392b-4757-4351-a157-9d5aebedecd0/download/6259895-2013-carbon-capture-storage-summary-report.pdf (accessed on 31 January 2021).
- Nakai, J.S.; Weingarten, M.; Sheehan, A.F.; Bilek, S.L.; Ge, S. A Possible Causative Mechanism of Raton Basin, New Mexico and Colorado Earthquakes Using Recent Seismicity Patterns and Pore Pressure Modeling. J. Geophys. Res. Solid Earth 2017, 122, 8051–8065. [Google Scholar] [CrossRef]
- Ogwari, P.O.; DeShon, H.R.; Hornbach, M.J. The Dallas-Fort Worth Airport Earthquake Sequence: Seismicity Beyond Injection Period. J. Geophys. Res. Solid Earth 2018, 123, 553–563. [Google Scholar] [CrossRef]
- Walters, R.J.; Zoback, M.D.; Baker, J.W.; Greg, B. Scientific Principles Affecting Protocols for Site-Characterizaion and Risk Assessment Related to the Potential for Seismicity Triggered by Saltwater Disposal and Hydraulic Fracturing. 2015, pp. 1–80. Available online: https://scits.stanford.edu/sites/g/files/sbiybj13751/f/scitsguidelines_final_spring2015_0.pdf (accessed on 16 October 2021).
- Zhou, Q.; Birkholzer, J.T. On scale and magnitude of pressure build-up induced by large-scale geologic storage of CO2. Greenh. Gases Sci. Technol. 2011, 47, 36–47. [Google Scholar] [CrossRef] [Green Version]
- Birkholzer, J.T.; Oldenburg, C.M.; Zhou, Q. CO2 migration and pressure evolution in deep saline aquifers. Int. J. Greenh. Gas Control 2015, 40, 203–220. [Google Scholar] [CrossRef] [Green Version]
- Ghaderi, S.M.; Leonenko, Y. Reservoir modeling for Wabamun lake sequestration project. Energy Sci. Eng. 2015, 3, 98–114. [Google Scholar] [CrossRef]
- Chang, K.W.; Segall, P. Injection-induced seismicity on basement faults including poroelastic stressing. J. Geophys. Res. Solid Earth 2016, 121, 2708–2726. [Google Scholar] [CrossRef] [Green Version]
- Kozłowska, M.; Brudzinski, R.; Friberg, P.; Skoumal, R.J.; Baxter, N.D.; Currie, B.S. Maturity of nearby faults influences seismic hazard from hydraulic fracturing. Proc. Natl. Acad. Sci. USA 2018, 115, E1720–E1729. [Google Scholar] [CrossRef] [PubMed] [Green Version]
- Hincks, T.; Aspinall, W.; Cooke, R.; Gernon, T. Oklahoma’ s induced seismicity strongly linked to wastewater injection depth. Science 2018, 7911, 1–46. [Google Scholar] [CrossRef] [Green Version]
- Brudzinski, M.R.; Kozłowska, M. Seismicity induced by hydraulic fracturing and wastewater disposal in the Appalachian Basin, USA: A review. Acta Geophys. 2019, 67, 351–364. [Google Scholar] [CrossRef] [Green Version]
- Rutqvist, J.; Rinaldi, A.; Cappa, F.; Jeanne, P.; Mazzoldi, A.; Urpi, L.; Guglielmi, Y.; Vilarrasa, V. Fault activation and induced seismicity in geological carbon storage—Lessons learned from recent modeling studies. J. Rock Mech. Geotech. Eng. 2016, 8, 789–804. [Google Scholar] [CrossRef]
- Dempsey, D.; Suckale, J. Physics-based forecasting of induced seismicity at Groningen gas field, The Netherlands. Geophys. Res. Lett. 2017, 44, 7773–7782. [Google Scholar] [CrossRef]
- Goebel, T.H.W.; Shirzaei, M. More Than 40 yrs of Potentially Induced Seismicity Close to the San Andreas Fault in San Ardo, Central California. Seismol. Res. Lett. 2020, 92, 187–198. [Google Scholar] [CrossRef]
- Walsh, F.R.; Zoback, M.D. Oklahoma’s recent earthquakes and saltwater disposal. Sci. Adv. 2015, 1, e1500195. [Google Scholar] [CrossRef] [Green Version]
- Walsh, F.R.; Zoback, M.D. Probabilistic assessment of potential fault slip related to injection induced earthquakes: Application to north-central Oklahoma, USA. Geology 2016, 44, 991–994. [Google Scholar] [CrossRef]
- Quinones, L.; DeShon, H.R.; Jeong, S.; Ogwari, P.; Sufri, O.; Holt, M.M.; Kwong, K.B. Tracking induced seismicity in the Fort Worth basin: A summary of the 2008–2018 north Texas earthquake study catalog. Bull. Seismol. Soc. Am. 2019, 109, 1203–1216. [Google Scholar] [CrossRef]
- Skoumal, R.J.; Brudzinski, M.R.; Currie, B.S. Proximity of Precambrian basement affects the likelihood of induced seismicity in the Appalachian, Illinois, and Williston Basins, central and eastern United States. Geosphere 2018, 14, 1365–1379. [Google Scholar] [CrossRef] [Green Version]
- Pawley, S.; Schultz, R.; Playter, T.; Corlett, H. The Geological Susceptibility of Induced Earthquakes in the Duvernay Play. Geophys. Res. Lett. 2018, 45, 1786–1793. [Google Scholar] [CrossRef]
- Goebel, T.H.W.; Brodsky, E.E. The spatial footprint of injection wells in a global compilation of induced earthquake sequences. Science 2018, 361, 899–904. [Google Scholar] [CrossRef] [Green Version]
- Scanlon, B.R.; Weingarten, M.B.; Murray, K.E.; Reedy, R.C. Managing Basin-Scale Fluid Budgets to Reduce Injection-Induced Seismicity from the Recent U.S. Shale Oil Revolution. Seismol. Res. Lett. 2018, 90, 171–182. [Google Scholar] [CrossRef]
- McGarr, A. Maximum magnitude earthquakes induced by fluid injection. J. Geophys. Res. Solid Earth 2014, 119, 1008–1019. [Google Scholar] [CrossRef]
- De Barros, L.; Cappa, F.; Guglielmi, Y.; Duboeuf, L.; Grasso, J.R. Energy of injection-induced seismicity predicted from in-situ experiments. Sci. Rep. 2019, 9, 1–11. [Google Scholar] [CrossRef]
- Mcgarr, A. Seismic Moment and Volume Change. J. Geophys. Res. B Solid Earth 1976, 81, 1487–1494. [Google Scholar] [CrossRef]
- McGarr, A.; Barbour, A.J. Wastewater Disposal and the Earthquake Sequences During 2016 Near Fairview, Pawnee, and Cushing, Oklahoma. Geophys. Res. Lett. 2017, 44, 9330–9336. [Google Scholar] [CrossRef]
- Schultz, R.; Atkinson, G.; Eaton, D.W.; Gu, Y.J.; Kao, H. Hydraulic fracturing volume is associated with induced earthquake productivity in the Duvernay play. Science 2018, 359, 304–308. [Google Scholar] [CrossRef] [PubMed] [Green Version]
- Kwiatek, G.; Saarno, T.; Ader, T.; Bluemie, F.; Bohnhoff, M.; Chendorain, M.; Dresen, G.; Heikkinen, P.; Kukkonen, I.; Leary, P.; et al. Controlling fluid-induced seismicity during a 6.1-km-deep geothermal stimulation in Finland. Sci. Adv. 2019, 5, eaav7224. [Google Scholar] [CrossRef] [Green Version]
- Oklahoma Corporation Commission. Earthquake Response Summary Recent Actions. 2017. Available online: https://paperzz.com/doc/7079096/earthquake-response-summary---oklahoma-corporation-commis (accessed on 16 October 2021).
- Hand, E. Injection wells blamed in Oklahoma earthquakes: Regulators in several states start to limit wastewater disposal to reduce risks of induced tremors. Science 2014, 345, 13–14. [Google Scholar] [CrossRef] [PubMed]
- McGarr, A.; Bekins, B.; Burkardt, N.; Dewey, J.; Earle, P.; Ellsworth, W.; Ge, S.; Hickman, S.; Holland, A.; Majer, E.; et al. Coping with earthquakes induced by fluid injection. Science 2015, 347, 830–831. [Google Scholar] [CrossRef] [PubMed]
- Langenbruch, C.; Zoback, M.D. Response to Comment on ‘How will induced seismicity in Oklahoma respond to decreased saltwater injection rates? Sci. Adv. 2017, 3, eaao2277. [Google Scholar] [CrossRef] [Green Version]
- National Academy of Sciences. Induced Seismicity Potential in Energy Technologies; National Academies Press: Washington, DC, USA, 2015. [Google Scholar] [CrossRef]
- Walters, R.J.; Zoback, M.D.; Baker, J.W.; Beroza, G.C. Characterizing and Responding to Seismic Risk Associated with Earthquakes Potentially Triggered by Fluid Disposal and Hydraulic Fracturing. Seismol. Res. Lett. 2015, 86, 1110–1118. [Google Scholar] [CrossRef]
- Teare, M.; Miller, S.; Overland, S.; Marsh, R.; Tamblyn, C. ST98-2015: Alberta’s Energy Reserves 2014 and Supply/Demand Outlook 2015–2024. 2015. Available online: https://static.aer.ca/prd/documents/sts/ST98/ST98-2015.pdf (accessed on 16 October 2021).
- Mansell, R.; Moore, M.; Winter, J.; Krzepkowski, M. Size, Role and Performance in the Oil and Gas Sector. SPP Res. Pap. 2012, 5, 1–77. [Google Scholar] [CrossRef] [Green Version]
- Alberta Energy Regulator. ST98 Alberta Energy Outlook. 2020. Available online: https://www.aer.ca/providing-information/data-and-reports/statistical-reports/st98/executive-summary/data (accessed on 7 April 2021).
- Connolly, C.A.; Walter, L.M.; Baadsgaard, H.; Longstaffe, F.J. Origin and evolution of formation waters, Alberta Basin, Western Canada Sedimentary Basin. Appl. Geochem. 1990, 5, 375–395. [Google Scholar] [CrossRef] [Green Version]
- Cox, R.J. Subsurface disposal of produced waters: An Alberta perspective. In Produced Water. Technological/Environmental Issues and Solutions; Ray, J.P., Engelhardt, F.R., Eds.; Springer Science & Business Media: New York, NY, USA, 1992; Volume 46, pp. 1–606. [Google Scholar]
- The National Academies Press. Flowback and Produced Waters: Opportunities and Challenges for Innovation. 2017. Available online: https://www.nap.edu/catalog/24620/flowback-and-produced-waters-opportunities-and-challenges-for-innovation-proceedings (accessed on 16 October 2021).
- Gaurina-Međimurec, N.; Pašić, B.; Mijić, P.; Medved, I. Deep underground injection of waste from drilling activities—An overview. Minerals 2020, 10, 303. [Google Scholar] [CrossRef] [Green Version]
- Gosselin, P.; Hrudley, S.E.; Naeth, M.A.; Plourde, A.; Therrien, R.; Van Der Kraak, G.; Xu, Z. The Royal Society of Canada Expert Panel: Environmental and Health Impacts of Canada’s Oil Sands Industry. 2010. Available online: http://www.chuq.qc.ca/oms/pdf/ResponseRSCPanelTimoney.pdf (accessed on 16 October 2021).
- Jasechko, S.; Gibson, J.J.; Jean Birks, S.; Yi, Y. Quantifying saline groundwater seepage to surface waters in the Athabasca oil sands region. Appl. Geochem. 2012, 27, 2068–2076. [Google Scholar] [CrossRef]
- Burruss, R.C. Development of a Probabilistic Assessment Methodology for Evaluation of Carbon Dioxide Storage—USGS Open File Report 2009–1035. 2009. Available online: http://www.usgs.gov/pubprod (accessed on 16 October 2021).
- Schuenemeyer, J. Methodology for the 2005 USGS Assessment of Undiscovered Oil and Gas Resources, Central North Slope, Alaska. 2005. Available online: http://pubs.usgs.gov/of/2005/1410/ (accessed on 16 October 2021).
- Verma, M.K.; Bird, K.J. Role of reservoir engineering in the assessment of undiscovered oil and gas resources in the National Petroleum Reserve, Alaska. Am. Assoc. Pet. Geol. Bull. 2005, 89, 1091–1111. [Google Scholar] [CrossRef]
- Zhou, S.; Huang, H.; Liu, Y. Biodegradation and origin of oil sands in the western Canada sedimentary basin. Pet. Sci. 2008, 5, 87–94. [Google Scholar] [CrossRef] [Green Version]
- Osif, T.L. Effects of Salt, Gas, Temperature, and Pressure on the Compressibility of Water. SPE Reserv. Eng. 1988, 30, 175–181. [Google Scholar] [CrossRef]
- Pană, D.I. Precambrian Basement of the Western Canada Sedimentary Basin in Northern Alberta. 2002. Available online: https://static.ags.aer.ca/files/document/ESR/ESR_2002_02.pdf (accessed on 16 October 2021).
- Province of Alberta. Oil and Gas Conservation Act: Revised Statutes of Alberta 2000 Chapter O-6. In Queen’s Printer; Edmonton, AB, Canada, 2009; pp. 1–88. Available online: https://www.qp.alberta.ca/documents/Acts/O06.pdf (accessed on 16 October 2021).
- Alberta Energy Regulator. ST103—Field/Pool List. 2021. Available online: https://www.aer.ca/providing-information/data-and-reports/statistical-reports/st103 (accessed on 16 October 2021).
- Creaney, S.; Allan, J.; Cole, K.S.; Fowler, M.G.; Brooks, P.W.; Osadetz, K.; Macqueen, R.W.; Snowdon, L.R.; Riediger, C.L. Chapter 31—Petroleum Generation and Migration in the Western Canada Sedimentary Basin. Geol. Atlas West. Can. Sediment. Basin 1994, 50, 189–202. [Google Scholar]
- Alberta Energy Regulator. Directive 065: Resources Applications for Oil and Gas Reservoirs. In Alberta Energy Regulator; Calgary, AB, Canada, 2016; Available online: https://www.aer.ca/documents/directives/Directive065.pdf (accessed on 16 October 2021).
- House of Commons of Canada. Bill C-12: An Act Respecting Transparency and Accountability in Canada’s Efforts to Acheive Net-Zero Greenhouse Gas Emissions by the Year 2050. 2020, p. 16. Available online: https://www.parl.ca/DocumentViewer/en/43-2/bill/C-12/royal-assent (accessed on 16 October 2021).
- Canada Energy Regulator. Canada Energy Future 2020. 2020. Available online: https://www.cer-rec.gc.ca/en/data-analysis/canada-energy-future/2020/index.html (accessed on 16 October 2021).
- Energy Resources Conservation Board. Directive 51: Injection and Disposal Wells Well Classifications Completion, Logging and Testing Requirements. 1994. Available online: https://www.aer.ca/documents/directives/Directive051.pdf (accessed on 16 October 2021).
- Environment and Climate Change Canada. National Inventory Report 1990–2017: Greenhouse Gas Sources and Sinks in Canada. 2019. Available online: https://www.canada.ca/en/environment-climate-change/services/climate-change/greenhouse-gas-emissions.html (accessed on 16 October 2021).
- Layzell, D.B.; Young, C.; Lof, J.; Leary, J.; Sit, S. Towards net-zero energy systems in Canada: A key role for hydrogen. Transit. Accel. Rep. 2020, 2, 53. Available online: https://www.cesarnet.ca/publications/transition-accelerator-reports/towards-net-zero-energy-systems-canada-key-role-hydrogen%0Ahttps://transitionaccelerator.ca/towards-net-zero-energy-systems-in-canada-a-key-role-for-hydrogen (accessed on 16 October 2021).
- Banks, J.; Harris, N.B. Geothermal potential of Foreland Basins: A case study from the Western Canadian Sedimentary Basin. Geothermics 2018, 76, 74–92. [Google Scholar] [CrossRef]
- Hawkes, C.D.; McLellan, P.J.; Zimmer, U.; Bachu, S. Geomechanical factors affecting geological storage of CO2 in depleted oil and gas reservoirs. In Proceedings of the Canadian International Petroleum Conference, Calgary, AB, Canada, 8–10 June 2004. [Google Scholar] [CrossRef]
- Schwab, D.R.; Bidgoli, T.S.; Taylor, M.H. Characterizing the Potential for Injection-Induced Fault Reactivation Through Subsurface Structural Mapping and Stress Field Analysis, Wellington Field, Sumner County, Kansas. J. Geophys. Res. Solid Earth 2017, 122, 10,132–10,154. [Google Scholar] [CrossRef] [Green Version]
- Hannis, S.; Lu, J.; Chadwick, A.; Hovorka, S.; Kirk, K.; Romanak, K.; Pearce, J. CO2 Storage in Depleted or Depleting Oil and Gas Fields: What can We Learn from Existing Projects? Energy Procedia 2016, 114, 5680–5690. [Google Scholar] [CrossRef]
- Watson, T.L. Abandoned wells create liability for future subsurface exploitation. Alta. Law Rev. 2020, 57, 1001–1024. Available online: https://www.albertalawreview.com/index.php/ALR/article/view/2602/2564 (accessed on 16 October 2021). [CrossRef]
- Birks, S.J.; Fennell, J.W.; Gibson, J.J.; Yi, Y.; Moncur, M.C.; Brewster, M. Using regional datasets of isotope geochemistry to resolve complex groundwater flow and formation connectivity in northeastern Alberta, Canada. Appl. Geochem. 2019, 101, 140–159. [Google Scholar] [CrossRef]
- Bachu, S. Flow systems in the Alberta Basin: Patterns, types and driving mechanisms. Bull. Can. Pet. Geol. 1999, 47, 455–474. [Google Scholar]
- Ferguson, G.; McIntosh, J.C.; Grasby, S.E.; Hendry, M.J.; Jasechko, S.; Lindsay, M.B.J.; Luijendijk, E. The Persistence of Brines in Sedimentary Basins. Geophys. Res. Lett. 2018, 45, 4851–4858. [Google Scholar] [CrossRef]
- Zoback, M.D.; Gorelick, S.M. Earthquake triggering and large-scale geologic storage of carbon dioxide. Proc. Natl. Acad. Sci. USA 2012, 109, 10164–10168. [Google Scholar] [CrossRef] [Green Version]
- Lippmann, M.J.; Benson, S.M. Relevance of Underground Natural Gas Storage to Geologic Sequestration of Carbon Dioxide. 2002. Available online: http://escholarship.org/uc/item/5gs5q111.pdf (accessed on 16 October 2021).
- Nicot, J.; Chowdhury, A.H. Are Depleted Oil and Gas Fields a Good Alternative for the Disposal of Concentrate from Brackish Water Desalination Plants: Ca? Desalination 2005, 181, 61–74. [Google Scholar] [CrossRef]
- Benson, S.; Cook, P. Chapter 5: Underground geological storage. In IPCC Special Report on Carbon Dioxide Capture and Storage, Intergovernmental Panel on Climate Change; Cambridge University Press: New York, NY, USA, 2005; pp. 195–276. [Google Scholar]
- Perry, K.F. Natural Gas Storage Industry Experience and Technology: Potential Application to CO2 Geological Storage. Carbon Dioxide Capture Storage Deep Geol. Form. 2005, 2, 815–825. [Google Scholar] [CrossRef]
- Stern, V.H.; Schultz, R.J.; Shen, L.; Gu, Y.J.; Eaton, D.W. Alberta earthquake catalogue, version 1.0: September 2006 through December 2010. Alta. Geol. Surv. Open File Rept 2013, 15, 36. [Google Scholar]
- Fereidoni, A.; Cui, L. Composite Alberta Seismicity Catalog: CASC2014-x. 2015. Available online: http://www.inducedseismicity.ca/wp-content/uploads/2015/01/Composite-Alberta-Seismicity-Catalog3.pdf (accessed on 8 April 2021).
- Schultz, R.; Stern, V.; Gu, Y.J.; Eaton, D. Detection threshold and location resolution of the Alberta Geological Survey earthquake catalogue. Seismol. Res. Lett. 2015, 86, 385–397. [Google Scholar] [CrossRef]
- Milne, W.G. The Snipe Lake, Alberta earthquake of 8 March 1970. Can. J. Earth Sci. 1970, 7, 1564–1567. [Google Scholar] [CrossRef]
- Milne, W.G.; Berry, W. Induced Seismicity in Canada. Int. J. Rock Mech. Min. Sci. 1976, 13, 258–283. [Google Scholar] [CrossRef]
- Wetmiller, R.J. Earthquakes near Rocky Mountain House, Alberta, and their relationship to gas production facilities (Canada). Can. J. Earth Sci. 1986, 23, 172–181. [Google Scholar] [CrossRef]
- Schultz, R.; Stern, V.; Gu, Y.J. An investigation of seismicity clustered near the Cordel Field, west central Alberta, and its relation to a nearby disposal well. J. Geophys. Res. Solid Earth 2014, 119, 3410–3423. [Google Scholar] [CrossRef]
- Rokosh, C.D.; Lyster, S.; Anderson, S.D.A.; Beaton, A.P.; Berhane, H.; Brazzoni, T.; Chen, D.; Cheng, Y.; Mack, T.; Pana, C.; et al. Summary of Alberta’s Shale- and Siltstone-Hosted Hydrocarbon Resource Potential. 2012. Available online: https://ags.aer.ca/publication/ofr-2012-06 (accessed on 16 October 2021).
- Galloway, E.; Hauck, T.; Corlett, H.; Pana, D.; Schultz, R. Faults and associated karst collapse suggest conduits for fluid flow that influence hydraulic fracturing-induced seismicity. Proc. Natl. Acad. Sci. USA 2018, 115, E10003–E10012. [Google Scholar] [CrossRef] [Green Version]
- Schultz, R.; Wang, R.; Gu, Y.J.; Haug, K.; Atkinson, G. A seismological overview of the induced earthquakes in the Duvernay play near Fox Creek, Alberta. J. Geophys. Res. Solid Earth 2017, 122, 492–505. [Google Scholar] [CrossRef]
- Atkinson, G.M. Strategies to prevent damage to critical infrastructure due to induced seismicity. Facets 2017, 2, 374–394. [Google Scholar] [CrossRef]
- Peck, W.D.; Bachu, S.; Knudsen, D.J.; Hauck, T.; Crotty, C.M.; Gorecki, J.A.; Sorenson, J.; Peterson, J.; Melnik, A. CO2 storage resource potential of the Cambro-Ordovician Saline System in the western interior of North America. Energy Procedia 2013, 37, 5230–5239. [Google Scholar] [CrossRef] [Green Version]
- Bachu, S.; Melnik, A.; Bistran, R. Approach to evaluating the CO2 storage capacity in Devonian deep saline aquifers for emissions from oil sands operations in the Athabasca area, Canada. Energy Procedia 2014, 63, 5093–5102. [Google Scholar] [CrossRef] [Green Version]
- Barson, D.; Bachu, S.; Esslinger, P. Flow systems inf the Mannville Group in the east-central Athabasca area and implications for steam-assisted gravity drainage operations for in-situ bitumen production. Bull. Can. Pet. Geol. 2001, 49, 376–392. [Google Scholar] [CrossRef]
- Miall, A.D. Geoscience of climate and energy 13. The environmental hydrogeology of the oil sands, lower Athabasca area, Alberta. Geosci. Canada 2013, 40, 215–233. [Google Scholar] [CrossRef]
- Broughton, P.L. Subglacial blowouts in western Canada: Insights into extreme meltwater pressures and hydrofracturing. Boreas 2018, 47, 326–346. [Google Scholar] [CrossRef] [Green Version]
- Sperling, T. Risk-Cost-Benefit Framework for the Design of Dewatering Systems in Open Pit Mines. Ph.D. Thesis, University of British Columbia, Vancouver, BC, Canada, 1990. Available online: https://open.library.ubc.ca/soa/cIRcle/collections/ubctheses/831/items/1.0052413 (accessed on 10 January 2022).
- Walters, D.A.; Settari, A.; Kry, P.R. Coupled geomechanical and reservoir modeling investigating poroelastic effects of cyclic steam stimulation in the cold lake reservoir. SPE Reserv. Eval. Eng. 2002, 5, 507–516. [Google Scholar] [CrossRef]
- Pooladi-Darvish, M.; Mattar, L. SAGD operations in the presence of overlying gas cap and water layer—Effect of shale layers. J. Can. Pet. Technol. 2002, 41, 40–50. [Google Scholar] [CrossRef]
- Bachu, S. Synthesis and model of formation-water flow, Alberta Basin, Canada. Am. Assoc. Pet. Geol. Bull. 1995, 79, 1159–1178. [Google Scholar] [CrossRef]
- Majorowicz, J.; Hofmann, H.; Babadagli, T. Deep geothermal heat storage under oilsands—Can we use it to help oilsands industry? New EGS concept proposed. Trans. Geotherm. Resour. Counc. 2013, 37, 173–178. [Google Scholar]
- Bachu, S.; Burwash, R.A. Regional Scale Analysis of the Geothermal Regime in the Western Canadian Sedimentary Basin. Geothermics 1991, 22, 387–407. [Google Scholar] [CrossRef]
- Klassen, J. AER/AGS Open File Report 2020-05: First-Order Groundwater Availability Assessment for the Lower Athabasca Region, Eastern Alberta. 2021. Available online: https://static.ags.aer.ca/files/document/OFR/OFR_2020_05.pdf (accessed on 10 January 2022).
- Birkholzer, J.T.; Zhou, Q. Basin-scale hydrogeologic impacts of CO2 storage: Capacity and regulatory implications. Int. J. Greenh. Gas Control 2009, 3, 745–756. [Google Scholar] [CrossRef]
- Anfort, S.J.; Bachu, S.; Bentley, L.R. Regional-scale hydrogeology of the upper devonian-lower creataceous sedimentary succession, south-central Alberta basin, Canada. Am. Assoc. Pet. Geol. Bull. 2001, 85, 637–660. [Google Scholar] [CrossRef]
- Hitchon, B.; Holter, M.E. Calcium and Magnesium in Alberta Brines. Econ. Geol. Rep. 1971, 1, 1–26. Available online: https://ags.aer.ca/publications/ECO_1.html (accessed on 10 January 2022).
- TNO. TNO Report TNO-034-UT-2009-01427: Long Term Integrity of CO2 Storage—Well Abandonment. 2009. Available online: https://www.globalccsinstitute.com/archive/hub/publications/98891/long-term-integrity-co2-storage-well-abandonment.pdf (accessed on 16 October 2021).
- Allan Gray, D.; Majorowicz, J.; Unsworth, M. Investigation of the geothermal state of sedimentary basins using oil industry thermal data: Case study from Northern Alberta exhibiting the need to systematically remove biased data. J. Geophys. Eng. 2012, 9, 534–548. [Google Scholar] [CrossRef]
- Alberta Energy Regulator. Directive 040: Pressure and Deliverability Testing Oil and Gas Wells. 2020. Available online: https://static.aer.ca/prd/documents/directives/Directive040.pdf (accessed on 10 January 2022).
- Anderson, S.T.; Jahediesfanjani, H. Estimating the pressure-limited dynamic capacity and costs of basin-scale CO2 storage in a saline formation. Int. J. Greenh. Gas Control 2019, 88, 156–167. [Google Scholar] [CrossRef]
- Thibeau, S.; Bachu, S.; Birkholzer, J.; Holloway, S.; Neele, F.; Zhou, Q. Using pressure and volumetric approaches to estimate CO2 storage capacity in deep saline aquifers. Energy Procedia 2014, 63, 5294–5304. [Google Scholar] [CrossRef] [Green Version]
Figure 1.
Map of the PSAC Areas, oil sands areas (OSA) and the Duvernay Shale Formation in Alberta. Courtesy of the Alberta Department of Energy.
Figure 1.
Map of the PSAC Areas, oil sands areas (OSA) and the Duvernay Shale Formation in Alberta. Courtesy of the Alberta Department of Energy.

Figure 2.
Calculated net stock tank (a) gas balance (gas injected - gas produced) (b) liquid balance (liquid injected - liquid produced) trends in the Alberta Basin for the period 1960–2020. Source data extracted from geoLOGIC Systems databases © 2020.
Figure 2.
Calculated net stock tank (a) gas balance (gas injected - gas produced) (b) liquid balance (liquid injected - liquid produced) trends in the Alberta Basin for the period 1960–2020. Source data extracted from geoLOGIC Systems databases © 2020.

Figure 3.
Calculated net in situ (a) gas and (b) liquid balance for area AB1 over the period January 1960–December 2020. Red bars: <1 km depth from Precambrian basement; Yellow bars: 1–2 km depth from Precambrian basement; Green bars: 2–3 km depth from Precambrian basement; Blue bars: 3–4 km frm Precambrian basement; Pink bars: 4–5 km depth from Precambrian basement; Brown bars: 5+ km depth from Precambrian basement. Source data extracted from geoLOGIC Systems databases © 2020.

Figure 4.
Calculated net in situ (a) gas and (b) liquid balance for AB2 over the period January 1960–December 2020. Red bars: <1 km depth from Precambrian basement; Yellow bars: 1–2 km depth from Precambrian basement; Green bars: 2–3 km depth from Precambrian basement; Blue bars: 3–4 km frm Precambrian basement; Pink bars: 4–5 km depth from Precambrian basement; Brown bars: 5+ km depth from Precambrian basement. Source data extracted from geoLOGIC Systems databases © 2020.

Figure 5.
Calculated net in situ (a) gas and (b) liquid balance for AB3 over the period January 1960–December 2020. Red bars: <1 km depth from Precambrian basement; Yellow bars: 1–2 km depth from Precambrian basement; Green bars: 2–3 km depth from Precambrian basement. Source data extracted from geoLOGIC Systems databases © 2020.

Figure 6.
Calculated net in situ (a) gas and (b) liquid balance for AB4 over the period January 1960–December 2020. Red bars: <1 km depth from Precambrian basement; Yellow bars: 1–2 km depth from Precambrian basement; Green bars: 2–3 km depth from Precambrian basement. Source data extracted from geoLOGIC Systems databases © 2020.

Figure 7.
Calculated net in situ (a) gas and (b) liquid balance for AB5 over the period January 1960–December 2020. Red bars: <1 km depth from Precambrian basement; Yellow bars: 1–2 km depth from Precambrian basement; Green bars: 2–3 km depth from Precambrian basement; Blue bars: 3–4 km frm Precambrian basement. Source data extracted from geoLOGIC Systems databases © 2020.

Figure 8.
Calculated net in situ (a) gas and (b) liquid balance for AB6 over the period January 1960–December 2020. Red bars: <1 km depth from Precambrian basement; Yellow bars: 1–2 km depth from Precambrian basemen. Source data extracted from geoLOGIC Systems databases © 2020.
Figure 8.
Calculated net in situ (a) gas and (b) liquid balance for AB6 over the period January 1960–December 2020. Red bars: <1 km depth from Precambrian basement; Yellow bars: 1–2 km depth from Precambrian basemen. Source data extracted from geoLOGIC Systems databases © 2020.

Figure 9.
Calculated net in situ (a) gas and (b) liquid balance for AB7 over the period January 1960–December 2020. Red bars: <1 km depth from Precambrian basement; Yellow bars: 1–2 km depth from Precambrian basement; Green bars: 2–3 km depth from Precambrian basement; Blue bars: 3–4 km frm Precambrian basement. Source data extracted from geoLOGIC Systems databases © 2020.

Figure 10.
Calculated net annual gas balance trend in the Alberta Basin. Source data extracted from geoLOGIC Systems databases © 2020.
Figure 10.
Calculated net annual gas balance trend in the Alberta Basin. Source data extracted from geoLOGIC Systems databases © 2020.

Figure 11.
Calculated annual variations in steam and other gas phase injection volumes in area AB6. Source data extracted from geoLOGIC Systems databases © 2020.
Figure 11.
Calculated annual variations in steam and other gas phase injection volumes in area AB6. Source data extracted from geoLOGIC Systems databases © 2020.

Figure 12.
Calculated net annual liquid balance trend in the Alberta Basin. Source data extracted from geoLOGIC Systems databases © 2020.
Figure 12.
Calculated net annual liquid balance trend in the Alberta Basin. Source data extracted from geoLOGIC Systems databases © 2020.

Figure 13.
Illustration of the two mega - hydrodynamic regimes in the Alberta basin. Adapted from Bachu, 1995. © AAPG Bulletin 1995 and reprinted by permission from the AAPG whose permission is required for further use.
Figure 13.
Illustration of the two mega - hydrodynamic regimes in the Alberta basin. Adapted from Bachu, 1995. © AAPG Bulletin 1995 and reprinted by permission from the AAPG whose permission is required for further use.

Figure 14.
Examples of data scatter in the pool pressure-survey records contained in the geoSCOUTTM database. Source data extracted from geoLOGIC Systems databases © 2020.
Figure 14.
Examples of data scatter in the pool pressure-survey records contained in the geoSCOUTTM database. Source data extracted from geoLOGIC Systems databases © 2020.

Figure 15.
Calculated net in situ gas deficit in the Alberta Basin (as of 31 December 2020). Source data extracted from geoLOGIC Systems databases © 2020.
Figure 15.
Calculated net in situ gas deficit in the Alberta Basin (as of 31 December 2020). Source data extracted from geoLOGIC Systems databases © 2020.

Figure 16.
Calculated net in situ liquid deficit in the Alberta Basin (as of 31 December 2020). Source data extracted from geoLOGIC Systems databases © 2020.
Figure 16.
Calculated net in situ liquid deficit in the Alberta Basin (as of 31 December 2020). Source data extracted from geoLOGIC Systems databases © 2020.


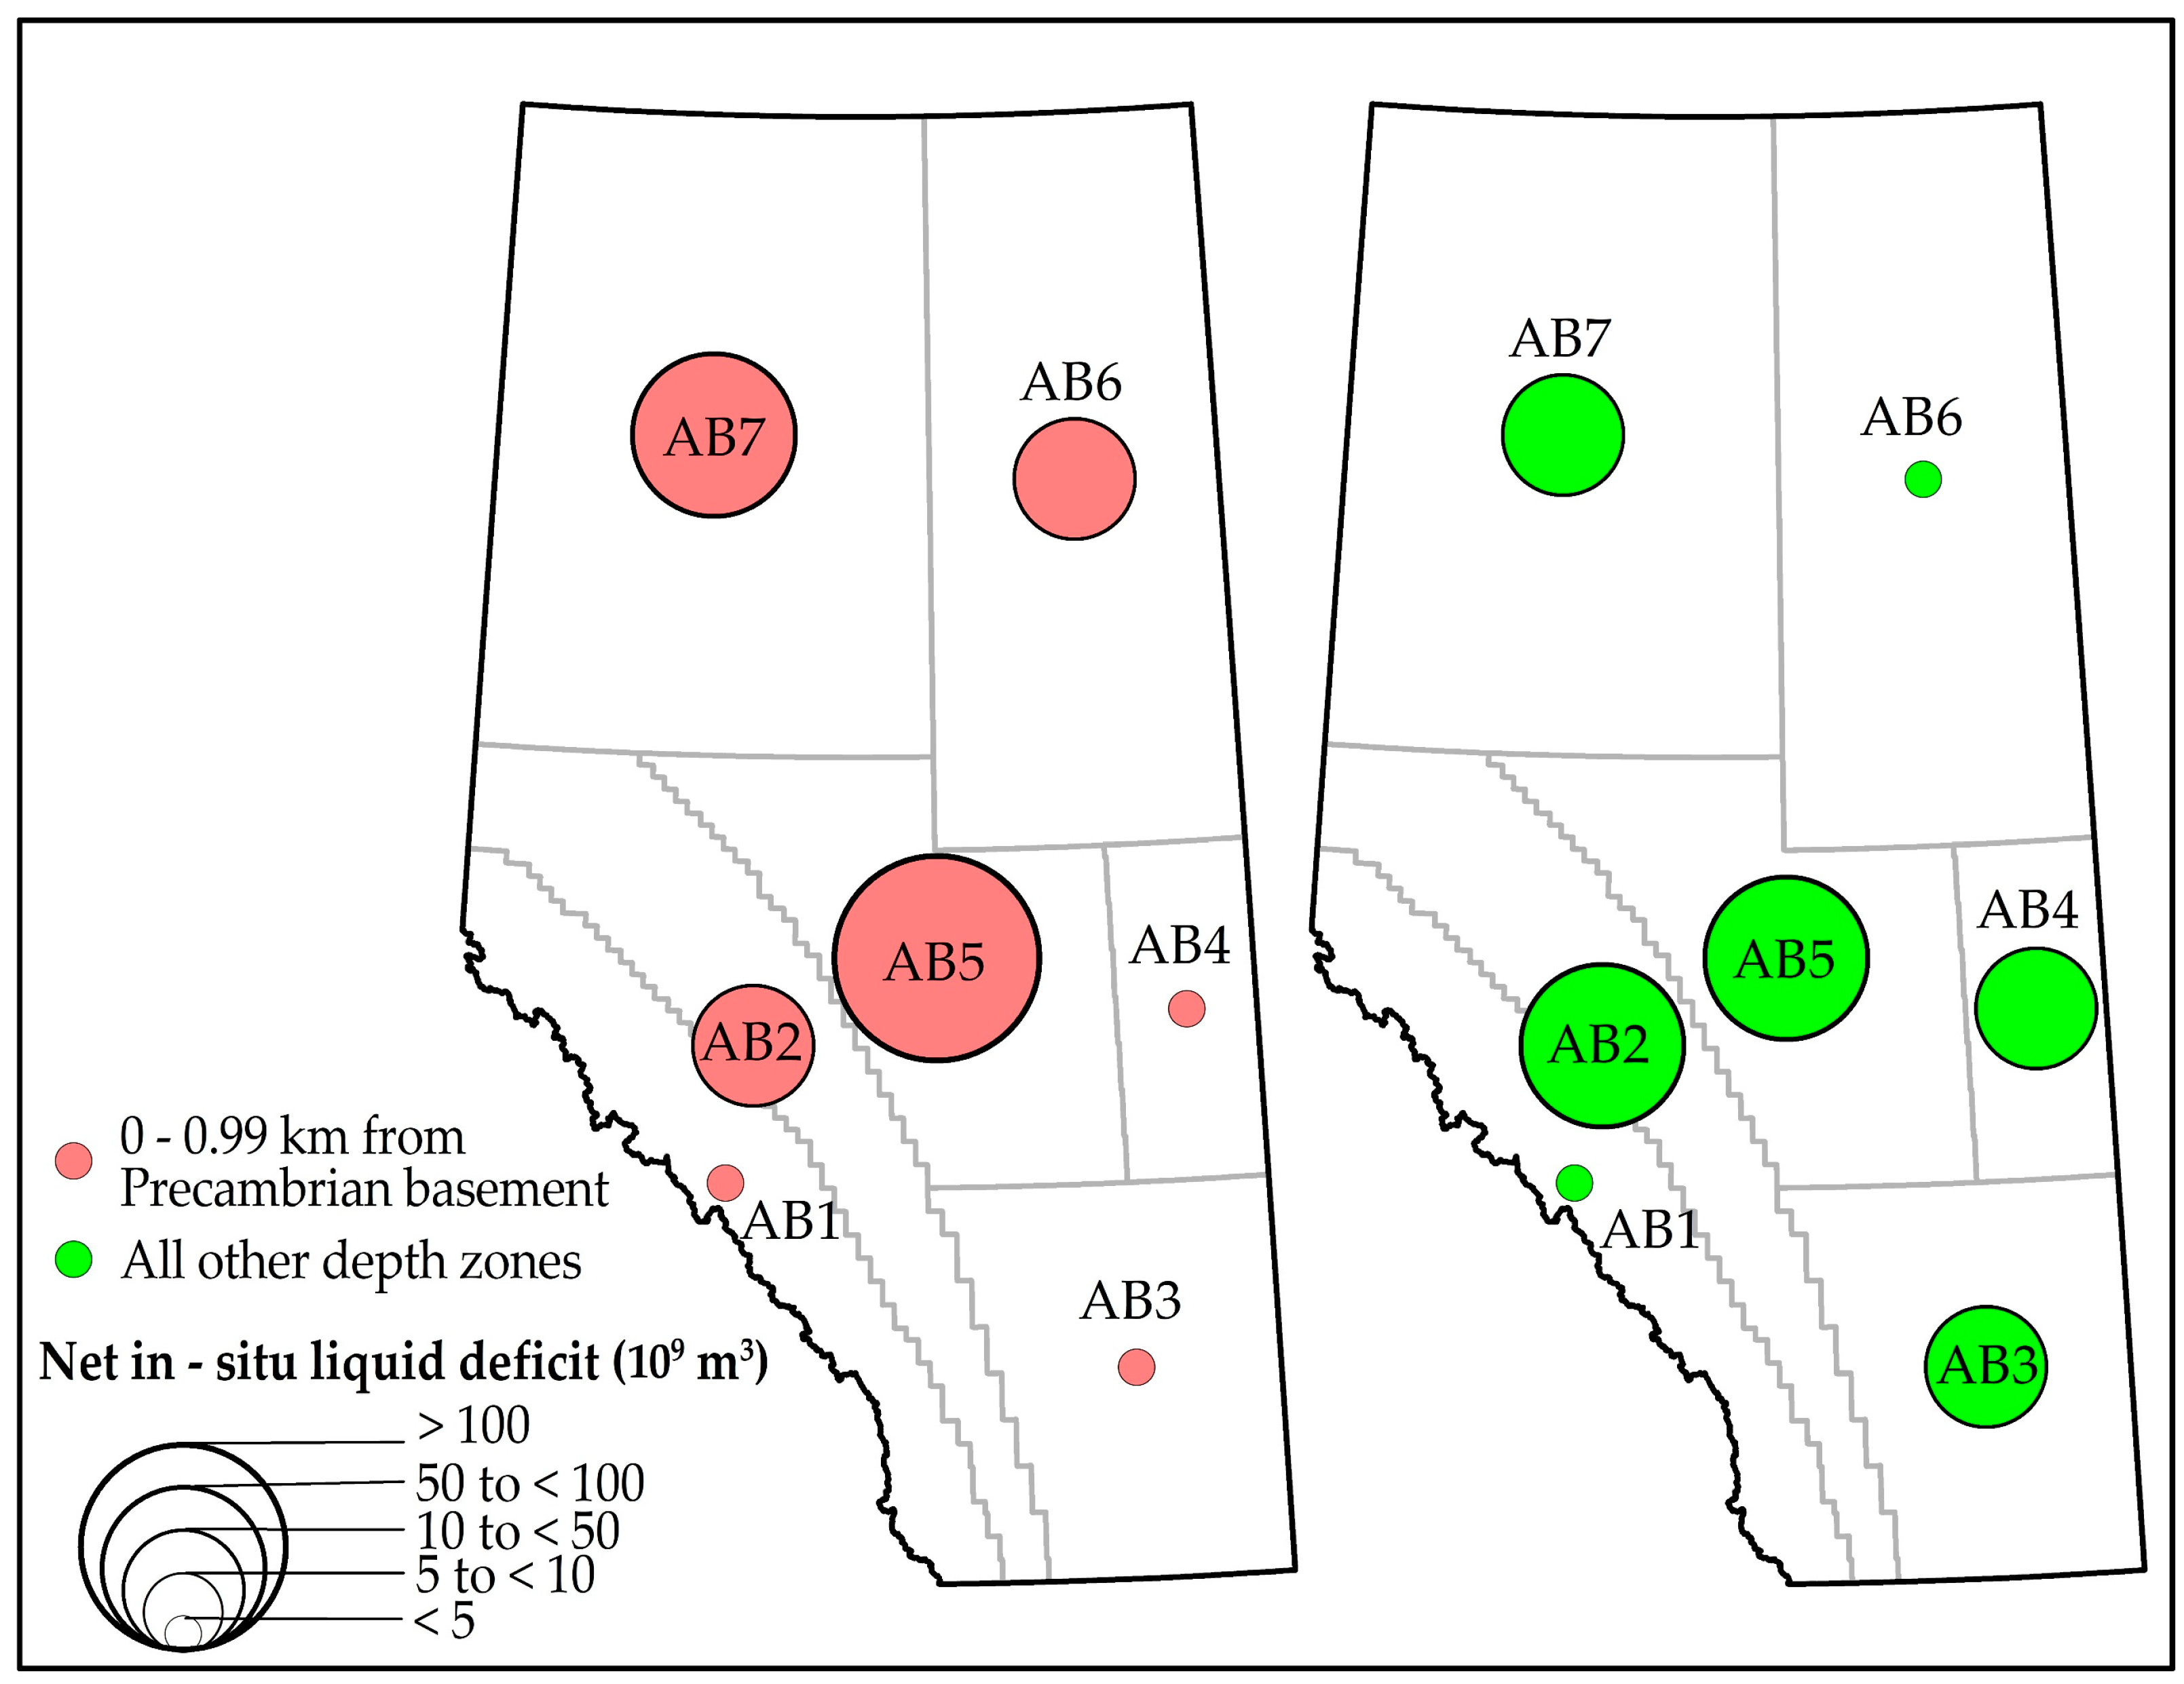
Table 1.
Summary of calculated industrial fluid injection and production stock-tank volumes in the Alberta Basin (1960–2020). Source data extracted from geoLOGIC Systems databases © 2020.
Table 1.
Summary of calculated industrial fluid injection and production stock-tank volumes in the Alberta Basin (1960–2020). Source data extracted from geoLOGIC Systems databases © 2020.
| Gases (m3) | Liquids (m3) | |
|---|---|---|
| Total produced | 6.84 × 10¹² | 2.46 × 10¹⁰ |
| Total injected | 7.97 × 10¹¹ | 2.01 × 10¹⁰ |
| Difference | −6.05 × 10¹² | −4.53 × 1009 |
Table 2.
Calculated decade-level variations in net industrial fluid injection and production stock-tank volumes in the Alberta Basin. Source data extracted from geoLOGIC Systems databases © 2020.
Table 2.
Calculated decade-level variations in net industrial fluid injection and production stock-tank volumes in the Alberta Basin. Source data extracted from geoLOGIC Systems databases © 2020.
| Decade | Net Gas (m3) | Net Liquid (m3) |
|---|---|---|
| 1960–1969 | −3.82 × 10¹¹ | −3.03 × 1008 |
| 1970–1979 | −7.18 × 10¹¹ | −3.96 × 1007 |
| 1980–1989 | −8.34 × 10¹¹ | −1.82 × 1008 |
| 1990–1999 | −1.38 × 10¹² | −4.24 × 1008 |
| 2000–2009 | −1.47 × 10¹² | −7.93 × 1008 |
| 2010–2019 | −1.16 × 10¹² | −2.50 × 1009 |
| Totals | −5.56 × 10¹² | −3.94 × 1009 |
Table 3.
Calculated reservoir pressure-change in select pools in the Alberta Basin (1960–2020). Source data extracted from geoLOGIC Systems databases © 2020.
Table 3.
Calculated reservoir pressure-change in select pools in the Alberta Basin (1960–2020). Source data extracted from geoLOGIC Systems databases © 2020.
| Area | Distance from Precambrian Basement (m) | Number of Pools with Comparable Pressure Data | Percentage of Pools Showing Increased Reservoir Pressure (%) | Average Increase (%) | Percentage of Pools Showing Decreased Reservoir Pressure (%) | Average Decrease (%) |
|---|---|---|---|---|---|---|
| AB1 | 5+ | 7 | 14 | 15 | 86 | −46 |
| AB1 | 4–4.99 | 18 | 11 | 91 | 89 | −36 |
| AB1 | 3–3.99 | 36 | 28 | 22 | 72 | −49 |
| AB1 | 2–2.99 | 47 | 13 | 35 | 87 | −50 |
| AB1 | 1–1.99 | 3 | 33 | 21 | 67 | −42 |
| AB1 | 0–0.99 | 1 | 0 | 0 | 100 | −66 |
| AB2 | 5+ | 1 | 0 | 0 | 100 | −20 |
| AB2 | 4–4.99 | 23 | 13 | 19 | 87 | −51 |
| AB2 | 3–3.99 | 79 | 15 | 80 | 85 | −44 |
| AB2 | 2–2.99 | 323 | 24 | 95 | 76 | −52 |
| AB2 | 1–1.99 | 996 | 22 | 70 | 78 | −51 |
| AB2 | 0–0.99 | 110 | 18 | 58 | 82 | −46 |
| AB3 | 2–2.99 | 92 | 36 | 117 | 64 | −45 |
| AB3 | 1–1.99 | 1351 | 23 | 50 | 77 | −44 |
| AB3 | 0–0.99 | 36 | 31 | 78 | 69 | −28 |
| AB4 | 1–1.99 | 884 | 21 | 45 | 79 | −40 |
| AB4 | 0–0.99 | 11 | 0 | 0 | 100 | −68 |
| AB5 | 3–3.99 | 2 | 0 | 0 | 100 | −66 |
| AB5 | 2–2.99 | 114 | 33 | 128 | 67 | −45 |
| AB5 | 1–1.99 | 1288 | 26 | 75 | 74 | −42 |
| AB5 | 0–0.99 | 25 | 40 | 108 | 60 | −32 |
| AB6 | 1–1.99 | 232 | 22 | 57 | 78 | −39 |
| AB6 | 0–0.99 | 238 | 15 | 38 | 84 | −41 |
| AB7 | 3–3.99 | 13 | 31 | 72 | 69 | −39 |
| AB7 | 2–2.99 | 63 | 17 | 133 | 83 | −49 |
| AB7 | 1–1.99 | 506 | 24 | 62 | 76 | −42 |
| AB7 | 0–0.99 | 400 | 28 | 85 | 73 | −36 |
Table 4.
Calculated net in situ fluid deficits in the Alberta Basin (as of 31 December 2020). Source data extracted from geoLOGIC Systems databases © 2020.
Table 4.
Calculated net in situ fluid deficits in the Alberta Basin (as of 31 December 2020). Source data extracted from geoLOGIC Systems databases © 2020.
| Area | 0–0.99 from the Precambrian Basement | All Other Depth Zones | ||
|---|---|---|---|---|
| Net Gas Deficit (km3) | Net Liquid Deficit (km3) | Net Gas Deficit (km3) | Net Liquid Deficit (km3) | |
| AB1 | −324 | 0 | −117,144 | −5 |
| AB2 | −166,562 | −38 | −447,808 | −87 |
| AB3 | −11,165 | −4 | −122,121 | −29 |
| AB4 | −2820 | −4 | −20,713 | −22 |
| AB5 | −52,007 | −161 | −121,545 | −70 |
| AB6 | −3742 | −29 | −9225 | −2 |
| AB7 | −46,116 | −60 | −68,361 | −13 |
Publisher’s Note: MDPI stays neutral with regard to jurisdictional claims in published maps and institutional affiliations. |
© 2022 by the authors. Licensee MDPI, Basel, Switzerland. This article is an open access article distributed under the terms and conditions of the Creative Commons Attribution (CC BY) license (https://creativecommons.org/licenses/by/4.0/).
Share and Cite
MDPI and ACS Style
Samaroo, M.; Chalaturnyk, R.; Dusseault, M.; Jackson, R.; Buhlmann, A.; Custers, H. An Assessment of the Net Fluid Balance in the Alberta Basin. Energies 2022, 15, 1081. https://0-doi-org.brum.beds.ac.uk/10.3390/en15031081
AMA Style
Samaroo M, Chalaturnyk R, Dusseault M, Jackson R, Buhlmann A, Custers H. An Assessment of the Net Fluid Balance in the Alberta Basin. Energies. 2022; 15(3):1081. https://0-doi-org.brum.beds.ac.uk/10.3390/en15031081
Chicago/Turabian StyleSamaroo, Mahendra, Rick Chalaturnyk, Maurice Dusseault, Richard Jackson, Arndt Buhlmann, and Hans Custers. 2022. "An Assessment of the Net Fluid Balance in the Alberta Basin" Energies 15, no. 3: 1081. https://0-doi-org.brum.beds.ac.uk/10.3390/en15031081
Note that from the first issue of 2016, this journal uses article numbers instead of page numbers. See further details here.