
Protective Coatings for Ferritic Stainless Steel Interconnect Materials in High Temperature Solid Oxide Electrolyser Atmospheres

 ,
,  , ,
, ,
Abstract
:1. Introduction
2. Materials and Methods
2.1. Materials
Coating Preparation
2.2. Oxidation Tests
2.3. Post-Test Characterization
3. Results and Discussion
3.1. Weight Gain
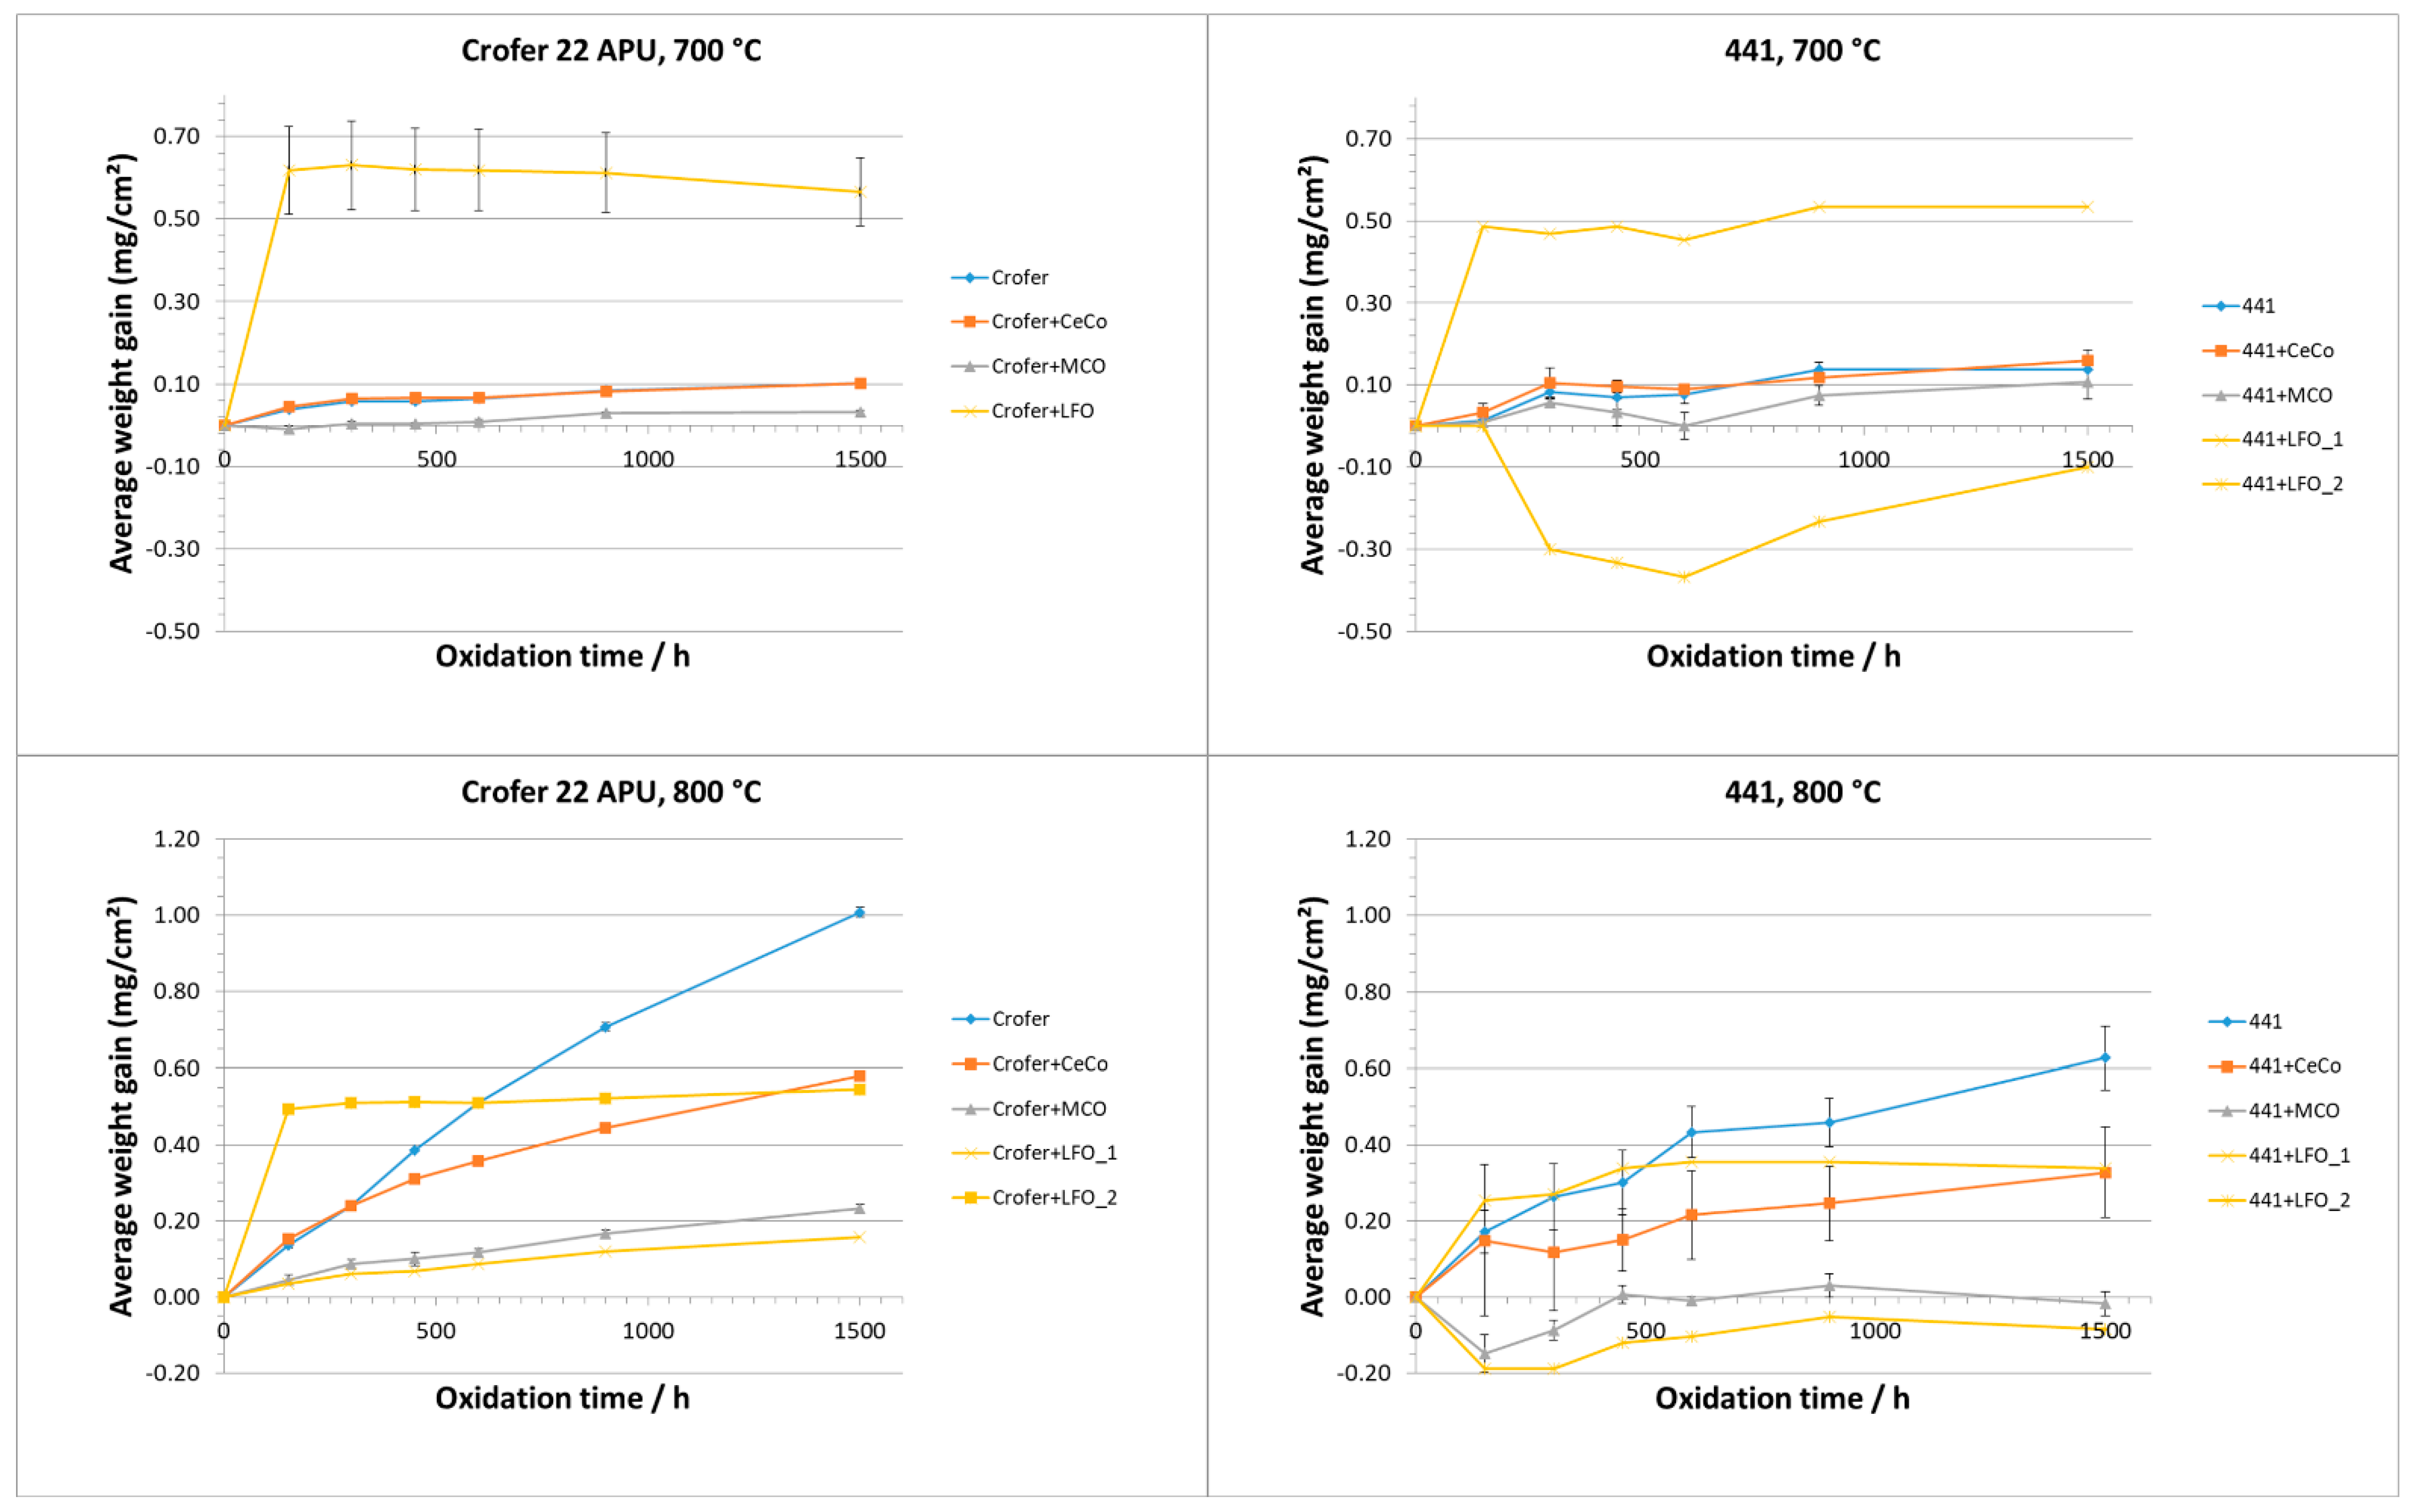
3.1.1. O2 Atmosphere
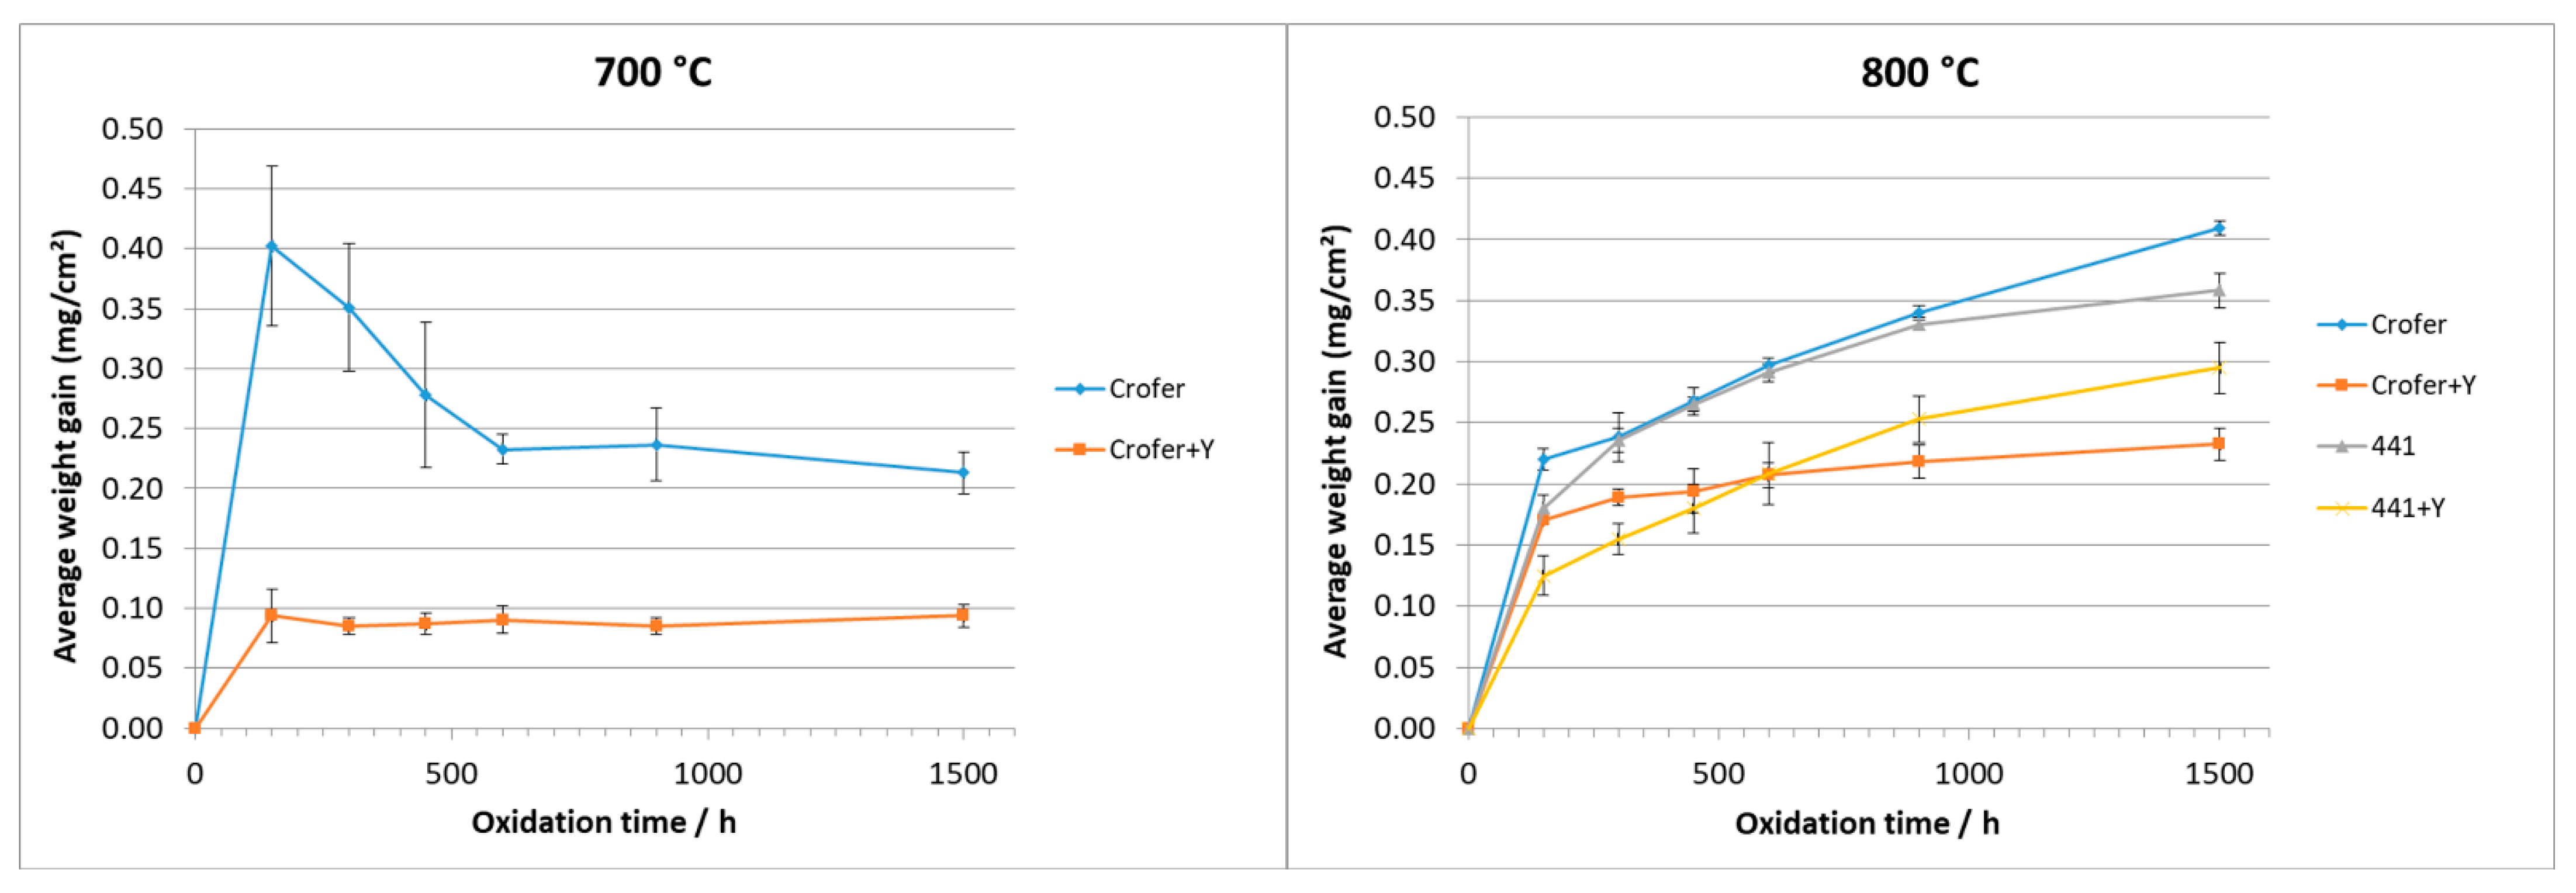
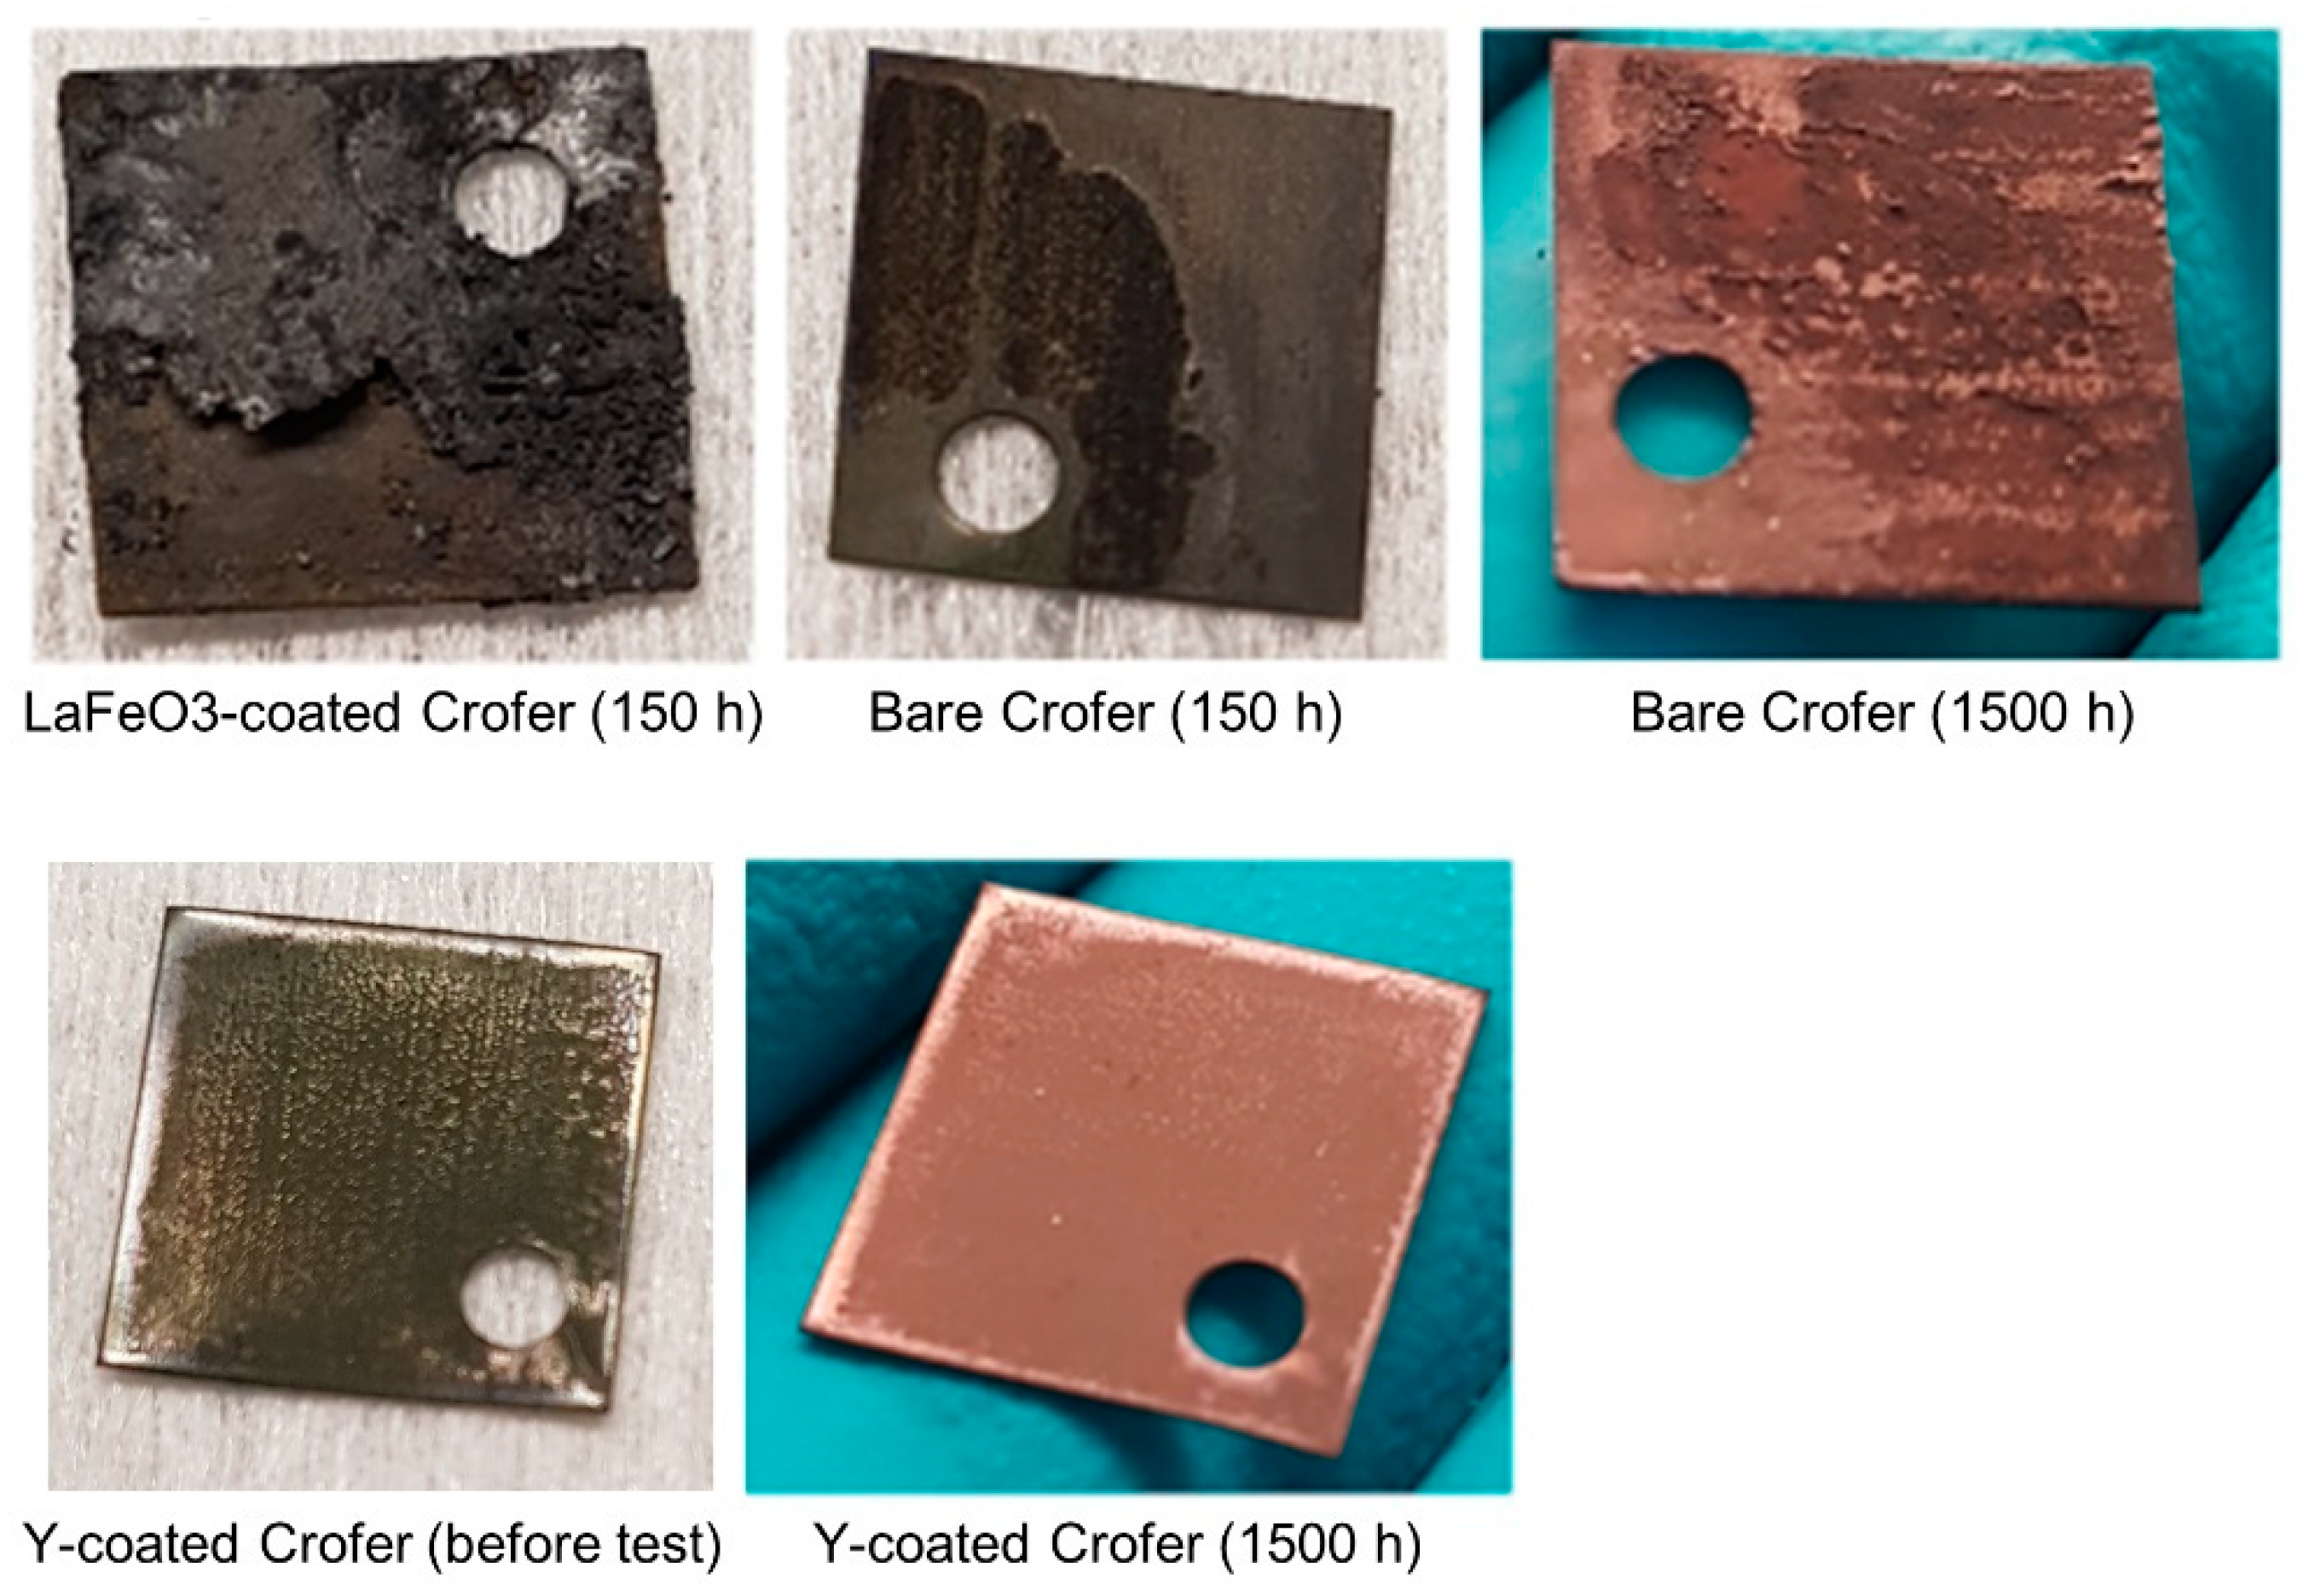
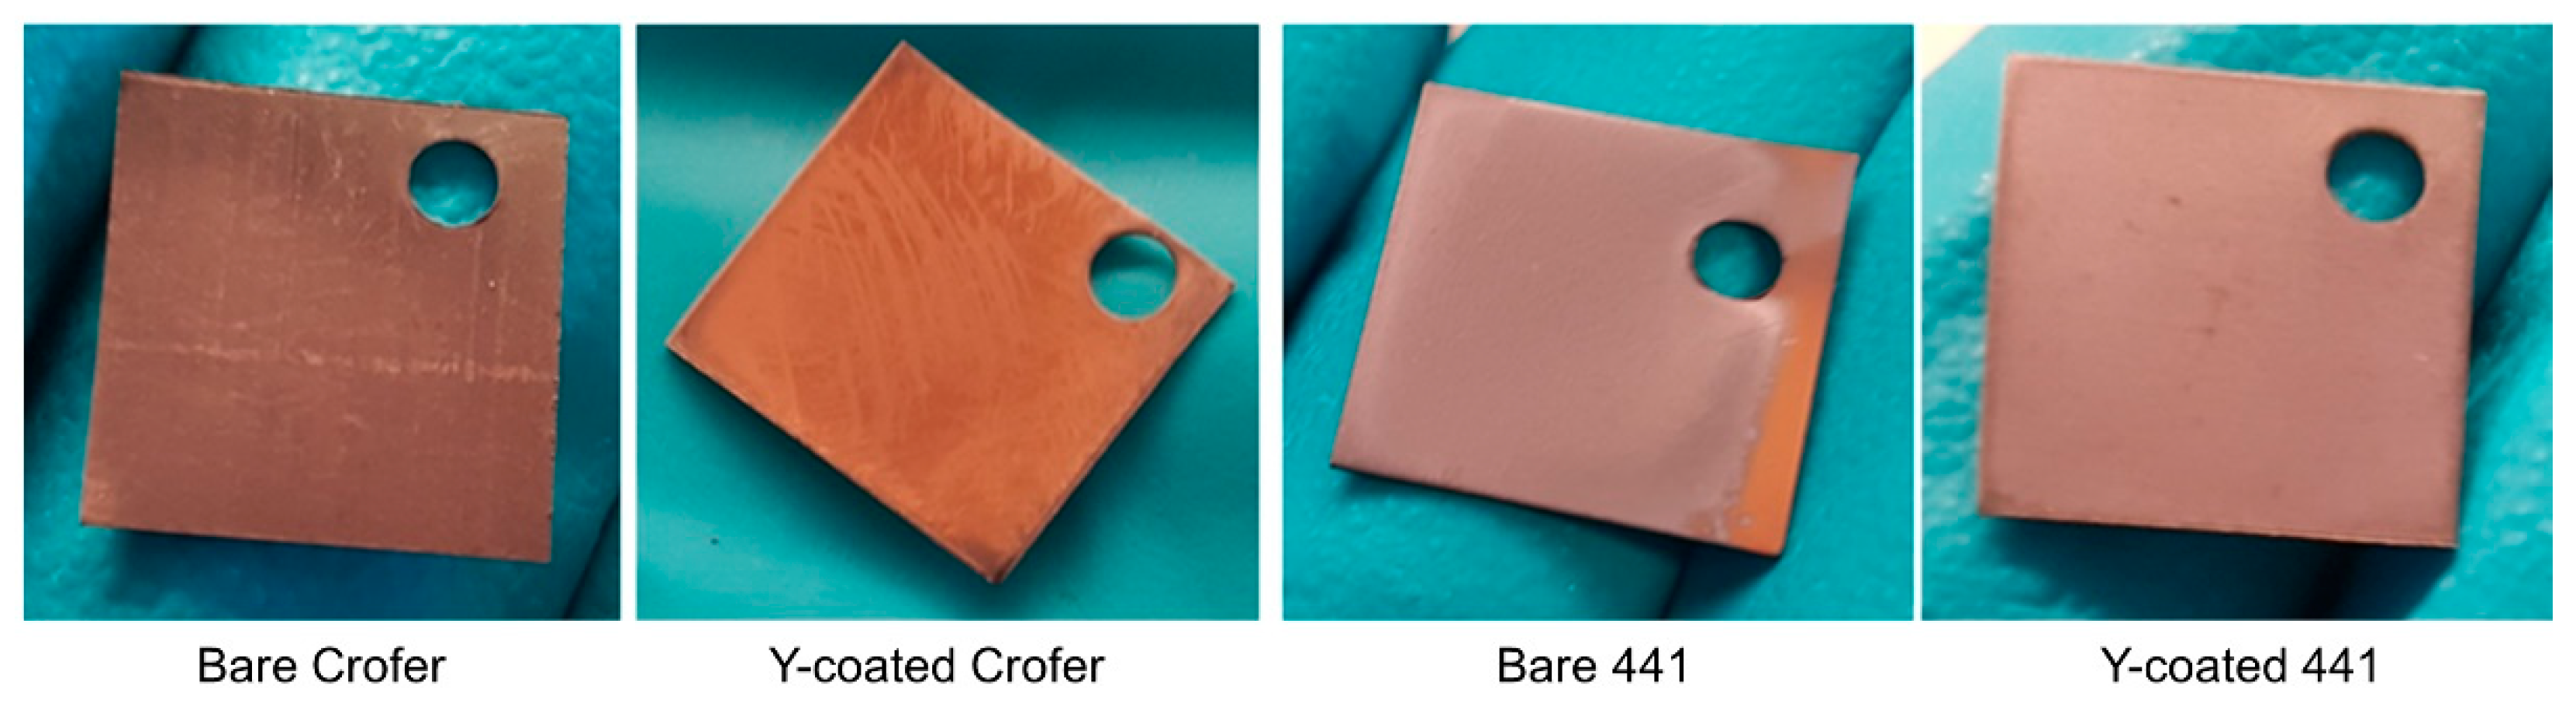
3.1.2. H2-H2O Atmosphere
3.2. Post-Test Analysis
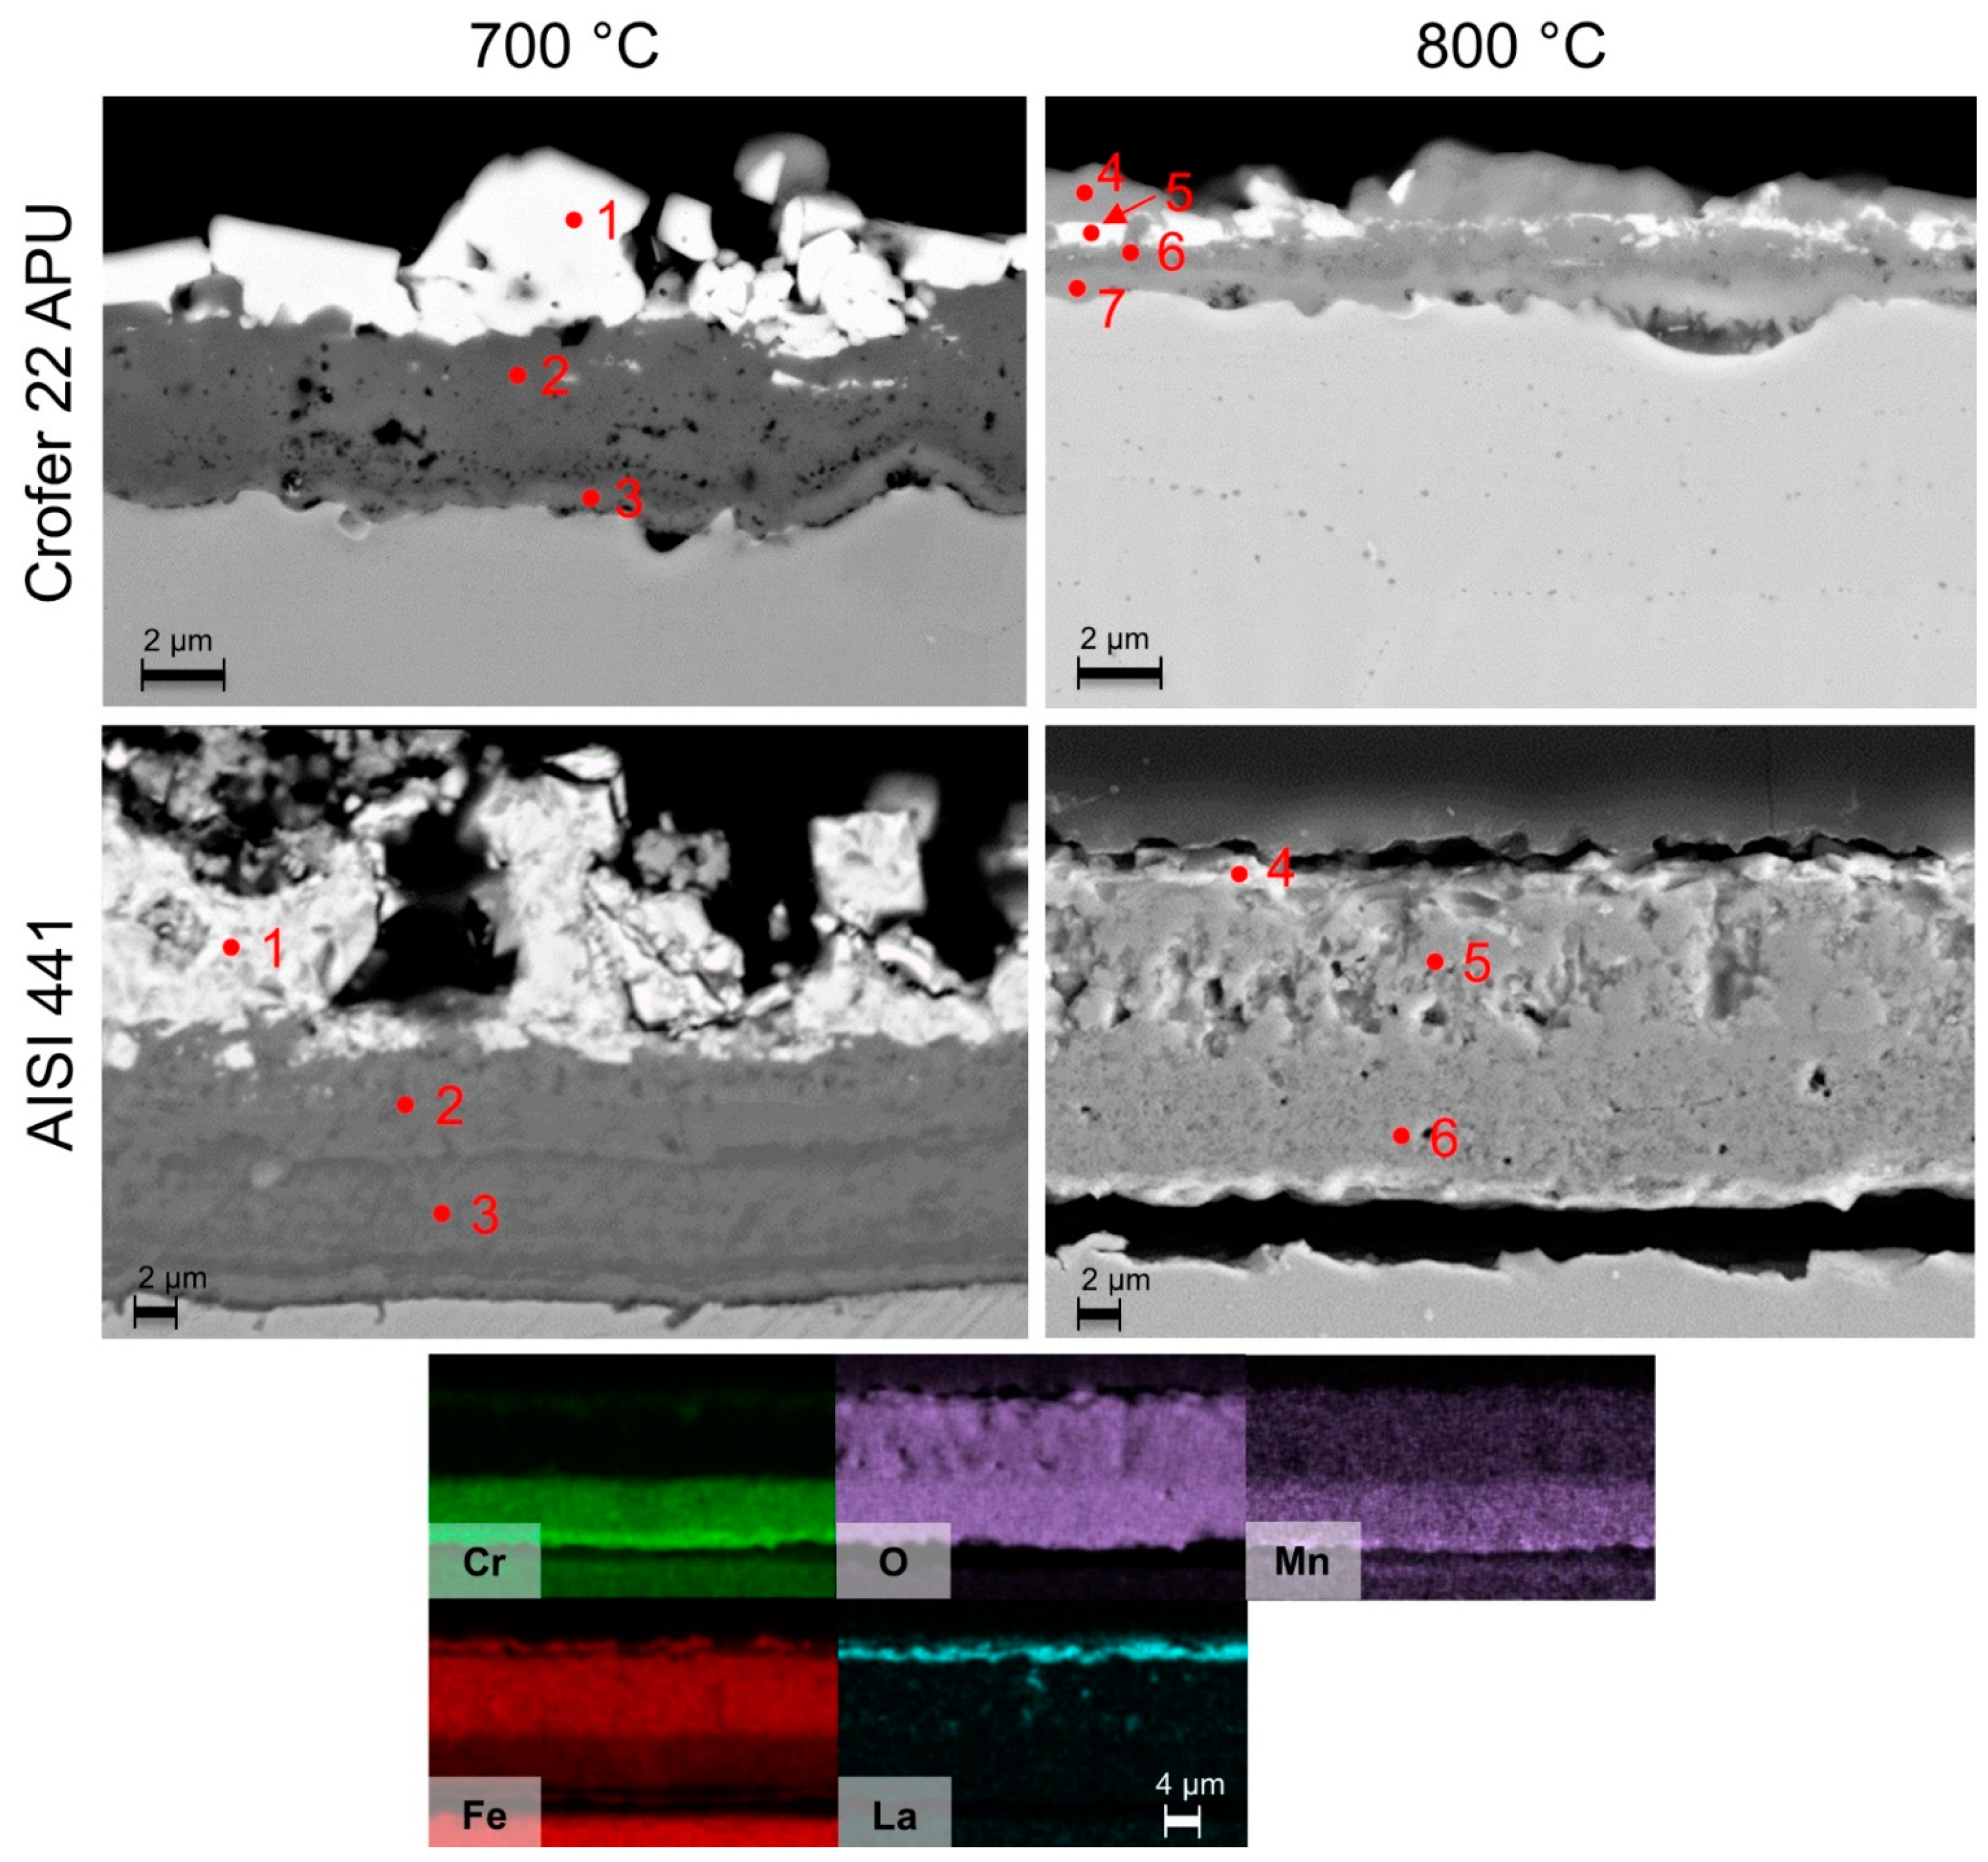
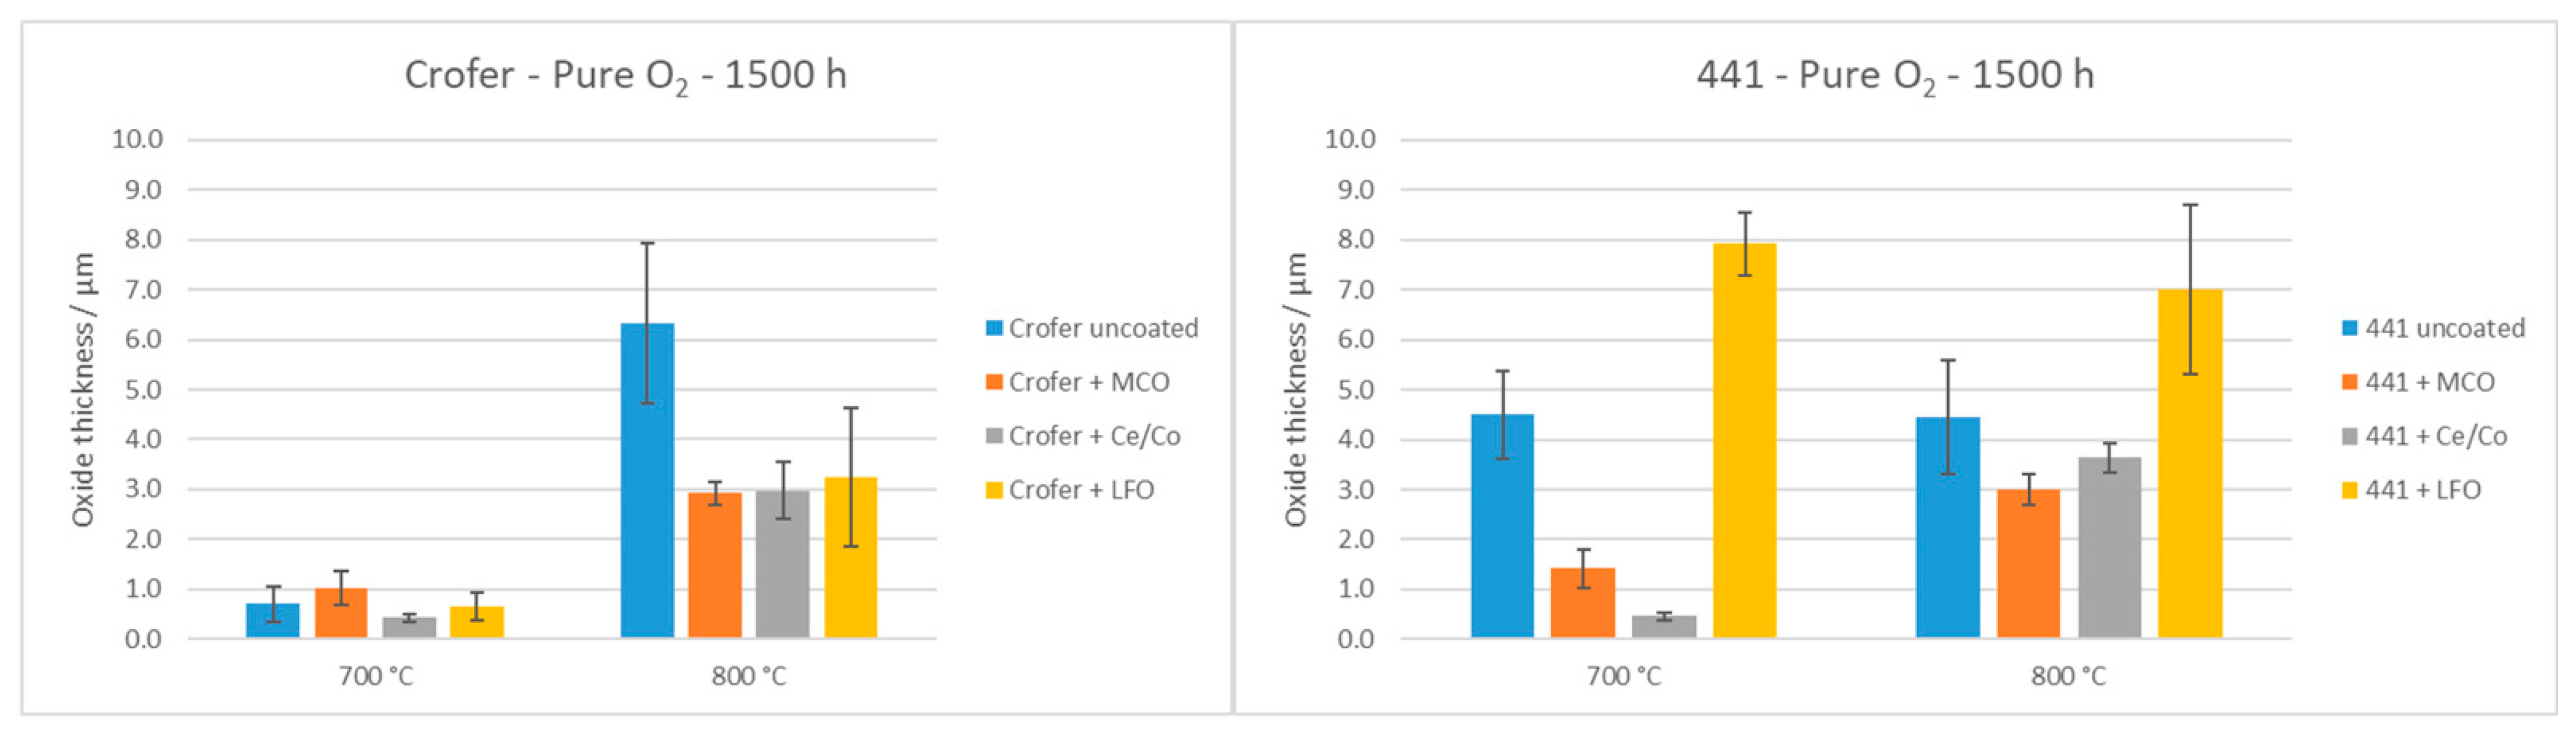
3.2.1. O2 Atmosphere
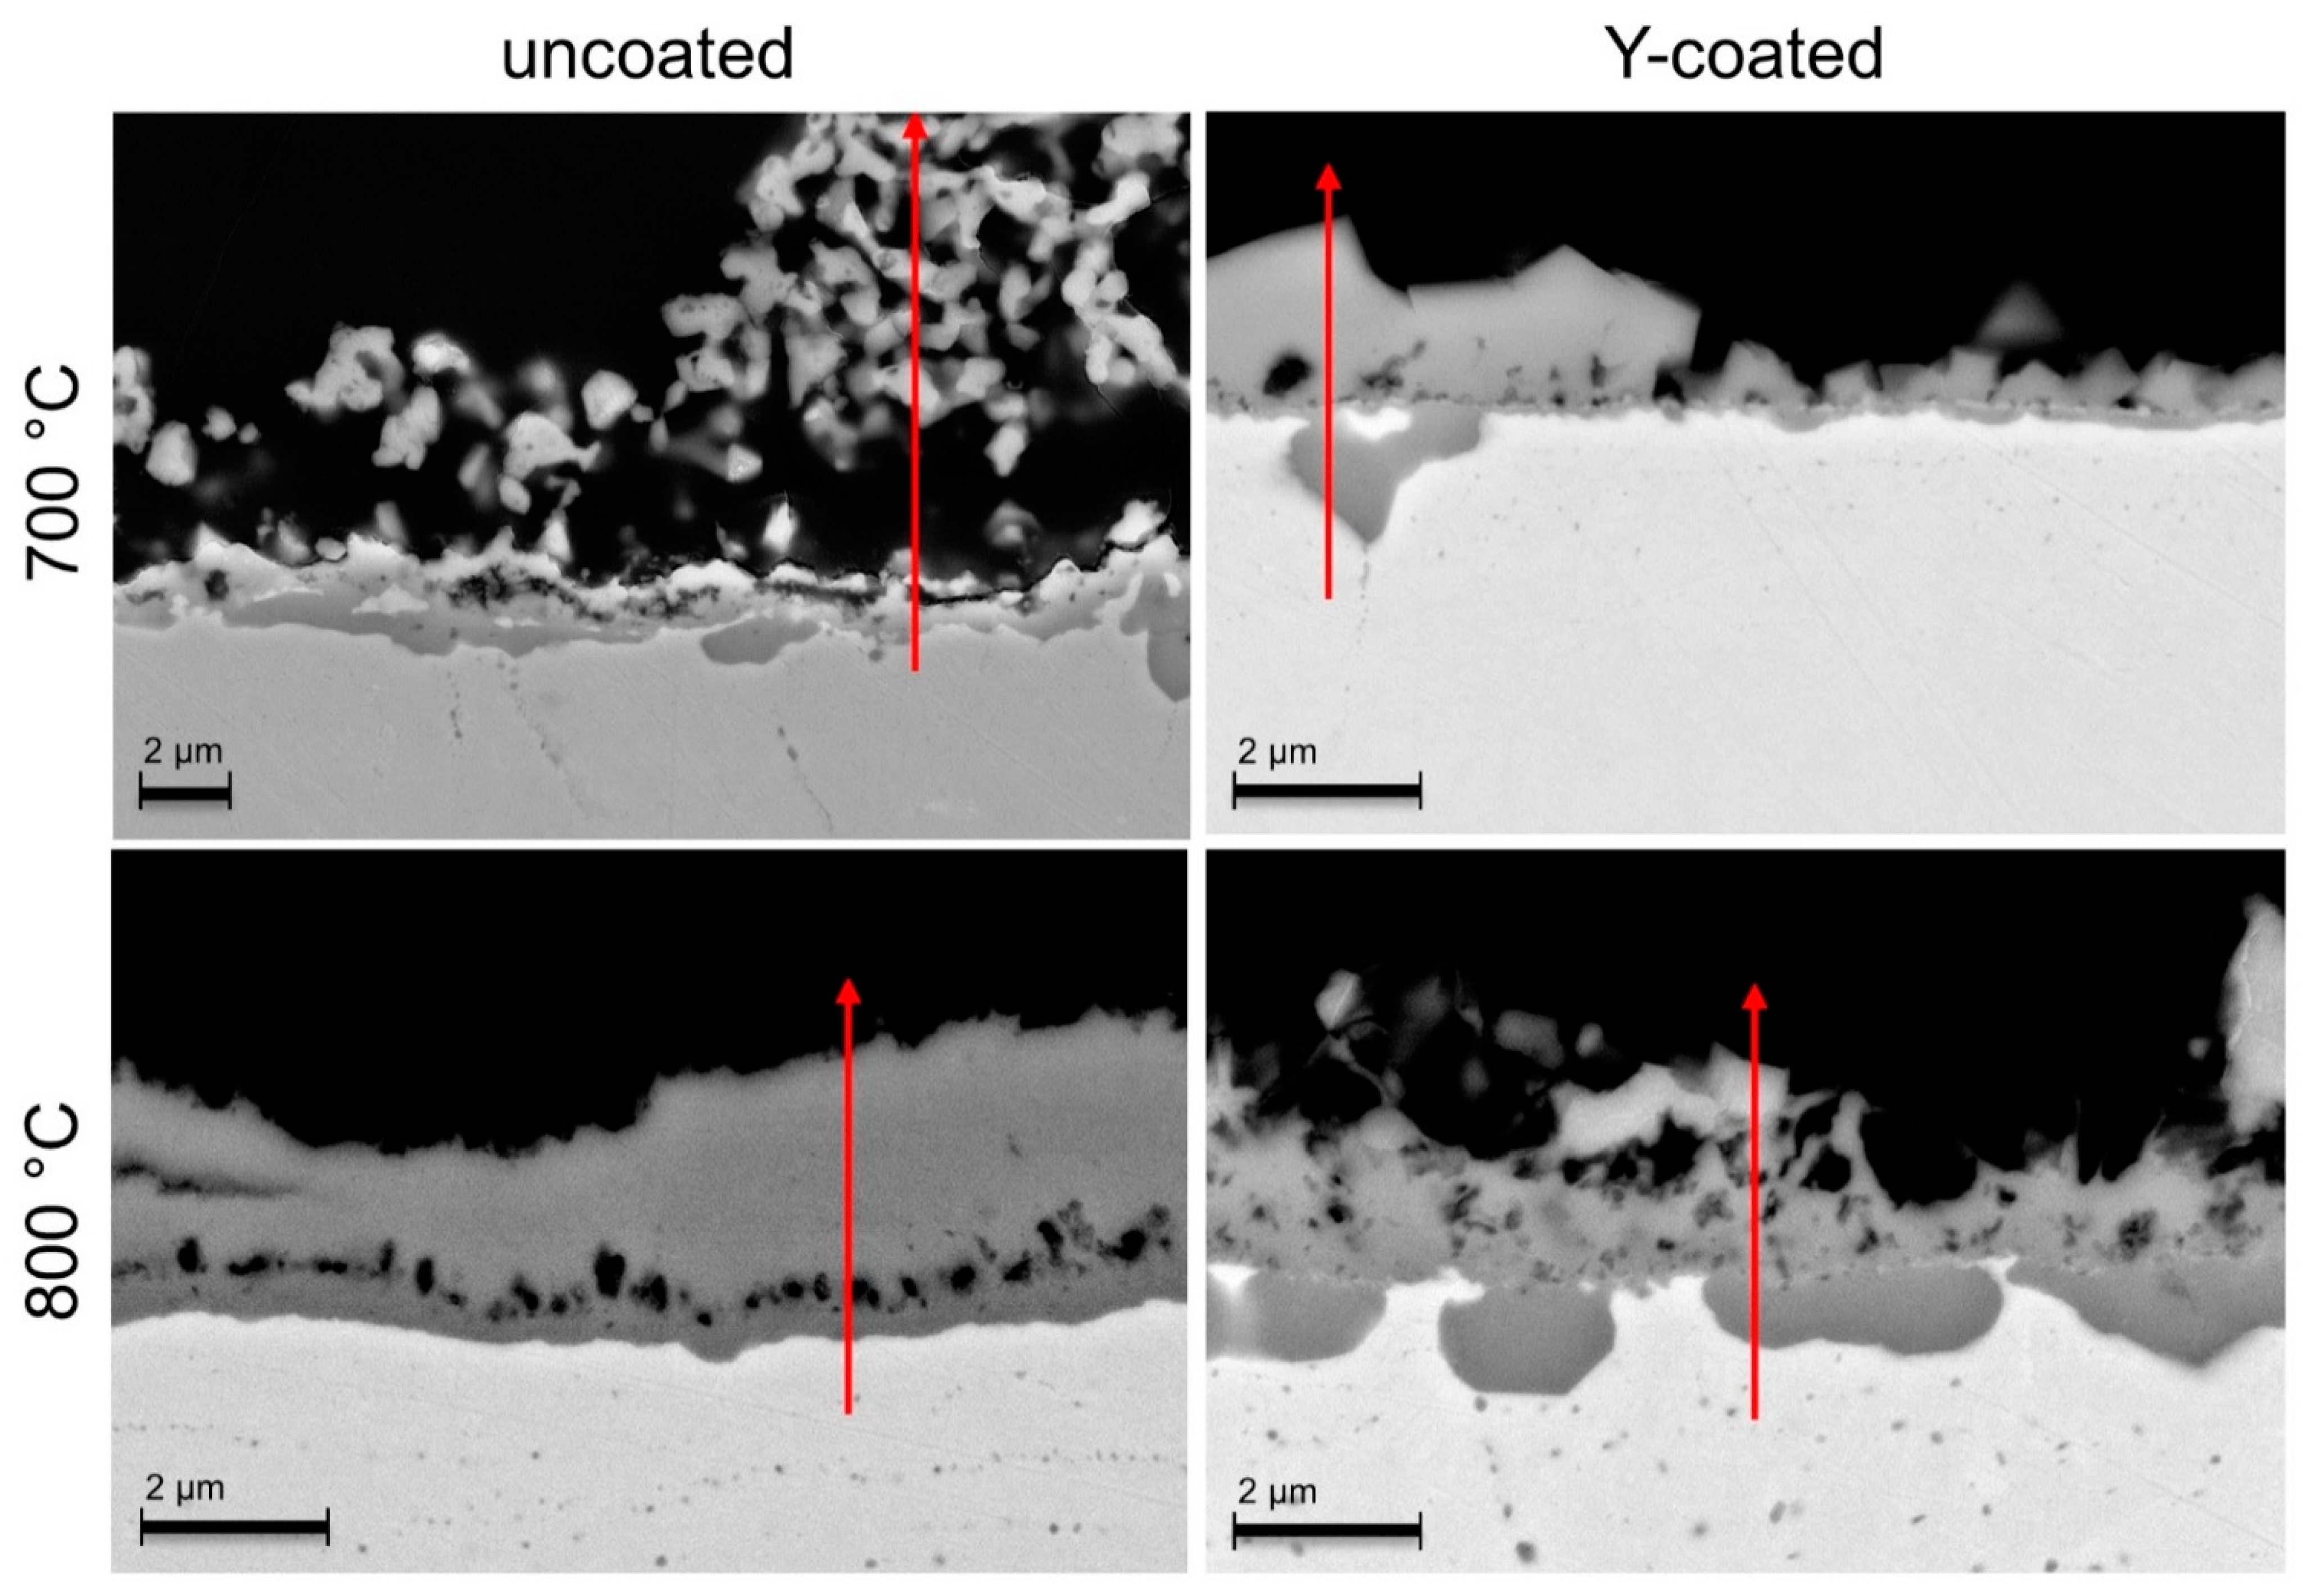
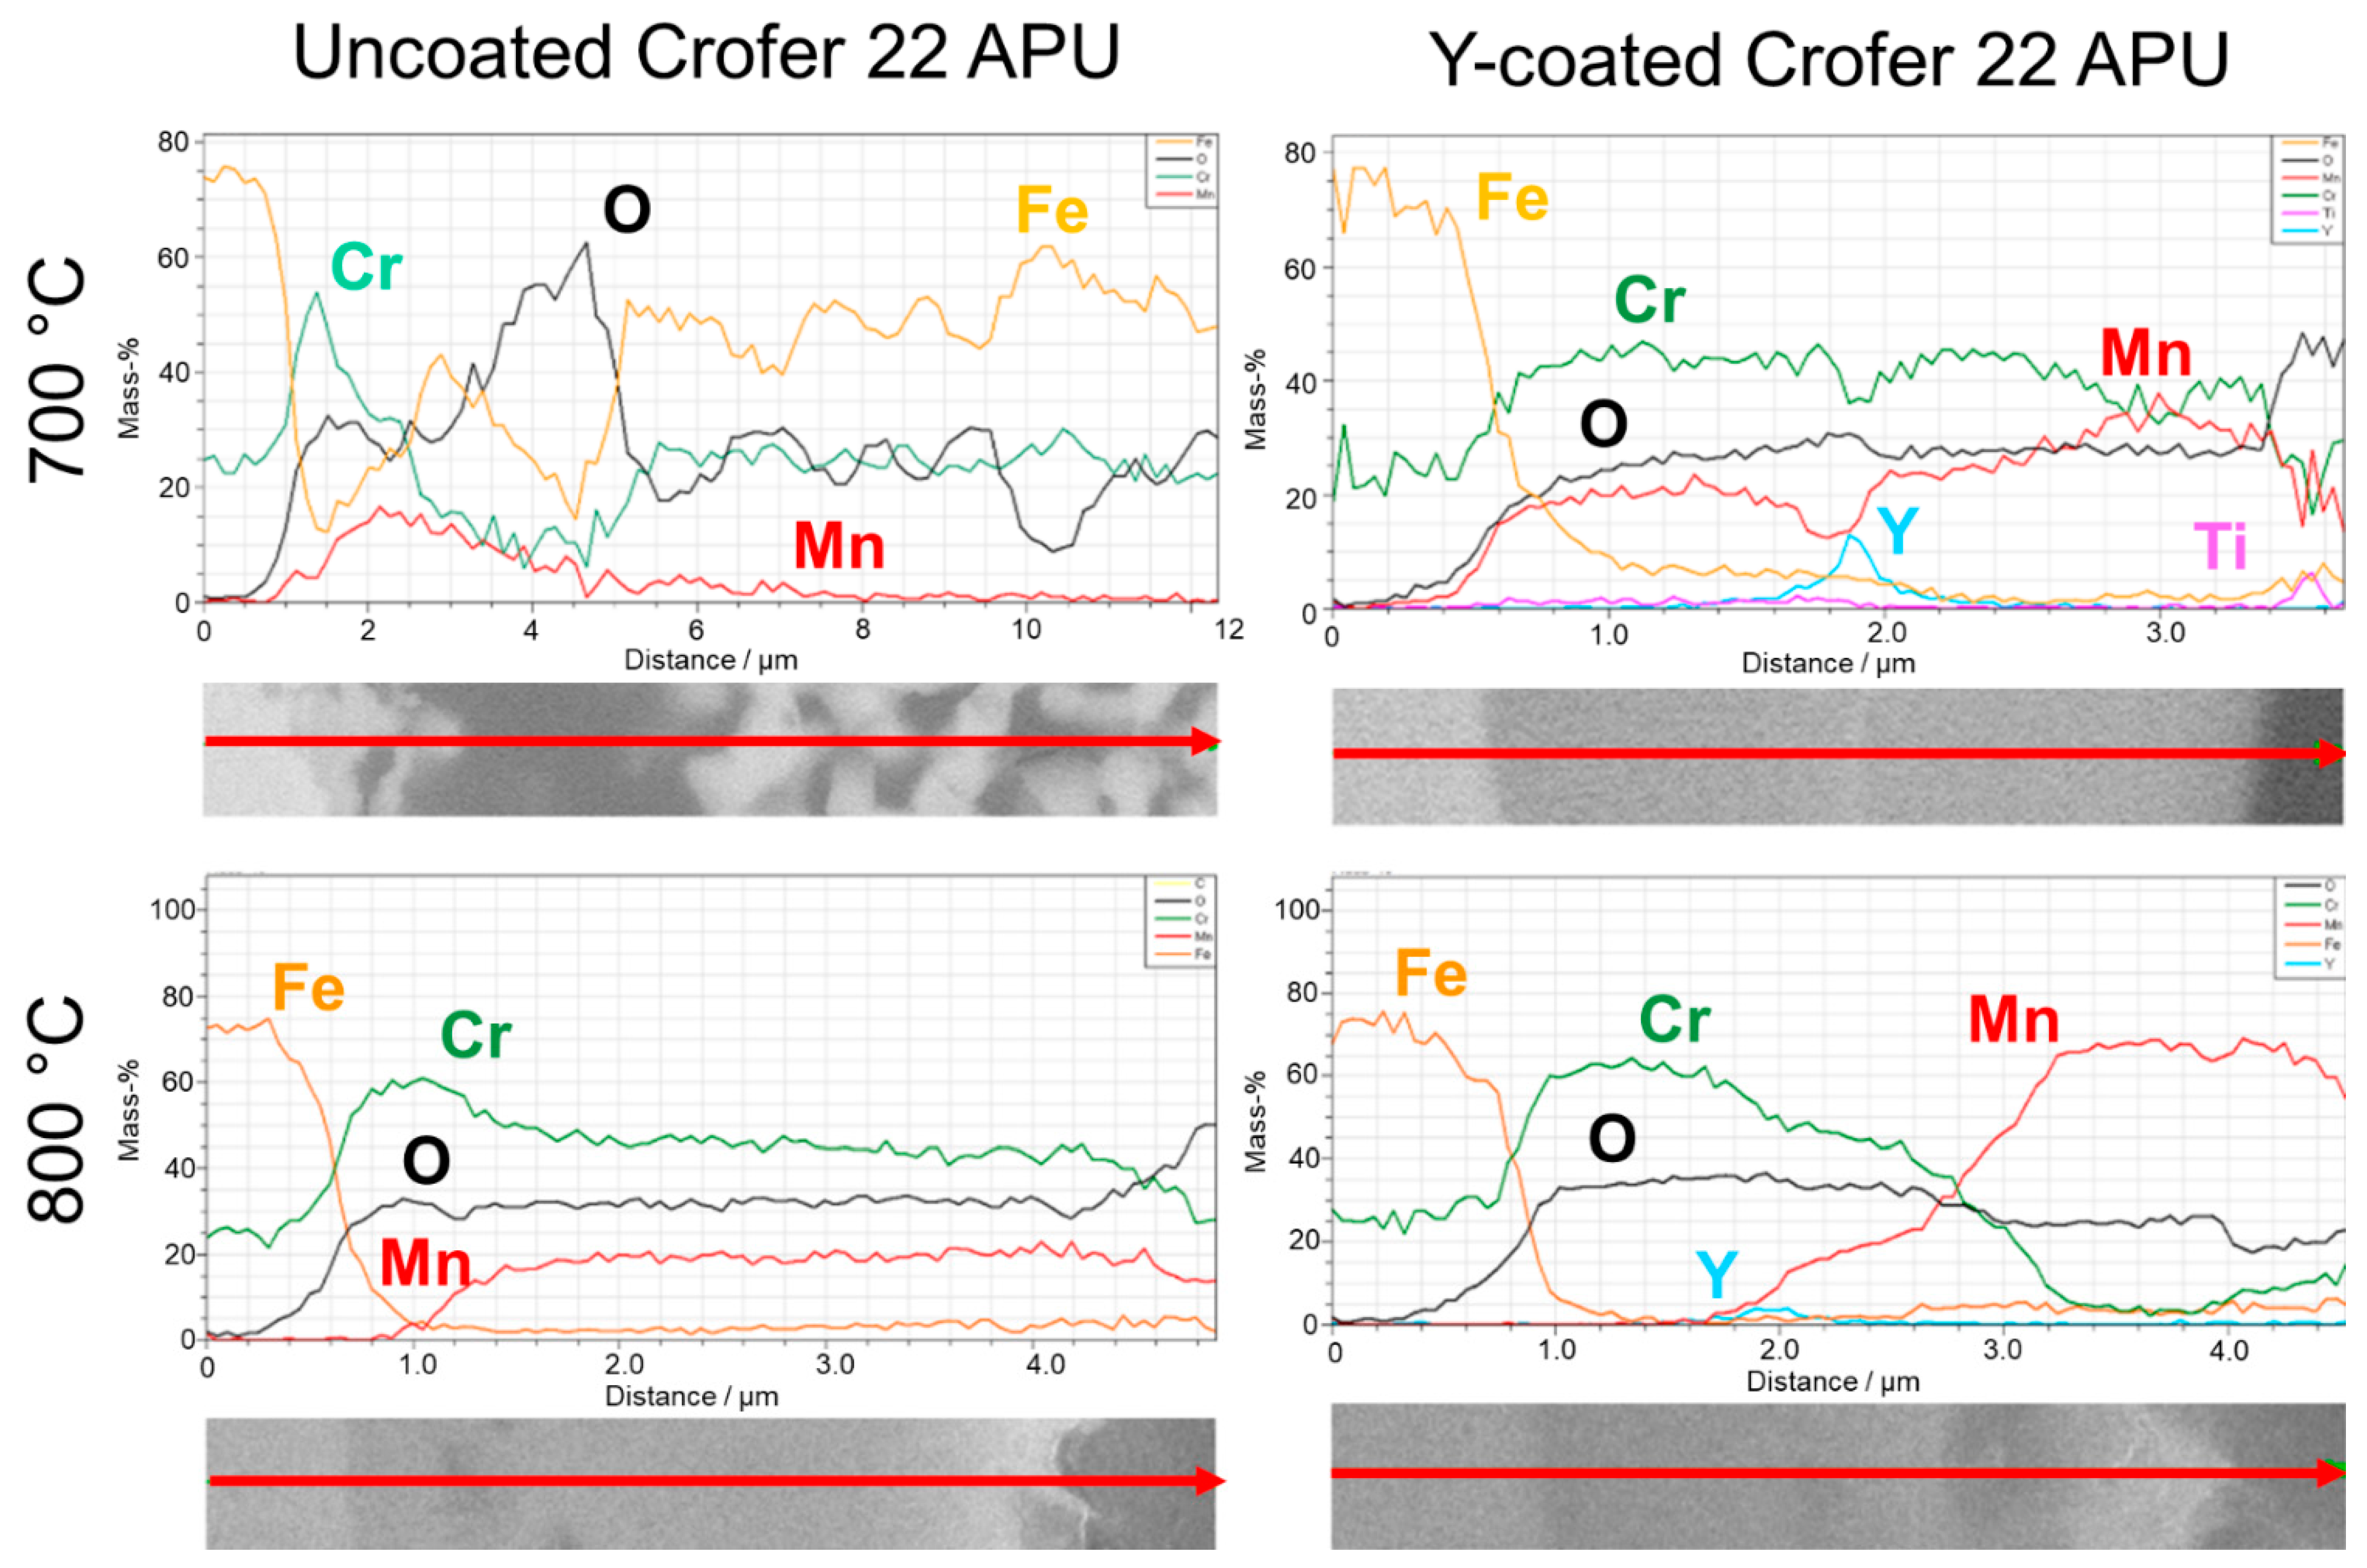
3.2.2. H2-H2O Atmosphere
4. Conclusions
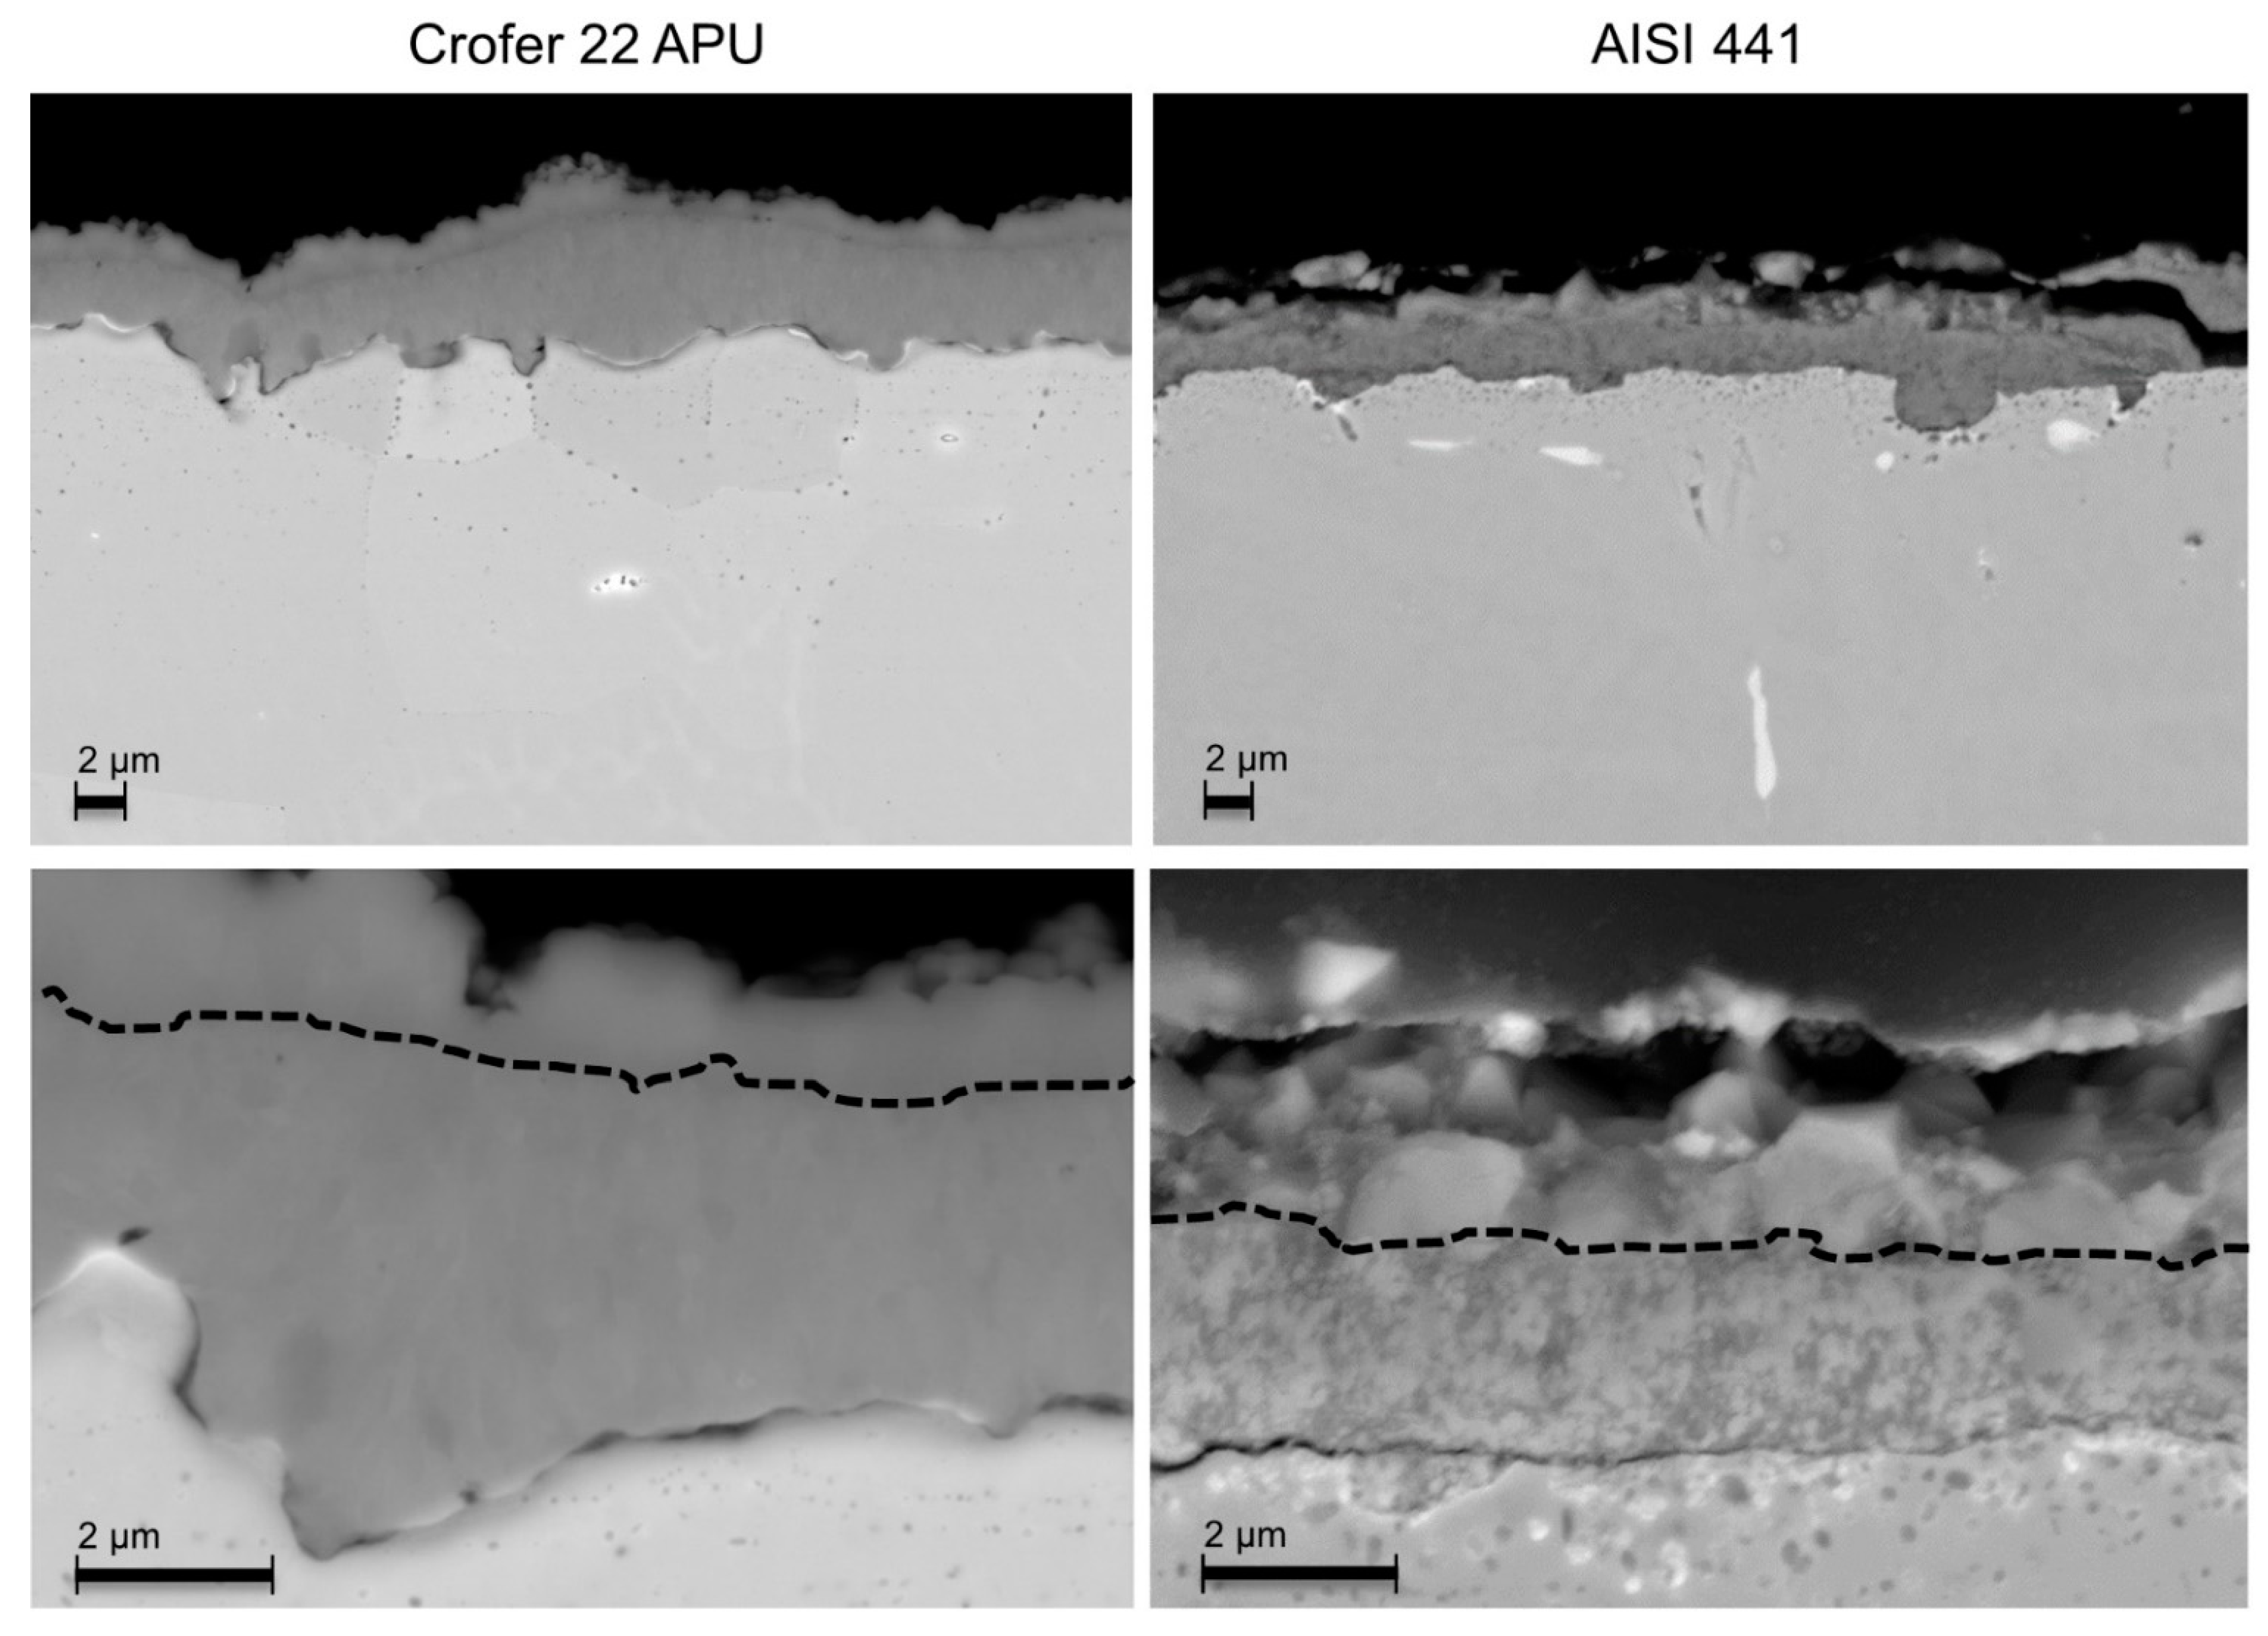
- In pure O2, the most efficient coatings for limiting the oxide scale formation and Cr outward diffusion were MCO and Ce/Co on Crofer 22 APU at both temperatures. The LFO coating suffered from severe delamination, in particular at 800 °C. With AISI 441, best results were obtained with the MCO coating at both temperatures. Partial delamination of the Ce/Co coating was observed on some of the AISI 441 samples at 800 °C. The oxide scale thickness (Cr2O3 and (Cr,Mn)3O4 layers) was lower with the MCO and Ce/Co coatings compared to the bare steels. Moreover, no or very low Cr content (<5 wt.%) was detected in the MCO and Ce/Co coatings.
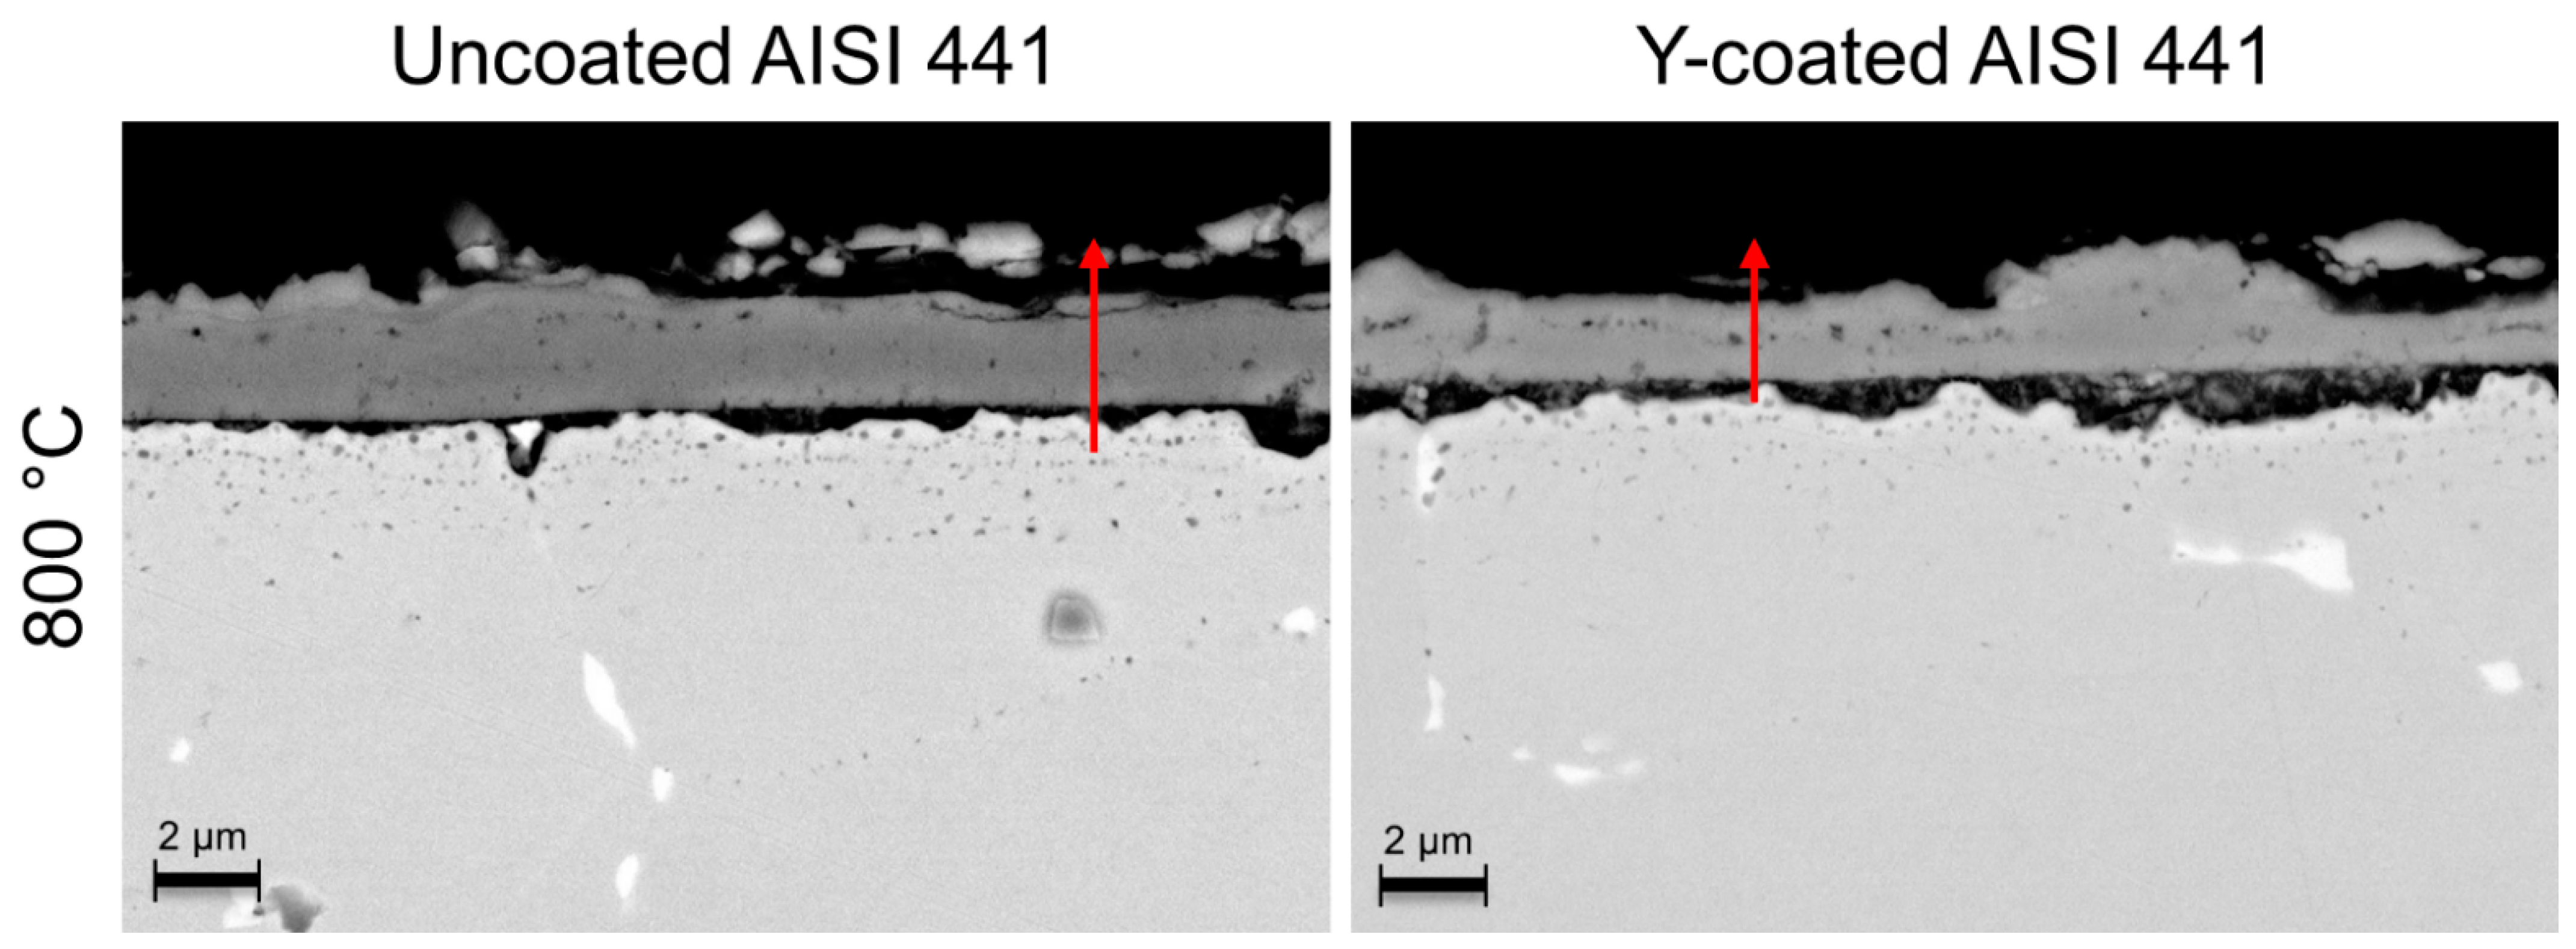
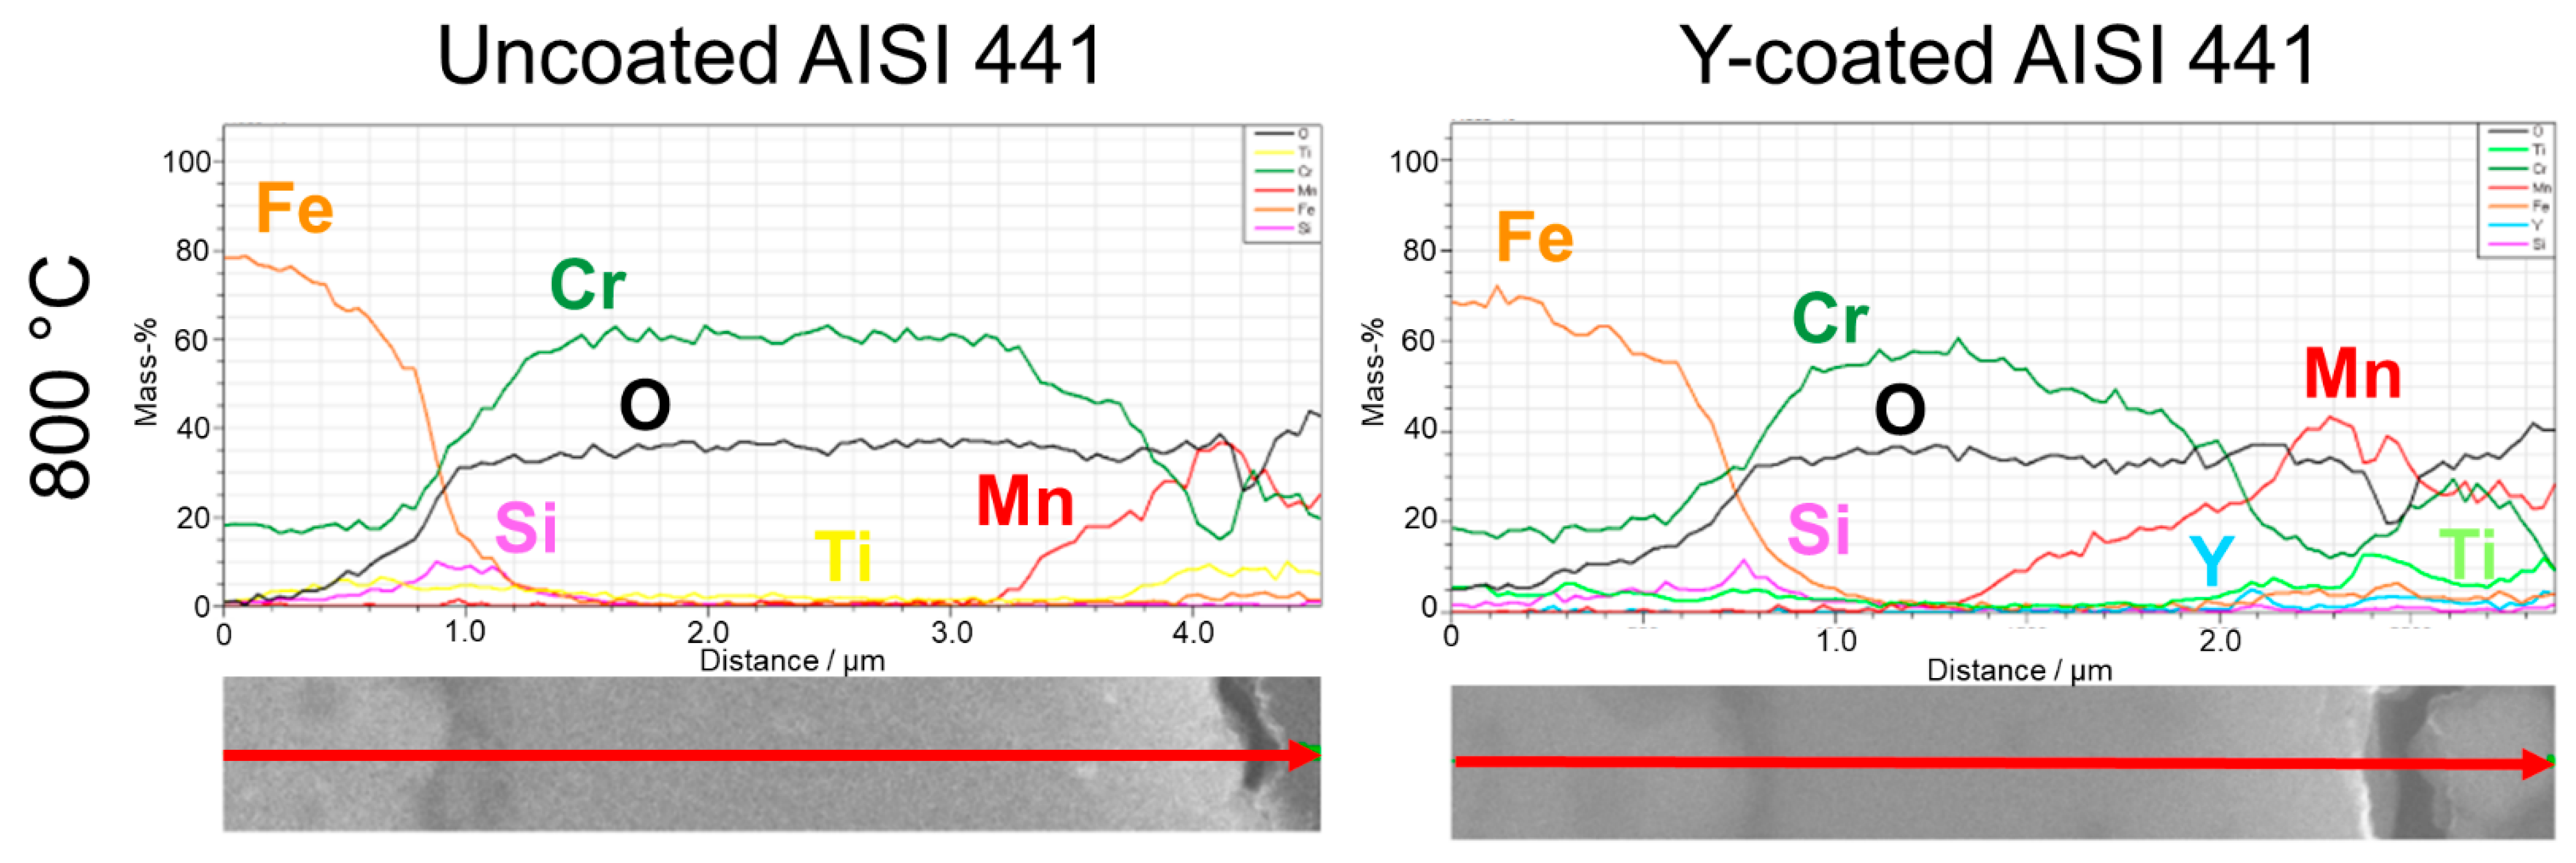
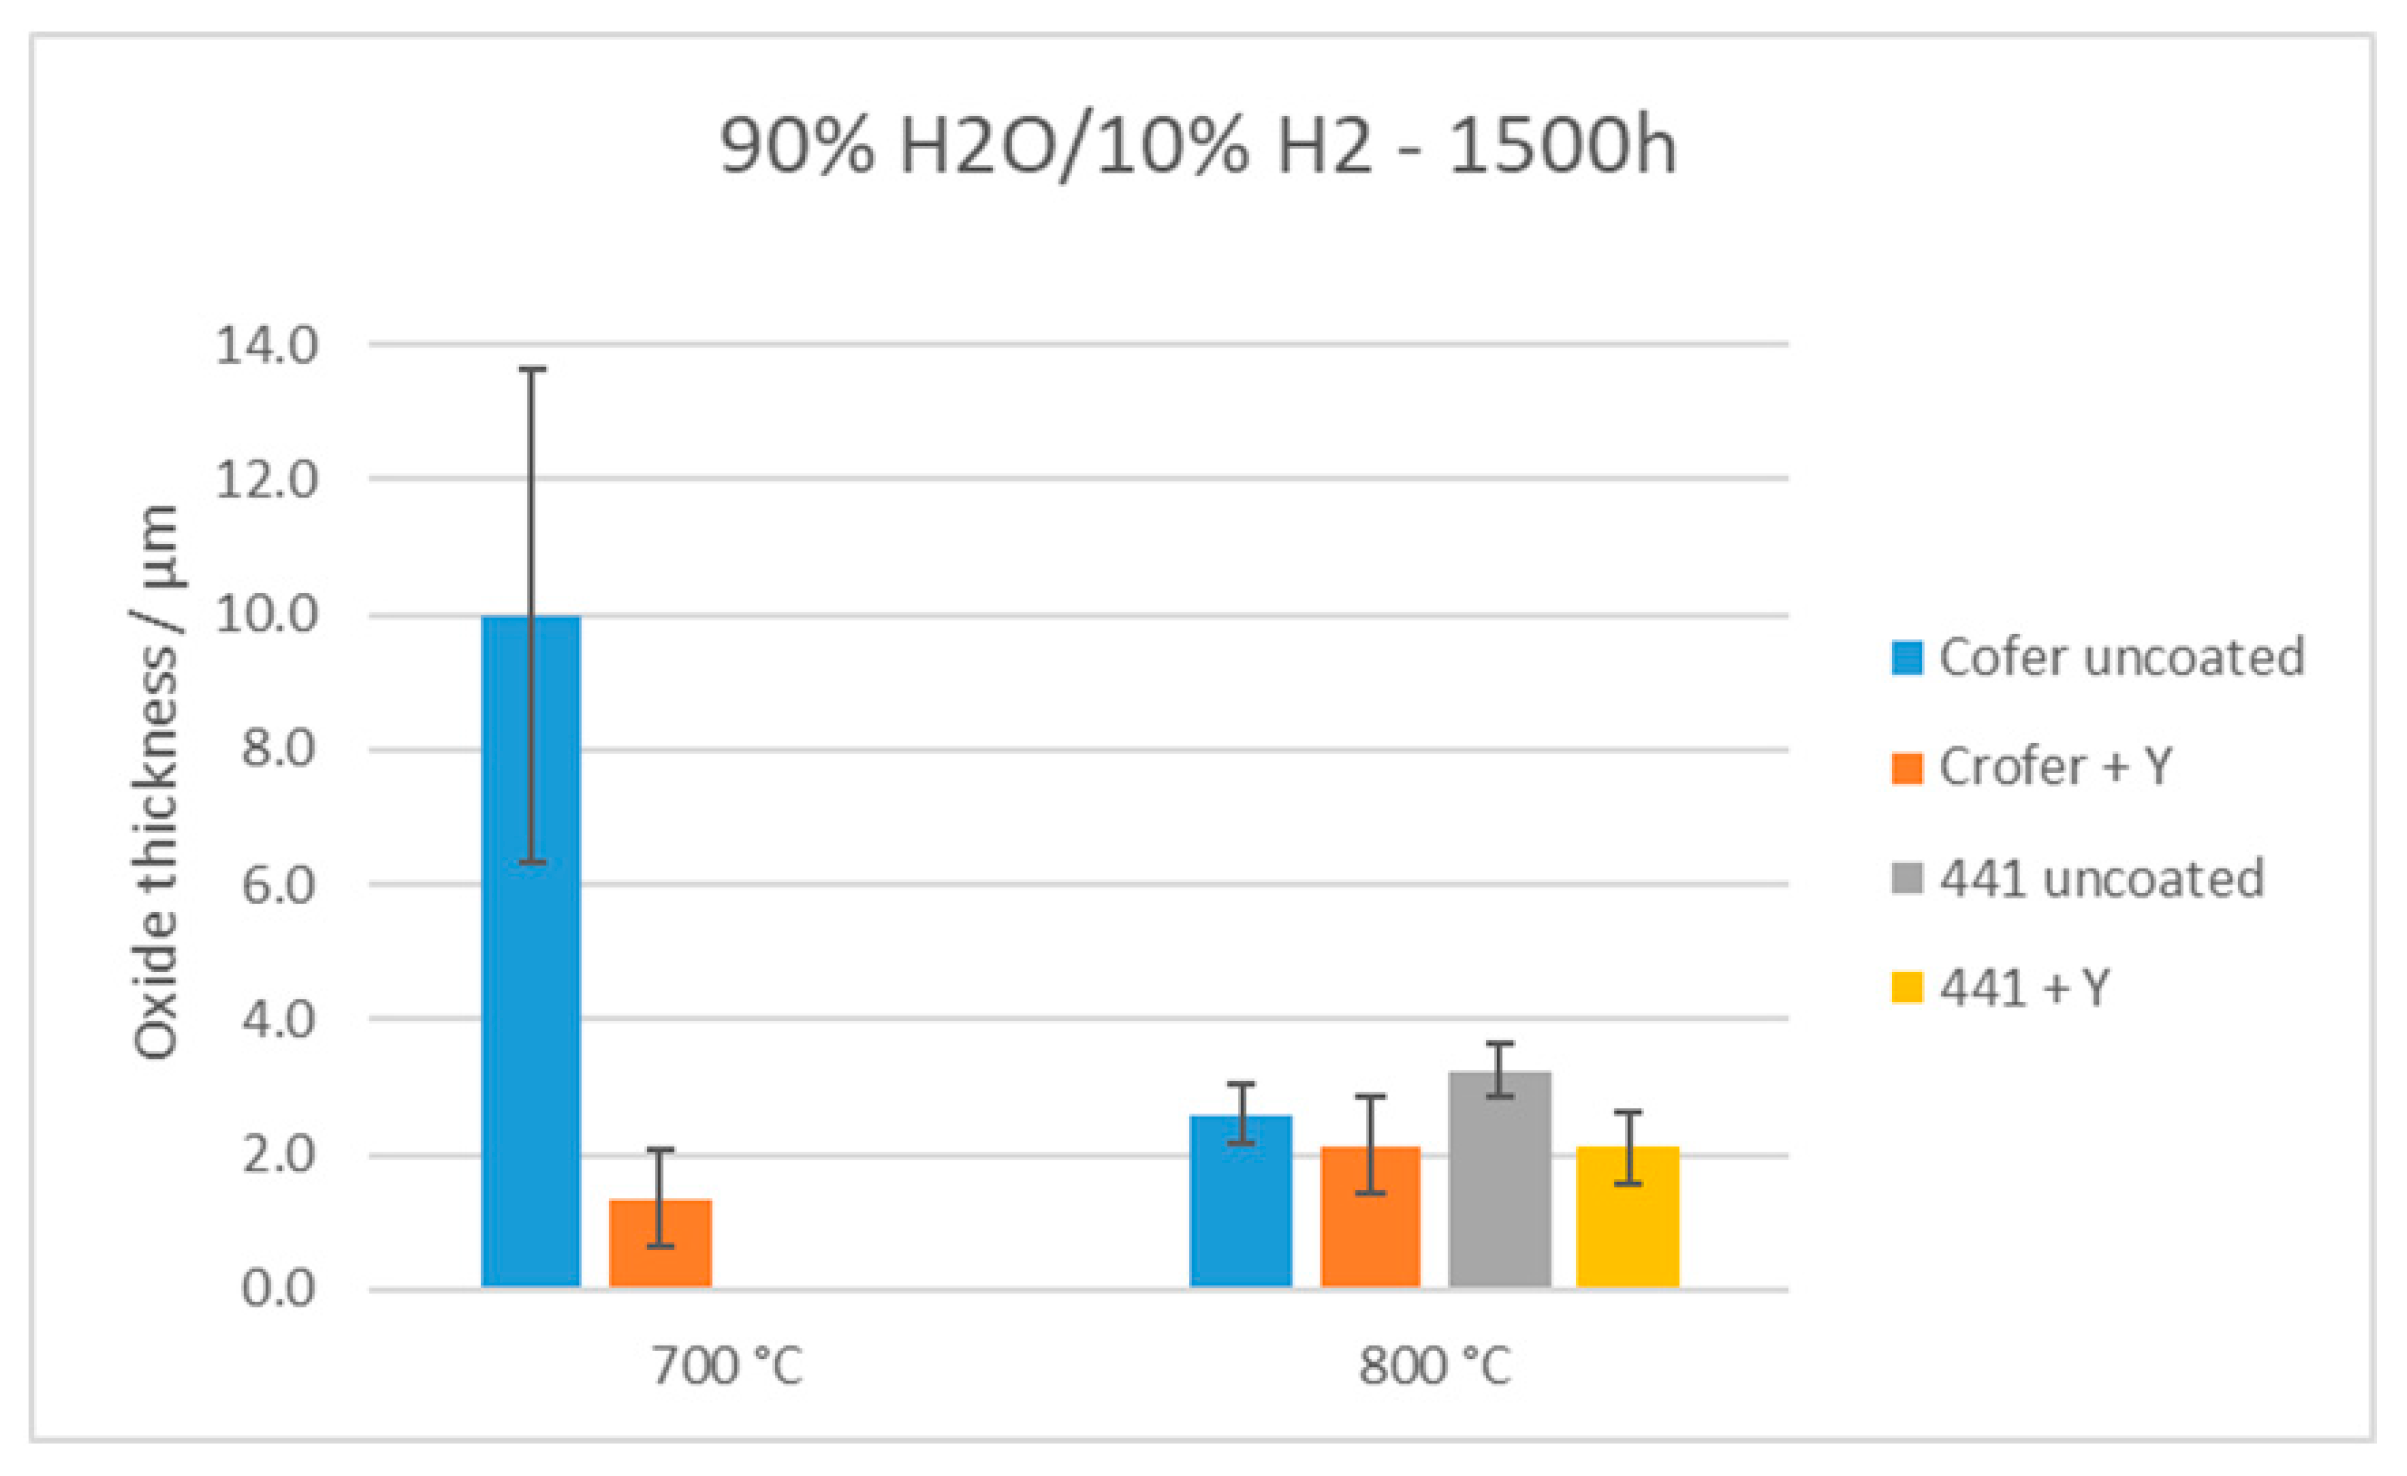
- In 90 vol.% H2O/10 vol.% H2, the Y-coating tested in this work caused a clear decrease in the oxide scale thickness compared to the bare steels at both temperatures (although AISI 441 was not tested at 700 °C). Additionally, this coating was efficient in avoiding Fe oxide formation, which was observed on the uncoated Crofer 22 APU at 700 °C.
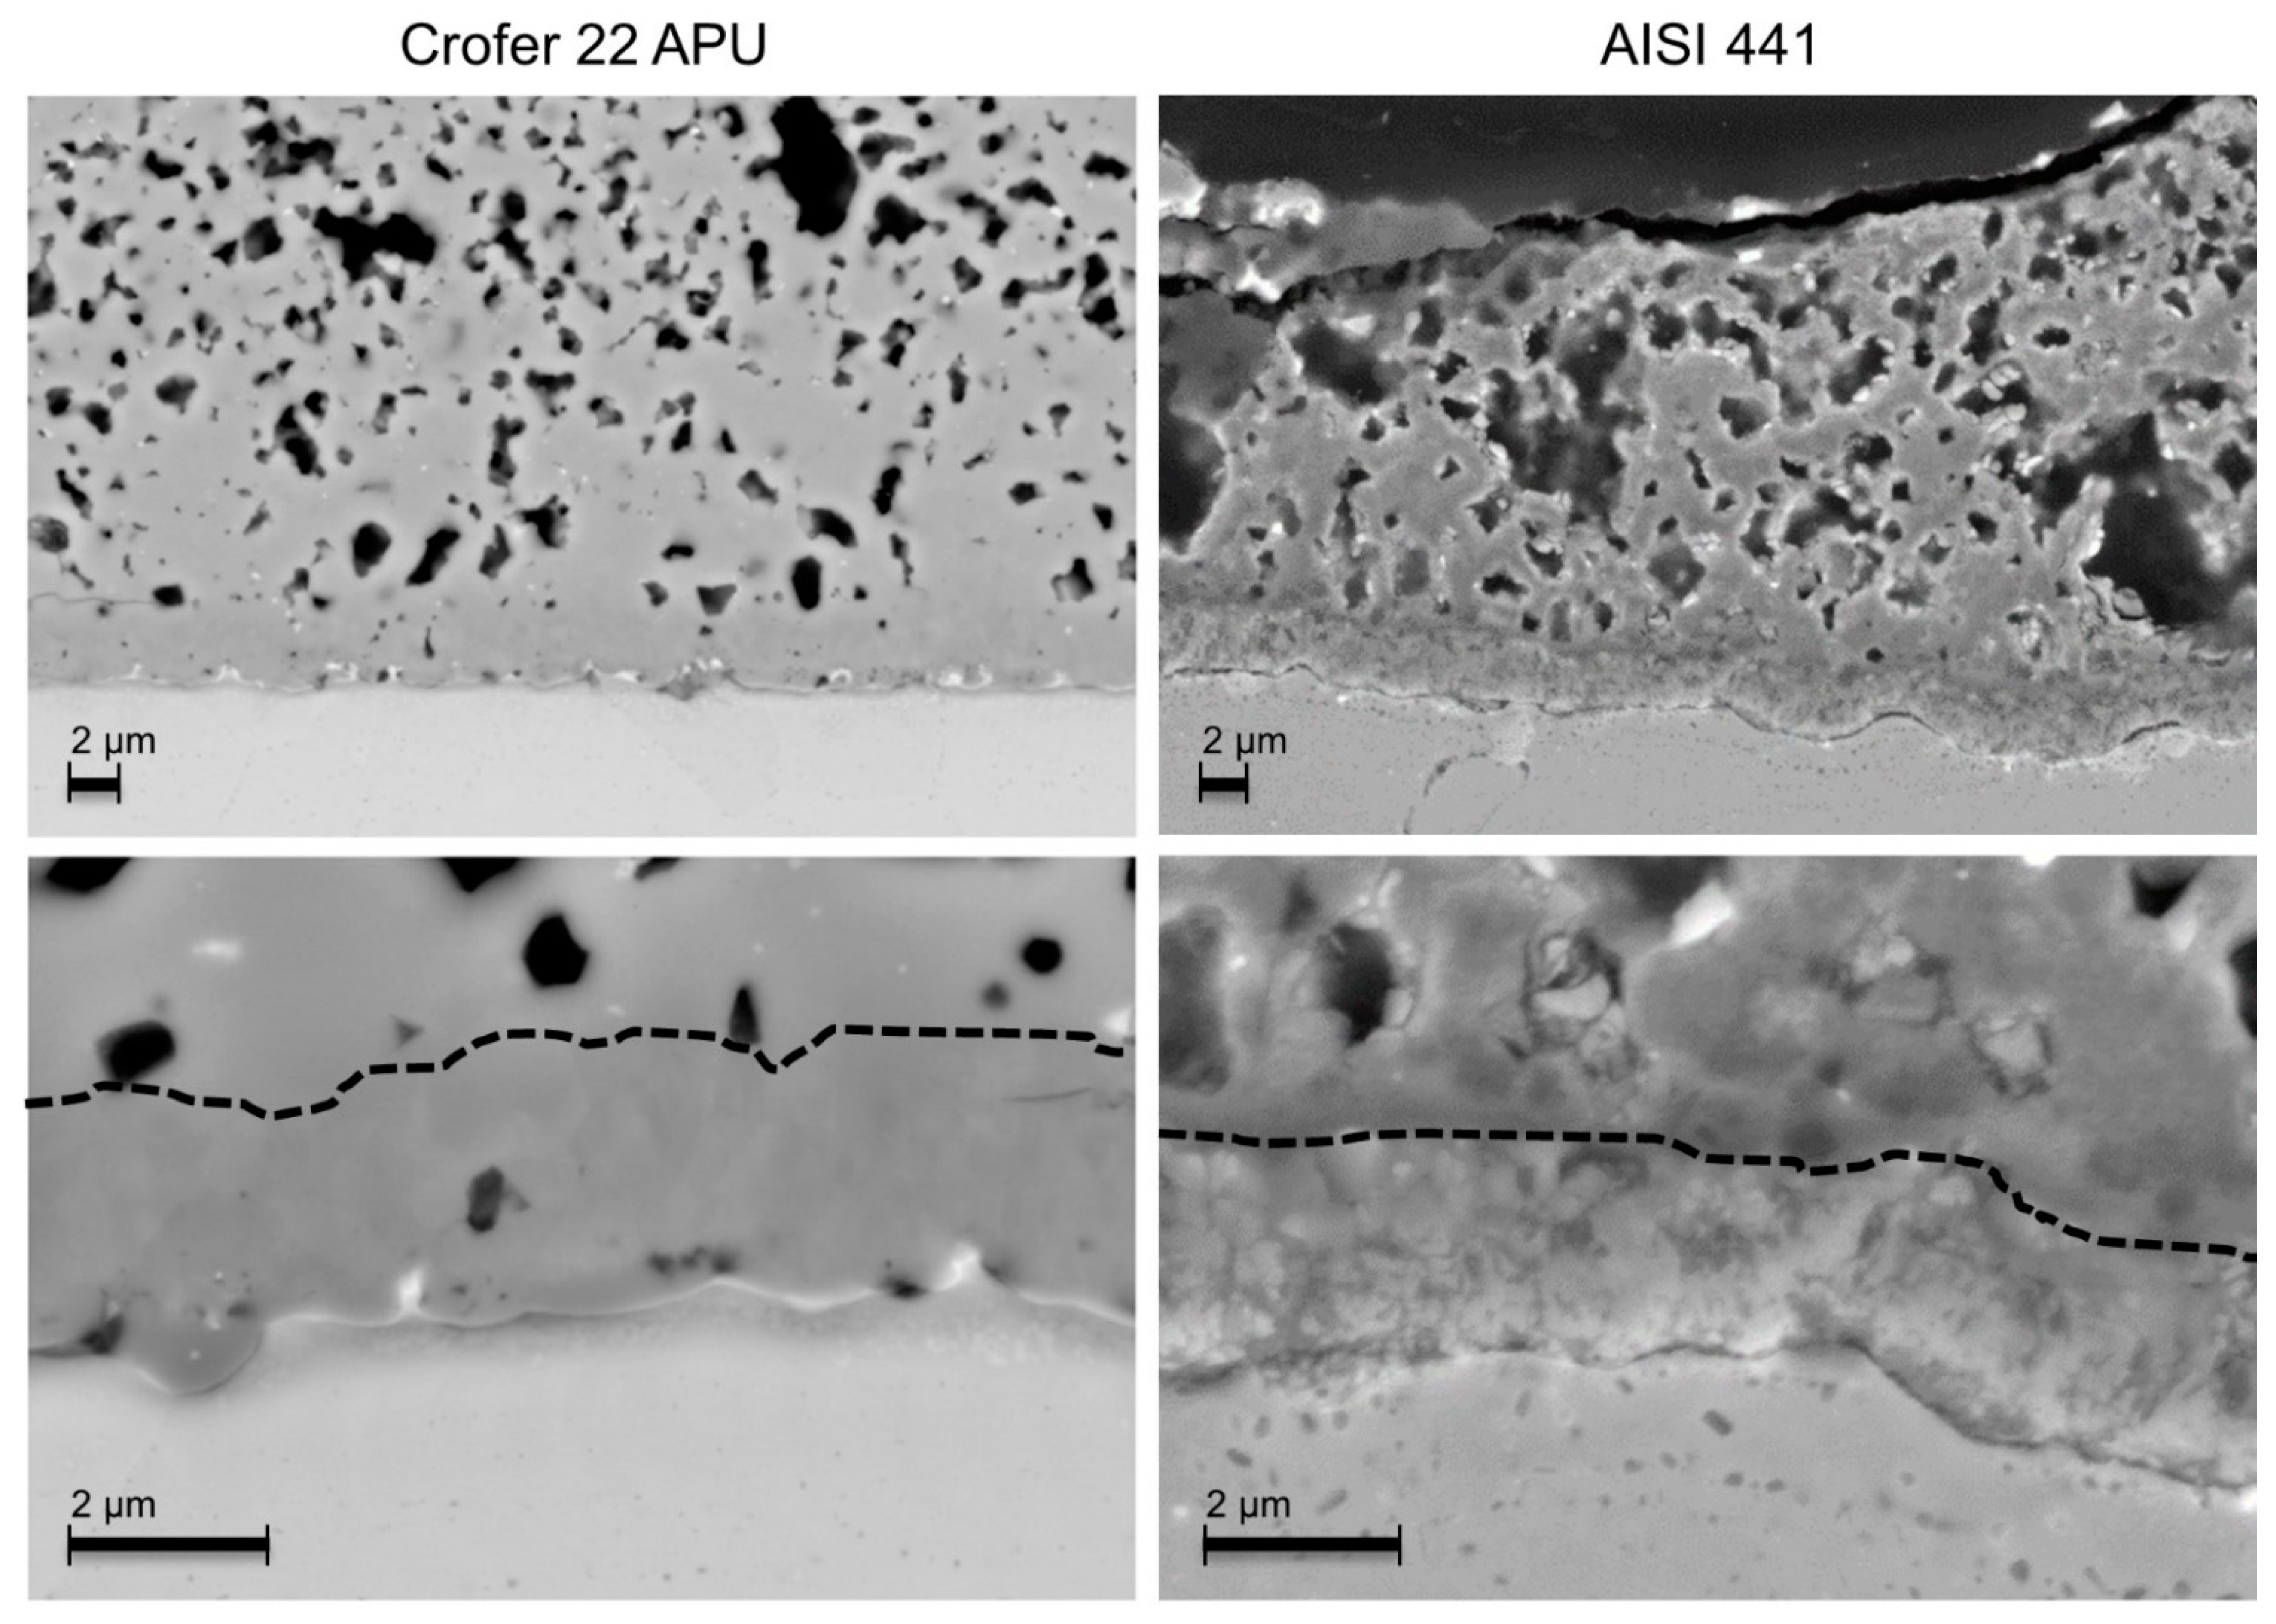
- Globally, the oxide scale adhesion seemed weaker with the AISI 441 steel and voids were observed by SEM at the oxide scale/steel interface in some places of several samples.
Author Contributions
Funding
Conflicts of Interest
References
- Lund, P.D.; Lindgren, J.; Mikkola, J.; Salpakari, J. Review of energy system flexibility measures to enable high levels of variable renewable electricity. Renew. Sustain. Energy Rev. 2015, 45, 785–807. [Google Scholar] [CrossRef] [Green Version]
- Jensen, S.H.; Graves, C.; Mogensen, M.; Wendel, C.; Braun, R.; Hughes, G.; Gao, Z.; Barnett, S.A. Large-scale electricity storage utilizing reversible solid oxide cells combined with underground storage of CO2 and CH4. Energy Environ. Sci. 2015, 8, 2471–2479. [Google Scholar] [CrossRef]
- Wang, Y.; Liu, T.; Lei, L.; Chen, F. High temperature solid oxide H2O/CO2 co-electrolysis for syngas production. Fuel Process. Technol. 2017, 161, 248–258. [Google Scholar] [CrossRef]
- Buttler, A.; Spliethoff, H. Current status of water electrolysis for energy storage, grid balancing and sector coupling via power-to-gas and power-to-liquids: A review. Renew. Sustain. Energy Rev. 2018, 82, 2440–2454. [Google Scholar] [CrossRef]
- Mahato, N.; Banerjee, A.; Gupta, A.; Omar, S.; Balani, K. Progress in material selection for solid oxide fuel cell technology: A review. Prog. Mater. Sci. 2015, 72, 141–337. [Google Scholar] [CrossRef]
- Sun, C.; Hui, R.; Roller, J. Cathode materials for solid oxide fuel cells: A review. J. Solid State Electrochem. 2010, 14, 1125–1144. [Google Scholar] [CrossRef]
- Singhal, S.; Kendall, K.; Kendall, M. High-Temperature Solid Oxide Fuel Cells: Fundamentals, Design and Applications; Elsevier: Amsterdam, The Netherlands, 2015. [Google Scholar] [CrossRef]
- Wu, J.; Liu, X. Recent development of SOFC metallic interconnect. J. Mater. Sci. Technol. 2010, 26, 293–305. [Google Scholar] [CrossRef]
- Palcut, M.; Mikkelsen, L.; Neufeld, K.; Chen, M.; Knibbe, R.; Hendriksen, P.V. Corrosion stability of ferritic stainless steels for solid oxide electrolyser cell interconnects. Corros. Sci. 2010, 52, 3309–3320. [Google Scholar] [CrossRef]
- Alnegren, P.; Sattari, M.; Froitzheim, J.; Svensson, J.E. Degradation of ferritic stainless steels under conditions used for solid oxide fuel cells and electrolyzers at varying oxygen pressures. Corros. Sci. 2016, 110, 200–212. [Google Scholar] [CrossRef]
- Young, D.J.; Zurek, J.; Singheiser, L.; Quadakkers, W.J. Temperature dependence of oxide scale formation on high-Cr ferritic steels in Ar-H2-H2O. Corros. Sci. 2011, 53, 2131–2141. [Google Scholar] [CrossRef]
- Shaigan, N.; Qu, W.; Ivey, D.G.; Chen, W. A review of recent progress in coatings, surface modifications and alloy developments for solid oxide fuel cell ferritic stainless steel interconnects. J. Power Sources 2010, 195, 1529–1542. [Google Scholar] [CrossRef]
- Mah, J.C.W.; Muchtar, A.; Somalu, M.R.; Ghazali, M.J. Metallic interconnects for solid oxide fuel cell: A review on protective coating and deposition techniques. Int. J. Hydrogen Energy 2017, 42, 9219–9229. [Google Scholar] [CrossRef]
- Yang, Z.; Xia, G.G.; Maupin, G.D.; Stevenson, J.W. Conductive protection layers on oxidation resistant alloys for SOFC interconnect applications. Surf. Coat. Technol. 2006, 201, 4476–4483. [Google Scholar] [CrossRef]
- Froitzheim, J.; Canovic, S.; Nikumaa, M.; Sachitanand, R.; Johansson, L.G.; Svensson, J.E. Long term study of Cr evaporation and high temperature corrosion behaviour of Co coated ferritic steel for solid oxide fuel cell interconnects. J. Power Sources 2012, 220, 217–227. [Google Scholar] [CrossRef]
- Lacey, R.; Pramanick, A.; Lee, J.C.; Jung, J.-I.; Jiang, B.; Edwards, D.D.; Naum, R.; Misture, S.T. Evaluation of Co and perovskite Cr-blocking thin films on SOFC interconnects. Solid State Ion. 2010, 181, 1294–1302. [Google Scholar] [CrossRef]
- Mardare, C.C.; Asteman, H.; Spiegel, M.; Savan, A.; Ludwig, A. Investigation of thermally oxidised Mn-Co thin films for application in SOFC metallic interconnects. Appl. Surf. Sci. 2008, 255, 1850–1859. [Google Scholar] [CrossRef]
- Uehara, T.; Yasuda, N.; Okamoto, M.; Baba, Y. Effect of Mn-Co spinel coating for Fe-Cr ferritic alloys ZMG232L and 232J3 for solid oxide fuel cell interconnects on oxidation behavior and Cr-evaporation. J. Power Sources 2011, 196, 7251–7256. [Google Scholar] [CrossRef]
- Ajitdoss, L.C.; Smeacetto, F.; Bindi, M.; Beretta, D.; Salvo, M.; Ferraris, M. Mn1.5Co1.5O4 protective coating on Crofer22APU produced by thermal co-evaporation for SOFCs. Mater. Lett. 2013, 95, 82–85. [Google Scholar] [CrossRef]
- Gavrilov, N.V.; Ivanov, V.V.; Kamenetskikh, A.S.; Nikonov, A.V. Investigations of Mn-Co-O and Mn-Co-Y-O coatings deposited by the magnetron sputtering on ferritic stainless steels. Surf. Coat. Technol. 2011, 206, 1252–1258. [Google Scholar] [CrossRef]
- Balland, A.; Gannon, P.; Deibert, M.; Chevalier, S.; Caboche, G.; Fontana, S. Investigation of La2O3 and/or (Co,Mn)3O4 deposits on Crofer22APU for the SOFC interconnect application. Surf. Coat. Technol. 2009, 203, 3291–3296. [Google Scholar] [CrossRef]
- Yang, Z.; Xia, G.; Nie, Z.; Templeton, J.; Stevenson, J.W. Ce-modified (Mn,Co)3O4 spinel coatings on ferritic stainless steels for SOFC interconnect applications. Electrochem. Solid-State Lett. 2008, 11, B140–B143. [Google Scholar] [CrossRef]
- Hoyt, K.O.; Gannon, P.E.; White, P.; Tortop, R.; Ellingwood, B.J.; Khoshuei, H. Oxidation behavior of (Co,Mn)3O4 coatings on preoxidized stainless steel for solid oxide fuel cell interconnects. Int. J. Hydrogen Energy 2012, 37, 518–529. [Google Scholar] [CrossRef]
- Tallgren, J.; Bianco, M.; Mikkola, J.; Himanen, O.; Kiviaho, J.; van Herle, J. Comparison of different manganese-cobalt-iron spinel protective coatings for SOFC interconnects. In Proceedings of the 12th European SOFC & SOE Forum, Lucerne, Switzerland, 5–8 July 2016; p. B0619. [Google Scholar]
- Tallgren, J.; Bianco, M.; Himanen, O.; Thomann, O.; Kiviaho, J.; van Herle, J. Evaluation of protective coatings for SOFC interconnects. ECS Trans. 2015, 68, 1597–1608. [Google Scholar] [CrossRef]
- Kruk, A.; Stygar, M.; Brylewski, T. Mn-Co spinel protective-conductive coating on AL453 ferritic stainless steel for IT-SOFC interconnect applications. J. Solid State Electrochem. 2013, 17, 993–1003. [Google Scholar] [CrossRef] [Green Version]
- Thomann, O.; Pihlatie, M.; Rautanen, M.; Himanen, O.; Lagerbom, J.; Mäkinen, M.; Varis, T.; Suhonen, T.; Kiviaho, J. Development and application of HVOF sprayed spinel protective coating for SOFC interconnects. J. Therm. Spray Technol. 2013, 22, 631–639. [Google Scholar] [CrossRef]
- Talic, B.; Molin, S.; Wiik, K.; Hendriksen, P.V.; Lein, H.L. Comparison of iron and copper doped manganese cobalt spinel oxides as protective coatings for solid oxide fuel cell interconnects. J. Power Sources 2017, 372, 145–156. [Google Scholar] [CrossRef] [Green Version]
- Talic, B.; Falk-Windisch, H.; Venkatachalam, V.; Hendriksen, P.V.; Wiik, K.; Lein, H.L. Effect of coating density on oxidation resistance and Cr vaporization from solid oxide fuel cell interconnects. J. Power Sources 2017, 354, 57–67. [Google Scholar] [CrossRef] [Green Version]
- Falk-Windisch, H.; Claquesin, J.; Sattari, M.; Svensson, J.E.; Froitzheim, J. Co- and Ce/Co-coated ferritic stainless steel as interconnect material for intermediate temperature solid oxide fuel cells. J. Power Sources 2017, 343, 1–10. [Google Scholar] [CrossRef]
- Falk-Windisch, H.; Sattari, M.; Svensson, J.E.; Froitzheim, J. Chromium vaporization from mechanically deformed pre-coated interconnects in solid oxide fuel cells. J. Power Sources 2015, 297, 217–223. [Google Scholar] [CrossRef] [Green Version]
- Falk-Windisch, H.; Svensson, J.E.; Froitzheim, J. The effect of temperature on chromium vaporization and oxide scale growth on interconnect steels for solid oxide fuel cells. J. Power Sources 2015, 287, 25–35. [Google Scholar] [CrossRef] [Green Version]
- Grolig, J.G.; Froitzheim, J.; Svensson, J.-E. Effect of cerium on the electrical properties of a cobalt conversion coating for solid oxide fuel cell interconnects—A study using impedance spectroscopy. Electrochim. Acta 2015, 184, 301–307. [Google Scholar] [CrossRef] [Green Version]
- Grolig, J.G.; Froitzheim, J.; Svensson, J.E. Coated stainless steel 441 as interconnect material for solid oxide fuel cells: Oxidation performance and chromium evaporation. J. Power Sources 2014, 248, 1007–1013. [Google Scholar] [CrossRef] [Green Version]
- Berger, R.; Lundberg, M.W.; Westlinder, J. Self-healing of precoated AISI 441 for solid oxide fuel cell interconnects at intermediate temperatures. ECS Trans. 2017, 78, 1599–1605. [Google Scholar] [CrossRef]
- Molin, S.; Chen, M.; Hendriksen, P.V. Oxidation study of coated Crofer 22 APU steel in dry oxygen. J. Power Sources 2014, 251, 488–495. [Google Scholar] [CrossRef]
- Frangini, S.; della Seta, L.; Masi, A.; Paoletti, C.; Bianco, M. Perovskite conversion coatings as novel and simple approach for improving functional performance of ferritic stainless steel SOFC interconnects. Fuel Cells 2020, 20, 316–322. [Google Scholar] [CrossRef]
- Frangini, S.; della Seta, L.; Paoletti, C. Effect of additive particle size on the CuO-accelerated formation of LaFeO3 perovskite conversion coatings in molten carbonate baths. Surf. Coat. Technol. 2019, 374, 513–520. [Google Scholar] [CrossRef]
- Frangini, S.; Masi, A.; della Seta, L.; Bianco, M.; van Herle, J. Composite Cu-LaFeO3 conversion coatings on a 18Cr ferritic stainless steel for IT-SOFC interconnects: Effect of long-term air exposure at 700 °C on Cr diffusion barrier and electrical properties. J. Electrochem. Soc. 2018, 165, F97–F104. [Google Scholar] [CrossRef]
- Sachitanand, R.; Sattari, M.; Svensson, J.E.; Froitzheim, J. The oxidation of coated SOFC interconnects in fuel side environments. Fuel Cells 2016, 16, 32–38. [Google Scholar] [CrossRef]
- Ardigo, M.R.; Popa, I.; Combemale, L.; Chevalier, S.; Herbst, F.; Girardon, P. Dual atmosphere study of the K41X stainless steel for interconnect application in high temperature water vapour electrolysis. Int. J. Hydrogen Energy 2014, 40, 5305–5312. [Google Scholar] [CrossRef]
- Nakamura, T.; Petzow, G.; Gauckler, L.J. Stability of the perovskite phase LaBO3 (B = V, Cr, Mn, Fe, Co, Ni) in reducing atmosphere I. Experimental results. Mater. Res. Bull. 1979, 14, 649–659. [Google Scholar] [CrossRef]
- Molin, S.; Persson, Å.H.; Skafte, T.; Smitshuysen, A.; Jensen, S.; Andersen, K.; Xu, H.; Chen, M.; Hendriksen, P. Effective yttrium based coating for steel interconnects of solid oxide cells: Corrosion evaluation in steam-hydrogen atmosphere. J. Power Sources 2019, 440, 226814. [Google Scholar] [CrossRef]
- VDM Metals. VDM® Crofer 22 APU. 2010. Available online: www.vdm-metals.com/fileadmin/user_upload/Downloads/Data_Sheets/Datenblatt_VDM_Crofer_22_APU.pdf (accessed on 10 February 2020).
- Thyssenkrupp. Thyssenkrupp Stainless Steel 441 1.4509. 2001. Available online: www.thyssenkrupp-materials.co.uk/media/material_data_sheets/stainless_steel_1/stainless_steel_1-4509_441.pdf (accessed on 10 February 2020).
- Bobruk, M.; Molin, S.; Chen, M.; Brylewski, T.; Hendriksen, P.V. Sintering of MnCo2O4coatings prepared by electrophoretic deposition. Mater. Lett. 2018, 213, 394–398. [Google Scholar] [CrossRef] [Green Version]
- Canovic, S.; Froitzheim, J.; Sachitanand, R.; Nikumaa, M.; Halvarsson, M.; Johansson, L.-G.; Svensson, J.-E. Oxidation of Co- and Ce-nanocoated FeCr steels: A microstructural investigation. Surf. Coat. Technol. 2013, 215, 62–74. [Google Scholar] [CrossRef]
- Chen, Z.; Wang, L.; Li, F.; Chou, K.C.; Sun, Z. The effects of temperature and oxygen pressure on the initial oxidation of stainless steel 441. Int. J. Hydrogen Energy 2014, 39, 10303–10312. [Google Scholar] [CrossRef]
- Lorenzo, M.D.J.; Kolarik, V.; Kuchenreuther-Hummel, V.; Pötschke, M.; Schimanke, D. Oxidation of La–Sr–Mn-coated interconnector alloys for steam electrolysis under pressure in pure oxygen and in pure steam. Oxid. Met. 2017, 88, 279–290. [Google Scholar] [CrossRef]
- Yang, Z.; Xia, G.; Wang, C.M.; Nie, Z.; Templeton, J.D.; Singh, P.; Stevenson, J.W. Investigation of AISI 441 Ferritic Stainless Steel and Development of Spinel Coatings for SOFC Interconnect Applications; U.S. Department of Energy: Washington, DC, USA, 2008.
- Chandra-Ambhorn, S.; Wouters, Y.; Antoni, L.; Toscan, F.; Galerie, A. Adhesion of oxide scales grown on ferritic stainless steels in solid oxide fuel cells temperature and atmosphere conditions. J. Power Sources 2007, 171, 688–695. [Google Scholar] [CrossRef]
- Mougin, J.; Dupeux, M.; Antoni, L.; Galerie, A.A. Adhesion of thermal oxide scales grown on ferritic stainless steels measured using the inverted blister test. Mater. Sci. Eng. A 2003, 359, 44–51. [Google Scholar] [CrossRef]
- Ebrahimifar, H.; Zandrahimi, M. Evaluation of the parabolic rate constant during different types of oxidation tests for spinel coated Fe-17%Cr alloy. Oxid. Met. 2011, 75, 125–141. [Google Scholar] [CrossRef]


| wt.% | Cr | C | Si | Mn | P | S | Ti | Nb | Cu | La | Fe |
|---|---|---|---|---|---|---|---|---|---|---|---|
| Crofer 22 APU [44] | 20–24 | 0.03 | 0.5 | 0.3–0.8 | 0.05 | 0.02 | 0.03–0.2 | - | 0.5 | 0.04–0.2 | Bal. |
| AISI 441 [45] | 17.5–18.5 | ≤0.03 | ≤1 | ≤1 | ≤0.04 | ≤0.015 | 0.1–0.6 | (3 × C + 0.30) − 1 | - | - | Bal. |
| Temperature Ramps | Heating Up and Cooling Down Atmospheres | Exposure Temperatures | Exposure Atmospheres | Exposure Time |
|---|---|---|---|---|
| 1 °C/min | Oxidizing atmosphere: Pure O2 Reducing atmosphere: N2/5 vol.% H2 | 700 °C 800 °C | Oxidizing atmosphere: Pure O2 Reducing atmosphere: 90 vol.% H2O/10 vol.% H2 | 1500 h |
| Steel | Atmosphere | Temperature (°C) | Partner | Gas Linear Velocity (cm/s) |
|---|---|---|---|---|
| Crofer 22 APU | O2 | 700 | VTT | 0.2 |
| Crofer 22 APU | O2 | 800 | VTT | 0.3 |
| Crofer 22 APU | H2-H2O | 700 | DTU | 1.1 |
| Crofer 22 APU | H2-H2O | 800 | DTU | 1.3 |
| AISI 441 | O2 | 700 | CEA | 3.5 |
| AISI 441 | O2 | 800 | CEA | 3.9 |
| AISI 441 | H2-H2O | 800 | DTU | 1.3 |
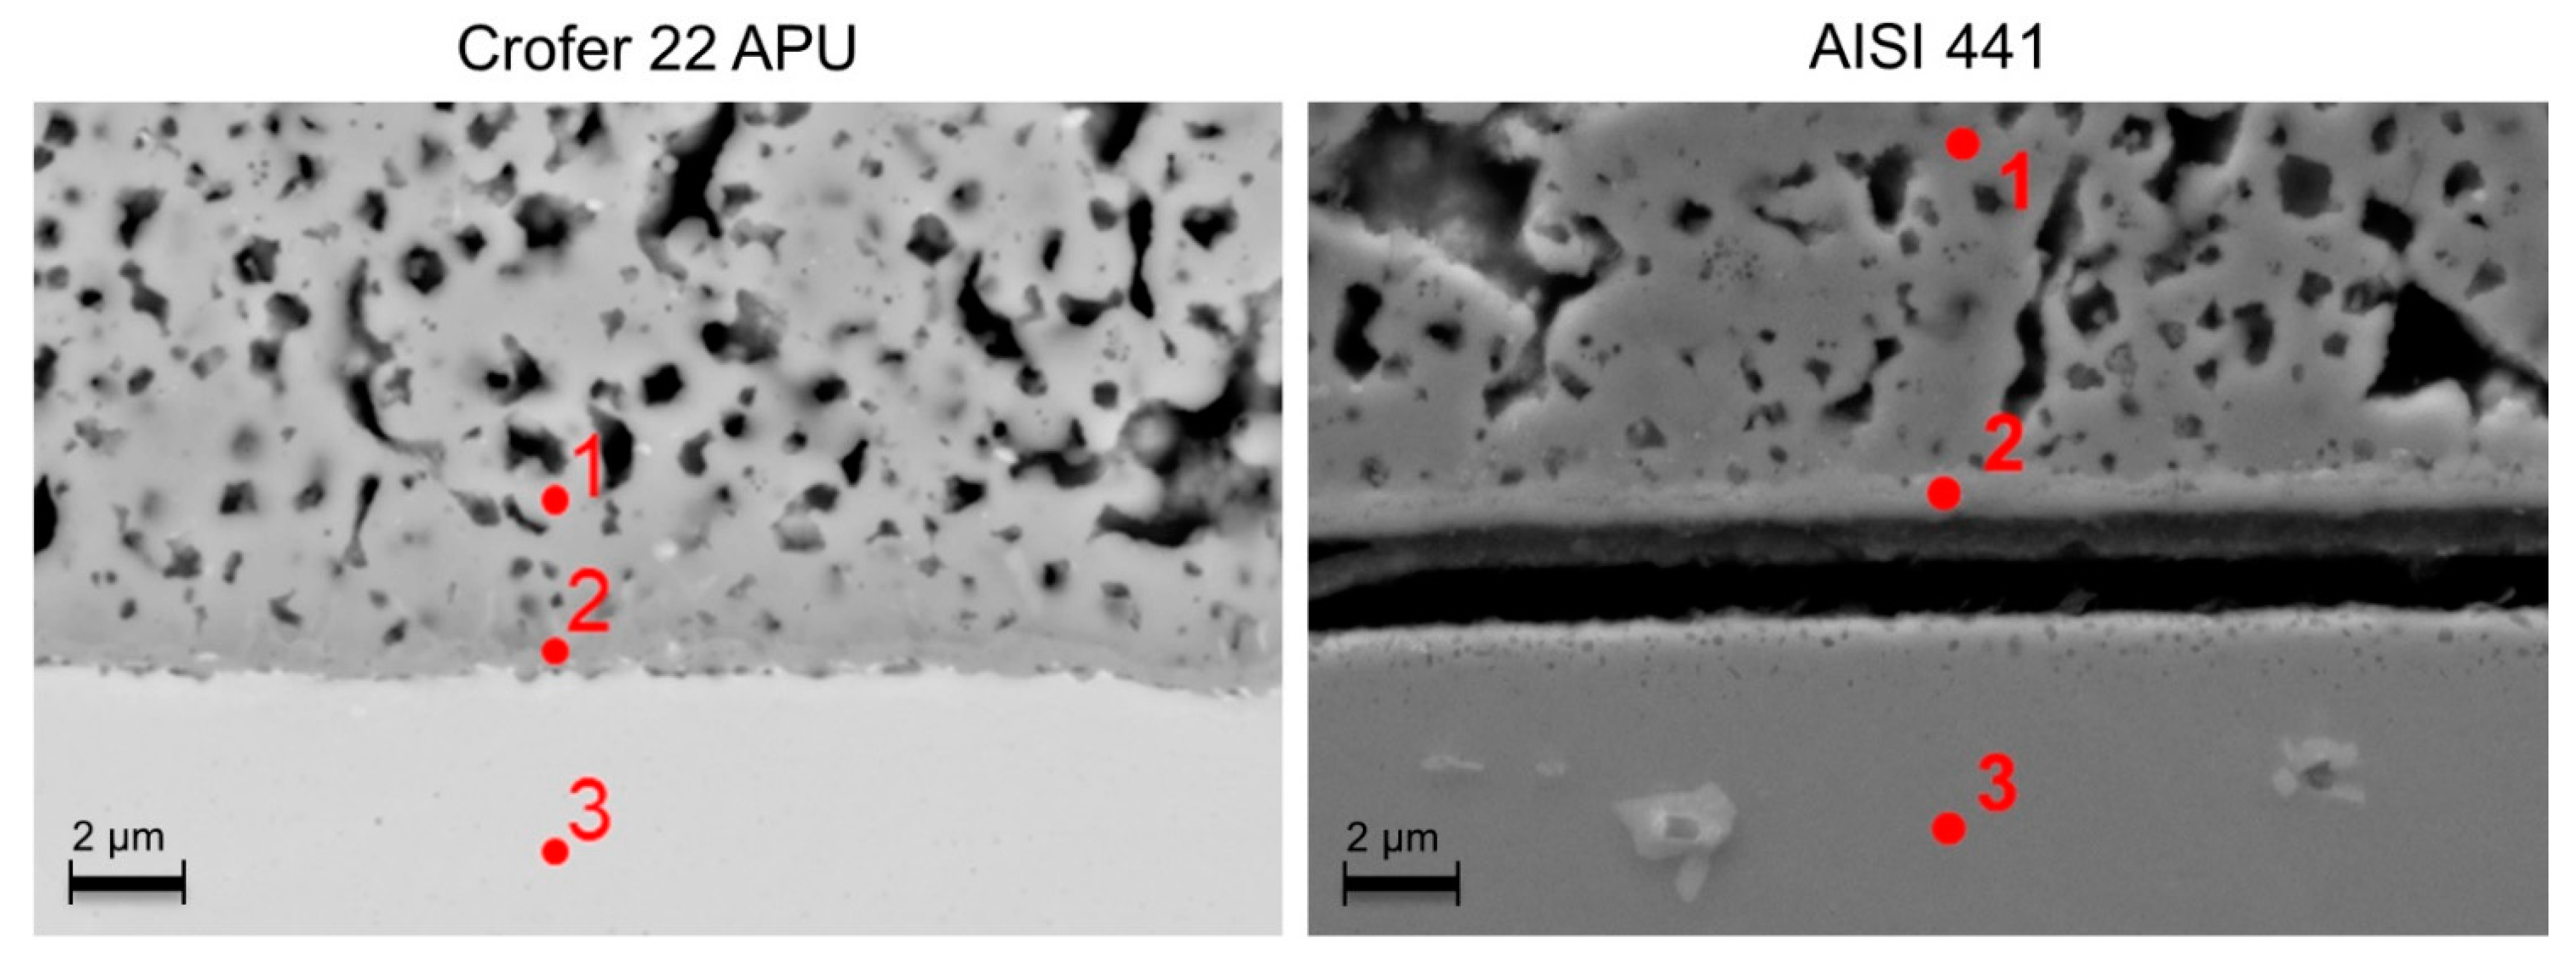
| Spot | O wt./at.% | Al wt./at.% | Si wt./at.% | Cr wt./at.% | Mn wt./at.% | Fe wt./at.% | Co wt./at.% |
|---|---|---|---|---|---|---|---|
| 1—Crofer 22 APU | 29.9/60.1 | 0.6/0.7 | 0.2/0.2 | 2.4/1.5 | 23.2/13.6 | - | 43.8/23.9 |
| 2—Crofer 22 APU | 32.2/61.7 | 0.5/0.6 | 0.2/0.2 | 30.2/17.8 | 8.8/4.9 | 4.6/2.5 | 23.4/12.2 |
| 3—Crofer 22 APU | - | 0.5/1.1 | 0.1/0.2 | 23.1/24.3 | - | 76.2/74.5 | - |
| 1—AISI 441 | 25.4/54.8 | 0.2/0.3 | 0.4/0.5 | 0.3/0.2 | 23.7/14.9 | 1.2/0.7 | 48.5/28.4 |
| 2—AISI 441 | 28.3/57.4 | 0.1/0.2 (Ti 1/0.7) | 0.2/0.3 | 29.8/18.7 | 9.9/5.8 | 3.6/2.1 | 26.7/14.7 |
| 3—AISI 441 | - | (Ti 0.5/0.4) | 0.7/1.4 | 18.1/19.2 | 0.3/0.3 | 79.6/78.6 | (Nb 0.7/0.5) |
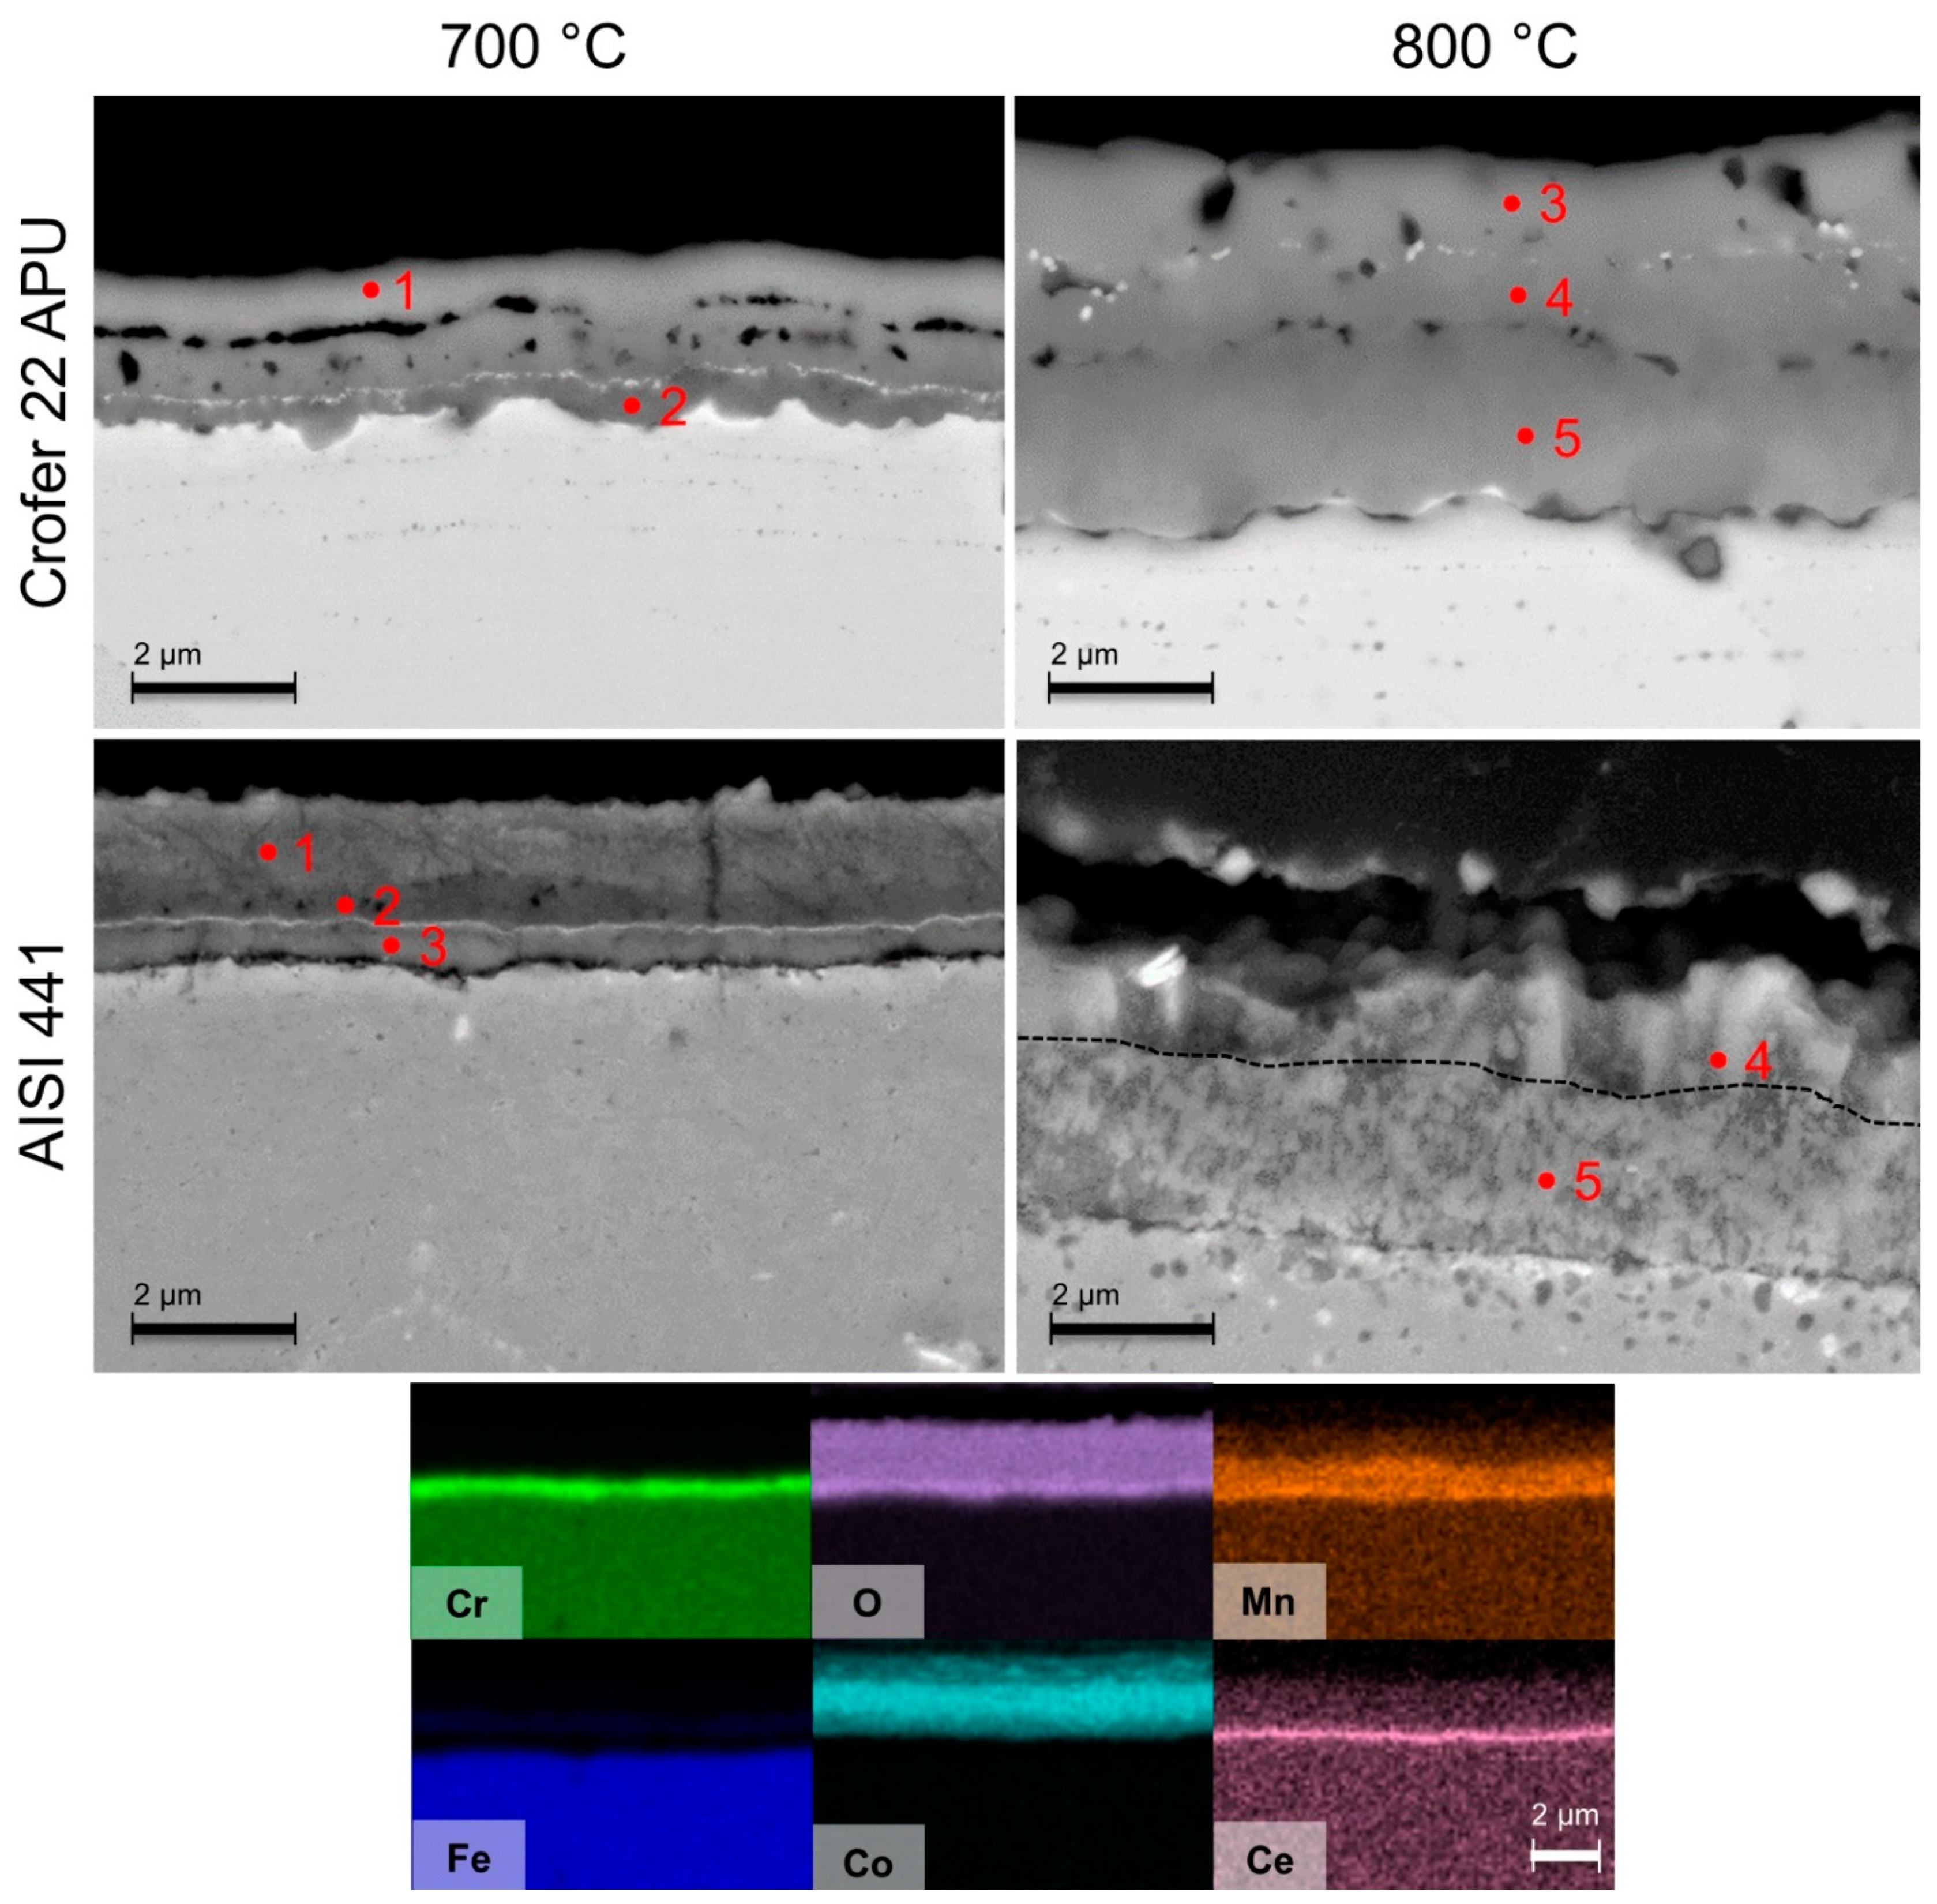
| Spot | O wt./at.% | Al wt./at.% | Si wt./at.% | Cr wt./at.% | Mn wt./at.% | Fe wt./at.% | Co wt./at.% |
|---|---|---|---|---|---|---|---|
| 700 °C | |||||||
| 1—Crofer 22 APU | 37.0/67.7 | 0.8/0.9 | 0.1/0.1 | 1.5/0.8 | 6.8/3.6 | 3.1/1.6 | 50.6/25.2 |
| 2—Crofer 22 APU | 28.3/58.4 | 0.6/0.8 | 0.1/0.1 | 17.1/10.9 | 5.8/3.5 | 9.5/5.6 | 35.6/20.0 |
| 1—AISI 441 | 26.2/56.1 | 0.2/0.3 | 0.5/0.6 | 1.3/0.9 | 3.2/2.0 | 7.4/4.5 | 61.2/35.6 |
| 2—AISI 441 | 25.0/54.3 | 0.1/0.1 | 0.2/0.3 | 4.4/2.9 | 6.7/4.2 | 17.9/11.2 | 45.1/26.6 |
| 3—AISI 441 | 25.6/52.9 | 0.1/0.2 | 1.1/1.2 (Ti 2.5/1.7) | 52.5/33.4 | 1.5/0.9 | 9.6/5.7 | 6.5/3.7 |
| 800 °C | |||||||
| 3—Crofer 22 APU | 35.4/65.8 | 0.7/0.8 | - | 4.7/2.7 | 21.1/11.5 | - | 37.9/19.2 |
| 4—Crofer 22 APU | 35.7/65.8 | 0.6/0.6 | 0.1/0.1 | 14.9/8.5 | 16.0/8.6 | - | 32.6/16.3 |
| 5—Crofer 22 APU | 38.4/66.9 | 0.4/0.4 | - | 58.3/31.2 | - | 2.6/1.3 | 0.3/0.1 |
| 4—AISI 441 | 34.0/63.0 | - | - | 43.9/25.1 | 19.9/10.7 | 1.2/0.6 | - |
| 5—AISI 441 | 33.9/62.5 | - | 0.2/0.2 | 60.5/34.4 | 1.1/0.6 | 3.6/1.9 | - |
| Spot | O wt./at.% | Al wt./at.% | Cr wt./at.% | Mn wt./at.% | Fe wt./at.% | Cu wt./at.% | La wt./at.% |
|---|---|---|---|---|---|---|---|
| 700 °C | |||||||
| 1—Crofer 22 APU | 18.7/56.3 | 0.6/1.0 | 0.4/0.3 | - | 28.4/24.4 | - | 51.9/17.9 |
| 2—Crofer 22 APU | 29.4/59.0 | 0.3/0.4 | 7.2/4.5 | 3.7/2.1 | 53.0/30.4 | 5.8/2.9 | - |
| 3—Crofer 22 APU | 1.7/5.6 | 0.3/0.6 | 22.3/22.5 | - | 75.5/71.1 | - | - |
| 1—AISI 441 | 19.4/54.2 | 1.0/1.7 | 2.5/2.2 | (Si 1.1/1.7) | 23.0/18.4 | 9.9/7.0 | 42.8/13.8 |
| 2—AISI 441 | 25.8/58.0 | 0.3/0.4 | 2.4/1.6 | (Si 0.8/1.1) | 48.9/31.5 | 3.5/2.0 | 17.9/4.6 |
| 3—AISI 441 | 29.9/58.7 | (Si 1.3/1.5) | 32.6/19.6 | 2.1/1.1 | 33.1/18.5 | - | 0.7/0.2 |
| 800 °C | |||||||
| 4—Crofer 22 APU | 36.0/66.2 | 0.3/0.3 | 8.3/4.7 | 21.2/11.3 | 30.0/15.8 | - | 3.4/0.7 |
| 5—Crofer 22 APU | 31.0/65.8 | 0.5/0.6 | 7.6/5.0 | 10.7/6.6 | 22.3/13.6 | - | 26.5/6.5 |
| 6—Crofer 22 APU | 34.3/63.9 | 0.2/0.2 | 30.6/17.5 | 17.0/9.2 | 13.2/7.1 | 0.3/0.2 | 3.2/0.7 |
| 7—Crofer 22 APU | 35.4/64.3 | 0.3/0.3 | 46.9/26.2 | 2.9/1.5 | 13.7/7.1 | - | - |
| 4—AISI 441 | 30.9/61.1 | 0.2/0.3 | 1.5/0.9 | 2.8/1.6 | 62.0/35.1 | 1.6/0.8 | 1.0/0.2 |
| 5—AISI 441 | 28.3/58.1 | (Si 0.2/0.3) | 3.7/2.3 | 2.2/1.3 | 63.1/37.1 | 1.1/0.5 | 1.0/0.2 |
| 6—AISI 441 | 29.9/58.3 | 0.1/0.2 | 43.3/26.0 | 3.0/1.7 | 21.1/11.8 | 1.2/0.6 | (Si 1.2/1.3) |
Publisher’s Note: MDPI stays neutral with regard to jurisdictional claims in published maps and institutional affiliations. |
© 2022 by the authors. Licensee MDPI, Basel, Switzerland. This article is an open access article distributed under the terms and conditions of the Creative Commons Attribution (CC BY) license (https://creativecommons.org/licenses/by/4.0/).
Share and Cite
Mikkola, J.; Couturier, K.; Talic, B.; Frangini, S.; Giacometti, N.; Pelissier, N.; Sudireddy, B.R.; Thomann, O. Protective Coatings for Ferritic Stainless Steel Interconnect Materials in High Temperature Solid Oxide Electrolyser Atmospheres. Energies 2022, 15, 1168. https://0-doi-org.brum.beds.ac.uk/10.3390/en15031168
Mikkola J, Couturier K, Talic B, Frangini S, Giacometti N, Pelissier N, Sudireddy BR, Thomann O. Protective Coatings for Ferritic Stainless Steel Interconnect Materials in High Temperature Solid Oxide Electrolyser Atmospheres. Energies. 2022; 15(3):1168. https://0-doi-org.brum.beds.ac.uk/10.3390/en15031168
Chicago/Turabian StyleMikkola, Jyrki, Karine Couturier, Belma Talic, Stefano Frangini, Nathalie Giacometti, Nathalie Pelissier, Bhaskar Reddy Sudireddy, and Olivier Thomann. 2022. "Protective Coatings for Ferritic Stainless Steel Interconnect Materials in High Temperature Solid Oxide Electrolyser Atmospheres" Energies 15, no. 3: 1168. https://0-doi-org.brum.beds.ac.uk/10.3390/en15031168