
Change in the Affordability of Owner-Occupied Housing in the Context of Rising Energy Prices


1
Department of Economics, Faculty of Economics, Prague University of Economics and Business, nám. W. Churchilla 1938/4, 130 67 Prague, Czech Republic
2
Faculty of Civil Engineering, Czech Technical University in Prague, Thakurova 7, 166 29 Prague, Czech Republic
*
Author to whom correspondence should be addressed.
Energies 2022, 15(4), 1281; https://0-doi-org.brum.beds.ac.uk/10.3390/en15041281
Submission received: 22 January 2022
/
Revised: 5 February 2022
/
Accepted: 8 February 2022
/
Published: 10 February 2022
(This article belongs to the Special Issue Advances in Scientific, Economic and Policy Analysis for Sustainable Development)
Abstract
:Household energy constitutes an important share of affordable housing. Unaffordable housing and inadequate household energy represent a new dimension of poverty. Connections between energy, housing affordability and well-being are still under-researched. Building on housing affordability framework, this study explores the magnitude in changes in affordability of acquisition and use of an apartment between January 2018 and January 2022. Over the last four years, the real estate market in Europe has changed significantly. This paper deals with primary data for the Czech Republic, where acquisition prices of residential real estate increased depending on the region in the range of 50 to 120%. Since January 2022, there has been a sharp rise in energy prices and a tightening of conditions for the acquisition of mortgage loans. All these factors affect the standard of living in the Czech Republic. The article quantifies the magnitude of this change by calculating shares of total housing costs to total average net household income for the period January 2018 and January 2022. It is found that the affordability of owner-occupied housing in the Czech Republic has deteriorated and part of the middle class will be forced to move to the rental housing sector, multifamily housing and sharing. Finally, we argue that energy poverty needs to be considered in addressing the government housing policies. The aim of the article is to analyze the changes that have taken place in the real estate market over the last four years in relation to the growth of total housing costs and energy costs associated with housing.
1. Introduction
For many years, the real estate market the Czech Republic has experiences a stable development. However, as a result of the COVID-19 pandemic, the quantitative easing, the loose monetary policy of central banks, the threat of high inflation and the devaluation of savings, there has been a significant transfer of available funds to the real estate sector [1]. Not least, the Czech property market has been for long attracting foreign capital. One, in response to institutional factors—as Ouechtati [2] proves that stable institutional variables attract foreign investment. This was the case of the Czech Republic [3,4], where institutional stability induced large amounts of foreign capital to invest in the Czech property market. Furthermore, a second factor inviting foreign investors to the Czech property market was the temporary significant depreciation to the Czech Koruna during the first wave of COVID pandemic [5]. All these factors contributed to a sharp and continuous increase in property prices. In fact, the real estate market prices over speeded the overall inflation rate by 10–20%, depending on region, indicating that the property market absorbs inflation expectations promptly [6] and represents a safe port in investor’s portfolio in times of increased inflation expectations [7]. High inflation expectations for 2022 [8] and expected continued fiscal easing [9] indicate that property prices may be expected to increase even in the period to follow. This reality, combined with a change in the European Union’s energy policy (Green Deal) which, as a result, brings a sharp increase in energy prices [10] also in relation to housing, has increased costs of housing [11], making housing less affordable for lower middle and middle class of population and not least for the young generation.
In addition to the factors mentioned above we have identified an increasing share of rental housing in the under 35 cohort of population. We believe that this trend can be explained by increased housing unaffordability enforced by changes in economic activity and consumption habits of the young generation. Malecek [12] documents that age of the first economic activity has been steadily increasing across developed countries, meaning that a large share of young population may not fulfill the mortgage requirements imposed by banks and thus may not be able to buy their own housing. It is also documented [13] that the consumption habits of the young generation are on average characterized by higher rate of intertemporal discounting signaling an increased impatience in consumption. Saving the down payment amount for property purchase is therefore much more painful for the young generation. Very probably lower middle class of population and young under 35 will constitute the new group with prevailing rental housing instead of own housing, and, also, will be affected by housing and energy poverty to a higher degree.
This article is structured as follows. First, we examine the results of other authors who deal with the financial unavailability of housing. The next section presents the EVAL software, which is used to collect and evaluate data on the real estate market in the Czech Republic. The author of the software EVAL is Eduard Hromada. The software was developed at CTU in Prague, Czech Republic. In the next part, the calculation of costs associated with housing for an apartment with a floor area of 30 m2 and 70 m2 is performed. The recapitulation of the obtained results in the form of summary tables follows. The Conclusion describes the consequences of the impact of financial unavailability of housing on society and suggesting solutions to this problem.
2. Literature Review
It needs to be remembered that the degree of housing and energy poverty differs across regions. Kaderabkova in this regard examines wage inflation in different regions in relation to labor productivity which falls behind and concludes that the trend of wage inflation might further increase rents and real estate prices, making own housing further less affordable [14,15]. Rising energy prices are reflected not only in the cost of energy consumption in households, but also in the prices of building materials and construction work [16]. Construction is a sector that consumes a significant amount of energy produced as quantified by Schneiderova-Heralova [17] or Karasek [18] thus energy prices create pressures at the supply side of property market [19]. Housing and energy poverty are two sides of the same issue, increasingly reflected in research papers and expert analyses. We offer a short insight below.
A huge volume of literature documents that household energy and energy and housing poverty is increasingly vital for maintaining good health and is reflected in policymakers’ decisions. Many authors deal with the issue of poor housing [20,21,22], energy poverty [23,24,25,26], socioeconomic disadvantage [27,28,29] and climate change [30,31,32] from various perspectives. Pala [33] considers climate change as one of the crucial factors of household’s well-being, Stanimir [34] discusses socioeconomic disadvantages connected to poverty through the lens participation of vulnerable communities in labor market and their preference of immediate remuneration in exchange of longer-term stability and career growth. Sokołowski et al. [35] examine the relationship between poor housing and inefficient heating and the risk of an increase in health problems. The authors conducted a survey of 1735 individuals living in two medium-sized cities in Poland’s coal-dependent region. The authors found that compared to people living in suitable housing conditions, people living in poor housing are more likely to show poor musculoskeletal and cardiovascular outcomes. Their results also suggest that energy-poor people who use coal or wood stoves in the apartment are more likely to develop respiratory illness than people in energy poverty who are connected to district heating. Similar views were reached by Jessel et al. [36] who found that unavailable and insufficient energy in households has adverse consequences for maintaining full health, which are exacerbated by poverty and a changing climate. Kopp et al. [37] argue that energy poverty has often have the form of water insufficiency and related health problems. Water insecurity for sure is another co-occurring hardship.
Energy bills contribute to a growing share on housing affordability. Families struggling with housing affordability may have difficulty providing other basic needs, such as health care, food and heating [38]. The unavailability of housing may lead to the use of one apartment by more people. A small living space increases the risk of poor mental health and physical illnesses such as tuberculosis and other infectious diseases. Neethu [39] proves that even temporary deteriorated housing conditions in case of guestworkers have remarkable and permanent impacts on their health condition. Decreased housing affordability also motivates people to move to their houses in countryside losing their job opportunities [40]. This behavior was confirmed prevalently for the 55–65 age group, where people decide to leave the labor market earlier and retire. Son [41] in this regard finds negative impact of health of early retires. In addition, Jessel [36], in line with authors mentioned above, concludes that low income and minority residents (usually tenants) face a higher proportion of housing difficulties. Pollack [42] demonstrates that vulnerable households tend to spend the greatest portion of their incomes on energy bills when compared to other socioeconomic groups. Several studies find that energy insufficiency and difficulties in affording housing costs is associated with adverse health outcomes [43]. An aspect of energy and housing insecurity that has serious health implications is energy insufficiency (poor insulation, lack of proper ventilation, older housing, energy inefficient heating, etc. [44,45,46,47].
Housing unaffordability enforced by energy poverty has vast spill overs to many aspects of life. Not surprisingly, it has attracted attention governments all over Europe. European funds offer several subsidy programs to increase energy efficiency and energy security of households (solar energy subsidies, insulation, efficient heating systems, etc.). These policies have a remarkable potential to improve energy insecurity, however, our data reveal that often the most vulnerable households are not able to obtain the support due to complex administrative requirements (projects, forms expertise reports, etc.).
Adequate access to energy and its affordability challenges known as energy insecurity [48] includes physical dimension (e.g., poor housing quality), economic dimension (affordability challenges) and behavioral dimension (social vulnerabilities, etc.). Within this conceptual framework we will explore recent primary data related to changes in household energy, poverty and housing burdens, we will demonstrate a range of concerns related to the currently obvious combination of sharp increase in energy bills and property prices. We will develop parallels with housing affordability and changes in housing trends as our findings suggest that share of own housing, which is historically prevailing form of housing, will decrease shifting towards rental housing and, increasingly, multifamily and shared housing.
3. Methods
The statistical data presented in this article are based on EVAL software data. EVAL is a software tool developed and constantly upgraded by one of the authors of this article. This software automatically collects, analyzes and evaluates data from real estate advertising in the Czech Republic. Data collection takes place once a month from 2007 until now. Data collection is performed for the categories of flats for sale and flats for rent. A total of 50 technical and economic parameters describing the advertised property are analyzed. For a better idea, these are, for example, floor area, price, age of the property, structural and material characteristics of the building, floor of the apartment, type of ownership of the apartment, orientation of the apartment, thermal insulation properties of the building and others.
During statistical processing, the credibility of each price offer is assessed and in case of any errors, this offer is excluded from further processing. Price offers that contain unrealistic offer prices were also excluded from the statistical processing. The difference between the offer prices and the prices actually realized on the market is also taken into account.
4. Results and Discussion
4.1. Comparison of Affordability of Owner-Occupied Housing
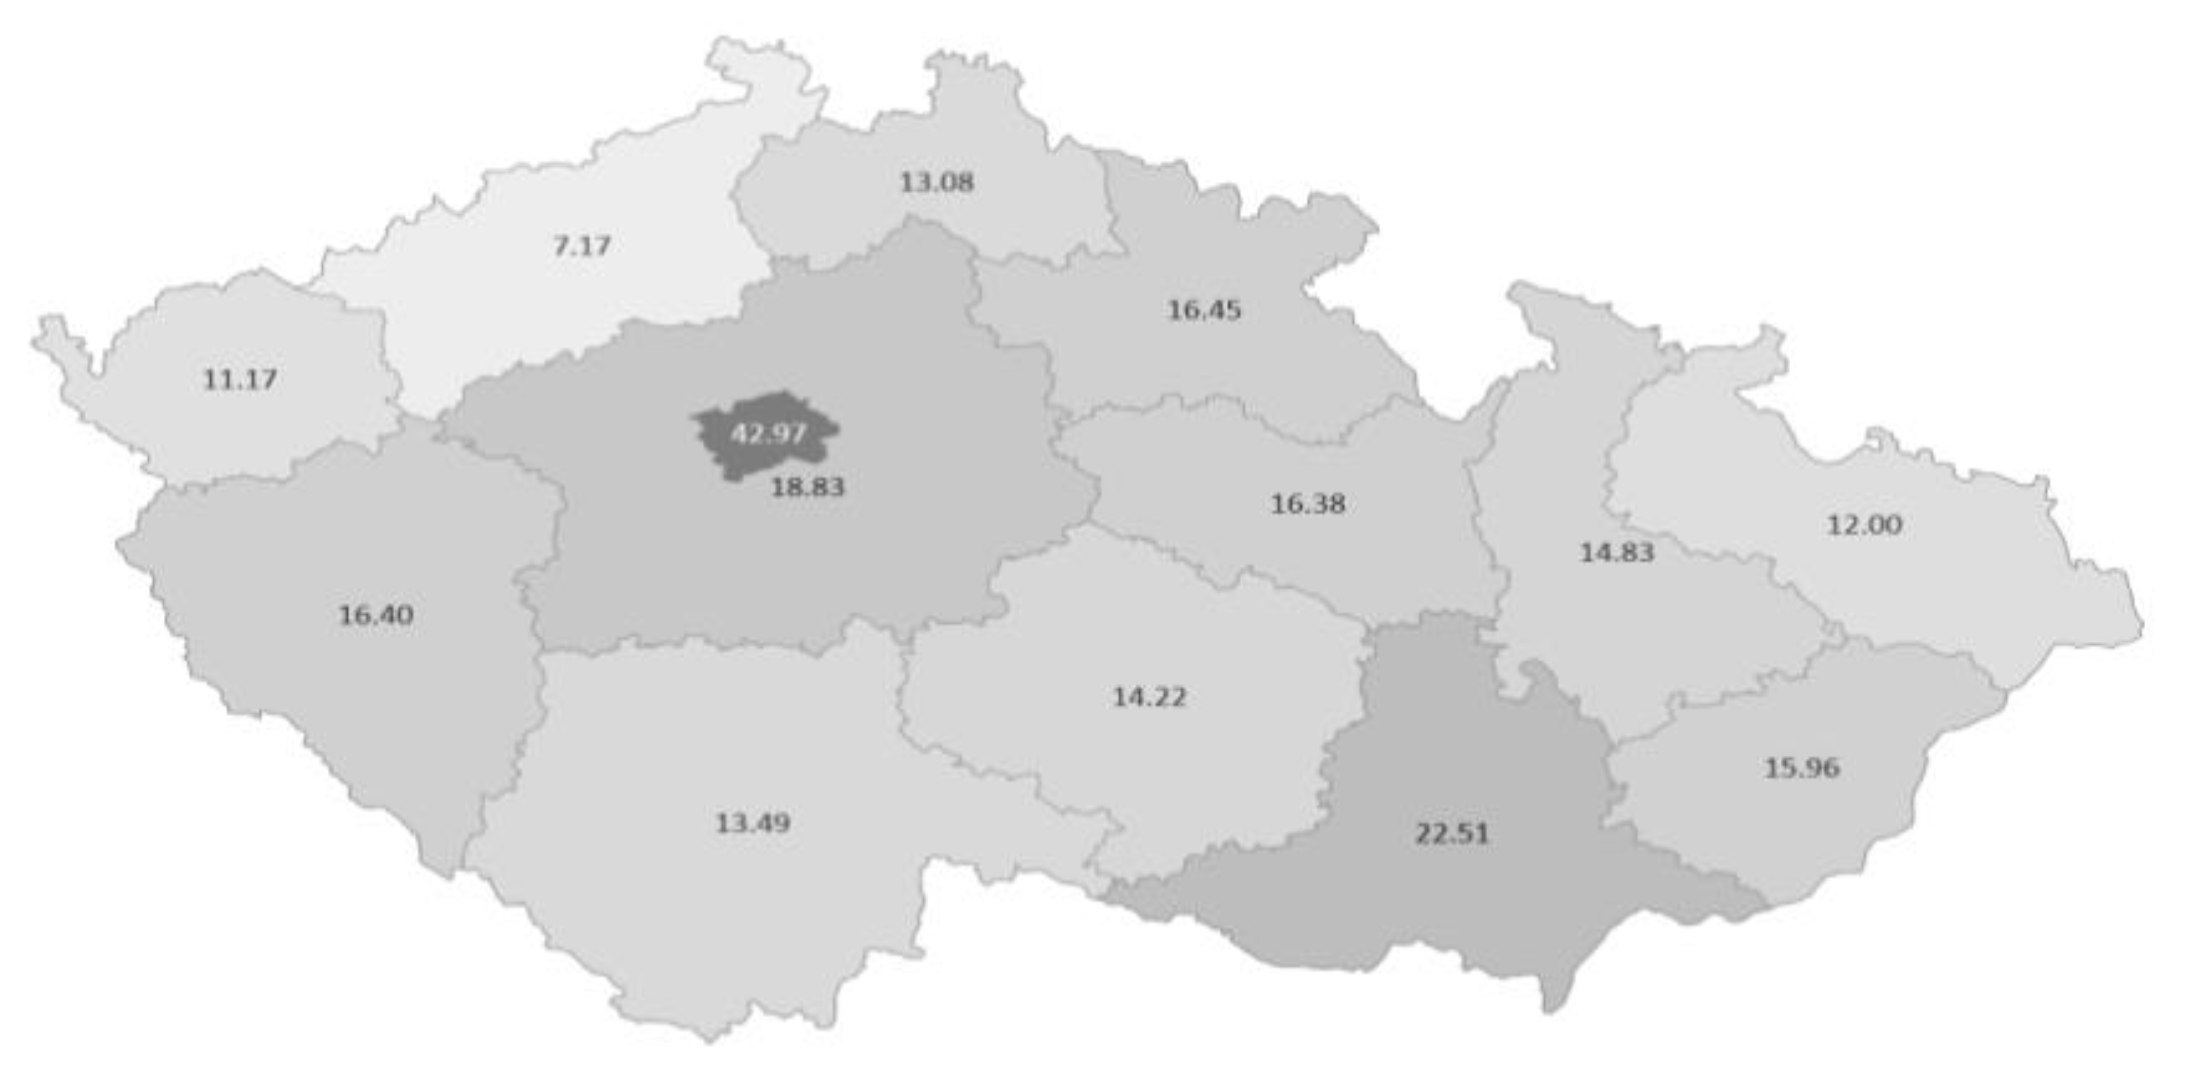
Between January 2018 and January 2022, there was a significant change in the affordability of owner-occupied housing. In 2018, it was possible to achieve very low interest rates on mortgage loans. At the same time, the purchase prices of real estate were still at an affordable level due to the household incomes in all regions of the Czech Republic, with the exception of Prague region, where housing affordability has been remarkably lower for the last 20 years. The Figure 1 shows average (2000–2021) price (measured in thousands of CZK (The exchange rate CZK/EUR corresponds approx. 25CZK (January 2022))) of 1 m2 of flat and the difference in price Prague vs. other regions is well observable.
However, in January 2022 there was a significant deterioration in the affordability of owner-occupied housing in all related indicators. Purchase prices of real estate increased significantly, the offer of vacant flats for sale decreased by about half, there was a sharp increase in interest rates on mortgage loans and the Czech National Bank tightened the conditions for applicants for mortgage loans [50]. Table 1 shows the described changes in the real estate market for an apartment with a floor area of 30 m2.
To confirm the reliability of the presented data, we also present the statistical results obtained through the Numbeo database (https://www.numbeo.com/, accessed on 17 January 2022). Numbeo is the world’s largest database about worldwide housing (real estate) prices. In this database, it is stated that price per square meter to buy apartment in city center starts in 22 January at CZK 151,598.56 and price per square meter to buy apartment outside of center is CZK 105,624.11. The values given correspond to the price range in Table 1. These values are also in line with the findings of the Czech Statistical Office and statistical analyzes of real estate agencies and consulting companies (Deloitte, Flat Zone, Nexter Company, etc.).
We calculated a correlation coefficient between the average purchase prices of the apartment in January 2018 and in January 2022. A value of 0.95 was found. Similarly, we found a very high dependency on the parameter number of years needed to save an amount to buy an apartment in January 2018 and in January 2022. A value of 0.91 was found. The values of correlation parameters show that the acquisition price of real estate is significantly affected by the location of the property.
The average purchase price of the apartment was determined using EVAL software. This software analyzes the online real estate advertising in the Czech Republic. The statistical survey includes flats for sale and flats for rent in all regions in the Czech Republic. Data collection is performed regularly over a period of one month. The calculation is based on the median unit acquisition prices in the individual regions of the Czech Republic. It is found that the highest purchase prices are achieved in the Prague region and the South-Moravian region.
The number of years needed to save an amount to buy an apartment represents a situation where a potential buyer of an apartment will invest all his earned funds in the acquisition of apartment. At the same time, it is assumed that it will finance its other operating expenses from other sources. To simplify the calculation, interest on this amount is not expected on the deposit account. The data of the Czech Statistical Office regarding average gross wages [51] in individual regions in the Czech Republic were used for the calculation. The calculation also assumes the conversion of the average gross wage to the average net wage using the assumed coefficients. Similar to the previous statistic, it is found that the worst financial affordability of owner-occupied housing was found in the Prague region and the South-Moravian region.
The average monthly mortgage payment assumes that a mortgage loan will be used to acquire the apartment. It is assumed that the ratio of own and external resources will be as follows: 20% included own resources and 80% includes external resources. This ratio represents a typical situation in the Czech Republic and is fully in line with the recommendations of the Czech National Bank. The maturity of the loan is expected to be 30 years.
The average interest rate on a mortgage loan for the month of January 2018 is based on the findings of Fincentrum Hypoindex [52]. The indicator is calculated as the weighted average interest rate at which new mortgage loans for individuals are provided in a given calendar month. The weights are the volumes of loans provided. For the month of January 2018, an average interest rate of 2.28% p.a. is calculated.
Another way of determining the average interest rate had to be used for the month of January 2022. The average interest rate determined by the Hypoindex indicator was not used for this month, as there was a significant change in the average interest rate in the last months. The value of the Hypoindex indicator was skewed in this case because the calculation also includes loan applications, which are still undergoing the approval process in the bank and have the original conditions set (low interest rates). Therefore, in this case, the current offers of banks on the market were used (ČSOB, Česká spořitelna, Komerční banka, etc.). For the month of January 2022, an average interest rate of 4.70% p.a. is calculated.
Table 2 compares the affordability of owner-occupied housing between January 2018 and January 2022 for an apartment with a floor area of 70 m2. The calculation methodology is the same as for an apartment with a floor area of 30 m2. The average monthly mortgage payment in the case of the purchase of an apartment with a floor area of 70 m2 already exceeds the net monthly income in the Prague region and the South-Moravian Region in January 2022.
4.2. Comparison of Energy Consumption Costs
Between January 2018 and January 2022, there was a significant increase in the cost of energy consumption in households. European climate policy and emissions trading are primarily responsible for the sharp rise in energy prices. Other negative factors causing the sharp rise in energy prices include the rapid recovery of European markets, the shortage of gas supplies and geopolitical factors. Furthermore, the performance of renewable sources, especially wind and solar power plants, was unexpectedly weak. There were also unexpected technical problems in the operation of nuclear power plants. According to its plan, Germany gradually shuts down nuclear power plants and logically, the power of these power plants is missing. The combination of all these factors caused the price of energy to increase very significantly year on year.
Such an unexpected rise in energy prices on world stock exchanges surprised even the energy suppliers themselves. In the Czech Republic, many energy suppliers who provided their services to approximately one million customers have failed. All these customers were thus forced to change their energy supplier immediately. At the same time, however, these customers were forced to accept significantly higher prices for energy supply than they used to pay to the original energy supplier.
Such a reality on energy market has a remarkably negative impact on housing costs. In addition to the increase in apartment acquisition and credit costs, there is also a significant increase in energy consumption costs. All these factors create a pressure on increasing tensions in the society and a deterioration in the living standards of many vulnerable populations.
Energy consumption in an apartment is a very individual matter. Nevertheless, our attempt is focused to determine the average values of consumption in order to be able to make an approximate comparison of costs over time. Factors such as the number of household members, average temperature in the apartment, energy consumption of appliances, type and age of the gas boiler, thermal insulation properties of the building, location of the apartment in the apartment building, altitude of the apartment, choice of gas and electricity supplier and the time of fixation of contracts, the time that residents spend away from home and family customs must be taken into account in the calculation.
For an apartment of 30 m2, it is assumed that this apartment is inhabited by only one earning person. For an apartment of 70 m2, it is assumed that this apartment is inhabited by a total of three people, two of whom have a regular income from employment.
Furthermore, the use of electricity for lighting and the use of common electrical appliances is assumed. The use of gas is assumed for cooking, water heating and apartment heating. It is assumed that the apartment has a separate gas boiler. Of course, there are many more combinations to ensure these processes (solid fuel boiler, heat pump, solar water heating, heat supply from a central source, etc.). The calculation in Table 3 is performed for the first defined variant (separate gas boiler).
The Table 3 compares the costs of energy consumption between January 2018 and January 2022. The calculation is made for an apartment with a floor area of 30 m2, which is occupied by one earning person. The table shows a significant change in costs.
- Electricity consumption—for lighting and the use of electrical appliances, an annual consumption of 1100 kWh per person is assumed. As of January 2018, an average price of CZK 4123/MWh was found from the price offers of electricity suppliers. This is the price including value added tax for a standard contract for an indefinite period. As of January 2022, an average price of CZK 6782/MWh was found.
- Gas consumption for cooking—The average consumption was set at 188 kWh per year (in the case of one person living in an apartment/30 m2/). In the case of living of 3 people in an apartment/70 m2/, the average consumption per person is slightly lower and was set at a total of 545 kWh per year. For January 2018, the average price was found to be CZK 1285/MWh (for a flat with a floor area of 30 m2) and CZK 1291/MWh (for a flat with a floor area of 70 m2). For January 2022, an average price of CZK 2353/MWh (for an apartment with a floor area of 30 m2) and CZK 2356/MWh (for an apartment with a floor area of 70 m2) was found.
- Gas consumption for water heating—This indicator assumes that the water is heated for washing. The average consumption was set at 1350 kWh per year (in the case of one person living in an apartment/30 m2/). In the case of living of 3 people in an apartment/70 m2/, the average consumption per person is slightly lower and was set at a total of 3720 kWh per year. Gas prices are the same as for gas consumption for cooking.
- Gas consumption for apartment heating—The average thermal insulation properties of the apartment and heating to normal temperature are assumed. In the case of an apartment with a floor area of 30 m2, gas consumption of 3800 kWh per year is assumed. In the case of an apartment with a floor area of 70 m2, gas consumption of 8300 kWh per year is assumed. Gas prices are the same as for gas consumption for cooking.
- Depreciation of a gas boiler—For completeness, it is necessary to include in the costs the replacement of the gas boiler at the end of its life. Acquisition costs of CZK 50,000 (for January 2018) and CZK 60,000 (for January 2022) and a boiler life of 15 years are assumed. The same costs are assumed regardless of the size of the floor area of the apartment.
The Table 4 compares the costs of energy consumption between January 2018 and January 2022. The calculation is made for an apartment with a floor area of 70 m2. It is assumed that this apartment is inhabited by a total of three people, two of whom have a stable job. The table shows a significant change in costs.
4.3. Operating Costs Associated with the Use of the Apartment
This group of costs includes costs associated with the use of the apartment. These costs vary according to the number of users of the apartment. This cost group does not include costs associated with the consumption of electricity in the apartment and gas consumption, as they have already been quantified in the previous chapter. The cost structure is shown in Table 5 and Table 6.
Electricity in common areas—These are costs including lighting in common areas (corridors, stairs, basement cubicles, etc.) and electricity consumption related to the operation of the elevator and bells. There is no distinction between the floor in which the apartment is located. For January 2018, these costs were set at CZK 50 per person per month, for January 2022, these costs were set at CZK 80 per person per month.
Water and sewer rates—these are costs associated with the consumption of cold and hot water and the disposal of wastewater using public sewers. These costs do not include water heating costs as these costs are included in the previous chapter. For January 2018, these costs were set at CZK 500 per person per month, for January 2022, these costs were set at CZK 650 per person per month.
Cleaning in an apartment building—These are the costs associated with cleaning the common areas in the apartment building (corridors, stairs, etc.). This service is usually provided by an external company that performs cleaning at regular intervals (for example, once a week). For January 2018, these costs were set at CZK 70 per person per month, for January 2022, these costs were set at CZK 120 per person per month. There was a significant increase in costs, as many working foreigners left the Czech Republic as a result of the COVID-19.
Garbage collection—This item includes costs associated with the disposal of municipal waste. This service is usually provided by the municipality. Municipal waste is usually removed at regular intervals once a week. For January 2018, these costs were set at CZK 60 per person per month, for January 2022, these costs were set at CZK 100 per person per month.
Common television antenna—This is a small cost associated with operating a common television antenna. This cost does not include concession fees. This item is paid only for technical operating costs. For January 2018, these costs were set at CZK 10 per person per month, for January 2022, these costs were set at CZK 15 per person per month.
Table 6 sets out the operating costs for a three-member household (apartment with a floor area of 70 m2). The owner of the apartment is obliged to report to the administrator of the apartment building the actual number of people who use the apartment. Based on the number of people, the operating costs are then calculated.
4.4. Costs Associated with Property Ownership
The costs associated with property ownership must also be included in the total costs related to the acquisition and operation of the property. These costs are not paid by the tenant, however, in this article we deal with the acquisition of an apartment on a mortgage loan, when it is necessary to take these costs into account. People often forget about this group of costs and are then unpleasantly surprised that they have to pay.
Table 7 and Table 8 compare the differences in property ownership costs between January 2018 and January 2022. It is found that these costs increased over time, however, compared to the costs associated with the acquisition of real estate and energy costs, this is a lower increase in costs.
Apartment management costs include the costs of operating an office providing administrative activities related to the apartment building, the costs of maintaining a bank account of the unit owners’ association, the costs of annual energy and water billing, the costs associated with providing legal services related to apartment building management, etc. For the purposes of our calculation, it is considered for January 2018 with an amount of CZK 180 per month per housing unit and for January 2022 with an amount of CZK 220 per month per housing unit. The size of the housing unit is not differentiated for these costs.
Equipment inspection costs include regular inspections of electrical and gas equipment, lifts and fire safety. The periods for carrying out these inspections are set out in national technical standards. Inspections then means the overall assessment of the equipment, during which the inspection, testing, or even measurement determines the operational safety and reliability. The technical documentation and professional competence of the operator are also assessed. After calculating these costs for individual apartments, the authors found that for January 2018 it is an annual cost of CZK 1800 per housing unit and for January 2022 it is an annual cost of CZK 2400 per housing unit. These costs are not affected by the size of the apartment.
Insurance costs—Real estate insurance is a common standard in the Czech Republic. The reason is that many of them are bought on a mortgage, where it is a mandatory condition. There are two basic products for insurance: property insurance and household insurance. Property insurance covers damage to the building components of an apartment caused by the elements or an accident. Household insurance then protects personal property, apartment equipment (floors, wallpaper, lighting, etc.), electronics, furniture and other removable equipment. Another option is to take out liability insurance, which covers the costs associated with the accident.
The authors calculated average insurance costs of CZK 750 per year (apartment with a floor area of 30 m2) and CZK 1150 per year (apartment with a floor area of 70 m2) for January 2018. Similarly, insurance costs for January 2022 were set at CZK 950 per year (apartment 30 m2) and 1380 CZK per year (apartment 70 m2). These values are based on current market prices.
Costs of the apartment building repair fund—Contributions to this fund are provided by the co-owners of the apartment building according to the size of the share in the common parts of the apartment building. This fund mainly pays for costs related to operation, maintenance, repairs, building modifications and other changes to the common parts of the apartment building.
The size of these contributions depends on the age of the apartment building and the degree of maintenance performed. The size of the contributions is then decided by the co-owners of the apartment building, which means that the size of this contribution varies for each apartment building. The authors assume an average worn of apartment building with a corresponding amount of this contribution. For January 2018, the amount of this contribution was set at CZK 35 per square meter of apartment floor per month. For January 2022, the amount of this contribution was set at CZK 50 per square meter of apartment floor per month.
The data in Table 1, Table 2, Table 3, Table 4, Table 5, Table 6, Table 7 and Table 8 show that the largest share of the total costs associated with housing is represented by the costs associated with the acquisition of an apartment. These are either mortgage repayments or rent payments. It turns out that the rule that buying one’s own apartment is cheaper than paying rent is no longer valid. Especially in large cities, the cost of paying rent is currently lower than the repayment of a mortgage loan for a comparable apartment.
A significant part of the costs associated with housing are the costs of the apartment building repair fund. These costs cannot be reduced in a simple way. These costs can be reduced only if most of the co-owners of the apartment building agree. However, the negative consequence will be a reduction in the standard of maintenance of the apartment building, with the result that the overall life of the apartment building will be shortened. In addition, neglect of preventive maintenance of an apartment building can significantly increase the necessary costs for repairs in the future.
If the household needs to reduce the total cost of housing, it has the opportunity to focus only on savings in total cost of energy consumption. For example, it is possible to reduce the comfort temperature of the interior heating to a lower value. It is also possible to better manage water consumption. However, these variable costs represent only a small component of the total costs. Therefore, another option is to just change of residence to a cheaper location. However, a change of residence can reduce the possibility of employment, so it can be counterproductive in some cases.
Table 9, Table 10, Table 11 and Table 12 show the results concerning the affordability of owner-occupied housing in the Czech Republic. Two time periods are compared–January 2018 and January 2022. The input data are based on the calculations in Table 1, Table 2, Table 3, Table 4, Table 5, Table 6, Table 7 and Table 8. During this period, there was a significant increase in acquisition prices, a sharp rise in interest rates on mortgage loans and a significant increase in energy prices.
In 2018, the critical financial limit threatening households with the unavailability of housing was exceeded only in Prague, the South-Moravian Region and the Olomouc Region (see Table 9, Table 10 and Table 11). The critical financial limit is marked in red in the tables.
In 2018, households looking for housing were more likely to choose a proprietary form of housing because it was affordable. Therefore, only young people who had not yet saved sufficient own resources to obtain a mortgage entered the rental sector. Furthermore, rental housing is used by low-income households, which, however, are expected to remain in the rental sector for life.
In 2022, however, there is a fundamental change in the real estate market. The critical financial limit is exceeded in almost all regions of the Czech Republic (see Table 10, Table 11 and Table 12). The only exception is the Usti region, which, however, has specific socio-economic and demographic problems. There are problems with structural unemployment and a low level of education of the population. Young and educated people mostly leave the Usti region to richer regions in the Czech Republic, but this worsens the development potential of this region in the future. At the same time, the Usti region is exposed to increased levels of speculative investment and abuse of social benefits.
Another important factor must be taken into account when determining the financial critical value that threatens the standard of living. If a household has a high income and at the same time pays high mortgage payments, it usually has enough funds left to provide for its basic necessities. In contrast, low-income households, for which the 40% threshold is hard to cope with. This household no longer has enough free funds to provide for everyday needs (food, clothing, transport costs, school supplies, etc.).
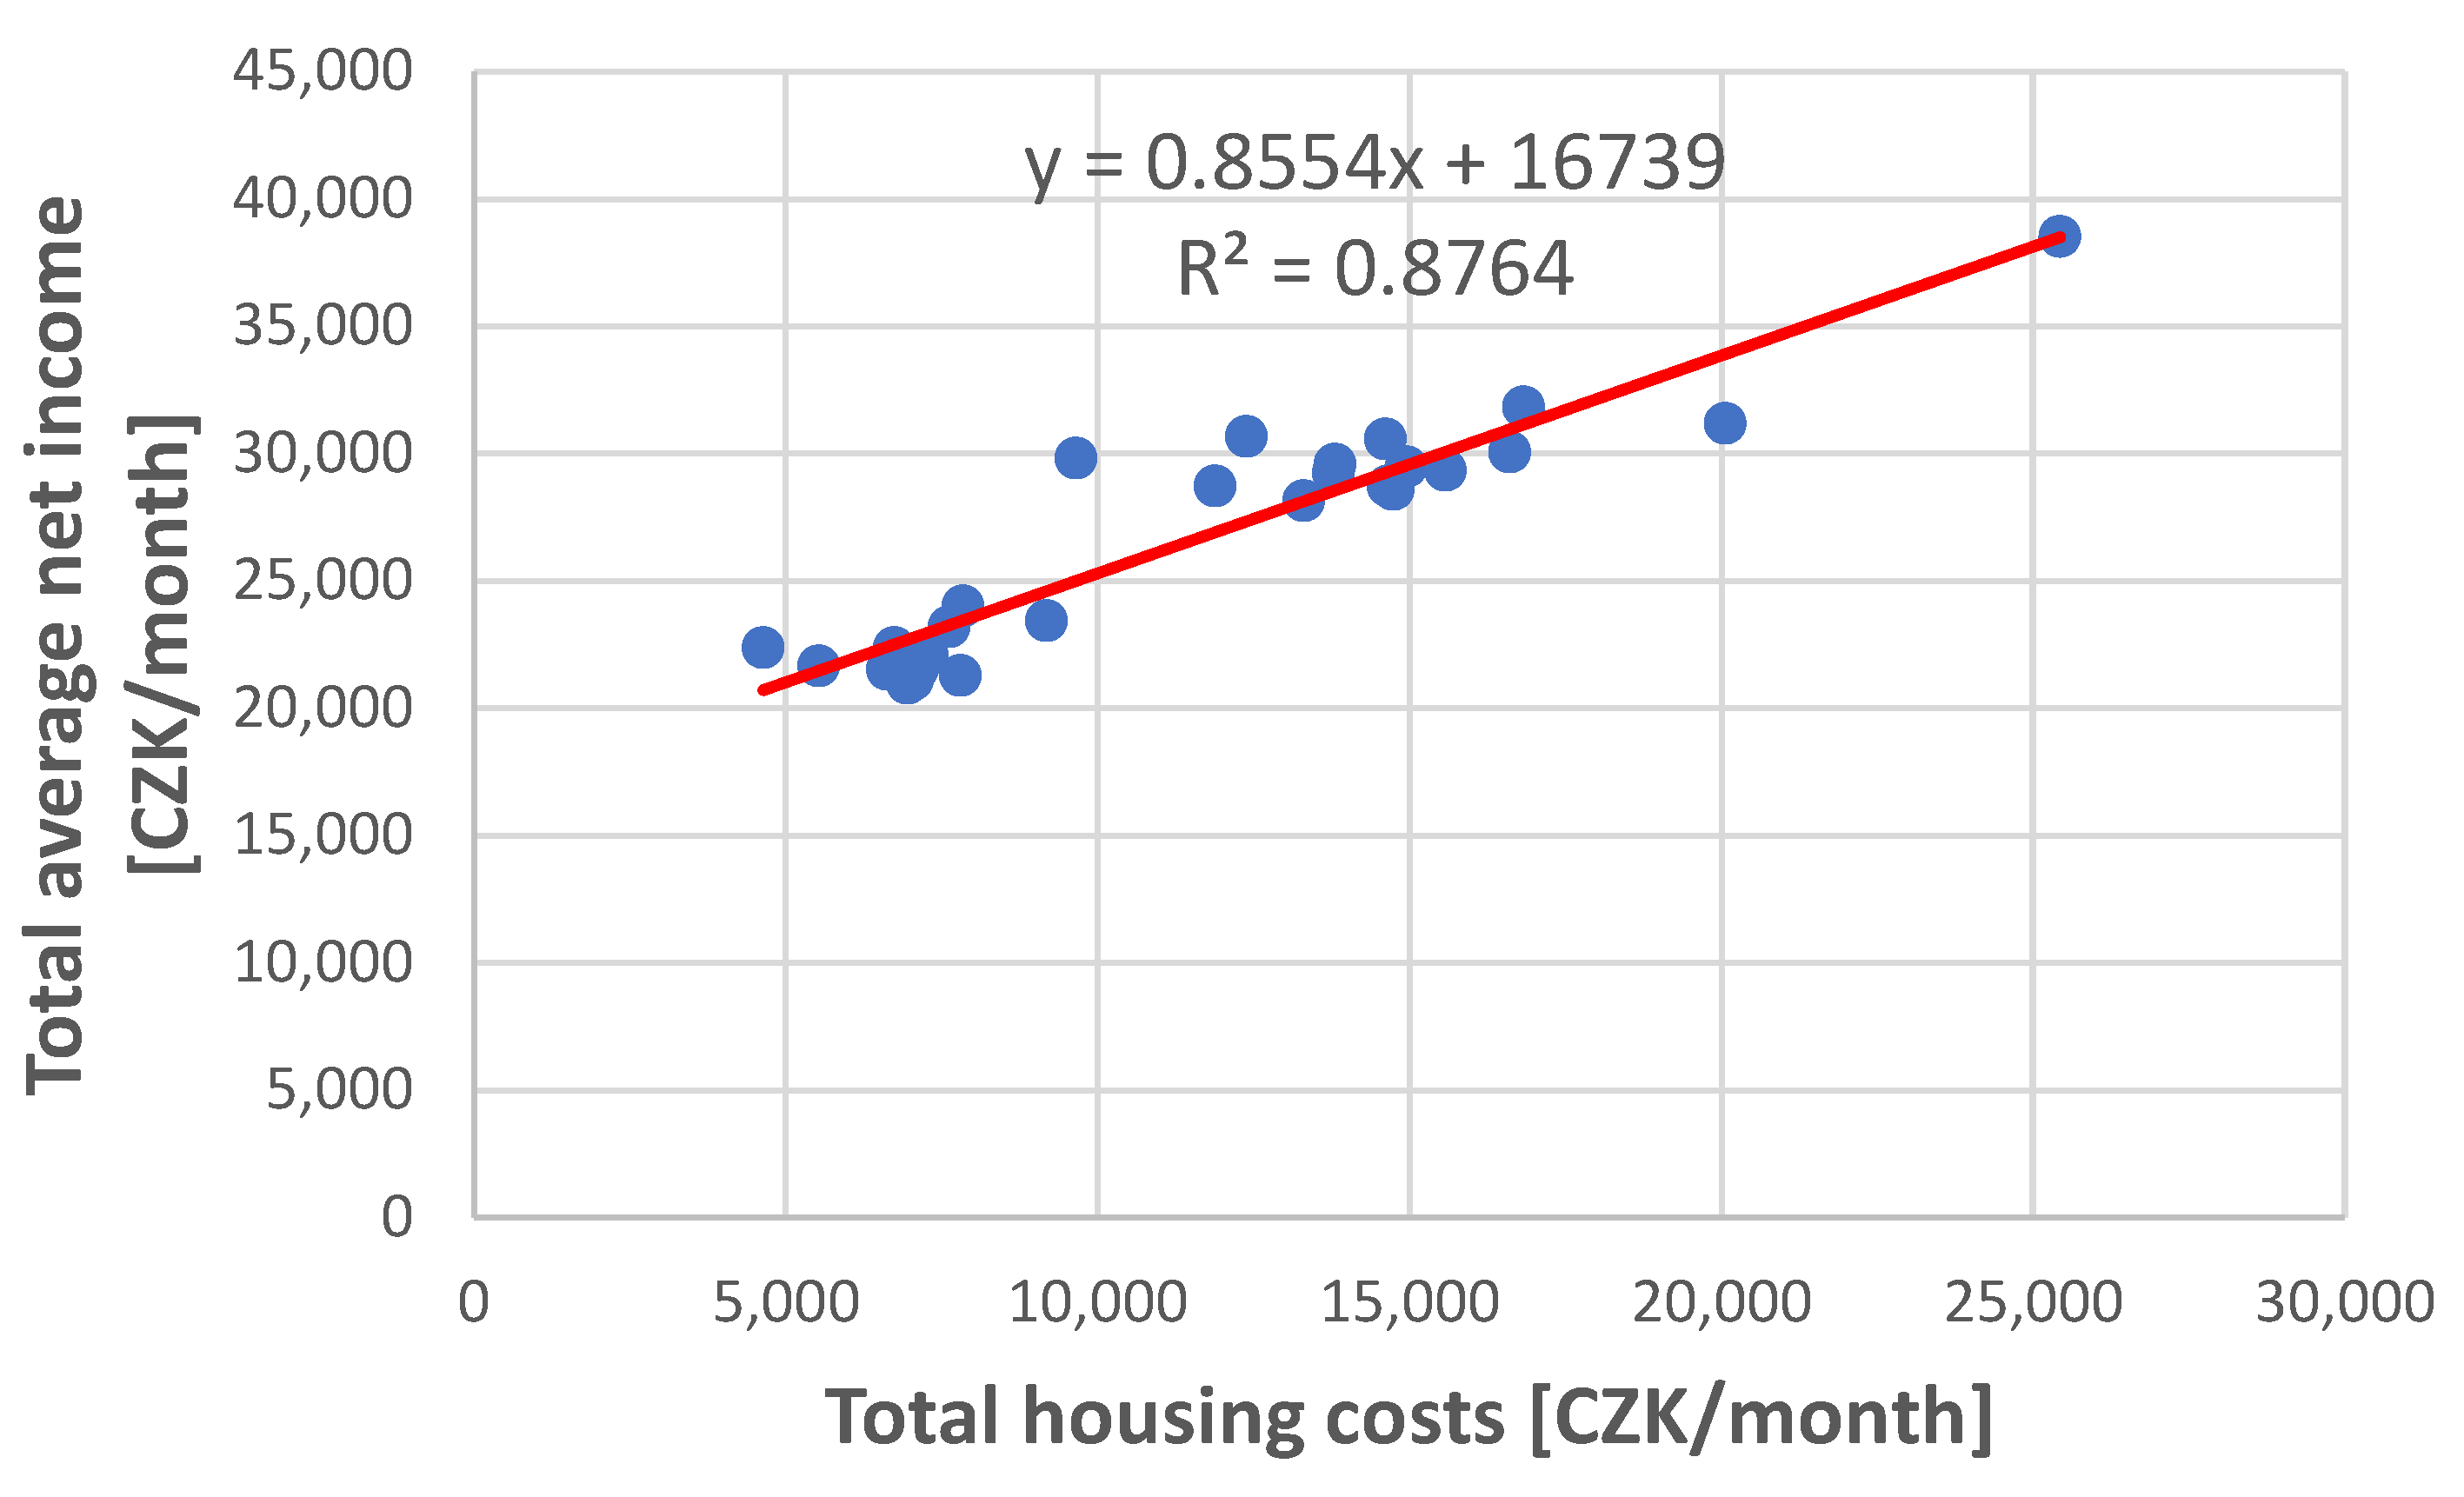
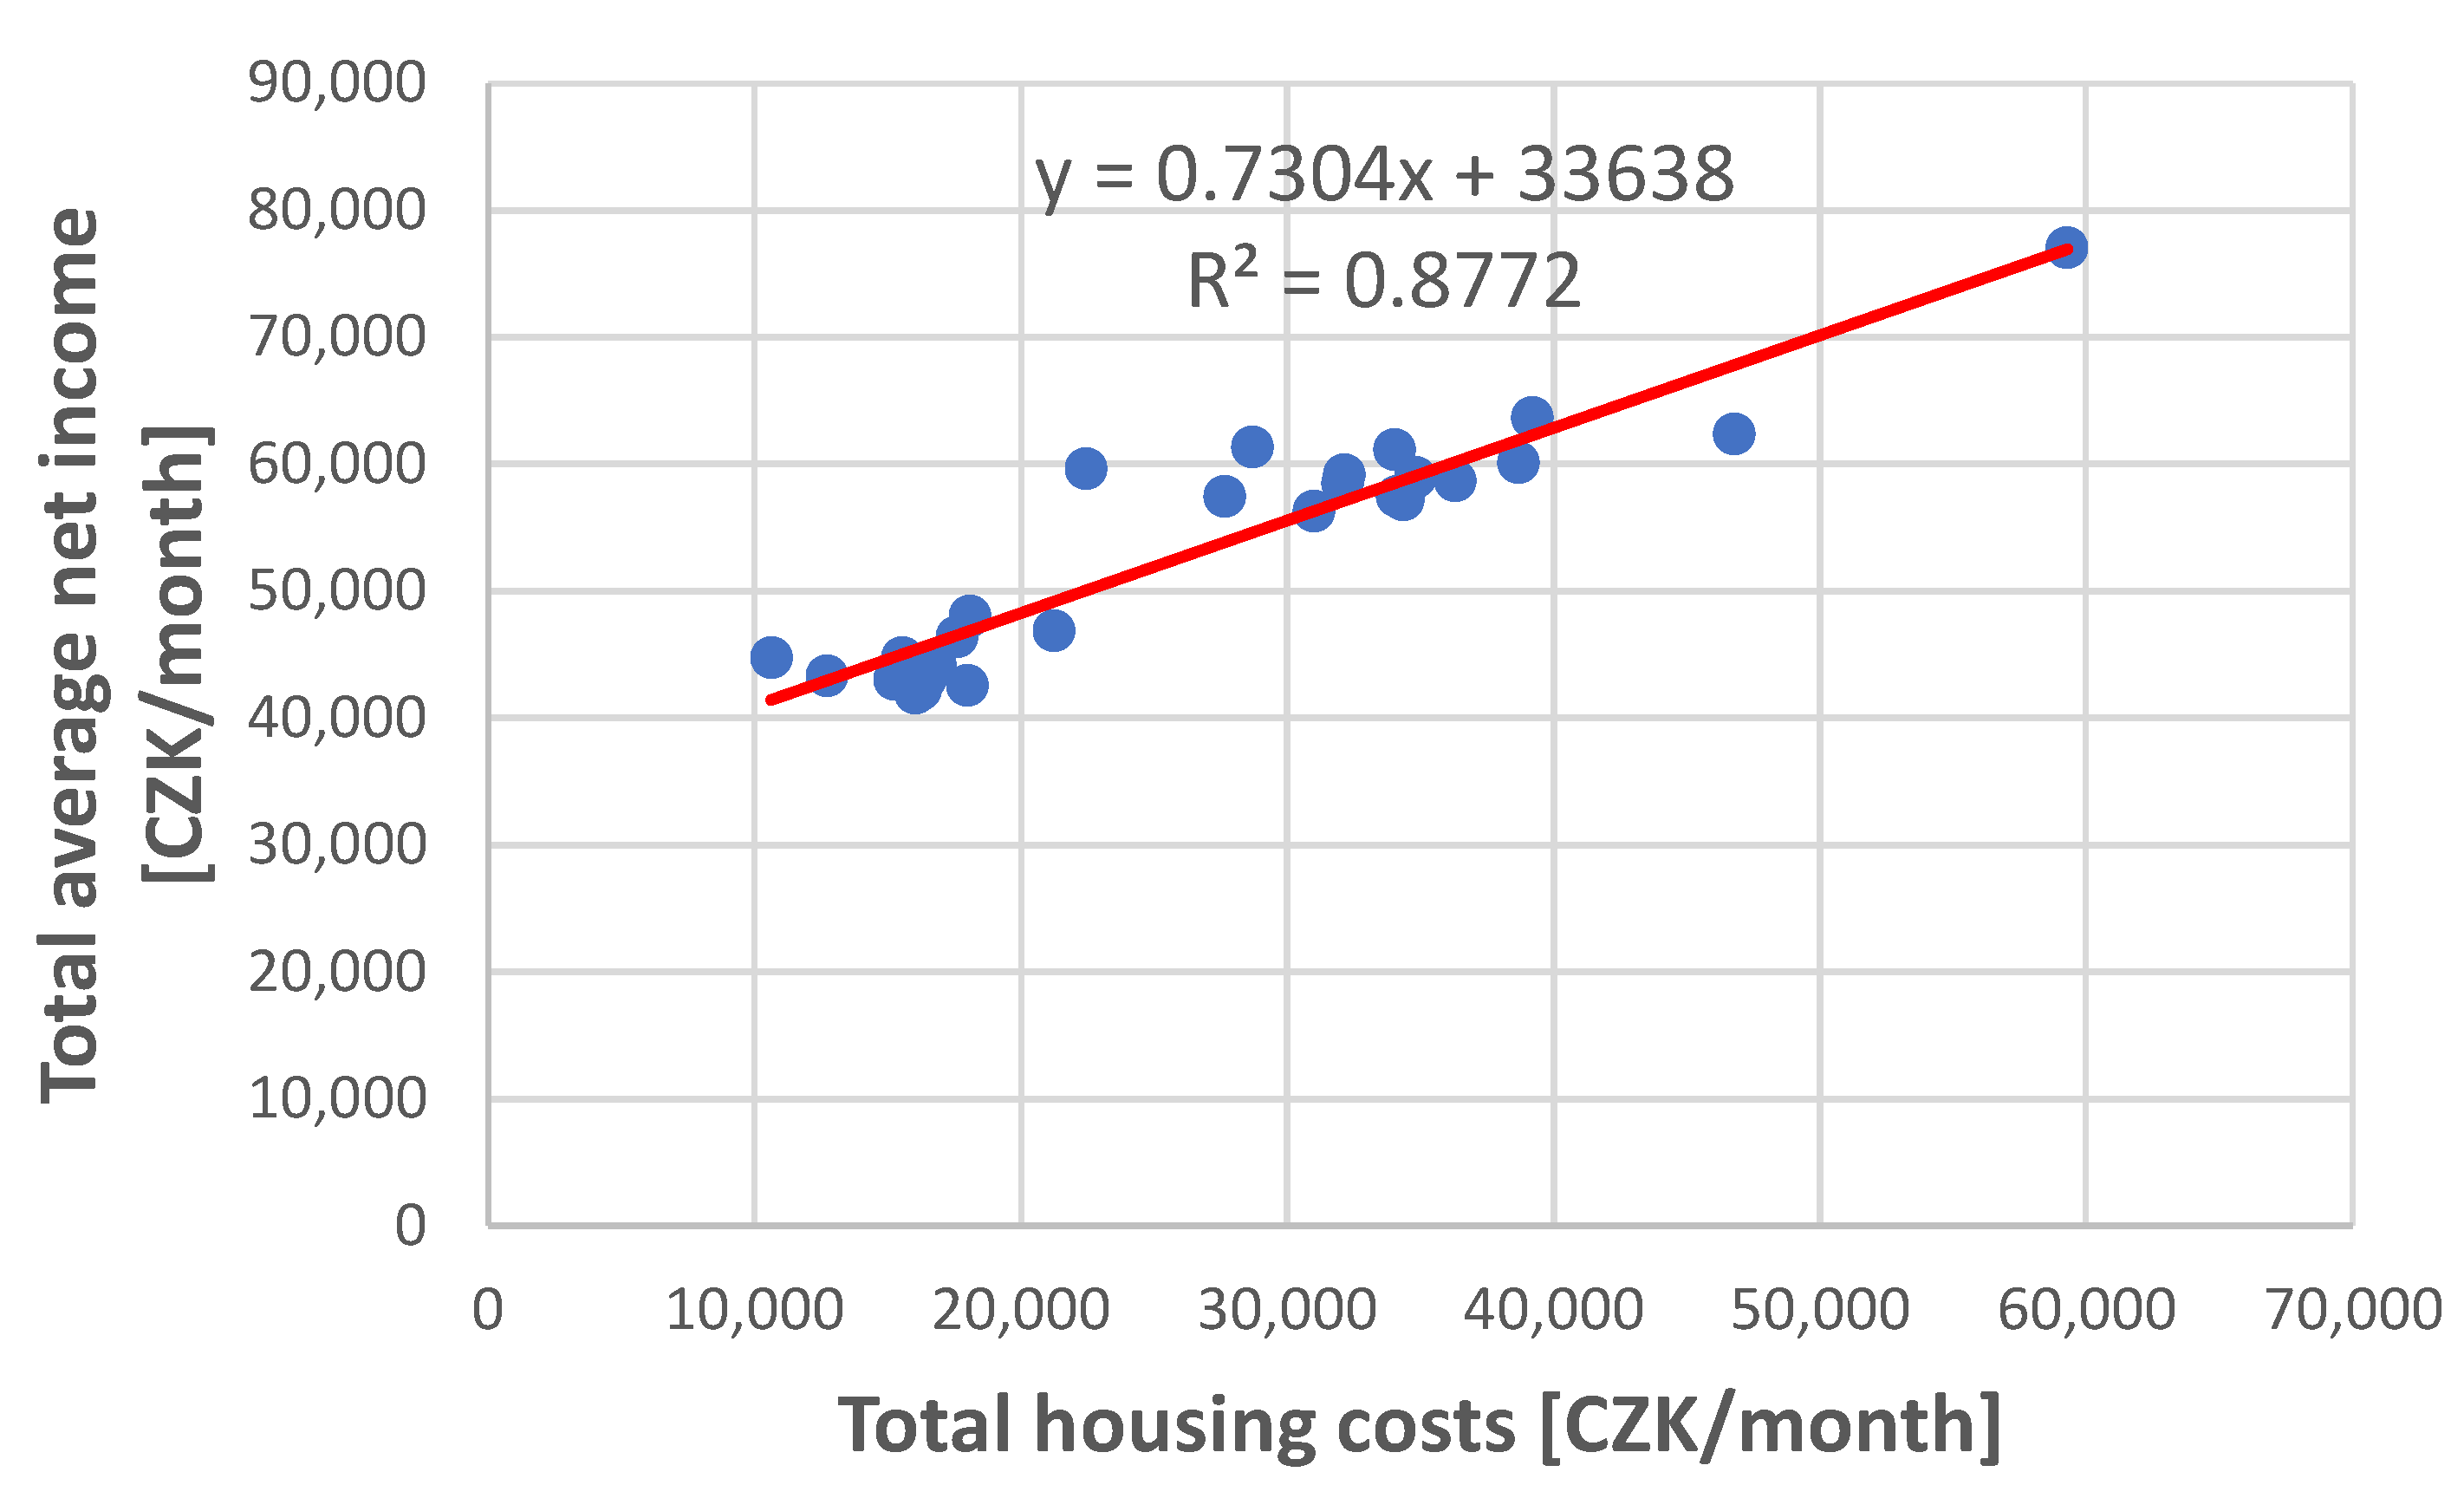
The Figure 2 and Figure 3 express a regression analysis of the relationship between total average net income and total housing costs. The Figure 2 describes the situation for an apartment with a floor area of 30 m2, the Figure 3 describes the situation for an apartment with a floor area of 70 m2. The analysis includes all regions in the Czech Republic as of January 2018 and January 2022.
A very significant dependence was found between the examined parameters, which is expressed by the coefficient of determination (0.8764; 0.8772). It has been found that lower-income households choose inferior housing and may be affected by energy and housing insufficiency or poverty. Inferior housing occurs in locations with poorer transport accessibility to employment and a limited supply of jobs. This dependence represents kind of a vicious circle, households hardly ever are able to move to a more expensive location in terms of housing with a better supply of jobs. These recent trends indicate an increased risk segregation of some areas or regions. It was also found that energy costs are comparable in all regions in the Czech Republic, which means that in regions with lower incomes, energy costs account for a higher percentage of total housing costs. The increase in energy costs thus represents a higher degree of burden for a poorer household than for a household in a richer region.
The regression proves that the lower income households may be considered the group most vulnerable by recent trends in housing affordability. It is this group which is facing a significant deterioration of housing affordability and energy poverty risk.
Alberini et al. [53] found that up to 17% of energy demanded by households in the US is consumed due to persistent inefficiencies, Andor et al. [54] calculated this value on German data to be equal to up to 20% and estimate on Swiss households’ data the electricity saving potential to 25% [55]. These results indicate that at least a share of household’s energy poverty may be improved by increasing efficiency of household’s appliances even though Orea et al. [56] argue that efficiency improvements are questionable due to rebound effects. The resulting policy recommendation is quite the opposite to what is currently discussed across the European governments—subsidies to households aimed to compensate increased energy prices and/or ”green“ energy production. The authors suggest rather policies aimed on increasing energy efficiency via incentives promoting a change of habits in the use of equipment, increasing energy literacy [57], and by offering incentives on the purchase of new, high-efficiency equipment and technologies. Andor et al. [54] recommend targeting such energy policy to selected groups as obviously a nationwide appliance of replacement program would result being too expensive. In this regard, Davis et al. [58] using the case of Mexican policy of subsidized replacement of household’s refrigerators and air conditioners with energy-efficient models demonstrates a rebound effect that counteracts some of the savings. On the other hand, Broadstock et al. [59] reveal that the wealthiest households exhibit the largest systematic behavioral shortcomings in residential electricity consumption. At the same time the price elasticity of demand for this group may be supposed to be less elastic than for the low-income households. This finding may represent a supporting argument for policy recommendation aimed to increasing energy literacy and changing habits rather than reducing tax on energy or compensating partly households’ energy bills.
5. Conclusions
This review sought to highlight how energy insecurity contributes to housing unaffordability and why it may be important for all aspects of daily life. Within this broader framework we can start to understand how policies that address energy insecurity also affect housing insecurity, education inequality, income inequality and poverty, and together impact population health.
We aimed at documenting an increasing role of energy spending in housing unaffordability. Using primary data related to recent changes in household energy and housing burdens we found evidence that between January 2018 and January 2022 there was a significant deterioration in the financial affordability of owner-occupied housing with the use of a mortgage loan. In January 2018, the critical limit of 40% (share of total housing costs to total average net household income) is exceeded only in the Prague region and for large flats also in the regions South-Moravian Region and Olomouc Region. In January 2022, however, the critical limit of 40% is exceeded in all regions of the Czech Republic with the exception of the Usti Region.
A number of studies indicate that if this limit exceeds 30%, the household is at risk of poverty, job loss and loss of housing. The results are thus very warning of social cohesion and social peace.
In response to this reality, the Chamber of Deputies of the Czech Republic is currently discussing an amendment to the Act on State Social Support under an accelerated regime. This amendment was approved by an absolute majority of deputies. This amendment significantly increases the normative housing costs which are paid by the state to poor households, so that the jump in energy prices that took place in the fourth quarter of 2021 can be taken into account. Normative housing costs are calculated as the average housing costs for the relevant number of persons in the household and taking into account the size of the municipality. Housing costs consist of rent and other housing-related costs, including energy. At the same time, this amendment expanded the number of persons who are entitled to housing allowance. Of course, finding a reasonable equilibrium between budget burden (already in deep deficits due to the COVID pandemic) and housing and energy policies is among the biggest current challenges for many governments.
Due to the discussed reduction in the affordability of owner-occupied housing, an expansion of the rental sector and an increase in rental prices can be expected. In the Czech Republic, the view of acceptance by the general public no longer holds that it is more financially advantageous to repay a mortgage on one’s own apartment than to pay rent to a landlord. At present, it is clearly cheaper to live in a rented flat, especially in large cities. In the Czech Republic, there is currently a significant predominance of owner-occupied housing over rental housing in comparison with developed Western European countries [60]. However, in the next period, the trend is likely to change, and the share of rental housing will increase in line with trends in Western Europe, and, at the same time, flat sharing and multifamily housing will become a new standard of living.
The study examined the effects of financial unavailability of owner-occupied housing only for the city of Prague and for an apartment with a floor area of 30 m2 and 70 m2. In further research, the authors want to focus on the analysis of the situation in other regions of the Czech Republic and other real estate categories (family houses, building plots). It can be expected that the impacts will be strongly dependent on the average price level of the purchase price of an apartment in a given region, in relation to the average level of household income in a given region. It was found that the differences in the price level of the purchase price of an apartment are significantly higher in individual regions than the average level of household income in individual regions.
Author Contributions
Conceptualization, K.Č. and E.H.; methodology, K.Č.; software, E.H.; validation, K.Č. and E.H.; formal analysis, K.Č.; investigation, K.Č. and E.H.; resources, E.H.; data curation, E.H.; writing—original draft preparation, K.Č. and E.H.; writing—review and editing, K.Č.; visualization, E.H.; supervision, K.Č. and E.H.; project administration, K.Č.; funding acquisition, K.Č. and E.H. All authors have read and agreed to the published version of the manuscript.
Funding
This research was funded by grant VŠE IGS F5/2/2018.
Institutional Review Board Statement
Not applicable.
Informed Consent Statement
Not applicable.
Data Availability Statement
Publicly available data were used in this study. This data can be found here: https://www.sreality.cz/.
Conflicts of Interest
The authors declare no conflict of interest.
References
- Hromada, E.; Cermakova, K. Financial unavailability of housing in the Czech Republic and recommendations for its solution. Int. J. Econ. Sci. 2021, 10, 47–57. [Google Scholar] [CrossRef]
- Ouechtati, I. Institutions and foreign direct investment: A Panel VAR approach. Int. J. Econ. Sci. 2020, 9, 55–70. [Google Scholar] [CrossRef]
- Jasova, E.; Cermakova, K.; Kaderabkova, B.; Prochazka, P. Působení institucionálních faktorů na strukturální a cyklickou nezaměstnanost v zemích Visegrádské skupiny. Politická Ekon. 2016, 64, 34–50. [Google Scholar] [CrossRef] [Green Version]
- Cermakova, K.; Prochazka, P.; Kurekova, L.; Rotschedl, J. Do Institutions Influence Economic Growth? Prague Econ. Pap. 2020, 29, 672–687. [Google Scholar] [CrossRef]
- Cecrdlova, A. Symmetric Behaviour to Fulfil the Main Objective as the Basis for the Credibility of Central Banks Behaviour on the Example of CNB. Int. J. Econ. Sci. 2020, 9, 68–82. [Google Scholar] [CrossRef]
- Andelinović, M.; Pavković, A.; Valentić, L. Equity Fund Performance and Sector Diversification. Int. J. Econ. Sci. 2020, 9, 25–43. [Google Scholar] [CrossRef]
- Kliber, P.; Rutkowska-Ziarko, A. Portfolio choice with a fundamental criterion—An algorithm and practical application—A computation methods and empirical analysis. Int. J. Econ. Sci. 2021, 10, 39–52. [Google Scholar] [CrossRef]
- Cecrdlova, A. Comparison of the Approach of the Czech National Bank and the European Central Bank to the Effects of the Global Financial Crisis. Int. J. Econ. Sci. 2021, 10, 18–46. [Google Scholar] [CrossRef]
- Jasova, E.; Kaderabkova, B. Ambiguous effects of minimum wage tool of labour markets regulation—Key study of V4 countries. Int. J. Econ. Sci. 2021, 10, 58–85. [Google Scholar] [CrossRef]
- Morningstar, R.L.; Simonyi, A.; Khakova, O.; Gordon, J.T. The European Green Deal Presents Opportunities and Obstacles to Cooperation in the Energy Space. In European Energy Security and the Critical Role of Transatlantic Energy Cooperation: Final Report and Recommendations; Atlantic Council: Washington, DC, USA, 2020; pp. 20–22. Available online: http://0-www-jstor-org.brum.beds.ac.uk/stable/resrep24587.9 (accessed on 15 January 2022).
- Strielkowski, W.; Mirvald, M.; Pedersen, M. Energy Integration in European Power Sector. Int. J. Energy Econ. Policy 2014, 4, 506–515. Available online: http://www.econjournals.com/index.php/ijeep/article/view/895 (accessed on 18 January 2022).
- Malecek, P. Effects of Demographic Structure in Growth and Labour Market Decompositions. Int. J. Econ. Sci. 2021, 10, 103–113. [Google Scholar] [CrossRef]
- Rotschedl, J.; Mitwallyova, H. Study of Intertemporal Discounting According to Age Groups. Int. J. Econ. Sci. 2021, 10, 126–139. [Google Scholar] [CrossRef]
- Kaderabkova, B.; Jasova, E. Development of real unit wage costs on the macro- and mezo-level of the Czech Republic. Int. J. Econ. Sci. 2019, 8, 45–59. [Google Scholar]
- Kaderabkova, B.; Jasova, E.; Holman, R. Analysis of substitution changes in the Phillips curve in V4 countries over the course of economic cycles. Int. J. Econ. Sci. 2020, 9, 39–54. [Google Scholar] [CrossRef]
- Kaderabkova, B.; Jasova, E. Comparation of the economic cycle on labour market in the construction industry and in the national economy of the Czechia. Civ. Eng. J. Staveb. Obz. 2020, 29, 272–279. [Google Scholar] [CrossRef]
- Heralova, R.S. Life Cycle Costing as an Important Contribution to Feasibility Study in Construction Projects. Procedia Eng. 2017, 196, 565–570. [Google Scholar] [CrossRef]
- Karásek, J.; Pojar, J.; Kaločai, L.; Heralová, R.S. Cost optimum calculation of energy efficiency measures in the Czech Republic. Energy Policy 2018, 123, 155–166. [Google Scholar] [CrossRef]
- Hromada, E.; Vitasek, S.; Holcman, J.; Heralova, R.S.; Krulicky, T. Residential Construction with a Focus on Evaluation of the Life Cycle of Buildings. Buildings 2021, 11, 524. [Google Scholar] [CrossRef]
- Hernández, D. Affording Housing at the Expense of Health. J. Fam. Issues 2016, 37, 921–946. [Google Scholar] [CrossRef] [PubMed] [Green Version]
- Borgersen, T.A. Social Housing Policy In A Segmented Housing Market: Indirect Effects On Markets And On Individuals. Int. J. Econ. Sci. 2019, 8, 1–21. [Google Scholar] [CrossRef] [Green Version]
- Kalinowski, S.; Wyduba, W. Rural poverty in Poland between the wars. Rural Hist. 2021, 32, 217–232. [Google Scholar] [CrossRef]
- Tundys, B.; Bretyn, A.; Urbaniak, M. Energy Poverty and Sustainable Economic Development: An Exploration of Correlations and Interdependencies in European Countries. Energies 2021, 14, 7640. [Google Scholar] [CrossRef]
- Recalde, M.; Peralta, A.; Oliveras, L.; Tirado-Herrero, S.; Borrell, C.; Palència, L.; Gotsens, M.; Artazcoz, L.; Marí-Dell’Olmo, M. Structural energy poverty vulnerability and excess winter mortality in the European Union: Exploring the association between structural determinants and health. Energy Policy 2019, 133, 110869. [Google Scholar] [CrossRef]
- Łuczak, A.; Kalinowski, S. Assessing the level of the material deprivation of European Union countries. PLoS ONE 2020, 15, e0238376. [Google Scholar] [CrossRef]
- Birol, F. Energy Economics: A Place for Energy Poverty in the Agenda? Energy J. 2007, 28, 1–6. [Google Scholar] [CrossRef] [Green Version]
- Szilagyiova, S. Exploitation of payday loan users: Fact or fiction? Int. J. Econ. Sci. 2019, 8, 127–147. [Google Scholar] [CrossRef]
- Rakauskiene, O.G.; Servetkiene, V.; Volodzkiene, L. Assessment of Wealth diversity. Int. J. Econ. Sci. 2019, 8, 106–130. [Google Scholar] [CrossRef]
- Tverdostup, M.; Paas, T. Skills heterogeneity and immigrant-native wage gap in the European countries. Int. J. Econ. Sci. 2018, 7, 119–142. [Google Scholar] [CrossRef]
- Wisner, B.; Blaikie, P.; Cannon, T.; Davis, I. At Risk: Natural Hazards, People’s Vulnerability, and Disasters; Routledge: London, UK, 2006; p. 7. ISBN 9780415252164. [Google Scholar]
- Fothergill, A.; Peek, L. Poverty and disasters in the United States: A review of recent sociological findings. Nat. Hazards 2004, 32, 89–110. [Google Scholar] [CrossRef]
- Cartalis, C.; Synodinou, A.; Proedrou, M.; Tsangrassoulis, A.; Santamouris, M. Modifications in energy demand in urban areas as a result of climate changes: An assessment for the southeast Mediterranean region. Energy Convers Manag. 2001, 42, 1647–1656. [Google Scholar] [CrossRef]
- Pala, A. The Relation between Climate Change and Economic Growth: The Investigation the Regional Differences with RCM Model in EU-28 Countries. Int. J. Econ. Sci. 2020, 9, 135–155. [Google Scholar] [CrossRef]
- Stanimir, A. Generation Y on labour market—Perception of work values and quality of job. Int. J. Econ. Sci. 2020, 9, 202–223. [Google Scholar] [CrossRef]
- Sokołowski, J.; Frankowski, J.; Lewandowski, P. Energy Poverty, Housing Conditions, and Self-Assessed Health: Evidence from Poland; IBS Working Paper; IBS: Warsaw, Poland, 2020. [Google Scholar] [CrossRef]
- Jessel, S.; Sawyer, S.; Hernández, D. Energy, Poverty, and Health in Climate Change: A Comprehensive Review of an Emerging Literature. Front. Public Health 2019, 12, 357. [Google Scholar] [CrossRef] [Green Version]
- Kopp, J.; Kurekova, L.; Hejdukova, P.; Vogt, D.; Hejduk, T. Relationships between Insufficient Drinking Water Supply and the Socio-Economic Development of Small Municipalities: Mayors’ Opinions from the Czech Republic. Water 2021, 13, 2098. [Google Scholar] [CrossRef]
- America’s Health Rankings Analysis of U.S. Department of Housing and Urban Development, Comprehensive Housing Affordability Strategy, United Health Foundation. Available online: AmericasHealthRankings.org (accessed on 20 January 2022).
- Neethu, L.; Helan, A.P. The Health Issues and Problems Faced by returnees from Gulf Countries in Kerkala. Int. J. Econ. Sci. 2021, 10, 71–83. [Google Scholar] [CrossRef]
- Kurekova, L.; Hejdukova, P. Multilevel research of migration with a focus on internal migration. Int. J. Econ. Sci. 2021, 10, 86–102. [Google Scholar] [CrossRef]
- Son Ch, H. The Effects of Retirement on Health-Related Quality of Life of Retirement-Aged Adults for Four Marital Status Subgroups. Int. J. Econ. Sci. 2020, 9, 179–201. [Google Scholar] [CrossRef]
- Pollack, C.E.; Griffin, B.A.; Lynch, J. Housing Affordability and Health Among Homeowners and Renters. Am. J. Prev. Med. 2010, 39, 515–521. [Google Scholar] [CrossRef]
- Hernández, D. Understanding ‘energy insecurity’ and why it matters to health. Soc. Sci. Med. 2016, 167, 1–10. [Google Scholar] [CrossRef] [Green Version]
- Agyeman, J.; Evans, T. Toward Just Sustainability in Urban Communities: Building Equity Rights with Sustainable Solutions. Ann. Am. Acad. Political Soc. Sci. 2003, 590, 35–53. [Google Scholar] [CrossRef]
- Dowler, E.; Spencer, N. Challenging Health Inequalities: From Acheson to Choosing Health. Policy Press at the University of Bristol. Available online: http://0-www-jstor-org.brum.beds.ac.uk/stable/j.ctt9qgvbt (accessed on 20 January 2022).
- Marmot Review Team and Friends of the Earth the Health Impacts of Cold Homes and Fuel Poverty; Friends of the Earth and the Marmot Review Team: London, UK, 2011.
- Krieger, J.; Higgins, D.L. Housing and health: Time again for public health action. Am. J. Public Health 2002, 92, 758–768. [Google Scholar] [CrossRef] [PubMed]
- Czech Statistical Office. Available online: https://www.czso.cz/csu/czso/regionalni_casove_rady (accessed on 20 January 2022).
- Hernandez, D.; Phillips, D.; Siegel, E.L. Exploring the housing and household energy pathways to stress: A mixed methods study. Int. J. Environ. Res. Public Health 2016, 13, 916. [Google Scholar] [CrossRef] [Green Version]
- Bednar, O. The Causal Impact of the Rapid Czech Interest Rate Hike on the Czech Exchange Rate Assessed by the Bayesian Structural Time Series Model. Int. J. Econ. Sci 2021, 10, 1–17. [Google Scholar] [CrossRef]
- Average Wages—1st Quarter 2018; The Czech Statistical Office: Prague, Czech Republic, 2022; Available online: https://www.czso.cz/csu/czso/cri/prumerne-mzdy-1-ctvrtleti-2018 (accessed on 11 January 2022).
- Fincentrum Hypoindex—Development; Fincentrum Hypoindex: Prague, Czech Republic, 2022; Available online: https://www.hypoindex.cz/hypoindex-vyvoj/ (accessed on 11 January 2022).
- Alberini, A.; Massimo, F. Transient and Persistent Energy Efficiency in the US Residential Sector: Evidence from Household-level Data (4 September 2015). Available online: https://ssrn.com/abstract=2655970 (accessed on 30 January 2022). [CrossRef] [Green Version]
- Andor, M.A.; Bernstein, D.H.; Sommer, S. Determining the efficiency of residential electricity consumption. Empir. Econ. 2021, 60, 2897–2923. [Google Scholar] [CrossRef]
- Boogen, N. Estimating the potential for electricity savings in households. Energy Econ. 2017, 63, 288–300. [Google Scholar] [CrossRef]
- Orea, L.; Llorca, M.; Filippini, M. A new approach to measuring the rebound effect associated to energy efficiency improvements: An application to the US residential energy demand. Energy Econ. 2015, 49, 599–609. [Google Scholar] [CrossRef] [Green Version]
- Blasch, J.E.; Boogen, N.; Filippini, M.; Kumar, N. The Role of Energy and Investment Literacy for Residential Electricity Demand and End-Use Efficiency; CER-ETH Economics Working Paper Series; CER-ETH—Center of Economic Research at ETH Zurich: Zurich, Switzerland, 2017; Volume 17. [Google Scholar]
- Davis, L.W.; Fuchs, A.; Gertler, P. Cash for Coolers: Evaluating a Large-Scale Appliance Replacement Program in Mexico. Am. Econ. J. Econ. Policy 2014, 6, 207–238. [Google Scholar] [CrossRef] [Green Version]
- Broadstock, D.C.; Li, J.; Zhang, D. Efficiency snakes and energy ladders: A (meta-)frontier demand analysis of electricity consumption efficiency in Chinese households. Energy Policy 2016, 91, 383–396. [Google Scholar] [CrossRef] [Green Version]
- Hromada, E.; Čermáková, K.; Krulický, T.; Machová, V.; Horák, J.; Mitwallyova, H. Labour Market and Housing Unavailability: Implications for Regions Affected by Coal Mining. Acta Montan. Slovaca 2021, 26, 404–414. [Google Scholar] [CrossRef]
Figure 1.
Average (2000–2021) flat price across Czech regions, measured in thousands of CZK of 1 m2, data source [49].
Figure 1.
Average (2000–2021) flat price across Czech regions, measured in thousands of CZK of 1 m2, data source [49].

Figure 2.
Regression analysis describing the dependence between total average net income and total housing costs for an apartment with a floor area of 30 m2.
Figure 2.
Regression analysis describing the dependence between total average net income and total housing costs for an apartment with a floor area of 30 m2.

Figure 3.
Regression analysis describing the dependence between total average net income and total housing costs for an apartment with a floor area of 70 m2.
Figure 3.
Regression analysis describing the dependence between total average net income and total housing costs for an apartment with a floor area of 70 m2.


Table 1.
Comparison of affordability of owner-occupied housing between January 2018 and January 2022 for an apartment with a floor area of 30 m2.
Table 1.
Comparison of affordability of owner-occupied housing between January 2018 and January 2022 for an apartment with a floor area of 30 m2.
| Region | State of January 2018 | State of January 2022 | ||||
|---|---|---|---|---|---|---|
| Average Purchase Price of the Apartment (CZK) | Number of Years Needed to Save an Amount to Buy an Apartment | Average Monthly Mortgage Payment (CZK) | Average Purchase Price of the Apartment (CZK) | Number of Years Needed to Save an Amount to Buy an Apartment | Average Monthly Mortgage Payment (CZK) | |
| Prague | 2,333,333 | 6.0 | 8955 | 3,927,514 | 8.1 | 20,370 |
| Central Bohemian Region | 1,148,972 | 3.8 | 4410 | 2,269,091 | 5.6 | 11,768 |
| South Bohemian Region | 832,836 | 3.1 | 3196 | 2,028,000 | 5.5 | 10,518 |
| Pilsen Region | 1,093,144 | 3.7 | 4195 | 1,841,667 | 4.8 | 9552 |
| Karlovy Vary Region | 918,439 | 3.5 | 3525 | 1,590,000 | 4.5 | 8246 |
| Usti Region | 315,000 | 1.1 | 1209 | 883,948 | 2.3 | 4584 |
| Liberec region | 863,547 | 3.1 | 3314 | 1,906,606 | 5.1 | 9888 |
| Hradec Kralove Region | 1,002,333 | 3.6 | 3847 | 2,225,400 | 5.9 | 11,542 |
| Pardubice Region | 961,538 | 3.5 | 3690 | 1,850,319 | 5.1 | 9596 |
| Highlands Region | 899,571 | 3.2 | 3452 | 1,685,517 | 4.5 | 8742 |
| South-Moravian Region | 1,500,000 | 5.1 | 5757 | 2,893,548 | 7.3 | 15,007 |
| Olomouc Region | 1,138,276 | 4.2 | 368 | 1,680,697 | 4.6 | 8717 |
| Zlín Region | 939,737 | 3.5 | 3607 | 1,866,800 | 5.2 | 9682 |
| Moravian-Silesian Region | 548,567 | 2.0 | 2105 | 1,314,386 | 3.6 | 6817 |
Table 2.
Comparison of affordability of owner-occupied housing between January 2018 and January 2022 for an apartment with a floor area of 70 m2.
Table 2.
Comparison of affordability of owner-occupied housing between January 2018 and January 2022 for an apartment with a floor area of 70 m2.
| Region | State of January 2018 | State of January 2022 | ||||
|---|---|---|---|---|---|---|
| Average Purchase Price of the Apartment (CZK) | Number of Years Needed to Save an Amount to Buy an Apartment | Average Monthly Mortgage Payment (CZK) | Average Purchase Price of the Apartment (CZK) | Number of Years Needed to Save an Amount to Buy an Apartment | Average Monthly Mortgage Payment (CZK) | |
| Prague | 5,444,444 | 14.0 | 20,895 | 9,164,199 | 18.8 | 47,529 |
| Central Bohemian Region | 2,680,935 | 8.8 | 10,289 | 5,294,545 | 13.2 | 27,460 |
| South Bohemian Region | 1,943,284 | 7.2 | 7458 | 4,732,000 | 12.8 | 24,542 |
| Pilsen Region | 2,550,669 | 8.7 | 9789 | 4,297,222 | 11.1 | 22,287 |
| Karlovy Vary Region | 2,143,024 | 8.1 | 8224 | 3,710,000 | 10.4 | 19,241 |
| Usti Region | 735,000 | 2.6 | 2821 | 2,062,545 | 5.5 | 10,697 |
| Liberec region | 2,014,942 | 7.1 | 7733 | 4,448,748 | 12.0 | 23,073 |
| Hradec Kralove Region | 2,338,778 | 8.4 | 8976 | 5,192,600 | 13.7 | 26,931 |
| Pardubice Region | 2,243,590 | 8.2 | 8610 | 4,317,410 | 11.9 | 22,392 |
| Highlands Region | 2,099,000 | 7.5 | 8056 | 3,932,874 | 10.5 | 20,397 |
| South-Moravian Region | 3,500,000 | 11.8 | 13,432 | 6,751,613 | 17.1 | 35,016 |
| Olomouc Region | 2,655,977 | 9.9 | 10,193 | 3,921,627 | 10.6 | 20,339 |
| Zlín Region | 2,192,719 | 8.2 | 8415 | 4,355,867 | 12.1 | 22,591 |
| Moravian-Silesian Region | 1,279,989 | 4.7 | 4912 | 3,066,901 | 8.5 | 15,906 |
Table 3.
Comparison of the costs of energy consumption between January 2018 and January 2022 for an apartment with a floor area of 30 m2 (monthly costs).
Table 3.
Comparison of the costs of energy consumption between January 2018 and January 2022 for an apartment with a floor area of 30 m2 (monthly costs).
| State of January 2018 | State of January 2022 | |
|---|---|---|
| (CZK/Month) | (CZK/Month) | |
| Electricity consumption | 378 | 622 |
| Gas consumption for cooking | 20 | 37 |
| Gas consumption for water heating | 145 | 265 |
| Gas consumption for apartment heating | 407 | 745 |
| Depreciation of a gas boiler | 278 | 333 |
| Total costs of energy consumption | 1227 | 2002 |
Table 4.
Comparison of the costs of energy consumption between January 2018 and January 2022 for an apartment with a floor area of 70 m2 (monthly costs).
Table 4.
Comparison of the costs of energy consumption between January 2018 and January 2022 for an apartment with a floor area of 70 m2 (monthly costs).
| State of January 2018 | State of January 2022 | |
|---|---|---|
| (CZK/Month) | (CZK/Month) | |
| Electricity consumption | 1134 | 1865 |
| Gas consumption for cooking | 59 | 107 |
| Gas consumption for water heating | 400 | 730 |
| Gas consumption for apartment heating | 893 | 1630 |
| Depreciation of a gas boiler | 278 | 333 |
| Total costs of energy consumption | 2763 | 4665 |
Table 5.
Comparison of the operating costs associated with the use of the apartment between January 2018 and January 2022 for an apartment with a floor area of 30 m2 (monthly costs).
Table 5.
Comparison of the operating costs associated with the use of the apartment between January 2018 and January 2022 for an apartment with a floor area of 30 m2 (monthly costs).
| State of January 2018 | State of January 2022 | |
|---|---|---|
| (CZK/Month) | (CZK/Month) | |
| Electricity in common areas | 50 | 80 |
| Water and sewer rates | 500 | 650 |
| Cleaning in an apartment building | 70 | 120 |
| Garbage collection | 60 | 100 |
| Common television antenna | 10 | 15 |
| Total operating costs | 690 | 965 |
Table 6.
Comparison of the operating costs associated with the use of the apartment between January 2018 and January 2022 for an apartment with a floor area of 70 m2 (monthly costs).
Table 6.
Comparison of the operating costs associated with the use of the apartment between January 2018 and January 2022 for an apartment with a floor area of 70 m2 (monthly costs).
| State of January 2018 (CZK/Month) | State of January 2022 (CZK/Month) | |
|---|---|---|
| Electricity in common areas | 150 | 240 |
| Water and sewer rates | 1500 | 1950 |
| Cleaning in an apartment building | 210 | 360 |
| Garbage collection | 180 | 300 |
| Common television antenna | 30 | 45 |
| Total operating costs | 2070 | 2895 |
Table 7.
Comparison of the costs associated with property ownership between January 2018 and January 2022 for an apartment with a floor area of 30 m2 (monthly costs).
Table 7.
Comparison of the costs associated with property ownership between January 2018 and January 2022 for an apartment with a floor area of 30 m2 (monthly costs).
| State of January 2018 (CZK/Month) | State of January 2022 (CZK/Month) | |
|---|---|---|
| Apartment management costs | 180 | 220 |
| Equipment inspection costs | 150 | 200 |
| Insurance costs | 63 | 79 |
| Costs of the apartment building repair fund | 1050 | 1500 |
| Other operating costs | 65 | 95 |
| Total costs associated with property ownership | 1508 | 2094 |
Table 8.
Comparison of the costs associated with property ownership between January 2018 and January 2022 for an apartment with a floor area of 70 m2 (monthly costs).
Table 8.
Comparison of the costs associated with property ownership between January 2018 and January 2022 for an apartment with a floor area of 70 m2 (monthly costs).
| State of January 2018 (CZK/Month) | State of January 2022 (CZK/Month) | |
|---|---|---|
| Apartment management costs | 180 | 220 |
| Equipment inspection costs | 150 | 200 |
| Insurance costs | 96 | 115 |
| Costs of the apartment building repair fund | 2450 | 3500 |
| Other operating costs | 105 | 155 |
| Total costs associated with property ownership | 2981 | 4190 |
Table 9.
Share of total housing costs to total average net household income for an apartment with a floor area of 30 m2 as of January 2018. A one-member household with regular income is assumed.
Table 9.
Share of total housing costs to total average net household income for an apartment with a floor area of 30 m2 as of January 2018. A one-member household with regular income is assumed.
| Region | Average Monthly Mortgage Payment (CZK/Month) | Total Costs of Energy Consumption (CZK/Month) | Total Operating Costs (CZK/Month) | Total Costs Associated with Property Ownership (CZK/Month) | Total Housing Costs (CZK/Month) | Total Average Net Household Income (CZK/Month) | Share of Total Housing Costs to Total Average Net Household Income (%) |
|---|---|---|---|---|---|---|---|
| Prague | 8955 | 1227 | 690 | 1508 | 12,380 | 30,680 | 40.4% |
| Central Bohemian Region | 4410 | 1227 | 690 | 1508 | 7834 | 24,001 | 32.6% |
| South Bohemian Region | 3196 | 1227 | 690 | 1508 | 6621 | 21,504 | 30.8% |
| Pilsen Region | 4195 | 1227 | 690 | 1508 | 7620 | 23,191 | 32.9% |
| Karlovy Vary Region | 3525 | 1227 | 690 | 1508 | 6950 | 20,982 | 33.1% |
| Usti Region | 1209 | 1227 | 690 | 1508 | 4634 | 22,373 | 20.7% |
| Liberec region | 3314 | 1227 | 690 | 1508 | 6739 | 22,358 | 30.1% |
| Hradec Kralove Region | 3847 | 1227 | 690 | 1508 | 7272 | 22,045 | 33.0% |
| Pardubice Region | 3690 | 1227 | 690 | 1508 | 7115 | 21,553 | 33.0% |
| Highlands Region | 3452 | 1227 | 690 | 1508 | 6877 | 22,079 | 31.1% |
| South-Moravian Region | 5757 | 1227 | 690 | 1508 | 9182 | 23,424 | 39.2% |
| Olomouc Region | 4368 | 1227 | 690 | 1508 | 7793 | 21,279 | 36.6% |
| Zlín Region | 3607 | 1227 | 690 | 1508 | 7031 | 21,097 | 33.3% |
| Moravian-Silesian Region | 2105 | 1227 | 690 | 1508 | 5530 | 21,651 | 25.5% |
Note: Values that exceed 40% are marked in red. This is a critical financial limit, which indicates a significant financial unavailability of housing for households. The procedure is similar for the other tables below.
Table 10.
Share of total housing costs to total average net household income for an apartment with a floor area of 30 m2 as of January 2022. A one-member household with regular income is assumed.
Table 10.
Share of total housing costs to total average net household income for an apartment with a floor area of 30 m2 as of January 2022. A one-member household with regular income is assumed.
| Region | Average Monthly Mortgage Payment (CZK/Month) | Total Costs of Energy Consumption (CZK/Month) | Total Operating Costs (CZK/Month) | Total Costs Associated with Property Ownership (CZK/Month) | Total Housing Costs (CZK/Month) | Total Average Net Household Income (CZK/Month) | Share of Total Housing Costs to Total Average Net Household Income (%) |
|---|---|---|---|---|---|---|---|
| Prague | 20,370 | 2002 | 965 | 2094 | 25,430 | 38,517 | 66.0% |
| Central Bohemian Region | 11,768 | 2002 | 965 | 2094 | 16,829 | 31,834 | 52.9% |
| South Bohemian Region | 10,518 | 2002 | 965 | 2094 | 15,579 | 29,325 | 53.1% |
| Pilsen Region | 9552 | 2002 | 965 | 2094 | 14,612 | 30,578 | 47.8% |
| Karlovy Vary Region | 8246 | 2002 | 965 | 2094 | 13,307 | 28,132 | 47.3% |
| Usti Region | 4584 | 2002 | 965 | 2094 | 9645 | 29,823 | 32.3% |
| Liberec region | 9888 | 2002 | 965 | 2094 | 14,949 | 29,465 | 50.7% |
| Hradec Kralove Region | 11,542 | 2002 | 965 | 2094 | 16,603 | 30,064 | 55.2% |
| Pardubice Region | 9596 | 2002 | 965 | 2094 | 14,657 | 28,720 | 51.0% |
| Highlands Region | 8742 | 2002 | 965 | 2094 | 13,803 | 29,557 | 46.7% |
| South-Moravian Region | 15,007 | 2002 | 965 | 2094 | 20,068 | 31,180 | 64.4% |
| Olomouc Region | 8717 | 2002 | 965 | 2094 | 13,778 | 29,240 | 47.1% |
| Zlín Region | 9682 | 2002 | 965 | 2094 | 14,743 | 28,593 | 51.6% |
| Moravian-Silesian Region | 6817 | 2002 | 965 | 2094 | 11,878 | 28,717 | 41.4% |
Note: Values that exceed 40% are marked in red. This is a critical financial limit, which indicates a significant financial unavailability of housing for households. The procedure is similar for the other tables below.
Table 11.
Share of total housing costs to total average net household income for an apartment with a floor area of 70 m2 as of January 2018. A three-member household in which there are two people with a regular income is assumed.
Table 11.
Share of total housing costs to total average net household income for an apartment with a floor area of 70 m2 as of January 2018. A three-member household in which there are two people with a regular income is assumed.
| Region | Average Monthly Mortgage Payment (CZK/Month) | Total Costs of Energy Consumption (CZK/Month) | Total Operating Costs (CZK/Month) | Total Costs Associated with Property Ownership (CZK/Month) | Total Housing Costs (CZK/Month) | Total Average Net Household Income (CZK/Month) | Share of Total Housing Costs to Total Average Net Household Income (%) |
|---|---|---|---|---|---|---|---|
| Prague | 20,895 | 2763 | 2070 | 2981 | 28,709 | 61,359 | 46.8% |
| Central Bohemian Region | 10,289 | 2763 | 2070 | 2981 | 18,103 | 48,002 | 37.7% |
| South Bohemian Region | 7458 | 2763 | 2070 | 2981 | 15,272 | 43,009 | 35.5% |
| Pilsen Region | 9789 | 2763 | 2070 | 2981 | 17,603 | 46,382 | 38.0% |
| Karlovy Vary Region | 8224 | 2763 | 2070 | 2981 | 16,039 | 41,965 | 38.2% |
| Usti Region | 2821 | 2763 | 2070 | 2981 | 10,635 | 44,745 | 23.8% |
| Liberec region | 7733 | 2763 | 2070 | 2981 | 15,547 | 44,715 | 34.8% |
| Hradec Kralove Region | 8976 | 2763 | 2070 | 2981 | 16,790 | 44,091 | 38.1% |
| Pardubice Region | 8610 | 2763 | 2070 | 2981 | 16,425 | 43,106 | 38.1% |
| Highlands Region | 8056 | 2763 | 2070 | 2981 | 15,870 | 44,158 | 35.9% |
| South-Moravian Region | 13,432 | 2763 | 2070 | 2981 | 21,246 | 46,848 | 45.4% |
| Olomouc Region | 10,193 | 2763 | 2070 | 2981 | 18,007 | 42,558 | 42.3% |
| Zlín Region | 8415 | 2763 | 2070 | 2981 | 16,229 | 42,194 | 38.5% |
| Moravian-Silesian Region | 4912 | 2763 | 2070 | 2981 | 12,727 | 43,302 | 29.4% |
Note: Values that exceed 40% are marked in red. This is a critical financial limit, which indicates a significant financial unavailability of housing for households. The procedure is similar for the other tables below.
Table 12.
Share of total housing costs to total average net household income for an apartment with a floor area of 70 m2 as of January 2022. A three-member household in which there are two people with a regular income is assumed.
Table 12.
Share of total housing costs to total average net household income for an apartment with a floor area of 70 m2 as of January 2022. A three-member household in which there are two people with a regular income is assumed.
| Region | Average Monthly Mortgage Payment (CZK/Month) | Total Costs of Energy Consumption (CZK/Month) | Total Operating Costs (CZK/Month) | Total Costs Associated with Property Ownership (CZK/Month) | Total Housing Costs (CZK/Month) | Total Average Net Household Income (CZK/Month) | Share of Total Housing Costs to Total Average Net Household Income (%) |
|---|---|---|---|---|---|---|---|
| Prague | 47,529 | 4665 | 2895 | 4190 | 59,279 | 77,033 | 77.0% |
| Central Bohemian Region | 27,460 | 4665 | 2895 | 4190 | 39,210 | 63,668 | 61.6% |
| South Bohemian Region | 24,542 | 4665 | 2895 | 4190 | 36,292 | 58,649 | 61.9% |
| Pilsen Region | 22,287 | 4665 | 2895 | 4190 | 34,037 | 61,156 | 55.7% |
| Karlovy Vary Region | 19,241 | 4665 | 2895 | 4190 | 30,992 | 56,263 | 55.1% |
| Usti Region | 10,697 | 4665 | 2895 | 4190 | 22,447 | 59,646 | 37.6% |
| Liberec region | 23,073 | 4665 | 2895 | 4190 | 34,823 | 58,930 | 59.1% |
| Hradec Kralove Region | 26,931 | 4665 | 2895 | 4190 | 38,681 | 60,128 | 64.3% |
| Pardubice Region | 22,392 | 4665 | 2895 | 4190 | 34,142 | 57,439 | 59.4% |
| Highlands Region | 20,397 | 4665 | 2895 | 4190 | 32,148 | 59,115 | 54.4% |
| South-Moravian Region | 35,016 | 4665 | 2895 | 4190 | 46,767 | 62,360 | 75.0% |
| Olomouc Region | 20,339 | 4665 | 2895 | 4190 | 32,089 | 58,480 | 54.9% |
| Zlín Region | 22,591 | 4665 | 2895 | 4190 | 34,341 | 57,186 | 60.1% |
| Moravian-Silesian Region | 15,906 | 4665 | 2895 | 4190 | 27,656 | 57,434 | 48.2% |
Note: Values that exceed 40% are marked in red. This is a critical financial limit, which indicates a significant financial unavailability of housing for households. The procedure is similar for the other tables below.
Publisher’s Note: MDPI stays neutral with regard to jurisdictional claims in published maps and institutional affiliations. |
© 2022 by the authors. Licensee MDPI, Basel, Switzerland. This article is an open access article distributed under the terms and conditions of the Creative Commons Attribution (CC BY) license (https://creativecommons.org/licenses/by/4.0/).
Share and Cite
MDPI and ACS Style
Čermáková, K.; Hromada, E. Change in the Affordability of Owner-Occupied Housing in the Context of Rising Energy Prices. Energies 2022, 15, 1281. https://0-doi-org.brum.beds.ac.uk/10.3390/en15041281
AMA Style
Čermáková K, Hromada E. Change in the Affordability of Owner-Occupied Housing in the Context of Rising Energy Prices. Energies. 2022; 15(4):1281. https://0-doi-org.brum.beds.ac.uk/10.3390/en15041281
Chicago/Turabian StyleČermáková, Klára, and Eduard Hromada. 2022. "Change in the Affordability of Owner-Occupied Housing in the Context of Rising Energy Prices" Energies 15, no. 4: 1281. https://0-doi-org.brum.beds.ac.uk/10.3390/en15041281
Note that from the first issue of 2016, this journal uses article numbers instead of page numbers. See further details here.