Article

Ash Behaviour during Combustion of Agropellets Produced by an Agro-Industry—Part 2: Chemical Characterization of Sintering and Deposition

1
CIRCE Institute, University of Zaragoza, 50018 Zaragoza, Spain
2
CIRCE Foundation, Parque Empresarial Dinamiza, 50018 Zaragoza, Spain
*
Author to whom correspondence should be addressed.
Submission received: 28 December 2021 / Revised: 5 February 2022 / Accepted: 9 February 2022 / Published: 17 February 2022
(This article belongs to the Special Issue Energy Production from Biomass Valorization)

Abstract

:
Eight different pellets (one woody and seven blends of woody and herbaceous biomass) produced by an agro-industry were tested in a fixed-bed reactor to characterize their behaviour during their combustion process. The objective was to analyze the possible problems that could arise and, thus, achieve advances in the greater penetration of these agropellets in the energy market. The blends’ design and tests results are presented in the first part of this article. The results of the bottom ash and fly ash samples obtained from the combustion tests using SEM-EDS and P-XRD techniques were analyzed in order to delve into the sintering and deposition phenomena, respectively. Regarding the sintering, a clear relationship has been found between the results of the SEM-EDS analysis and the initial composition of the ash of the fuels. Additionally, the analysis of the results confirms a different ash behaviour regarding the sintering phenomenon depending on the ratio between the amounts of Si, Ca + Mg and K + Na. With respect to deposition, it has been determined that in woody pellets, showing the lower sintering degree, the predominant deposition mechanism is by inertial impact, while in blend pellets it is by condensation, which increases when the percentage of herbaceous in the mixture increases. It has been proved that, in order to compensate (at least partially) for the negative effect of the herbaceous components in the blends, working with a higher λ value is interesting, as it achieves a decrease in the combustion temperature (with λ >1), which implies both a decrease in the sintering degree and in the deposition, improving therefore the ash behaviour in the combustion of agropellets.

1. Introduction

The use of residual agricultural biomass, which could significantly contribute to help with the growing demand in the energy sector, is currently limited by the problems that this type of biomass presents during its conversion, especially the herbaceous type.
It is well known that during combustion, fuel ash undergoes physical and chemical transformations that give rise to their partitioning. A part of the ash components forms a solid fraction that accumulates in the grate (bottom ash) that can sinter and cause important problems in the facility [1,2,3]. The main phenomenon in the process of sintering is the formation of low-melting alkali metal silicates, mainly K, with which other elements such as alkaline earth metals, mainly Ca + Mg, can subsequently interact [4]. Another part volatilizes (principally related to alkali metal compounds) and can condense directly or be deposited, after the formation of aerosols, on the exchange surfaces of the boiler [4,5]. In addition, part of the solid particles can leave the bed by entrainment together with the combustion gases (coarse fly ash). These particles can also be deposited on the exchange surfaces through the mechanism of inertial impact. Both phenomena (vaporization and entrainment) can cause problems, as corrosion, erosion and deposition, that can reduce the useful life of the equipment and its performance [2,6]. It is very important, therefore, to know what the formation of one or another fraction depends on and to look for solutions that contribute to reduce the negative effect of each one of them.
In recent years, there has been numerous research focused in this direction. These research studies have pointed out the critical influence of the chemical composition of ash on its behaviour [1,4,7,8,9,10,11,12,13,14,15]. In this sense, in order to minimize these problems, which due to their characteristics affect more agricultural biomass, it is very common to resort to mixing [1,13,14,16,17,18], both herbaceous and woody and with forest biomass. The AGROinLOG Project [19] focuses on the transformation of agro-industries into Integrated Biomass Logistic Centers (IBLCs) to avoid seasonality by means of exploiting their own residues or those from nearby areas in order to create a new business line. Among the demo sites developed in the project, a fodder industry in which blended agropellets were produced based on herbaceous and forestry biomass was selected. In the framework of the project, these agropellets were selected though a traceability assessment [20] and tested in a lab-scale grate reactor to analyze how the blending contributed to mitigate problems related to herbaceous biomass ash and the influence of its chemical composition and operation conditions.
From these test series, extensive research was performed and the results have been divided into two papers. The results of the first paper [20] based on the experimental combustion tests results showed clear correlations between the sintering degree (percentage of sintering fraction with respect to total fuel ash) and the Si and Ca + Mg content in fuel ash which, in turn, are related to the percentage of herbaceous in the blend. Regarding deposition, the deposition rate (amount of ash deposited per area unit and time) was obtained and found to be lower in woody pellets compared to agropellets.
Even though adequate combustion performance was achieved for a wide range of excess air, a high sintering degree and deposition rate were detected. Taking into account the problems that both can cause, and to continue delving into the different partitioning phenomena, this second paper goes one step further by characterizing the ash samples collected during the tests. For that, two different analytical techniques were used: Scanning Electron Microscopy (SEM) along with Energy-Dispersive Spectrometry (EDS) and Powder X-Ray Diffraction (P-XRD). Both are widely used to identify and characterize ash compounds (see, e.g., [6,13,21,22,23,24,25]) and have been used to study ash sintering [26] and fly ash deposition [27]. On the one hand, SEM-EDS obtains both the morphology and elemental chemical composition of samples. On the other hand, and in order to deepen the analysis regarding ash chemical composition, P-XRD is used to measure the concentration of crystalline phases and determine the amorphous fraction [22]. In addition, the results obtained with SEM-EDS will allow the calculation, by applying a simple methodology [27], of the amount of ash deposited by condensation and inertial impact mechanisms so that these two fractions can also be studied.
The results achieved from the characterization have been analyzed in order to understand the sintering and deposition mechanisms, the relationship with the fuel ash composition and the influence of the operating conditions and thus advance the knowledge on the behaviour of residual agricultural biomass.

2. Materials and Methods

2.1. Fuels

Eight different biofuels were studied in this work, all of them having been produced by an agro-industry inside the feed and fodder sector working as an IBLC in the context of the AGROinLOG´s project [19].
The definition of the blends was based on the methodology described in [20]. This methodology suggested selecting a pellet made from forestry wood, used as a reference, and seven agropellets from two different families: wheat straw and maize stalk (two pure herbaceous pellets and five blended with the aforementioned forestry woody biomass). The mix of herbaceous and woody fuels was selected to try to mitigate ash-related problems [14,17]. Moreover, some authors such as Brand et al. [28] suggest that this mix could improve the pellets’ physical characteristics. Table 1 shows the characterization of each biofuel.

2.2. Reactor

In order to assess and compare the properties of the fuels and extract results for the final conversion in larger scale equipment, it is desirable to perform experiments in simplified geometry equipment and under controlled conditions [10,29,30,31,32]. This was achieved by using a lab-scale grate reactor: a fixed-bed reactor, placed at CIRCE’s installations. The description of the reactor, the parameters monitored and the methodology followed to perform the test was described in [20].

2.3. Ash Analysis

For all the tests, bottom ash (ash and unburned material deposited over the grate of the combustor) and fly ash (ash transported from the combustion chamber by the exhausted gas that can be deposited over the exchange surface) were collected in order to better assess the ash behaviour of each fuel under different operating conditions.
On the one hand, the fly ash deposition samples were collected during the combustion through a deposition probe located in the chimney with a removable sampling ring that also allowed the estimation of the Deposition Rate (DR) for each fuel and combustion condition (for more information about the deposition probe characteristic and how DR was obtained, see [20]). Then, a sample was taken from the front face of the removable sampling rings, i.e., from the one faced perpendicular to the flow of the combustion gases. Each sample was glued onto metal plates with carbon tape and then coated with carbon.
On the other hand, bottom ash samples collected in the combustion tests were weighted and classified in three fractions according to their sintering status [8,33]:
  • S1: passes through a 3.15 mm sieve, and it is considered as not sintered;
  • S2: does not pass through a 3.15 mm sieve, but it is easily disaggregated;
  • S3: does not pass through a 3.15 mm sieve, and it is difficult to disaggregate.
As the difference between S2 and S3 is subjective, a fraction S2/3 encompassing both classes was used. Afterward, samples of the S1 and S2/3 bottom ash fractions were collected and crushed in a mortar to obtain homogeneous samples with an adequate particle size. Once this process was finished, they were treated in the same way as the ones collected in the removable rings.
All the samples were analyzed by the SEM-EDS method. The equipment used was a Carl Zeiss Merlin electronic field emission microscope equipped with a Gemini column, with acceleration voltages between 0.02 and 30 kV, with an EDS X-MAS detector of Oxford instruments with a window of 20 mm2 and a resolution in energy from 127 eV to 5.9 keV. For each sample, three zones of 1 mm2 were selected, taking the image with the retro-dispersed detector (asb). The average elemental composition was obtained through EDS with a voltage of 15 kV, being processed with the INCA software. The elements analyzed included the main participants in the most important ash transformation processes, namely Na, Mg, Al, Si, P, S, Cl, K and Ca.
In addition, the crystalline matter compositions of the S2/3 fraction and the removable sampling ring of four tests carried out with an intermediate λ value for each fuel were determined by the P-XRD method. Standard X-ray diffraction patterns were collected at room temperature using a Rigaku D/max instrument with a copper rotating anode and a graphite monochromator to select the CuKα wavelength. The measurements were performed at 40 kV and 80 mA, in the angular range from 5° to 80° on 2θ, applying a step size of 0.03° and a counting rate of 1 s/step. The X-ray pattern was analyzed using the JADE 7 program, with access to the “JCPDS-International Centre for Diffraction Database (2000)”. Crystalline phases were quantified using the Reference Intensity Ratio (RIR) method. In addition, to quantify the amorphous phase, peak decomposition was carried out through profile fitting, using a pseudo-Voigt approximation, with Lorentz = 0.5. The crystallite size of each peak (XS) was measured, and the proportion of the amorphous phase was calculated, considering peaks with an XS below 80 Å to be included.

2.4. Test Features

A total of 68 tests were carried out successfully (between 5 and 10 tests per fuel), with the 8 fuels. The most relevant combustion parameters were analyzed and reported in [20]. Table 2 is a summary of the main results achieved.

2.5. Statistical Analysis

To determine the goodness of a certain linear correlation, a statistical analysis through the estimation of the Pearson´s correlation coefficient (r) and its corresponding p-value (p) was performed. The correlation was considered statistically significant when p < 0.05.

3. Results

3.1. Bottom Ash Results

In this section the results obtained from the SEM-EDS and P-XRD analyses of the samples collected in the grate during the reactor tests are presented and analyzed. Table 3 and Table 4 show mean values and the range (minimum and maximum values) for the elemental composition obtained by SEM-EDS for each of the eight fuels of fractions S1 and S2/3 of bottom ash, respectively, expressed as a percentage of the total mass of measured elements (Na, Mg, Al, Si, P, S, Cl, K and Ca).
Due to their chemical similarity and the almost identical role they play in reactions taking place in the ash transformation, the concentrations of K and Na [4] as well as Ca and Mg [34] have been aggregated for the analysis and included in Table 3 and Table 4.
Additionally, Table 5 shows the crystalline phases and amorphous concentration detected using the P-XRD technique for the fraction S2/3 samples of the tests selected for each fuel. It can be seen that the percentage of amorphous is very high, especially for the WSP family, meaning that part of the compounds contained in the sample might have not been detected because they are not in the crystalline phase. In addition, those substances that, being detected, could not be quantified are marked with X.

3.2. Bottom Ash Analysis

In view of the SEM-EDS results shown in Table 3 and Table 4, it can be stated that the three main components of the bottom ash are Si, Ca + Mg and K + Na, staying, in general, approximately constant for each agropellet for the whole range. Al also appears in those fuels that have a high percentage of this element in their composition (WP100, WSP35 and the MSP family, see Table 1), being practically insignificant in the rest. As for P, it is present in lower concentrations than the previous elements although not negligible, and the quantity is quite similar in all the fuels and in both fractions. In all cases, the percentages of Cl are very low, as this element is almost completely vaporized [35] and afterward a part can condense in the form of deposits, as will be seen in the next section. The same occurs with S, although, in this case, amounts above 1% have been detected in fraction S1 of the WSP family, which could have been fixed as calcium sulfates when reacting with the Ca of the fuel [34].
The compositions of both fractions (S1 and S2/3) are similar for each fuel, although it can be verified that the Si content in the latter is higher, which is related to its higher sintering status, while the content of Ca + Mg and K + Na is slightly lower.
Once the main elements that form bottom ash have been identified, it should be noted that the amount of each one and the compounds that they form are different depending on the fuel, which can be verified by taking into account the results obtained for fraction S2/3 (see the SEM-EDS and P-XRD results in Table 4 and Table 5, respectively).
In the case of WP100, more than 50% of the ash was composed by Ca + Mg, as expected due to the high percentage of alkaline earth that the ash of this fuel presents. These elements were fixed forming different compounds (the detected ones by P-XRD were: Ca2(SiO4), Ca2Mg(Si2O7), Ca2Al3Si3O12(OH) and K2Mg2(SO4)3). The second most abundant element was Si, which appeared in combination with Ca or as SiO2 (quartz), probably coming from the contamination of the pellet (sand) [36]. In this case the percentage of alkaline metals was the lowest of all the fuels, and of the same order, in some tests, of aluminum or phosphorus. This could also be related to the high content of alkaline earth metals as these elements could bind to Si in the compounds indicated above, which have high melting temperatures [37], justifying the low sintering degree, and thus K would be released [35].
With respect to the WSP family, the most important element was Si, especially in the case of WSP100, with more than 50% by mass. The high percentage of amorphous matter did not allow quantification, but the presence of SiO2 was detected. High percentages of K + Na also appeared in all of them (around 30%), which may have been fixed in the bottom ash in the form of low-melting silicates or phosphates (it may have been in the amorphous phase and had not been detected). Due to the higher Al content in WSP35, KAlSi2O6 was detected. This compound has a higher melting temperature than K-silicates and K-phosphates [37] and, again, could be related to the lower sintering degree of this fuel compared to the others of the same family. For the WSP family, the quantities of Ca + Mg were lower than for the rest of the fuels, among other reasons, due to the fact that its content in fuel ash was also low (see Table 1). The high content of Si and K + Na, together with the low presence of Ca + Mg, could justify the high sintering degree of these fuels [4,18,25].
All the MSP family fuels presented a very similar composition of the ash. The percentage of Si was around 45%, Ca + Mg was above 35% while K + Na exceeded 10% (except in MSP100). It should be noted that despite having a higher concentration of Ca + Mg and less K + Na it had no lower sintering degree, as could be expected, which may be related to the high combustion temperatures that were achieved during the tests with these agropellets [20]. These temperatures might imply that alkali metal silicates could be formed and melted, which would justify the high ash sintering degree. However, high concentrations of less problematic compounds such as alkaline earth metal silicates (CaSiO3, Ca3(Si3O9) and Ca2Mg(Si2O7)) have been found (in addition to KAlSi2O6, which could have been formed due to the high Al content of these fuels [25]). Although, at first, alkali metal silicates could be formed, K and Na have been able to be displaced and released for Ca or Mg [4,26,33], forming finally the compounds indicated above. Those compounds are clearly predominant in the crystalline phase, although SiO2 was detected too. The higher number of compounds found is linked to the greater crystalline phase of these fuels with respect to the others.
On the other hand, no relationship has been found between the SEM-EDS results and λ, not even for WP100 in which a decrease in the sintering degree as λ increased was found (see [20]). The ash composition remained constant although the quantity of the sintering fraction varied.
Once the composition of the ash formed in the tests is known, it may be interesting to check whether there is any relationship between this and the initial composition of the ash of the fuel, taking into account the different ash conditions (combustion temperature, residence time, λ and turbulence) in the reactor and the laboratory. As no relationship was found between the SEM-EDS results and λ, it is possible to work with an average composition for each fuel. Therefore, Figure 1, Figure 2 and Figure 3 show the results for mean bottom ash composition obtained as a weighted average of the fraction S1 and S2/3 compositions for all the tests versus the concentration of Si, Ca + Mg and K + Na in the fuel preliminary analysis, respectively. A clear relationship between both compositions was confirmed (Figure 1: r = 0.81, p = 0.014; Figure 2: r = 0.94, p < 0.001; Figure 3: r = 0.99, p < 0.001).
It can be seen that the main differences are a higher percentage of Si (Figure 1) and lower K + Na (Figure 3) in the SEM-EDS analyses for all the fuels. These results are logical due to the higher combustion temperatures reached in the reactor compared to the laboratory. Si is the most refractory element [4], so, regardless of the temperature, the compounds formed remain solid, while K + Na is much more volatile, so when increasing the temperature the compounds formed are less retained in the bottom ash. The concentration of Ca + Mg does not vary much as the compounds either do not vaporize [4] or do so but in a very small proportion compared to K + Na [38]. The behaviour of Si, K + Na and Ca + Mg is similar to the one found when analyzing other blended pellets [26].
Furthermore, it should be noted that K + Na decreased proportionally more in those fuels in which the initial Ca + Mg content was higher, even though the K + Na content was lower (WP100 and the MSP family). This could confirm the displacement of alkali metals in the silicates by alkaline earth metals when there is an excess of the latter. In this case, the K and Na would be released to form other compounds that come out of the bed. This latter phenomenon is also favored by higher combustion temperatures, especially in the tests with the MSP family.
Regarding the WSP family, the K + Na content decreased proportionally less, which would imply that they remained fixed, forming silicates and phosphates that, although not detected by P-XRD, could form part of the amorphous phase (higher than 95% in these fuels, except WSP35). The presence of phosphates could be corroborated by the fact that the phosphorus concentration is very similar in the results of the SEM-EDS to the initial one in these fuels (see Figure 4). For the MSP family, the phosphorus decrease (see Figure 4) could be due to the fact that the high temperatures may have led to its volatilization [33].

3.3. Deposition Results

The results obtained from the SEM-EDS analysis of the samples collected in the deposition probe during the reactor tests are presented in Table 6. As discussed in [20], when analyzing deposition phenomena only tests with λ > 1 were considered, in order to reproduce the operating conditions of actual facilities. To carry out the analysis, the concentrations of K and Na, and Ca and Mg, were aggregated again. It can be seen how the most abundant groups of elements in WP100 are Ca + Mg and K + Na, while in agropellets they are K + Na and Cl, being much lower than the concentration of Ca + Mg. In addition, as the percentage of herbaceous in the blend increases, in general, the percentage of Cl also increases, while Ca + Mg decreases.
Table 7 shows the crystalline phases and amorphous concentrations detected in the samples of the deposits of the tests selected for each fuel, using P-XRD techniques. Firstly, it should be highlighted that, on the whole, there was a high crystallinity degree in the samples (percentage of zero amorphous in many of them), which considerably reduces the possible uncertainties of the method. Nevertheless, in WP100 and MSP10 the crystallinity degree was lower (albeit much larger than in bottom ash samples). In the case of the agropellets, the main compounds detected were KCl and alkali metal sulfates (K2SO4 and K3Na(SO4)2), with a reduced amount of SiO2 in several fuels and CaCO3 in MSP10. On the contrary, in WP100 the percentage of K, Na and Cl compounds was much smaller, with the compounds of Ca, Mg and Si being the main ones. These results corroborate the ones obtained from the SEM-EDS analysis.
All these differences in the composition of the deposits (SEM-EDS and P-XRD) are related to the different relative importance of the deposition mechanisms that apply for each fuel and operating condition. In the next section this aspect is addressed, aiming to deepen the understanding of the factors that influence the deposition and thus try to reduce the negative impacts that this phenomenon entails.

3.4. Deposition Mechanisms Analysis

To understand the differences among the DR value between the different fuels and its relationship with lambda [20], it is necessary to analyze the deposition phenomena, even in a simplified manner. There are two ways in which ash can leave the bed, by vaporization and by entraining. Each of these leads to a different deposition mechanism, one produced by condensation and another by inertial impact, respectively [27].
Concerning condensation, it can be stated that some compounds, mainly alkali metal chlorides, sulfates and hydroxides, are vaporized and can be deposited on the heating surface chiefly as chlorides, sulfates and carbonates by direct condensation or after forming aerosols by thermophoresis or turbulent diffusion. In the case of alkali metal sulfates and chlorides, due to their low melting points, a sticky layer is formed, to which other deposits adhere [5,36,39,40,41,42]. Part of these alkali metal compounds can also condense into coarse fly ash [5,36,39,40,41,42,43].
In relation to inertial impact, some of the coarse fly ash entrained from the bed, which contains mainly silicates, aluminosilicates and phosphates, as well as oxides, carbonates, sulfates, and hydroxides of Mg, Si and/or Ca, can form deposits on the sticky initial layer by inertial impact [5,36,39,40,41,42,43].
These two mechanisms are highly complex, and it is helpful to establish several simplifications in order to facilitate the analysis of the results. In this work, the methodology exposed in [27] to estimate deposition by condensation (DRCond.) and by inertial impact (DRImp.) was applied (Fe has not been considered, due to the contamination of some samples with oxides from the reactor). This methodology uses the elemental composition of the S1 fraction and of the deposits (from SEM-EDS analysis) instead of analyzing the fluid and particle dynamics and is based on the different composition of the ashes that leave the bed by entrainment and by vaporization. This simplified method uses the average composition of the ashes, without considering the differences that may exist in this composition depending on the different particle sizes. Nevertheless, it obtains information regarding the relative importance of both deposition mechanisms and identifies trends when varying operating conditions. In Figure 5 and Figure 6, DRCond. and DRImp. values are shown with respect to λ.
As can be seen in Figure 5 and Figure 6, DRCond. and DRImp. clearly depend on the type of fuel and also vary with the operating conditions. Thus, deposition is expected to be affected by the quantity and the composition of the ash in the fuel, as well as by λ and the combustion temperature. All these parameters are in turn interrelated, which complicates the analysis. These aspects are dealt with in the following subsections.

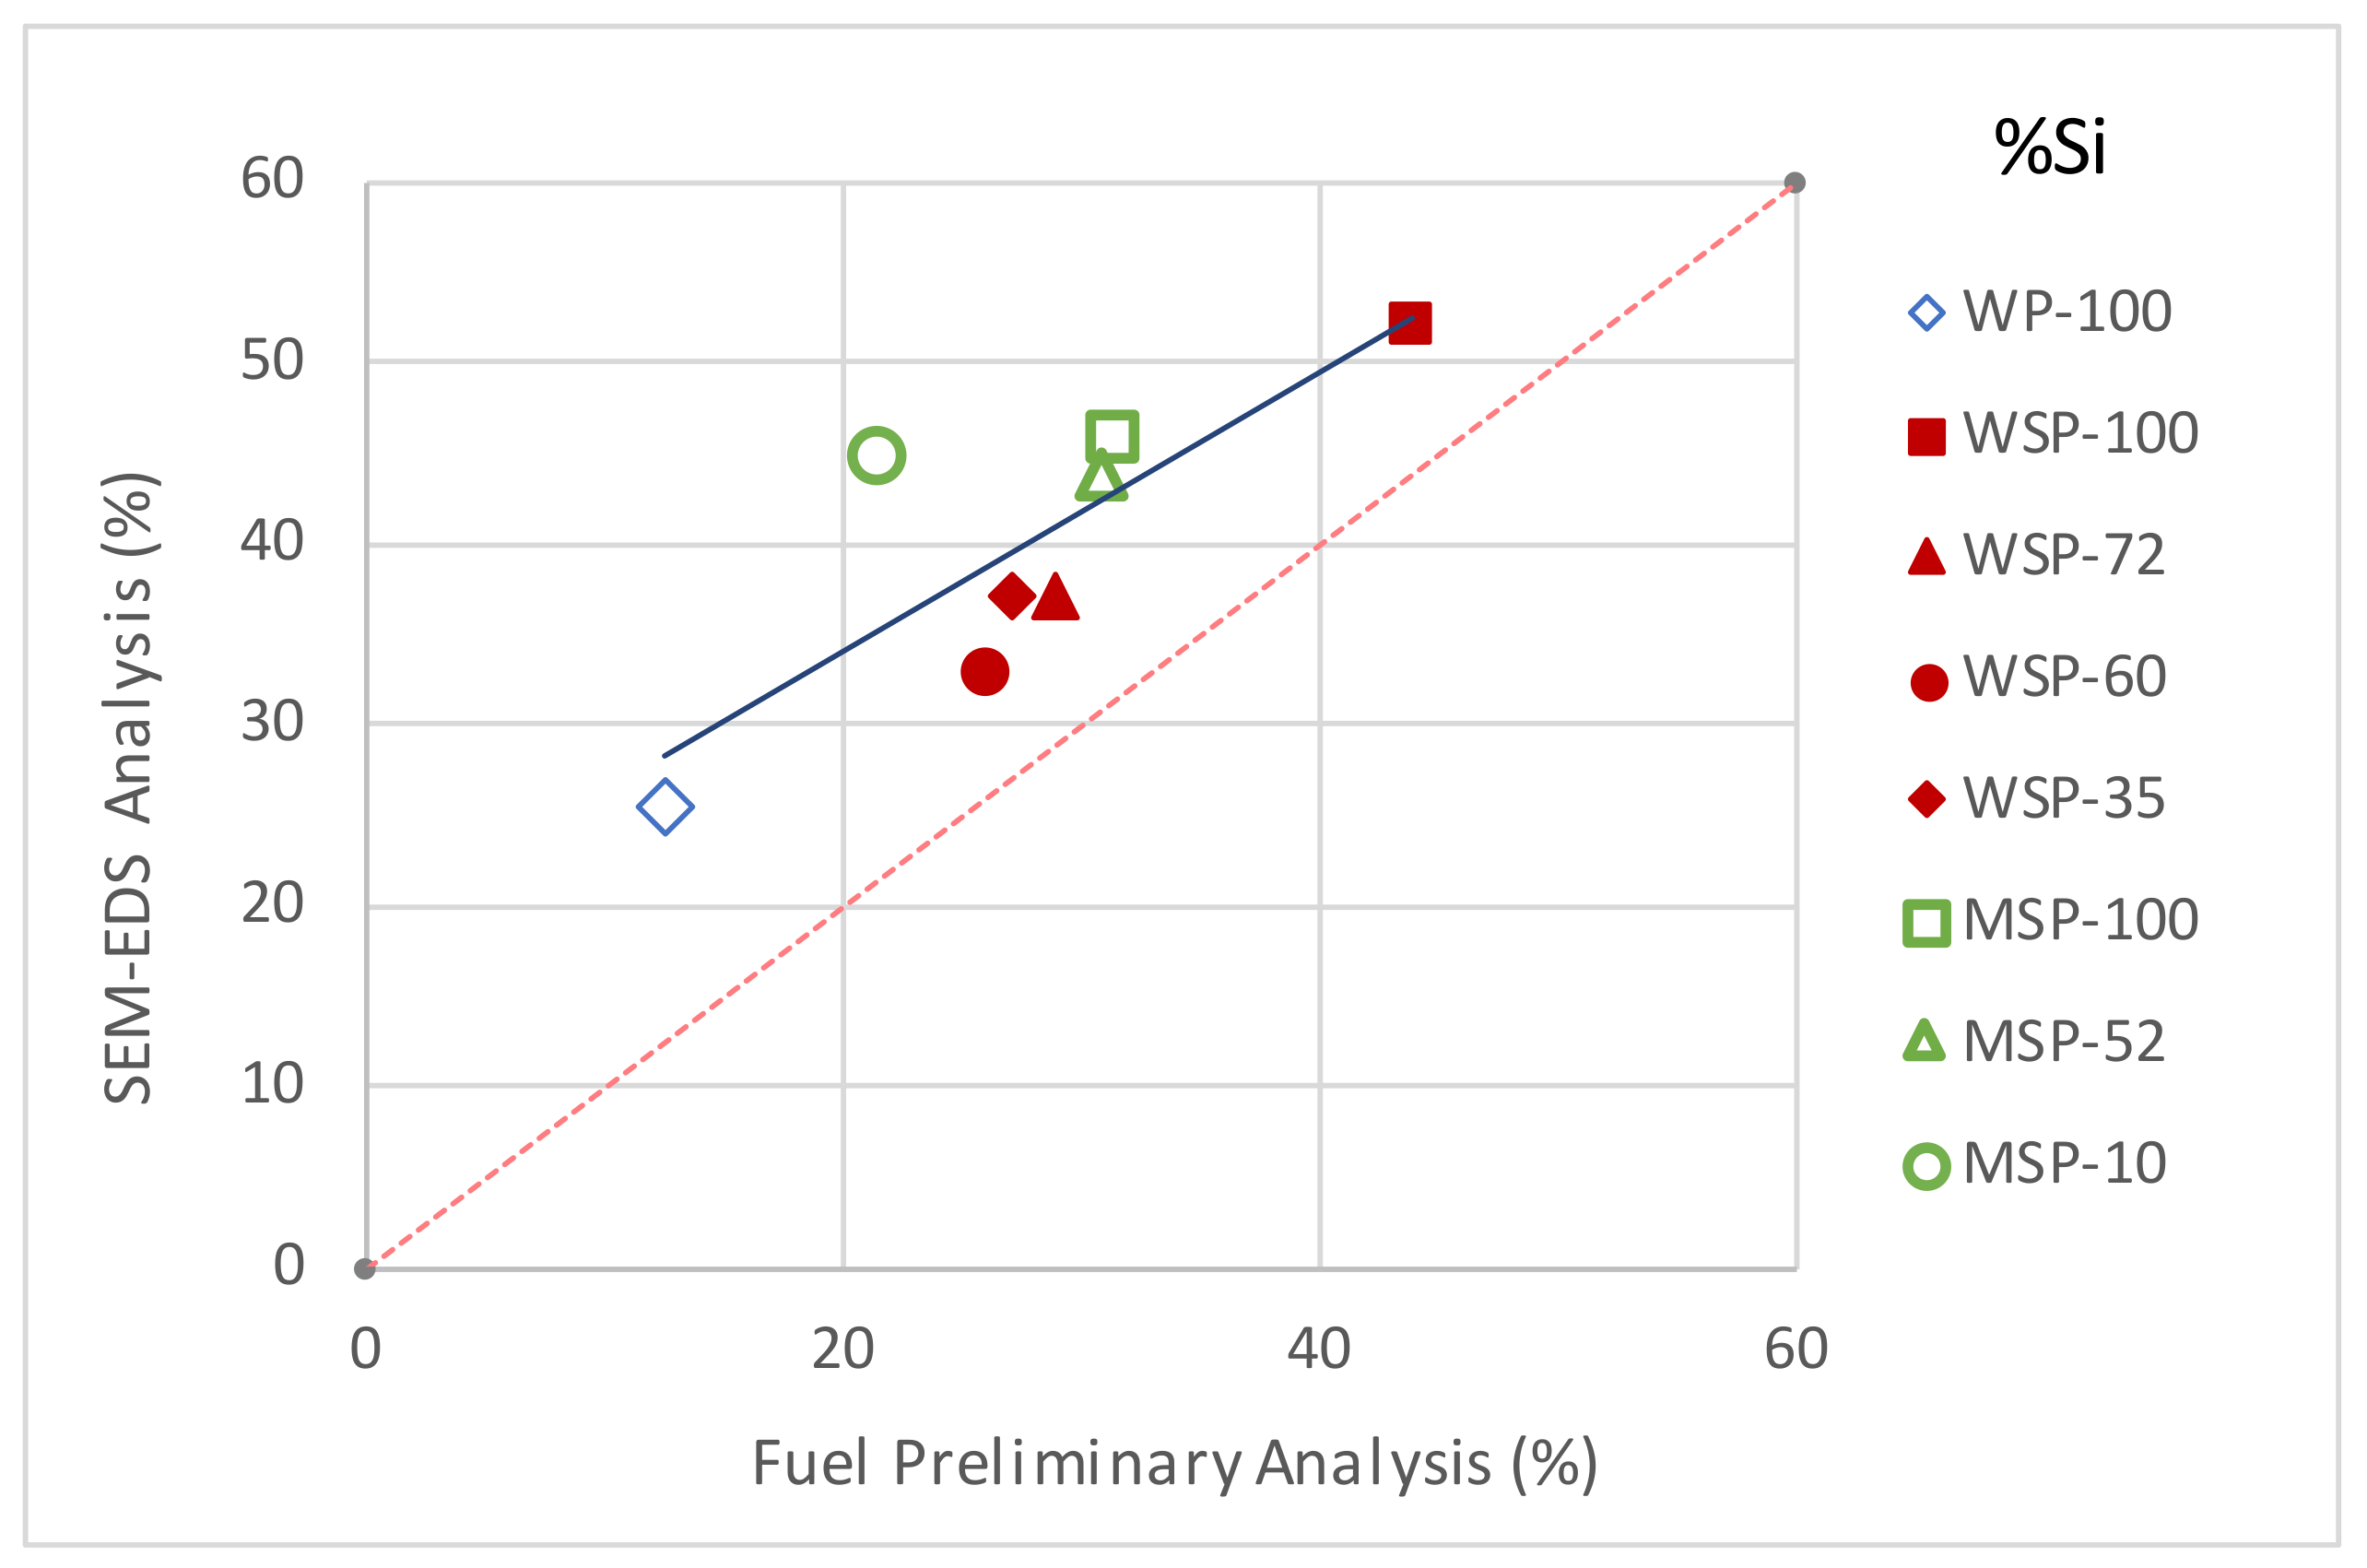
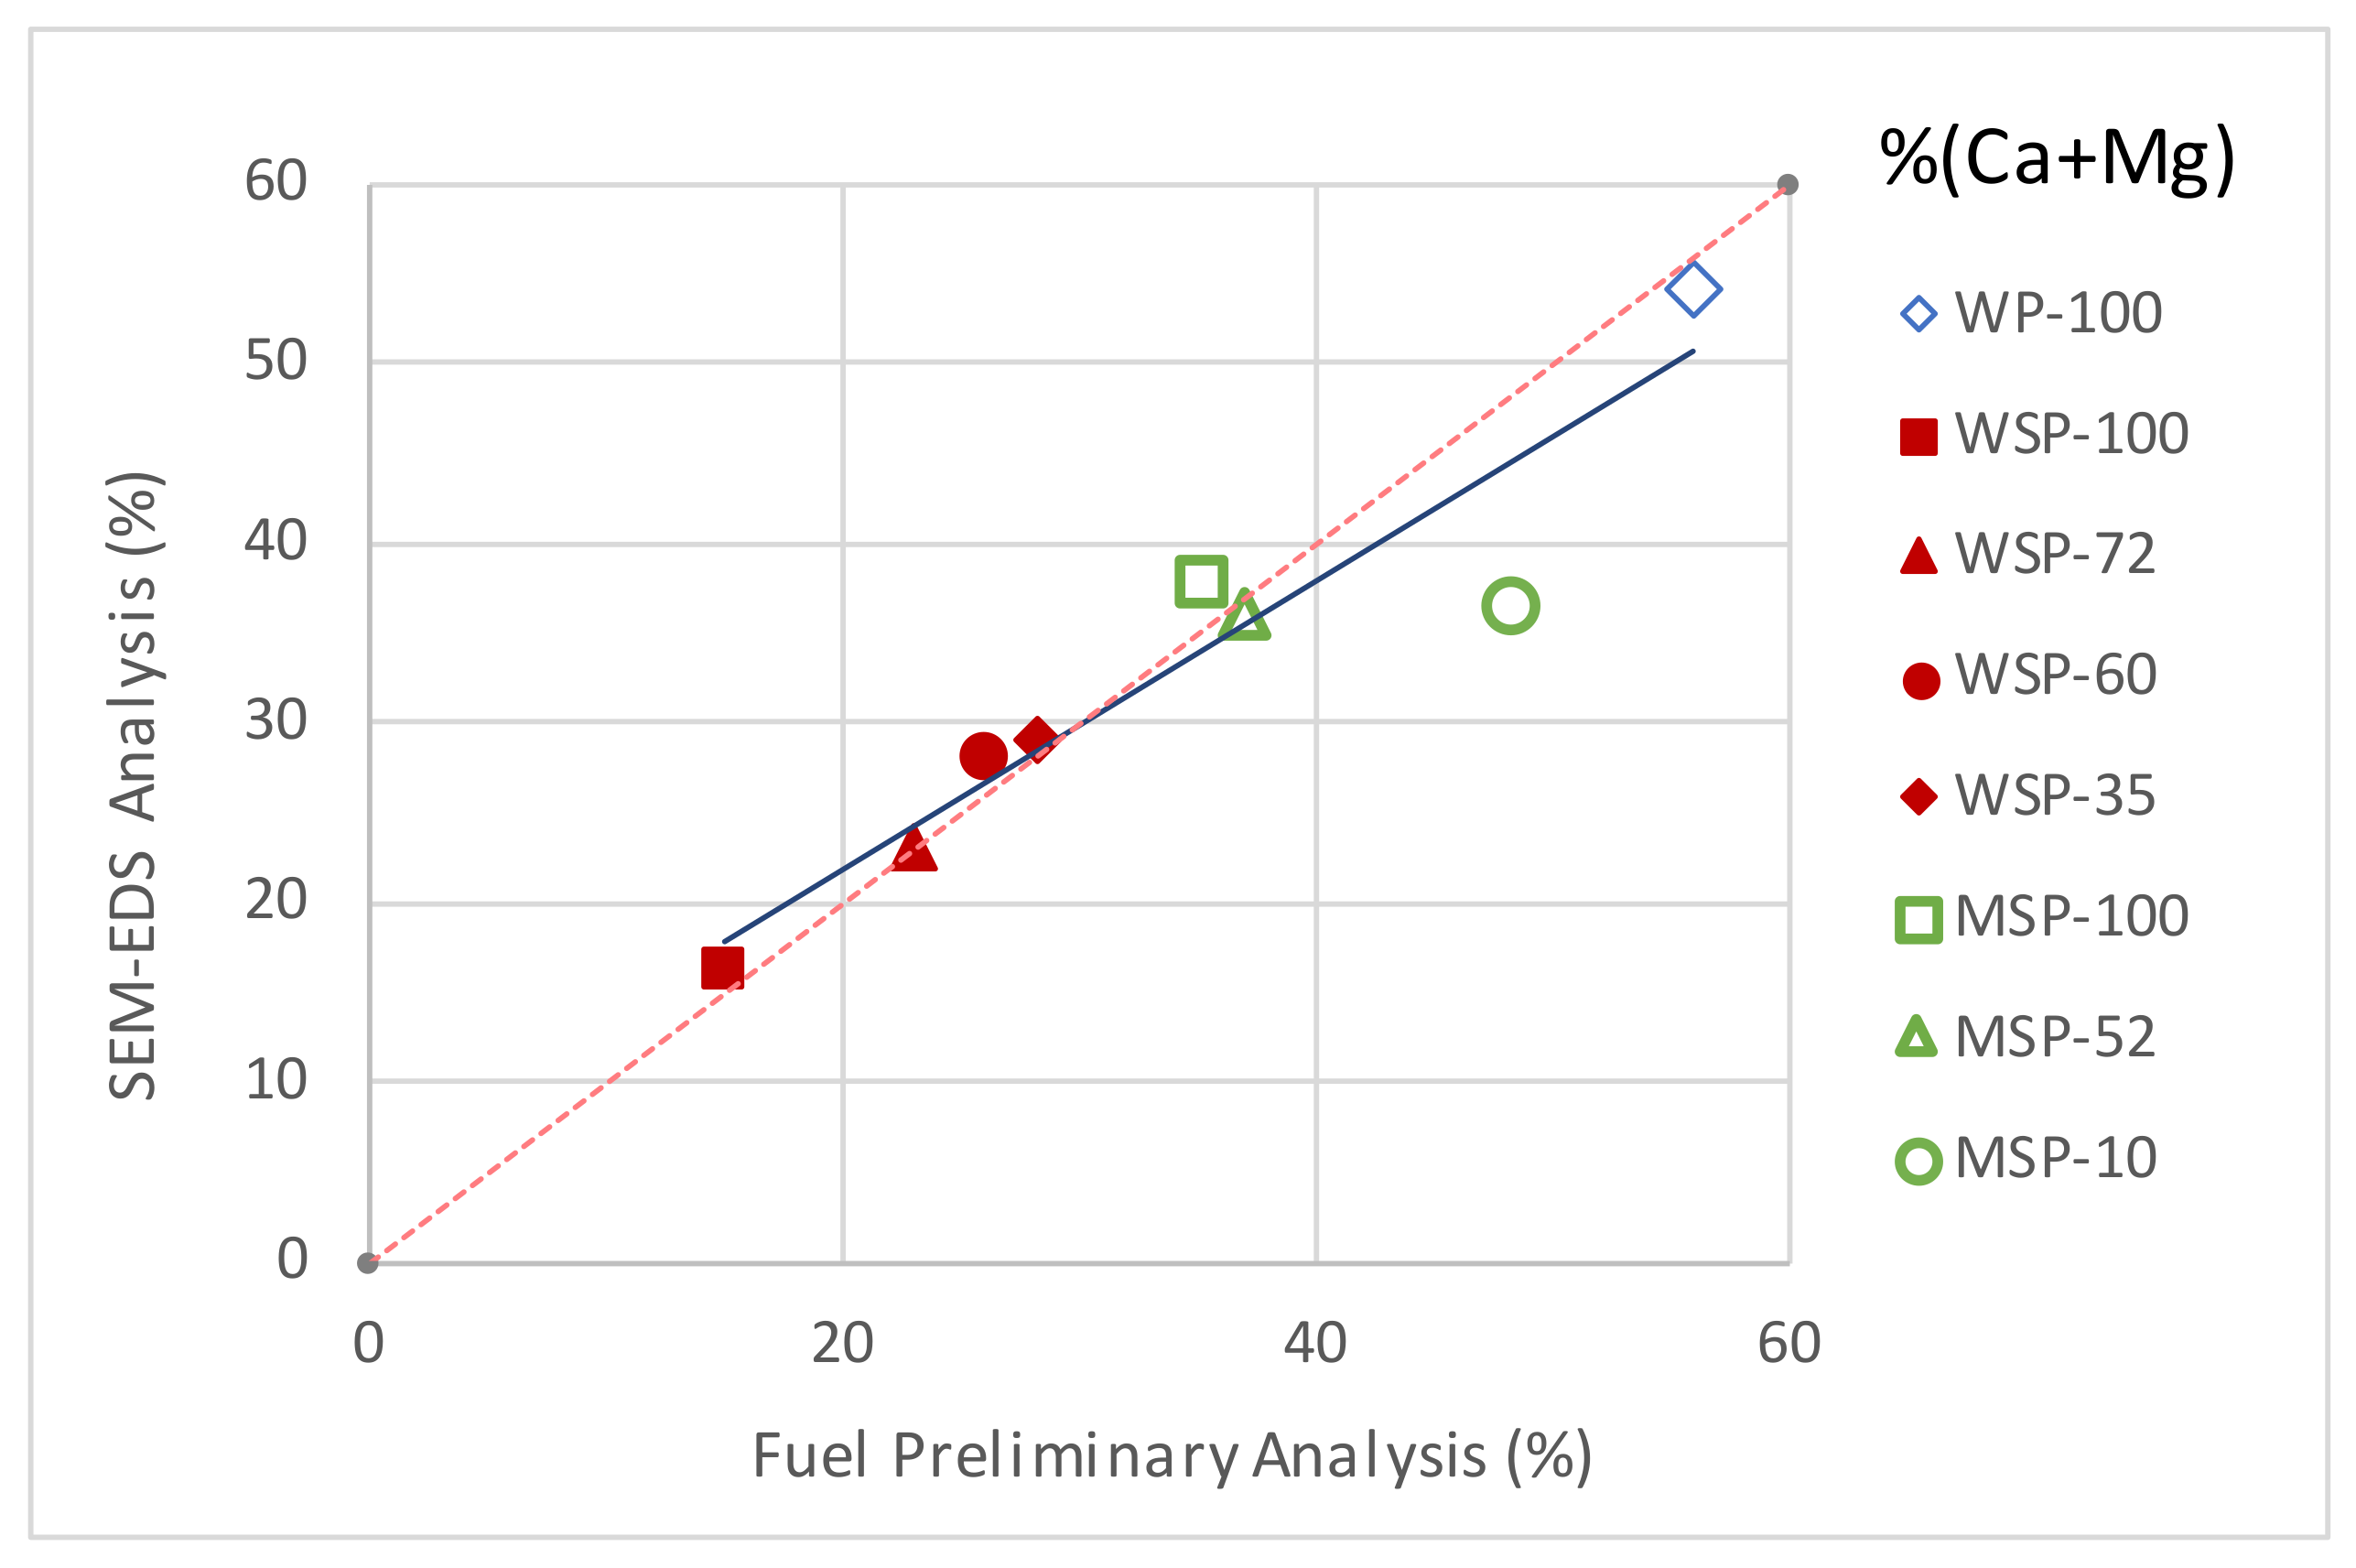
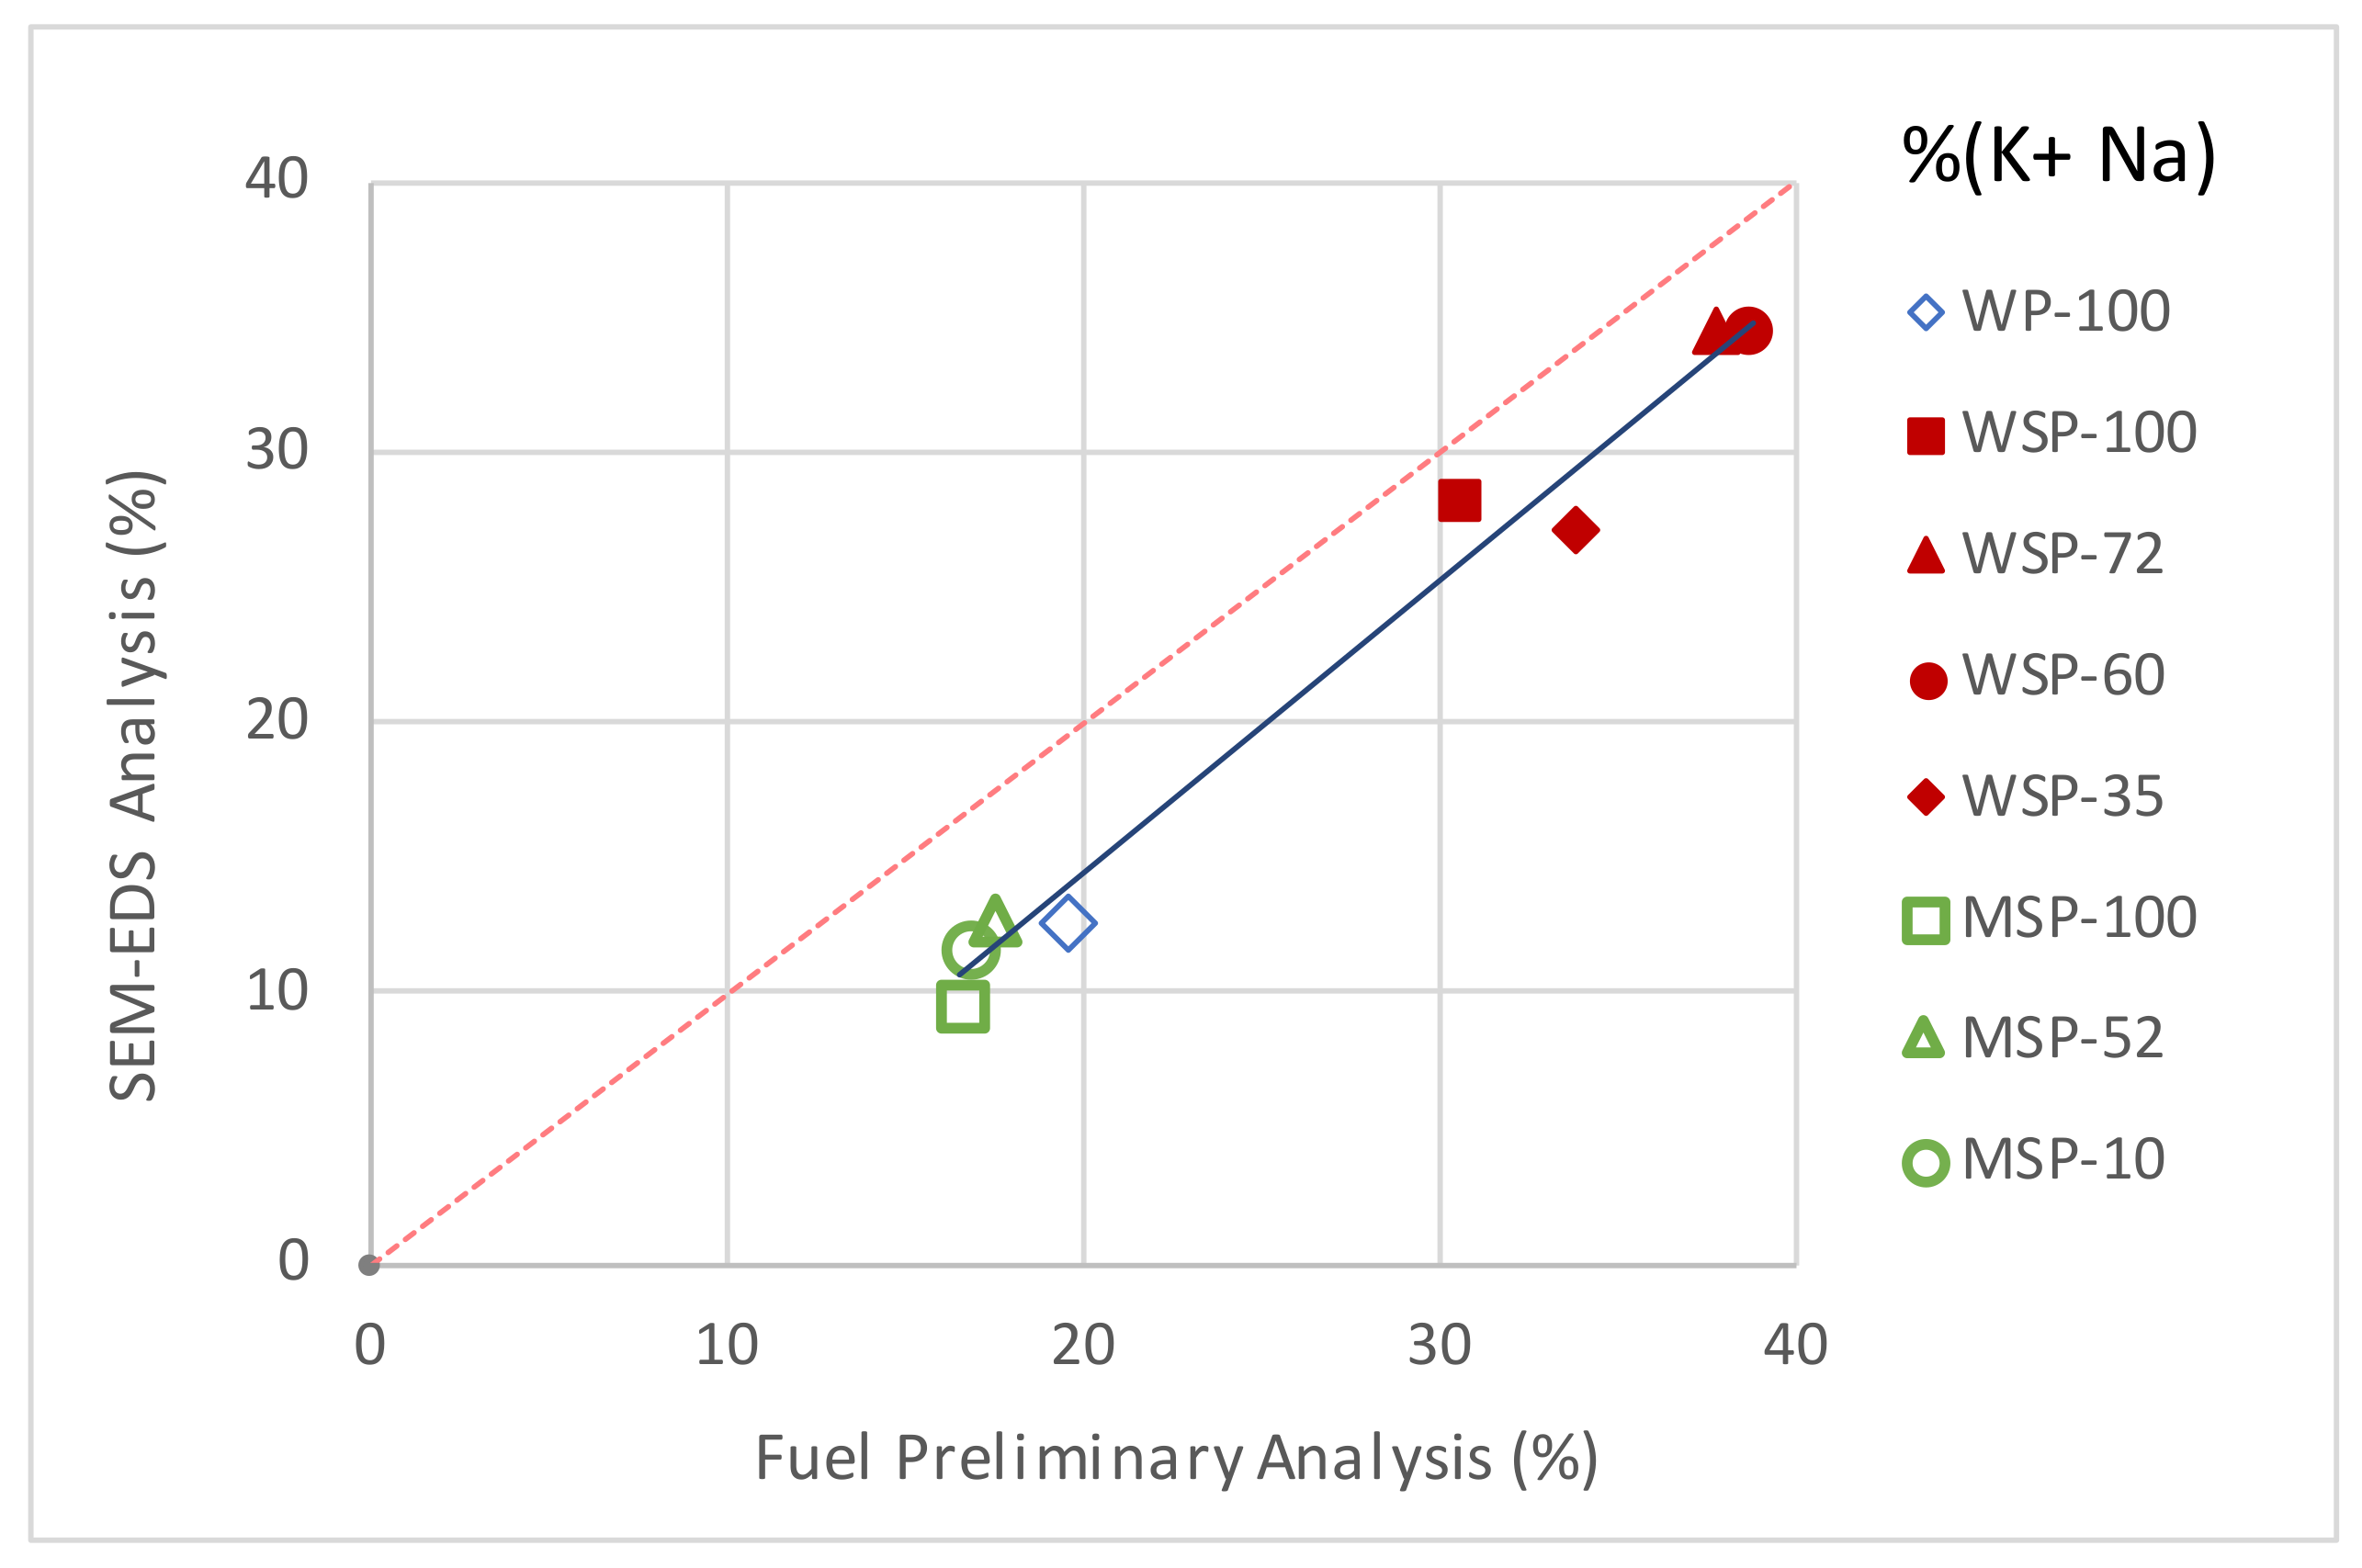
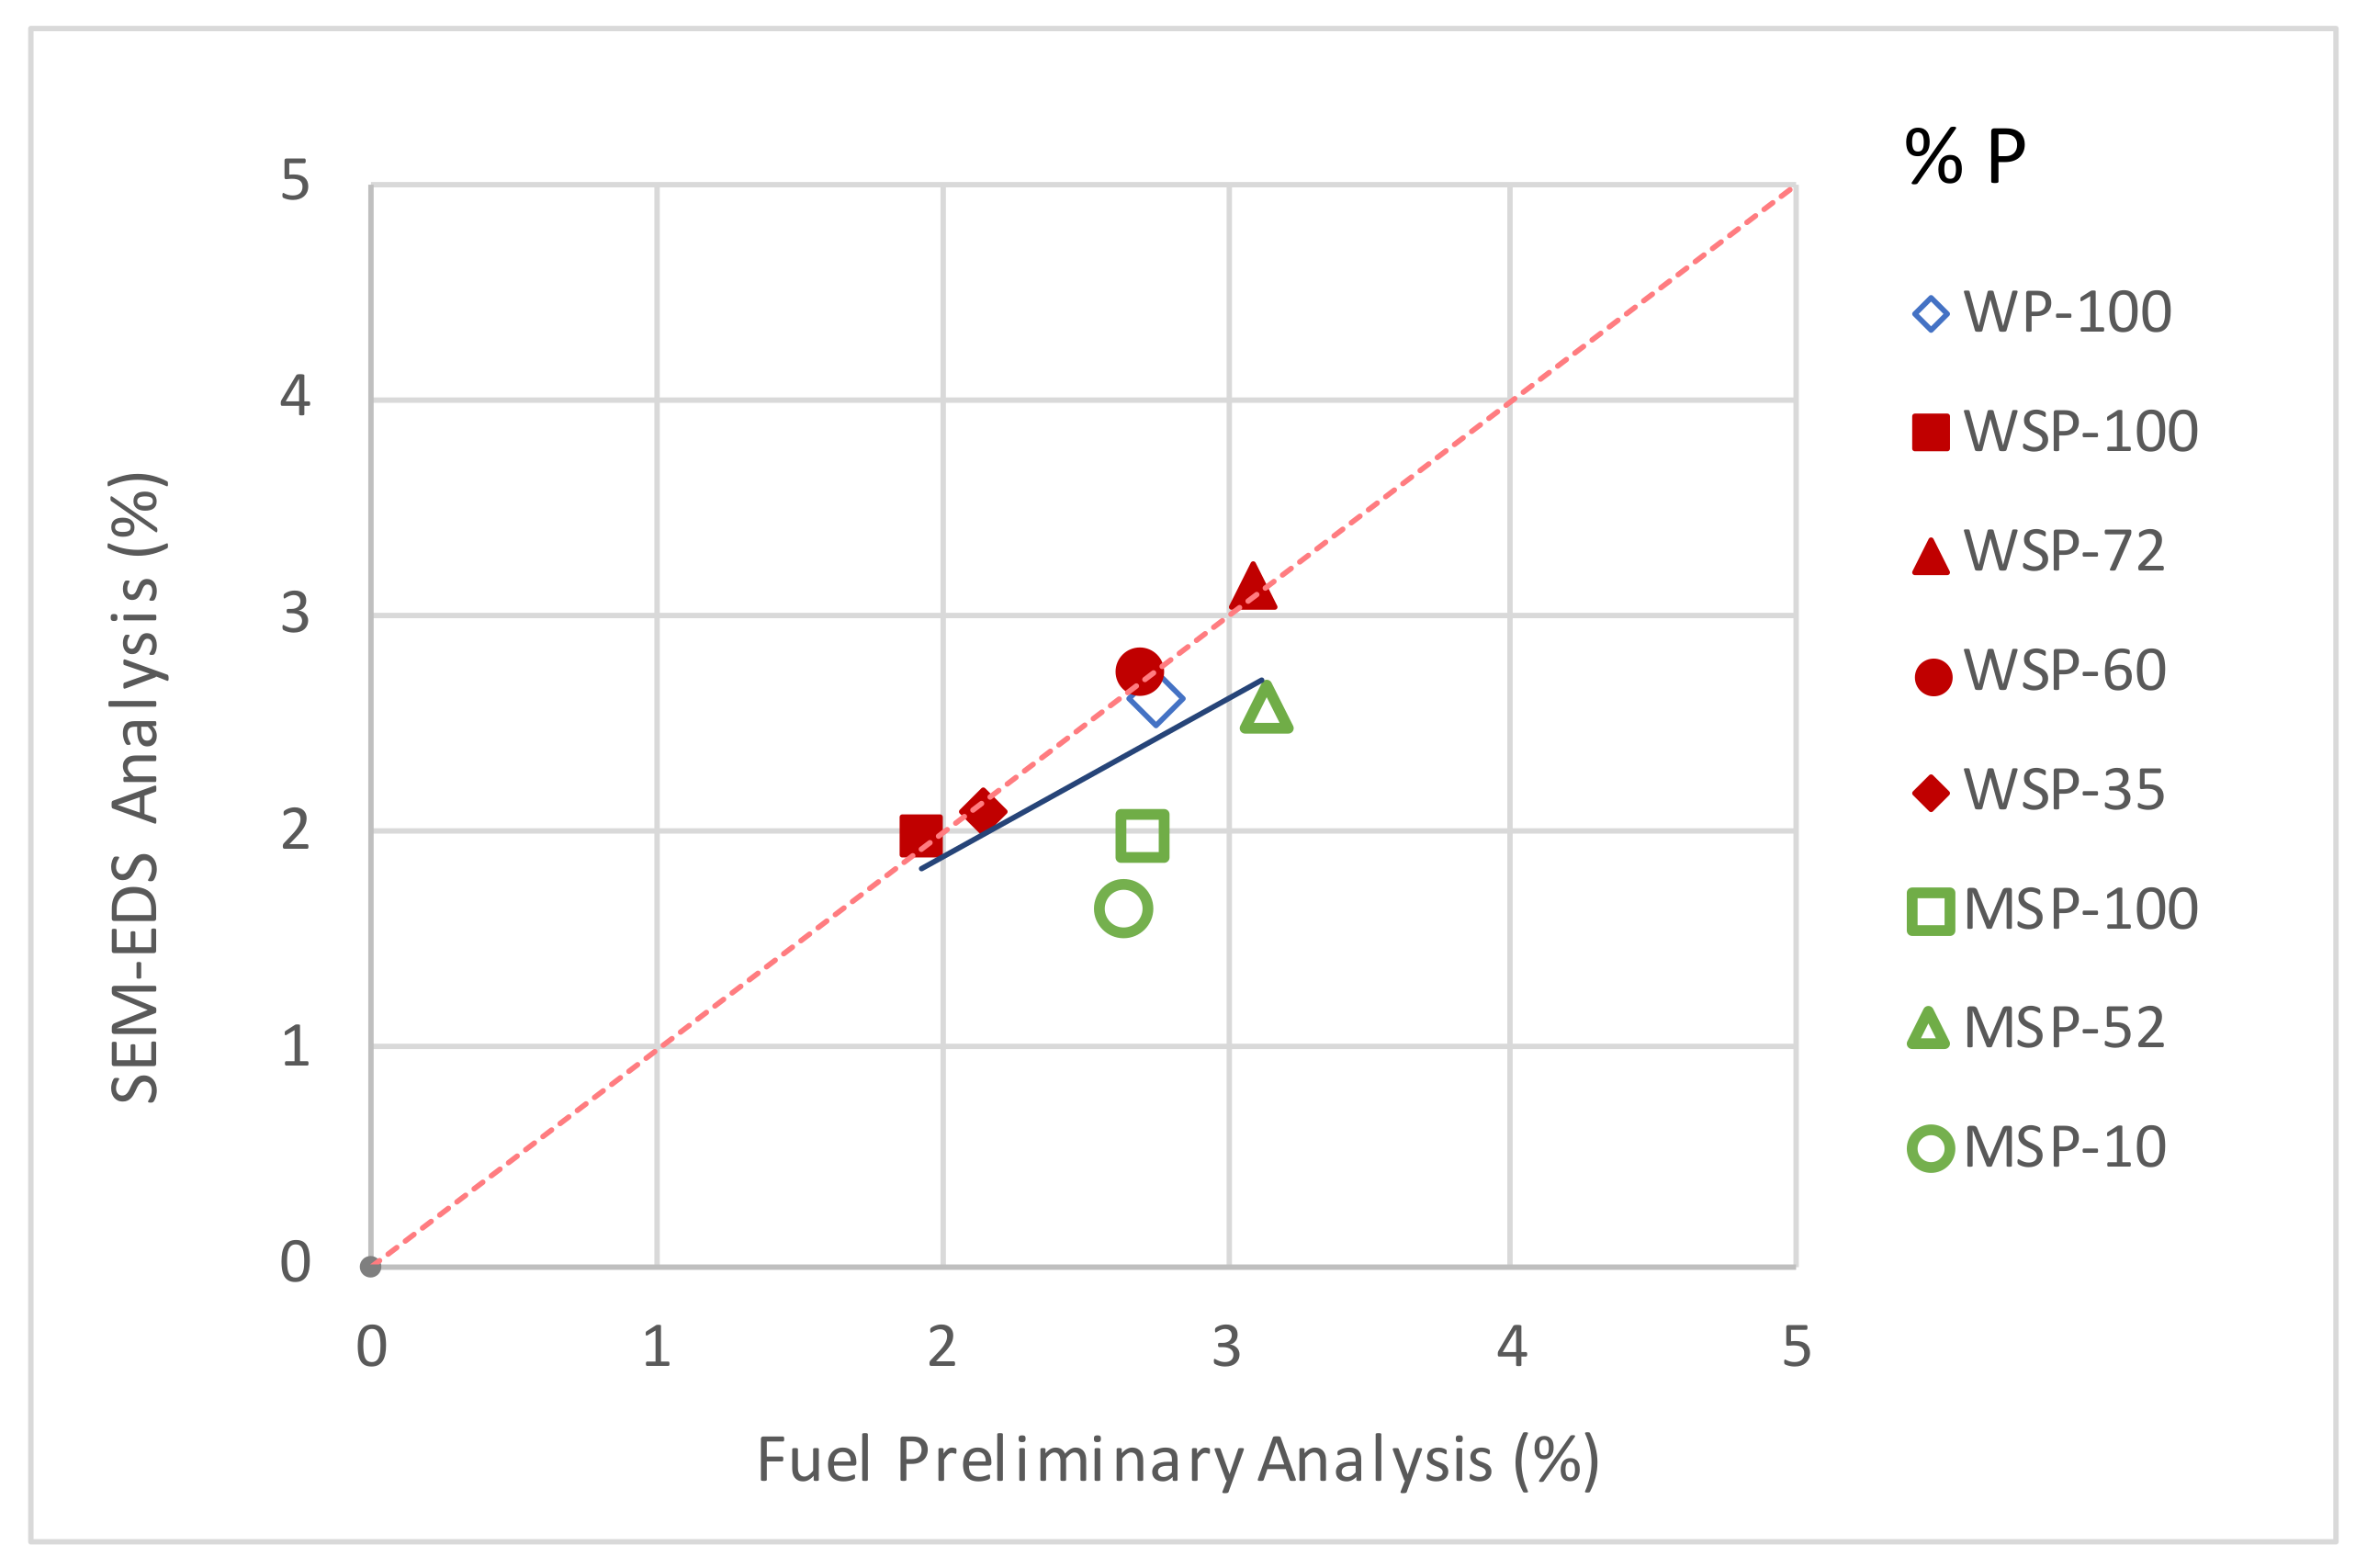
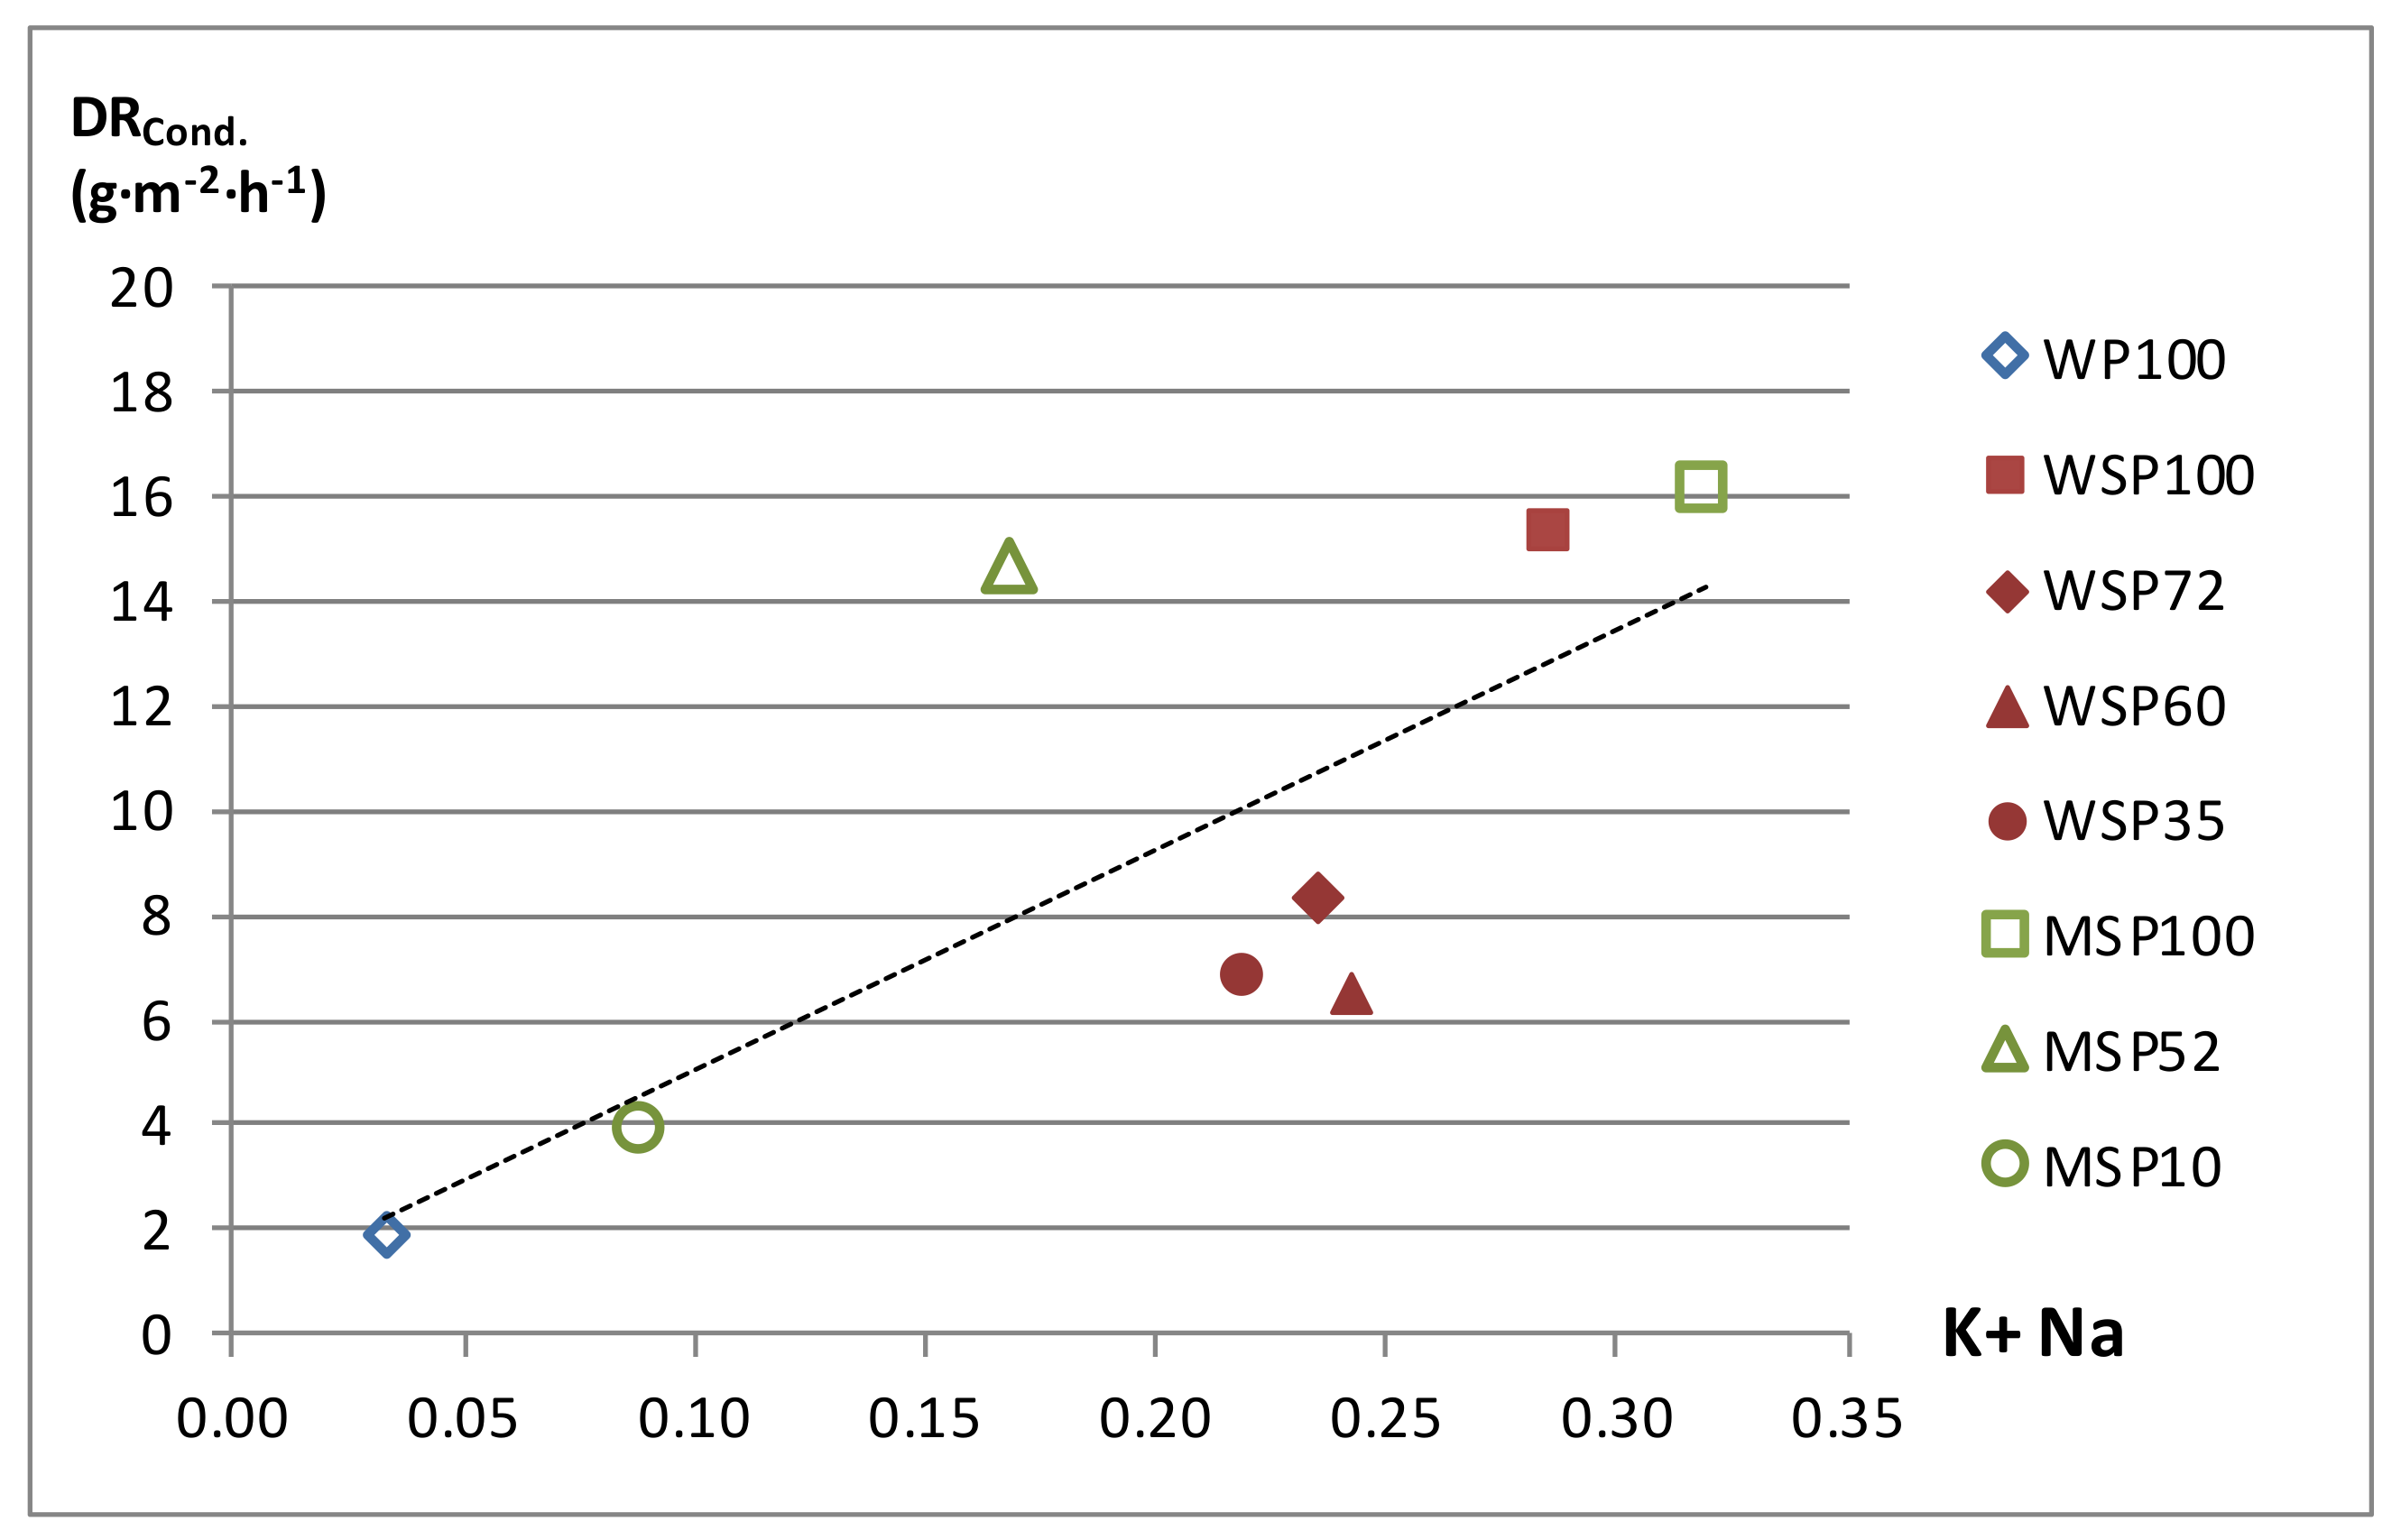
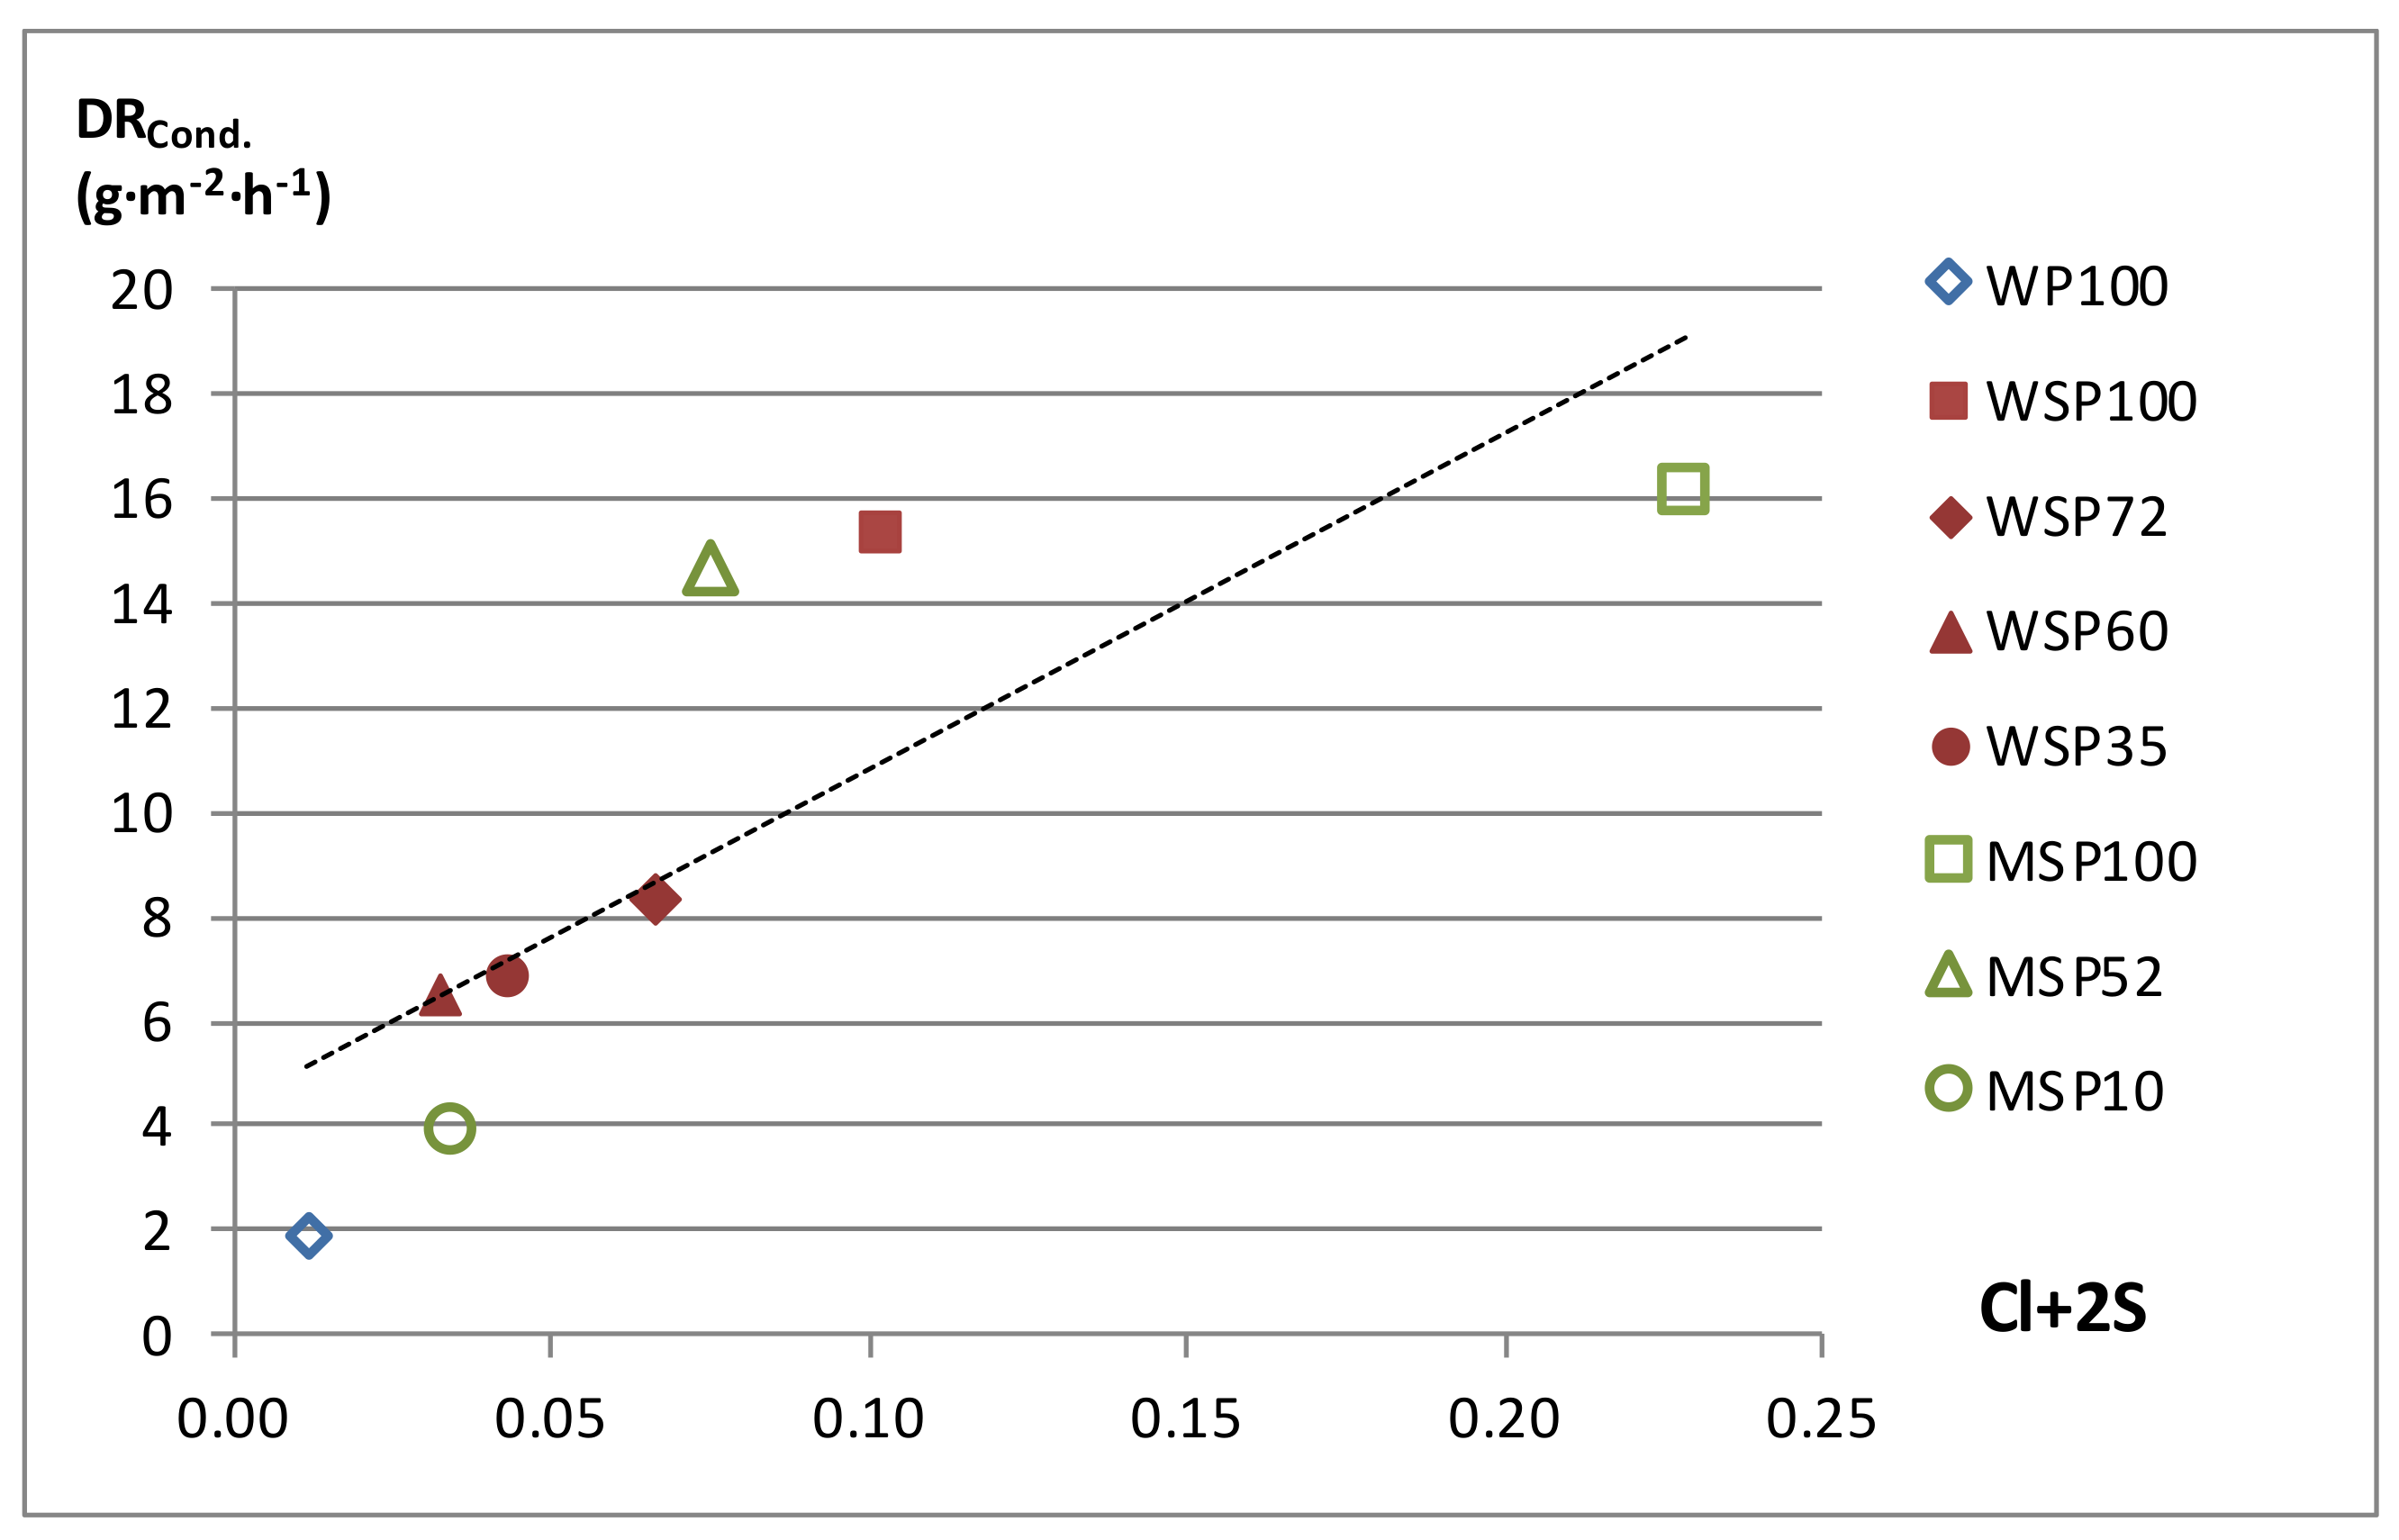
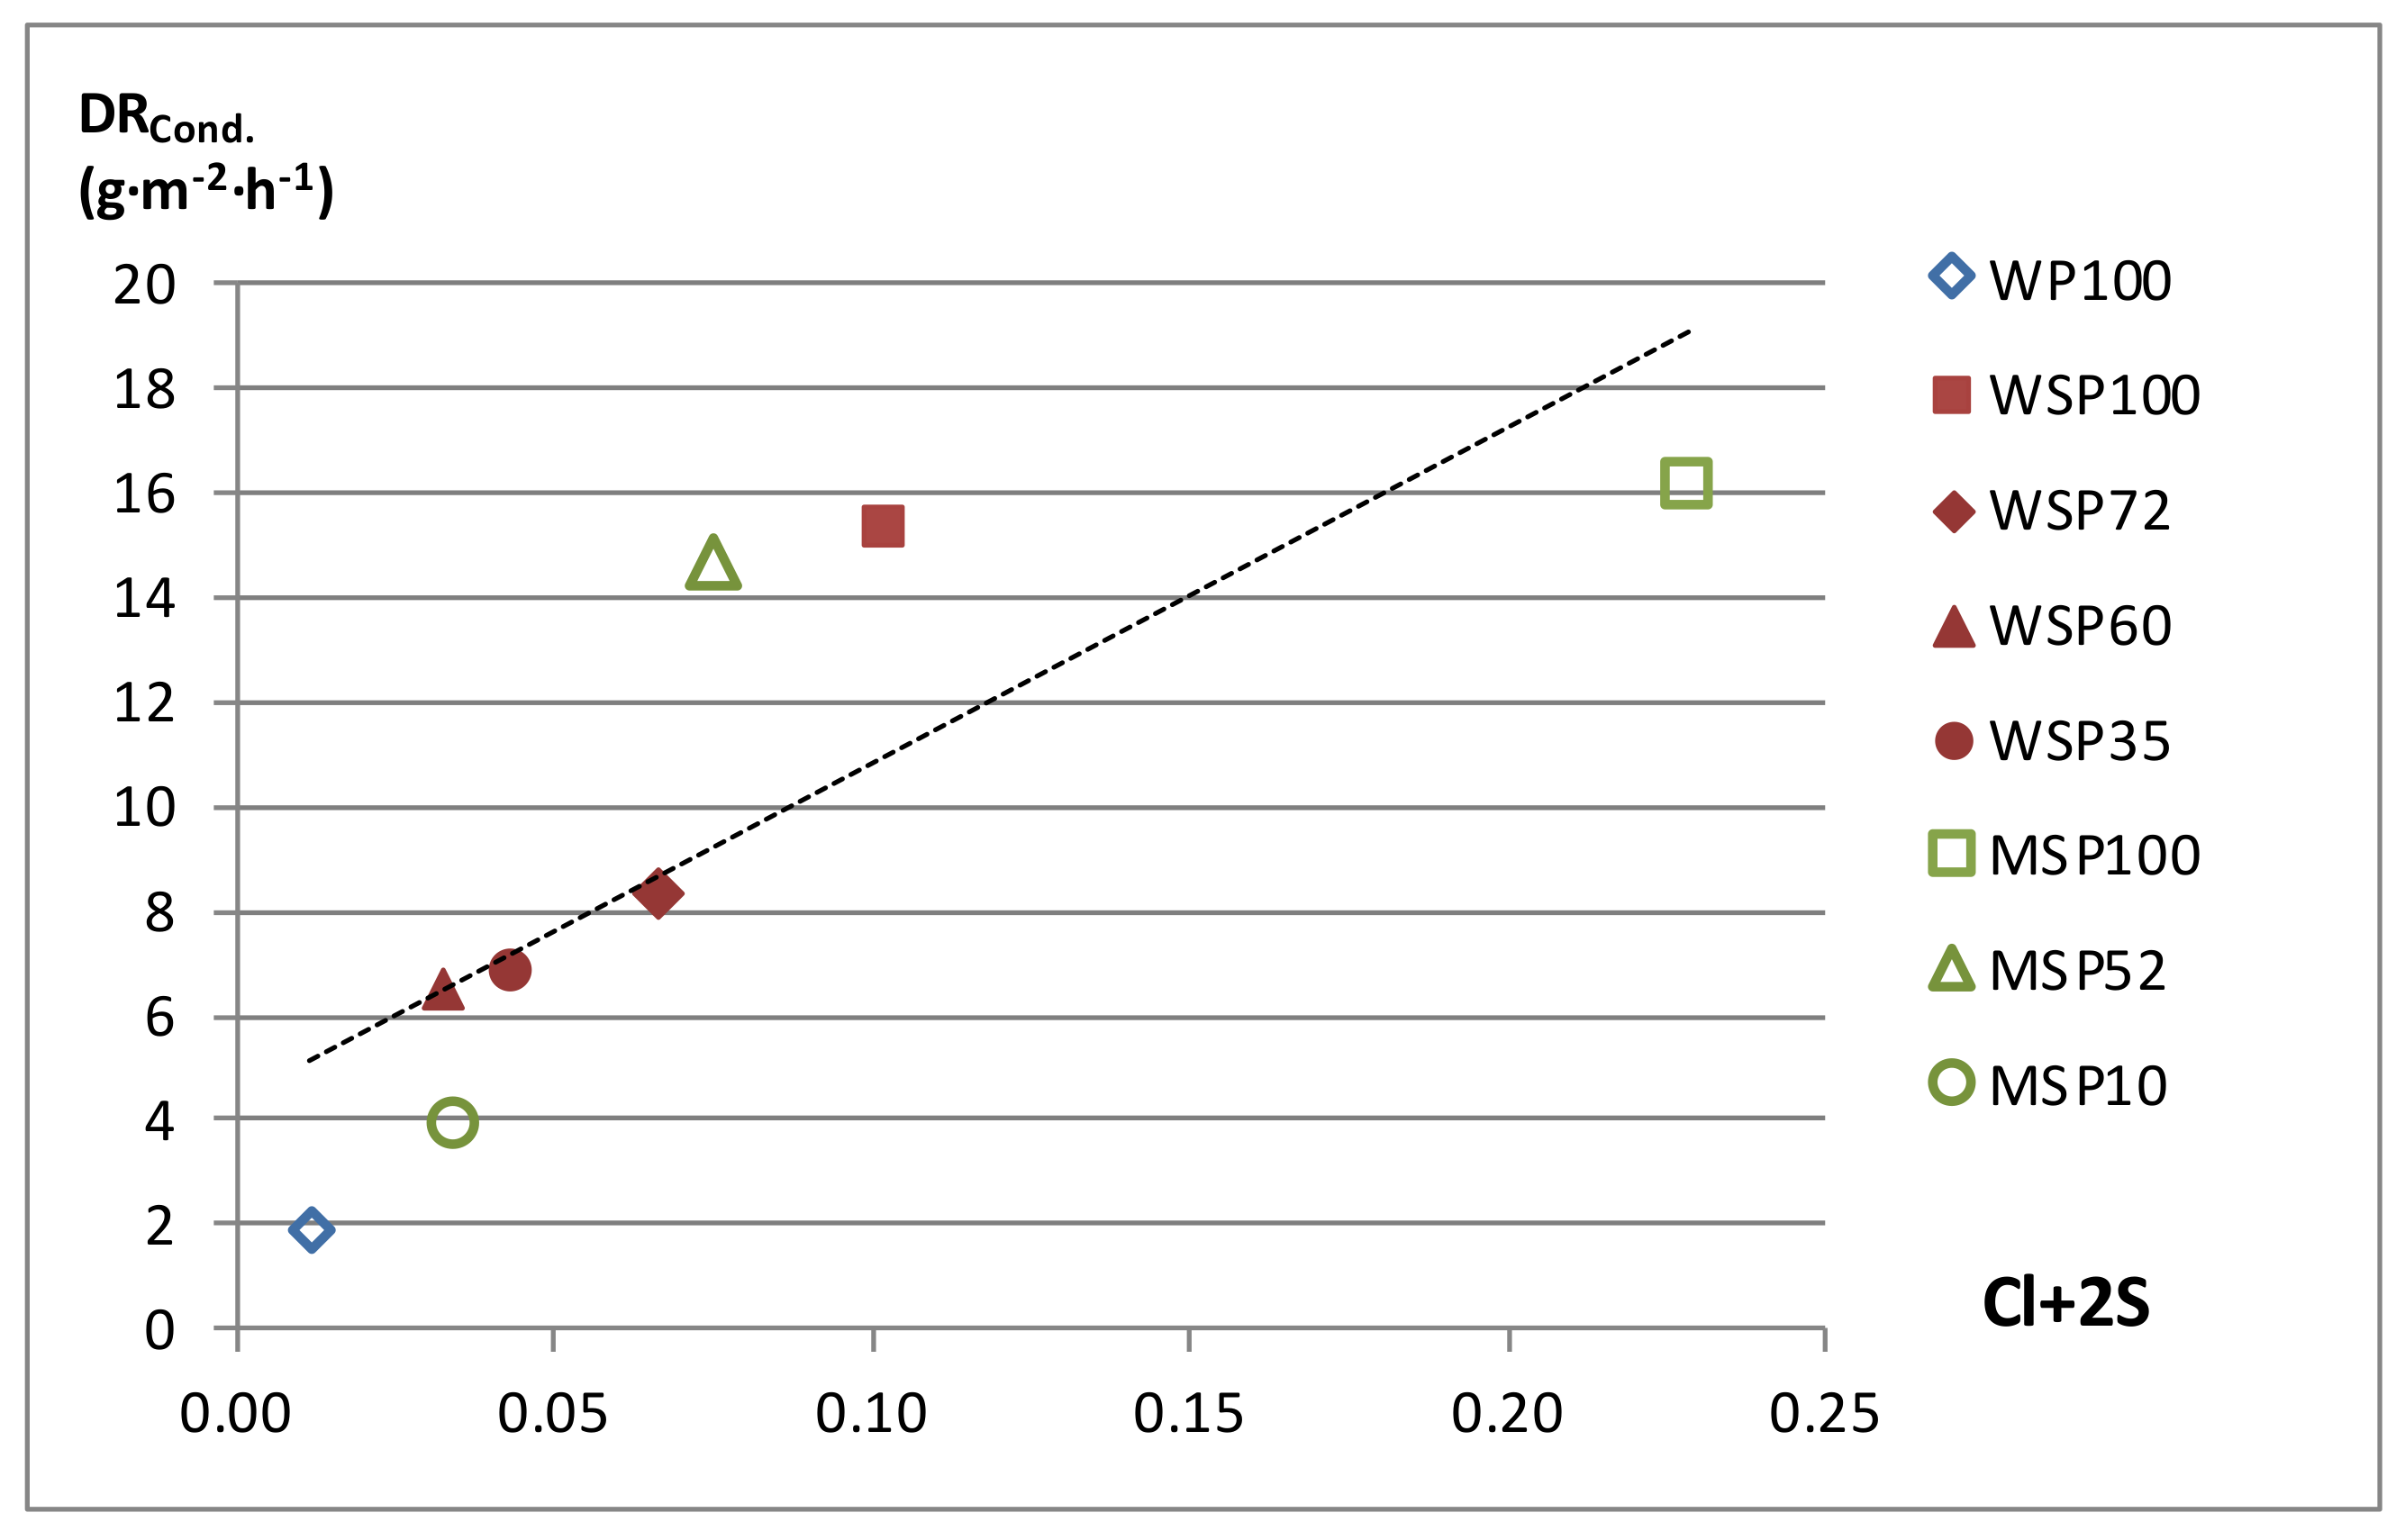
3.4.1. Comparison between Fuels

In order to make the analysis of the comparison between fuels independent from the operating parameters, in this subsection, the average values of the tests carried out with each fuel were used. The means of DR, DRCond. and DRImp. values for each fuel are shown in Table 8.
It can be seen that in WP100 the main deposition mechanism is the inertial impact, while in the blended pellets condensation clearly dominates. However, when the percentage of herbaceous in the blend is small (WSP35 and MSP10) the deposition by impact becomes more important.
In the event that the temperature of the sampling ring had been higher, the importance of condensation would have decreased, with the inertial impact gaining importance, as happens for example in [44].
The results shown in Table 8 are consistent with those of the P-XRD analysis (Table 7). Thus, fuels with a DRCond. percentage greater than 75% with respect to the total (WSP100, WSP72, WSP60, WSP35, MSP100 and MSP52) present a percentage of compounds related to vaporization and subsequent condensation (KCl, K2SO4 and K3Na(SO4)2) greater than 90%. The other two fuels (WP100 and MSP10) had relatively high concentrations of compounds with a high vaporization point (SiO2, CaCO3, Ca2Mg(Si2O7), Ca(OH)2, CaO, Ca2(SiO4) and MgO) that could only have been deposited by inertial impact.
Due to deposition by condensation beginning with the vaporization of various compounds, mainly alkali metal chlorides, sulfates and hydroxides, when the amounts of K, Na, Cl and S are higher in the fuel, it is expected that the DRCond. will increase. The amounts of these elements generally increase as the percentage of herbaceous does (molelement/kgfuel, which can be obtained from Table 1), which justifies that in both fuel families DRCond. increases with the percentage of herbaceous (see Table 8) except in WSP60, possibly due to the low value of S that this fuel presents. The relationship between these elements and deposition by condensation is reflected in Figure 7 and Figure 8, where DRCond. is represented as a function of the amount of K + Na and Cl + 2S (to take into account that the molar ratio between K + Na and Cl is 1 in alkali metal chlorides and 2 between K + Na and S in alkali metal sulfates) in the initial analysis of the fuels, respectively.
It can be seen that there is a clear correlation between DRCond. and K + Na (Figure 7: r = 0.75, p = 0.033) and between DRCond. and Cl + 2S (Figure 8: r = 0.80, p = 0.016). The latter is more significant as, while an important part of the K + Na can be retained in the bottom ash (see Section 3), not participating in the deposition phenomenon, almost of the Cl and S vaporizes [35] and can lead to deposition by condensation.
Regarding the DRImp., it should be noted that, despite its low amount of ash, WP100 presents by far the highest deposition by inertial impact (Figure 6 and Table 8). This is possibly due to the low sintering degree of this fuel (see Table 2), which favors entrainment and the subsequent deposition of solid particles. In this sense, it should be noted that in the case of WP100 it was found that the S1 fraction was made up of a large quantity of ash in the form of fine dust. The sintering degree is related, in addition to certain operating parameters and to the composition of the ash. Due to the high percentage of K + Na in all the fuels analyzed, the sintering degree is mainly related to the concentration of Si, Ca and Mg, and with the relation between them (see [20]). In this sense, in Figure 9 it can be observed how DRImp. correlates negatively with the Sr index (Sr = SiO2/(SiO2 + Fe2O3 + CaO + MgO)·100 [45]) (r = −0.72, p = 0.043).
The relationship between DRImp. and the sintering degree will be discussed again in the next subsection.

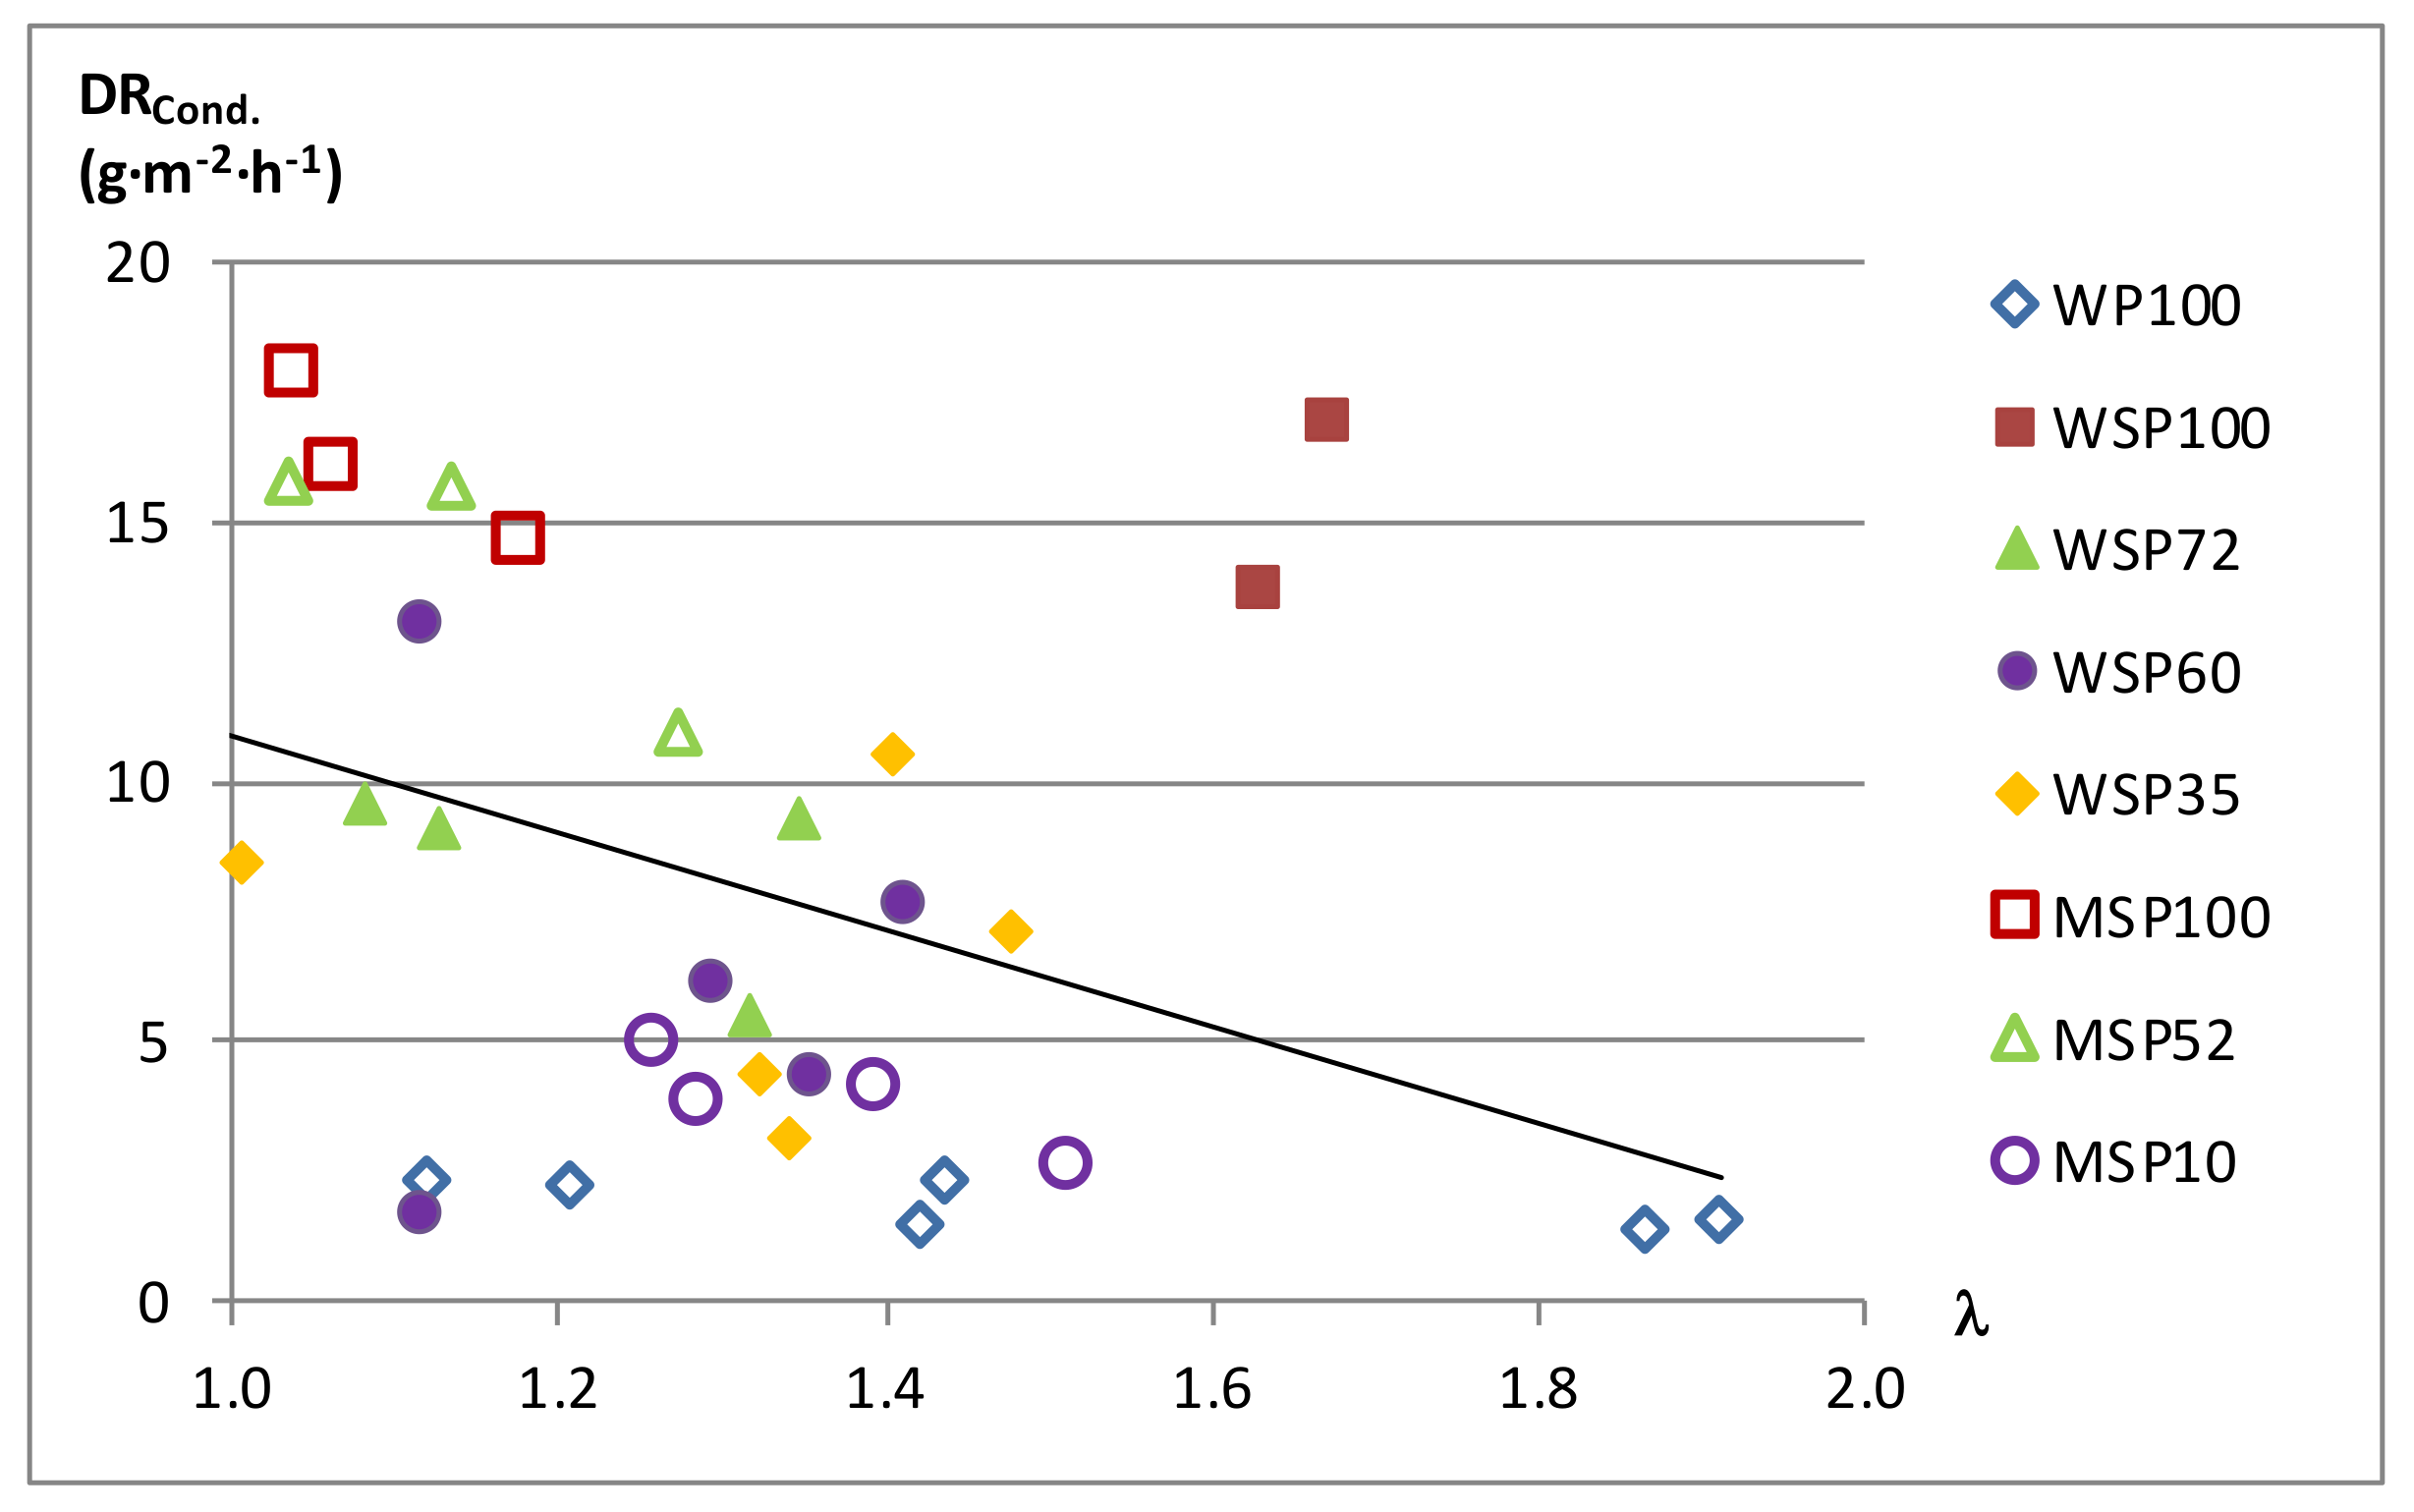
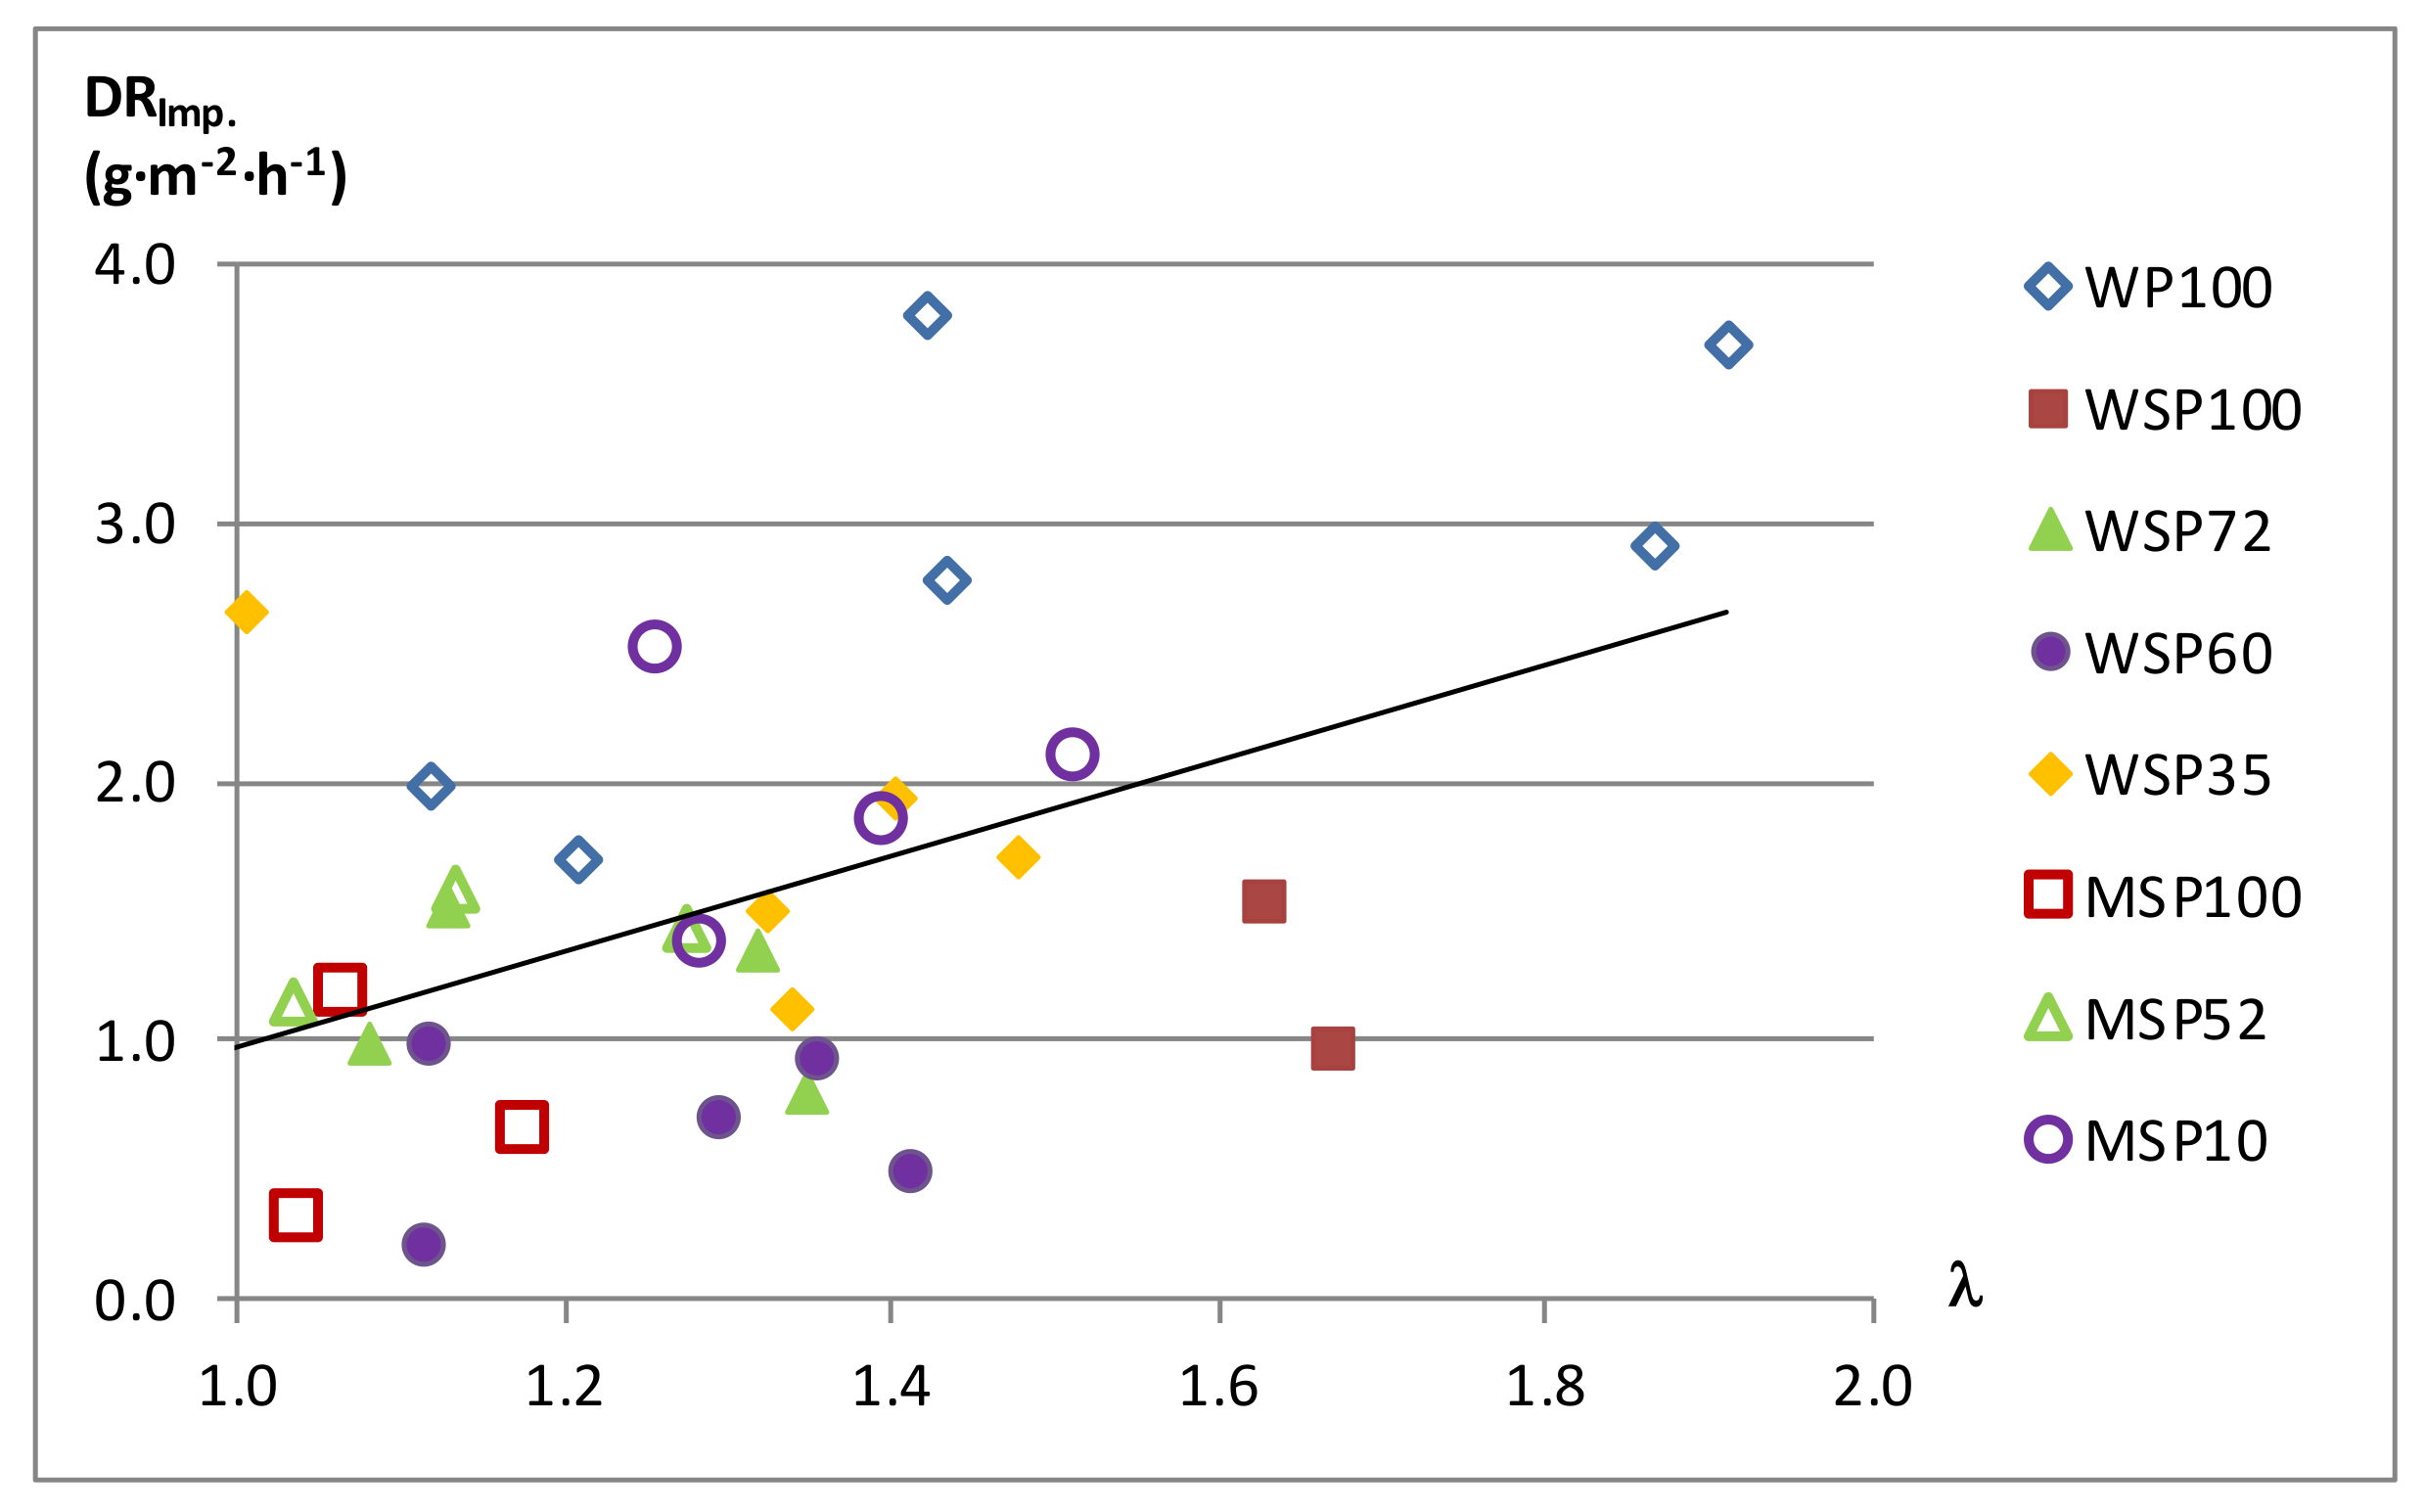
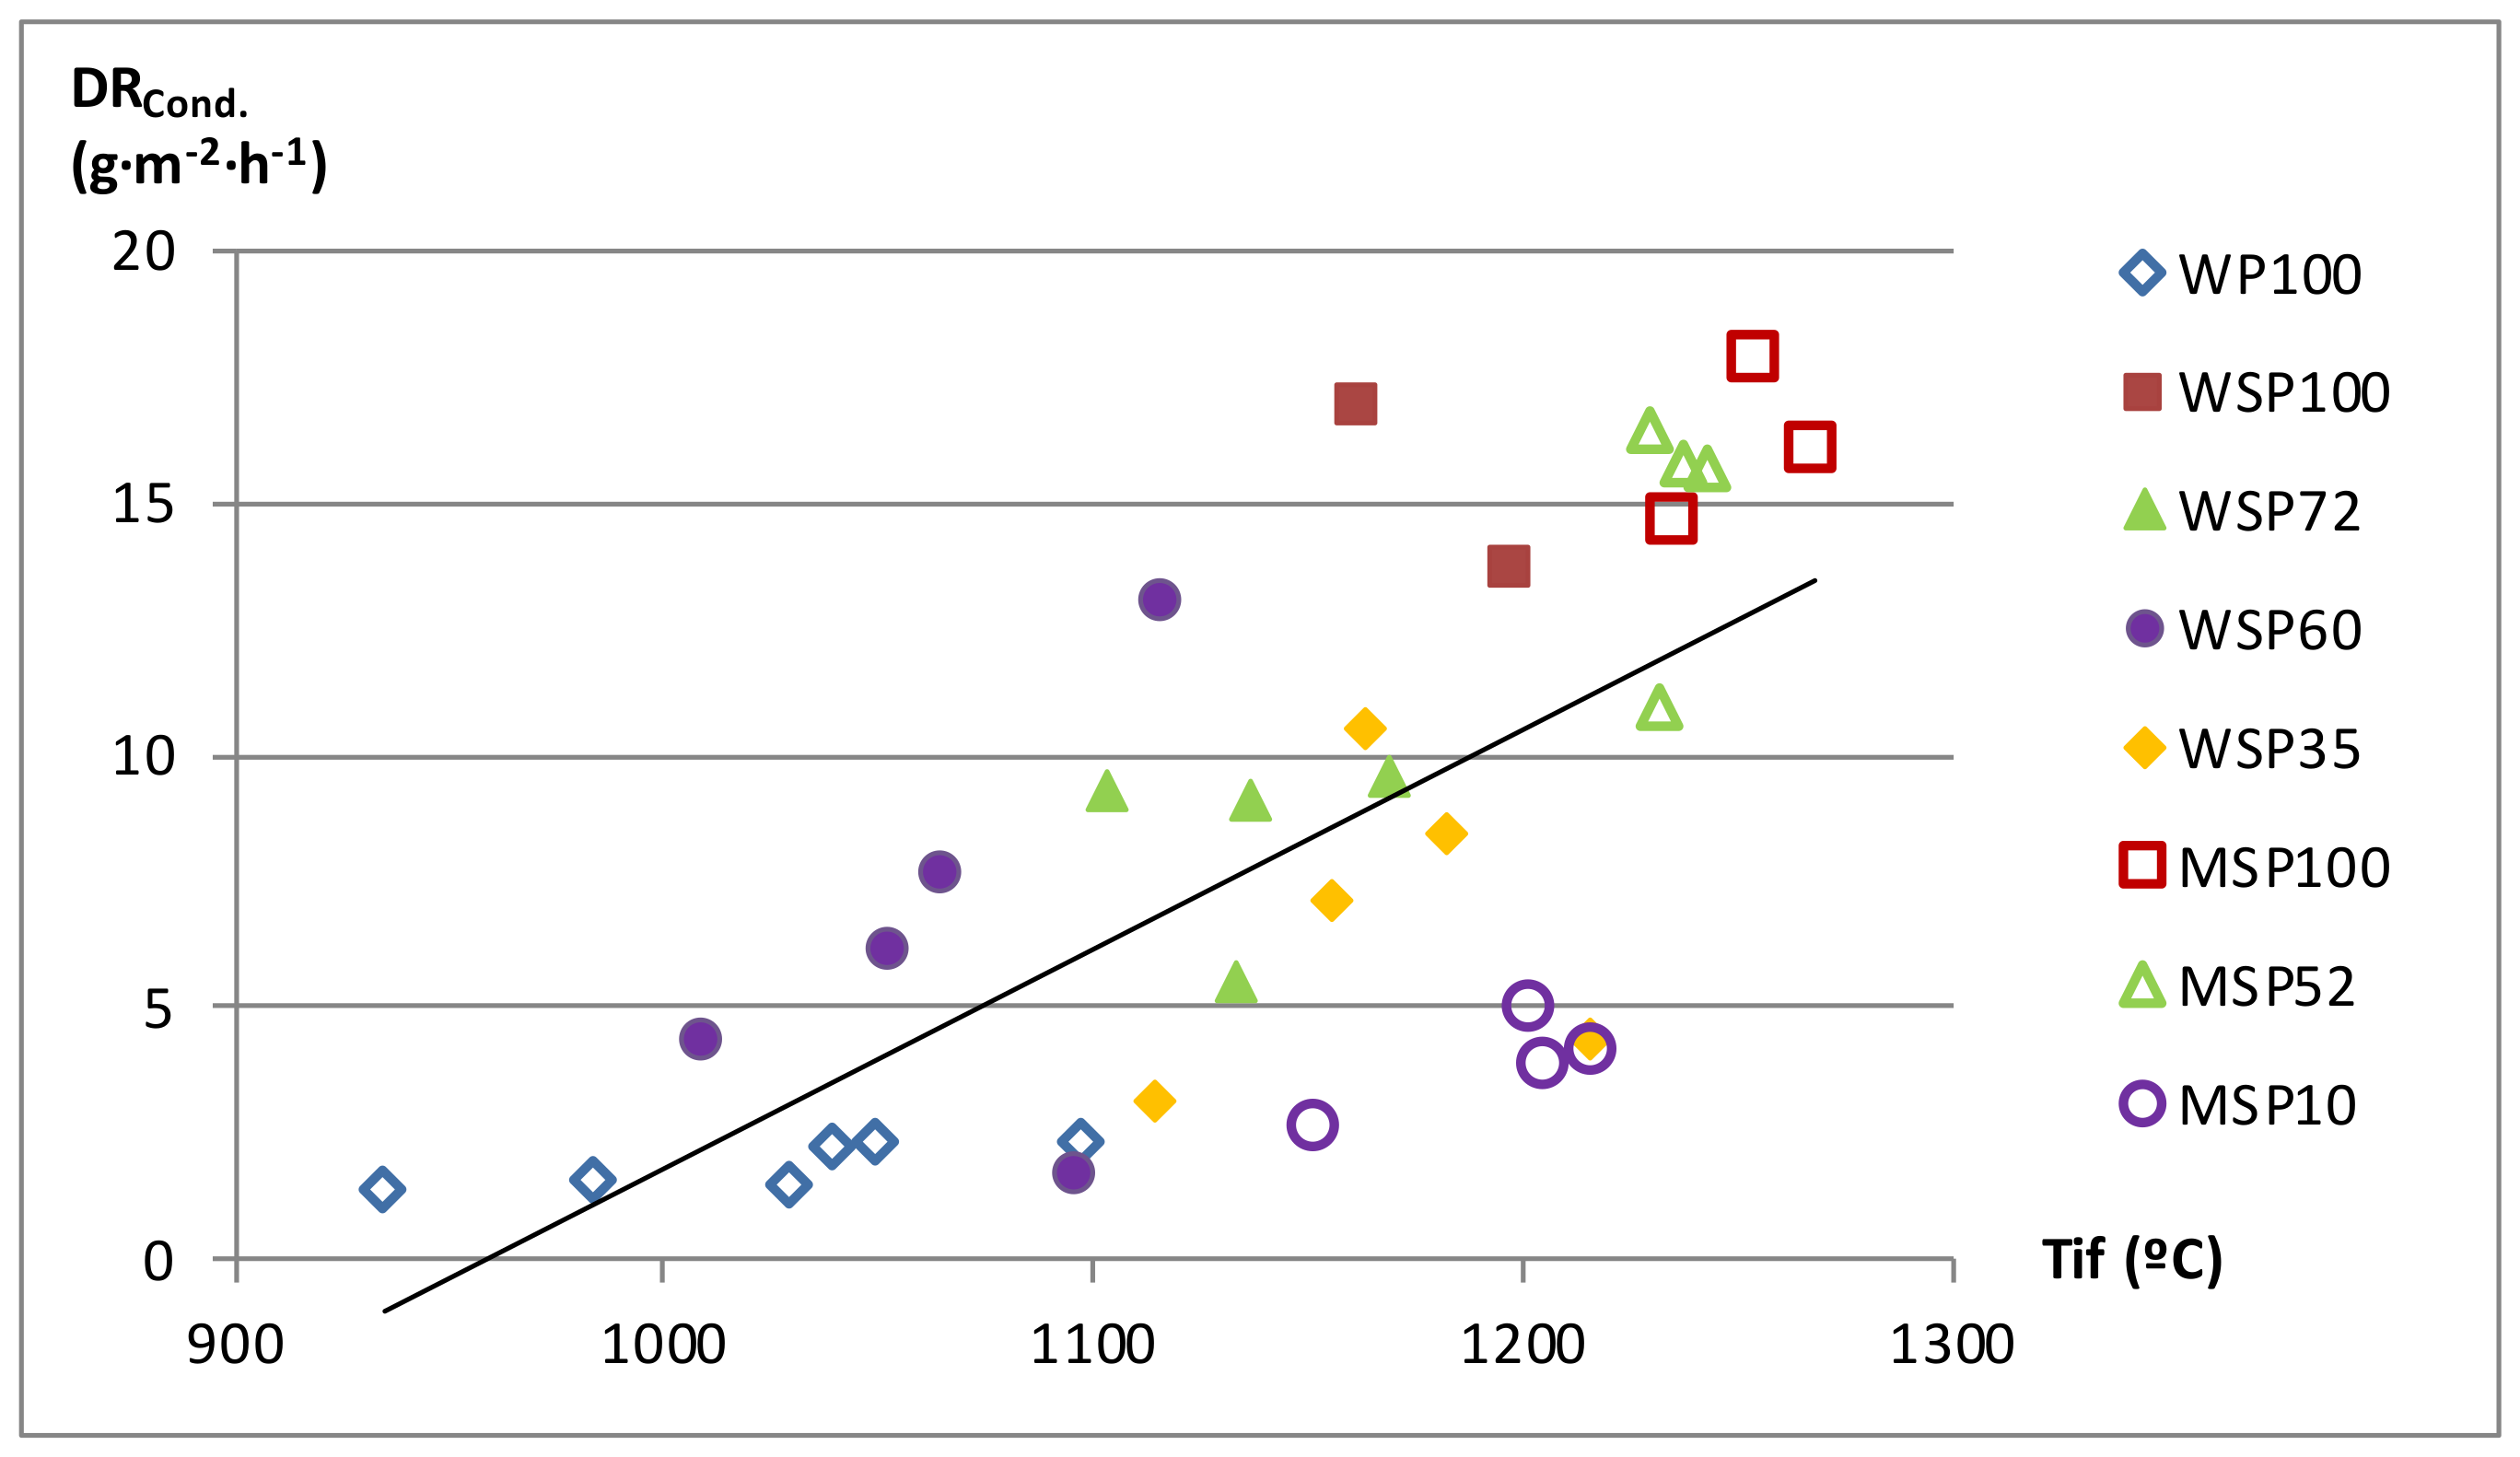
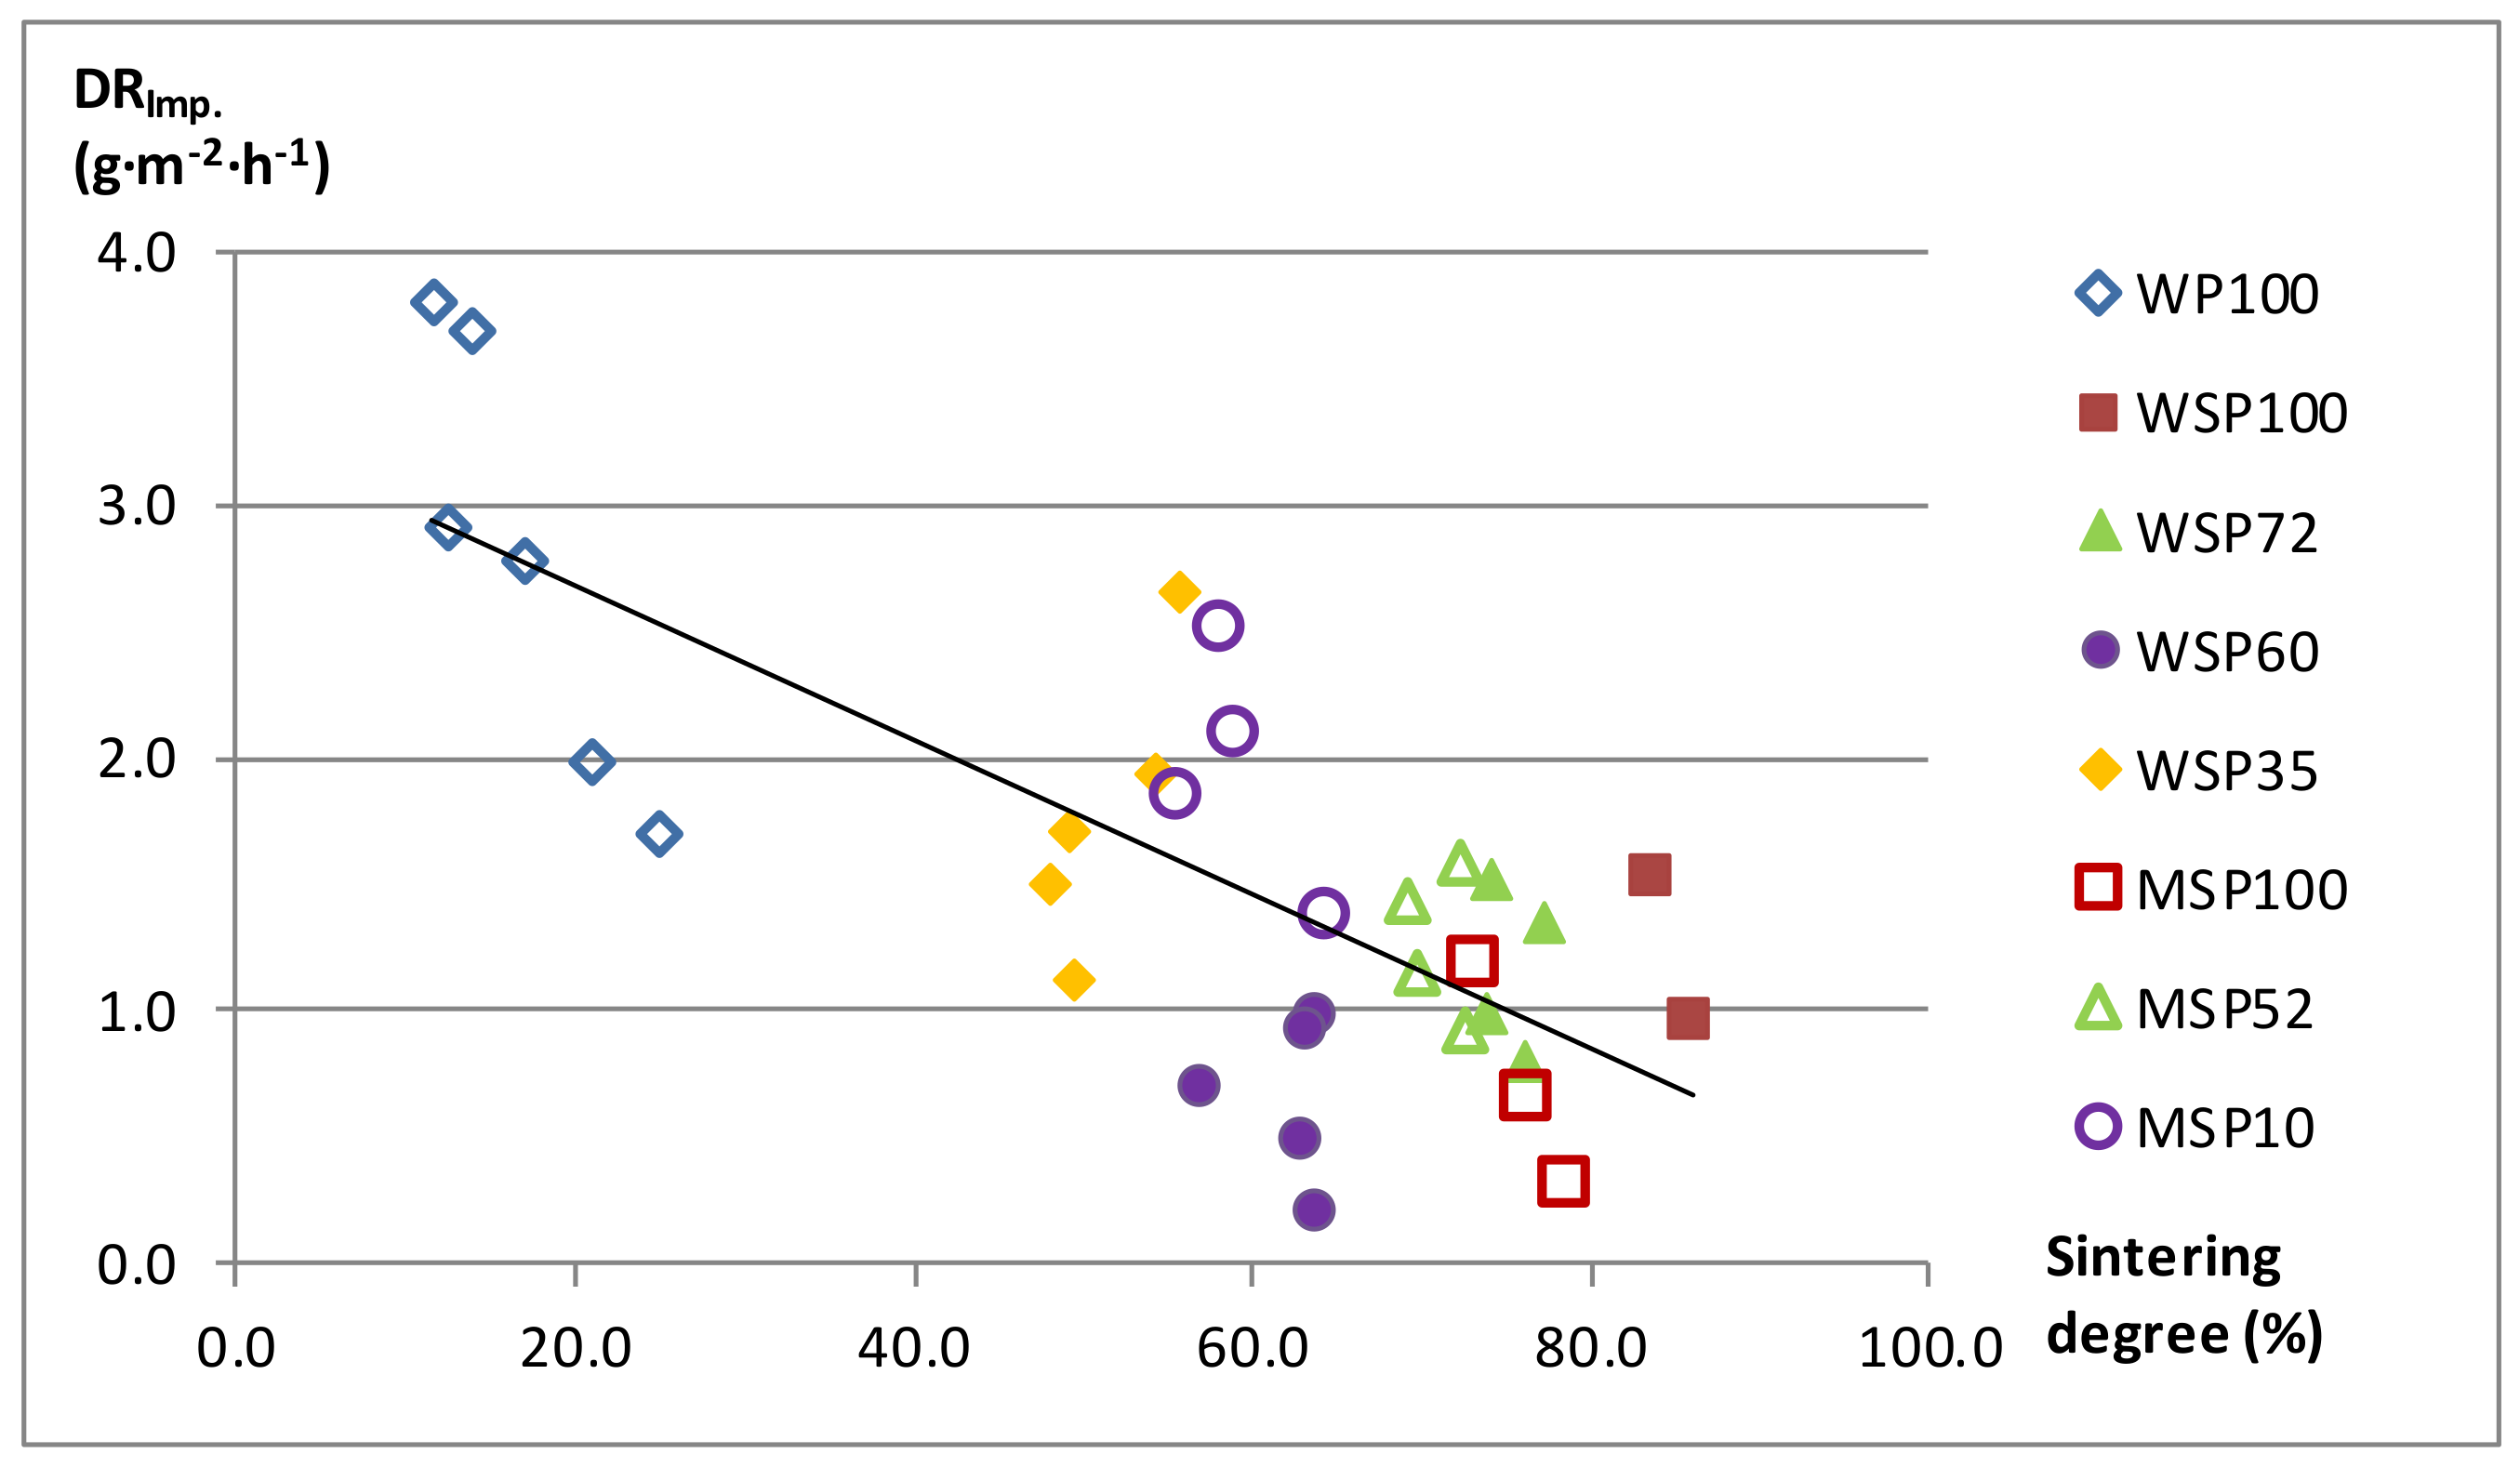
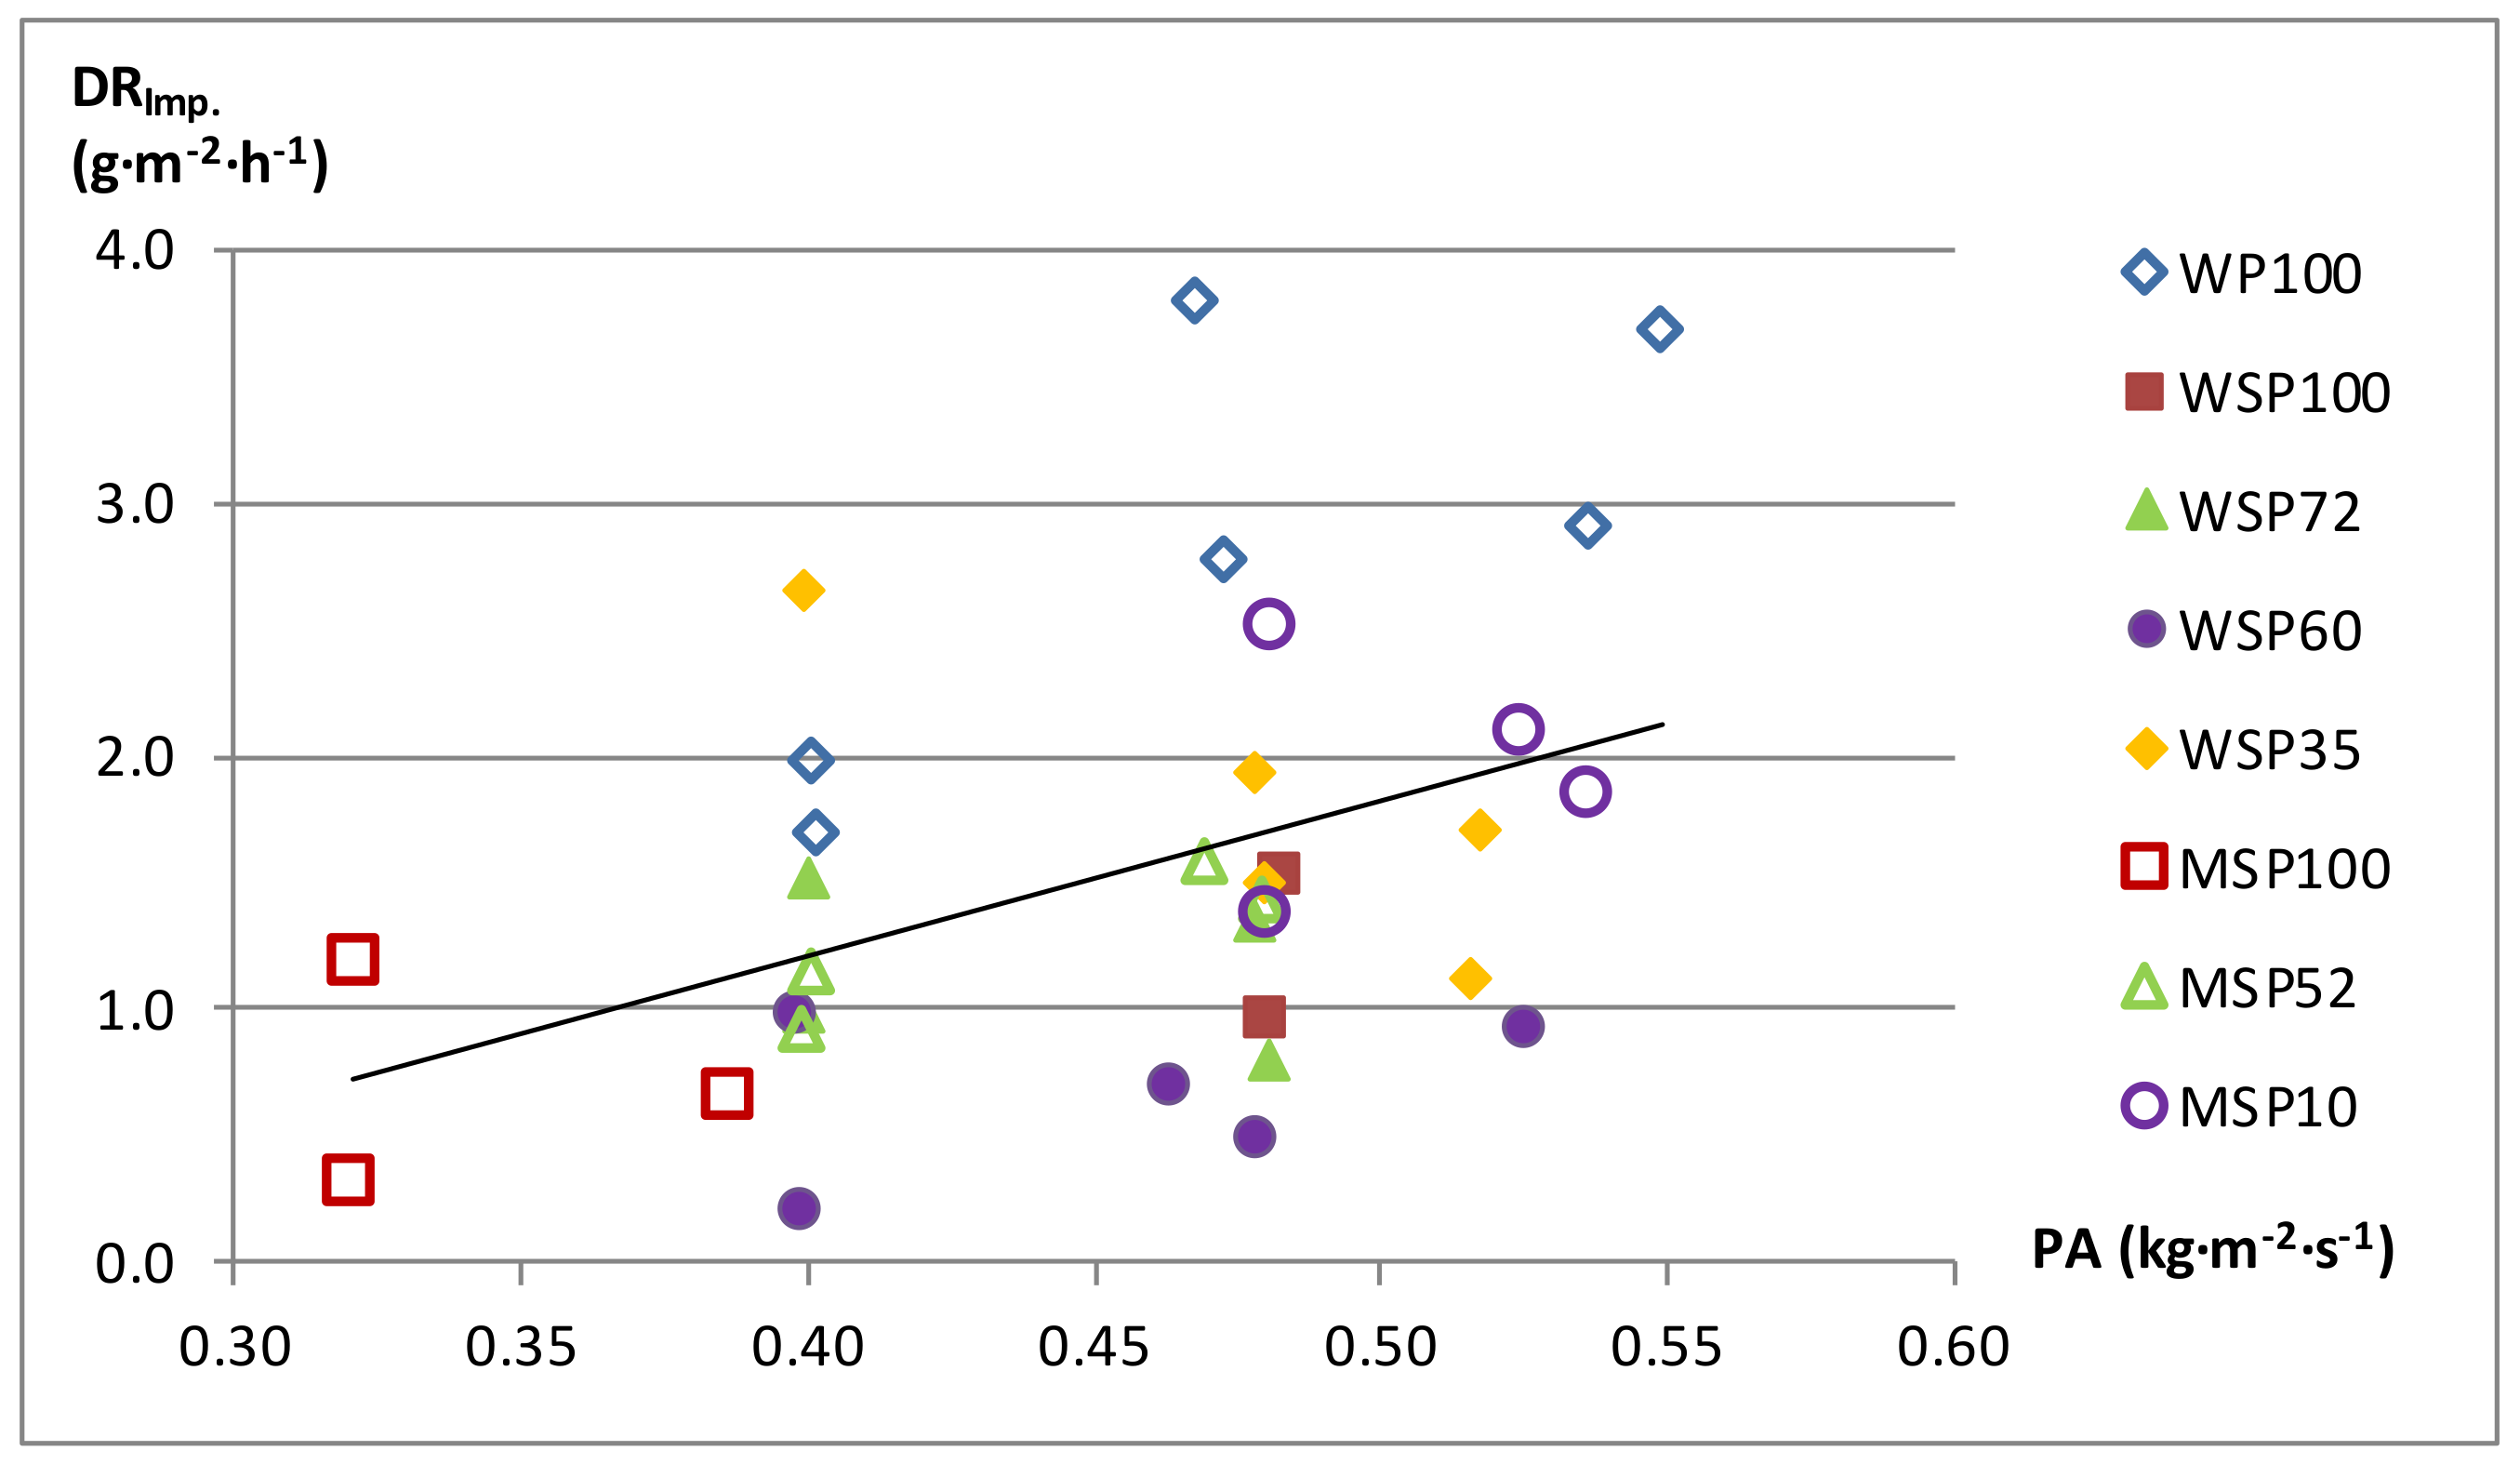
3.4.2. Influence of Operating Conditions

As was done in [20], given the low number of tests for each fuel with λ higher than 1, it is interesting to analyze all of them together (33 tests between the 8 fuels).
It can be seen in Figure 5 and Figure 6 how λ is negatively correlated with DRCond. (r = −0.40, p = 0.022) and positively with DRImp. (r = 0.48; p = 0.005). Thus, the increase in λ has opposite effects on each of the two deposition mechanisms. Nevertheless, given that in the case of blended pellets DRCond. has a greater influence than DRImp., it can be stated that increasing λ decreases DR, as already suggested in [20].
Although the separation of these two mechanisms makes the relationships obtained statistically relevant, and much stronger than the one between λ and DR (r = −0.34, p = 0.051, [20]), a significant dispersion of results is still observed in Figure 5 and Figure 6.
To better understand this dispersion, it is necessary to delve into the analysis of the effect associated to the λ increase on various operating conditions. On the one hand, when λ is increased, there is a decrease in the combustion temperature (for λ > 1), although it affects each fuel in a different way (as can be seen in [20]). This decrease in temperature, and not directly λ, is what produces a decrease in the vaporization of some compounds of the ash, with the consequent decrease in deposition by condensation. The very clear relationship between DRCond. and the mean flame temperature (Tif, °C) is shown in Figure 10 (r = 0.69, p < 0.001).
On the other hand, increasing λ also affects the entrainment of solid particles in two ways. Firstly, the aforementioned decrease in combustion temperature implies a decrease in the sintering degree (from the results presented in [20] it is possible to determine for all fuels as a whole that when λ > 1 there is a very clear correlation between the sintering degree and the combustion temperature: r = 0.68, p < 0.001). Secondly, there is a clear direct relationship between λ and air mass flow by unit area of the grate (PA, kg·m−2·s−1) so that an increase in λ corresponds to an increase in the air velocity in the bed [20]. Both effects, the decrease in the sintering degree and the increase in air velocity, allow a greater entrainment of solid particles and, consequently, a greater deposition by inertial impact as reflected in Figure 11 and Figure 12.
It can be seen how the relationship between DRImp. and the sintering degree is very strong (r = −0.75, p < 0.001), being of less intensity in the case of DRImp. vs. PA (r = 0.41; p = 0.016). Therefore, it can be inferred that the increase in inertial impact deposition with increasing λ is closely related to the decrease in the sintering degree and, to a lesser extent, to the increase in air velocity. However, it must be taken into account that a greater particle entrainment does not always have to produce a directly proportional increase of the inertial impact deposition, as for this deposition to occur there must be a sticky layer of condensation deposits.

4. Conclusions

The behaviour regarding the sintering and deposition phenomena of eight different biofuels produced by an agro-industry working as an IBLC has been studied in depth, through the analysis, using SEM-EDS and P-XRD techniques, of the ashes obtained in combustion tests.
With respect to sintering, the SEM-EDS and P-XRD results confirm a different behaviour of ash depending on its composition, in particular Si, Ca + Mg and K + Na. Additionally, a clear relationship has been found between the results of the SEM-EDS analysis and the initial composition of the ash of the fuels, and the differences are fully justifiable due to the different conditions at which the ashes were obtained in both cases. As the changes between the two types of analysis showed the same trend for all fuels, an adjustment of the current limits or definition of new indices and ratios from the initial composition of the ash of the fuels should allow a comparison of the phenomenon severity between the fuels for the same operating conditions.
Regarding deposition, it was determined that in WP100 the predominant deposition mechanism is inertial impact, while in blend pellets it is condensation. In addition, it was observed that when the percentage of herbaceous in the mixture increases, the deposition by condensation also increases significantly, while deposition due to inertial impact decreases only slightly.
Thus, it has been confirmed that due to the composition and quantity of its ashes, increasing the percentage of herbaceous in the blend increases sintering problems and also negatively affects the deposition phenomenon. To compensate at least in part for these negative effects, the operating conditions can be acted upon. Thus, increasing λ implies both a decrease in the sintering degree and in deposition by condensation. However, it must be taken into account that when λ increases there is a slight increase in deposition by inertial impact (although less important than the aforementioned decrease in deposition by condensation) and possibly in the amount of particles emitted through the chimney (which can be solved with an oversized particle capture system), as well as a decrease in boiler performance (which can be greatly limited with the use of condensing boilers).
Consequently, after performing the tests in the experimental installation and the depth analysis of the behaviour in terms of the sintering degree and deposition, aiming to minimize any negative effects, it can be stated that these biofuels are technically interesting to be burned in adapted boilers able to operate with agropellets and under appropriate operating conditions. Therefore, the production of these blended pellets based on herbaceous and forestry biomass by the fodder sector agro-industries working as IBLCs can contribute to opening an additional business line to be considered by these agro-industries during periods of lower activity.

Author Contributions

Conceptualization, J.R., P.C., S.Z., M.G. and C.B.; methodology, J.R. and P.C.; experimentation and validation, J.R., P.C. and S.Z.; formal analysis, J.R., P.C., S.Z., M.G. and C.B.; writing—original draft preparation, review and editing J.R., P.C., S.Z., M.G. and C.B.; visualization and supervision, J.R., P.C., S.Z., M.G. and C.B.; project administration, S.Z., M.G. and C.B.; funding acquisition, S.Z., M.G. and C.B. All authors have read and agreed to the published version of the manuscript.

Funding

This publication is part of a project that has received funding from the European Union’s Horizon 2020 research and innovation programme under grant agreement No 727961. The work was performed in the framework of the European project AGROinLOG (Grant Agreement No 727961) “Demonstration of innovative integrated biomass logistics centres for the Agro-industry sector in Europe”. www.agroinlog-h2020.eu (accessed on 28 December 2021).
Energies 15 01499 i001

Institutional Review Board Statement

Not applicable.

Informed Consent Statement

Not applicable.

Data Availability Statement

Not applicable.

Acknowledgments

The authors also would like to acknowledge the use of the Servicio General de Apoyo a la Investigación—SAI, Universidad de Zaragoza. We would like to acknowledge Bárbara Palacino, Javier Marcos and Óscar Puyo for their support during experimental work.

Conflicts of Interest

The authors declare no conflict of interest.

Abbreviations

%m/mMass percentage
DRDeposition Rate (g·m−2·h−1)
DRCond.Deposition Rate by Condensation (g·m−2·h−1)
DRImp.Deposition Rate by Inertial Impact (g·m−2·h−1)
EDSEnergy-Dispersive Spectrometry
IBLCIntegrated Biomass Logistic Center
MSPMaize Stalk Pellet (pure or blended with forestry wood)
pp-value (Pearson’s correlation)
PAAir mass flow by unit area of the grate (kg·m−2·s−1)
rPearson’s correlation coefficient
RIRReference Intensity Ratio
S1Not sintered ash fraction
S2Low sintered ash fraction
S2/3Fraction S2 plus fraction S3
S3High sintered ash fraction
SEMScanning Electron Microscopy
SrSlag viscosity index
TaInlet air temperature (°C)
TifMean flame temperature (°C)
WPWood Pellet
WSPWheat Straw Pellet (pure or blended with forestry wood)
P-XRDPowder X-Ray Diffractometry
λExcess air ratio (%)

References

  1. Zeng, T.; Weller, N.; Pollex, A.; Lenz, V. Blended biomass pellets as fuel for small scale combustion appliances: Influence on gaseous and total particulate matter emissions and applicability of fuel indices. Fuel 2016, 184, 689–700. [Google Scholar] [CrossRef]
  2. Carvalho, L.; Wopienka, E.; Pointner, C.; Lundgren, J.; Verma, V.K.; Haslinger, W.; Schmidl, C. Performance of a pellet boiler fired with agricultural fuels. Appl. Energy 2013, 104, 286–296. [Google Scholar] [CrossRef]
  3. Houshfar, E.; Løvås, T.; Skreiberg, Ø. Experimental Investigation on NOx Reduction by Primary Measures in Biomass Combustion: Straw, Peat, Sewage Sludge, Forest Residues and Wood Pellets. Energies 2012, 5, 270–290. [Google Scholar] [CrossRef] [Green Version]
  4. Boström, D.; Skoglund, N.; Grimm, A.; Boman, C.; Öhman, M.; Broström, M.; Backman, R. Ash Transformation Chemistry during Combustion of Biomass. Energy Fuels 2011, 26, 85–93. [Google Scholar] [CrossRef]
  5. Garba, M.U.; Ingham, D.B.; Ma, L.; Porter, R.T.J.; Pourkashnian, M.; Tan, H.Z.; Williams, A. Prediction of Potassium Chloride Sulfation and Its Effect on Deposition in Biomass-Fired Boilers. Energy Fuels 2012, 26, 6501–6508. [Google Scholar] [CrossRef]
  6. Wang, L.; Skjevrak, G.; Hustad, J.E.; Grønli, M.G.; Skreiberg, Ø. Effects of Additives on Barley Straw and Husk Ashes Sintering Characteristics. Energy Procedia 2012, 20, 30–39. [Google Scholar] [CrossRef] [Green Version]
  7. Díaz-Ramírez, M.; Sebastián, F.; Royo, J.; Rezeau, A. Influencing factors on NOX emission level during grate conversion of three pelletized energy crops. Appl. Energy 2013, 115, 360–373. [Google Scholar] [CrossRef]
  8. Diaz-Ramirez, M.; Boman, C.; Sebastian, F.; Royo, J.; Xiong, S.; Bostrom, D. Ash characterization and transformation behaviour of the fixed-bed combustion of novel crops: Poplar, brassica, and cassava fuels. Energy Fuels 2012, 26, 3218–3229. [Google Scholar] [CrossRef]
  9. Díaz-Ramírez, M.; Sebastian, F.; Royo, J.; Rezeau, A. Combustion requirements for conversion of ash-rich novel energy crops in a 250 kWth multifuel grate fired system. Energy 2012, 46, 636–643. [Google Scholar] [CrossRef]
  10. Díaz-Ramírez, M.; Frandsen, F.J.; Glarborg, P.; Sebastian, F.; Royo, J. Partitioning of K, Cl, S and P during combustion of poplar and brassica energy crops. Fuel 2014, 134, 209–219. [Google Scholar] [CrossRef]
  11. Vassilev, S.V.; Baxter, D.; Vassileva, C.G. An overview of the behaviour of biomass during combustion: Part II. Ash fusion and ash formation mechanisms of biomass types. Fuel 2014, 117, 152–183. [Google Scholar] [CrossRef]
  12. Zhu, Y.; Tan, H.; Niu, Y.; Wang, X. Experimental study on ash fusion characteristics and slagging potential using simulated biomass ashes. J. Energy Inst. 2018, 92, 1889–1896. [Google Scholar] [CrossRef]
  13. Fernández, M.J.; Mediavilla, I.; Barro, R.; Borjabad, E.; Ramos, R.; Carrasco, J.E. Sintering reduction of herbaceous biomass when blended with woody biomass: Predictive and combustion tests. Fuel 2018, 239, 1115–1124. [Google Scholar] [CrossRef]
  14. Rodriguez, J.L.; Álvarez, X.; Valero, E.; Ortiz, L.; de la Torre-Rodríguez, N.; Acuña-Alonso, C. Design of solid biofuels blends to minimize the risk of sintering in biomass boiler. J. Energy Inst. 2020, 93, 2409–2414. [Google Scholar] [CrossRef]
  15. Lachman, J.; Baláš, M.; Lisý, M.; Lisá, H.; Milčák, P.; Elbl, P. An overview of slagging and fouling indicators and their applicability to biomass fuels. Fuel Process. Technol. 2021, 217, 106804. [Google Scholar] [CrossRef]
  16. Zeng, T.; Pollex, A.; Weller, N.; Lenz, V.; Nelles, M. Blended biomass pellets as fuel for small scale combustion appliances: Effect of blending on slag formation in the bottom ash and pre-evaluation options. Fuel 2018, 212, 108–116. [Google Scholar] [CrossRef]
  17. Míguez, J.L.; Porteiro, J.; Behrendt, F.; Blanco, D.; Patiño, D.; Dieguez-Alonso, A. Review of the use of additives to mitigate operational problems associated with the combustion of biomass with high content in ash-forming species. Renew. Sustain. Energy Rev. 2021, 141, 110502. [Google Scholar] [CrossRef]
  18. Rodríguez, J.L.; Álvarez, X.; Valero, E.; Ortiz, L.; de la Torre-Rodríguez, N.; Acuña-Alonso, C. Influence of ashes in the use of forest biomass as source of energy. Fuel 2020, 283. [Google Scholar] [CrossRef]
  19. European Project AGROinLOG. Demonstration of Innovative Integrated Biomass Logistics Centres for the Agro-Industry Sector in Europe. 17 February 2021. Available online: http://agroinlog-h2020.eu/en/home/ (accessed on 28 December 2021).
  20. Zapata, S.; Gómez, M.; Bartolomé, C.; Canalís, P.; Royo, J. Ash behaviour in combustion of agropellets produced in agro-industry. Part 1: Blends definition and experimental tests results. Energies 2022. in press. [Google Scholar]
  21. Capablo, J. Formation of alkali salt deposits in biomass combustion. Fuel Process. Technol. 2016, 153, 58–73. [Google Scholar] [CrossRef]
  22. Vassilev, S.V.; Vassileva, C.G. Methods for Characterization of Composition of Fly Ashes from Coal-Fired Power Stations: A Critical Overview. Energy Fuels 2005, 19, 1084–1098. [Google Scholar] [CrossRef]
  23. Liu, Y.; He, Y.; Wang, Z.; Xia, J.; Wan, K.; Whiddon, R.; Cen, K. Characteristics of alkali species release from a burning coal/biomass blend. Appl. Energy 2018, 215, 523–531. [Google Scholar] [CrossRef] [Green Version]
  24. Llorente, M.F.; Arocas, P.D.; Nebot, L.G.; García, J.C. The effect of the addition of chemical materials on the sintering of biomass ash. Fuel 2008, 87, 2651–2658. [Google Scholar] [CrossRef]
  25. Wang, L.; Skreiberg, Ø.; Becidan, M. Investigation of additives for preventing ash fouling and sintering during barley straw combustion. Appl. Therm. Eng. 2014, 70, 1262–1269. [Google Scholar] [CrossRef]
  26. Royo, J.; Canalís, P.; Quintana, D. Chemical study of bottom ash sintering in combustion of pelletized residual agricultural biomass. Fuel 2022, 310, 122145. [Google Scholar] [CrossRef]
  27. Royo, J.; Canalís, P.; Quintana, D. Chemical study of fly ash deposition in combustion of pelletized residual agricultural biomass. Fuel 2020, 268, 117228. [Google Scholar] [CrossRef]
  28. Brand, M.A.; Rodrigues, T.M.; da Silva, J.P.; de Oliveira, J. Recovery of agricultural and wood wastes: The effect of biomass blends on the quality of pellets. Fuel 2020, 284, 118881. [Google Scholar] [CrossRef]
  29. Zhou, H.; Jensen, A.; Glarborg, P.; Jensen, P.A.; Kavaliauskas, A. Numerical modeling of straw combustion in a fixed bed. Fuel 2005, 84, 389–403. [Google Scholar] [CrossRef]
  30. Ryu, C.; Yang, Y.B.; Khor, A.; Yates, N.E.; Sharifi, V.N.; Swithenbank, J. Effect of fuel properties on biomass combustion: Part I. Experiments—Fuel type, equivalence ratio and particle size. Fuel 2006, 85, 1039–1046. [Google Scholar] [CrossRef]
  31. Porteiro, J.; Patiño, D.; Collazo, J.; Granada, E.; Moran, J.; Miguez, J.L. Experimental analysis of the ignition front propagation of several biomass fuels in a fixed-bed combustor. Fuel 2010, 89, 2635. [Google Scholar] [CrossRef]
  32. Houshfar, E.; Khalil, R.A.; Løvås, T.; Skreiberg, Ø. Enhanced NOx Reduction by Combined Staged Air and Flue Gas Recirculation in Biomass Grate Combustion. Energy Fuels 2012, 26, 3003–3011. [Google Scholar] [CrossRef]
  33. Lindström, E.; Sandström, M.; Boström, D.; Öhman, M. Slagging Characteristics during Combustion of Cereal Grains Rich in Phosphorus. Energy Fuels 2007, 21, 710–717. [Google Scholar] [CrossRef]
  34. Zevenhoven, M.; Yrjas, P.; Skrifvars, B.-J.; Hupa, M. Characterization of Ash-Forming Matter in Various Solid Fuels by Selective Leaching and Its Implications for Fluidized-Bed Combustion. Energy Fuels 2012, 26, 6366–6386. [Google Scholar] [CrossRef]
  35. Sommersacher, P.; Brunner, T.; Obernberger, I. Fuel Indexes: A Novel Method for the Evaluation of Relevant Combustion Properties of New Biomass Fuels. Energy Fuels 2011, 26, 380–390. [Google Scholar] [CrossRef]
  36. Niu, Y.; Tan, H.; Hui, S. Ash-related issues during biomass: Alkali-induced slagging, silicate melt-induced slagging (ash fusion), agglomeration, corrosion, ash utilization, and related countermeasures. Prog. Energy Combust. Sci. 2016, 52, 1–61. [Google Scholar] [CrossRef]
  37. Vassilev, S.V.; Baxter, B.; Vassileva, C.G. An overview of the behaviour of biomass during combustion: Part I. Phase-mineral transformations of organic and inorganic matter. Fuel 2013, 112, 391–449. [Google Scholar] [CrossRef]
  38. Okuno, T.; Sonoyama, N.; Hayashi, J.-I.; Li, C.-Z.; Sathe, A.C.; Chiba, T. Primary Release of Alkali and Alkaline Earth Metallic Species during the Pyrolysis of Pulverized Biomass. Energy Fuels 2005, 19, 2164–2171. [Google Scholar] [CrossRef]
  39. Niu, Y.Q.; Tan, H.Z.; Ma, L.; Pourkashanian, M.; Liu, Z.N.; Liu, Y.; Wang, X.; Liu, H.; Xu, T. Slagging characteristics on the superheaters of a 12 MW biomass-fired boiler. Energy Fuels 2010, 24, 5222–5227. [Google Scholar] [CrossRef]
  40. Niu, Y.; Tan, H.; Wang, X.; Liu, Z.; Liu, Y.; Xu, T. Study on Deposits on the Surface, Upstream, and Downstream of Bag Filters in a 12 MW Biomass-Fired Boiler. Energy Fuels 2010, 24, 2127–2132. [Google Scholar] [CrossRef]
  41. Mu, L.; Zhao, L.; Liu, L.; Yin, H. Elemental Distribution and Mineralogical Composition of Ash Deposits in a Large-Scale Wastewater Incineration Plant: A Case Study. Ind. Eng. Chem. Res. 2012, 51, 8684–8694. [Google Scholar] [CrossRef]
  42. Wei, X.; Schnell, U.; Hein, K.R. Behaviour of gaseous chlorine and alkali metals during biomass thermal utilisation. Fuel 2005, 84, 841–848. [Google Scholar] [CrossRef] [Green Version]
  43. Jensen, P.A.; Stenholm, M.; Hald, P. Deposition Investigation in Straw-Fired Boilers. Energy Fuels 1997, 11, 1048–1055. [Google Scholar] [CrossRef]
  44. Weber, R.; Poyraz, Y.; Mancini, M.; Schwabauer, A. Biomass fly-ash deposition: Dependence of deposition rate on probe/particle temperature in 115–1200 °C range. Fuel 2021, 290, 120033. [Google Scholar] [CrossRef]
  45. Pronobis, M. Evaluation of the influence of biomass co-combustion on boiler furnace slagging by means of fusibility correlations. Biomass Bioenergy 2005, 28, 375–383. [Google Scholar] [CrossRef]
Figure 1. Si concentration in bottom ash versus Si concentration in fuel preliminary analysis.
Energies 15 01499 g001
Figure 2. Ca + Mg concentration in bottom ash versus Ca + Mg concentration in fuel preliminary analysis.
Energies 15 01499 g002
Figure 3. K + Na concentration in bottom ash versus K + Na concentration in fuel preliminary analysis.
Energies 15 01499 g003
Figure 4. P concentration in bottom ash versus P concentration in fuel preliminary analysis.
Energies 15 01499 g004
Figure 5. Deposition rates by condensation versus λ.
Energies 15 01499 g005
Figure 6. Deposition rates by inertial impact versus λ.
Energies 15 01499 g006
Figure 7. Deposition rate by condensation versus K + Na (mol/kgfuel).
Energies 15 01499 g007
Figure 8. Deposition rate by condensation versus Cl + 2S (mol/kgfuel).
Energies 15 01499 g008
Figure 9. Deposition rate by inertial impact versus Sr index.
Energies 15 01499 g009
Figure 10. Deposition rates by condensation versus Tif.
Energies 15 01499 g010
Figure 11. Deposition rates by inertial impact versus sintering degree.
Energies 15 01499 g011
Figure 12. Deposition rates by inertial impact versus PA.
Energies 15 01499 g012
Table 1. Fuel properties (% a.r.: weight percentage as received; % d.b.: weight percentage in dry basis).
ParameterUnitsWP100WSP100WSP72WSP60WSP35MSP100MSP52MSP10
Wood Pellet 100%Wheat Straw Pellet
100%
Wheat Straw Pellet
72%
Wheat Straw Pellet 60%Wheat Straw Pellet 35%Maize Stalk Pellet
100%
Maize Stalk Pellet 52%Maize Stalk Pellet 10%
Proximate analysis
Moisture (a)% a.r.7.64.86.46.710.25.55.57.6
Volatile matter (b)% d.b.81.073.874.574.974.771.772.974.8
Fixed carbon (c)% d.b.18.020.121.622.021.215.820.922.1
Ash (d)% d.b.1.06.13.93.14.112.56.23.2
C (e)% d.b.51.9045.5048.1049.2049.3042.6048.1051.4
H (e)% d.b.5.805.805.906.005.905.205.805.8
N (e)% d.b.0.130.420.300.500.290.820.440.27
S (f)% d.b.0.010.080.080.030.050.130.030.03
Cl (f)% d.b.0.020.190.060.050.050.530.200.06
O (c)% d.b.41.0041.9141.6641.1240.3238.2039.2337.7
Heating value
Low heating value (g)kWh/kg, a.r.4.904.434.594.674.504.004.614.70
Ash analysis (h)
Na2O% d.b.1.50.270.580.510.890.640.671.17
MgO% d.b.9.063.042.862.912.697.996.16.77
Al2O3% d.b.5.621.191.752.135.885.815.827.00
SiO2% d.b.16.5555.8138.1134.5735.0038.9438.3827.71
P2O5% d.b.3.892.624.363.842.963.614.173.65
K2O% d.b.13.2721.7127.5228.4823.8711.0511.7511.29
CaO% d.b.41.029.8817.5020.2721.621.9524.9735.06
TiO2% d.b.0.350.080.100.120.210.30.290.38
Fe2O3% d.b.3.850.570.851.031.812.352.563.17
(a) EN-ISO 18134:2016, (b) EN-ISO 18123:2016, (c) Calculated, (d) EN-ISO 18122:2016, (e) EN-ISO 16948:2015, (f) EN-ISO 16994:2015, (g) EN-ISO 14918:2011, (h) EN-ISO 16967:2015
Table 2. Summary of reactor test features.
WP100WSP100WSP72WSP60WSP35MSP100MSP52MSP10
Number of successful tests10889105810
λMin0.660.850.750.740.620.810.640.64
Max1.911.671.351.411.481.181.271.51
Mean1.201.131.041.081.060.980.931.04
Tif (°C)Min934.91134.71103.31009.21099.61234.11202.61151.6
Max1179.51251.71168.91136.11239.41267.61281.91267.6
Mean1069.01176.41133.31090.61180.51248.01235.21229.6
Bottom ash proportion (%)Mean44.2186.2183.1872.6569.5980.6579.9487.95
Sintering degree (%)Mean19.9684.1574.8663.0951.8875.5169.5662.07
Deposition rate (DR) (a)Mean4.7116.679.537.188.5316.9015.975.87
(a) Only test with λ > 1.
Table 3. Mean values (range) of the elemental composition (SEM-EDS) of fraction S1 of bottom ash expressed as a percentage of the total mass of measured elements (Na, Mg, Al, Si, P, S, Cl, K and Ca) (%m/m: mass percentage).
NaMgAlSiPSClKCaCa + MgK + Na
WP1001.28
(1.12–1.41)
6.19
(5.66–6.96)
4.69
(4.17–5.44)
21.76
(16.79–27.06)
2.76
(2.51–3.14)
0.74
(0.26–1.45)
0.1
(0.02–0.21)
13.41
(9.5–17.71)
49.07
(47.23–52.73)
55.26
(53.45–59.1)
14.69
(10.78–18.95)
WSP1000.28
(0.2–0.36)
2.25
(2.19–2.32)
0.9
(0.82–1)
49.23
(46.85–51.14)
1.95
(1.85–2.21)
0.82
(0.44–1.37)
0.56
(0.21–1.06)
29.79
(28.61–30.65)
14.22
(13.38–15.06)
16.47
(15.57–17.3)
30.06
(28.83–31)
WSP720.46
(0.41–0.51)
1.95
(1.86–2.1)
1.32
(1.18–1.68)
32.99
(31.32–35.62)
3.36
(3.21–3.47)
2.15
(1.53–2.52)
0.4
(0.23–0.57)
35.31
(33.9–35.97)
22.06
(20.51–23.03)
24.01
(22.41–25.14)
35.76
(34.31–36.41)
WSP600.57
(0.46–0.69)
2.32
(2.11–2.45)
1.53
(1.38–1.73)
27.14
(23.13–31.11)
2.82
(2.64–3.03)
2.11
(1.61–2.74)
0.37
(0.15–0.59)
36.25
(35.24–37.43)
26.89
(24.21–28.76)
29.21
(26.42–31.17)
36.82
(35.8–38.03)
WSP351.1
(0.97–1.2)
2.53
(2.28–2.84)
3.49
(3.21–3.86)
30.02
(27.8–32.2)
2.38
(2.22–2.64)
1.88
(1.45–2.57)
0.29
(0.09–0.47)
28.55
(26.97–29.51)
29.77
(27.99–32.39)
32.3
(30.34–35.21)
29.65
(28.06–30.68)
MSP1000.63
(0.54–0.71)
5.16
(4.96–5.27)
4.08
(3.93–4.34)
37.99
(36.77–39.97)
2.45
(2.33–2.67)
0.79
(0.66–0.9)
0.86
(0.66–1.19)
11.13
(10.65–12.15)
36.91
(35.94–38.01)
42.07
(40.89–43.21)
11.76
(11.3–12.73)
MSP520.7
(0.61–0.77)
4.52
(4.24–4.7)
4.31
(4.04–4.72)
35.99
(34.46–38.2)
2.97
(2.8–3.22)
0.83
(0.69–1.05)
0.46
(0.3–0.59)
13.21
(11.96–14.57)
36.99
(34.22–39.17)
41.51
(38.46–43.84)
13.91
(12.67–15.24)
MSP101.15
(1.02–1.26)
4.1
(3.72–4.29)
5.2
(4.9–5.57)
37.37
(36.02–40.21)
2.06
(1.91–2.21)
0.56
(0.37–0.81)
0.15
(−0.01–0.26)
12.53
(12.01–13.02)
36.88
(34.56–38.19)
40.98
(38.28–42.32)
13.68
(13.18–14.12)
Table 4. Mean values (range) of the elemental composition (SEM-EDS) of fraction S2/3 of bottom ash, expressed as a percentage of the total mass of measured elements (Na, Mg, Al, Si, P, S, Cl, K and Ca) (%m/m: mass percentage).
NaMgAlSiPSClKCaCa + MgK + Na
WP1000.91
(0.31–1.36)
5.21
(3.94–6.46)
4.25
(1.75–5.61)
29.94
(25.16–38.54)
2.47
(2.04–2.83)
0.09
(0.04–0.24)
0.02
(−0.05–0.08)
9.38
(6.4–14.74)
47.73
(36.96–52.39)
52.94
(40.9–57.2)
10.29
(7.43–15.43)
WSP1000.23
(0.17–0.29)
2.35
(2.23–2.43)
1.04
(0.95–1.2)
52.28
(51.11–53.44)
1.99
(1.88–2.23)
0.16
(0.07–0.23)
0.03
(−0.04–0.1)
27.85
(26.49–28.37)
14.07
(13.47–14.71)
16.42
(15.9–17.03)
28.08
(26.71–28.67)
WSP720.36
(0.27–0.43)
1.81
(1.72–1.91)
1.44
(1.34–1.62)
37.64
(36.85–38.46)
3.13
(3.04–3.36)
0.29
(0.14–0.53)
–0.01
(−0.06–0.07)
34.09
(32.98–34.91)
21.24
(20.98–21.66)
23.06
(22.88–23.47)
34.45
(33.42–35.29)
WSP600.53
(0.48–0.58)
2.06
(1.92–2.17)
1.78
(1.69–1.9)
33.48
(32.28–34.05)
2.71
(2.55–2.81)
0.22
(0.11–0.38)
0.01
(−0.05–0.05)
33.37
(32.51–34.38)
25.86
(25.38–26.36)
27.92
(27.45–28.28)
33.9
(33.02–34.93)
WSP351.06
(0.9–1.15)
2.06
(1.88–2.23)
3.96
(3.78–4.19)
39.63
(38.79–41.22)
2.02
(1.92–2.18)
0.1
(0.02–0.2)
0.02
(−0.04–0.08)
25.27
(23.8–25.99)
25.89
(25.06–26.78)
27.95
(27.09–28.7)
26.33
(24.88–27.06)
MSP1000.57
(0.53–0.63)
4.38
(4.23–4.53)
4.04
(3.79–4.2)
46.51
(43.97–48.7)
1.97
(1.86–2.15)
0.12
(0.02–0.24)
0
(−0.06–0.06)
8.95
(8.2–9.47)
33.46
(30.98–35.66)
37.84
(35.37–40.13)
9.52
(8.75–10.06)
MSP520.62
(0.56–0.75)
3.97
(3.73–4.3)
4.27
(4.09–4.44)
45.28
(44.58–46.21)
2.53
(2.42–2.7)
0.02
(−0.08–0.07)
0.02
(−0.01–0.08)
11.91
(11.55–12.52)
31.38
(29.19–32.8)
35.35
(33.49–36.53)
12.53
(12.12–13.27)
MSP101.06
(0.96–1.15)
3.58
(3.44–3.66)
5.6
(5.48–5.7)
44.75
(44.29–45.32)
1.65
(1.49–1.79)
0.01
(−0.03–0.07)
0.01
(−0.06–0.06)
10.56
(10.25–11.09)
32.8
(32.46–33.36)
36.38
(36.06–36.89)
11.61
(11.32–12.24)
Table 5. Fraction S2/3 composition (combustion test selected).
λP-XRD Analysis Results
Crystalline Matter (%) (a)Amorphous (%) (b)
SiO2KAlSi2O6Ca3(Si3O9)K2Mg2(SO4)3Ca2(SiO4)Ca2Mg(Si2O7)Ca2Al3Si3O12(OH)CaMg(CO3)2CaSiO3(Na0.75K0.25)
(AlSi3O8)
WP100(d)0.8310.7 1517.134.116.8 36.66
0.866.4 5.6963.912.1 3.94
1.427.6 11.313.352.912.1 25.38
1.441.6 12.415.25614.8 3.3
WSP1000.87X (c) 99.84
0.85X (c) 97.81
1.63X (c) 96.93
1.67X (c) 96.1
WSP720.95X (c) X (c) 97.65
0.97X (c) X (c) 97.67
1.35X (c) X (c) 96.42
1.32X (c) X (c) 94.53
WSP600.99X (c) X (c) 95.7
0.96 X (c) 95.21
1.41 X (c)X (c) 93.56
1.30 X (c) 92.1
WSP350.8811.513.275.3 77.36
0.8613.42363.6 77.3
1.3211.828.459.8 77.78
1.4016.615.667.8 69.98
MSP1000.8341.716.6 6.321.114.331.34
0.8132.412.1 831.316.152.1
1.1823.213 4.429.330.167.7
MSP520.8717.122.732.2 7.7 20.2 55.04
0.848.230.423.8 4.1 33.6 57.52
1.1322.920.528.8 7 20.7 59.02
1.2723.126.216.4 10 24.4 53.25
MSP100.7912.627.835.4 24.2 43
0.8118.728.632.6 20.1 37.16
1.2616.33133 19.7 16.34
1.281027.432.1 30.4 15.85
(a) Expressed as mass percentage with respect to the total crystalline matter in the S2/3 fraction. (b) Expressed as mass percentage with respect to the total amount of the S2/3 fraction. (c) Substances that, being detected, could not be quantified. (d) Small amounts of Fe2O3 were detected in this fuel, due to contamination of the samples.
Table 6. Mean values (range) of the elemental composition (SEM-EDS) of deposits expressed as a percentage of the total mass of measured elements (Na, Mg, Al, Si, P, S, Cl, K and Ca) (%m/m: mass percentage).
NaMgAlSiPSClKCaK + NaCa + Mg
WP1001.67
(1.36–1.91)
4.65
(2.84–6.3)
1.75
(1.14–2.25)
4.21
(2.8–5.34)
1.97
(1.25–2.66)
6.34
(4.85–8.93)
14.75
(9.12–19.77)
32.49
(25.39–41.23)
32.16
(20.84–42.13)
34.16
(26.75–43.15)
36.81
(23.68–48.43)
WSP1000.22
(0.19–0.24)
0.11
(0.05–0.18)
0.25
(0.18–0.28)
1.55
(1.17–2.29)
0.31
(0.21–0.43)
3.21
(2.18–5.02)
41.92
(39.41–43.53)
51.85
(50.54–53.03)
0.57
(0.36–0.81)
52.07
(50.73–53.27)
0.69
(0.41–0.99)
WSP720.36
(0.31–0.42)
0.14
(0.07–0.25)
0.22
(0.19–0.28)
2.53
(1.32–4.09)
0.54
(0.45–0.65)
6.12
(5.92–6.26)
35.64
(34.42–37.12)
53.04
(51.55–53.86)
1.42
(0.82–2.4)
53.4
(51.87–54.28)
1.56
(0.89–2.65)
WSP600.56
(0.5–0.6)
0.19
(0.12–0.35)
0.2
(0.12–0.33)
1.39
(0.74–2.45)
0.31
(0.23–0.43)
6.56
(5.61–7.08)
35.94
(34.07–38.5)
52.89
(51.65–53.71)
1.96
(1.1–3.61)
53.45
(52.14–54.3)
2.16
(1.22–3.96)
WSP351.21
(1.13–1.33)
0.52
(0.3–0.7)
0.56
(0.42–0.74)
3.06
(2.38–3.64)
0.61
(0.48–0.78)
6.68
(6.13–7.4)
32.22
(30.15–34.79)
49.39
(48.06–50.67)
5.75
(3.38–7.27)
50.61
(49.19–52)
6.26
(3.68–7.97)
MSP1001.26
(1.22–1.31)
0.14
(0.06–0.21)
0.16
(0.13–0.18)
0.67
(0.21–1.11)
0.26
(0.19–0.34)
1.64
(1.15–2.15)
47.19
(46.02–48.94)
47.89
(47.31–48.52)
0.8
(0.22–1.43)
49.15
(48.53–49.82)
0.94
(0.27–1.64)
MSP521.2
(1.14–1.28)
0.23
(0.14–0.31)
0.22
(0.13–0.29)
1.42
(0.86–2.17)
0.33
(0.26–0.43)
1.49
(1.09–1.9)
45.19
(43.89–46.36)
48.3
(47.07–48.9)
1.63
(0.99–2.19)
49.5
(48.21–50.17)
1.86
(1.13–2.5)
MSP102.15
(2.03–2.25)
1.53
(0.97–2.37)
0.98
(0.73–1.41)
3.32
(2.6–4.9)
1.09
(0.8–1.41)
2.28
(1.77–2.79)
36.81
(31.33–40)
39.21
(36.1–41.41)
12.64
(8.92–17.45)
41.36
(38.13–43.66)
14.17
(9.88–19.81)
Table 7. Deposits composition (combustion test selected).
ṁ_air (kg/m2s)λP-XRD Analysis Results
Crystalline Matter (%) (a)Amorphous
(%) (b)
KClK2SO4K3Na(SO4)2SiO2CaCO3Ca2Mg(Si2O7)Ca(OH)2CaOCa2(SiO4)MgO
WP1000.471.4213.49.2 1.923.45.59.62.87.526.821.24
0.471.4426.913 1.624.82.52.52.27.519.117.6
WSP100(c)0.481.6391.38.7 0
0.481.6789.210.8 0
WSP720.481.3577.422.6 0
0.481.3276.123.9 0
WSP600.481.4181.918.1 0
0.461.307521.5 3.5 0
WSP350.481.3269.723.66.7 5.68
0.481.4077.116.96 0
MSP1000.391.1891.45.3 3.3 0
MSP520.471.1386.7 7.55.7 0
0.481.2784.7 8.76.7 0
MSP100.481.2671.3 6.222.5 10.18
0.481.2868.4 10.920.6 4.42
(a) Expressed as mass percentage with respect to the total of crystalline matter in the deposits. (b) Expressed as mass percentage with respect to the total deposits. (c) Small amounts of Fe2O3 were detected in this fuel, due to contamination of the samples.
Table 8. Deposition rates (total, by condensation and by inertial impact) mean values (λ > 1).
WP100WSP100WSP72WSP60WSP35MSP100MSP52MSP10
DR4.7116.499.537.188.5316.915.975.87
DRCond.
(% a)
1.9
(40.3)
15.26
(92.5)
8.36
(87.7)
6.53
(90.9)
6.75
(79.1)
16.18
(95.7)
14.7
(92.0)
3.91
(66.6)
DRImp.
(% a)
2.81
(59.7)
1.23
(7.5)
1.17
(12.3)
0.65
(9.1)
1.78
(20.9)
0.72
(4.3)
1.27
(8.0)
1.96
33.4)
a Percentage with respect to DR.
Publisher’s Note: MDPI stays neutral with regard to jurisdictional claims in published maps and institutional affiliations.

