
Metal Supported Electrolysis Cells


1
DTU Energy, Technical University of Denmark, Fysikvej B. 310, 2800 Kongens Lyngby, Denmark
2
Politecnico di Milano, Piazza Leonardo da Vinci 32, 20133 Milano, Italy
*
Author to whom correspondence should be addressed.
Energies 2022, 15(6), 2045; https://0-doi-org.brum.beds.ac.uk/10.3390/en15062045
Submission received: 18 February 2022
/
Revised: 8 March 2022
/
Accepted: 9 March 2022
/
Published: 10 March 2022
(This article belongs to the Special Issue Solid Oxide Cells: Technology, Design and Applications)
Abstract
:Solid oxide electrolyser (SOE) technology can become a key player in energy systems, with increasing shares of electricity from fluctuating sources such as wind and solar, contributing to power grid balance and energy storage as well as providing green fuels for transportation. Most mature SOE configurations are electrolyte supported or fuel electrode supported. Metal supported SOE cell configurations are an interesting concept for decreasing costs and increasing robustness. The present study compares fuel electrode supported and metal supported cells in terms of performance and durability under SOE conditions. Special emphasis was on medium temperature operating conditions of 650 °C. Metal supported cells, fabricated using ceramic processing methods, showed a better performance compared to state-of-the-art (SoA) cells with Ni/YSZ fuel electrode supported configuration, fabricated by tape casting and screen printing, under steam electrolysis conditions at 700 and 650 °C. The area specific cell resistance (ASR) was lower by ca. 20% for the metal supported cell in 50% H2O in H2 vs. air at 650 °C. Furthermore, the metal supported cells showed a stable performance—even a slight activation—during long-term steam electrolysis tests over 500 h at 650 °C and −0.25 and −0.5 A/cm2, while the SoA reference cell degraded with 13%/1000 h under the same conditions.
1. Introduction
The reduction and finally removal of fossil fuels in the energy and transport sector is a common ambition, seconded by specific targets in several parts of the world. For example, the European Green Deal aims at Europe becoming the first climate-neutral continent by 2050. Such ambitious goals require establishment and extension of sustainable technologies for energy production, storage, and distribution with greatly reduced emissions and by using renewable energy sources. In this context, shares of electricity production from wind and solar are increasing. Not only does the fluctuating and interruptive nature of these sources require means of storage, but also the transport sector needs solutions for difficult to electrify branches such as shipping and aviation. Electrolysis technologies can solve this challenge. Particularly, high temperature (solid oxide) electrolysis excels with high efficiencies and the ability of flexible operating modes to convert electricity into storage media such as hydrogen and high energy density transportation fuels. Solid oxide electrolysers (SOE) have reached a matureness allowing for demonstration and field-testing, based on electrolyte, fuel electrode, and metal supported cell configurations, as presented by major technology providers (e.g., [1,2,3,4,5]).
Among those configurations, metal supported cells (MSCs) have received particular attention lately, with more and more studies of electrolysis operation being reported [6], while the use as fuel cells has been a research topic for many years [7]. Increased mechanical robustness and reduced costs are claimed as advantages when compared to ceramic electrolyte and fuel electrode supported configurations. The MSC concepts developed by industry and academic players are very diverse. They include porous metal support sheets, where the active layers are deposited by plasma spraying technologies [8] or a wet processing methodology such as screen printing [9]. DTU Energy has developed another MSC concept for SOFC operation based on a tape cast metallic support, with the subsequent layers added through tape casting and lamination, followed by sintering in reducing atmosphere, infiltration of electro-catalyst into the fuel electrode, and finally oxygen electrode deposition by screen printing [10]. Another concept is based on a symmetric MSC with porous metal supports on both electrode sides [11].
A commonly observed degradation mechanism during operation in SOFC and SOEC modes is the oxidation of the porous metallic substrate [8,12]. Furthermore, electrode degradation in terms of coarsening of Ni particles in the case of Ni/YSZ cermet fuel electrodes occurs [8], similarly to the observations in ceramic cells with the same type of Ni/YSZ fuel electrodes [13]. In order to prevent the Ni related degradation in fuel cell operation, alternative fuel electrodes were developed, for example, based on porous, Ni-free (or low Ni content) electrode backbone structures with infiltrated Ni/GDC (ceria doped gadolinia oxide) electro-catalysts yielding significantly lower Ni contents with finer Ni particles, less prone to structural degradation [14,15,16]. The durability of these MSCs in SOFC operating mode shows promising low degradation rates with suppressed oxidation of the metal parts of the cell and more durable fuel electrodes [15,16,17]. The present study investigates for the first time the durability of these MSCs in electrolysis operation and compares it to operation in fuel cell mode and electrolysis operation of state-of-the-art (SoA) ceramic cells with Ni/YSZ fuel electrodes in the medium to low temperature region around 650 °C.
2. Materials and Methods
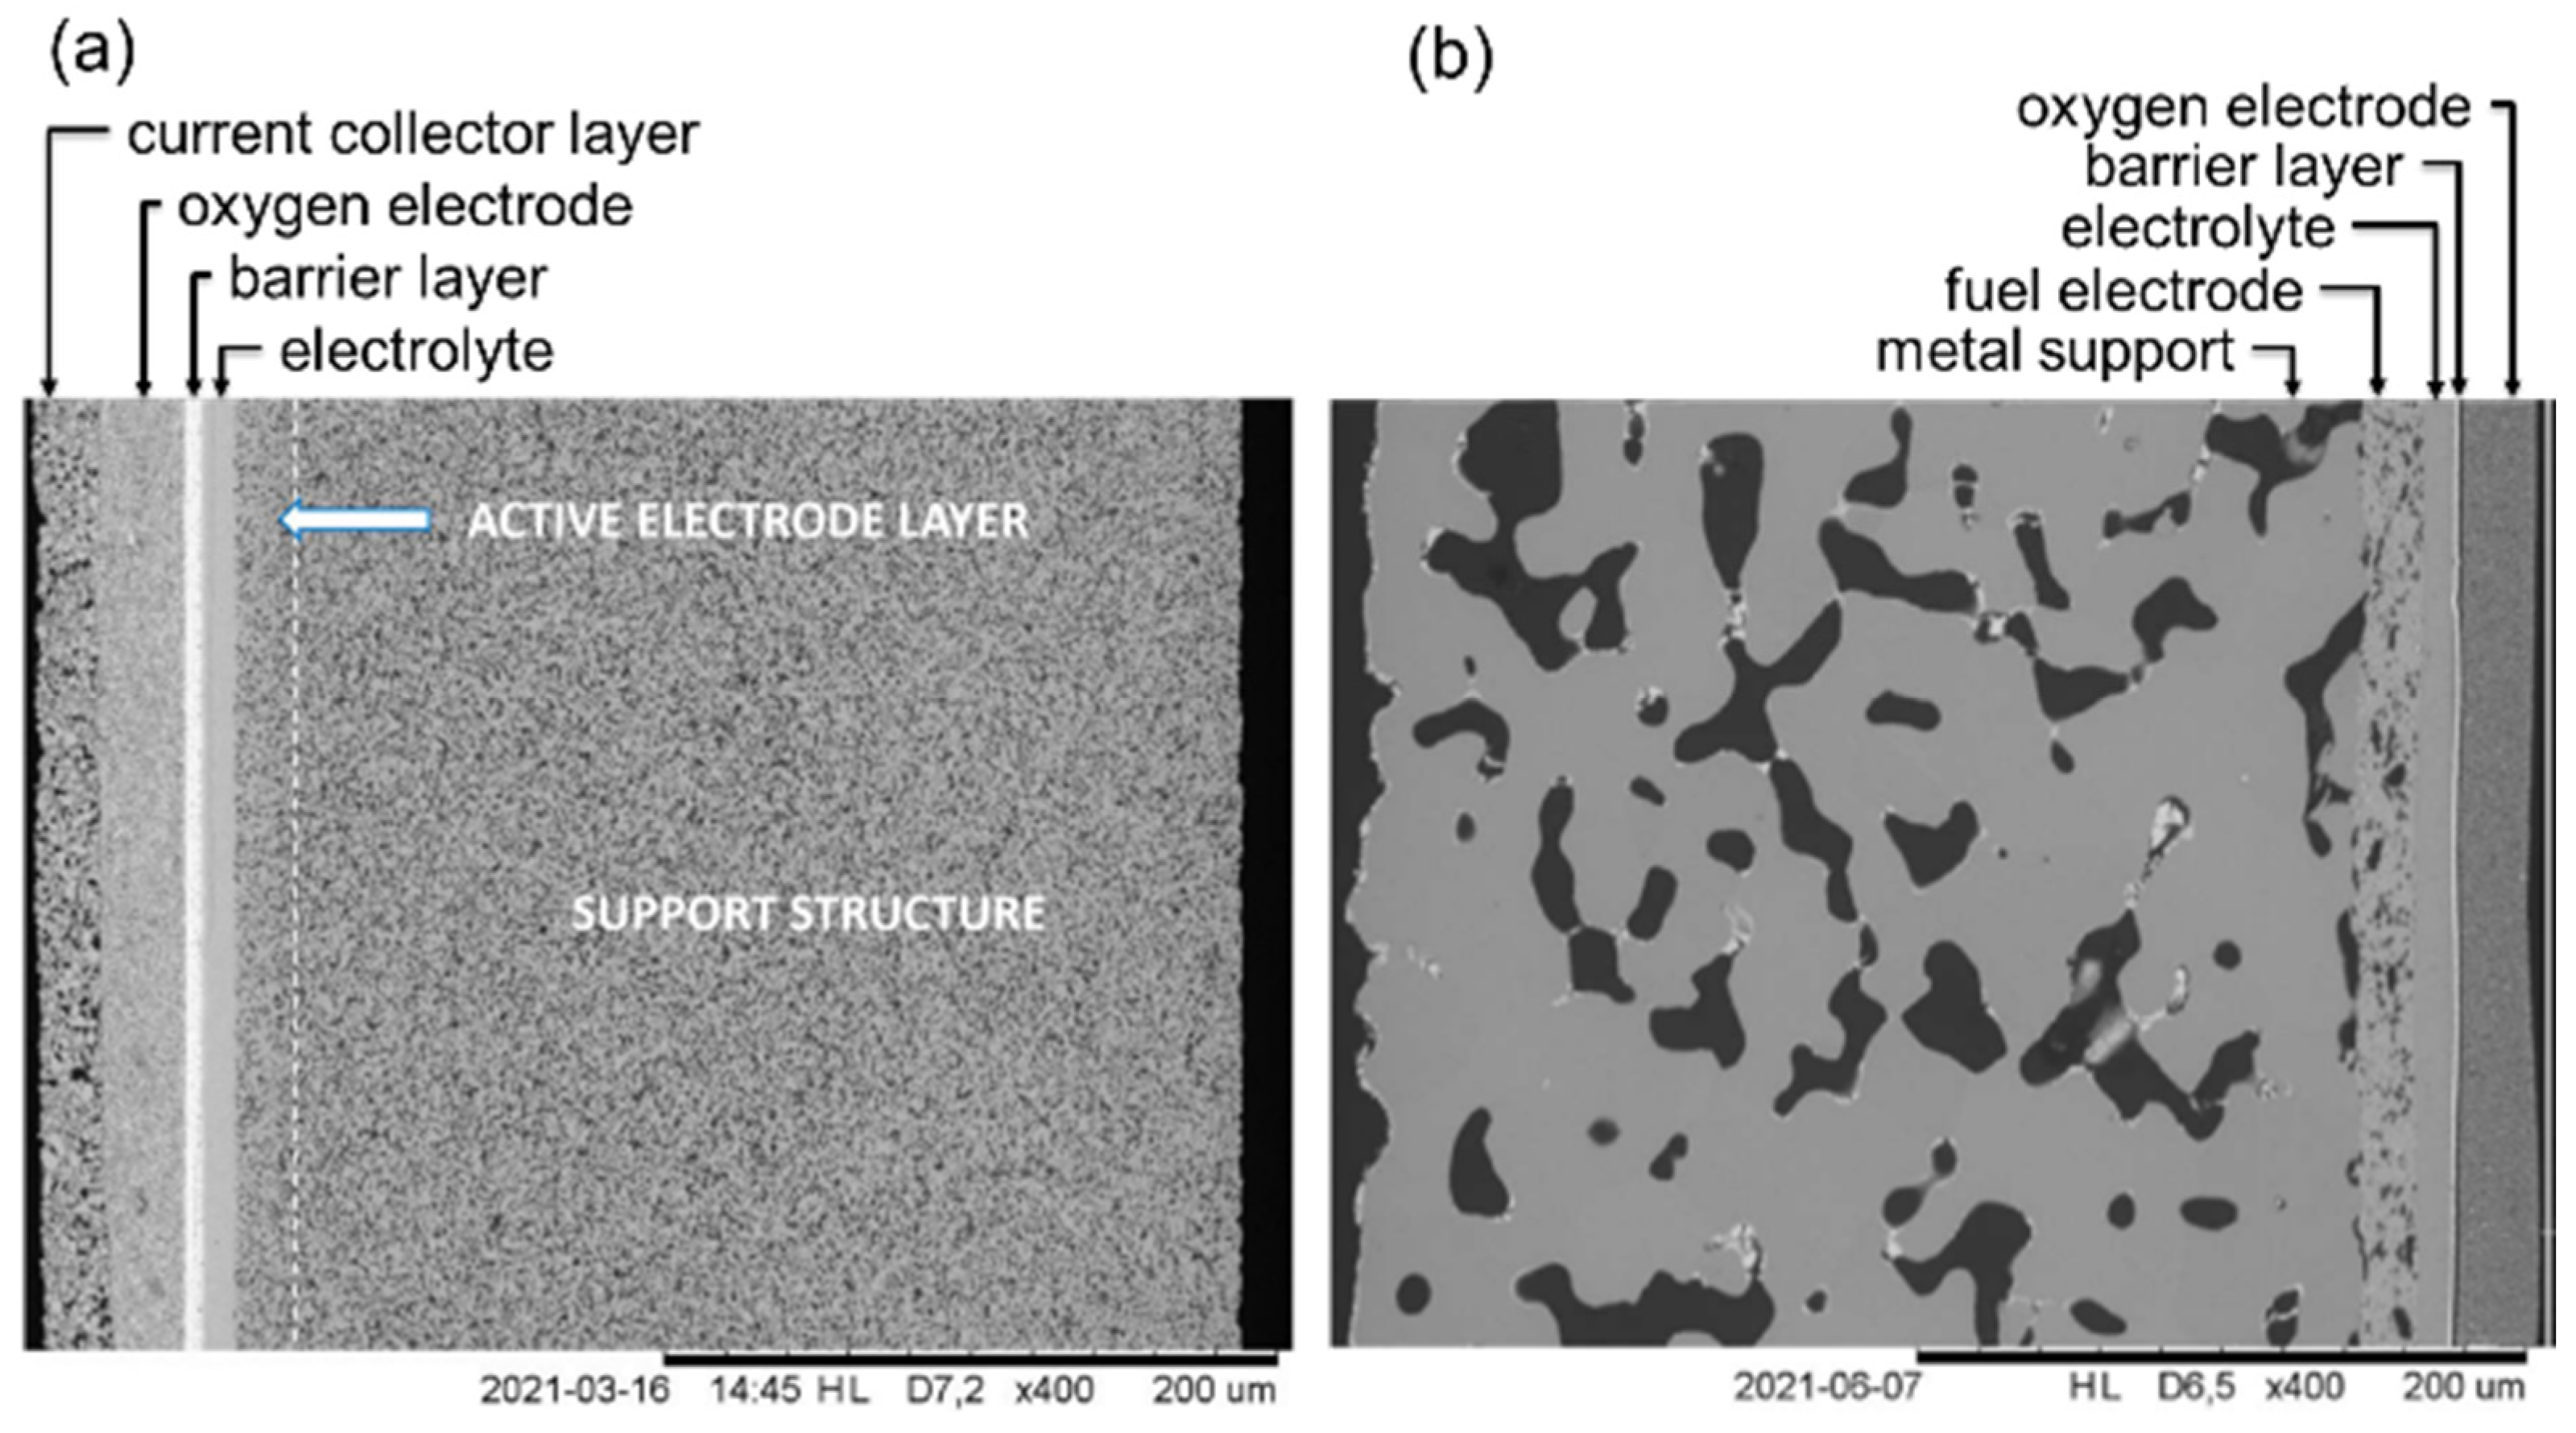
The cells in this study are in house developed cells. The SoA reference cell (denoted SoA) consisted of a ca. 300 µm thick Ni/3YSZ (3% yttria stabilized zirconia) support, a ca. 10 µm thick Ni/8YSZ (8% yttria stabilized zirconia) active fuel electrode, a ca. 5 µm thick 8YSZ electrolyte, a ca. 8 µm thick GDC (gadolinia doped ceria, Ce0.9Gd0.1O1.95) inter diffusion barrier layer, and a ca. 25 µm thick 40LSC/60GDC (lanthanum strontium cobaltite, La0.6Sr0.4Co1.05O3−δ) oxygen electrode. Finally, a ca. 20 µm thick LSM (lanthanum strontium manganite, La0.8Sr0.2Mn0.3) current collection layer was applied on the oxygen electrode. The fabrication of the cell is described in References [18,19]. A cross section of the cell is shown in Figure 1a.
Metal supported cells (denoted MSCs) with the following composition were tested: a ca. 330 µm thick Fe22Cr metal support, a ca. 20 µm thick 95% LSFNT/5% ScYSZ (lanthanum strontium iron nickel titanate, La0.4Sr0.4Fe0.03Ni0.03Ti0.94O3)/(Scandia doped YSZ) fuel electrode backbone with infiltrated Ni/GDC, a ca. 10 µm thick ScYSZ electrolyte, a ca. 2 µm thick GDC barrier layer, and a ca. 25 µm thick LSC ((La0.6Sr0.4)0.99CoO3−δ) oxygen electrode. The cell fabrication is described in References [15,16]. The cross section of the cell is shown in Figure 1b. The cell sizes were in all cases 53 × 53 mm2 with an active area of 40 × 40 mm2.
The electrochemical testing was carried out in an alumina test housing placed in a furnace. The cells were sandwiched between nickel meshes and a nickel sheet current collection layer on the fuel side and a gold mesh on the oxygen side. The fuel side was sealed using gold seals. Details of the test setup are shown in Reference [17].
The startup process was tailored for the respective cell configuration. The SoA cell was heated to 850 °C with 1 K/min in nitrogen to the fuel electrode and air to the oxygen electrode. The reduction of the NiO in the cermet was accomplished at this temperature starting with 2 h in 5% hydrogen in nitrogen followed by 1 h in pure hydrogen. The MSCs were heated to 800 °C with 1 K/min in a 5% hydrogen in nitrogen reducing atmosphere to the fuel electrode in order to prevent the metal support from oxidation. Afterwards, pure hydrogen was applied. In the case of the MSC, no reduction of the fuel electrode is needed. Instead, the oxygen electrode (LSC) is sintered in situ at 800 °C in air for 5 h.
After the startup, the furnace temperature was lowered, and the cells were characterized at a set of standard conditions for DC (iV curves in fuel cell and electrolysis modes) and AC (electrochemical impedance spectroscopy: EIS) behavior. Gasses involved different ratios of steam/hydrogen to the fuel electrode and air or oxygen to the oxygen electrode at 750, 700, and 650 °C. The specific conditions were tailored according to the cell configuration in order to minimize initial changes of the cell layers during this electrochemical characterization. In this article, only results in SOE mode and at 650 and 700 °C are discussed.
Electrolysis durability tests were carried out at 650 °C at current densities of −0.25 (SoA cell and MSC) and −0.5 A/cm2 (only MSC) in 12 L/h 50% H2O/H2 fuel vs. 50 L/h air. EIS were recorded before and after the constant durability conditions at 0 A/cm2 and, furthermore, regularly during the durability tests under polarization. After finishing the durability test, the DC and AC characterization from prior to testing was repeated.
EIS were recorded using a Solartron 1255B from Solartron Analytical. Ohmic/serial (Rs) and polarization (Rp) resistances were deduced from the EIS using the real impedance obtained at the highest frequency for Rs, and the difference between the intercept at low frequency and Rs for the polarization resistance (Rp). The test was controlled using an in house developed software Elchemea. Area specific resistance (ASR) values were determined from iV curves as the slope at a current density of −0.25 A/cm2.
3. Results
3.1. Electrochemical Performance
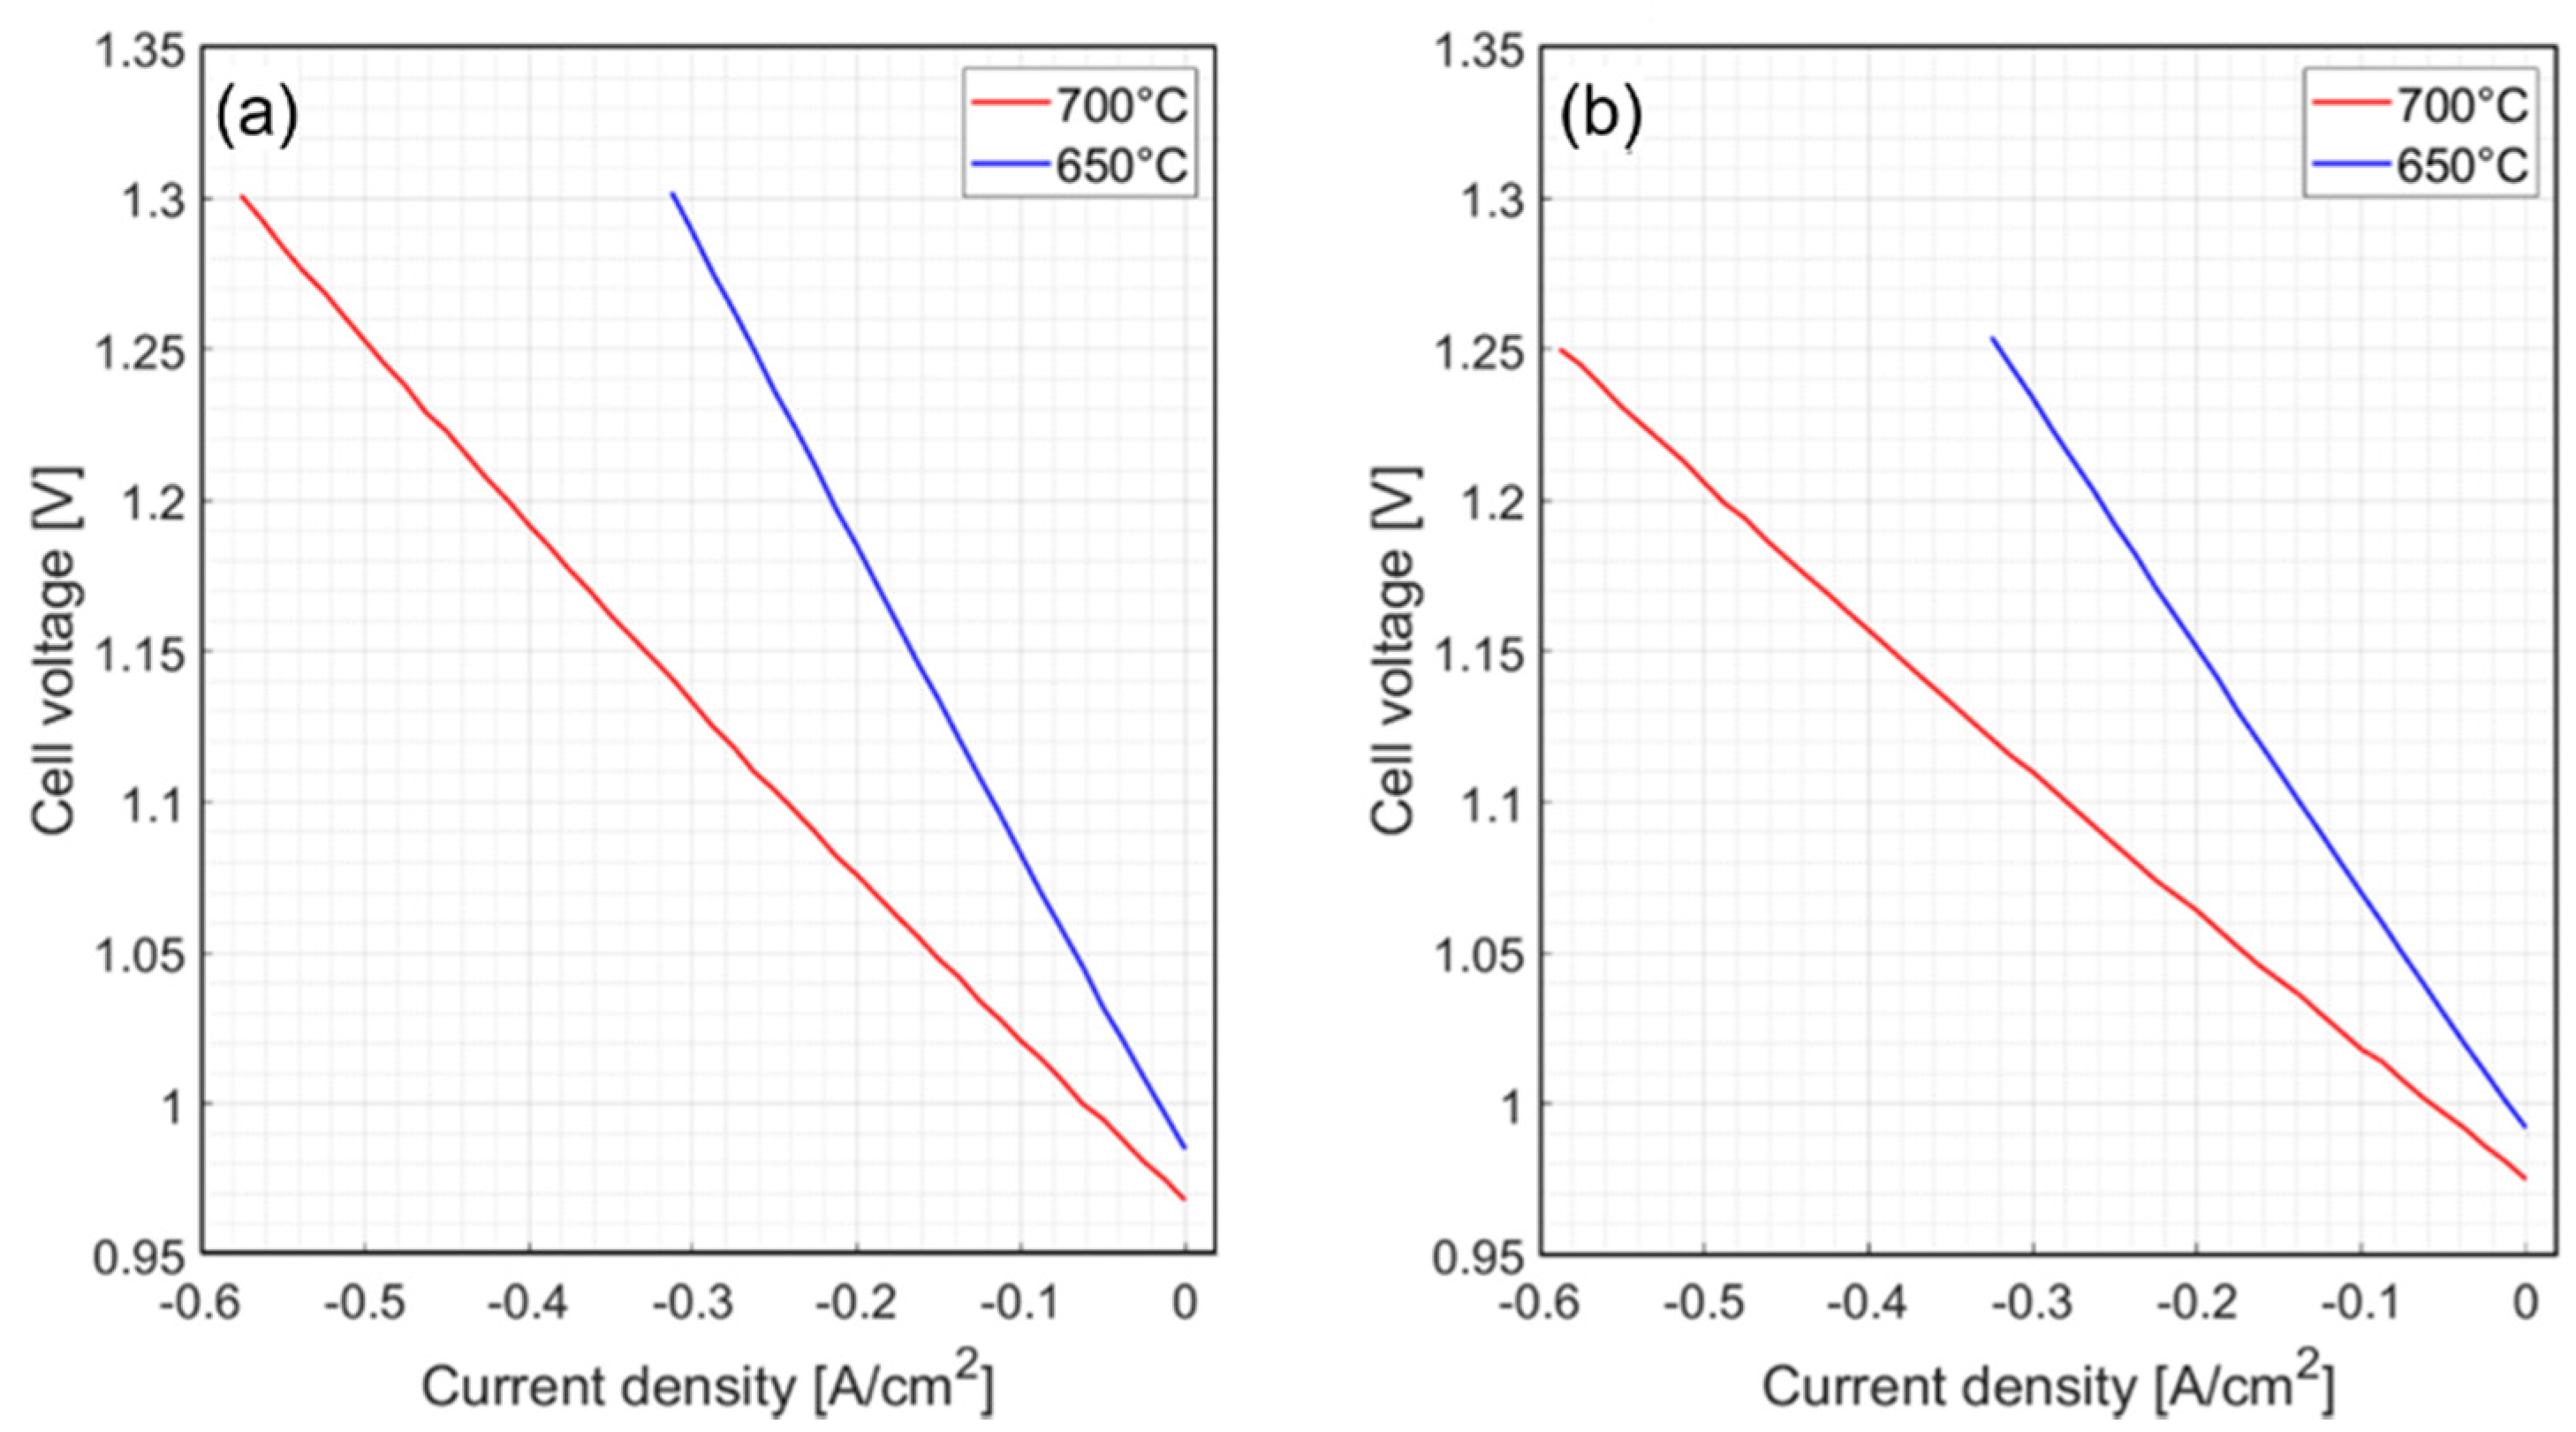
The reference ceramic fuel electrode supported (SoA) and the metal supported (MSC) cells were evaluated regarding their DC and AC performance. iV curves are shown in Figure 2.
The measured open circuit voltages (OCV) were in the range of the expected values according to the Nernst equation, with minor deviations of only ca. 2–6 mV, verifying a tight setup. The ASR of the ceramic SoA cell calculated from the slope of the iV-curve at −0.25 A/cm2 were 1.03 and 0.52 Ω·cm2 at 650 and 700 °C, respectively, and 0.83 and 0.48 Ω·cm2 at 650 and 700 °C, respectively, for the metal supported cell.
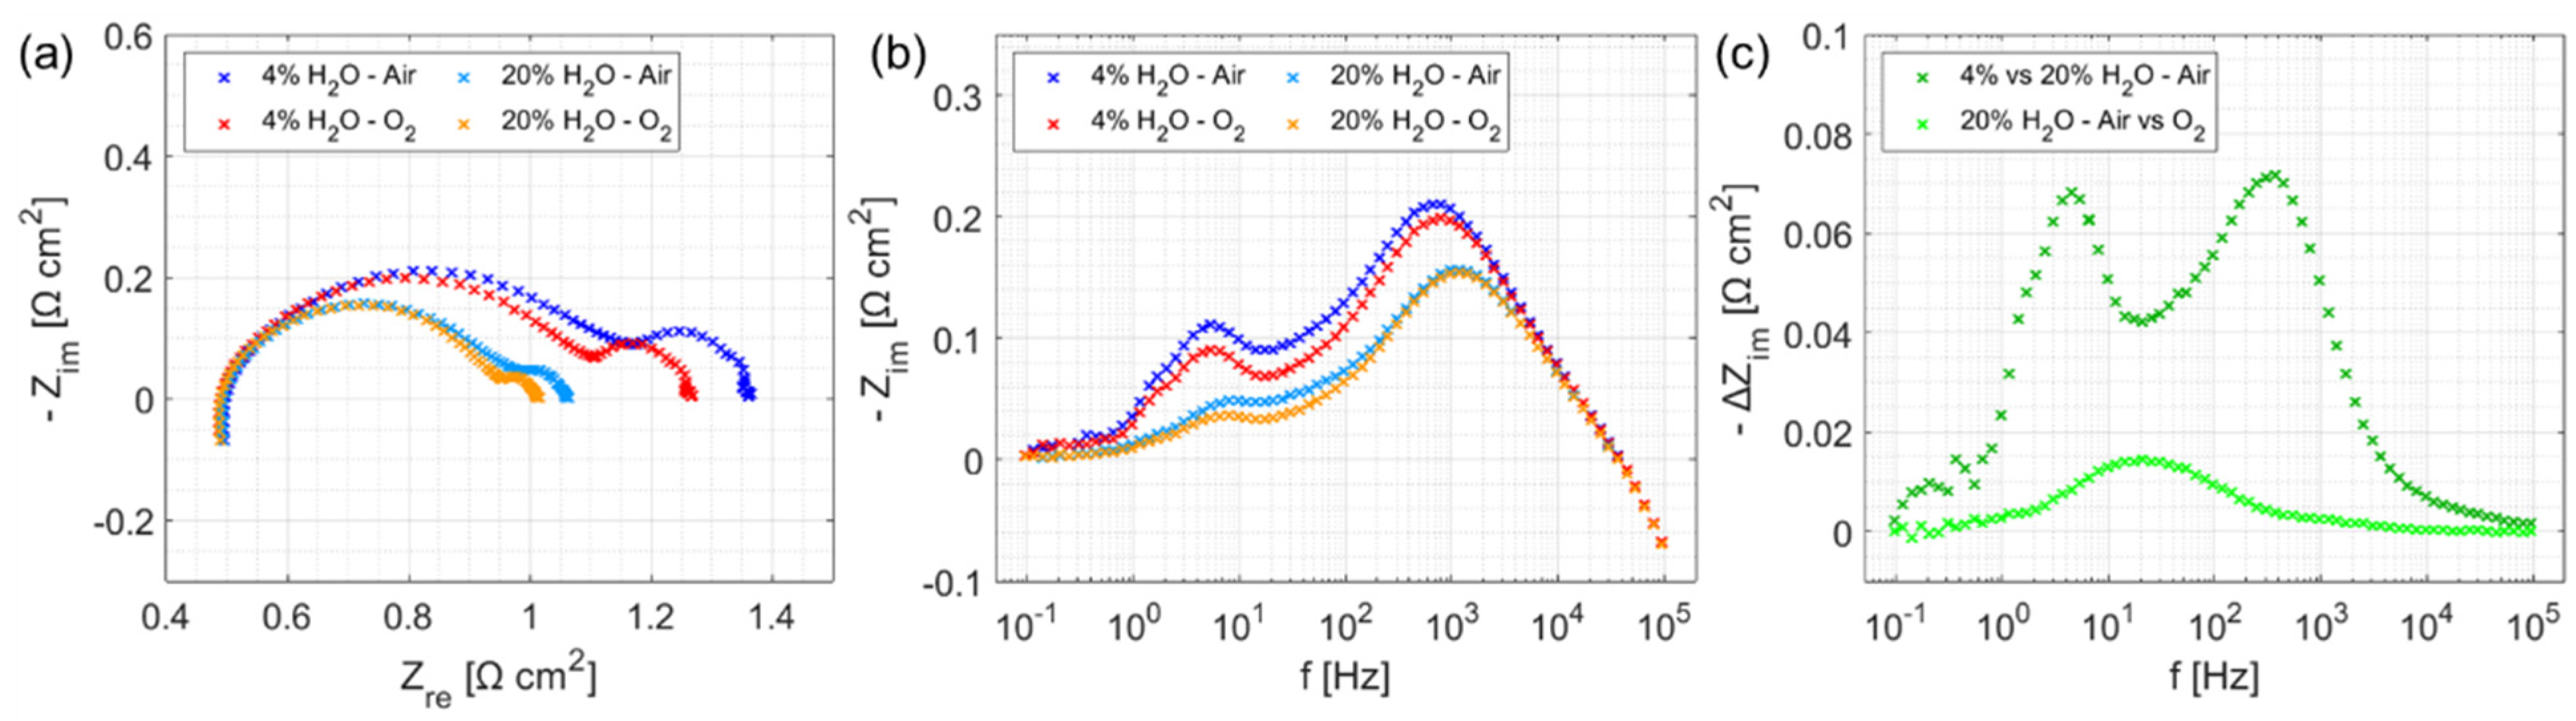
EIS for the ceramic and the metal supported cells are shown in Figure 3 and Figure 4, respectively. Gas shift impedance was carried out in order to assign electrode processes to characteristic frequencies. The results are summarized in Table 1. The Nyquist plots for the different gasses to the electrodes of the SoA cell in Figure 3a have the same ohmic resistance, i.e., all changes occur for the polarization (electrode) resistances as expected. Differences of the polarization resistances are visible in the Bode plots (Figure 3b) and even more pronounced from difference Bode plots (Figure 3c). The variation of the oxygen electrode gas between air and oxygen reveals changes in the impedance in the frequency region of 20 Hz for the ceramic SoA cell (see Figure 3b,c). This process is thus related to the oxygen electrode. Variation of the steam to hydrogen ratio leads to changes in two frequency regions of ca. 5 Hz and 400 Hz, which thus both represent fuel electrode processes. The observed frequency contributions were compared to the results obtained by Hauch et al. [19] and by Chen et al. [20] on the same type of cell, however, at significantly higher temperatures of 800 °C and partly under electrolysis polarization. Thus, the absolute frequency values cannot be transferred directly. Taking these limitations into consideration, the low-frequency contribution was assigned to gas transport and the high-frequency contribution to the triple phase boundary process in the Ni/YSZ cermet.
The gas shift EIS recordings on the MSC show a dependency of the contribution at ca. 100 Hz on the oxygen electrode gas (see Figure 4). The same observation was made by Hagen et al. [17] on the same type of cell. Changing the steam to hydrogen ratio on the MSC leads to changes in the frequency regions of ca. 4 and 10 Hz (see peaks in Figure 4c); both correspond to the findings from Hagen et al. [17] as well. In accordance with the results by Nielsen et al. [16] on similar types of cells, the contribution at low frequency is assigned diffusion processes, while the higher frequency contribution should be due to electrode processes. Indeed, the fuel electrode charge transfer contribution of Ni/GDC cermet cells in electrolyte supported configuration was observed to be located at much lower frequencies as compared to Ni/YSZ [21].
3.2. Durability
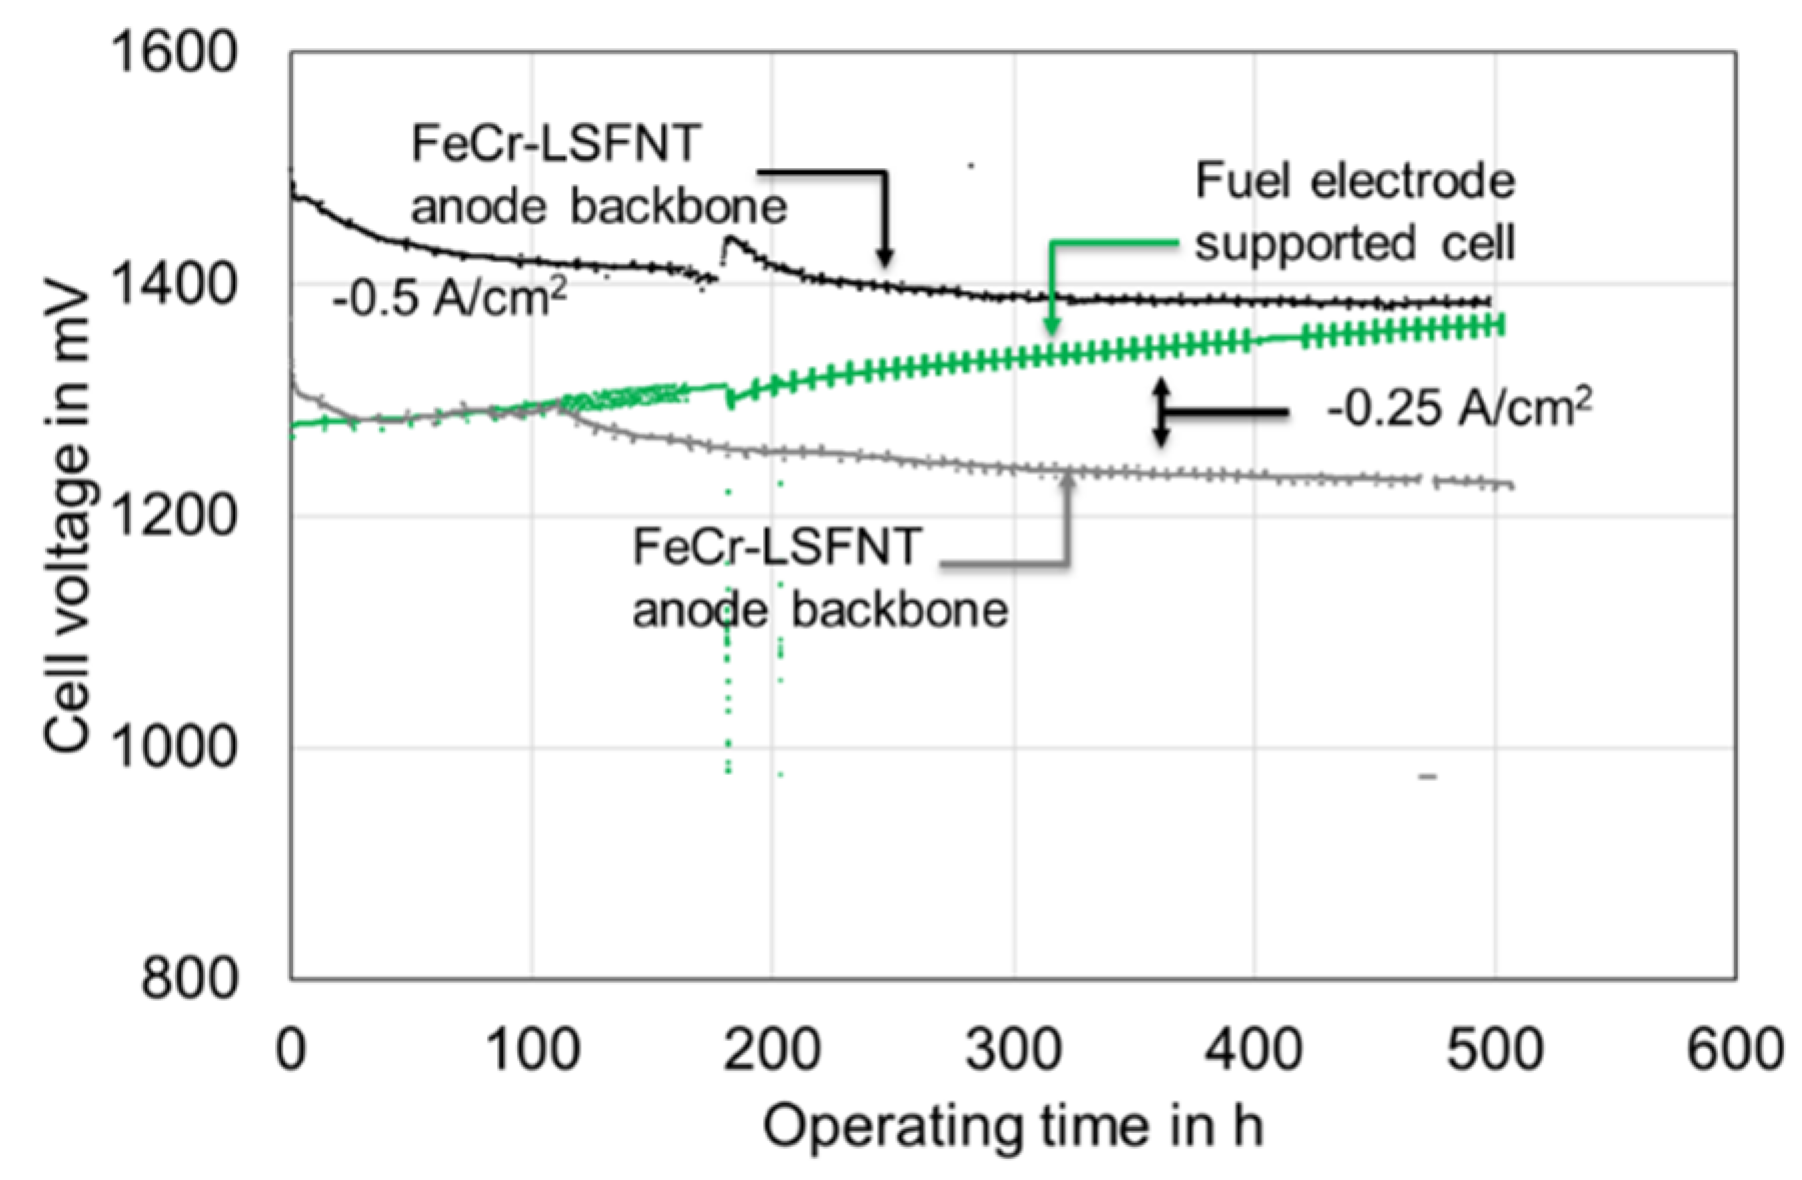
The cells were tested under galvanostatic conditions for 500 h. The cell voltage development over time is compared for all tests in Figure 5. A continuous increase of the cell voltage occurs with the ceramic cell. The slope amounts to ca. 13%/1000 h. The cell voltages during the electrolysis test on the MSCs decrease for both current densities. The activation amounts to 20 and 15%/1000 h at −0.25 and −0.5 A/cm2, respectively.
Figure 6 shows the EIS recorded under load during the durability tests and Figure 7 shows the evolution of Rs and Rp contributions over time on the SoA cell and the MSC.
The EIS of the ceramic SoA cell shifted towards larger resistances, i.e., they increase over time, with main changes appearing for the polarization contributions (see increase of arc in Figure 6a) thereby confirming the trend of the cell voltage (see Figure 5). This is supported by the numerical values obtained from those EIS as shown in Figure 7a. The serial resistances remain nearly constant. The main increase of the total resistance is due to the increase of the polarization resistances.
On the other hand, the EIS of the metal supported cell shifted to lower resistances (see Figure 6b), with the polarization part remaining nearly constant as the size of the arc did not change, while the whole spectrum shifted. This apparent activation is also seen from the cell voltage development shown in Figure 5 and looking at the resistance values shown in Figure 7b.
More details regarding the electrode degradation mechanisms can be deduced from Bode plots of the EIS as shown in Figure 8. For better visibility of the changes, the differences of Bode plots are plotted with the first EIS recorded under polarization being the reference.
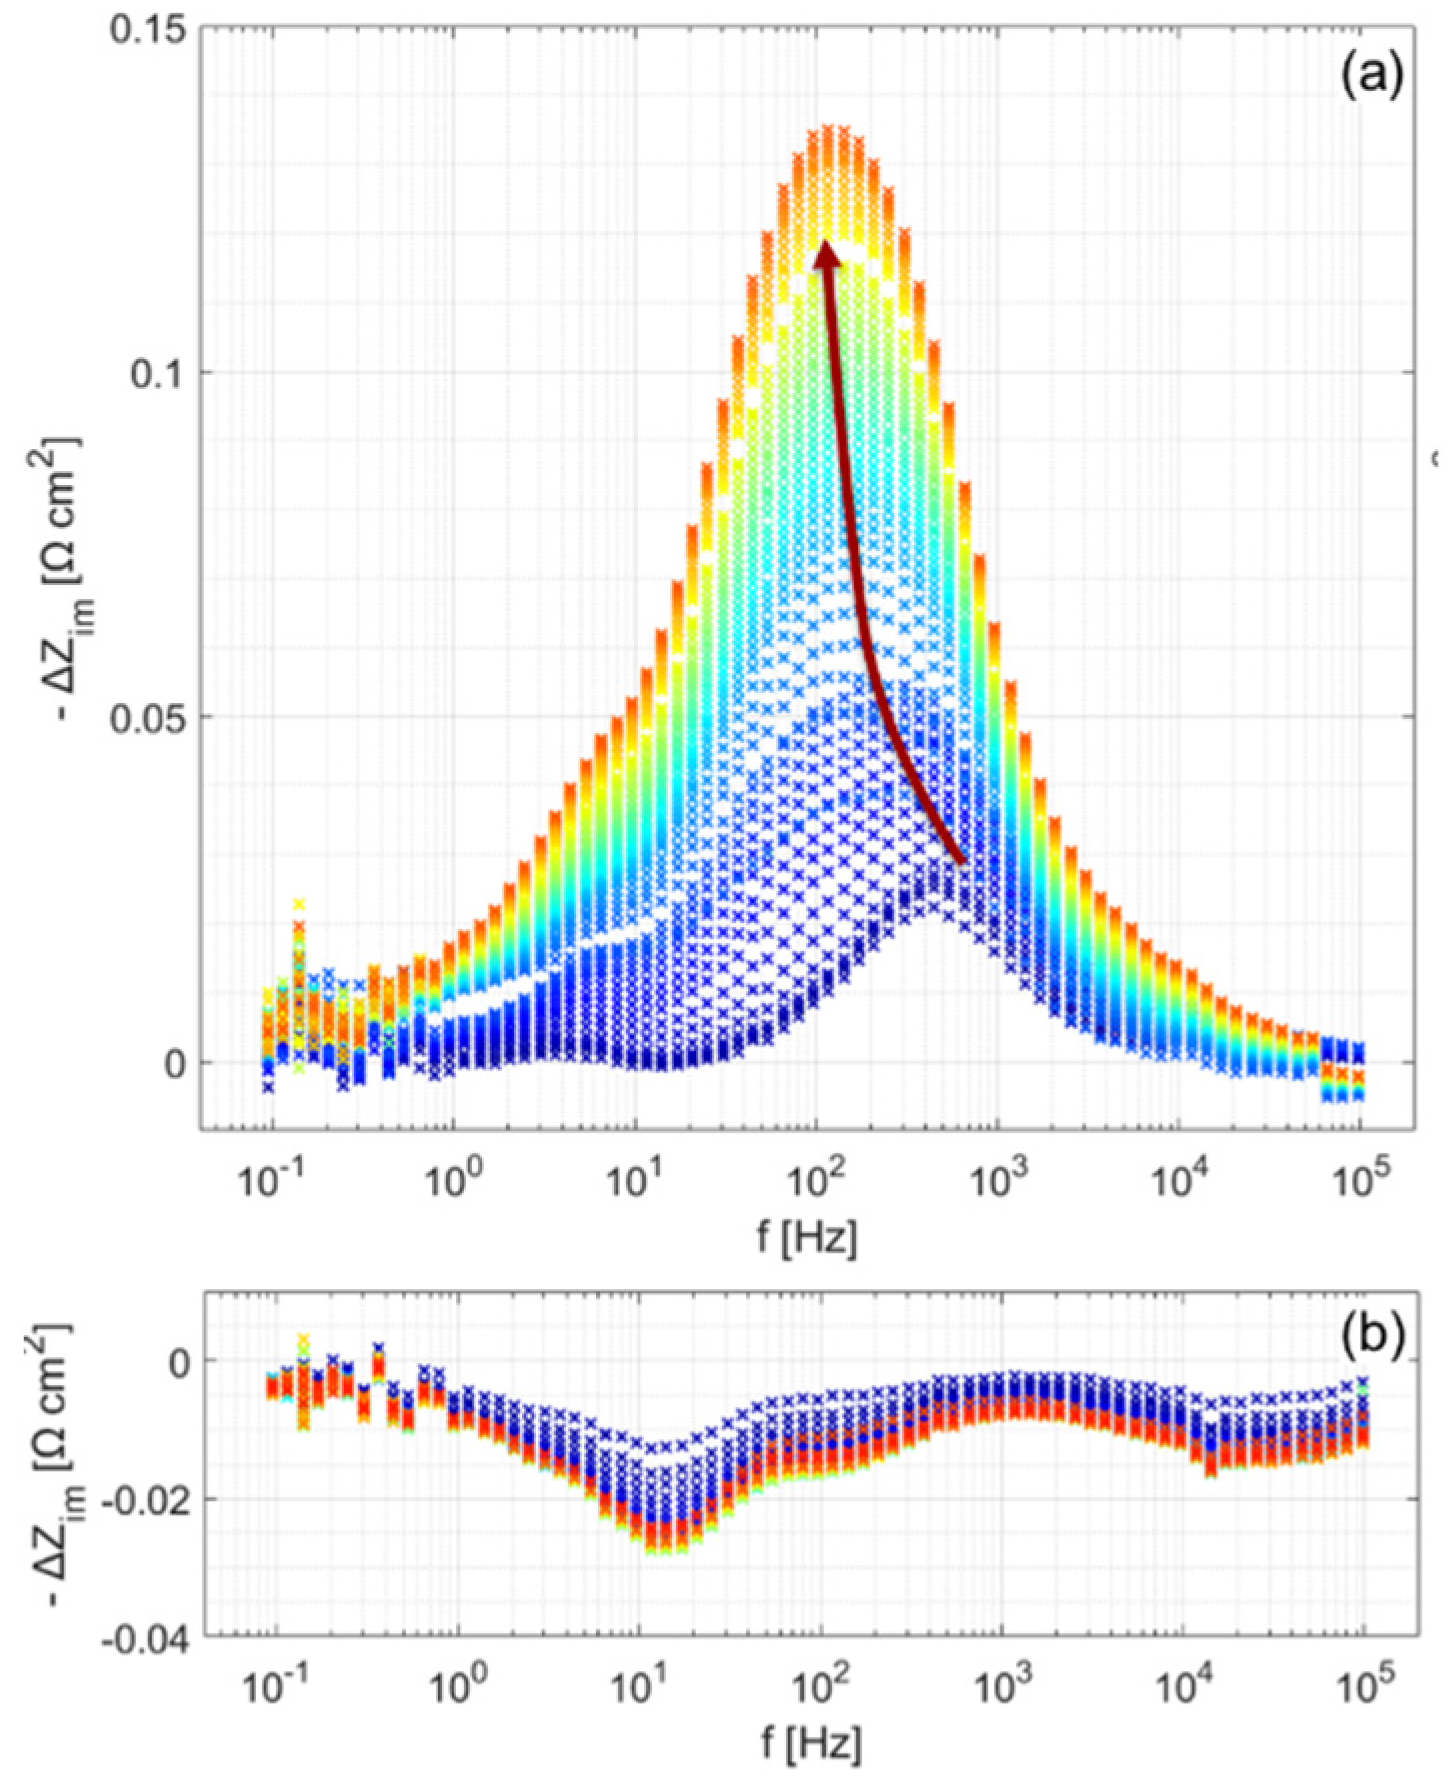
The difference plot reveals that the main increase of polarization resistance when testing the ceramic SoA cell in SOE mode happens in the frequency region of 100 to 500 Hz (see Figure 8a). This frequency region is related to fuel electrode TPB processes (see Table 1).
The Bode plots for the metal supported cell on the other hand show only minor changes, which is consistent with the cell voltage decrease and EIS evolution observed over time (see Figure 5, Figure 6b and Figure 8b). Most changes occur in the frequency range of ca. 40 Hz, a region that might be related to both electrode processes (see Table 1). For a clearer assignment, the changes should be larger than in the present case. However, as compared to the change of the serial resistance over time (decrease), the electrode related changes are less significant.
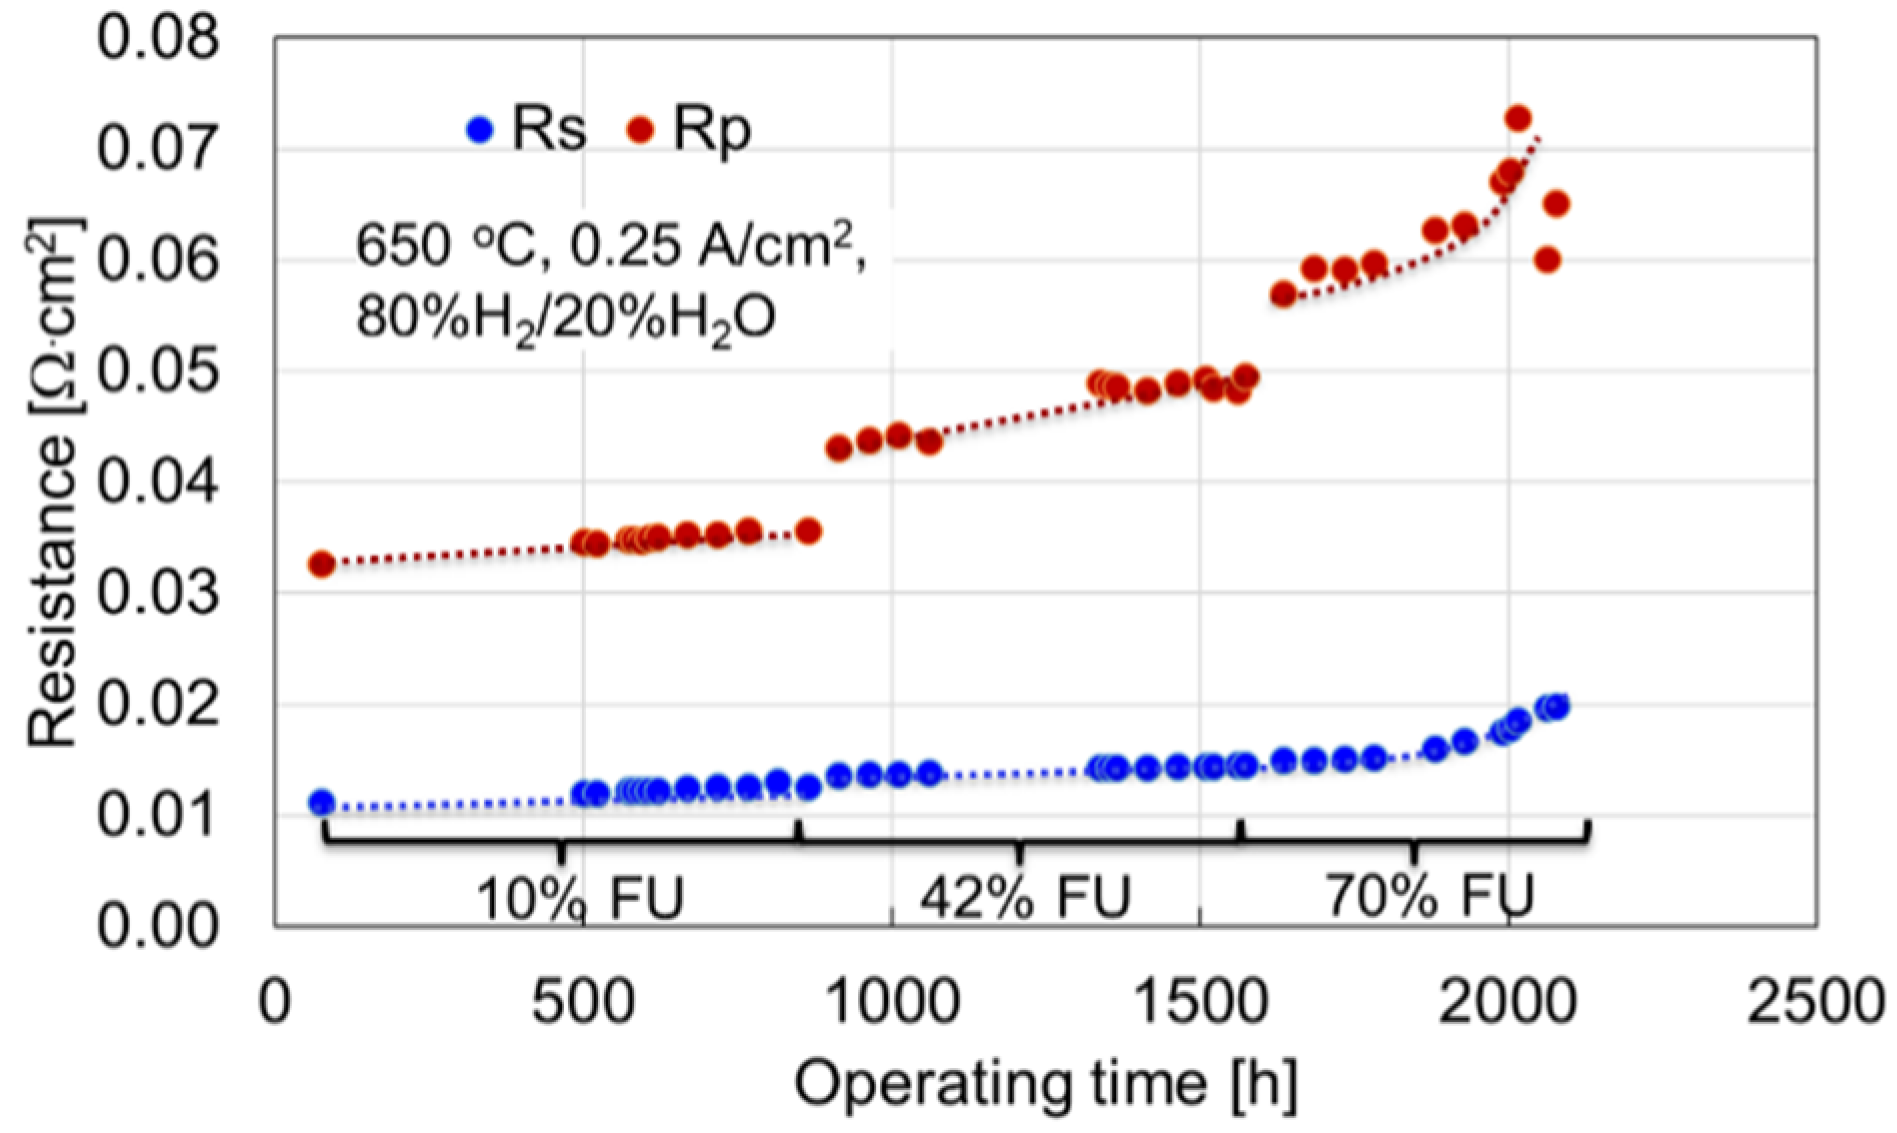
In previous studies, a MSC with similar composition as the one in the present work was operated in fuel cell mode with increasing fuel utilization [17]. Cell voltage degradation rates of 5%, 6%, and 13% (with beginning acceleration)/1000 h were determined, at 10%, 42%, and 70% fuel utilization, respectively, using hydrogen fuel at 650 °C [17]. The EIS recorded during the SOFC durability operation were analyzed in this study. Figure 9 shows the detailed trends of the Rs and Rp values determined from the EIS recorded during SOFC operation. At the low fuel utilization, the degradation rates of the serial (ohmic) and polarization resistance contributions were in a similar range, with 20%/1000 h and 13%/1000 h for Rs and Rp, respectively. When the fuel utilization was increased to 42%, the polarization resistance started to increase more, reaching a 25%/1000 h degradation rate vs. 11%/1000 h for the serial resistance. This trend continued for ca. 200 h when the fuel utilization was increased to 72%. Afterwards, both resistance contributions started to increase in an accelerated fashion (see Figure 9).
4. Discussion
Metal supported cells with the configuration in this study were developed for use as fuel cells. In this study, those cells were investigated for their potential as electrolysis cells. Motivations are the lower costs as compared to ceramic fuel electrode and electrolyte supported cell configurations, and the higher mechanical robustness, which apart from expected longer lifetime under dynamic operating conditions also opens the opportunity to fabricate cells with larger footprints for large-scale power-to-X applications. Similar MSCs as those in this study showed a better performance, i.e., a lower ASR, as compared to state-of-the-art (SoA) ceramic fuel electrode supported cells in fuel cell mode at lower operating temperatures of <650 °C in previous studies [22]. The higher activity might be ascribed to the thin layers and the more active electrodes. More specifically, a LSC vs. LSC/CGO oxygen electrode and maybe even more importantly, a Ni/GDC vs. Ni/YSZ fuel electrode.
The present study reveals a better performance of these MSCs in electrolysis mode as well, already at temperatures of 700 °C and below. The performance gain over SoA cells is even larger. DC characterization by iV curves shows ca. 20% improvement of the MSC with Ni/GDC infiltrated LSFNT fuel electrode and LSC oxygen electrode compared to SoA cells with Ni/YSZ fuel electrode and LSC/GDC oxygen electrode (see Figure 2). The main causes for the improved performance are a lower serial resistance as deduced from EIS (see Nyquist plots in Figure 3 and Figure 4). A potential explanation is the use of scandia doped YSZ as electrolyte in the MSC, which has a higher conductivity. Furthermore, the GDC inter diffusion barrier layer between electrolyte and oxygen electrode is much thinner in the MSC (ca. 4 times thinner than in the SoA cell). Another significant difference between the MSCs and SoA fuel electrode supported cells is the fuel electrode material. The MSC contains highly active Ni/GDC electro-catalyst covering the LSFNT backbone, as seen from SEM images in [17]. GDC is a mixed ionic electronic conductor and can extend the reaction points from the TPB in Ni/YSZ towards a two-phase boundary. This attractive property of Ni/GDC was recently applied to boost the durability of SoA cells with Ni/YSZ fuel electrodes [23]. Furthermore, the oxygen electrode in the MSC is slightly modified as well. It is a single-phase LSC in the MSC, which exhibits high catalytic activity vs. LSC/GDC composite in the SoA cell. It was moreover sintered in situ and thus at lower temperatures as compared to the oxygen electrode of the SoA cell, which results in smaller, nano-sized particles with higher activity. Due to these differences between the two cell configurations in terms of materials and structures, the resistance contributions to the total ASR distribute differently as is also expressed through the different frequency regions, where the contributions appear (see Table 1). The most significant difference appears in the fuel electrode, where the characteristic frequencies for Ni/YSZ TPB reaction is moved from ca. 400 Hz towards lower frequencies of ca. 10 Hz representing the Ni/GDC charge transfer process. Consequently, different behaviors under long-term electrolysis operation are expected.
The durability of the MSCs from this study was in previous studies evaluated in fuel cell mode, only [16,17]. It was found that a stable operation is possible in hydrogen fuel and at low fuel utilization up to ca. 4% at 650 °C for MSC with FeCr metal support and a Ni/GDC infiltrated FeCr-ScYSZ or LSFNT-ScYSZ backbone fuel electrode [12,16]. The main cause of degradation in fuel cell mode at higher fuel utilization on the MSC with a FeCr containing fuel electrode backbone was ascribed to accelerated corrosion, leading to higher resistances [14]. LSFNT based backbones with very low content of or without FeCr were developed in order to prevent this fatal corrosion when using FeCr-ScYSZ backbones. Such cells were successfully operated at higher fuel utilization of ca. 40–50% with hydrogen fuel and methane containing fuel [17]. The higher the fuel utilization, and thus the steam content and the oxygen partial pressure in the fuel electrode, the higher the degradation rate. A limitation when using methane fuel is the lower activity of the fuel electrode in the MSCs for internal methane reforming due to the much lower nickel content as compared to fuel electrode supported cells with Ni/YSZ cermet fuel electrodes. Focusing on the use of hydrogen as fuel in MSC operated as fuel cells, the detailed evaluation of the resistance trends reveals that the degradation in SOFC mode is due to an increase of both resistance contributions, Rs and Rp, whereas the larger increase comes from Rp (see Figure 9).
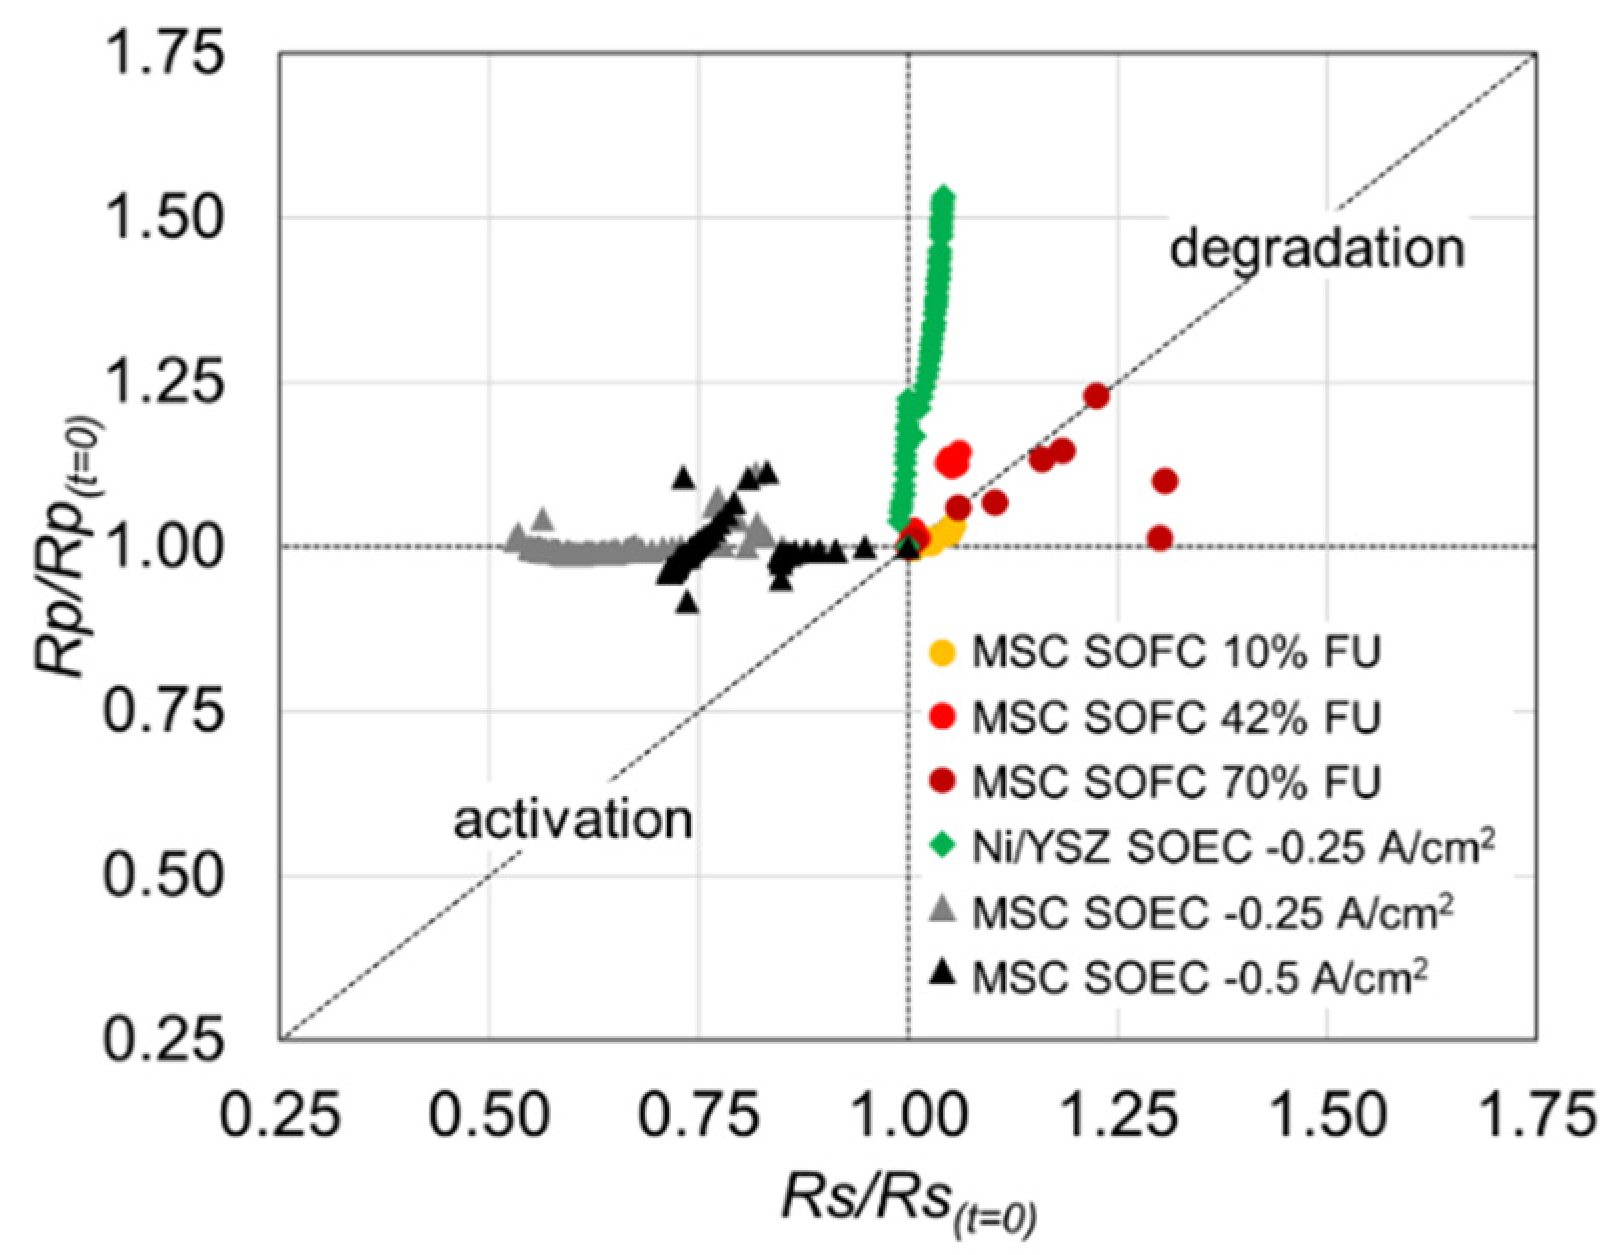
Plotting the ratio of the relative increase of Rs and Rp during operation provides an illustrative view on the degradation mechanisms; see Figure 10. Changes in the horizontal direction indicate purely Rs related processes, for example, loss of contact, delamination, and loss of conductivity through structural changes. Changes in the vertical direction indicate purely Rp related processes, which have often a reversible nature. Consequently, if the cell experiences mixed degradation processes, the slopes will be between these two extreme cases. The areas of either degradation or activation are indicated in Figure 10.
The MSC test with a LSFNT fuel electrode backbone in SOFC mode is represented in Figure 10 by circles. The same trend is observed when operating at 10, 42, and 70% FU, which is characterized by a simultaneous increase of Rs and Rp. This result suggests electrode degradation processes and degradation of the ohmic part as well, probably due to corrosion layer formation in the FeCr. Another potential cause could be loss of active area in the electrode, for example, the oxygen electrode towards the barrier layer. Only at the highest FU of 70%, the changes finally move towards the horizontal line, indicating that the increase of the serial resistance is determining the period of accelerated degradation. More severe corrosion and probably breakaway corrosion could be the explanation.
In this study, MSC and fuel electrode supported SoA cells were operated in electrolysis mode under the same conditions at 650 °C for 500 h using 50% H2O/50% H2. The ceramic SoA cell shows a steady degradation, which amounts to ca. 13% increase of cell voltage per 1000 h (see Figure 5). Detailed electrochemical characterization during the operation revealed a predominating increase of the polarization resistance, while the serial resistance remained nearly constant (see Figure 6a and Figure 7a). In fact, the polarization resistance increase constituted ca. 95% of the complete resistance increase. Furthermore, the evaluation using changes of the ratio Rs/Rp resistance contributions clearly shows the prevalence of electrode degradation as they are raising almost purely into the vertical direction (green diamonds in Figure 10).
More precisely, the processes at a frequency region around 100–500 Hz are affected by degradation (see Figure 6a). According to the results of the initial electrochemical characterization (see Figure 3 and Table 1), this is the characteristic region for fuel electrode processes, more precisely the TPB reaction. This phenomenon is also in line with previous results, where the fuel electrode was identified as responsible for the major degradation in electrolysis operation, presumably due to Ni particle size coarsening and loss of percolation, even though it is normally reported for operation at higher temperatures as compared to this study [19]. These structural changes were related to the overpotential at the fuel electrode. As the electrode reaction in Ni/YSZ fuel electrodes is confined to the TPB where the gas phase, the oxygen ion-conducting YSZ phase, and the electron-conducting Ni phase meet, reaction sites are vulnerable to any micro structural changes, in particular when considering the mobility of Ni particles under the operating conditions or potentially present impurities [13]. Moreover, in the present study, similar re-structuring, even though the operating temperature was lower by ca. 50 °C, is considered a realistic degradation process.
In contrast to previous experiences with MSC operated as fuel cells or the fuel electrode supported cells operated in electrolysis mode, the MSC show an activation, rather than degradation. This was observed when operating at the same current density as the fuel electrode supported SoA cell and as well when increasing the current density from −0.25 to −0.5 A/cm2 (see Figure 5). The cell voltage activation amounts to ca. 20%/1000 h and 15%/1000 h for −0.25 and −0.5 A/cm2 current density, respectively. EIS recorded during operation revealed that the main origin of this activation is related to a decrease of the serial resistance (see Figure 6b and Figure 7b). It amounted to ca. 95% of the total decrease of the resistance during operation. This is confirmed when evaluating the polarization contributions, which remained nearly constant during the 500 h of operating the MSCs (for the test at −0.25 A/cm2 see Figure 8b—similar results are obtained at −0.5 A/cm2). The trends of the changes of the ratio Rs/Rp as shown in Figure 10 confirm these results. They develop towards the left (activation) almost entirely in a horizontal way (grey and black triangles).
A typical observation for degradation phenomena of the polarization resistance of ceramic SoA cells is an increase of degradation rates with increasing current density, due to the increase of the overpotential at the (fuel) electrode [19,24]. Interestingly, the change of the serial resistance in the case of the MSC operation in electrolysis does not seem to depend significantly on the applied current density. Therefore, the activation mechanism does not seem to be related to the current density (see Figure 5) and also not to electrode processes (Rp, see Figure 10). It seems more related to the temperature in combination with partial steam/oxygen pressures. The reducing conditions when forming hydrogen in electrolysis mode can be the driving force. A potential mechanism is the reduction of iron oxide scales under these reducing conditions and an increase of conductivity in the electrodes.
The more stable behavior of the electrodes during the electrolysis operation of the MSCs could be related to the significantly different materials composition and structure of the fuel electrode, which otherwise would be the main contributor to degradation in SoA Ni/YZS based cells. The use of the mixed-ionic electronic conductor GDC, which is infiltrated together with Ni, expands the otherwise limited reaction point to a reaction zone and leads to lower local overpotential at the Ni particles and thus less tendency towards Ni coarsening, loss of Ni percolation, etc. Furthermore, even a slight loss of percolation of Ni would not lead to the same loss of electronic conductivity and thus increase of the ohmic resistance as in Ni/YSZ electrodes because GDC can act as electronic conductor.
5. Conclusions
Moving energy systems to sustainable sources such as wind and solar power requires efficient conversion technologies for balancing the fluctuating nature of these sources, for storage, and for alternatives to fossil-based fuels for transportation. Solid oxide electrolysers offer high efficiencies and cost-efficient materials and manufacturing processes, in particular, the metal supported cell configuration, which also provides high mechanical robustness. In the present study, metal supported solid oxide cells fabricated by ceramic processing methods were tested for electrolysis performance and durability and compared to state-of-the-art fuel electrode supported cells.
The performance gain in terms of area specific resistance is ca. 20% at 650 °C in 50%H2O/50% H2. The decreased ASR is due to the use of alternative materials and improved structures. In relation to the fuel electrode, a configuration with LSFNT backbones, infiltrated with Ni/GDC was used yielding:
- (i)
- High conductivities (due to the mixed ionic electronic conductivities of LSFNT and GDC);
- (ii)
- An extended reaction zone (from triple phase boundary in SoA Ni/YSZ cermet fuel electrodes to a reaction zone in Ni/GDC);
- (iii)
- Highly active nano-sized electrode particles (due to the infiltration of the fuel electrode and the in situ sintering of the oxygen electrode).
While a SoA fuel electrode supported cell showed a cell voltage degradation rate of ca. 13%/1000 h during electrolysis at 650 °C and −0.25 A/cm2, the MSC did not degrade over the testing period of 500 h nor at the higher current density of −0.5 A/cm2, on the contrary, even a slight activation was observed. Detailed electrochemical evaluation revealed the fuel electrode as main source of the degradation in the SoA cell, a typical phenomenon on this type of cells when operated at 700 °C and above. In contrast, no electrode degradation was observed on the MSC under the given conditions—probably related to the higher activity and thus lower overpotential. The slight activation during SOE was due to an improvement of the serial resistance.
The results of this study show the large potential of the metal supported cells in electrolysis operation.
Author Contributions
Conceptualization, A.H. and X.S.; methodology, A.H., X.S., R.C. and F.C.; experiment, X.S., R.C. and F.C.; formal analysis, R.C. and F.C.; evaluation and interpretation, A.H., X.S., R.C. and F.C.; resources, A.H.; writing—original draft preparation, A.H.; writing—review and editing, X.S., R.C. and F.C.; supervision, A.H. and X.S.; project administration, A.H. All authors have read and agreed to the published version of the manuscript.
Funding
This research received no external funding.
Data Availability Statement
Data are available on request.
Acknowledgments
The authors are very grateful for the technical support by Henrik Henriksen and Jens Valdemar Thorvald Høgh.
Conflicts of Interest
The authors declare no conflict of interest.
References
- Walter, C.; Blumentritt, R.; Posdziech, O.; Boltze, M. Status of Stack & System Development at Sunfire. In Proceedings of the 14th European SOFC & SOEC Forum, Lucerne, Switzerland, 20–23 October 2020. [Google Scholar]
- Noponen, M.; Torri, P.; Göös, J.; Puranen, J.; Niinistö, J.; Pylypko, S.; Roostar, M.; Õunpuu, E. Progress of SOE development at Elcogen. In Proceedings of the 14th European SOFC & SOEC Forum, Lucerne, Switzerland, 20–23 October 2020. [Google Scholar]
- Küngas, R.; Blennow, P.; Heiredal-Clausen, T.; Holt Nørby, T.; Rass Hansen, J.; Bøgild Hansen, J.; Moses, P.G. Power-to-X activities at Haldor Topsoe: Our approach for electrification of the chemicals industry. In Proceedings of the 14th European SOFC & SOEC Forum, Lucerne, Switzerland, 20–23 October 2020. [Google Scholar]
- Leah, R.; Bone, A.; Selcuk, A.; Lankin, M.; Rahman, M.; Clare, A.; Reade, G.; Felix, F.; De Vero, J.; Wang, X.; et al. Commercialization of the Steel Cell® technology: Latest Update. In Proceedings of the 14th European SOFC & SOEC Forum, Lucerne, Switzerland, 20–23 October 2020. [Google Scholar]
- Bertoldi, M.; Bucheli, O.; Pichler, A. Development, Manufacturing and Deployment of SOC-Based Products at SOLIDpower. In Proceedings of the 14th European SOFC & SOEC Forum, Lucerne, Switzerland, 20–23 October 2020. [Google Scholar]
- Tucker, M.C. Progress in metal-supported solid oxide electrolysis cells: A review. Int. J. Hydrogen Energy 2020, 45, 24203–24218. [Google Scholar] [CrossRef]
- Venkata Krishnan, V. Recent developments in metal-supported solid oxide fuel cells. WIREs Energy Environ. 2017, 6, e246. [Google Scholar] [CrossRef]
- Schiller, G.; Ansar, A.; Lang, M.; Patz, O. High temperature water electrolysis using metal supported solid oxide electrolyser cells (SOEC). J. Appl. Electrochem. 2009, 39, 293–301. [Google Scholar] [CrossRef] [Green Version]
- Udomsilp, D.; Rechberger, J.; Neubauer, R.; Bischof, C.; Thaler, F.; Schafbauer, W.; Menzler, N.H.; de Haart, L.G.J.; Nenning, A.; Opitz, A.K.; et al. Metal-supported solid oxide fuel cells with exceptionally high power density for range extender systems. Cell Rep. Phys. Sci. 2020, 1, 100072. [Google Scholar] [CrossRef]
- Blennow Tullmar, P.; Hjelm, J.; Klemensø, T.; Persson, Å.H.; Brodersen, K.; Srivastava, A.K.; Frandsen, H.L.; Lundberg, M.; Ramousse, S.; Mogensen, M.B. Development of planar metal supported SOFC with novel cermet anode. ECS Trans. 2009, 25, 701–710. [Google Scholar] [CrossRef] [Green Version]
- Tucker, M.C. Durability of symmetric-structured metal-supported solid oxide fuel cells. J. Power Sources 2017, 369, 6–12. [Google Scholar] [CrossRef] [Green Version]
- Klemensø, T.; Nielsen, J.; Blennow, P.; Persson, Å.H.; Stegk, T.; Hjalmarsson, P.; Christensen, B.H.; Sønderby, S.; Hjelm, J.; Ramousse, S. Development of long-term stable and high-performing metal-supported SOFCs. ECS Trans. 2011, 35, 369–378. [Google Scholar] [CrossRef]
- Mogensen, M.B.; Chen, M.; Frandsen, H.L.; Graves, C.R.; Hauch, A.; Hendriksen, P.V.; Jacobsen, T.; Jensen, S.H.; Skafte, T.L.; Sun, X. Review of Ni migration in SOC electrodes. In Proceedings of the 14th European SOFC & SOEC Forum, Lucerne, Switzerland, 20–23 October 2020. [Google Scholar]
- McKenna, B.J.; Christiansen, N.; Schauperl, R.; Prenninger, P.; Nielsen, J.; Blennow, P.; Klemensø, T.; Ramousse, S.; Kromp, A.; Weber, A. Advances in metal supported cells in the METSOFC EU consortium. Fuel Cells 2013, 13, 592–597. [Google Scholar] [CrossRef]
- Sudireddy, B.R.; Nielsen, J.; Persson, Å.H.; Thyden, K.; Brodersen, K.; Ramousse, S.; Neagu, D.; Stefan, E.; Irvine, J.T.S.; Geisler, H.; et al. Development of RobustMetal-supported SOFCs and stack components in EU METSAPP consortium. Fuel Cells 2017, 17, 508–516. [Google Scholar] [CrossRef] [Green Version]
- Nielsen, J.; Persson, Å.H.; Sudireddy, B.R.; Irvine, J.T.S.; Thydén, K. Infiltrated La0.4Sr0.4Fe0.03Ni0.03Ti0.94O3 based anodes for all ceramic and metal supported solid oxide fuel cells. J. Power Sources 2017, 372, 99–106. [Google Scholar] [CrossRef] [Green Version]
- Hagen, A.; Sun, X.; Sudireddy, B.R.; Persson, Å.H. Metal supported SOFCs for mobile applications using hydrocarbon fuels. J. Electrochem. Soc. 2020, 167, 104510. [Google Scholar] [CrossRef]
- Larsen, P.H.; Brodersen, K. Reversible Solid Oxide Cell Producing Method Involves Sintering Multilayer Structure After Laminating Anode Support Layer on Top of Anode Layer. U.S. Patent US2008124602-A1, 2014. [Google Scholar]
- Hauch, A.; Brodersen, K.; Chen, M.; Mogensen, M.B. Ni/YSZ electrodes structures optimized for increased electrolysis performance and durability. Solid State Ion. 2016, 293, 27–36. [Google Scholar] [CrossRef] [Green Version]
- Chen, M.; Sun, X.; Chatzichristodoulou, C.; Koch, S.; Hendriksen, P.V.; Mogensen, M.B. Thermoneutral Operation of Solid Oxide Electrolysis Cells in Potentiostatic Mode. ECS Trans. 2017, 78, 3077–3088. [Google Scholar] [CrossRef] [Green Version]
- Krishnakumar Padinjarethil, A.; Bianchi, F.R.; Bosio, B.; Hagen, A. Electrochemical characterization and modelling of anode and electrolyte supported solid oxide fuel cells. Front. Energy Res. 2021, 9, 668964. [Google Scholar] [CrossRef]
- Christensen, J.O.; Sudireddy, B.R.; Hagen, A. Performance of metal supported SOFCs operated in hydrocarbon fuels and at low (<650 °C) temperatures. ECS Trans. 2021, 103, 713–724. [Google Scholar] [CrossRef]
- Ovtar, S.; Tong, X.; Bentzen, J.J.; Thydén, K.T.S.; Simonsen, S.B.; Chen, M. Boosting the performance and durability of Ni/YSZ cathode for hydrogen production at high current densities via decoration with nano-sized electrocatalysts. Nanoscale 2019, 11, 4394. [Google Scholar] [CrossRef] [PubMed]
- Chen, M.; Liu, Y.-L.; Bentzen, J.J.; Zhang, W.; Sun, X.; Hauch, A.; Tao, Y.; Bowen, J.R.; Hendriksen, P.V. Microstructural degradation of Ni/YSZ electrodes in solid oxide electrolysis cells under high current. J. Electrochem. Soc. 2013, 160, F883–F891. [Google Scholar] [CrossRef]
Figure 1.
SEM image of the cross section of (a) SoA fuel electrode supported reference cell and (b) metal supported cell.
Figure 1.
SEM image of the cross section of (a) SoA fuel electrode supported reference cell and (b) metal supported cell.

Figure 2.
iV curves in electrolysis mode of (a) the ceramic fuel electrode supported cell with a Ni/YSZ fuel electrode and (b) the metal supported cell with a Ni/GDC-LSFNT fuel electrode. 650 °C (blue curves) and 700 °C (red curves) using 50% H2O/H2 vs. air.
Figure 2.
iV curves in electrolysis mode of (a) the ceramic fuel electrode supported cell with a Ni/YSZ fuel electrode and (b) the metal supported cell with a Ni/GDC-LSFNT fuel electrode. 650 °C (blue curves) and 700 °C (red curves) using 50% H2O/H2 vs. air.

Figure 3.
EIS of the ceramic SoA cell (a) Nyquist plot, (b) Bode plot, and at 650 °C, 20% and 4% H2O/H2 to the fuel electrode vs. O2 and air to the oxygen electrode, and (c) Delta (difference) Bode plot, 20% vs. 4% fuel humidity to the fuel electrode and air vs. O2 to the oxygen electrode.
Figure 3.
EIS of the ceramic SoA cell (a) Nyquist plot, (b) Bode plot, and at 650 °C, 20% and 4% H2O/H2 to the fuel electrode vs. O2 and air to the oxygen electrode, and (c) Delta (difference) Bode plot, 20% vs. 4% fuel humidity to the fuel electrode and air vs. O2 to the oxygen electrode.

Figure 4.
EIS of the metal supported cell (a) Nyquist plot, (b) Bode plot, and at 650 °C, 20% and 4%H2O/H2 to the fuel electrode vs. O2 and air to the oxygen electrode, and (c) Delta (difference) Bode plot, 20% vs. 4% fuel humidity to the fuel electrode and air vs. O2 to the oxygen electrode.
Figure 4.
EIS of the metal supported cell (a) Nyquist plot, (b) Bode plot, and at 650 °C, 20% and 4%H2O/H2 to the fuel electrode vs. O2 and air to the oxygen electrode, and (c) Delta (difference) Bode plot, 20% vs. 4% fuel humidity to the fuel electrode and air vs. O2 to the oxygen electrode.

Figure 5.
Cell voltage vs. operating time under constant electrolysis current of −0.25 and −0.5 A/cm2 at 650 °C in 50% H2O/H2 fuel vs. air using a ceramic fuel electrode supported cell (green curve) and the metal supported cells (grey and black curves).
Figure 5.
Cell voltage vs. operating time under constant electrolysis current of −0.25 and −0.5 A/cm2 at 650 °C in 50% H2O/H2 fuel vs. air using a ceramic fuel electrode supported cell (green curve) and the metal supported cells (grey and black curves).

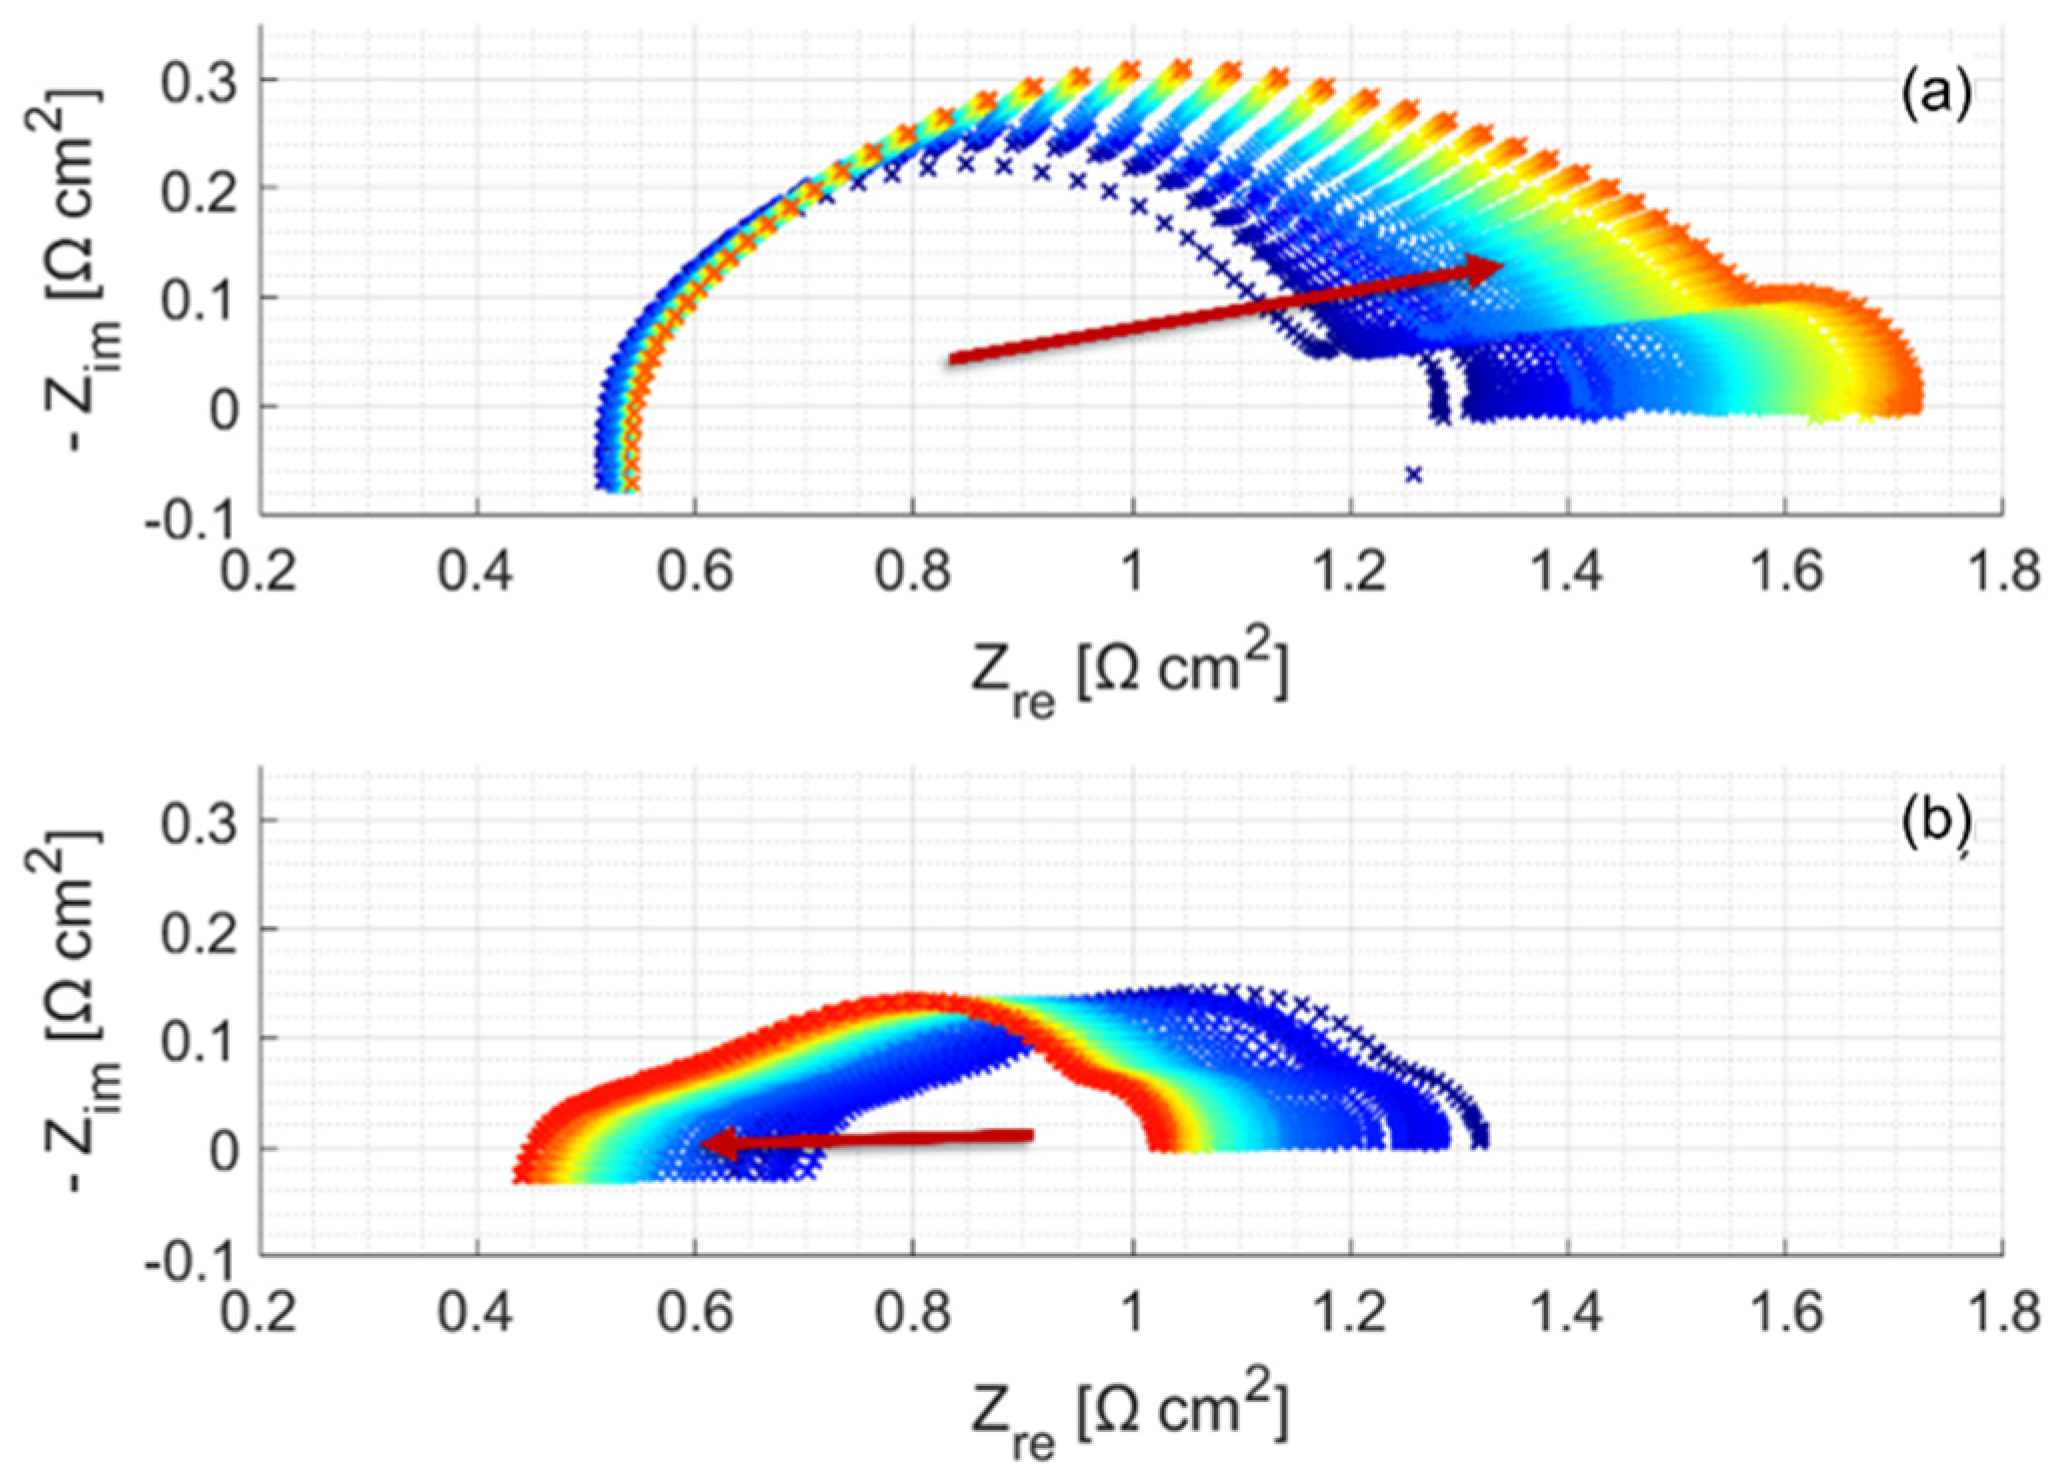
Figure 6.
EIS (Nyquist plot) recorded during electrolysis durability tests on (a) the ceramic fuel electrode supported SoA cell and (b) the metal supported cell at 650 °C, −0.25 A/cm2. The frequency of recording was every 12 h during the first 100 h followed by every 8 h for 140 h, and finally every 6 h for the last period. Increasing operating time from blue to red curves (arrow).

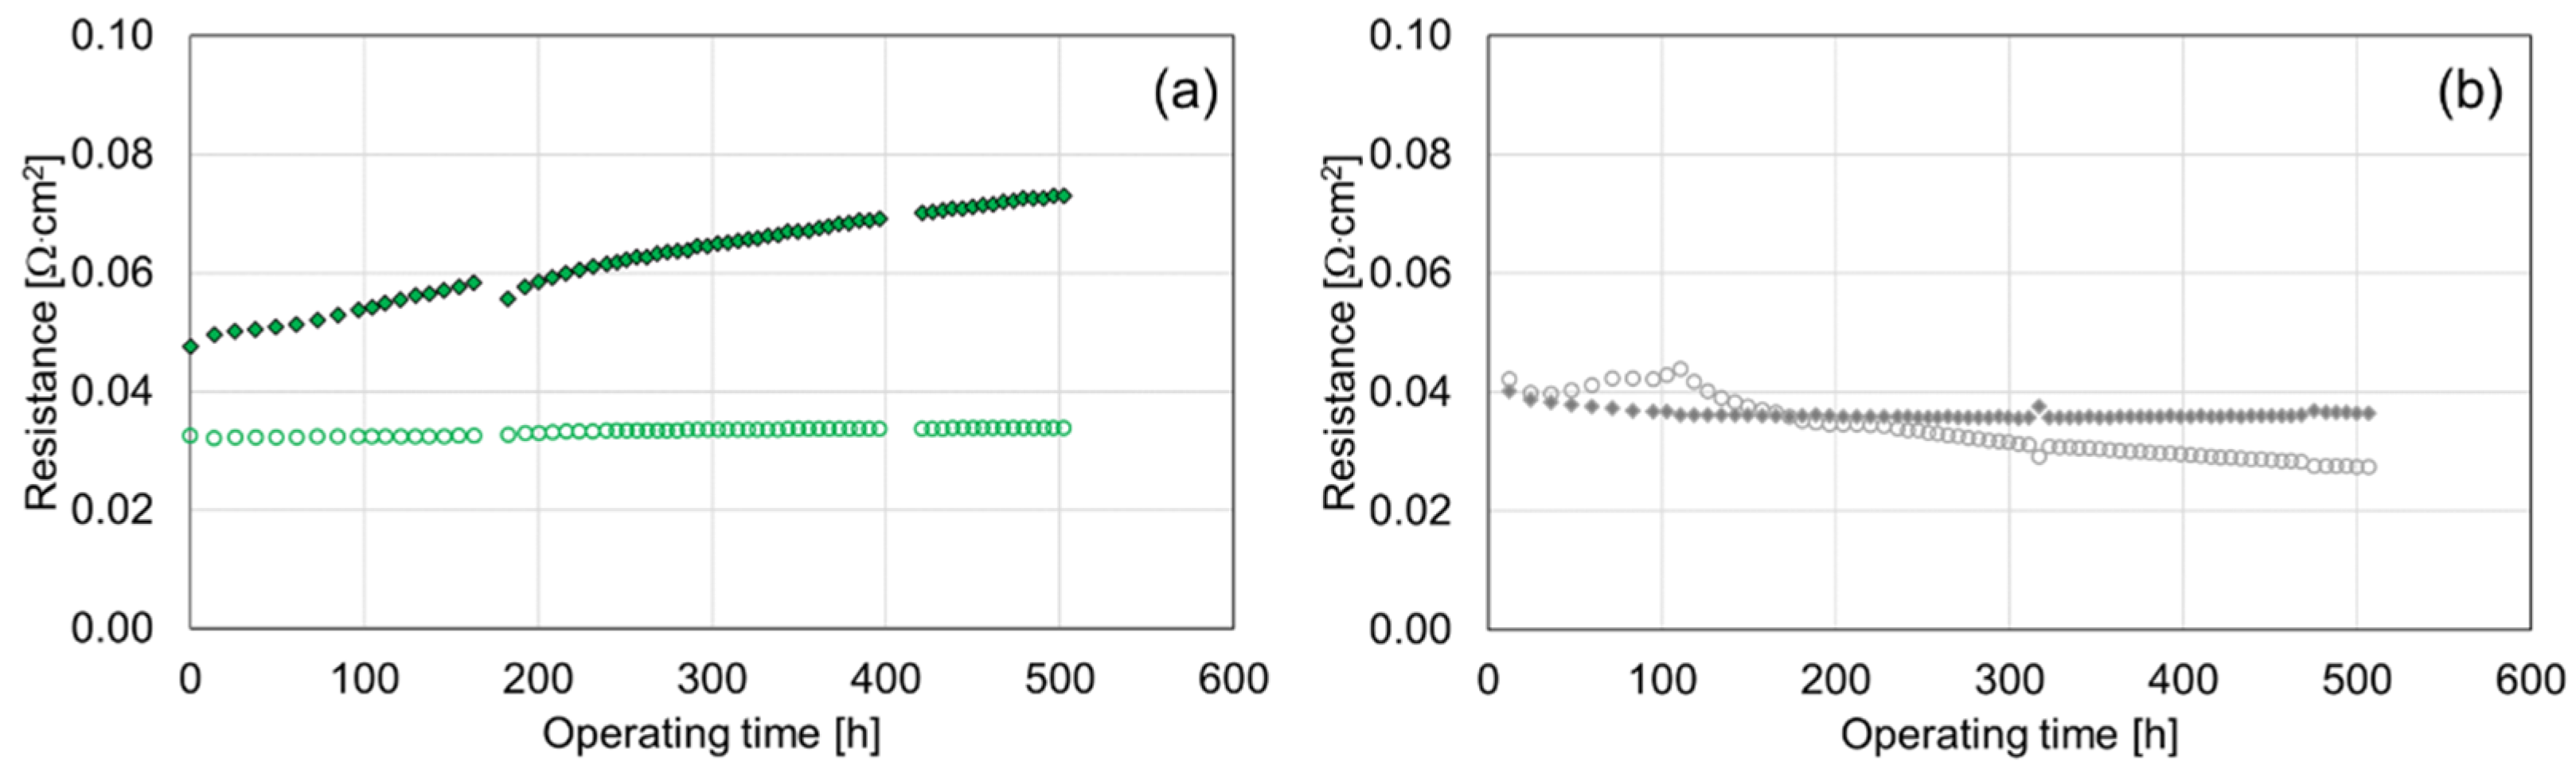
Figure 7.
Ohmic (open circles) and polarization resistances (diamonds) during the electrolysis durability tests of (a) the ceramic SoA cell and (b) the MSC at 650 °C, −0.25 A/cm2. Values were deduced from EIS.
Figure 7.
Ohmic (open circles) and polarization resistances (diamonds) during the electrolysis durability tests of (a) the ceramic SoA cell and (b) the MSC at 650 °C, −0.25 A/cm2. Values were deduced from EIS.

Figure 8.
Differences of EIS (Bode plot) over time for (a) ceramic SoA cell and (b) metal supported cell. The initial EIS was subtracted from all spectra at the specific operating time. Ceramic cell operated at 650 °C, −0.25 A/cm2. The frequency of recording was every 12 h during the first 100 h, followed by every 8 h for 140 h, and finally every 6 h for the last period. Increasing operating time from blue to red curves (arrow).

Figure 9.
Development of the area specific serial (Rs) and polarization (Rp) resistance during MSC operation in SOFC mode at 650 °C, with 20% H2O in H2 fuel and 0.25 A/cm2. Fuel utilization was changed from 10 to 42, and finally to 70% as indicated in the figure.
Figure 9.
Development of the area specific serial (Rs) and polarization (Rp) resistance during MSC operation in SOFC mode at 650 °C, with 20% H2O in H2 fuel and 0.25 A/cm2. Fuel utilization was changed from 10 to 42, and finally to 70% as indicated in the figure.

Figure 10.
Ratio between serial (Rs) and polarization (Rp) resistance change compared to start of operation (Rs(t = 0)), Rp(t = 0)). MSC in SOFC mode (circles) with 10% FU (orange), 42% FU (red), 70% FU (dark red), Ni/YSZ cell (green diamonds), MSC in SOEC mode at −0.25 A/cm2 (grey triangles), and MSC in SOEC mode at −0.5 A/cm2 (black triangles).


Table 1.
Characteristic frequencies of electrode contributions to the total ASR determined from gas shift EIS at 650 °C.
Table 1.
Characteristic frequencies of electrode contributions to the total ASR determined from gas shift EIS at 650 °C.
| Cell Type | f of the Process (Hz) | Assignment |
|---|---|---|
| SoA | 5 | Ni/YSZ diffusion |
| 20 | LSC/GDC electrode | |
| 400 | Ni/YSZ TPB 1 | |
| MSC | 4 | Ni/GDC-LSFNT diffusion |
| 10 | Ni/GDC-LSFNT charge transfer | |
| 100 | LSC electrode |
1 Triple phase boundary (TPB).
Publisher’s Note: MDPI stays neutral with regard to jurisdictional claims in published maps and institutional affiliations. |
© 2022 by the authors. Licensee MDPI, Basel, Switzerland. This article is an open access article distributed under the terms and conditions of the Creative Commons Attribution (CC BY) license (https://creativecommons.org/licenses/by/4.0/).
Share and Cite
MDPI and ACS Style
Hagen, A.; Caldogno, R.; Capotondo, F.; Sun, X. Metal Supported Electrolysis Cells. Energies 2022, 15, 2045. https://0-doi-org.brum.beds.ac.uk/10.3390/en15062045
AMA Style
Hagen A, Caldogno R, Capotondo F, Sun X. Metal Supported Electrolysis Cells. Energies. 2022; 15(6):2045. https://0-doi-org.brum.beds.ac.uk/10.3390/en15062045
Chicago/Turabian StyleHagen, Anke, Riccardo Caldogno, Federico Capotondo, and Xiufu Sun. 2022. "Metal Supported Electrolysis Cells" Energies 15, no. 6: 2045. https://0-doi-org.brum.beds.ac.uk/10.3390/en15062045
Note that from the first issue of 2016, this journal uses article numbers instead of page numbers. See further details here.