
Numerical Simulation on Pressure Dynamic Response Characteristics of Hydrogen Systems for Fuel Cell Vehicles


1
Hubei Key Laboratory of Advanced Technology for Automotive Components, Wuhan University of Technology, Wuhan 430070, China
2
Hubei Collaborative Innovation Center for Automotive Components Technology, Wuhan 430070, China
*
Author to whom correspondence should be addressed.
Energies 2022, 15(7), 2413; https://0-doi-org.brum.beds.ac.uk/10.3390/en15072413
Submission received: 24 February 2022
/
Revised: 21 March 2022
/
Accepted: 23 March 2022
/
Published: 25 March 2022
(This article belongs to the Special Issue Advanced Techniques for Thermoelectric Generator and Fuel Cell System)
Abstract
:A proton exchange membrane fuel cell (PEMFC) is known as one of the most promising energy sources for electric vehicles. A hydrogen system is required to provide hydrogen to the stack in time to meet the flow and pressure requirements according to the power requirements. In this study, a 1-D model of a hydrogen system, including the fuel cell stack, was established. Two modes, one with and one without a proportion integration differentiation (PID) control strategy, were applied to analyze the pressure characteristics and performance of the PEMFC. The results showed that the established model could be well verified with experimental data. The anode pressure fluctuation with a PID control strategy was more stable, which reduced the damage to the fuel cell stack caused by sudden changes of anode pressure. In addition, the performance of the stack with the PID control mode was slightly improved. There was an inflection point for hydrogen utilization; the hydrogen utilization rate was higher under the mode without PID control when the current density was greater than 0.4 A/cm2. What is more, a hierarchical control strategy was proposed, which made the pressure difference between the anode and cathode meet the stack working requirements, and, more importantly, maintained the high hydrogen utilization of the hydrogen system.
1. Introduction
With the increasingly prominent problems of global climate change and energy shortages, clean energy devices are becoming more and more popular [1,2]. A proton exchange membrane fuel cell (PEMFC) is known as one of the most promising vehicle power sources due to it having the advantages of high efficiency, fast response, low noise, and zero emissions [3,4,5]. As an important part of a vehicle fuel cell system, the hydrogen system is responsible for providing the corresponding flow of hydrogen according to the power demand and maintaining the pressure stability of the anode according to the load change and the tail hydrogen emission process [6].
In order to extend the range of fuel cell vehicles, the hydrogen storage pressure standard of a hydrogen storage tank can reach 70 MPa. The hydrogen in the hydrogen storage tank is depressurized to 15–20 bar through the pressure-reducing valve at the front end of the ejector or injector [6,7]. By controlling the duty cycle through the pulse width modulation signal of the injector, the amount of hydrogen injected can be controlled accurately to meet the power requirement [8]. The unreacted hydrogen from the outlet is recirculated to the inlet through the circulating pump or ejector and combined with the primary flow to realize the high utilization rate of the hydrogen. Since the water generated by the electrochemical reaction from the cathode penetrates the anode, the exhaust gas and water from the anode need to be discharged periodically to maintain a stable output performance [9,10]. However, a small part of hydrogen is discharged with the water during anode discharge, which leads to the waste of hydrogen and, more importantly, the instantaneous mutation of anode pressure.
As an important operating parameter, pressure is closely related to the output performance of the PEMFC [11]. Generally, a PEMFC is required to operate under specific working pressure, such as 200–400 kPa, to obtain the ideal output performance [12,13]. In addition, the anode operating pressure is set higher than that of the cathode, the water transmission from the anode to the cathode is improved through the formed pressure difference to avoid the anode flooding with water. Li, et al. [14] found that the anode pressure was controlled to be about 20 kPa higher than the cathode pressure; the performance of the fuel cell under high current density can be greatly improved. It is considered that the pressure difference facilitates the discharge of water in the anode and the prevention of flooding in the anode.
During fuel cell operation, load change and exhaust gas emissions are inevitable; these cause pressure fluctuations. Yuan et al. [15] designed an FLPI controller using the change in load flow and the purge action as input disturbances. Online experiments show that when the load changes, the system pressure can respond quickly, and the pressure fluctuation is controlled at 2 kPa when the purge is activated. Wang et al. [16] designed an ejector suitable for a 10 kW PEMFC system and conducted experiments on the hydrogenation recirculation experiment. It was found that, compared with the EDA mode, the hydrogen consumption of the ejector mode was reduced by 5%-10%, and the pressure fluctuation caused by the switch of purge could improve the performance of the injector at a low current density.
Many studies have investigated the characteristics of the PEMFC by establishing relevant mathematical models. Musio et al. [17] applied electrochemistry to develop a single cell model fuel cell in a Simulink environment, which was used to analyze the temperature, pressure, humidity, and current of the single cell under steady-state conditions. Zhang, et al. [18] developed a one-dimensional model of a fuel cell system to calculate the pressure difference between the cathode and the anode in the discharge process and controlled it within a certain range by using a control model. Variable load and tail gas discharge are the main causes for anode pressure fluctuations; PID is widely used in the pressure control of hydrogen systems. Chen et al. [19] added the supplementary signal of the tail gas discharge to the original PID control and improved the injection strategy of the common rail injector; this reduced the pressure fluctuation of the system during the tail gas discharge process, and extended the service life of the common rail injector. However, hydrogen waste is inevitable in the discharge process, and the low hydrogen utilization rate of a PEMFC is also one of the main reasons limiting its commercial development. A reasonable discharge strategy needs to be formulated to ensure the full emission of waste gas and the improvement of hydrogen utilization as much as possible. Shen et al. [20] established a hydrogen recirculation system model by studying the characteristic curve of the circulating pump; they found that a discharge of 0.3 s in a 10-s period could enable the entire system to maintain a high hydrogen utilization rate.
The predecessors concluded through experiments that controlling the anode pressure of the stack to be 20 kPa higher than the cathode pressure could effectively improve the performance of the single cell, and the inlet pressure characteristics during the discharge process were studied by modeling. There is little research on the hydrogen utilization rate during the periodic discharge of the outlet valve and the hydrogen utilization rate under a single PID control mode is rather high. No research has been carried out in this area in combination with the economy of the fuel cell.
In this paper, the stack pressure characteristics and hydrogen utilization rate of the periodic discharge process are studied, and the hydrogen utilization rate under the two control modes is analyzed and compared. Since the internal pressure of the stack could not be monitored during the experiment, a hydrogen system model was established to analyze the pressure response characteristics inside the stack under different control strategies and loaded modes. Based on the analysis of the stack pressure characteristics and hydrogen utilization in the two modes, a mode switching strategy based on a current density partition is proposed, and the control strategy of the hydrogen system for a fuel cell vehicle was optimized to ensure low pressure fluctuations and high hydrogen utilization, which is beneficial to the durability and economy of a fuel cell The results of this study provided effective guidance for the practical application of vehicle fuel cells.
2. Mathematical Model
2.1. Hydrogen System Model
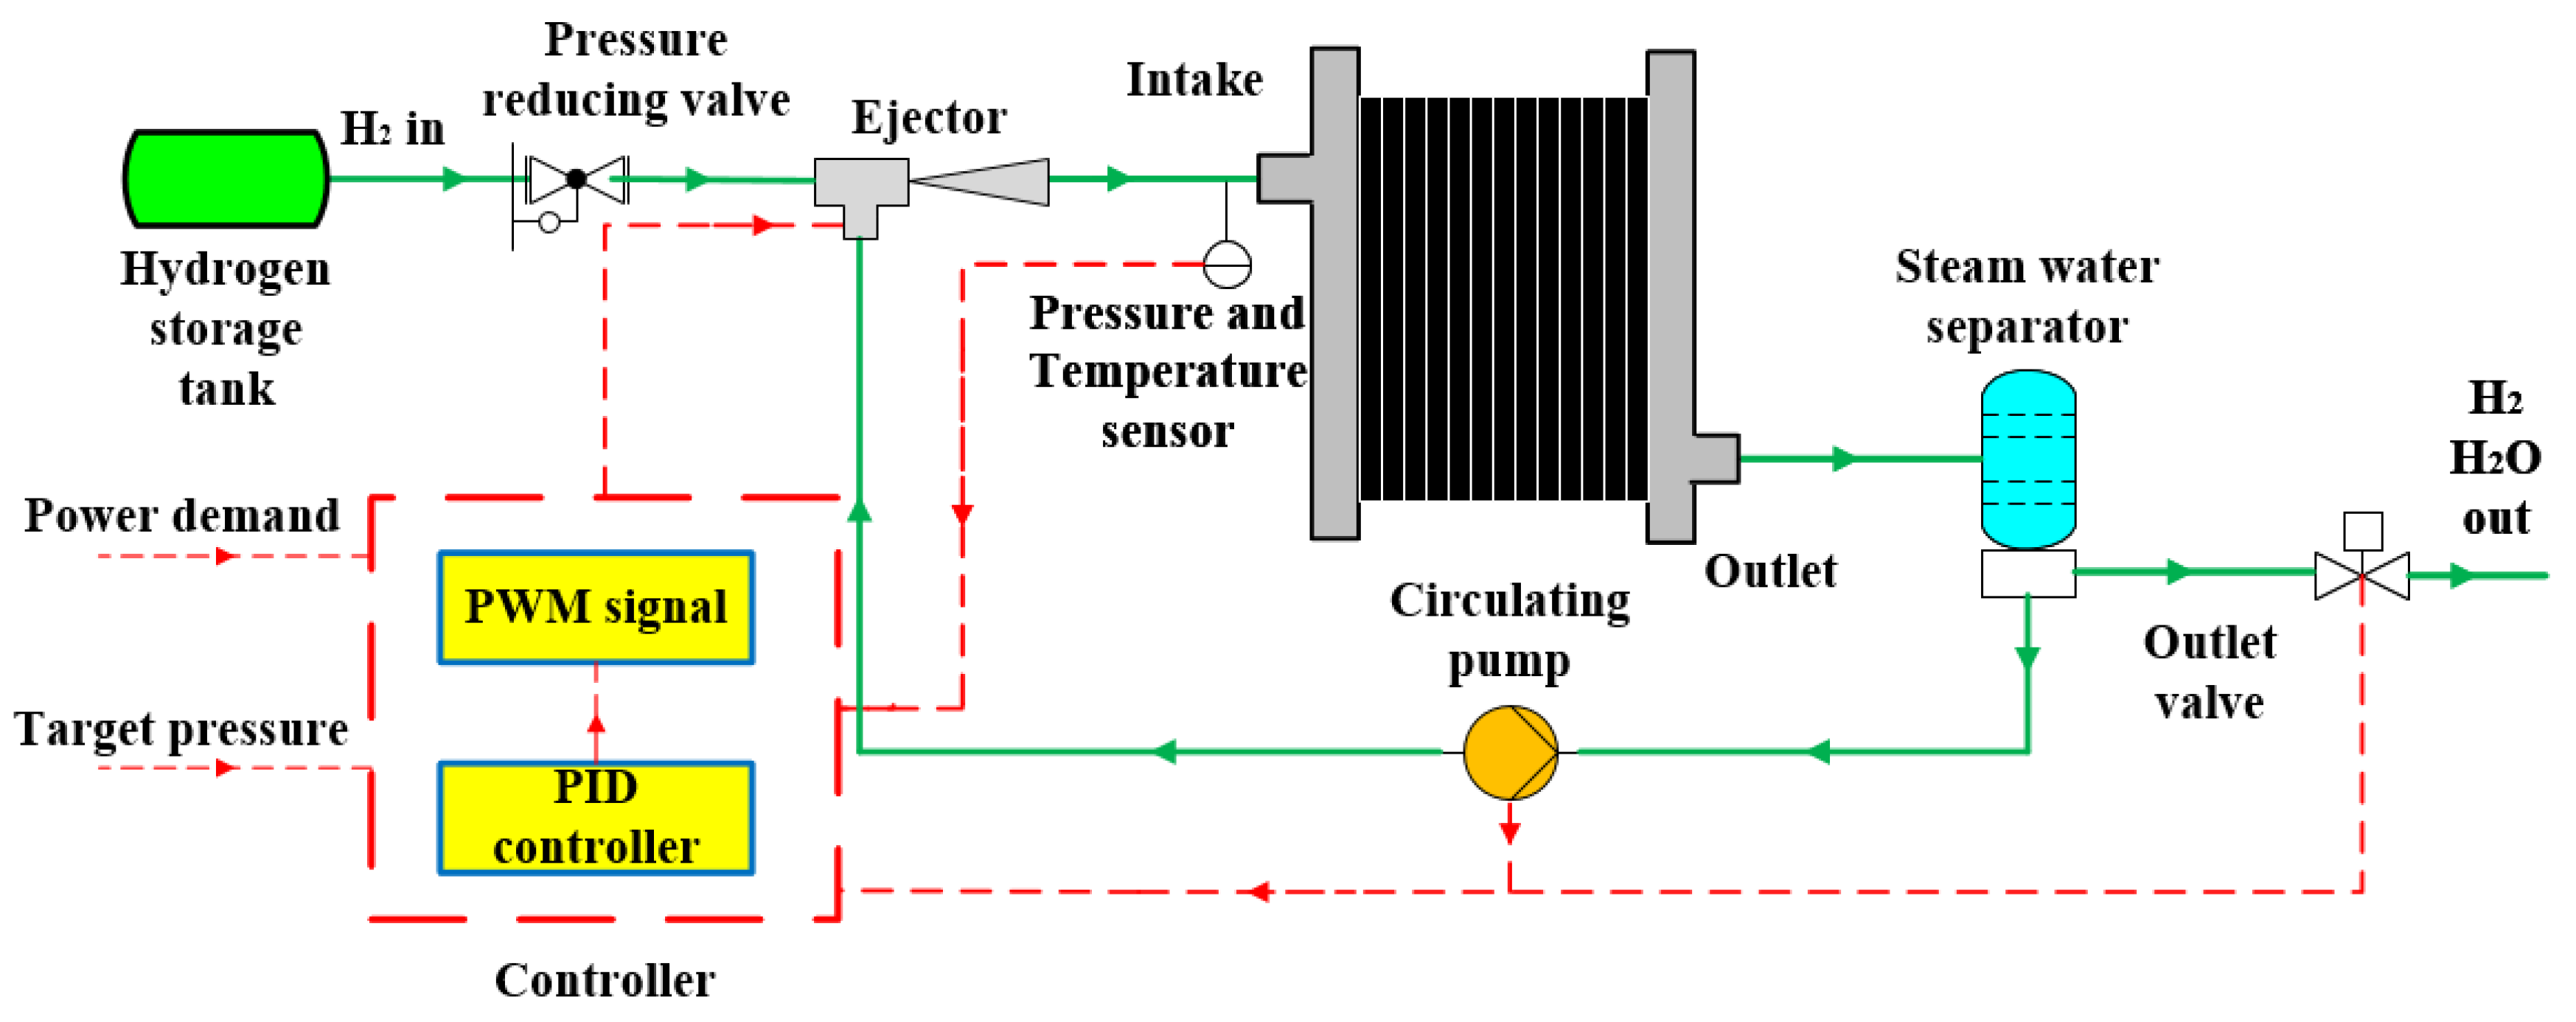
The PEMFC hydrogen system for vehicles is mainly composed of a hydrogen storage tank, pressure relief valve, ejector or injector, fuel cell stack, circulating pump, water gas separator, outlet valve, etc. The schematic diagram of the hydrogen system in this paper is shown in Figure 1. The high-pressure hydrogen supplied from the hydrogen tank passes through the pressure-reducing valve to the ejector, which was used to regulate the flow of fresh hydrogen to the stack. The circulating pump was used to circulate the tail hydrogen from the outlet to the inlet, so as to realize hydrogen recirculation. The gas–water separator was used to separate the water in the anode exhaust gas and adjust the humidity of the gas in the hydrogen system. In addition, an outlet valve was used for system emissions.
2.2. Model Assumption
The following assumptions and simplifications of the model were employed: (1) The 1-D model of the hydrogen system adopts the pressure control model; (2) The model of the pressure relief valve was ignored, and the front-end pressure was set directly. (3) All the hydrogen that was not reacted is recycled by the circulating pump. (4) The operating temperature of the fuel cell stack is constant. (5) The mole fraction of the inlet reactant is constant. (6) All gases are ideal gases, and the ideal gas law and Moore conservation law apply.
2.3. Fuel Cell Model
The output voltage of a single cell consists of two parts: the ideal potential and the overpotential [20,21,22,23].
where Enernst is the Nernst potential with reversible voltage under specific conditions and Vact, Vohmic, and Vcon are activation overpotential, ohmic overpotential, and concentration overpotential, respectively.
2.3.1. Nernst Potential
The Gibbs free energy changes with the changes of pressure and temperature. The approximate equation of Gibbs free energy can be obtained from the empirical equation [24]:
The pressure in the formula is the partial pressure of gas. Generally, the gas pressure of the cathode and anode is roughly the same. From the entropy change under standard conditions, it can be written as [25]:
Here, T represents the cell temperature and and are the hydrogen and oxygen partial pressure, respectively.
2.3.2. Activation Overpotential
In low-temperature and medium-temperature fuel cells, activation overvoltage is the main factor of a voltage drop, which is determined by the empirical Equation (4) fitted with the experimental data of activation overvoltage [26]:
Here, ξ1, ξ2, ξ3, ξ4 are the empirical parameters of the fuel cell system obtained by experiment, which are given in the Table 1:
represents the dissolved concentration of O2 at the gas–liquid interface. The dissolved concentration of O2 is obtained from Henry’s theorem [26]:
2.3.3. Ohmic Overpotential
Ohmic overpotential consists of two parts: proton transport resistance Rproton in the proton exchange membrane and electron transport resistance Relectronic between the current collector and electrode. Ohmic overpotential is described as follows [26]:
Here, electron transport resistance Relectronic can be regarded as a constant as 100 µΩ between 50 °C and 90 °C [27].
Proton transport resistance Rproton is determined by:
Here, ρM is the membrane resistivity, which is a function of current, activation area, and water content of membrane. l is the thickness of the electrolyte membrane, and the calculation of membrane resistivity is as follows [28]:
where φ is the water content of the membrane.
2.3.4. Concentration Overpotential
The concentration overpotential, resulting from a change in the concentration of the reactants on the electrode surface, could be improved by enhancing the mass transfer of the reactants and water. Vcon can be computed by the following expression [29]:
Here, B is an empirical constant and Imax is the limiting current density, decreasing exponentially along the channel length.
2.4. Hydrogen System Model
This model mainly analyzed the pressure response characteristics of the hydrogen system, the pressure of the intake manifold, anode, and outlet manifold was also calculated. The calculation of the hydrogen system pressure was based on the continuity equation, momentum equation, and ideal gas equation as follows [20]:
2.4.1. Valve Model
Both the injector and the outlet valve realize the nozzle driven by high-pressure gas through the pressure difference between the front end and the rear end. The mathematical model of the injector and the outlet valve could be established by using the tapered nozzle theory [30]. According to the ratio of front and rear end pressure, the flow formula for the valve parts can be expressed as follows:
where k and γ are related to the type of gas and Cvalve represents the resistance coefficient of the valve. Here Avalve is the equivalent area of the valve port as follows:
where φvalve is the diameter of the valve and θ is the duty cycle of the valve, respectively.
2.4.2. Intake Manifold
The internal pressure of the intake manifold is determined by the flow in and out, the previous model assumed that all the hydrogen that had not been reacted was recycled to the intake, and the effect of circulation on humidity was ignored. The expressions of intake manifold pressure, mass flow, and circulating flow are as follows [20]:
where mim,in is the outlet flow of the injector, mre represents circulating flow, mim,out represents the discharge flow of the intake manifold, kim represents the equivalent flow resistance coefficient between the intake manifold and the anode flow field, and λset represents the set initial hydrogen stoichiometric ratio, respectively.
2.4.3. Anode Flow Field Model
According to the previous assumption, the pressure of the stack anode is only affected by hydrogen and steam. From the ideal gas formula, the change rate of anode pressure could be obtained from the formula, and the change in hydrogen flow was calculated by the formula. Assuming that the reactor is in a constant humidity state, the content of water vapor does not change with the change in tail row. All the equations are as follows [20]:
where Pan0 represents the initial value of anode pressure, Pan,vopor represents water vapor pressure, which is the product of saturated vapor pressure and relative humidity at the current temperature, Pan′ represents the change rate of anode pressure, represents steady gas flow in the anode flow channel, and Van is the volume of anode channel, respectively.
2.4.4. Outlet Manifold
The outlet manifold was considered as a whole. Steady gas flow in the outlet manifold was equal to the intake flow minus the outlet flow minus the circulating flow of the outlet manifold, all the equations are as follows [20]:
where kan represents the equivalent flow resistance coefficient between the anode flow field and the outlet manifold, and Vom is the volume of the outlet manifold. Here mpurage is calculated through the previous valve model, and β represents the open state of the outlet manifold, its value is 1 or 0, respectively.
2.4.5. Pulse Width Modulation Signal
The supply of hydrogen was required to match the power demand of fuel cell vehicles [31]. The required injection amount was controlled by controlling the valve opening of the injector, which was determined by the PWM signal. It could be calculated by the following [20]:
where i represents current density, Aact represents activation area, represents the molar mass of hydrogen, ncell is the number of unit fuel cell, F is the Faraday constant, and ω1 represents PWM signal, respectively. The parameters of the hydrogen system are given in Table 2; the flow resistance coefficients Kim and Kan in Table 2 were obtained by calibration during the experiment:
2.5. Pressure Control Objectives
In the process of fuel cell operation, the anode pressure fluctuated frequently due to the tail gas discharge and load change. The pressure on both sides of the anode and cathode needed to be strictly controlled. To avoid mechanical damage to the key components, a constant pressure difference was maintained between the anode and cathode, and the cathode pressure was followed to regulate the anode pressure. In addition, the anode pressure wats controlled higher than that of the cathode to alleviate anode flooding [14]. The pressure control objectives were set as follows:
2.6. Simulation Approach
The input module of the whole model was the current density of the fuel cell and the pressure signal of the cathode. The output signal included the pressure of the intake manifold, anode, and outlet manifold of the hydrogen system, as well as the output voltage and output power of the single cell module. At the same time, a certain operating condition was set to calculate the hydrogen utilization rate under different operating conditions.
Two control modes were adopted and compared, including a non-PID control and PID control strategy. The outlet valve adopted timed periodic discharge, and the PID control was based on the control mode of the following cathode pressure. By automatically adjusting the PWM duty cycle’s signal, the opening of the valve of the injector was adjusted to form a closed-loop control and control the pressure of the intake manifold.
The outlet valve set the periodic discharge time as 15 s per cycle, and the discharge started from 14.55 s, and the duration of each discharge was 0.45 s. With the strategy without PID control, the injector replenished the flow immediately after the outlet valve was closed according to the outlet valve signal, and the replenishment time was also 0.45 s and the supplementary signal was obtained according to the outlet valve signal:
The discharge signal was delayed by 0.45 s and input into the injector. After discharge, the PWM signal of the injector was as follows:
With the strategy of PID control, the pressure of the intake manifold was monitored through the pressure sensor. The difference between the target pressure of the intake manifold and the actual pressure was input to the PID controller to form a closed-loop control to adjust the pressure.
2.7. Model Validation
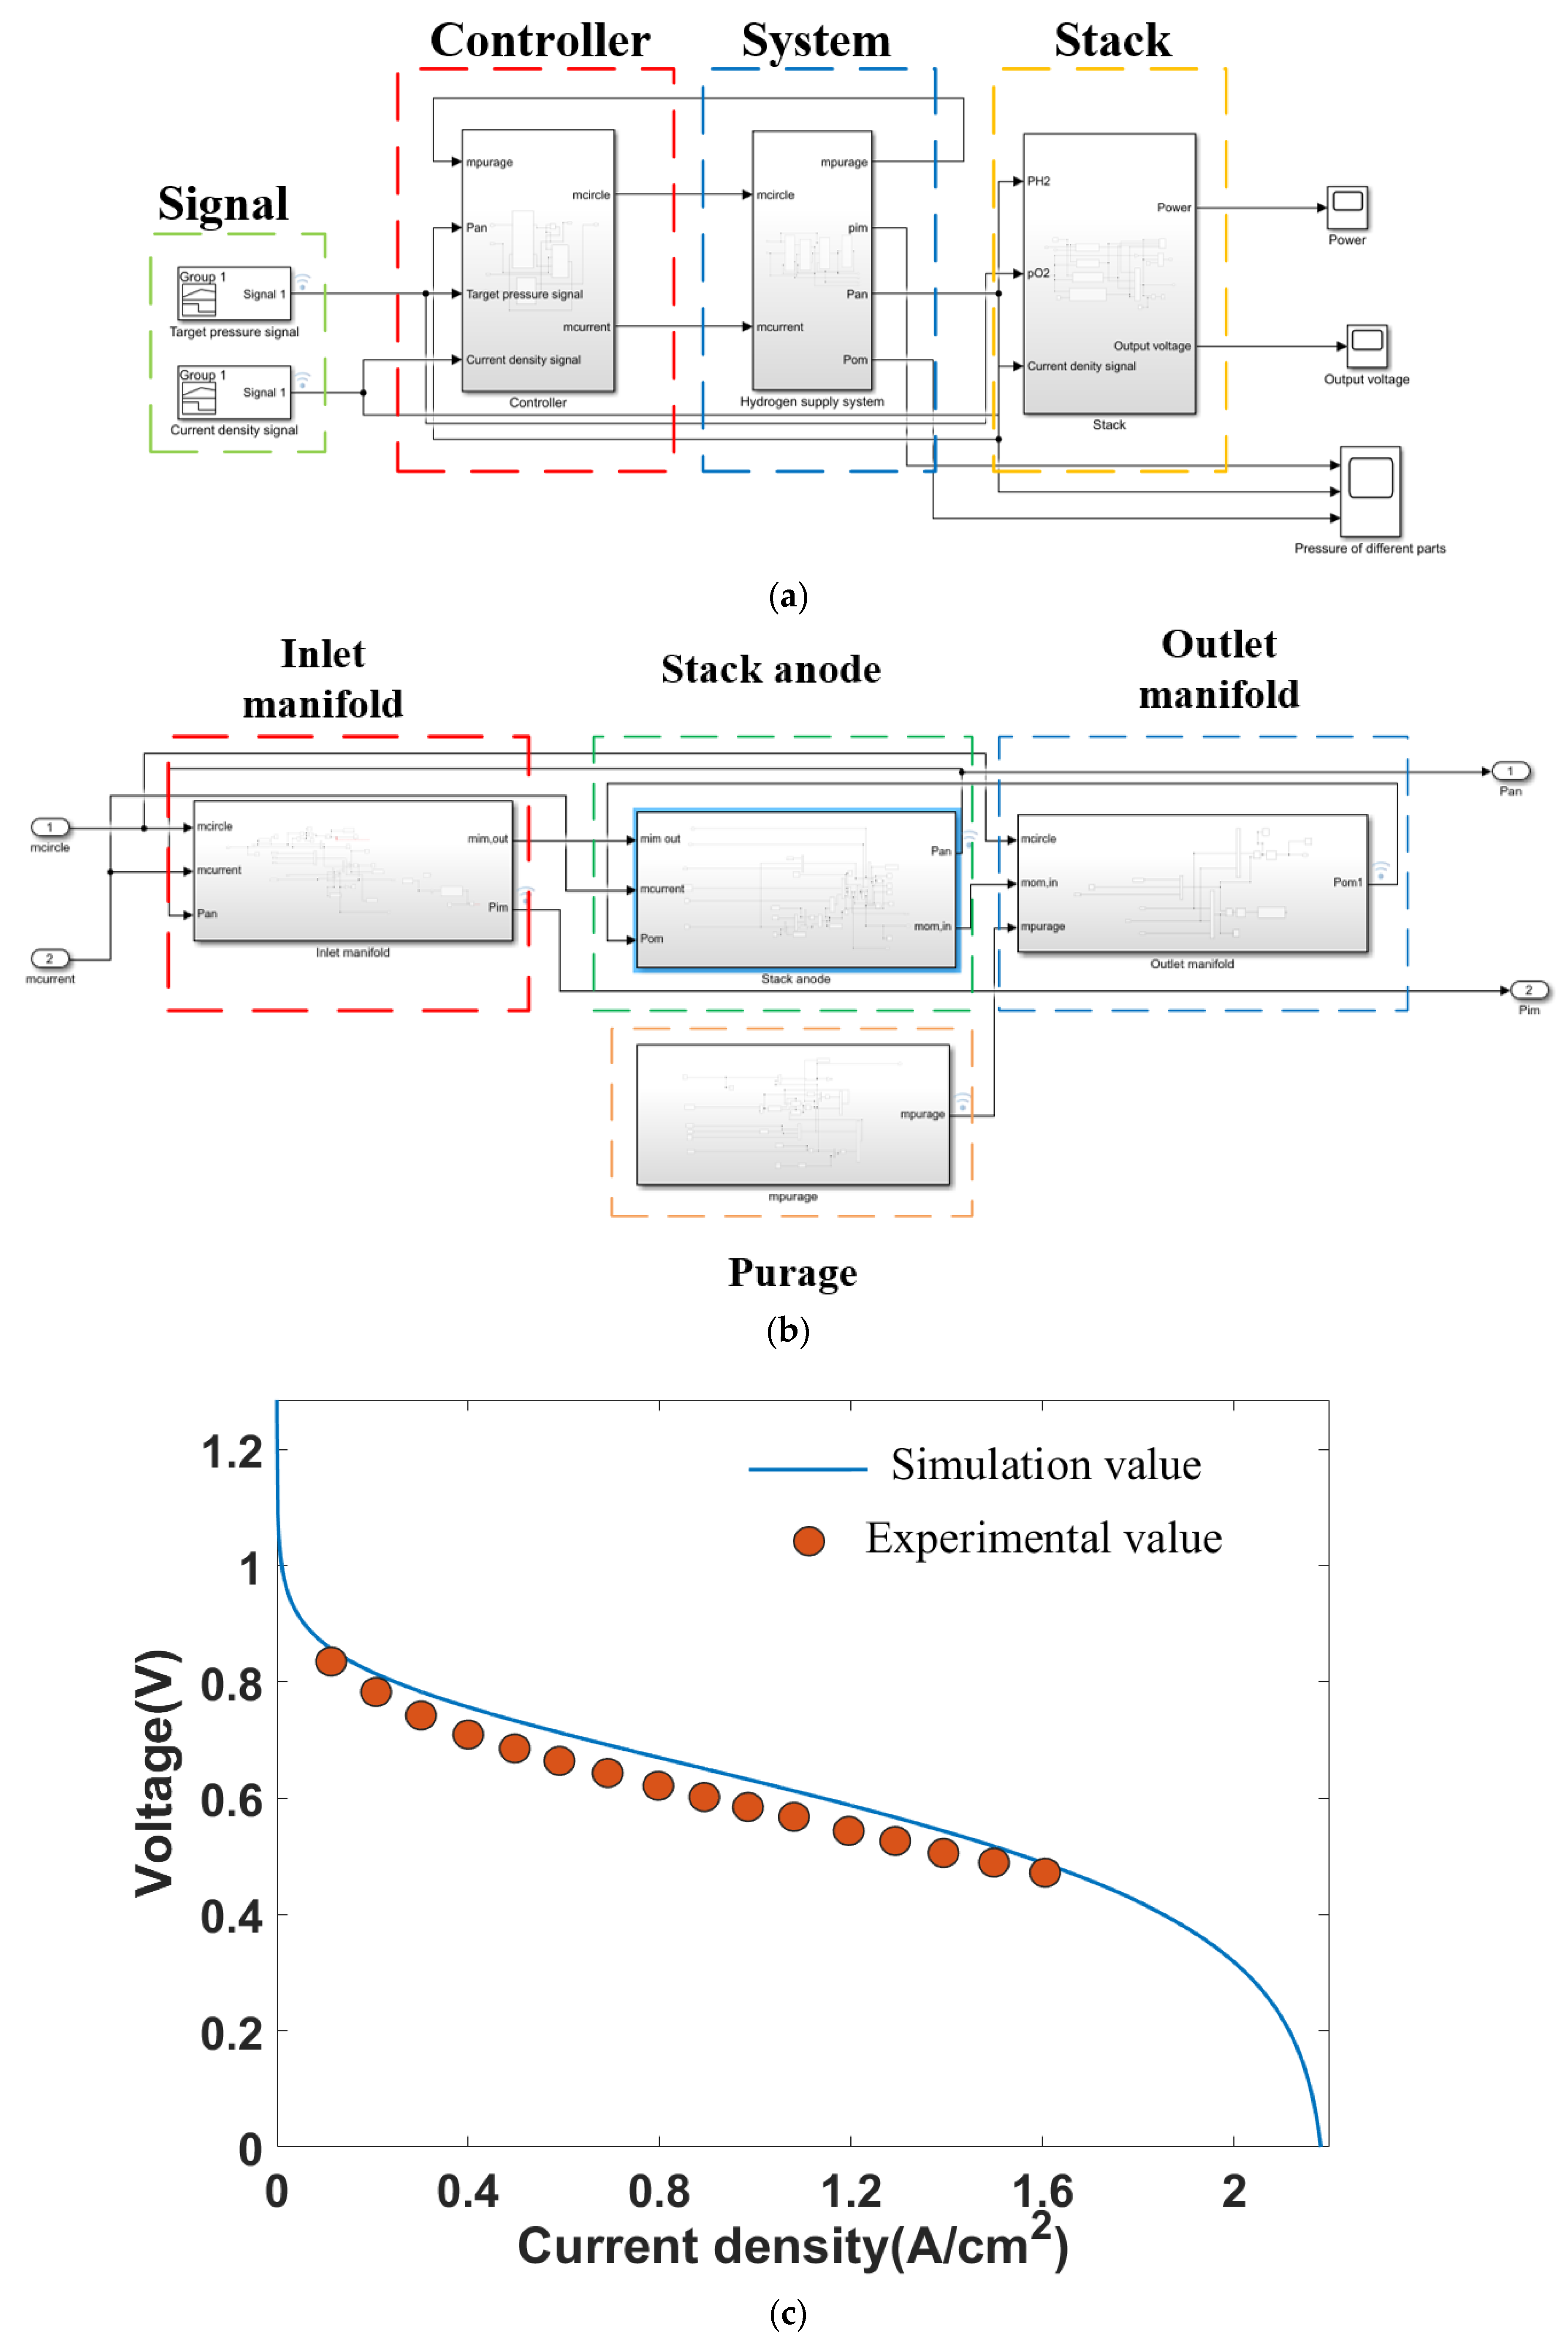
The simulation model and simulation verification of the whole system are shown in Figure 2.
In the Figure 2a, the whole fuel cell hydrogen system model was mainly composed of controller, hydrogen system, and fuel cell stack. The hydrogen system model was connected in series with the fuel cell stack model [32]. In Figure 2b, the hydrogen supply pressure model was mainly composed of the intake manifold model, the anode pressure model, the outlet manifold model, and the purage model; they were connected in series with each other and output the pressure parameters to the stack model. In order to verify the accuracy of the modeling, the simulated polarization curve was compared with the experimental data of a 60 kW fuel cell system developed by our research group. The fuel cell stack contained 300 units of cells with an active area of 300 cm2. During the experiment, the anode hydrogen with stoichiometric ratio of 1.5 was not humidified, and the unreacted hydrogen entered the stack again via the hydrogen-circulating pump. During operation, the anode outlet valve was opened every 15 s for 0.45 s. The cathode air with stoichiometric ratio of 2 was humidified by the cathode outlet tail gas. As shown in Figure 2c, it could be seen that the polarization curve of the experimental process was lower than the simulated value because the single cell was affected by various factors, such as materials and clamping, during the experimental process, which made the resistance of the single cell larger during the experimental process. The simulation value of the output voltage was 0.752 V, while the experimental value was 0.745 V at a current density of 0.4 A/cm2, and the error value was 0.9%. The simulation value of the output voltage was 0.595 V, while the experimental value was 0.579 V at a current density of 1.2 A/cm2, and the error value was 2.69%. The simulation voltages and experimental results were in good agreement with an error less than 3%, which indicated that the developed model was accurate and effective.
3. Results and Discussion
3.1. Pressure Dynamic Response Characteristics
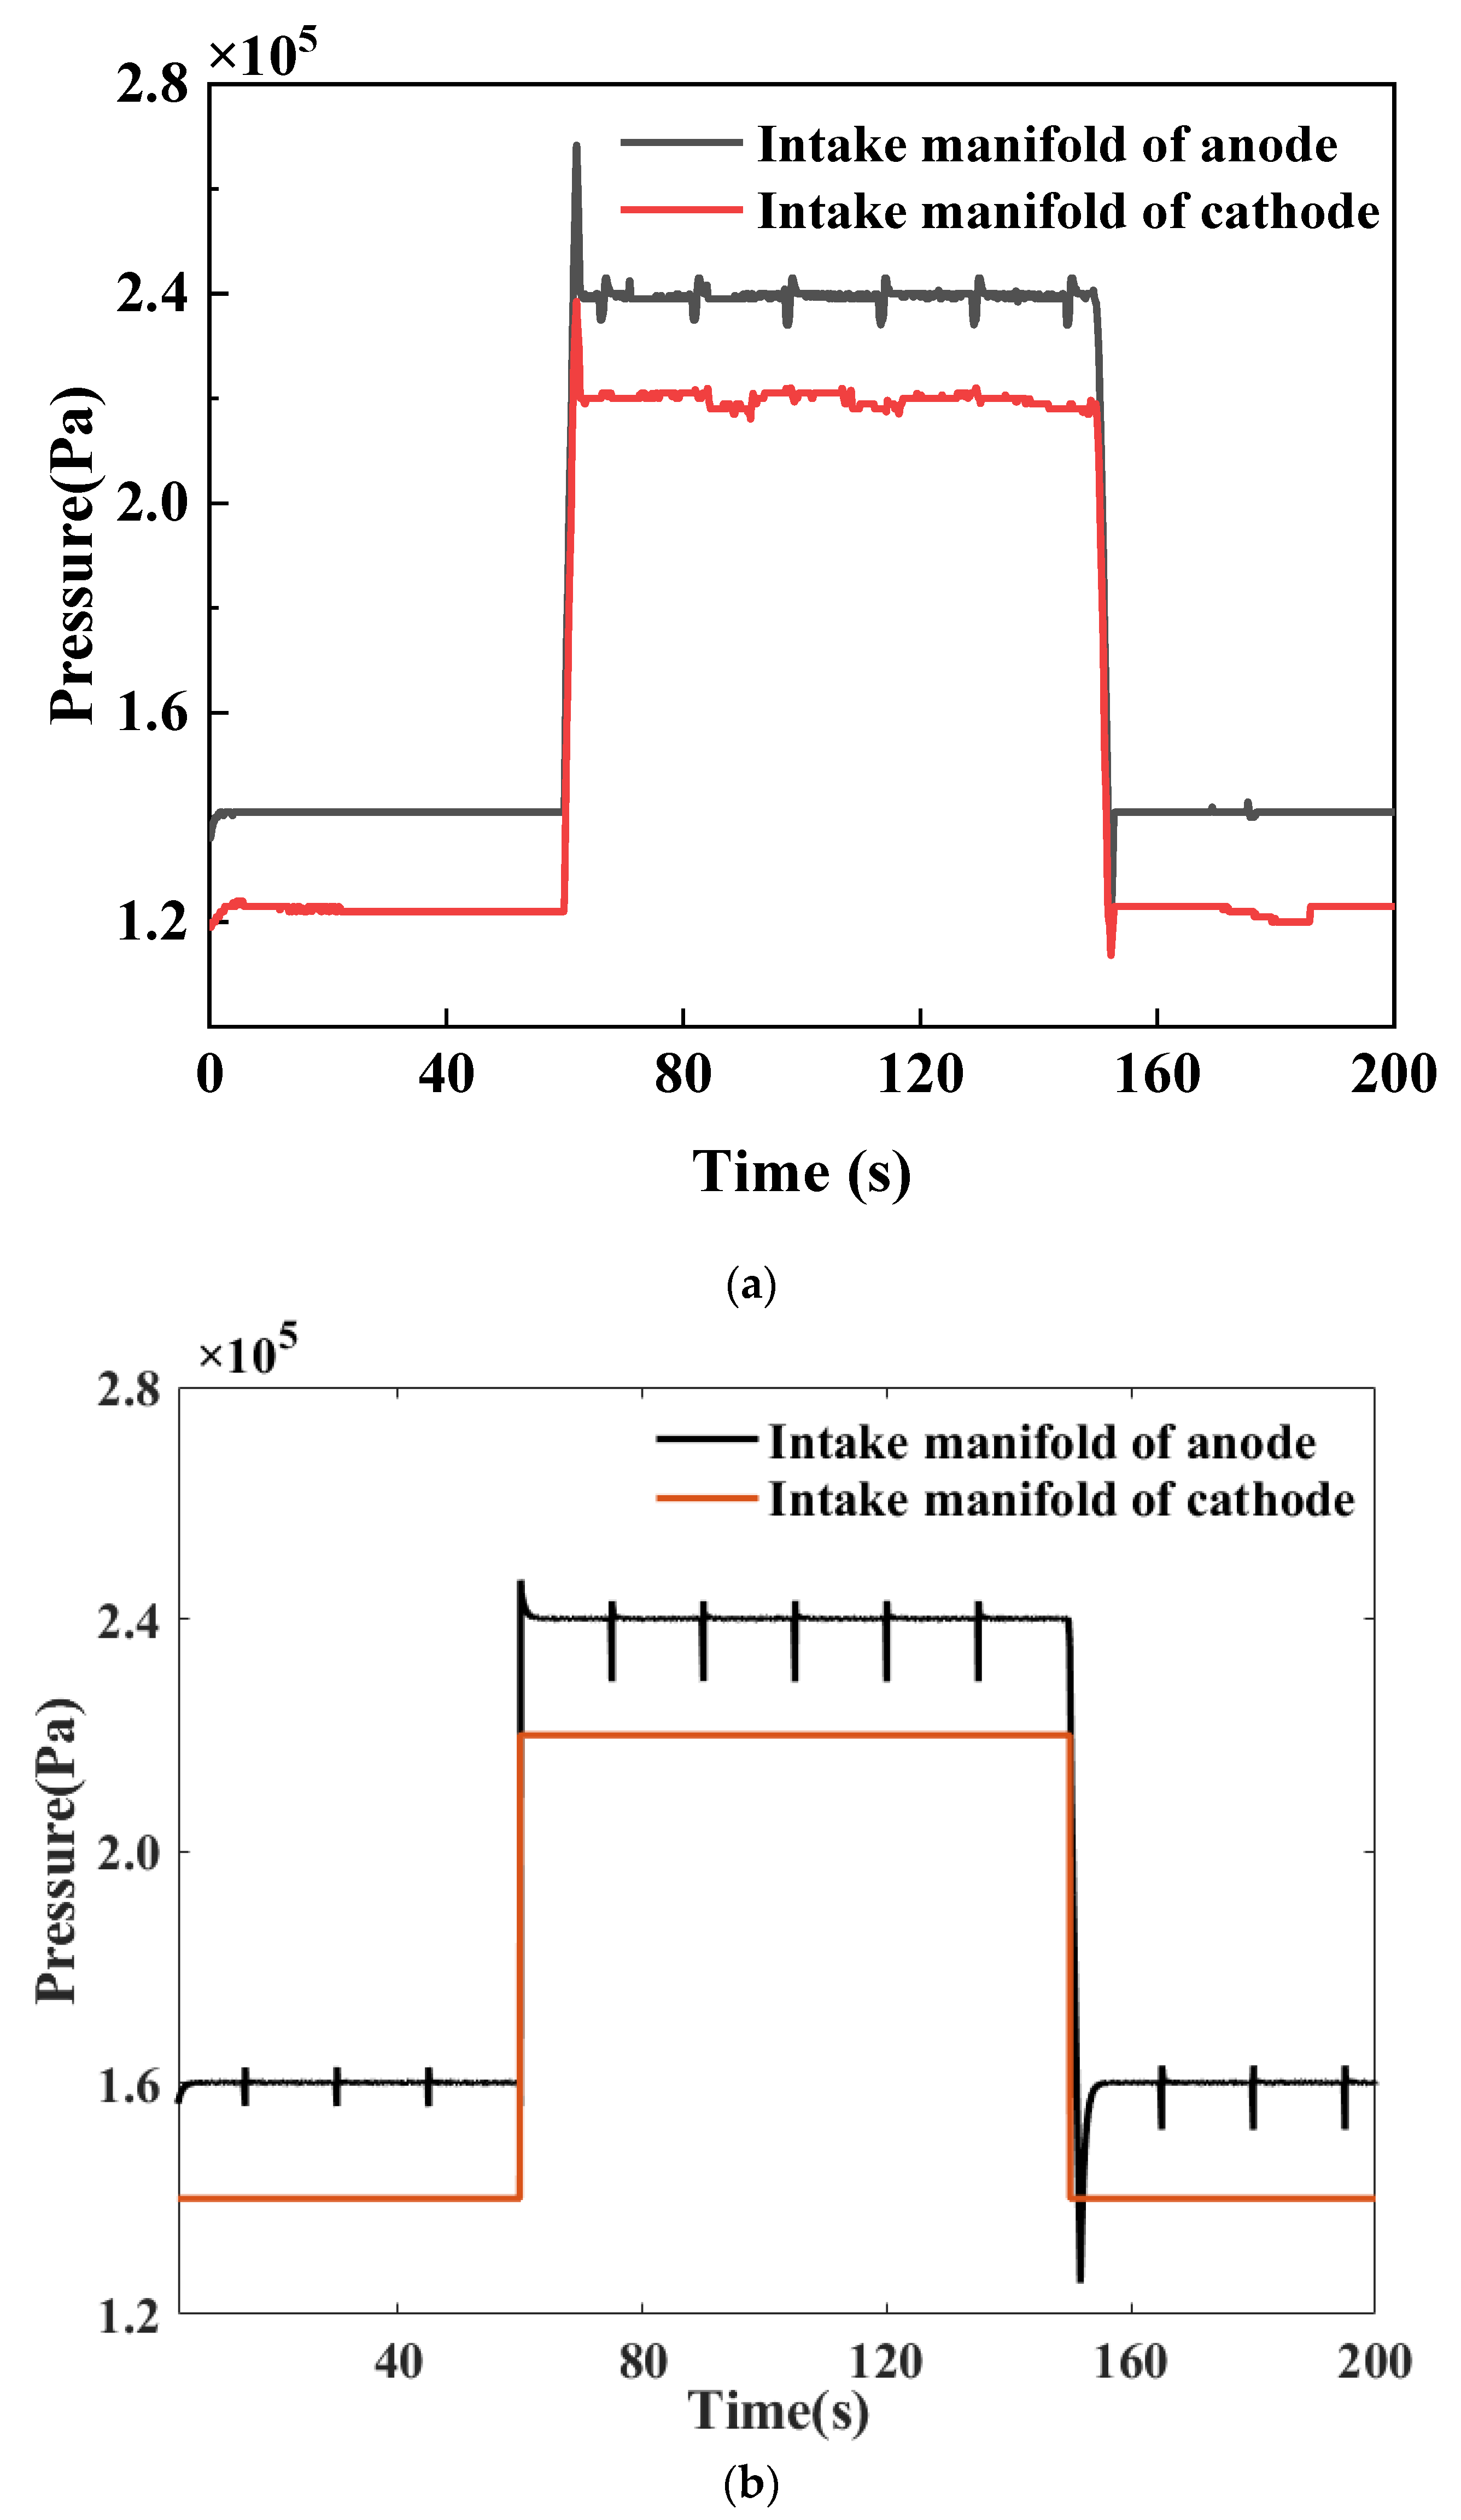
Figure 3a shows the pressure variation of anode and cathode during variable load operation from 0.6 A/cm2 to 1.6 A/cm2. Similarly, Figure 3b shows the pressure variation curve according to the load-up and load-down processes. Both the pressure of the cathode and anode increased with the increase in current density during the loading process. When loading from low current to high current, overshoot occurred in both the anode and cathode, and it recovered quickly in a short time.
It was observed from the experimental data that the cathode pressure fluctuated irregularly in a small range due to the influence of the gas frequency and the high-frequency injection of the injector, while the anode fluctuated regularly in a range due to periodic discharge. The difference between the maximum pressure and the minimum pressure during the discharge process was 8 kPa. From Figure 3b, the accuracy of the model was verified by comparing the simulation changes with the experimental changes.
3.2. Comparison of Control Strategies
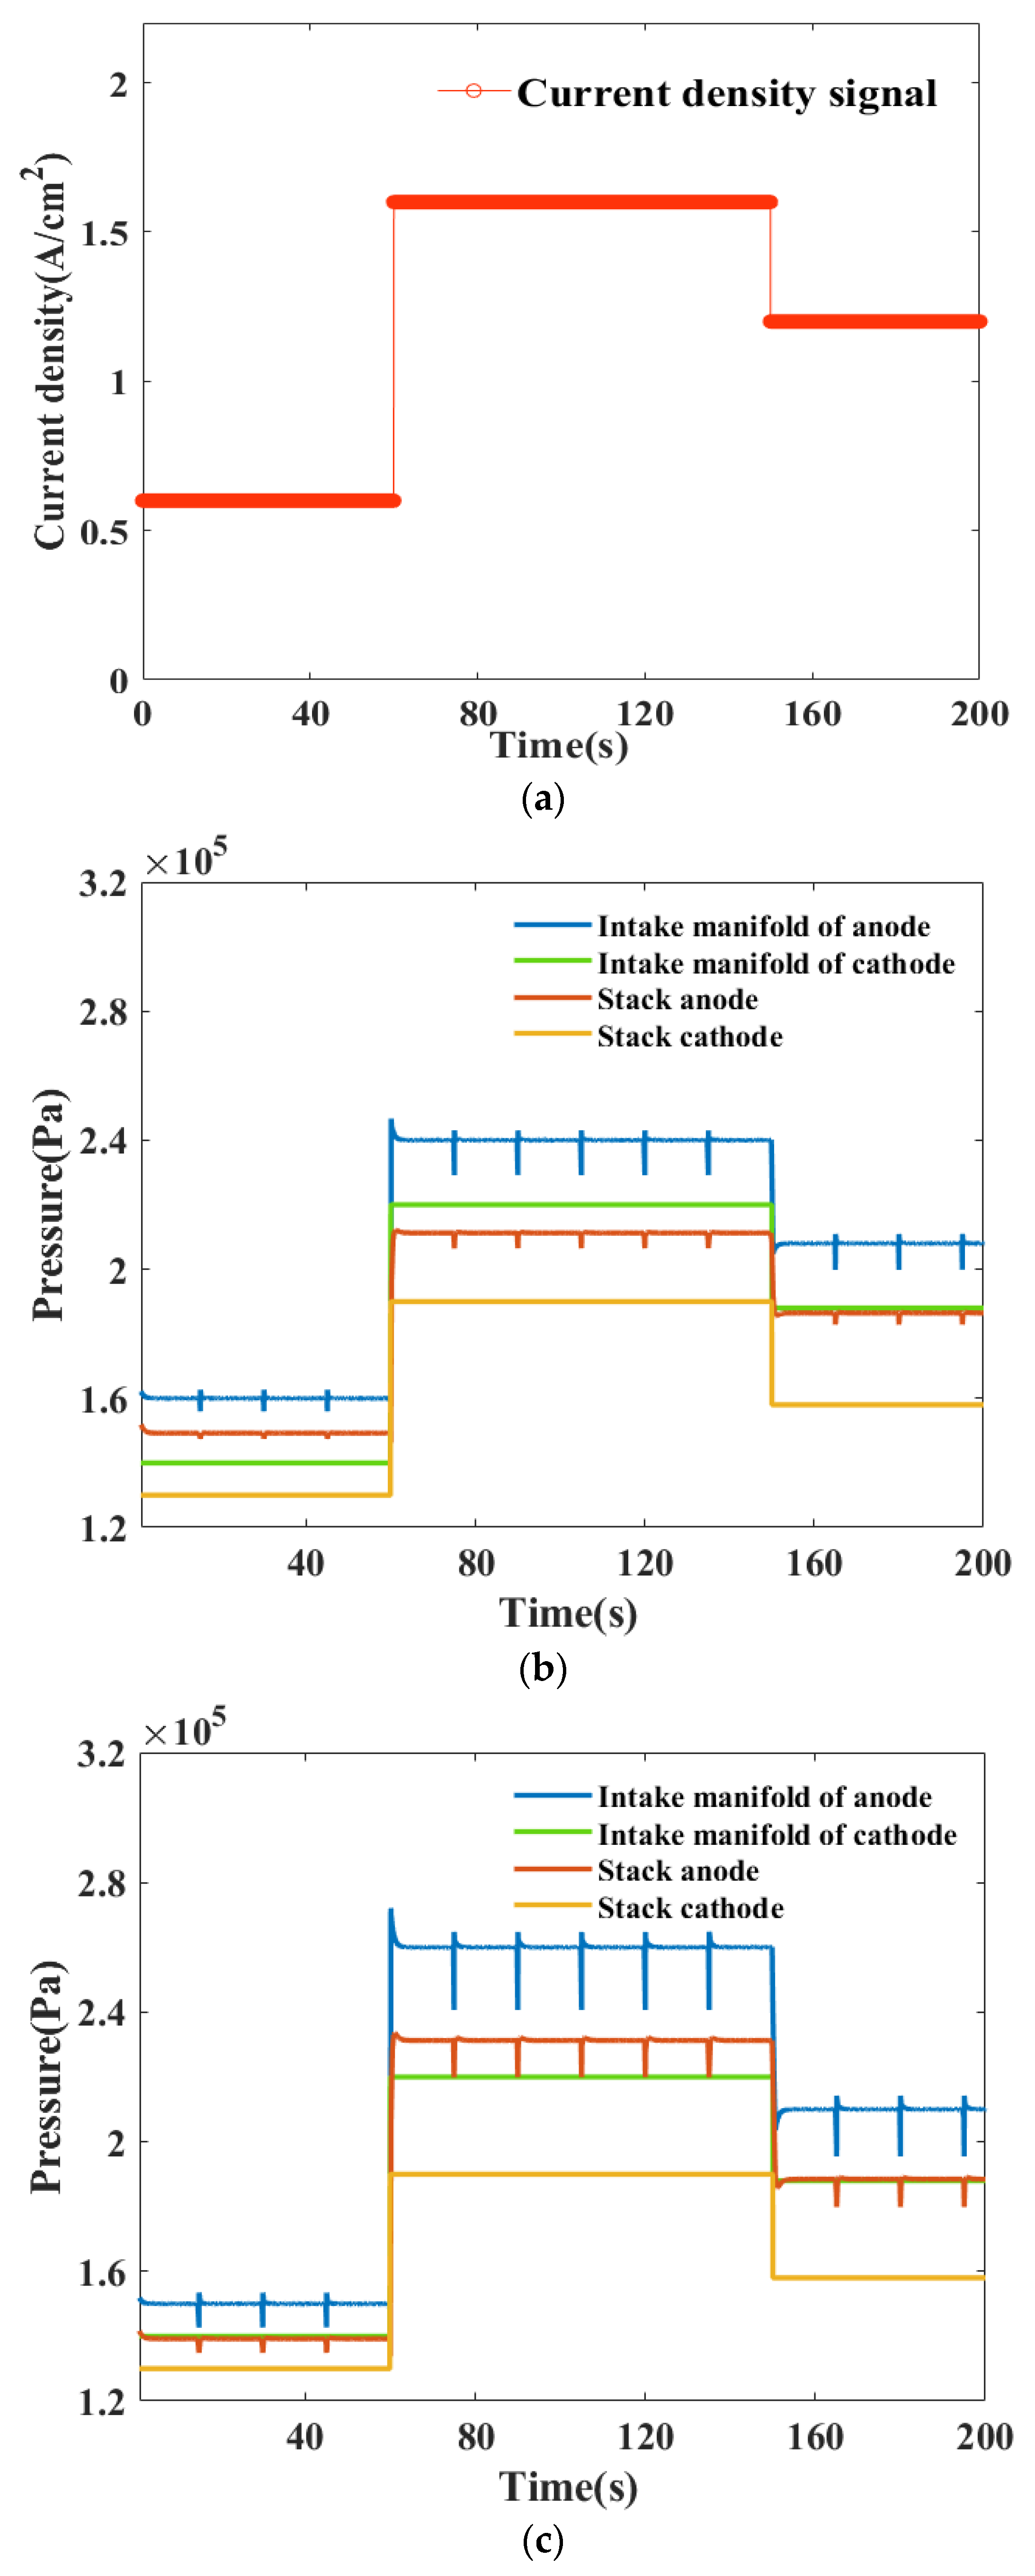
Figure 4a shows the set variable load conditions. The stack operated for 60 s at 0.6 A/cm2, then switched to 1.6 A/cm2 for 90 s, and then switched to 1.2 A/cm2 for 50 s. The pressure changes of the intake manifold and anode based on the PID cathode pressure following mode and non-PID mode were obtained, as shown in Figure 4b,c.
Based on the PID cathode pressure following mode, the intake manifold of anode pressure was set to be fixed greater than the intake manifold of cathode pressure by 20 kPa. According to the figure, in the process of load change, the anode achieved the pressure under the PID control, and it was precisely 20 KPa higher than the cathode pressure. In the case of non-PID control, with the change in current density, the general change trend of the anode pressure curve was consistent with that of the cathode pressure. Under different current densities pressure accumulation occurred and part of the pressure was removed, resulting in pressure that fluctuated more violently during anode discharge. By comparison, the pressure fluctuation of the anode under non-PID control was around 5 kPa, while under PID control was only 0.5 kPa at a current density of 0.6 A/cm2. The pressure fluctuation of the anode under non-PID control was around 10 kPa, while under PID control it was 2 kPa at a current density of 1.2 A/cm2. The pressure fluctuation of the anode under non-PID control was around 15 kPa, while under PID control it was 3 kPa at a current density of 1.6 A/cm2. The non-PID mode produced more severe mechanical damage to the MEA during anode discharge, but its pressure change was within the ideal control range.
3.3. Output Performance
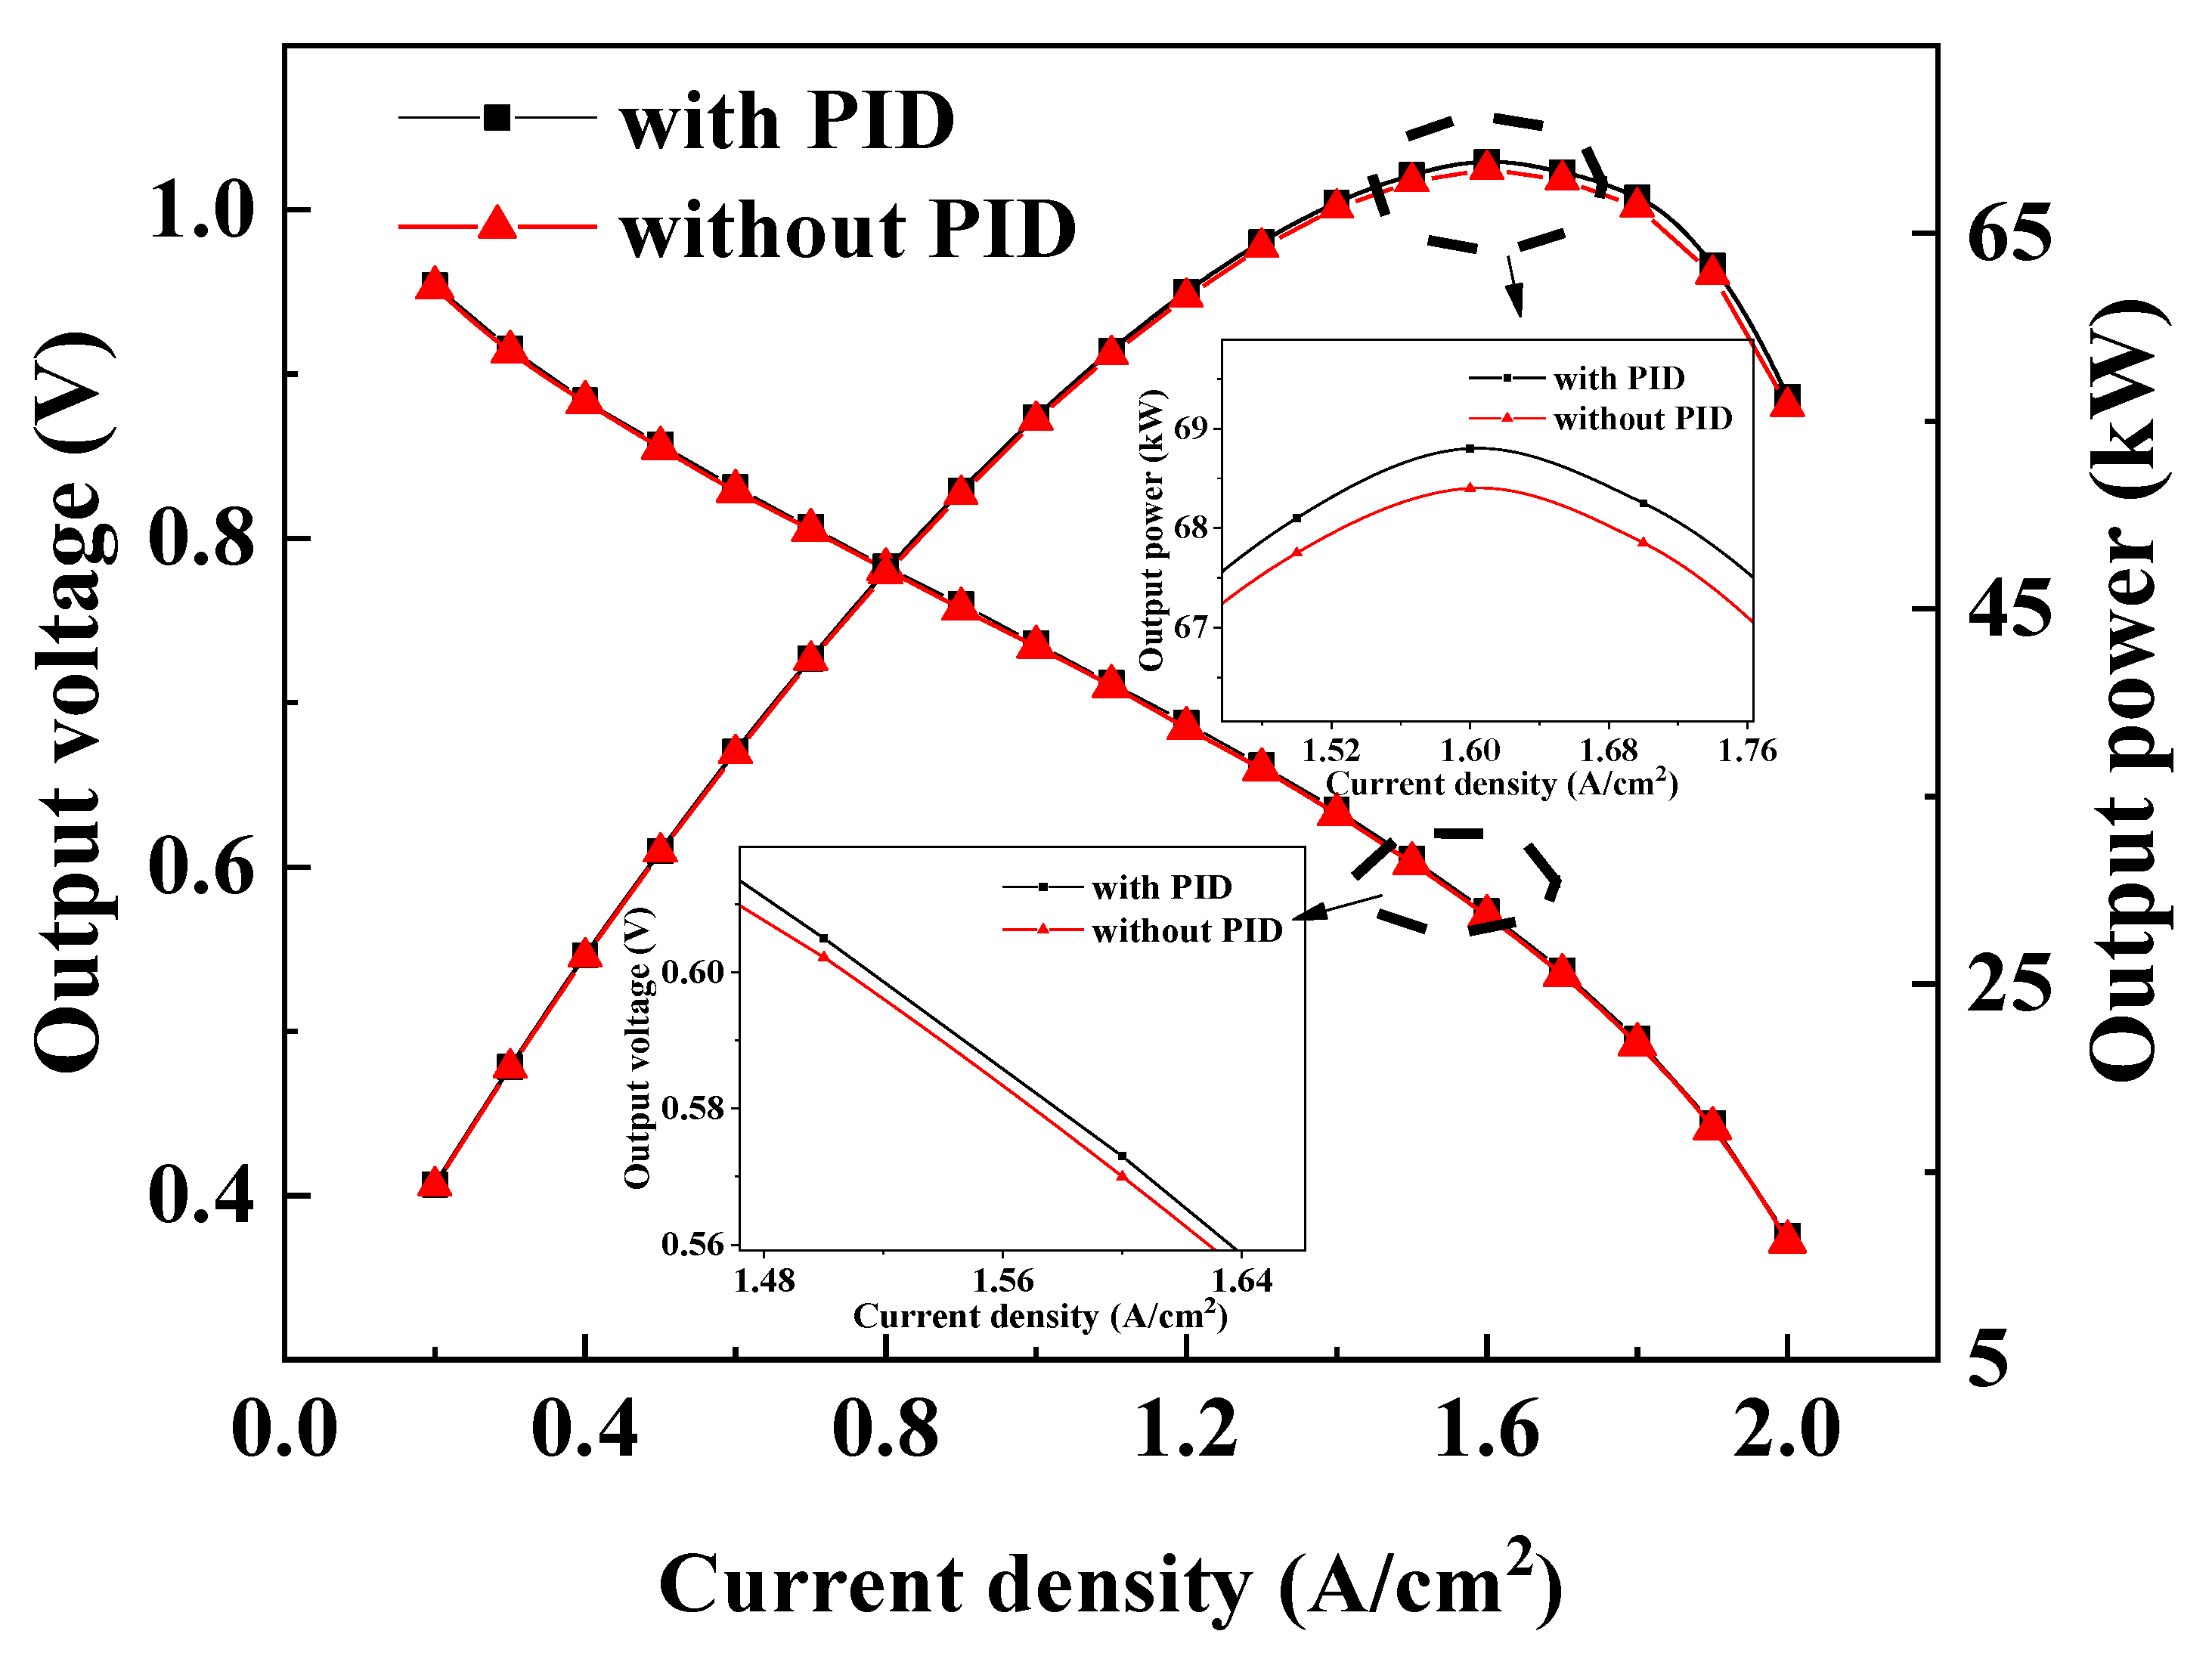
Based on the comparison of the output performance under the two control modes, the variation curves of output voltage and power under the two modes are obtained as Figure 5. With the increase in current density, the energy voltage of the PID control model was slightly higher than that of the non-PID control model, and the output voltage was almost indistinguishable between the two modes. The relationship between output power and single cell voltage was obtained. The maximum power in the non-PID mode was 68.47 kW at a current density of 1.6 A/cm2, while the maximum power in the PID mode was a little higher, up to 68.8 kW.
3.4. Hydrogen Utilization
Based on the fact that the fuel cell output performance had little influence, the hydrogen utilization rate and the stability of pressure on both sides of the MEA membrane were mainly analyzed. The hydrogen utilization rate under stable conditions could be calculated as follows,
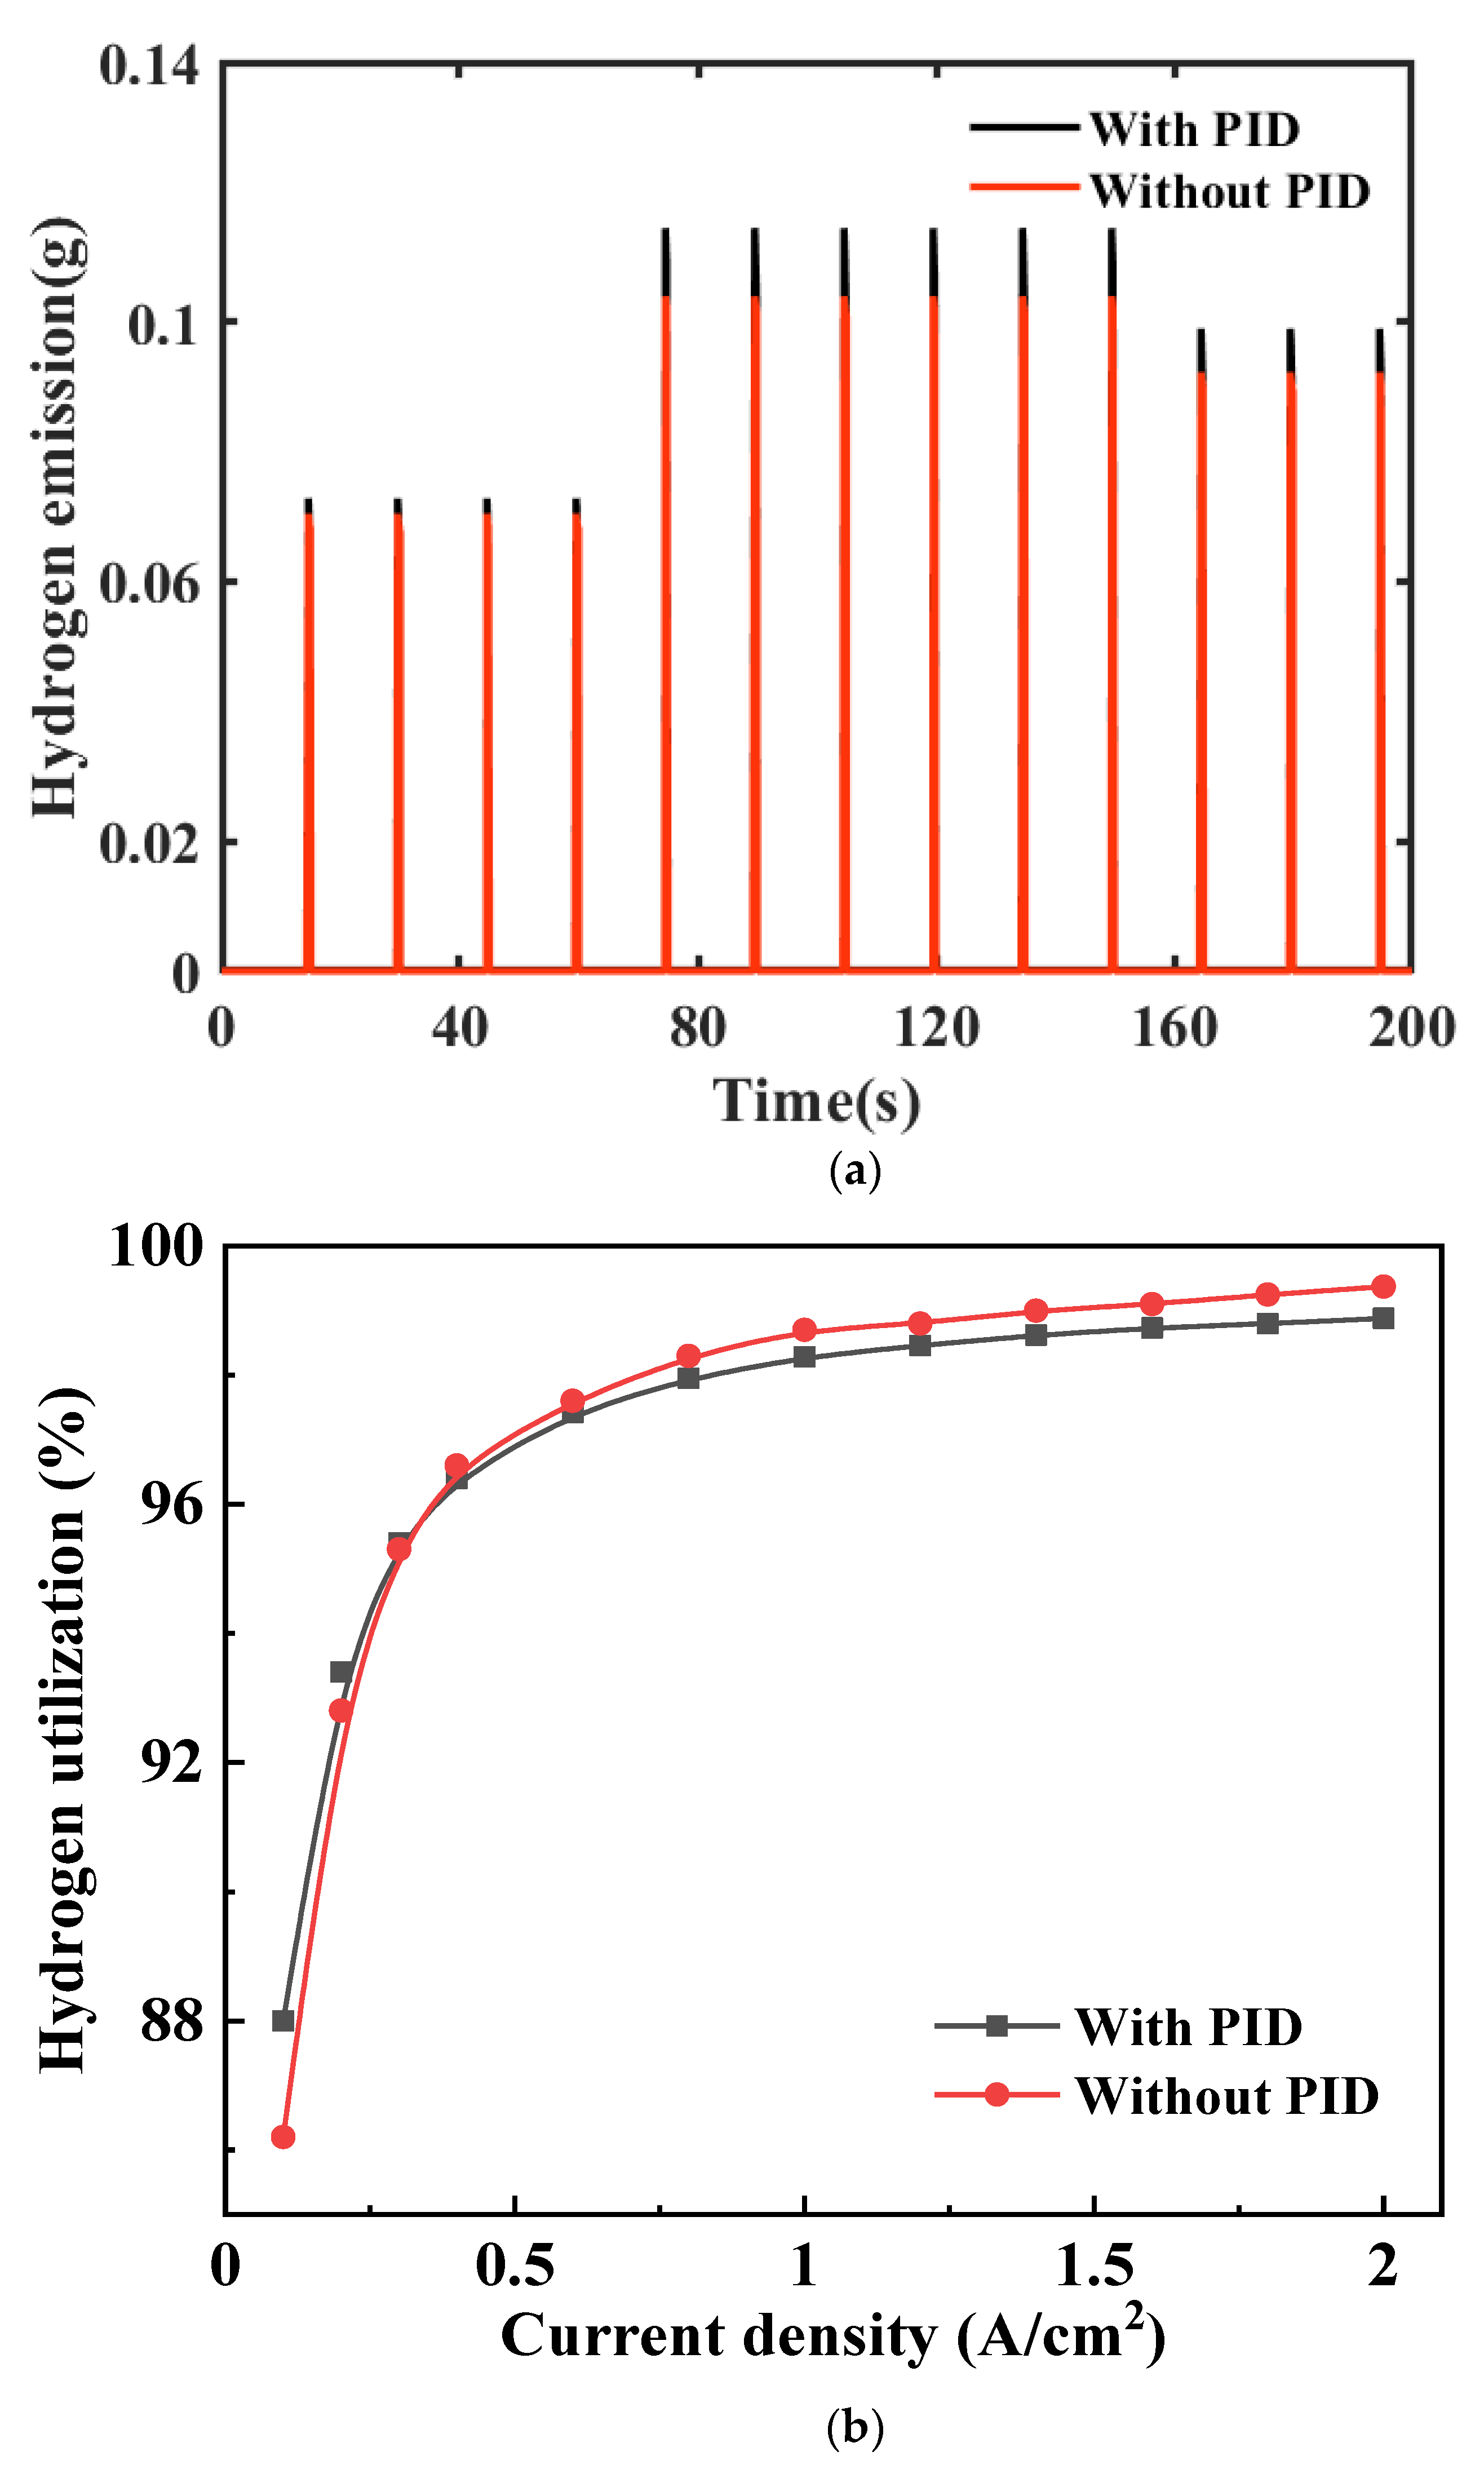
The hydrogen emission quality in the two modes and the hydrogen utilization rate under different current densities are shown in Figure 6a,b, as follows:
It could be seen from Figure 6a that in the anode discharge process, the hydrogen emission under the PID control mode was higher than that of the non-PID control mode, what is more, the gap between them increased with the increase in current density, such as at 1.2 A/cm2 and at 1.6 A/cm2. From Figure 6b, under the two control modes, the two hydrogen utilization rates both increased with the increase in current density, but the increase range slowed down gradually. There was an inflection point for hydrogen utilization, and the hydrogen utilization rate was higher under the PID control mode when the current density was lower than 0.4 A/cm2. The hydrogen utilization rate was 93.4% under PID control, while it was 92.8% under non-PID control at a current density of 0.2 A/cm2. The hydrogen utilization rate under the non-PID control mode was higher with a current density greater than 0.4 A/cm2. There was a hydrogen utilization rate of 98.73% under PID control, while it was 99.1% under non-PID control at a current density of 1.6 A/cm2. In addition, the hydrogen utilization rate was 98.88% under PID control, while it was 99.37% under non-PID control at a current density of 2 A/cm2. With the increase in current density, compared with the PID control mode, the hydrogen utilization of the non-PID control mode increased gradually. In a wide range of high current density, the hydrogen utilization rate under non-PID control was about 0.4–0.5% higher than that under PID control. Compared with the non-PID control mode, in the PID mode, the fluctuation of the pressure at the moment of triggering the anode outlet valve was relatively small, leading to a larger pressure difference between the anode and the atmosphere, resulting in a larger amount of hydrogen emissions.
3.5. Control Strategy Optimization
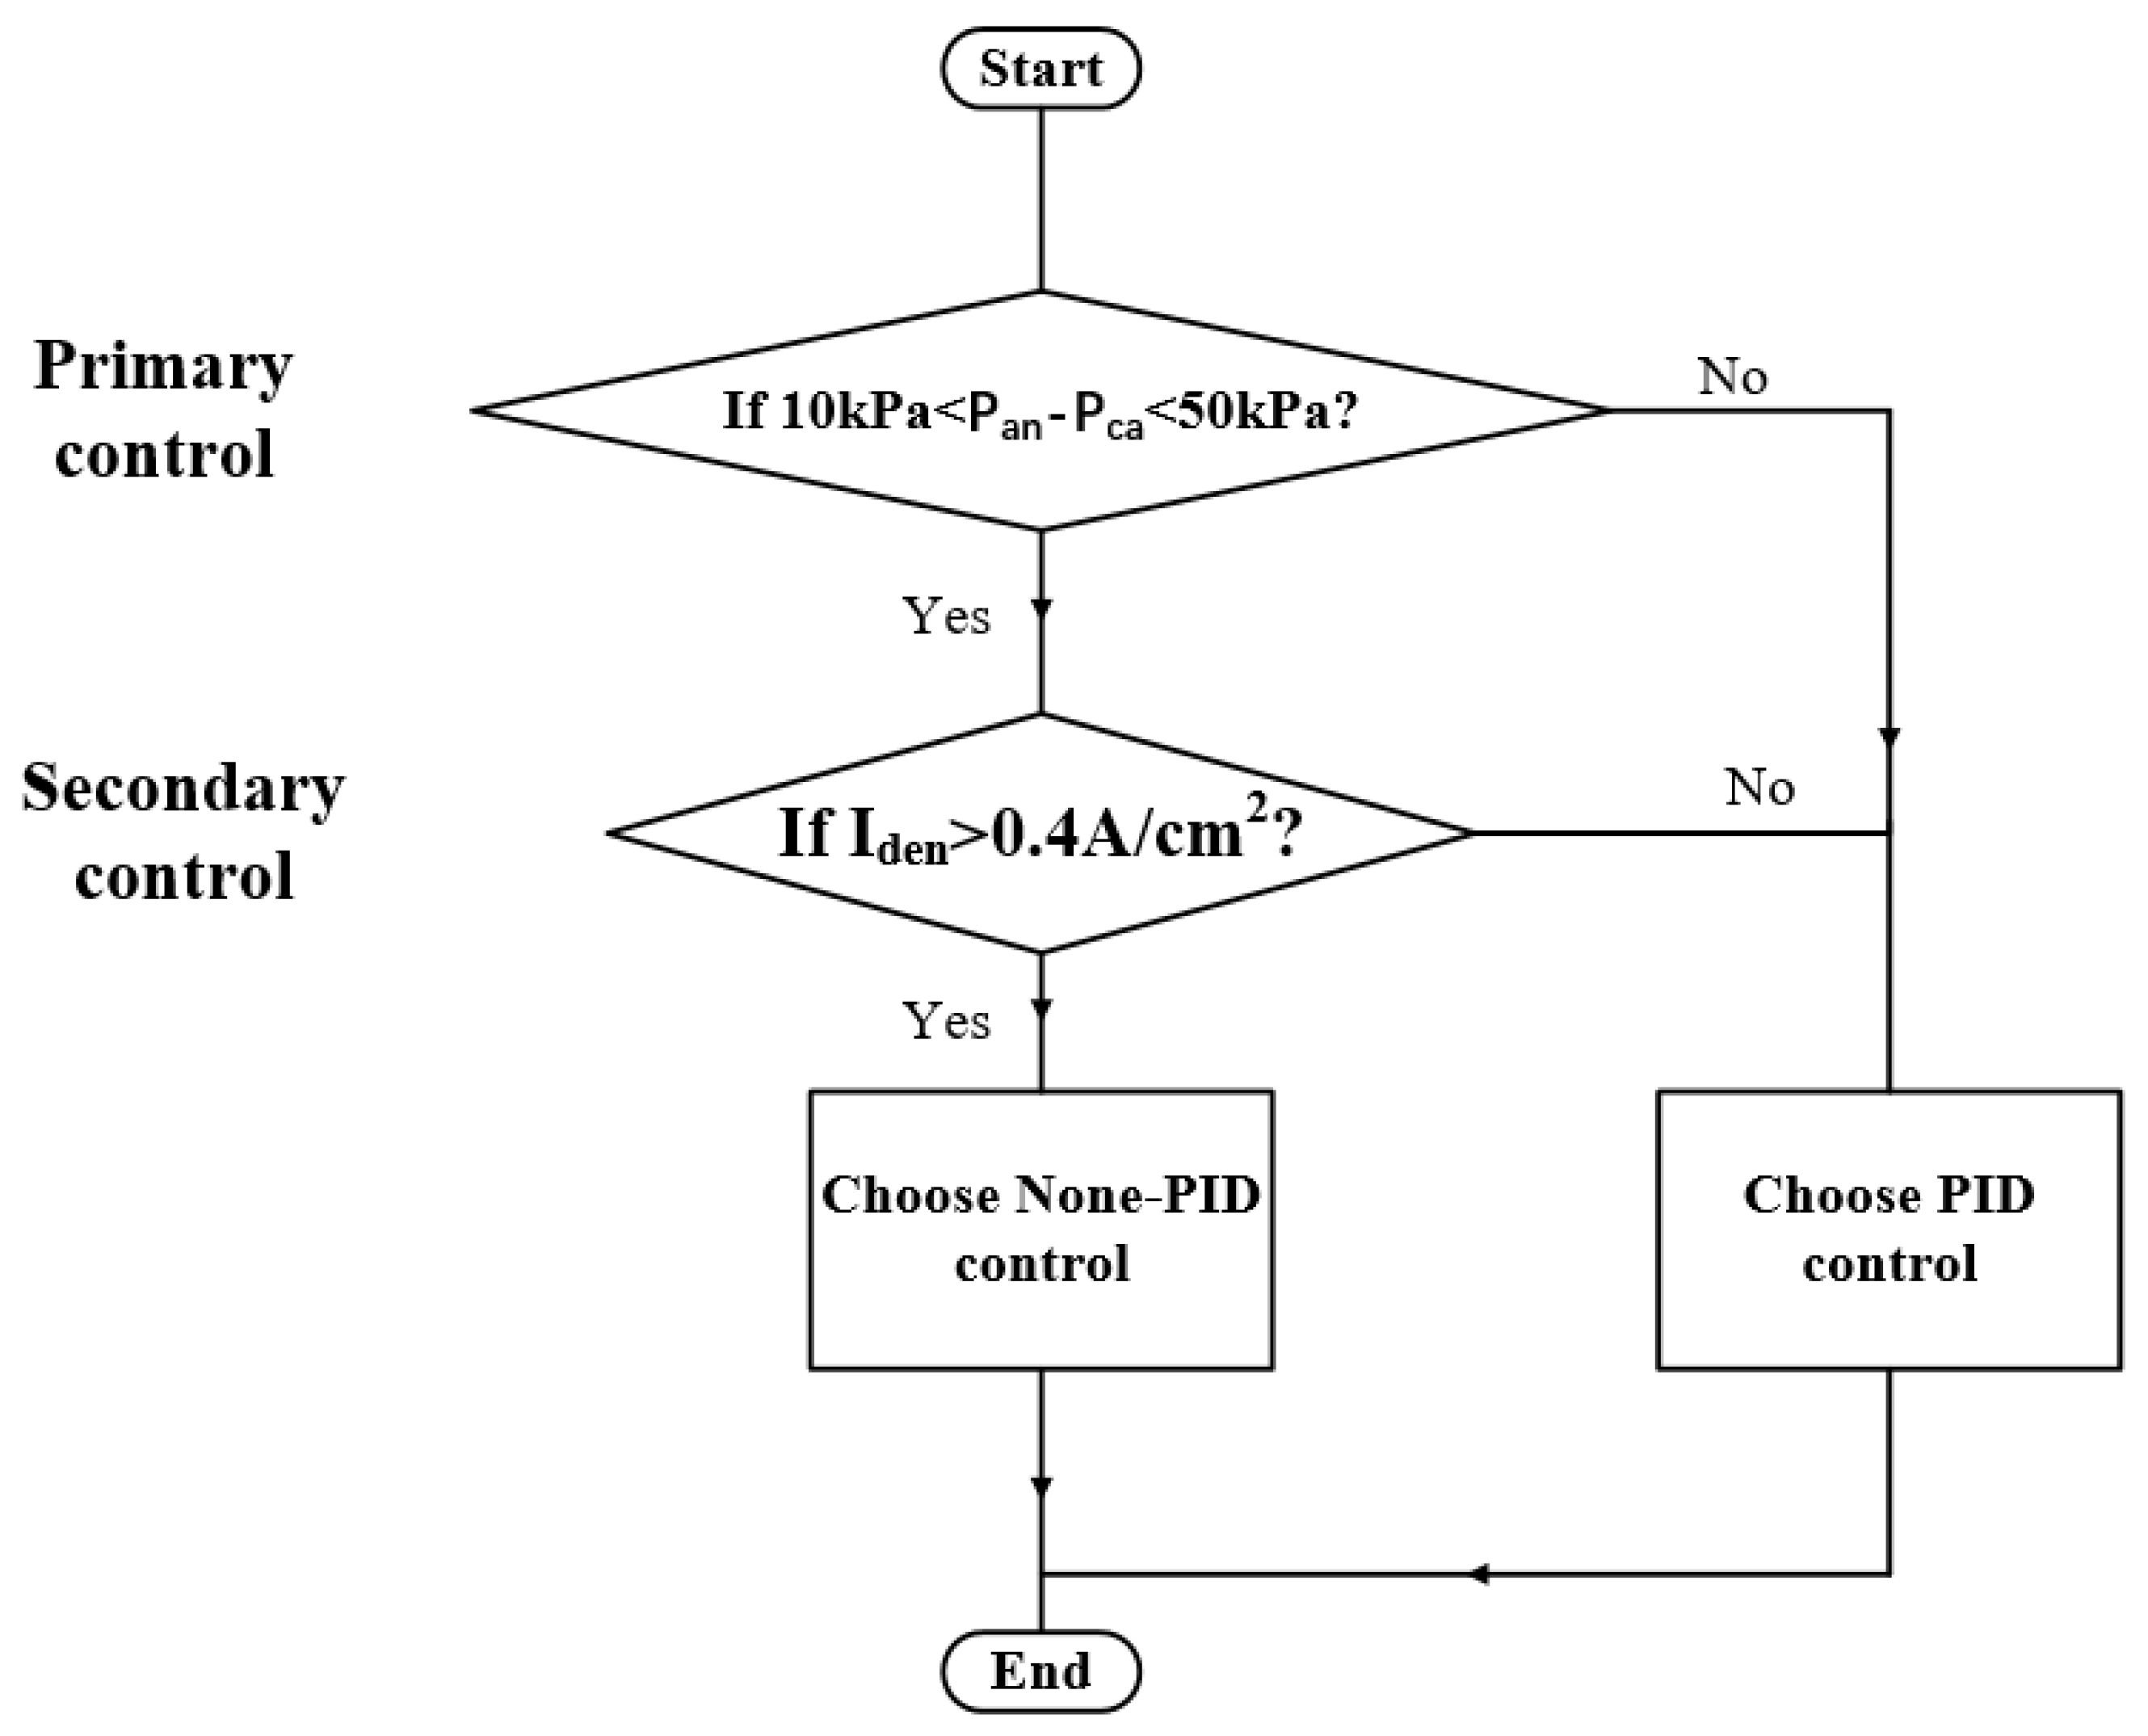
Through the comparison of hydrogen utilization under the two modes, under the condition of low power demand or idle speed, the hydrogen utilization under PID control was higher, and under the condition of medium and higher power demand, the hydrogen utilization under non-PID control was higher. Considering that there was almost no difference in the output performance between the two control modes, and the pressure on both sides of the membrane could meet the requirements, high hydrogen utilization was a better choice. The optimization of the control strategy was made as follows (Figure 7):
The control policies adopted hierarchical control. The primary control mode mainly monitored whether the pressure difference between the anode and cathode was within the threshold. If it exceeded the pressure threshold, PID control intervened to reduce the mechanical damage to the MEA caused by the pressure difference exceeding the threshold. If it did not exceed the threshold, the current density was judged and secondary control was adopted. If the current density was greater than 0.4 A/cm2, non-PID control could maintain a high hydrogen utilization rate. On the contrary, PID control could also maintain a high hydrogen utilization rate under low current densities and idling conditions.
4. Conclusions
In this paper, the anode pressure characteristics were obtained, which could not be monitored during the experiment by establishing a mathematical model of the hydrogen system. Two pressure control strategies were proposed, the pressure characteristics, output performance, and hydrogen utilization rate were compared under the two control strategies by a simulation approach. The results showed the following:
- (1)
- The mathematical model of the hydrogen system was established and connected in series with the fuel cell model. The accuracy of the model was verified by comparing the simulation results with the experimental results.
- (2)
- The hydrogen system under PID control could follow the cathode pressure accurately, and the anode pressure fluctuation was significantly smaller than that of the non-PID control during discharge. The pressure difference between the cathode and anode under non-PID control changed with the change in load, and the pressure difference between the cathode and anode was larger at higher current densities.
- (3)
- The output performance under PID control was better in all current density ranges, while the hydrogen utilization rate under PID control was lower than that under non-PID control at a current density higher than 0.4 A/cm2.
- (4)
- Combining the advantages and disadvantages of the two control strategies, an optimized control strategy was formulated. In the case of preferentially satisfying the pressure difference on both sides of the MEA, and then satisfying the hydrogen system to maintain a high hydrogen utilization rate.
The novelty of this paper was in the analysis of the stack anode pressure characteristics and hydrogen utilization in different current densities under PID and non-PID control. Based on this, a mode of switching strategy was proposed that could not only meet the single cell’s durability, but also ensure the system maintained a high hydrogen utilization rate, which could provide effective guidance for the practical application of vehicle fuel cells.
Author Contributions
Conceptualization, B.C. and W.C.; methodology, W.C.; software, W.C. and Y.L.; validation, W.C. and B.C.; formal analysis, W.C.; investigation, B.C.; resources, B.C.; writing—original draft preparation, W.C. and Y.L.; writing—review and editing, B.C.; funding acquisition, B.C. All authors have read and agreed to the published version of the manuscript.
Funding
This research and the APC were funded by National Natural Science Foundation of China, grant number (52176200), and Foshan Xianhu Laboratory of the Advanced Energy Science and Technology Guangdong Laboratory, grant number (XHD 2020-003).
Institutional Review Board Statement
Not applicable.
Informed Consent Statement
Not applicable.
Data Availability Statement
Not applicable.
Conflicts of Interest
The authors declare no conflict of interest.
Abbreviation
| PEMFC | Proton exchange membrane fuel cell |
| PID | Proportion integration differentiation |
| PWM | Pulse width modulation |
| MEA | Membrane electrode assembly |
Nomenclature
| Output voltage, V | |
| Nernst potential, V | |
| Activation overpotential, V | |
| Ohmic overpotential, V | |
| Concentration overpotential, V | |
| Theoretical electromotive force, V | |
| R | Gas constant |
| Temperature, K | |
| Faraday constant | |
| Partial pressure of hydrogen in stack anode, Pa | |
| Partial pressure of oxygen in stack cathode, Pa | |
| Partial pressure of vapour in stack cathode, Pa | |
| Concentration of oxygen in stack anode, mol·L−1 | |
| Load current, A | |
| Ohmic overpotential of electron transport resistance, V | |
| Ohmic overpotential of proton transport resistance, V | |
| Electron transport resistance, mΩ | |
| Proton transport resistance, mΩ | |
| Membrane resistivity | |
| Thickness of proton exchange membrane, mm | |
| Active area of cell, cm2 | |
| Temperature of stack anode, K | |
| Water content of the membrane | |
| Empirical constant of concentration overpotential | |
| Current density, A/cm2 | |
| Maximum current density, A/cm2 | |
| Constant related to the hydrogen | |
| Pressure of front valve, Pa | |
| Pressure of front valve, Pa | |
| Flow rate of valve, g/s | |
| Flow coefficient of valve | |
| Flow area of purge valve, m2 | |
| Diameter of the valve, m | |
| Opening of proportional valve | |
| Pressure of intake manifold, Pa | |
| Pressure of stack anode, Pa | |
| Pressure of saturated vapor pressure, Pa | |
| Pressure of outlet manifold, Pa | |
| Volume of intake manifold, m3 | |
| Volume of stack anode, m3 | |
| Volume of outlet manifold, m3 | |
| Flow rate of hydrogen from the ejector to intake manifold, g/s | |
| Flow rate of hydrogen from the intake manifold to stack, g/s | |
| Flow rate of circulation hydrogen, g/s | |
| Flow rate meets power requirements, g/s | |
| Equivalent flow coefficient between intake manifold and stack anode | |
| Equivalent flow coefficient between stack anode and the outlet manifold | |
| Initial stoichiometric ratio of hydrogen | |
| Initial pressure of stack anode, Pa | |
| Pressure of stack anode, Pa | |
| Molar mass of hydrogen, g·mol−1 | |
| Number of cells | |
| Flow rate of hydrogen from the stack to outlet manifold, g/s | |
| Flow rate of hydrogen from the outlet manifold to circulation, g/s | |
| Flow rate of hydrogen of the discharge, g/s | |
| Status of purge valve | |
| PWM signal meets power requirements | |
| PWM signal of supplementary | |
| PWM signal of injector | |
| Hydrogen utilization |
References
- Ahoutou, Y.; Ilinca, A.; Issa, M. Electrochemical Cells and Storage Technologies to Increase Renewable Energy Share in Cold Climate Conditions—A Critical Assessment. Energies 2022, 15, 1579. [Google Scholar] [CrossRef]
- Sellali, M.; Ravey, A.; Betka, A.; Kouzou, A.; Benbouzid, M.; Djerdir, A.; Kennel, R.; Abdelrahem, M. Optimization-Based Health-Conscious Predictive Energy Management Strategy for Fuel Cell Hybrid Electric Vehicles. Energies 2022, 15, 1318. [Google Scholar] [CrossRef]
- Chitsaz, A.; Haghghi, M.A.; Hosseinpour, J. Thermodynamic and exergoeconomic analyses of a proton exchange membrane fuel cell (PEMFC) system and the feasibility evaluation of integrating with a proton exchange membrane electrolyzer (PEME). Energy Convers. Manag. 2019, 186, 487–499. [Google Scholar] [CrossRef]
- Nguyen, H.; Shabani, B. Proton exchange membrane fuel cells heat recovery opportunities for combined heating/cooling and power applications. Energy Convers. Manag. 2020, 204, 112328. [Google Scholar] [CrossRef]
- Balcombe, P.; Brierley, J.; Lewis, C.; Skatvedt, L.; Speirs, J.; Hawkes, A.; Staffell, I. How to decarbonise international shipping: Options for fuels, technologies and policies. Energy Convers. Manag. 2019, 182, 72–88. [Google Scholar] [CrossRef]
- He, J.; Choe, S.-Y.; Hong, C.-O. Analysis and control of a hybrid fuel delivery system for a polymer electrolyte membrane fuel cell. J. Power Sources 2008, 185, 973–984. [Google Scholar] [CrossRef]
- Wang, Y.; Dai, X.; You, H.; Gao, M. Research on the design of hydrogen supply system of 70 MPa hydrogen storage cylinder for vehicles. Int. J. Hydrogen Energy 2018, 43, 19189–19195. [Google Scholar] [CrossRef]
- He, H.; Quan, S.; Wang, Y.-X. Hydrogen circulation system model predictive control for polymer electrolyte membrane fuel cell-based electric vehicle application. Int. J. Hydrogen Energy 2020, 45, 20382–20390. [Google Scholar] [CrossRef]
- Chen, B.; Tu, Z.K.; Chan, S.H. Performance degradation and recovery characteristics during gas purging in a proton exchange membrane fuel cell with a dead-ended anode. Appl. Therm. Eng. 2018, 129, 968–978. [Google Scholar] [CrossRef]
- Wang, B.W.; Deng, H.; Jiao, K. Purge strategy optimization of proton exchange membrane fuel cell with anode recirculation. Appl. Energy 2018, 225, 1–13. [Google Scholar] [CrossRef]
- Gou, J.; Pei, P.; Wang, Y. The dynamic behavior of pressure during purge process in the anode of a PEM fuel cell. J. Power Sources 2006, 162, 1104–1114. [Google Scholar] [CrossRef]
- Reshetenko, T.V.; Bender, G.; Bethune, K.; Rocheleau, R. Systematic study of back pressure and anode stoichiometry effects on spatial PEMFC performance distribution. Electrochim. Acta 2011, 56, 8700–8710. [Google Scholar] [CrossRef]
- Qin, Y.; Du, Q.; Fan, M.; Chang, Y.; Yin, Y. Study on the operating pressure effect on the performance of a proton exchange membrane fuel cell power system. Energy Convers. Manag. 2017, 142, 357–365. [Google Scholar] [CrossRef]
- Li, Y.; Zhao, X.; Tao, S.; Li, Q.; Chen, W. Experimental Study on Anode and Cathode Pressure Difference Control and Effects in a Proton Exchange Membrane Fuel Cell System. Energy Technol. 2015, 3, 946–954. [Google Scholar] [CrossRef]
- Yuan, H.; Dai, H.F.; Wu, W.; Xie, J.P.; Shen, J.; Wei, X.Z. A fuzzy logic PI control with feedforward compensation for hydrogen pressure in vehicular fuel cell system. Int. J. Hydrogen Energy 2021, 46, 5714–5728. [Google Scholar] [CrossRef]
- Wang, X.; Lu, Y.; Zhang, B.; Liu, J.; Xu, S. Experimental analysis of an ejector for anode recirculation in a 10 kW polymer electrolyte membrane fuel cell system. Int. J. Hydrogen Energy 2021, 47, 1925–1939. [Google Scholar] [CrossRef]
- Musio, F.; Tacchi, F.; Omati, L.; Stampino, P.G.; Dotelli, G.; Limonta, S.; Brivio, D.; Grassini, P. PEMFC system simulation in MATLAB-Simulink (R) environment. Int. J. Hydrogen Energy 2011, 36, 8045–8052. [Google Scholar] [CrossRef]
- Zhang, Q.; Tong, Z.; Tong, S.; Cheng, Z. Modeling and dynamic performance research on proton exchange membrane fuel cell system with hydrogen cycle and dead-ended anode. Energy 2021, 218, 119476. [Google Scholar] [CrossRef]
- Chen, F.; Yu, Y.; Liu, Y.; Chen, H. Control system design for proton exchange membrane fuel cell based on a common rail (I): Control strategy and performance analysis. Int. J. Hydrogen Energy 2017, 42, 4285–4293. [Google Scholar] [CrossRef]
- Shen, K.-Y.; Park, S.; Kim, Y.-B. Hydrogen utilization enhancement of proton exchange membrane fuel cell with anode recirculation system through a purge strategy. Int. J. Hydrogen Energy 2020, 45, 16773–16786. [Google Scholar] [CrossRef]
- Chang, H.; Wan, Z.; Zheng, Y.; Chen, X.; Shu, S.; Tu, Z.; Chan, S.H. Energy analysis of a hybrid PEMFC–solar energy residential micro-CCHP system combined with an organic Rankine cycle and vapor compression cycle. Energy Convers. Manag. 2017, 142, 374–384. [Google Scholar] [CrossRef]
- Ohenoja, M.; Leiviskä, K. Validation of genetic algorithm results in a fuel cell model. Int. J. Hydrogen Energy 2010, 35, 12618–12625. [Google Scholar] [CrossRef]
- Wang, C.T.; Hu, Y.C.; Zheng, P.L. Novel biometric flow slab design for improvement of PEMFC performance. Appl. Energy 2010, 87, 1366–1375. [Google Scholar] [CrossRef]
- Chugh, S.; Chaudhari, C.; Sonkar, K.; Sharma, A.; Kapur, G.; Ramakumar, S. Experimental and modelling studies of low temperature PEMFC performance. Int. J. Hydrogen Energy 2020, 45, 8866–8874. [Google Scholar] [CrossRef]
- Huang, B.; Chatillon, Y.; Bonnet, C.; Lapicque, F.; Leclerc, S.; Hinaje, M.; Raël, S. Experimental investigation of pinhole effect on MEA/cell aging in PEMFC. Int. J. Hydrogen Energy 2013, 38, 543–550. [Google Scholar] [CrossRef]
- Berning, T.; Djilali, N. Three-dimensional computational analysis of transport phenomena in a PEM fuel cell—A parametric study. J. Power Sources 2003, 124, 440–452. [Google Scholar] [CrossRef]
- Karnik, A.; Sun, J.; Stefanopoulou, A.; Buckland, J. Humidity and Pressure Regulation in a PEM Fuel Cell Using a Gain-Scheduled Static Feedback Controller. IEEE Trans. Control Syst. Technol. 2008, 17, 283–297. [Google Scholar] [CrossRef]
- Mann, R.F.; Amphlett, J.C.; Hooper, M.A.I.; Jensen, H.M.; Peppley, B.A.; Roberge, P.R. Development and application of a generalised steady-state electrochemical model for a PEM fuel cell. J. Power Sources 2000, 86, 173–180. [Google Scholar] [CrossRef]
- Yang, S.; Chellali, R.; Lu, X.; Li, L.; Bo, C. Modeling and optimization for proton exchange membrane fuel cell stack using aging and challenging P systems based optimization algorithm. Energy 2016, 109, 569–577. [Google Scholar] [CrossRef]
- Zhu, Y.; Li, Y. New theoretical model for convergent nozzle ejector in the proton exchange membrane fuel cell system. J. Power Sources 2009, 191, 510–519. [Google Scholar] [CrossRef]
- Laribi, S.; Mammar, K.; Sahli, Y.; Necaibia, A.; Arama, F.Z.; Ghaitaoui, T. PEMFC water diagnosis using PWM functionality signal and fractional order model. Energy Rep. 2021, 7, 4214–4221. [Google Scholar] [CrossRef]
- Wu, Z.; Tan, P.; Chen, B.; Cai, W.; Chen, M.; Xu, X.; Zhang, Z.; Ni, M. Dynamic modeling and operation strategy of an NG-fueled SOFC-WGS-TSA-PEMFC hybrid energy conversion system for fuel cell vehicle by using MATLAB/SIMULINK. Energy 2019, 175, 567–579. [Google Scholar] [CrossRef]
Figure 1.
Schematic diagram of the hydrogen system.

Figure 2.
(a) The Simulink model of the hydrogen system. (b) The Simulink model of the hydrogen supply pressure model. (c) The comparison of simulation and experimental performance.
Figure 2.
(a) The Simulink model of the hydrogen system. (b) The Simulink model of the hydrogen supply pressure model. (c) The comparison of simulation and experimental performance.

Figure 3.
(a) Experimental curves of the anode and cathode intake pressure variation during load-up and load-down processes. (b) Simulation curves of the anode and cathode intake pressure variation during load-up and load-down processes.
Figure 3.
(a) Experimental curves of the anode and cathode intake pressure variation during load-up and load-down processes. (b) Simulation curves of the anode and cathode intake pressure variation during load-up and load-down processes.

Figure 4.
(a) Variable loading condition. (b) Pressure fluctuation curves of cathode, anode, intake manifold with variable load under PID mode. (c) Pressure fluctuation curves of cathode, anode, intake manifold with variable load under non-PID mode.
Figure 4.
(a) Variable loading condition. (b) Pressure fluctuation curves of cathode, anode, intake manifold with variable load under PID mode. (c) Pressure fluctuation curves of cathode, anode, intake manifold with variable load under non-PID mode.

Figure 5.
Output performance with different current densities under two modes.

Figure 6.
(a) The hydrogen emission quality under two control strategies. (b) Hydrogen utilization rate under two control modes.
Figure 6.
(a) The hydrogen emission quality under two control strategies. (b) Hydrogen utilization rate under two control modes.

Figure 7.
Flow chart of the hierarchical control policies in the two modes.


Table 1.
Empirical parameters of activation overpotential.
| −0.9514 | 3.12 × 10⁻³ | 7.4 × 10⁻⁵ | −1.87 × 10⁻⁴ |
Table 2.
Operating parameters of the hydrogen system.
| Parameters | Value | Parameters | Value |
|---|---|---|---|
| k | 1.4 | R | 4.124 J/mol K |
| 0.53 | B | 0.15 | |
| 3 | 2.5 × 10⁻³ cm | ||
| 3 | 2.2 A | ||
| 343.15 K | F | 96,485 C/mol | |
| 300 cm2 | 300 | ||
| 1.5 | 4.2 × 10⁻³ cm | ||
| 4×10⁻⁵ g/s Pa | 3 × 10⁻⁵ g/s Pa | ||
| 0.01 m3 | 0.005 m3 | ||
| 0.01 m3 | 2 g/mol |
Publisher’s Note: MDPI stays neutral with regard to jurisdictional claims in published maps and institutional affiliations. |
© 2022 by the authors. Licensee MDPI, Basel, Switzerland. This article is an open access article distributed under the terms and conditions of the Creative Commons Attribution (CC BY) license (https://creativecommons.org/licenses/by/4.0/).
Share and Cite
MDPI and ACS Style
Chen, W.; Liu, Y.; Chen, B. Numerical Simulation on Pressure Dynamic Response Characteristics of Hydrogen Systems for Fuel Cell Vehicles. Energies 2022, 15, 2413. https://0-doi-org.brum.beds.ac.uk/10.3390/en15072413
AMA Style
Chen W, Liu Y, Chen B. Numerical Simulation on Pressure Dynamic Response Characteristics of Hydrogen Systems for Fuel Cell Vehicles. Energies. 2022; 15(7):2413. https://0-doi-org.brum.beds.ac.uk/10.3390/en15072413
Chicago/Turabian StyleChen, Wenshang, Yang Liu, and Ben Chen. 2022. "Numerical Simulation on Pressure Dynamic Response Characteristics of Hydrogen Systems for Fuel Cell Vehicles" Energies 15, no. 7: 2413. https://0-doi-org.brum.beds.ac.uk/10.3390/en15072413
Note that from the first issue of 2016, this journal uses article numbers instead of page numbers. See further details here.