
Optimal Service Restoration Scheme for Radial Distribution Network Using Teaching Learning Based Optimization


1
Department of Electrical and Computer Engineering, Dilla University, Dilla 419, Ethiopia
2
Department of Electrical and Computer Engineering, Hawassa University, Hawassa 005, Ethiopia
3
Electrical Engineering Department, College of Engineering, Jazan University, P.O. Box 114, Jazan 45142, Saudi Arabia
*
Authors to whom correspondence should be addressed.
Energies 2022, 15(7), 2505; https://0-doi-org.brum.beds.ac.uk/10.3390/en15072505
Submission received: 4 March 2022
/
Revised: 18 March 2022
/
Accepted: 22 March 2022
/
Published: 29 March 2022
(This article belongs to the Special Issue Electrical Power System Dynamics: Stability and Control)
Abstract
:In the event of a fault isolation process, all loads located downstream from the faulted point become out of service, and as a consequence, the power interruption affects a greater portion of the radial distribution system. This paper proposes an optimal Service Restoration (SR) method that entails changing the network topology configuration via optimal tie-switch and section switch combinations. However, when the network topology configuration is performed, it results in increased load currents. As a result, some Protective Devices (PDs) can operate undesirably and some network branches may become unprotected. Therefore, it is essential to consider protection constraints in the SR problem to maintain service continuity during power interruptions. The proposed method aims at optimal SR with minimum out-of-service loads, minimum power loss, and improved voltage profiles and at the same time ensures PDs operate correctly during the normal and overloading conditions. The proposed method was carried out on the Debre Markos distribution networks, using the Teaching Learning Based Optimization (TLBO), Particle Swarm Optimization (PSO), and Differential Evolutionary (DEV) algorithms. The proposed SR was carried out considering and without considering protection constraints. The obtained SR topology was not feasible for SR without considering protection constraints, since some PDs fail to operate properly in normal loading conditions. After executing the proposed SR algorithms by considering protection constraints for a single fault case, the power loss reductions in TLBO, DEV, and PSO were 64.9073%, 45.9073%, and 55.358 %, respectively. The minimum voltage profiles obtained in each proposed TLBO, DEV, and PSO algorithm were 0.96%, 0.95%, and 0.96%, respectively. In each algorithm, except for the branch under fault, all healthy out-of-service branches were restored. When the protection constraints were considered in an optimal SR, load current did not exceed the rating of the fuses. The results show the importance of considering protection constraints during SR to prevent dysfunction of the PDs in the network. Comparative analyses were carried out on each algorithm and TLBO algorithms performed better than PSO and DEV for search functions.
1. Introduction
An electric power system commonly includes power generation systems, transmission systems, and distribution systems. An electric power distribution system is the final stage in the delivery of electric power. Most distribution networks operate in a radial configuration to exploit the advantages, as these topologies offer easier coordination of protective measures, easier voltage and power flow control, and lower cost [1].
In radial distribution systems, during an outage, the downstream customers are disrupted during the fault isolation process. Thus, to restore an electric power to the un-faulted parts of the distribution system, an effective maneuver plan is required to minimize the impact of interruption to as few consumers as possible [2].
The problem of the restoration of a radial electrical distribution network is one of the most important topics related to the efficient operation of radial distribution systems. In this context, the main goal is to restore the largest number of disconnected loads (out-of-service areas). The service restoration must be performed without violating the distribution network operational constraints such as current capacity of the feeder, capacity of the substation, voltage limits of nodes, radiality, and protection constraints [3].
The power system service restoration has two main consecutive steps. First, from the set of feasible limits, the optimal section switch combinations are obtained for network reconfiguration. Second, switching operations are performed to achieve the optimal target configuration obtained in the first step. Thus, the customers faced with interruption of the power delivery can be transferred to the support feeders via network reconfiguration [4].
The authors of [5] described a mixed-integer linear program for optimal service restoration of a mesh-structured distribution network switching process. The proposed method supports the decision-making process of operators in the control center of a distribution system during an outage conditions.
In [6], the authors provided a mixed-integer linear programming for post-fault service restoration methodologies. In this method, the operational constraints of distributed energy sources and energy storage systems are also included.
The author of [7] reported a service restoration to enhance distribution network reliability using a particle swarm optimization algorithm. In this paper, integration of distribution generations was included to further improve the reliability of the distribution system.
The authors of [8] developed a radial distribution network reconfiguration based service restoration using DEV. During an outage in the distribution system, service restorations are carried out by optimally changing the closed and open statuses of sectionalizing and tie-switches and at the same time the power loss has to be minimized. The feasibility of the algorithm is checked using IEEE 16 and IEEE 33 bus distribution networks.
In [9], the authors explained a combined spinning tree and genetic algorithm based distribution network reconfiguration for service restoration. The proposed algorithms focused on maximization of connected loads and minimization of switching operations by considering all technical and operational constraints.
The authors of [10] provided a service restoration plan to energize downstream feeders by finding the optimal path for power flow. A hybrid GA and ACO algorithm was used to find optimal section and tie-switches.
In [11], the authors described a radial service restoration to avoid overloading of the distribution feeder using an ACO algorithm. The algorithm is intended for solving the overloading contingency and is capable of obtaining the limits of bus voltages within limits.
The authors of [12] discussed an optimal hybrid tabu search and particle swarm optimization algorithm for distribution network reconfiguration to minimize the distribution network power losses. In this paper, the IEEE 33 bus distribution networks are involved.
The authors of [13] reported service restoration of islanded sections of a distribution network with an integration of Boolean algebra and PSO. In this work, normal problem formulation and contingency causes are studied by integrating distributed energy sources and capacitor banks so as to improve the distribution network voltage stability index.
Based on the above literature review, in this paper, a multi-objective and real system service restoration method is proposed which consider the operation and protective device constraints. This method tries to provide optimal service restoration of the network, which has the capability to supply all out-of-service customers with minimum active power loss, and improve voltage profiles while the protection system of the network works properly. This method was performed on the real data of radial distribution networks of the town of Debre Markos.
2. Methodology and Problem Formulation
2.1. Methodology
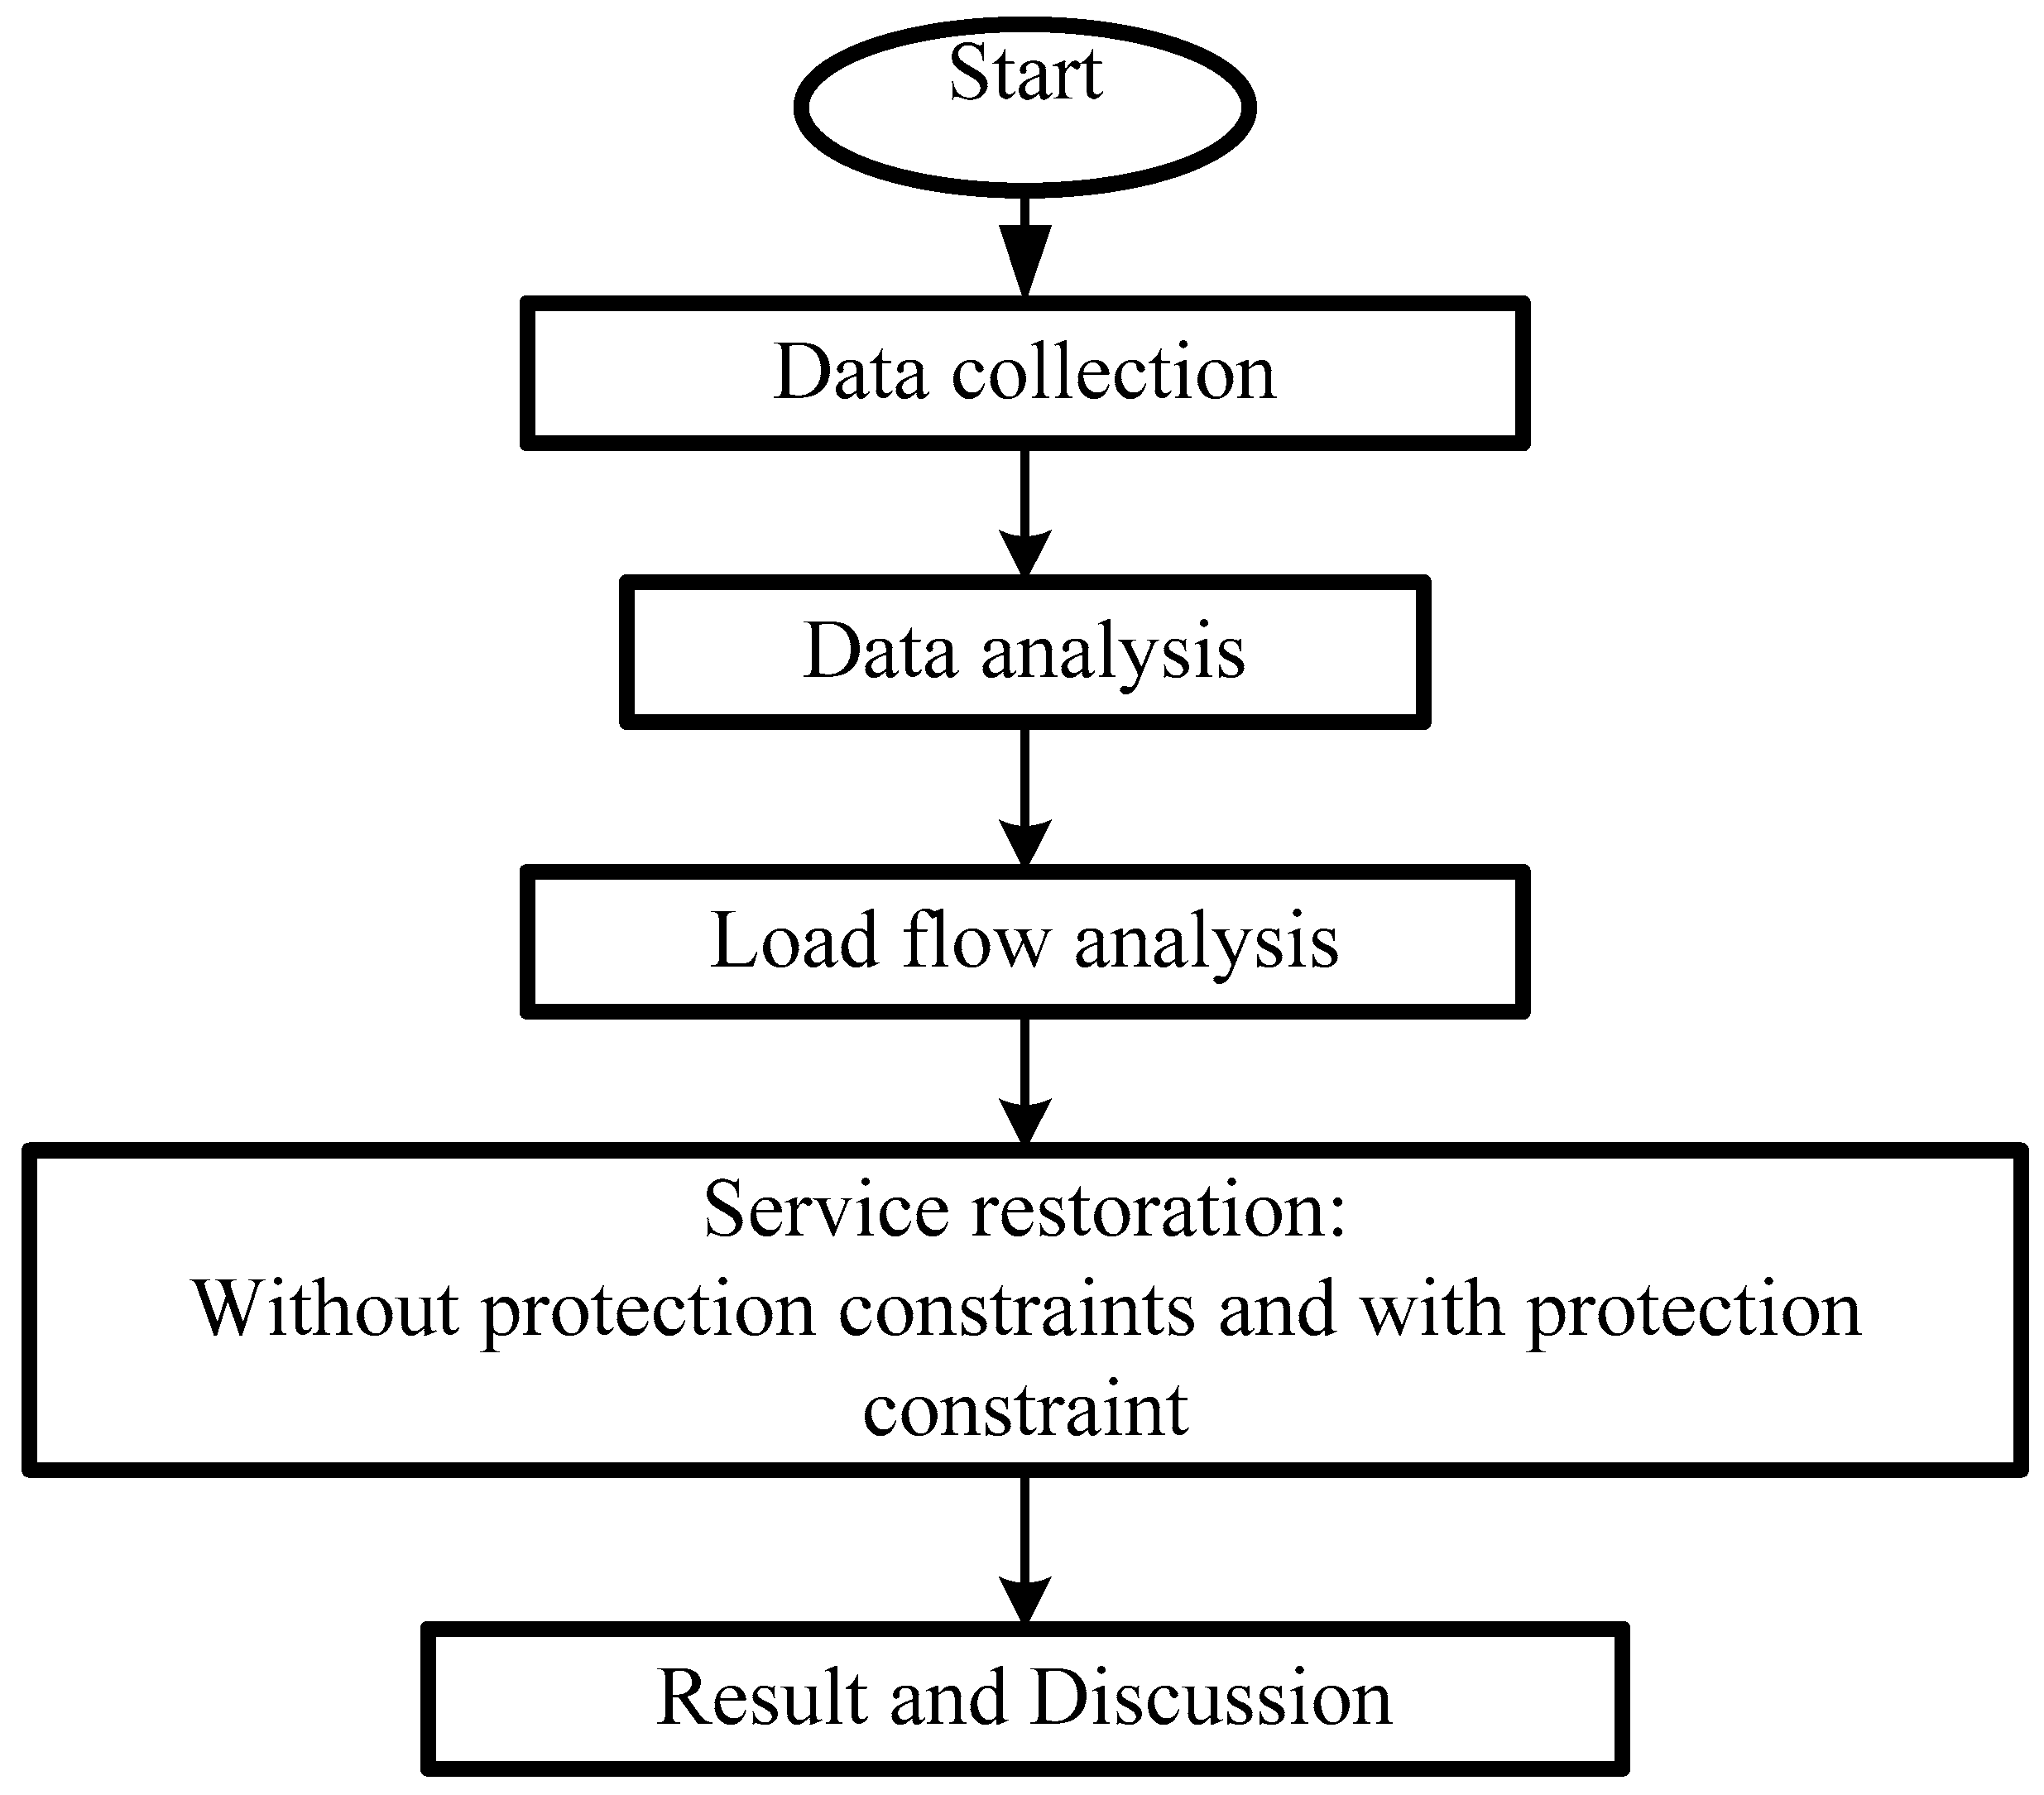
The overall methodology of this study includes the following main steps illustrated using Figure 1 below.
2.2. Service Restoration (SR) Problem Formulation
2.2.1. Objective Functions
The SR problem begins after the faulted areas have been identified and isolated. To obtain an optimal post-fault service restoration, the network will be reconfigured by testing different switching combinations and selecting the topology which ensures maximum customer connectivity and minimal power losses by satisfying several objectives with constraints.
The main objective function to restore out-of-service loads, minimize power losses, and minimize voltage deviations is expressed in Equation (1) below [14].
where i is any feeder branch, Nbr is the number of branches, is the ith branch resistance, is the current magnitude flow in the branch, is the voltage deviation of bus I, and is the number of loads that are out of service in a radial distribution network.
W1, W2, and W3 are weights of the real power loss, cumulative voltage deviation, and distribution network out-of-service loads in the objective function, respectively, and their sum is equal to one.
The Voltage Deviation (VD) at bus i is given as in Equation (2).
where Vi is measured voltage at bus i, m is the total number of load buses, and is the nominal bus voltages.
2.2.2. Network Reconfiguration Constraints
In this paper, restoration is carried out by reconfiguring the topology of the radial distribution networks. Additionally, network reconfiguration is subjected to the following constraints:
- (a)
- Power balance: In all distribution networks, the power supply must be equal to the sum of the load demand and power loss.where Psubstation is the total power supply from the substation to the outgoing feeders, Pload is the total load demand.Psubstation = Ploss + Pload
- (b)
- Voltage constraint: The voltage magnitude Vbus at each bus should stay within specific limits during the operation of the system.where Vmin and Vmax are the minimum and maximum allowed voltage in the system, respectively. Vbus is any bus voltage. Vmin is 0.95 per unit and Vmax is 1.05 per unit and they are presented as a standard voltage limit ranges [15].Vmin < Vbus < Vmax
- (c)
- Feeder capacity limits: After reconfiguration, all power lines must be operating within their thermal limits:where Ii is current in the ith branch, Ii,max is maximum current capacity of the ith branch, and Nbr is the number of branches.
- (d)
- The radiality constraint: The distribution systems must stay radial during operation. The system has to remain radially operated after reconfiguration. Therefore, at least one switch in each of the identified loops has to be opened.
The topology of distribution systems must be a radial configuration, and there is no isolated node in the system. The radial topology constraint is expressed as follows:
where Nnode is the number of nodes in the system.
Nnode − Nbr = 1
2.2.3. Protection Constraints
- (a)
- The Overload Factor (OLF) limit: at the normal operating time of the distribution network, if the branch current is higher than the pick-up current of the relay or operating current of the fuse, the protective device must immediately isolate the coverage area to minimize damage to the distribution equipment. The Overload Factor (OLF) limit is formulated in Equation (7).where Ibr is the branch current flow through the protective device after the optimal service restoration and Ip is the operating current of the protective device.OLF × Ibr < Ip
The OLF recommended for lines, transformers, and generators is normally in the range of 1.25 to 1.5. In this paper, an OLF of 1.25 is selected to reduce equipment failures.
- (b)
- Protective device sensitivity to the minimum fault current: In the optimal service restoration, the restored networks’ protective devices have to sense the fault currents and isolate the fault section of the distribution networks. This constraint will avoid unwanted operation of protective devices and ensure the protection coverage of the distribution network. Thus, the rating of the protective devices should be below the minimum fault current values and it is given in Equation (8) [16].
2.2.4. Protection Coordination Constraints
Protection coordination is necessary when two or more than two protective devices are used in a radial distribution network. In each protection zone of the protective devices, the main protective device should operate before the backup protective devices. This is necessary to avoid unwanted tripping of the protective devices and reduces undesired distribution network downtime. In this paper, fuse–fuse coordination and fuse–relay coordination are considered.
(a) Fuse–Fuse Coordination: Whenever more than two protective devices are placed in an electric network, the main fuse should operate before the backup fuses. Additionally, thus, to isolate the faulty section of the network, appropriate time discrimination is needed. The operating time of the main fuse should be less than 75% of the operating time of the backup fuses [17].
where MCTFm is maximum operating time of the main fuse and MMTFb is the minimum allowed operating time of the backup fuse.
MCTFm ≤ 0.75 × MMTFb
(b) Fuse–Relay Coordination: The time of operation between the main protective devices and backup protective devices needs a Coordination Time Interval (CTI). The appropriate CTI ensures the main protective devices operate before backup protective devices. In this paper, a CTI of 0.3 s is selected, the relay time dial is set to 0.15 s, and they are described by Equation (10).
where top is operating time of the backup protection relays and tfuse is the primary protective device operating time. Time Delay Setting (TDS) is the fine-tuning process to delay the relay operating time to achieve correct coordination. According to IEC 60255-151 standards [18], the operating Time–Current Characteristic (TCC) of the relay is described by Equation (11).
where is the operating time of the relay, is current inside the operating relay coil, PS is plug setting, and TMS is time multiplier setting. The relay is operated at standard inverse characteristics and the value of is 0.14 and is 0.02 [18].
top − tfuse > CTI
2.3. Implementation of TLBO in Radial Distribution Network Service Restoration
2.3.1. Pseudo Code of TLBO
The teaching learning based meta-heuristic algorithm performs its optimization techniques based on the following pseudo code procedures.
Set k = 1
D = No. of generators.
N = number of learners in a class, i.e., population size.
= minimum value of generators.
= maximum value of generators.
Generate initial students of the classroom, i.e., generation of all generators randomly. Calculate objective function ƒ (x) for all students of the classroom, i.e., all generators.
WHILE (the termination conditions are not met)
{
Teacher Phase:
}
Calculate the mean of each design variable (mean of Generators Mg).
Identify the best solution (teacher)
FOR I ➔ n
Calculate teaching factor = round [1 + rand (0, 1) {2 − 1}]
Modify solution based on best solution (teacher)
=+ rand (−×)
Calculate objective function for new mapped student ƒ ()
IF is better than Xi, ƒ () < ƒ ()
=
Check whether is within limits.
IF >
=
ELSE IF <
=
END
END IF {End of Teacher Phase}
{
Learner Phase: }
Randomly select another learner , such that i ≠ r
IF is better than , i.e., ƒ () < ƒ (,)
= + rand (0, 1) ( − ,)
ELSE
= + rand (0, 1) (, −)
END IF
IF is better than , ƒ () < ƒ ()
=
Check whether is within limits.
IF >
=
ELSE IF <
=
END
END IF {End of Learner Phase}
END FOR
Set k = k + 1
END WHILE
2.3.2. Implementation of TLBO in Radial Distribution Network Service Restoration
The problems of selecting optimum tie-switches for SR are formulated in the form of a TLBO algorithm. An objective function is formulated considering minimization of the distribution out-of-service loads and power losses, and it improves the voltage profiles. These are considered, and it is given in the equation below.
where is the weighting factor giving priority to reduction in real power losses, is the weighting factor giving priority to reduction in voltage deviation, and is the weighting factor giving priority to reduction in out-of-service loads in the radial distribution network. Weights of an objective are chosen in proportion to the relative importance of the objective. In this paper, the out-of-service loads are restored by giving more emphasis to power loss and out-of-service loads. It is also important that the condition = 1 has to be satisfied in each case.
Thus, in this study the weight values are assumed where is restricted to be between 0.4 and 0.7, and are restricted to be between 0.1 and 0.5. The weight factors having minimum fitness values are selected for the multi-objective service restoration function. Thus, based on this criterion the candidate weight factors were checked with the SR objective functions and the weights chosen were = 0.6, = 0.1, and = 0.3. Additionally, the multi-objective service restoration function is given by:
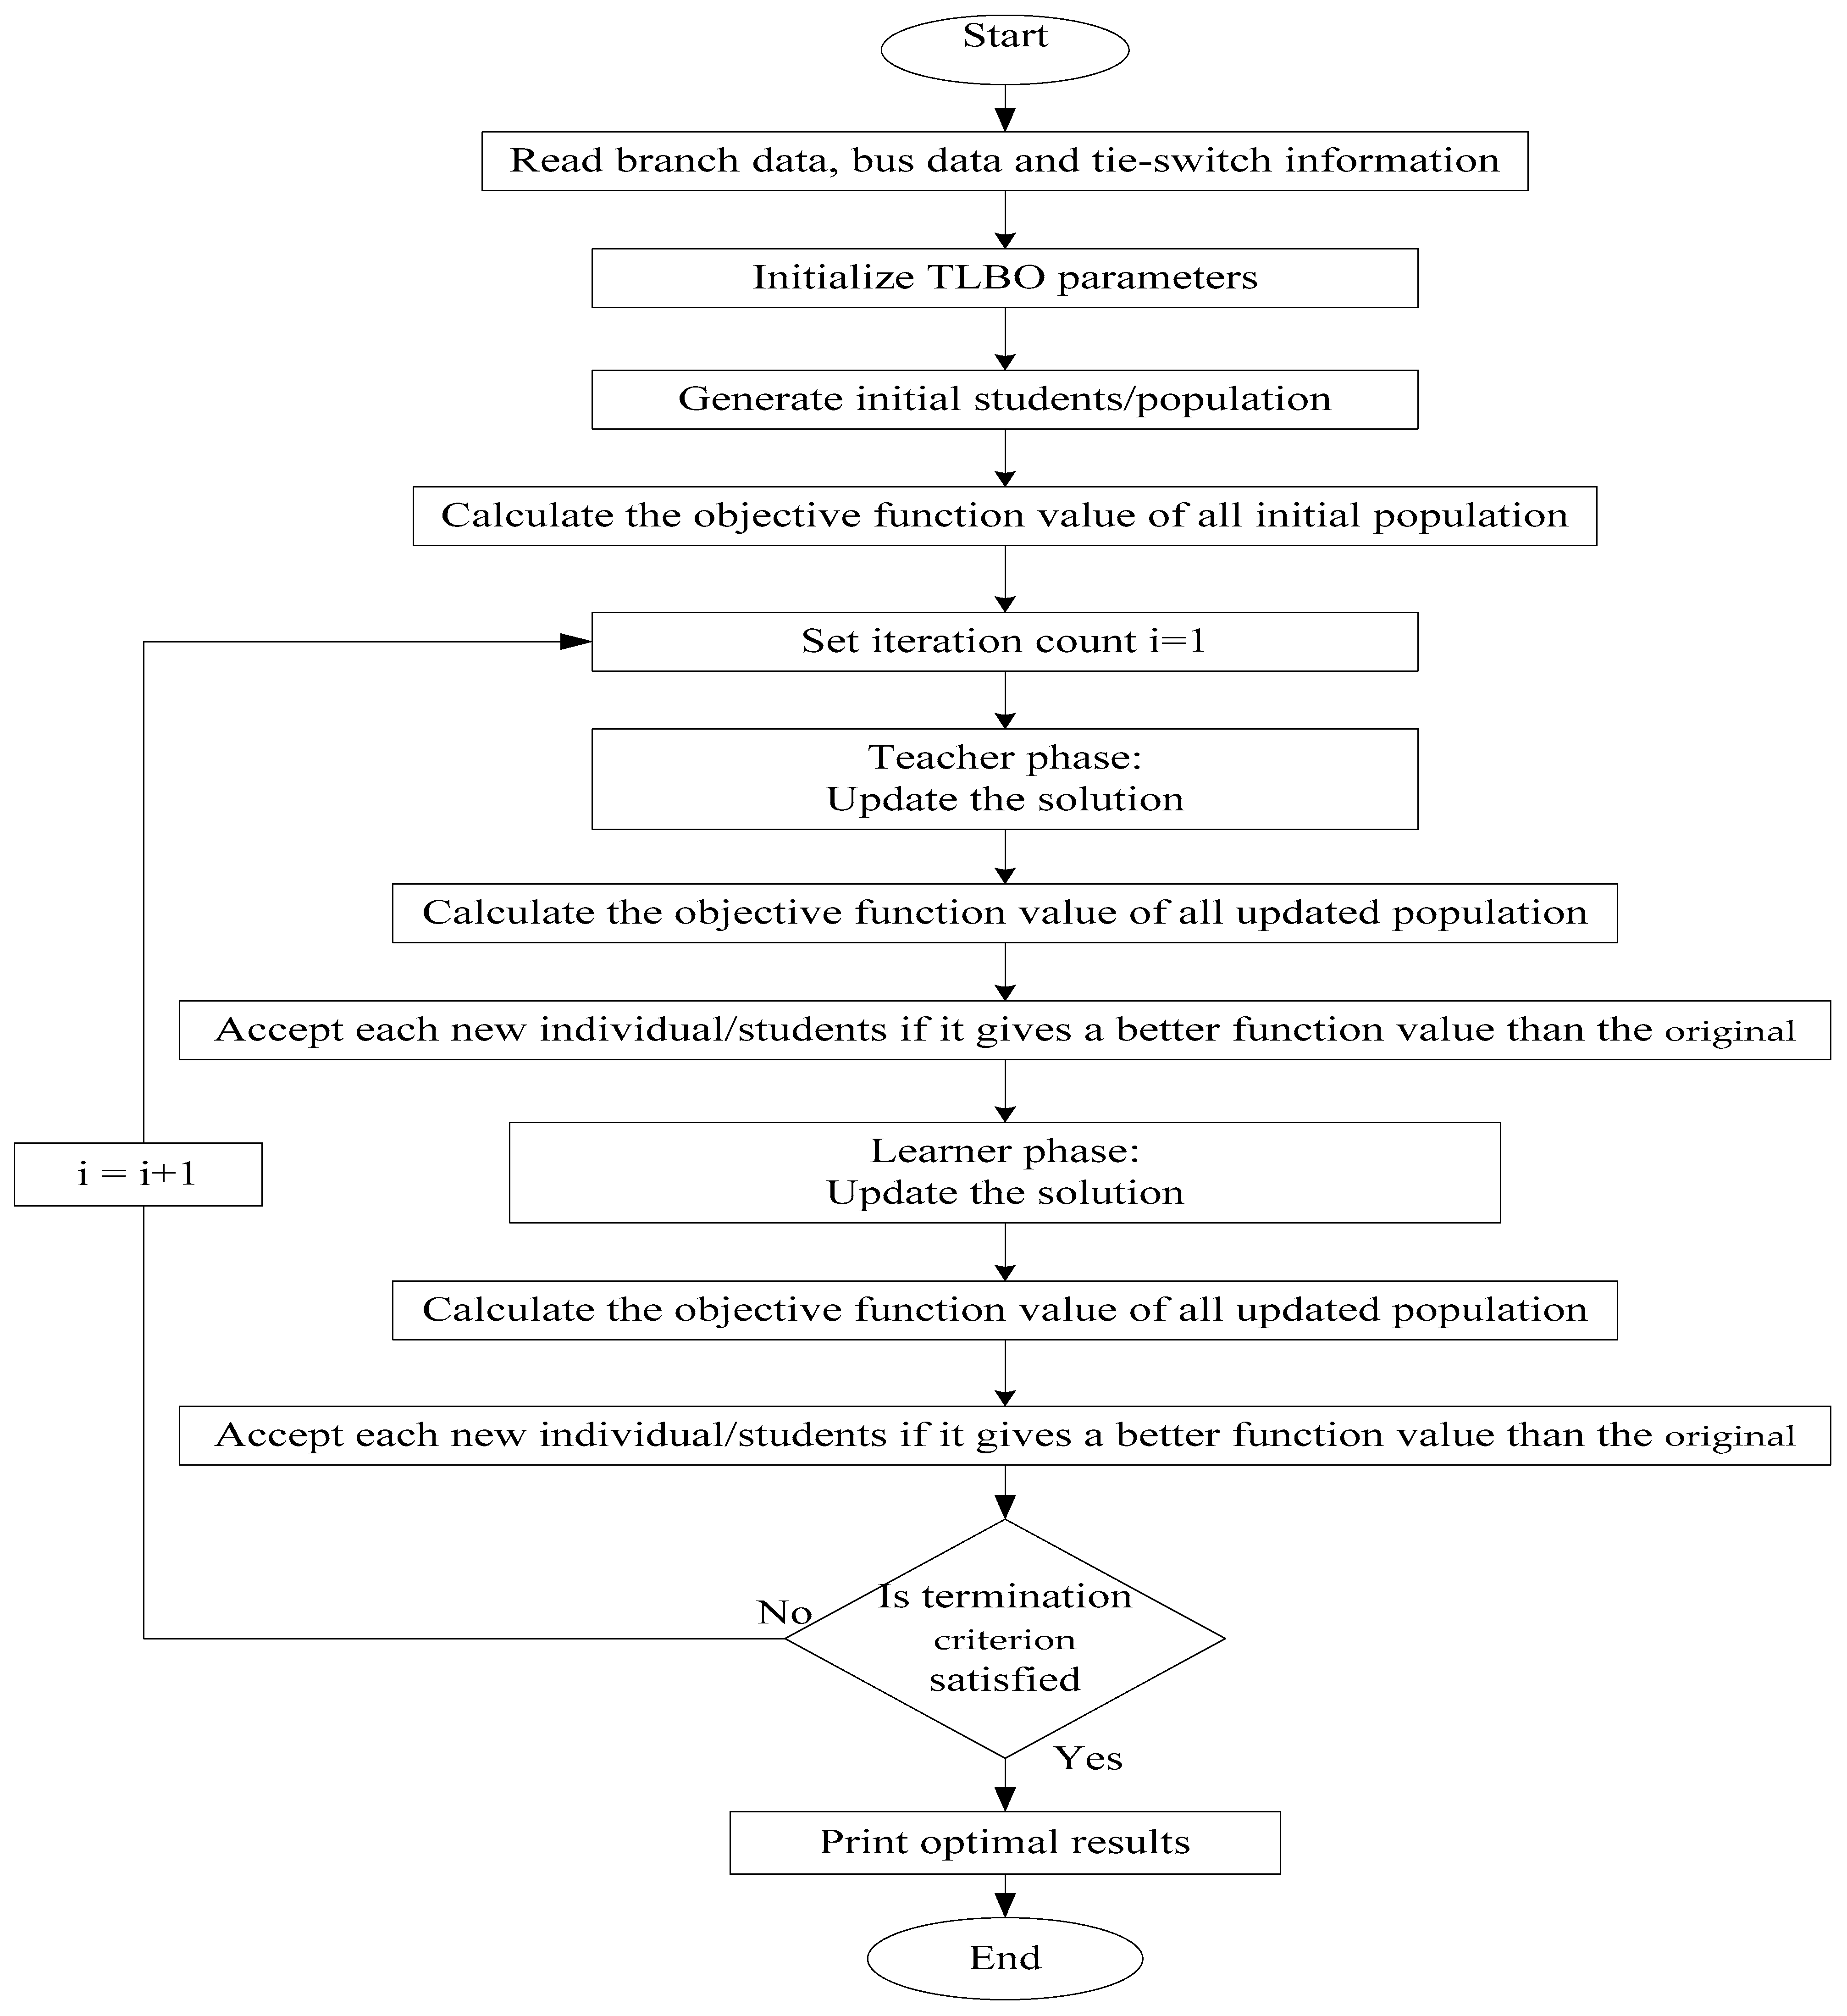
The implementations of TLBO algorithms for radial distribution network service restoration are illustrated in Figure 2 below.
3. Overview of a Study Area
The town of Debre Markos is located in the northwest of Ethiopia. The town is located in the East Gojjam Zone of Amhara Region, at a distance of 300 km from Addis Ababa and 265 km from the capital of Amhara Nation Regional State Bahir Dar. Its geographic coordinates are 10°20′ N latitude and 37°43′ E longitude. According to the Debre Markos city administration mayor office, the total population was about 49,297 in 1994 and 107,433 persons in 2016/17, and now has an estimated population of 262,497 (2019/20) [19,20].
The medium voltage networks in Debre Markos are responsible for the operation, maintenance, and management of the Debre Markos electric utility and mainly operate at 15 kV. All of the medium voltage networks in Debre Markos are overhead line 3 phase 3 wire type. The medium voltage networks are projected from Debre Markos substation having a 63/40/23 MVA, 230/66/15 kV rating three winding transformer.
Among the five Debre Markos 15 kV distribution networks, FD-3 has the highest values of average power interruption frequency and longest durations. This indicates that to enhance the performance of Debre Markos 15 kV distribution networks, FD-3 needs more improvement.
Due to this, the scope of this service restoration study is limited to the FD-3 distribution network.
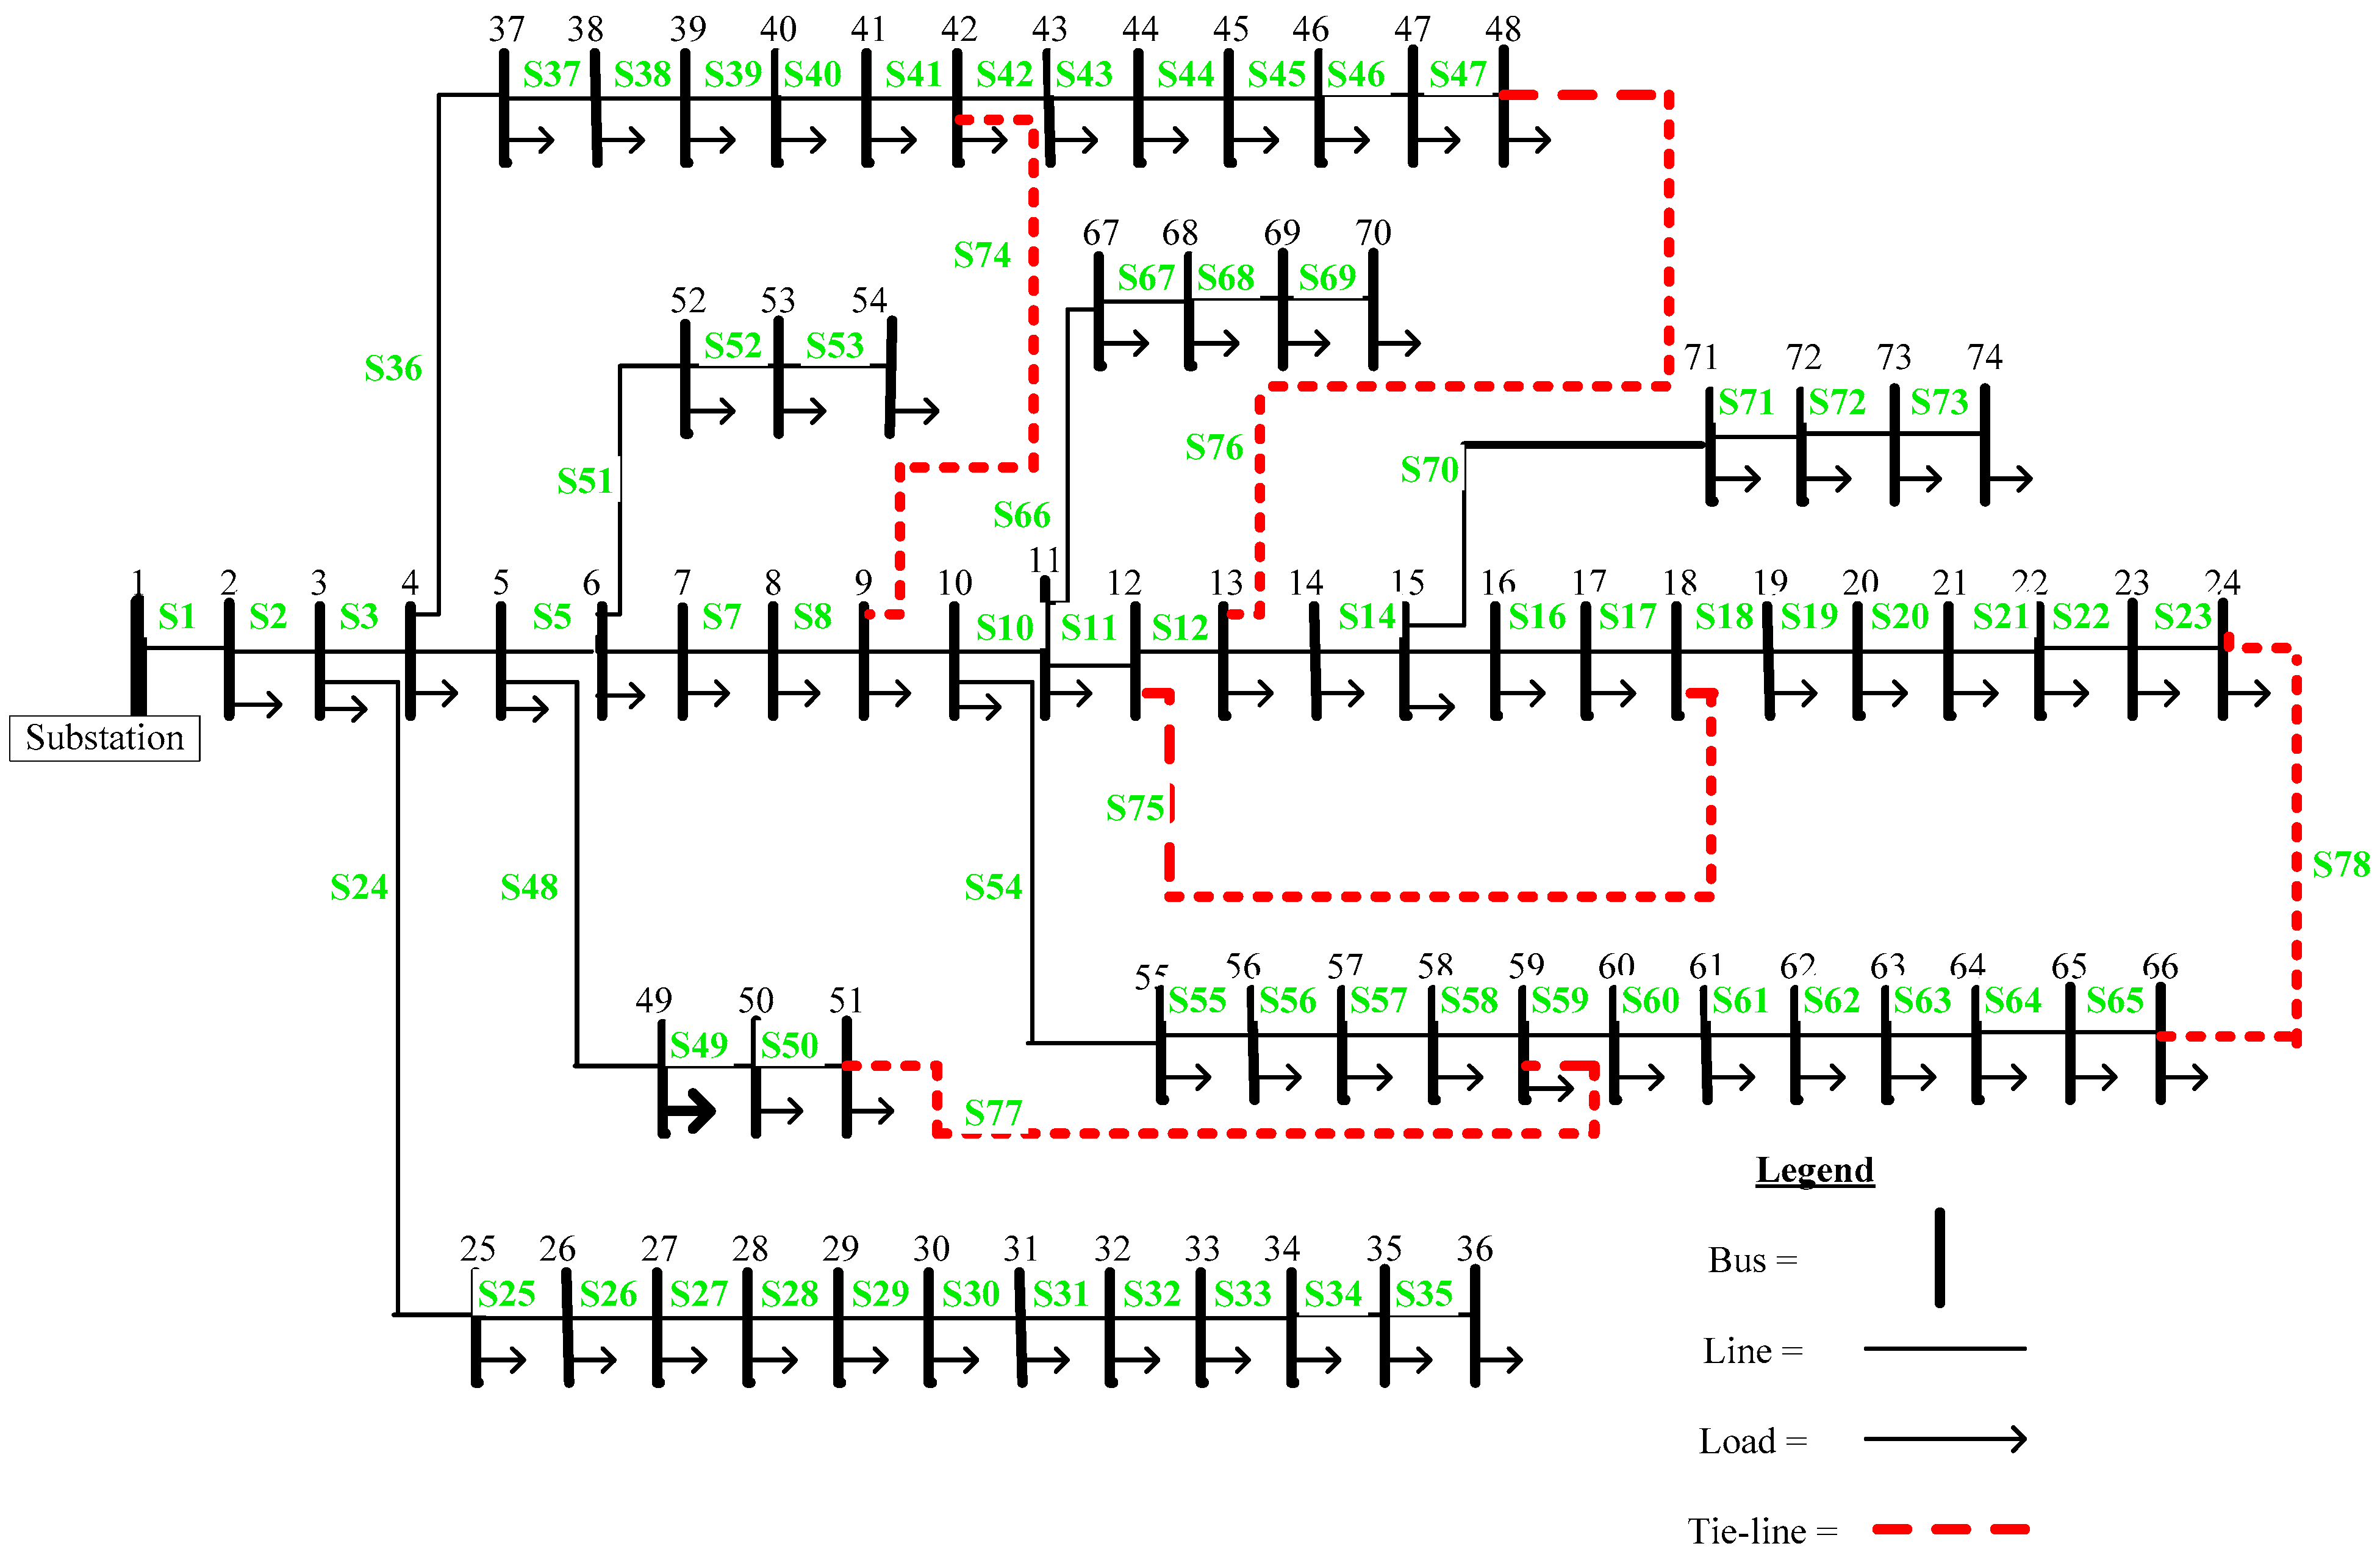
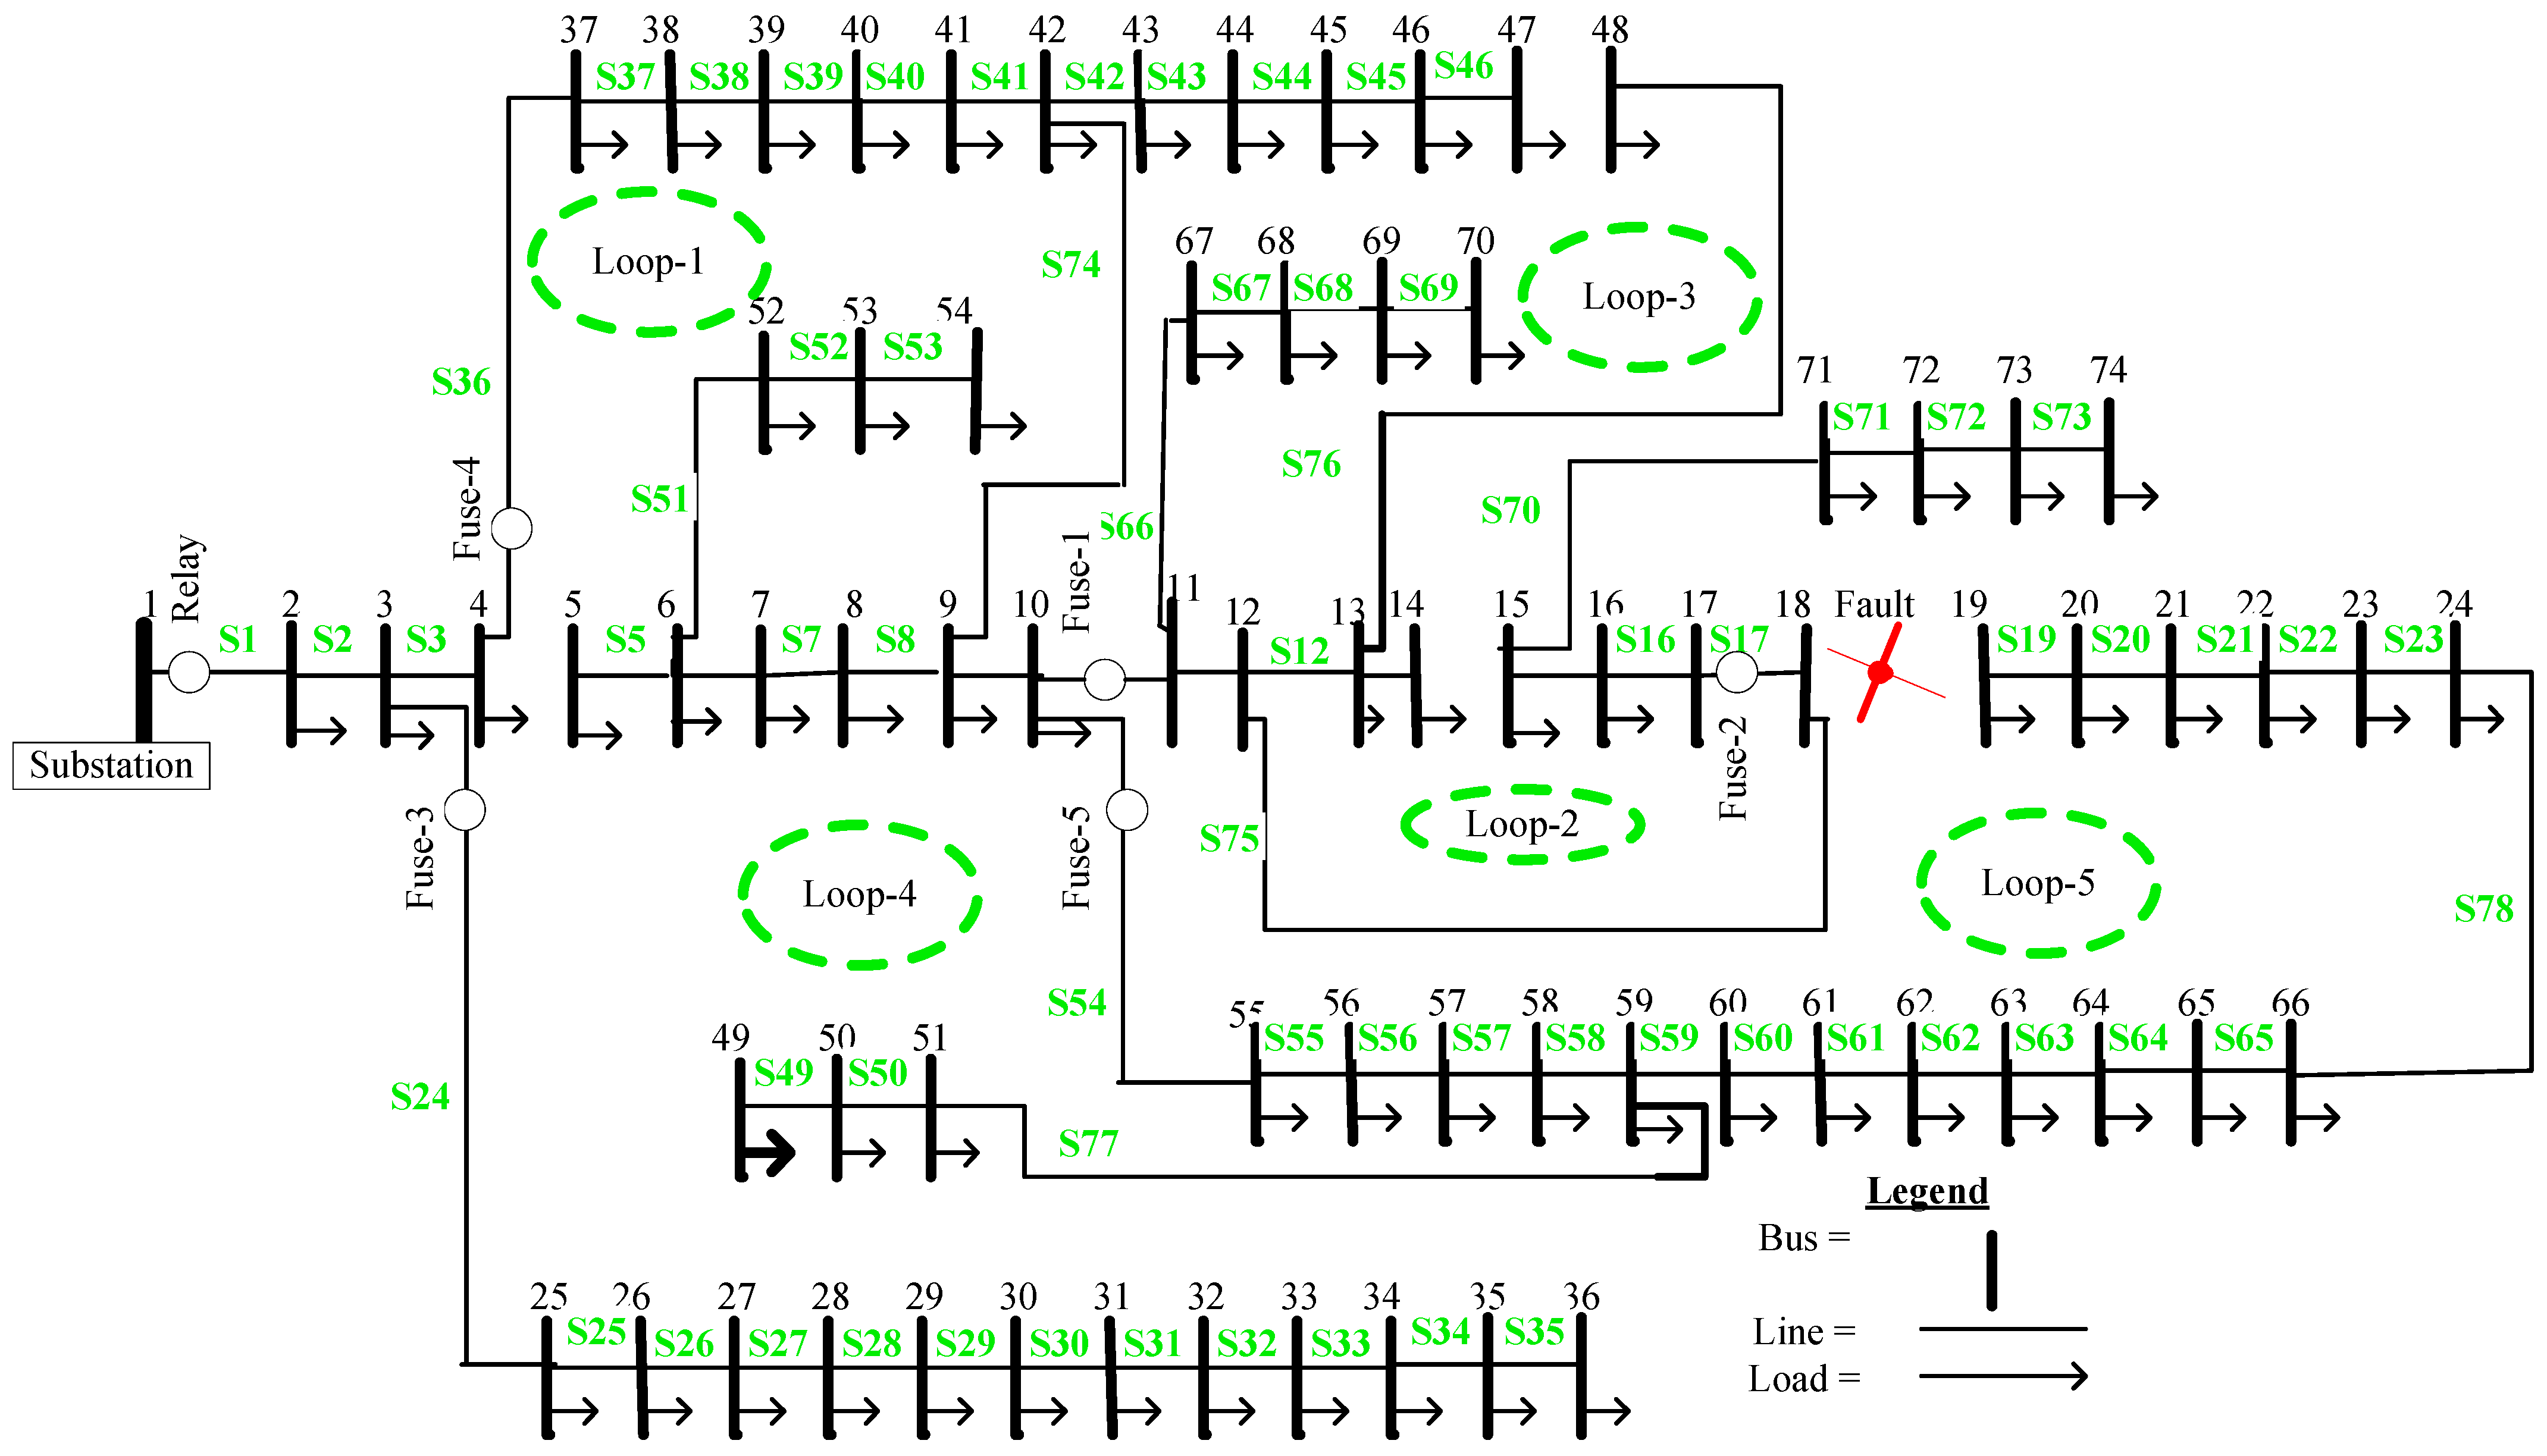
Single Line Diagram Representation of DM Feeder-3 (FD-3)
The nodes are designated by numbers (black) from 1 to 74, the sectionalizing lines are represented by numbers (green) from S1 to S73, and the red dotted lines indicate the tie-line switches.
4. Result and Discussion
The objective of this simulation is to evaluate the service restoration problems on the selected Debre Markos (DM) distribution feeders. The proper tie-switch combinations for service restorations are demonstrated in MATLAB (R2017a version) software using the TLBO, PSO, and DEV algorithms. Furthermore, the impact of integrating the protection constraints into the service restoration problem has been investigated in detail. For illustration, the existing distribution network lateral designs were drawn using Microsoft Visio.
The main target of optimal service restoration based on reconfiguring the network is performed by opening sectionalizing lines in each loop so that an optimal network topology with minimum out-of-service loads, minimum power loss, and better voltage profile is obtained. The sectionalizing line combinations to be opened/closed are determined with TLBO, PSO, and DEV optimization algorithms and are discussed in the coming sections.
From the existing/base system, two different cases were formed and analyzed for Debre Markos FD-3 service restoration problems. The cases are:
Case 1: Service restoration without considering protection constraints is employed for a single fault condition with the objectives to minimize out-of-service customers, reduce the power losses, and to improve the voltage profile in the system.
Case 2: Service restoration by considering protection constraints is employed for a single fault condition with the objectives to minimize out-of-service customers, reduce the power losses, and to improve the voltage profile in the system.
Case 1—SR for Single Fault Case without Protection Constraints
For analysis purposes, it is assumed that branch S18 which connects buses 18 and 19 is faulted.
For a single fault case, SR without considering protection constraints was implemented using TLBO, DEV, and PSO. Except for the branch under fault, all healthy out-of-service branches were restored. The identified switch combinations to be opened at the final configuration using TLBO are S4, S12, S11, and S8, those using DEV are S74, S75, S9, and S77, and for PSO they are S40, S17, S46, and S56.
The restored load, power loss, minimum voltage, and section switch combinations are identified and tabulated in Table 1. After executing the proposed TLBO, DEV, and PSO algorithms, active power losses were reduced by 72.4587%, 58.3708%, and 62.477%, respectively, and reactive power losses were reduced by 71.9573%, 60.2861%, and 63.8461%, respectively. In each algorithm, the SR simulation results are mostly similar and this confirms the validity of the proposed optimization algorithms.
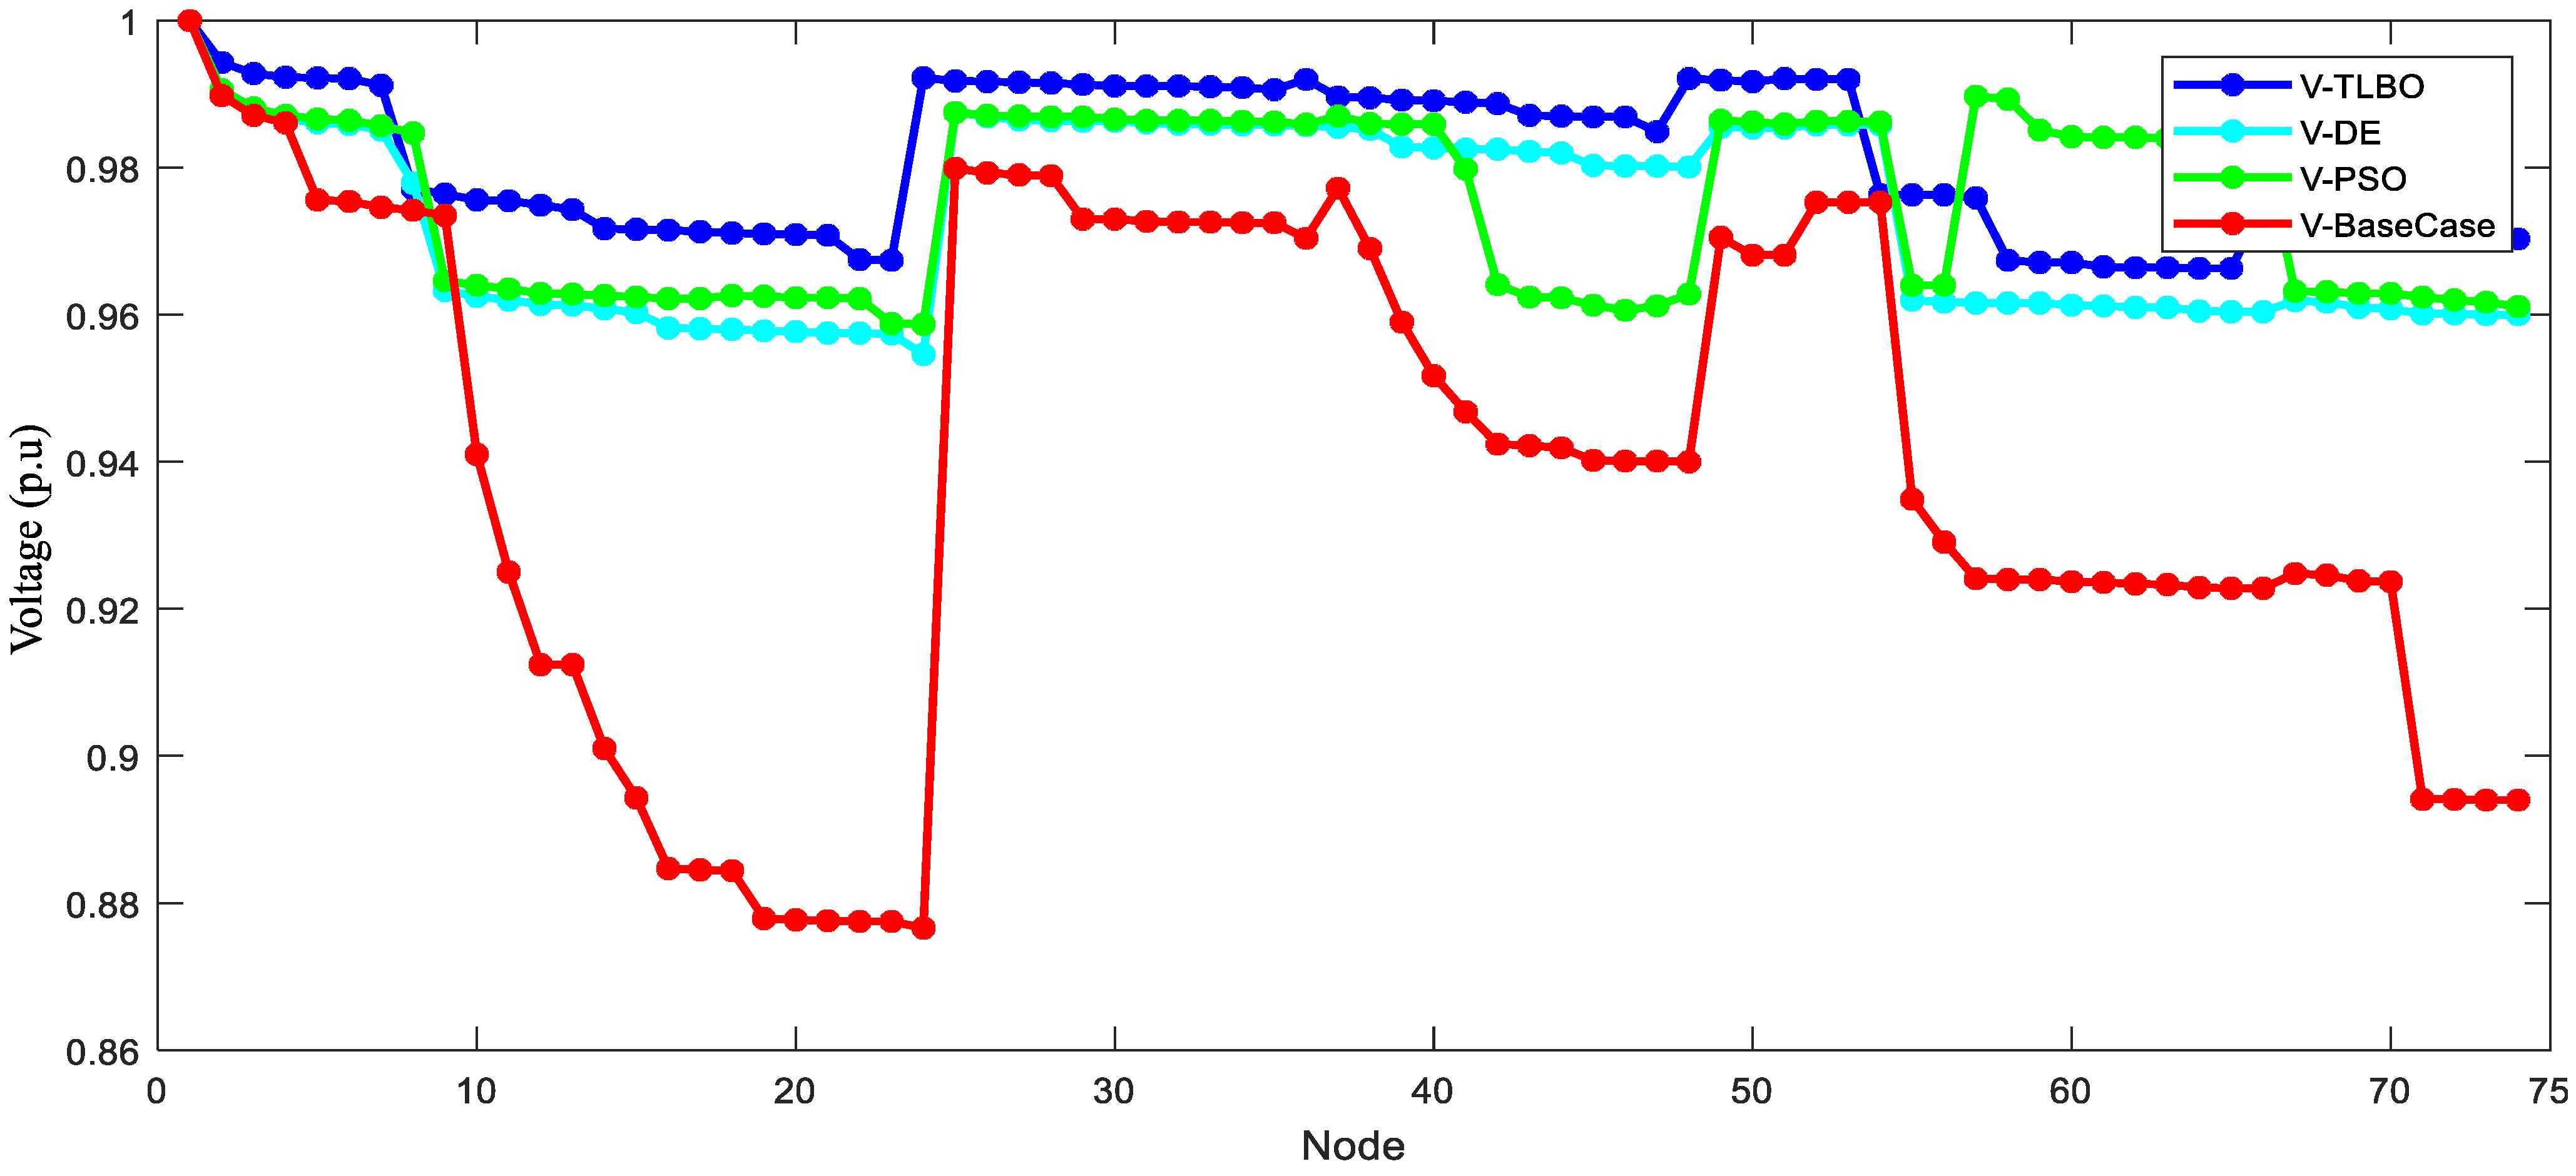
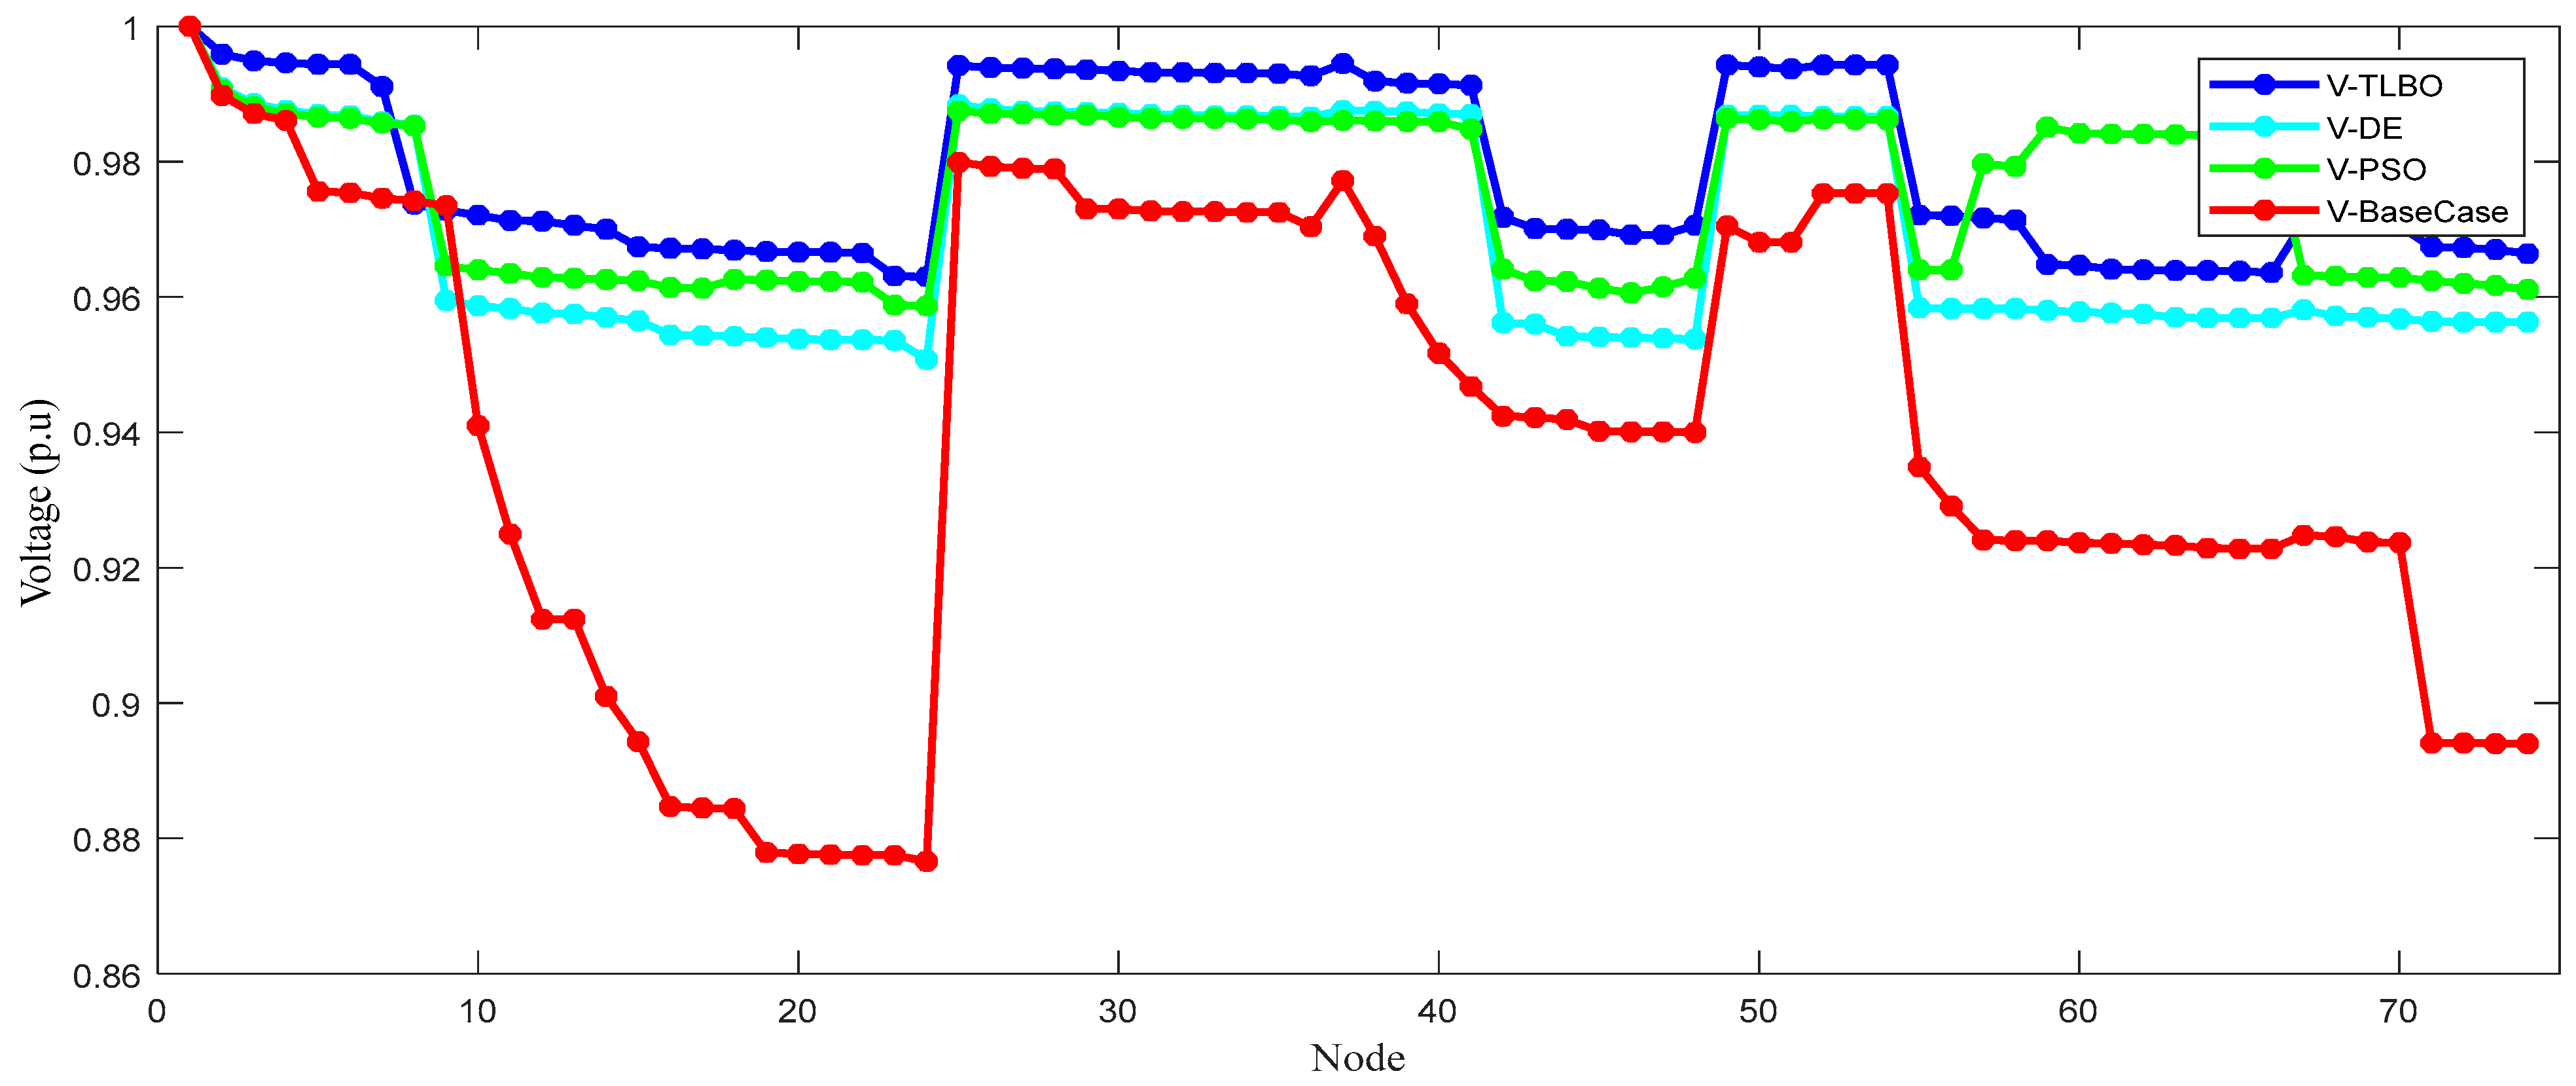
In addition, the bus voltages are also maintained within the limit. The bus voltages at the final configuration are shown in Figure 3; it indicates that none of the bus voltages has deviated from its minimum standard value of 0.95 p.u.
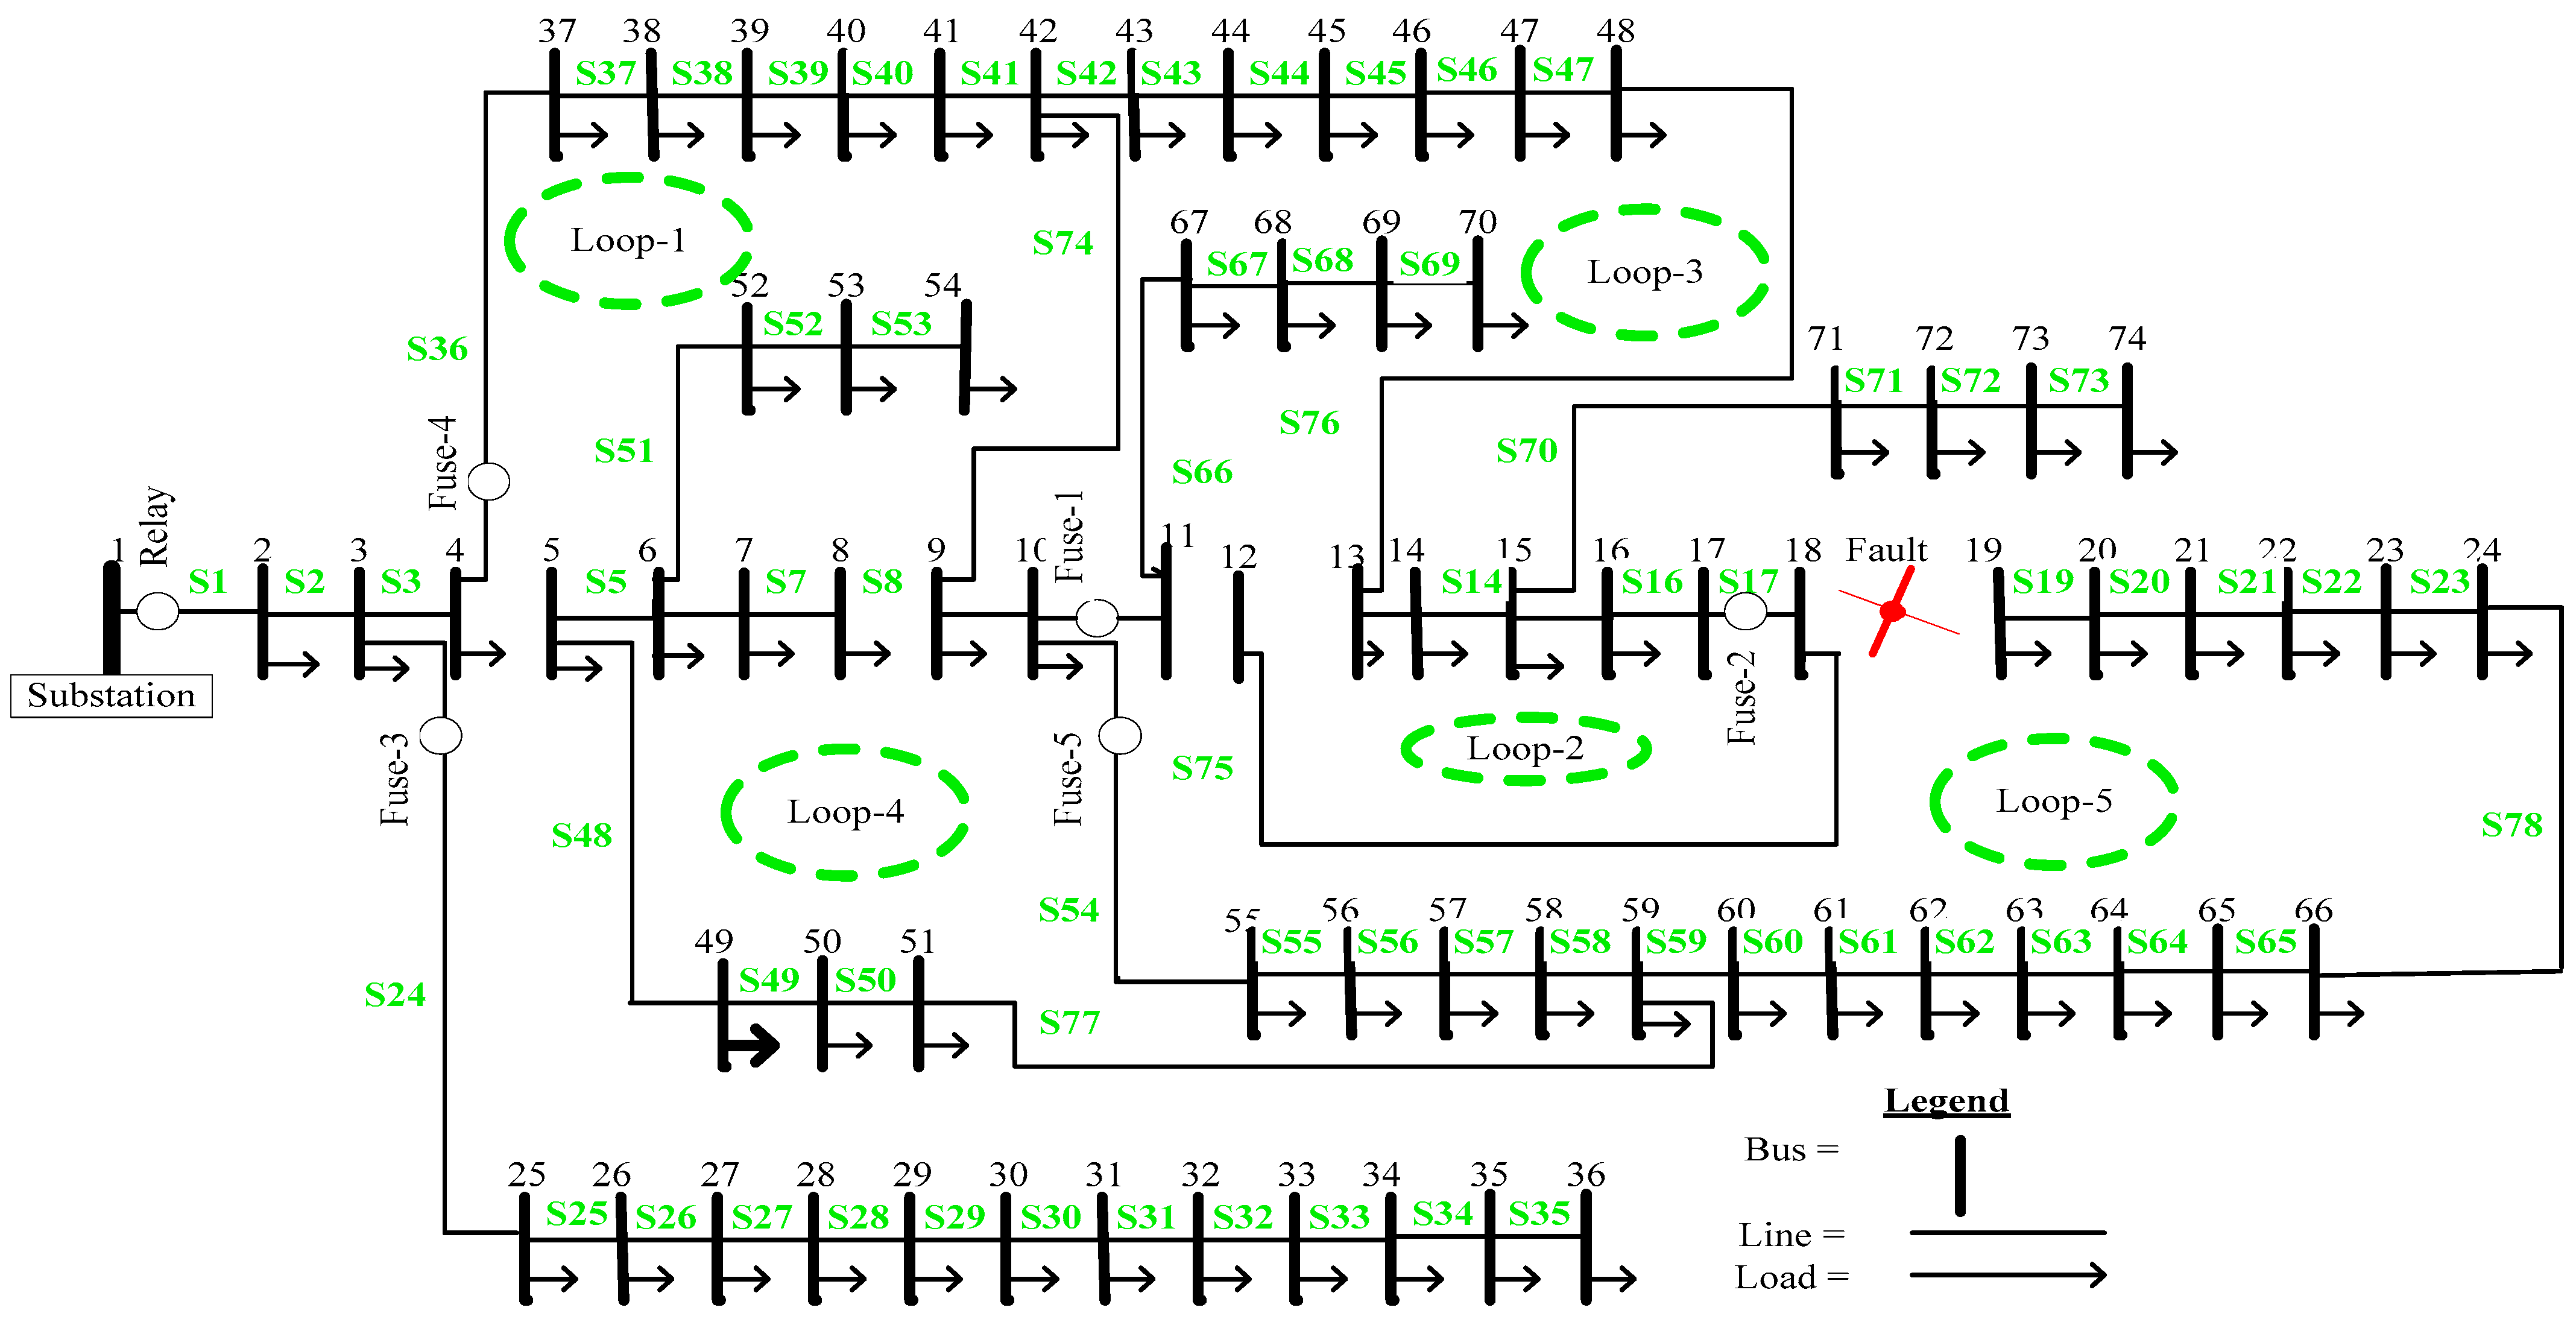
The status of protective devices for the optimal SR without protection constraints are further studied, and the values are summarized in Table 2. In this case, the restored network protective device operating conditions of fuses F1, F2, F3, and F5 operate in nominal loading and 25% overloading conditions. Conversely, in this case fuse F4 will operate and blow out with normal load currents. Thus, this causes power interruption in the distribution network downstream from fuse F4. As shown in Figure 4 below, fuse F4 is located in branch S36 and, due to the mal-function of this fuse, the loads with 968.9189 kW power connected from node 37 to node 48 will be shaded. The SR simulation result, presented in Figure 5, shows that the proposed method using TLBO is better than for DEV and PSO.
The protective devices should be selective and designed to sense the minimum fault current and not trip with a normal load current. Conversely, since some protective devices fail with a normal load current, the obtained distribution network topology is not feasible and cannot be considered as na optimal restored network. Thus, to prevent unwanted tripping of protective devices and to avoid protection blinding, considering a protection constraint in optimal service restoration has a great advantage.
At each protection zone, a three phase short circuit analysis was executed on FD-3 distribution networks. The results of fault currents at each protection zone and the corresponding protective devices’ time of operations are illustrated in Figure 6, Figure 7, Figure 8 and Figure 9. In order to permit the rest of the system to continue in service wherever possible, FD-3 distribution network protective devices have four separate protection zones, this can be individually protected and disconnected during the occurrence of a fault. The protection zones are the relay, fuse 1, and fuse 2 protection zone, relay and fuse 3 protection zone, relay and fuse 4 protection zone, and relay and fuse 5 protection zone. The fault currents and the corresponding time operation of each protective device are tabulated in Table 3.
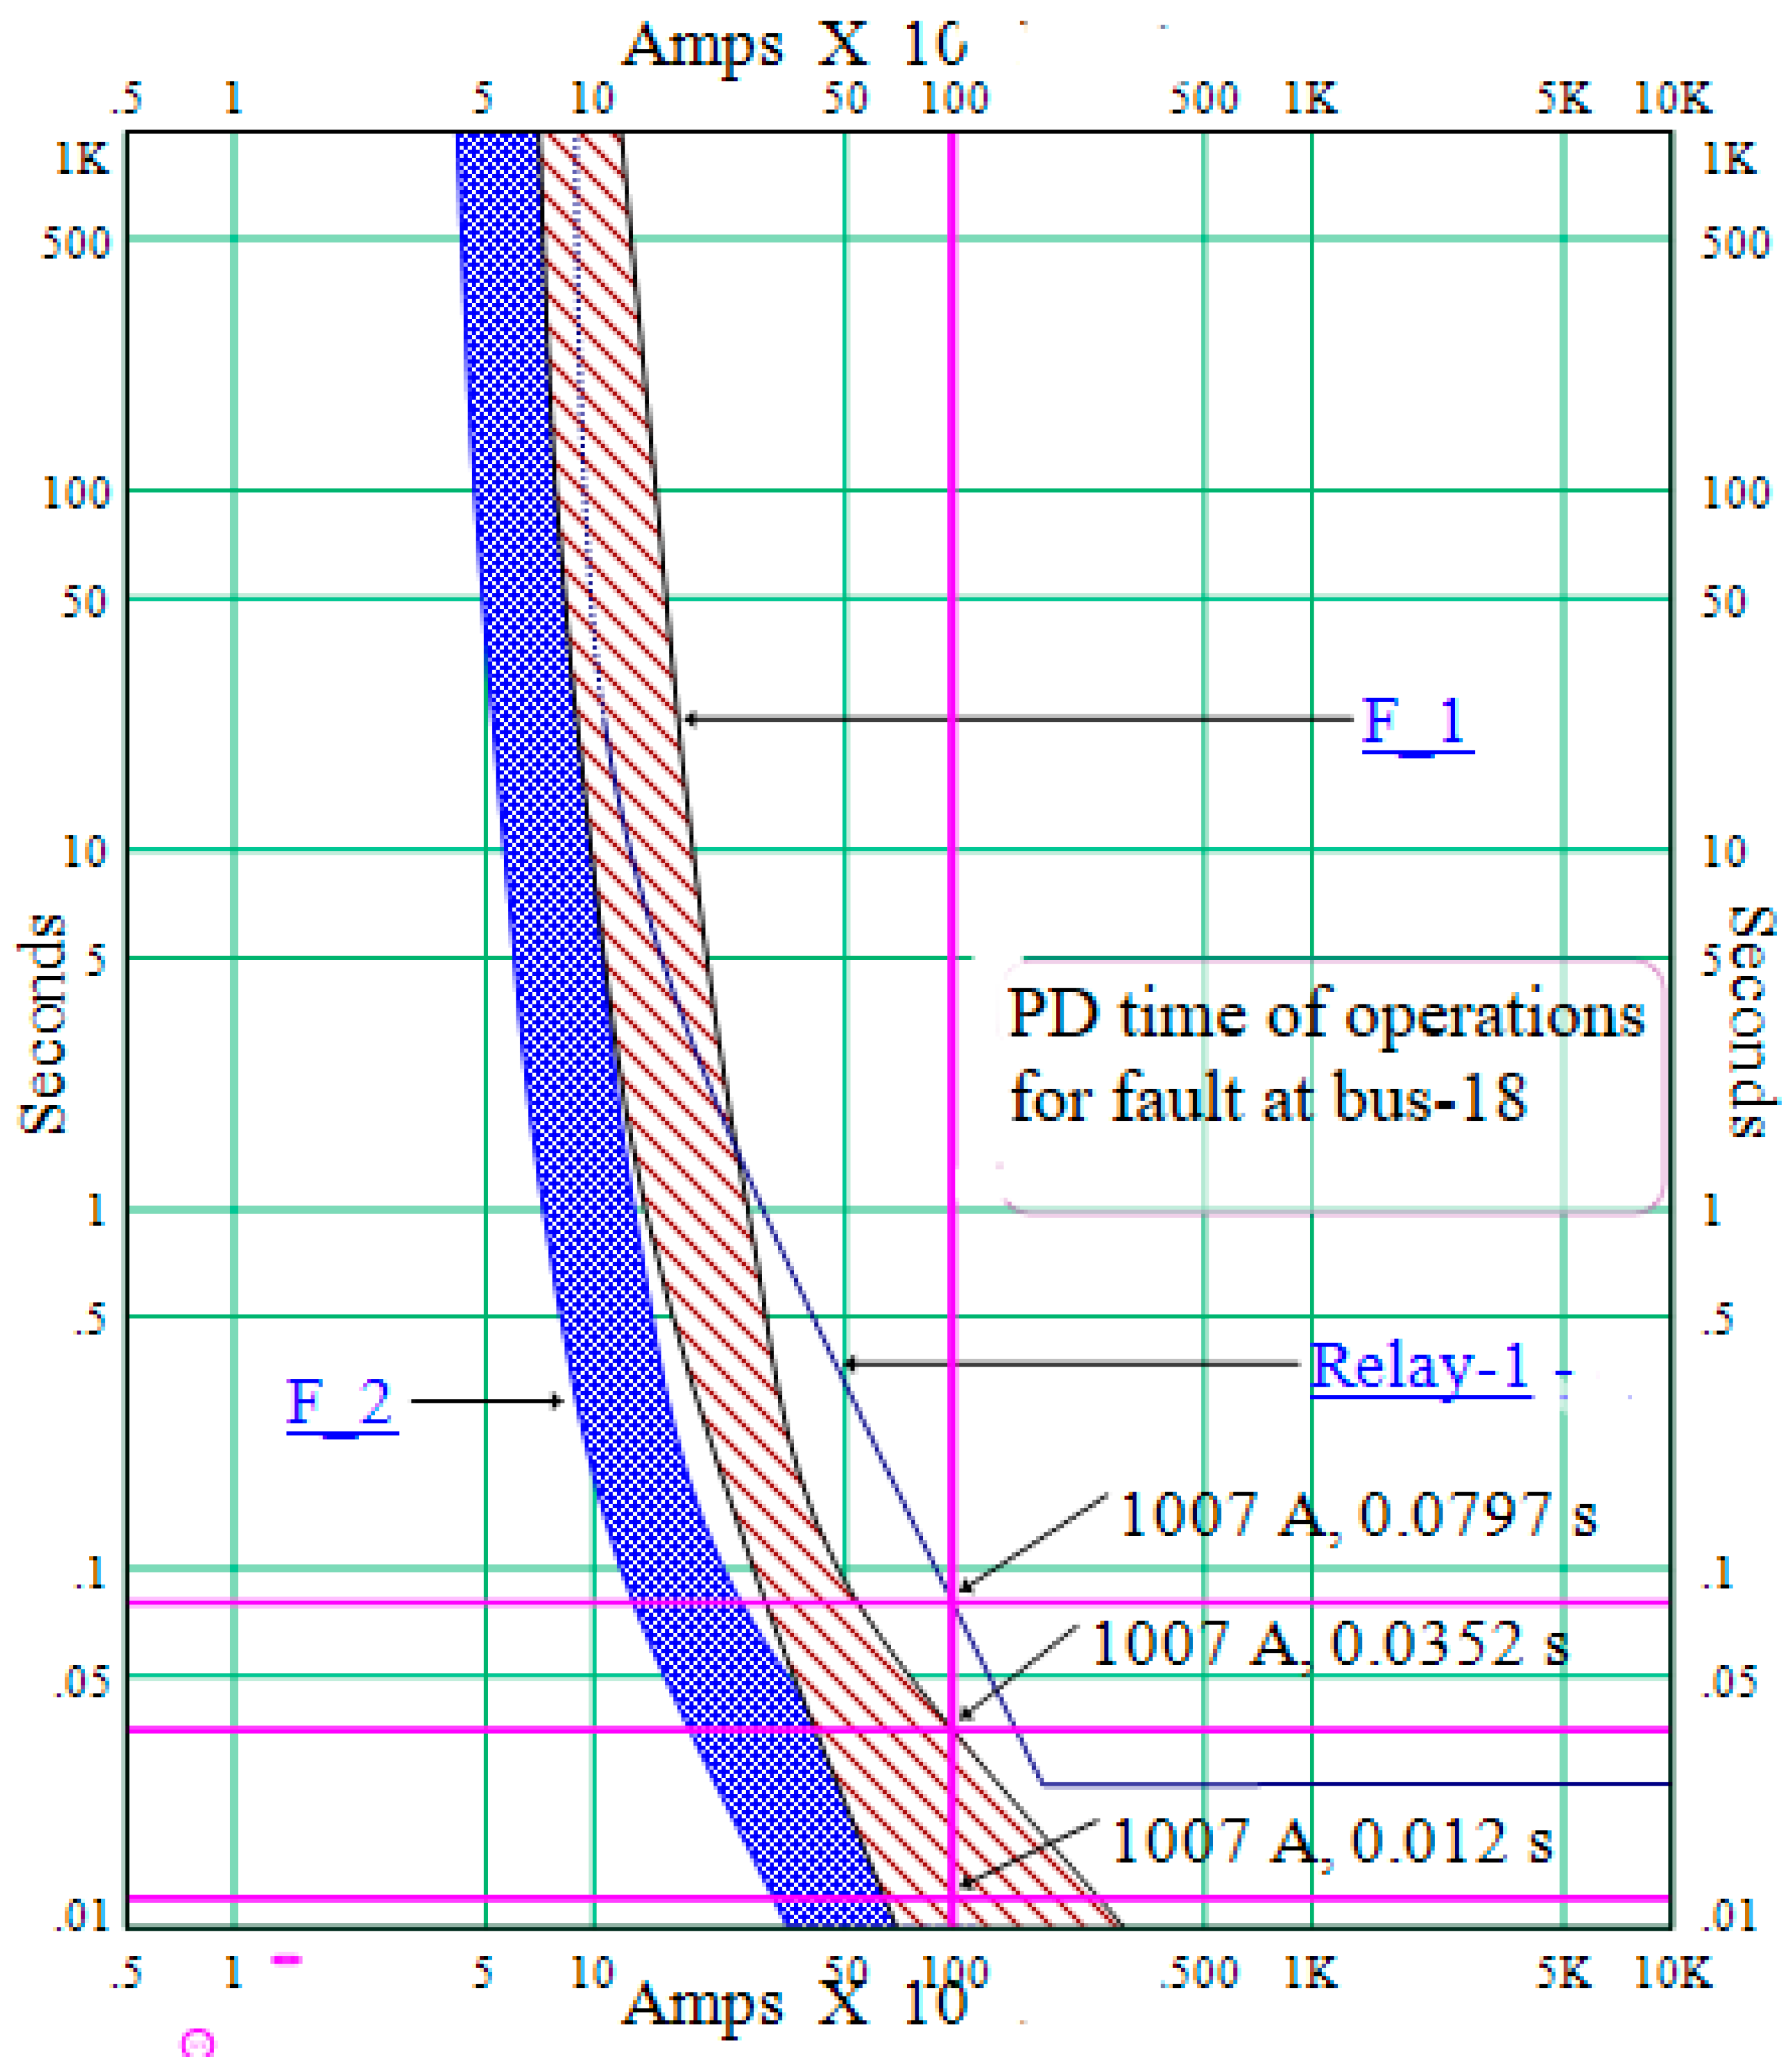
Figure 6 below shows the time current characteristic curves of the primary protection of fuse 1 and backup protection of fuse 2 and relay protection zones. For this protection zone, the three-phase-to-ground fault is executed on bus 18 and this fault current is 1007 ampers. For this fault current, the tripping times of fuse 1, fuse 2, and relay are 0.0352, 0.012 s, and 0.0797 s, respectively. As shown in Figure 4 below, the time of operation of protective devices is not within the fuse-to-fuse coordination criterion ranges.
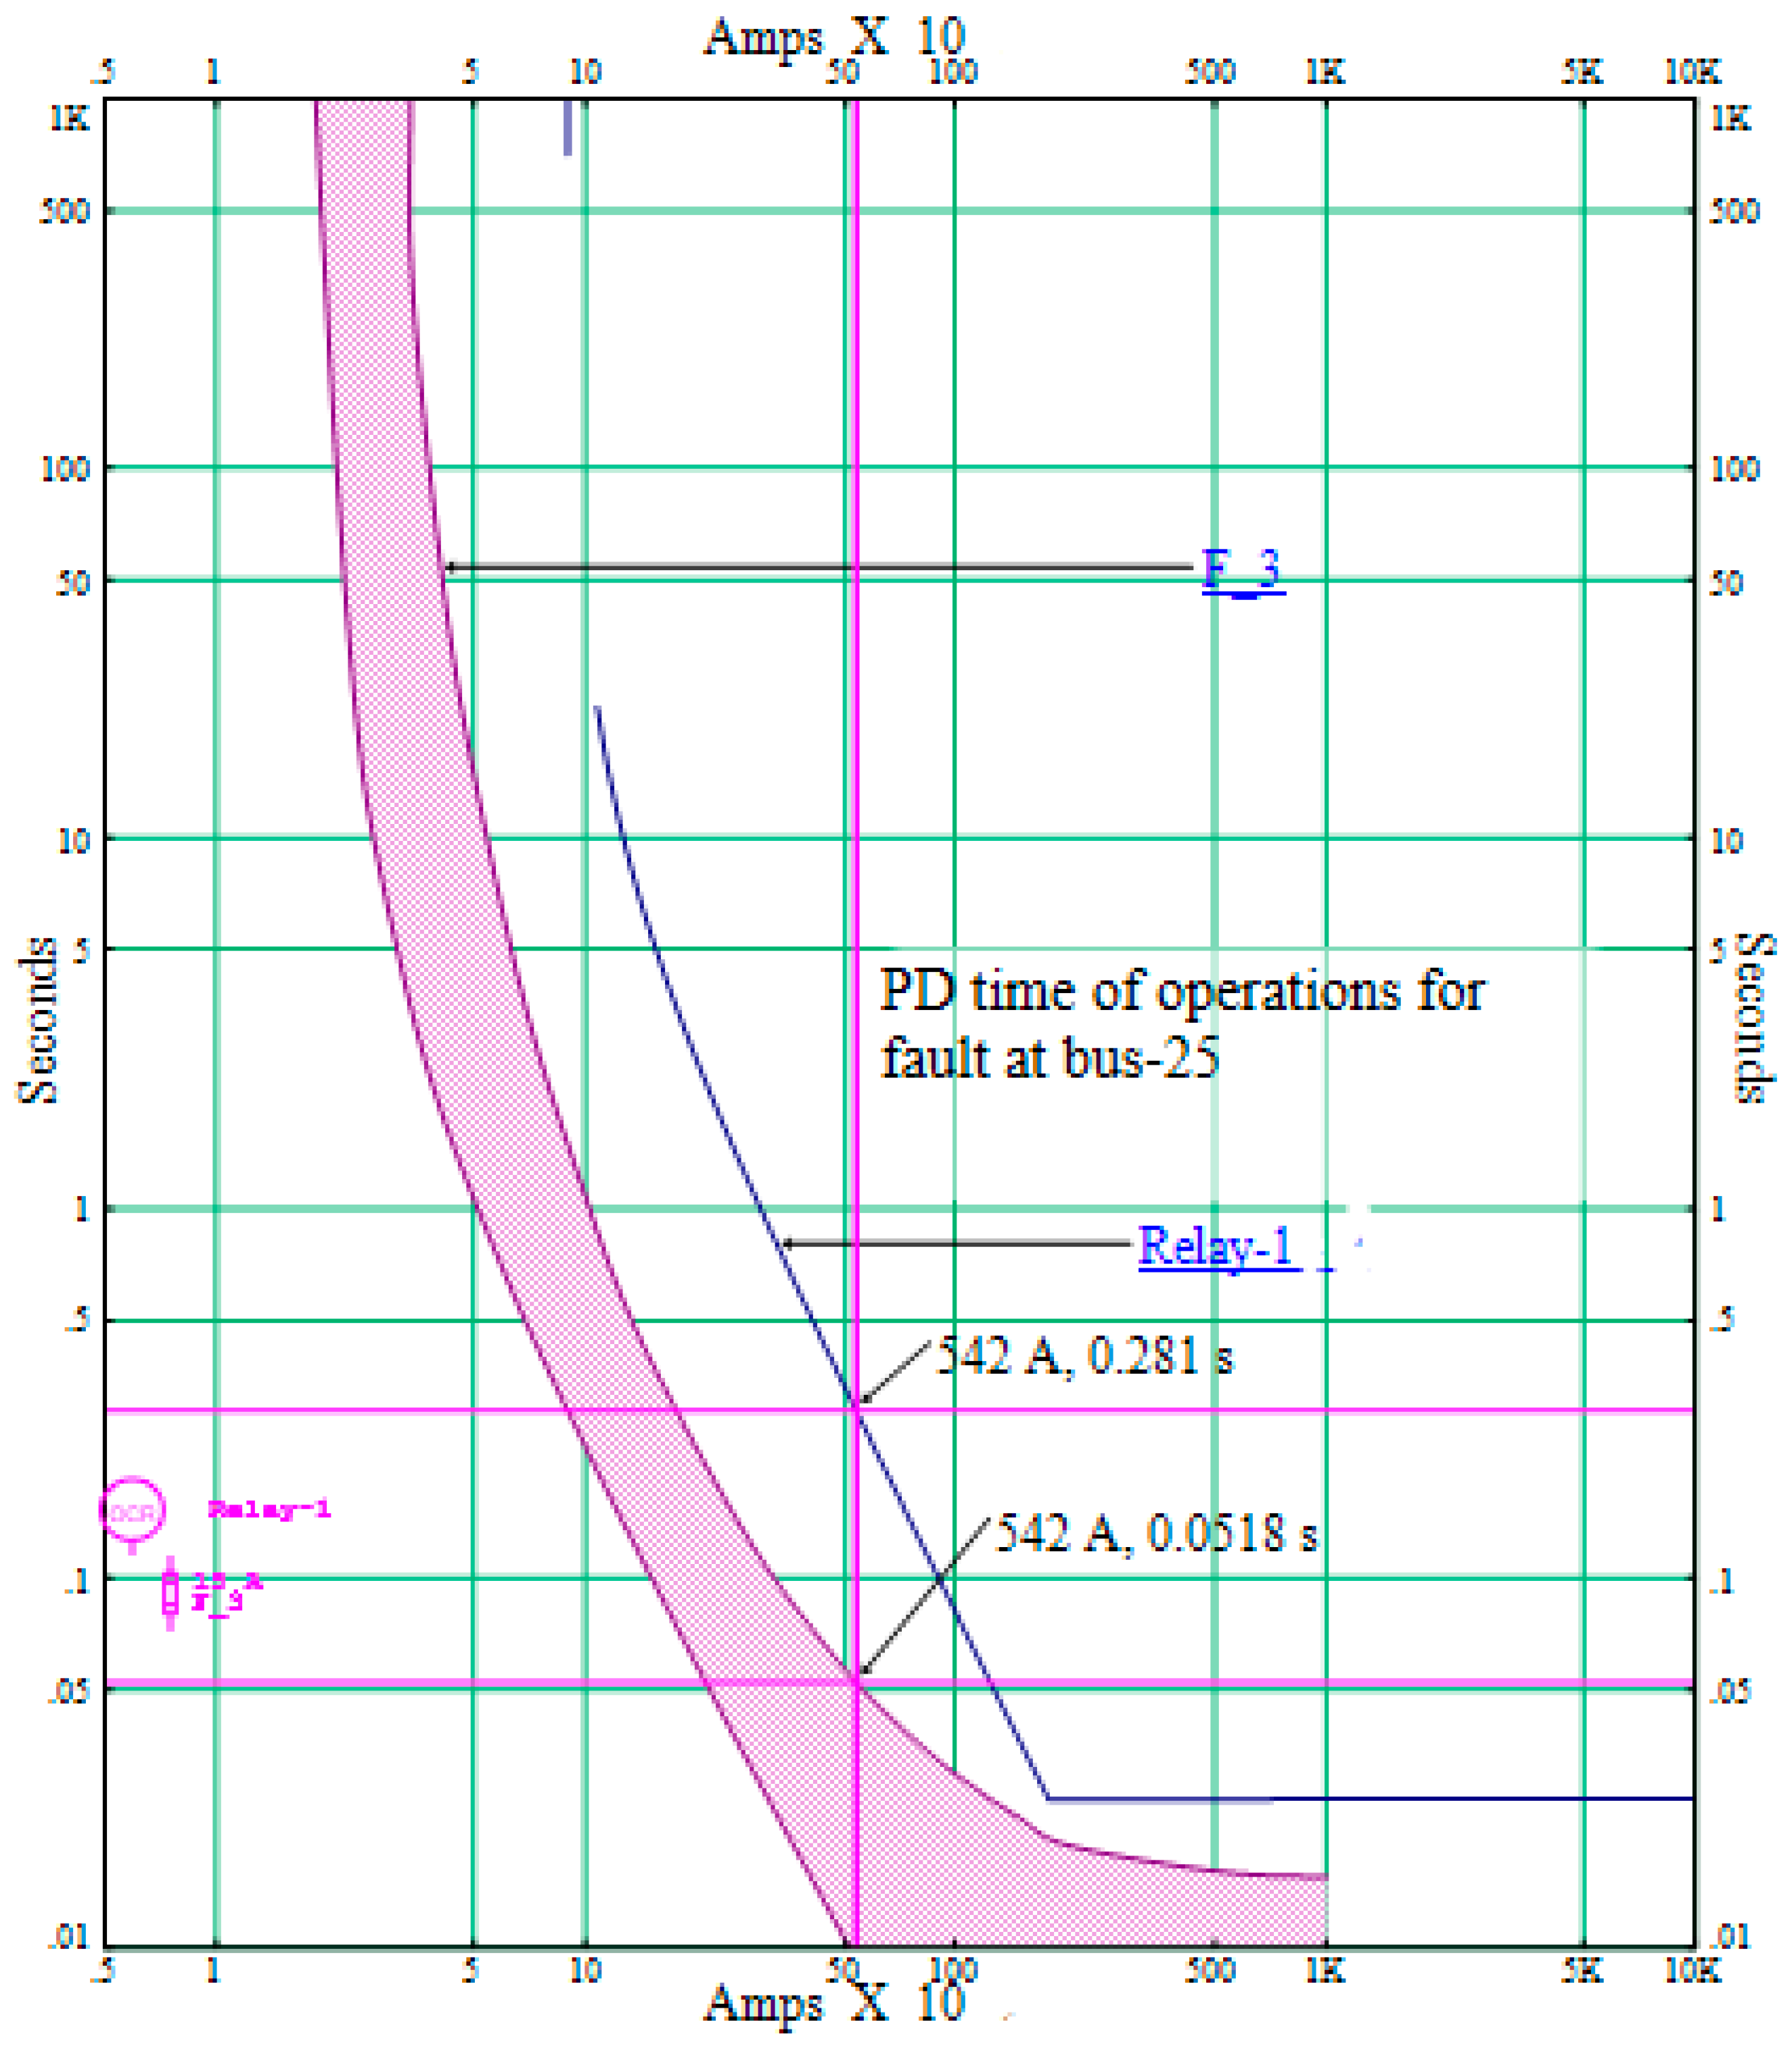
Figure 7 below shows the time current characteristic curves of the primary protection fuse 3 and backup protection of the relay. For this protection zone, the three-phase-to-ground fault is executed on bus 25 and this fault current is 542 ampers. For this fault current, the tripping times of fuse 3 and relay are 0.0518 s and 0.281 s, respectively. As shown in Figure 7 below, the time of operation of protective devices is within the range of the fuse-to-fuse coordination criterion.
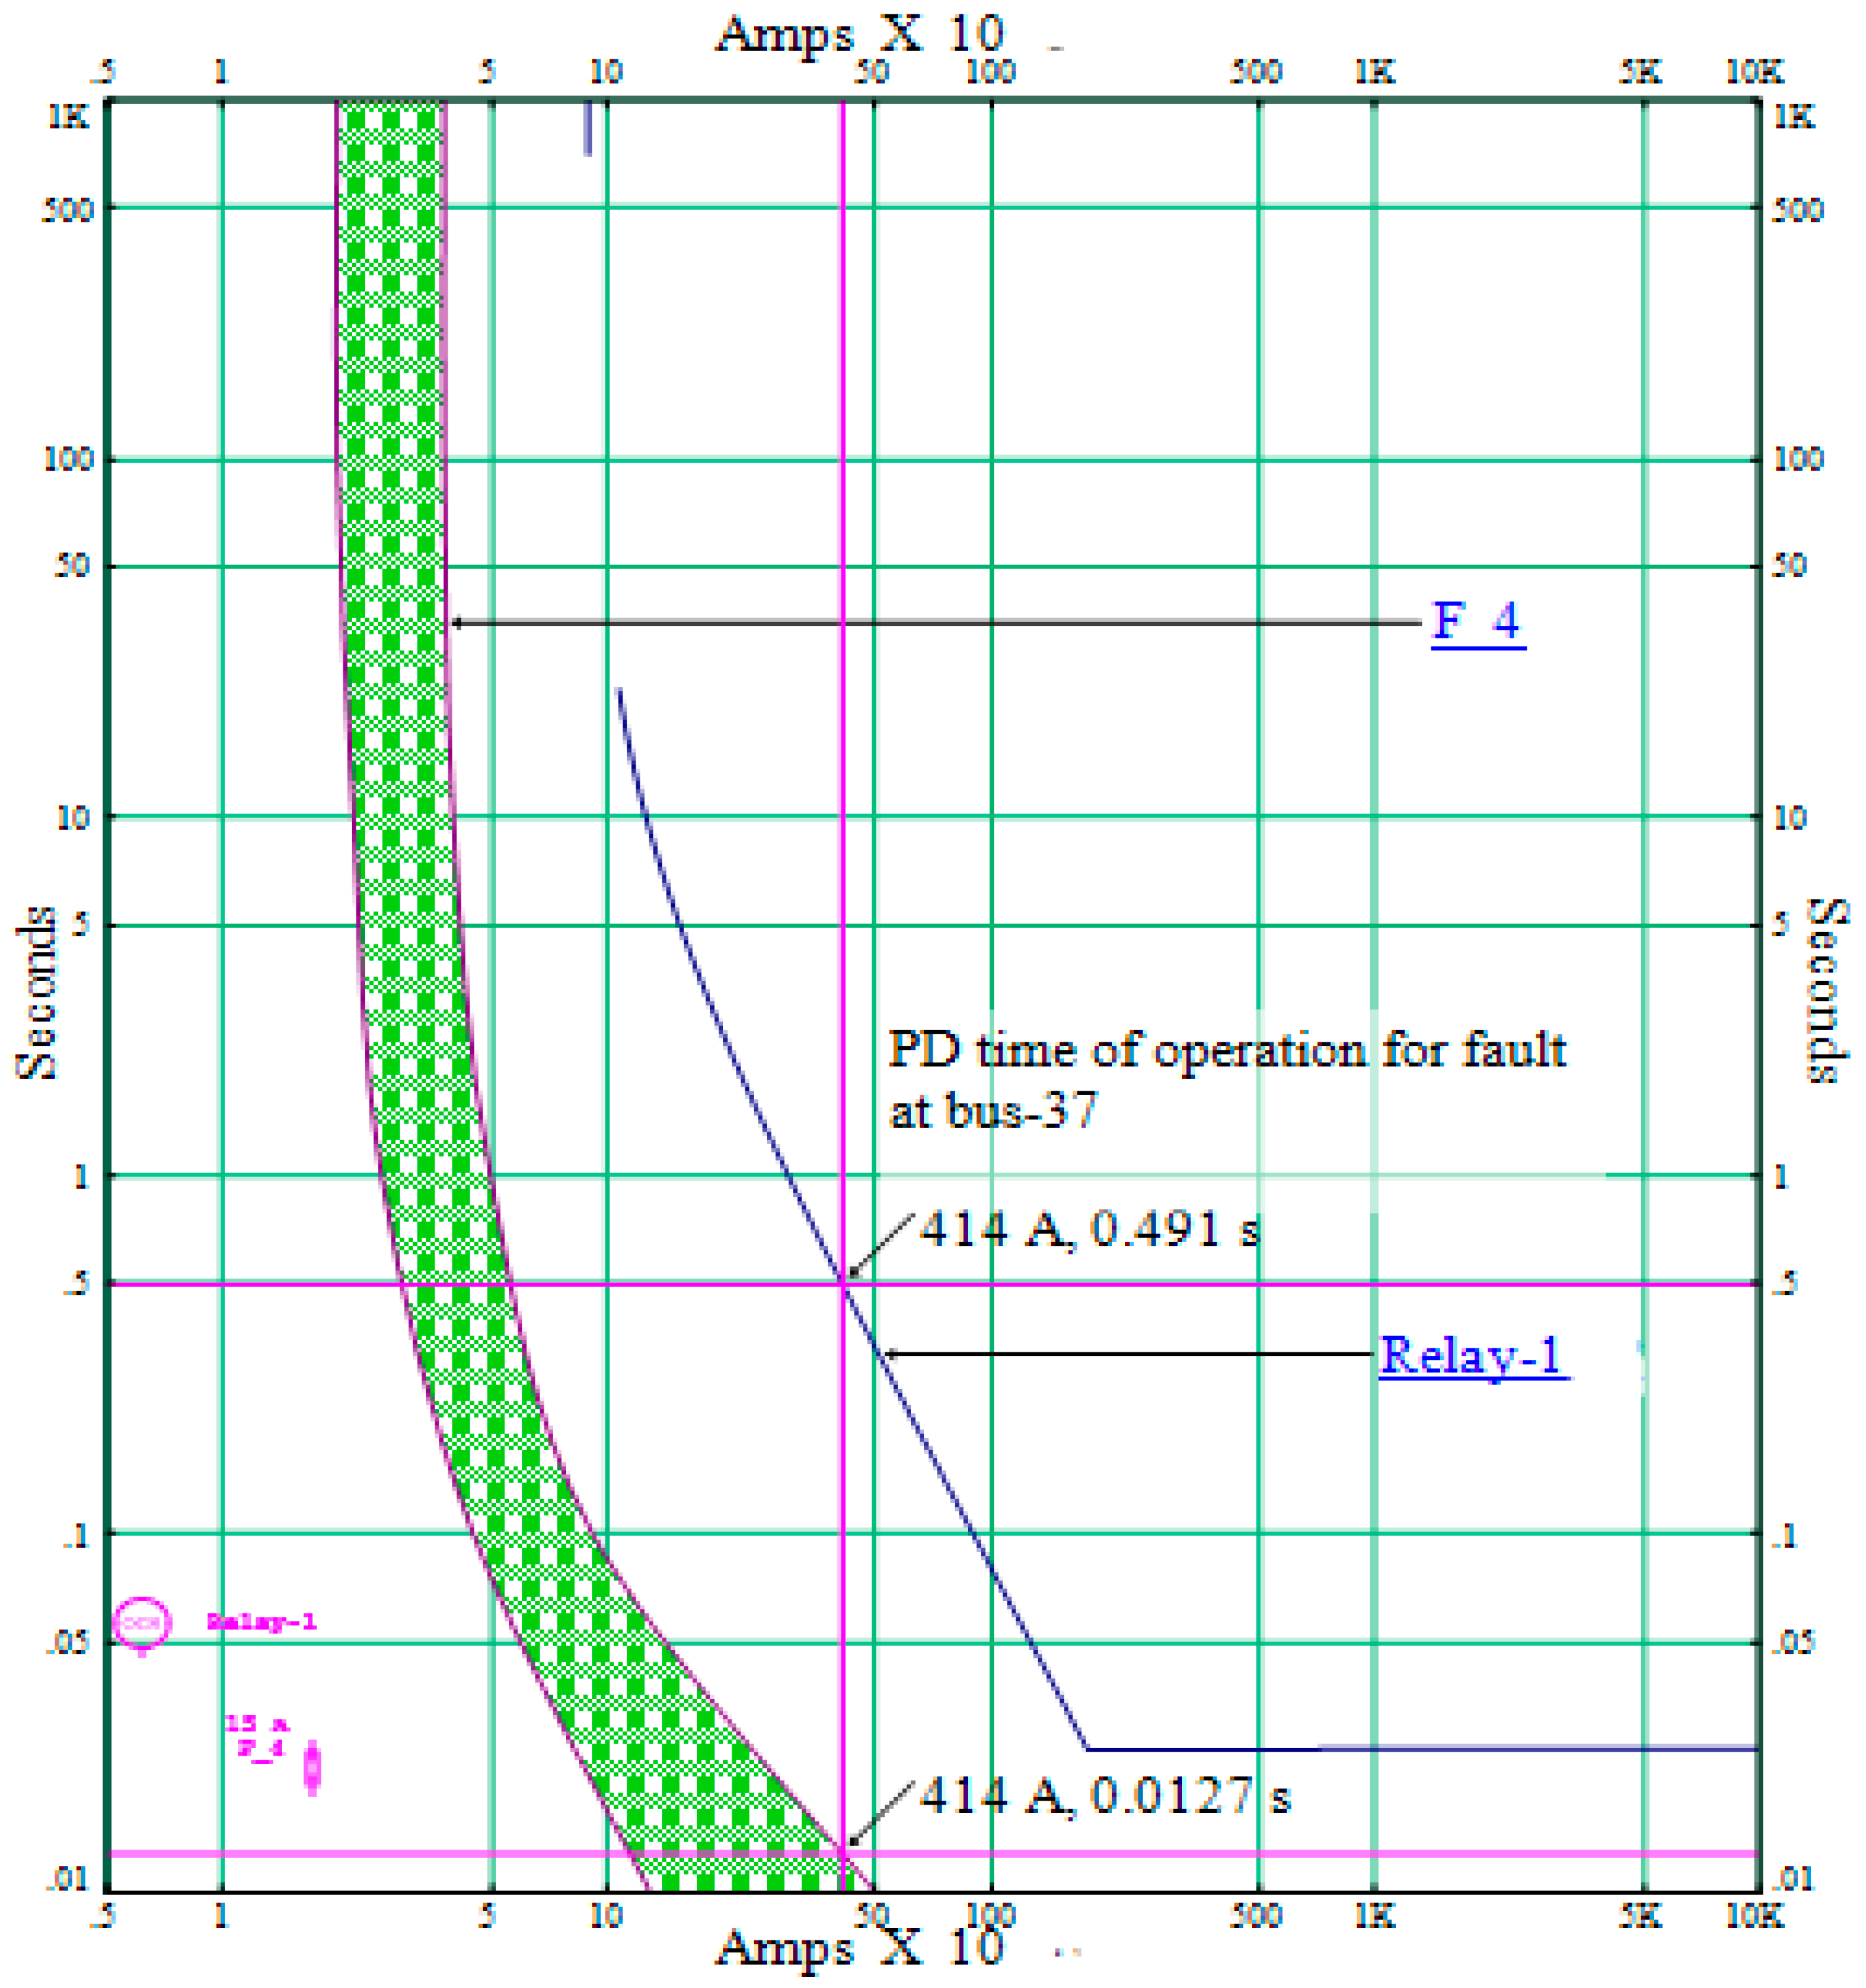
Figure 8 below shows the time current characteristic curves of the primary protection fuse 4 and backup protection of the relay. For this protection zone, the three-phase-to-ground fault is executed on bus 37 and this fault current is 414 ampers. For this fault current, the tripping times of fuse 4 and relay are 0.0127 s and 0.491 s, respectively. As shown in Figure 8 below, the time of operation of protective devices is within the range of the fuse-to-fuse coordination criterion.
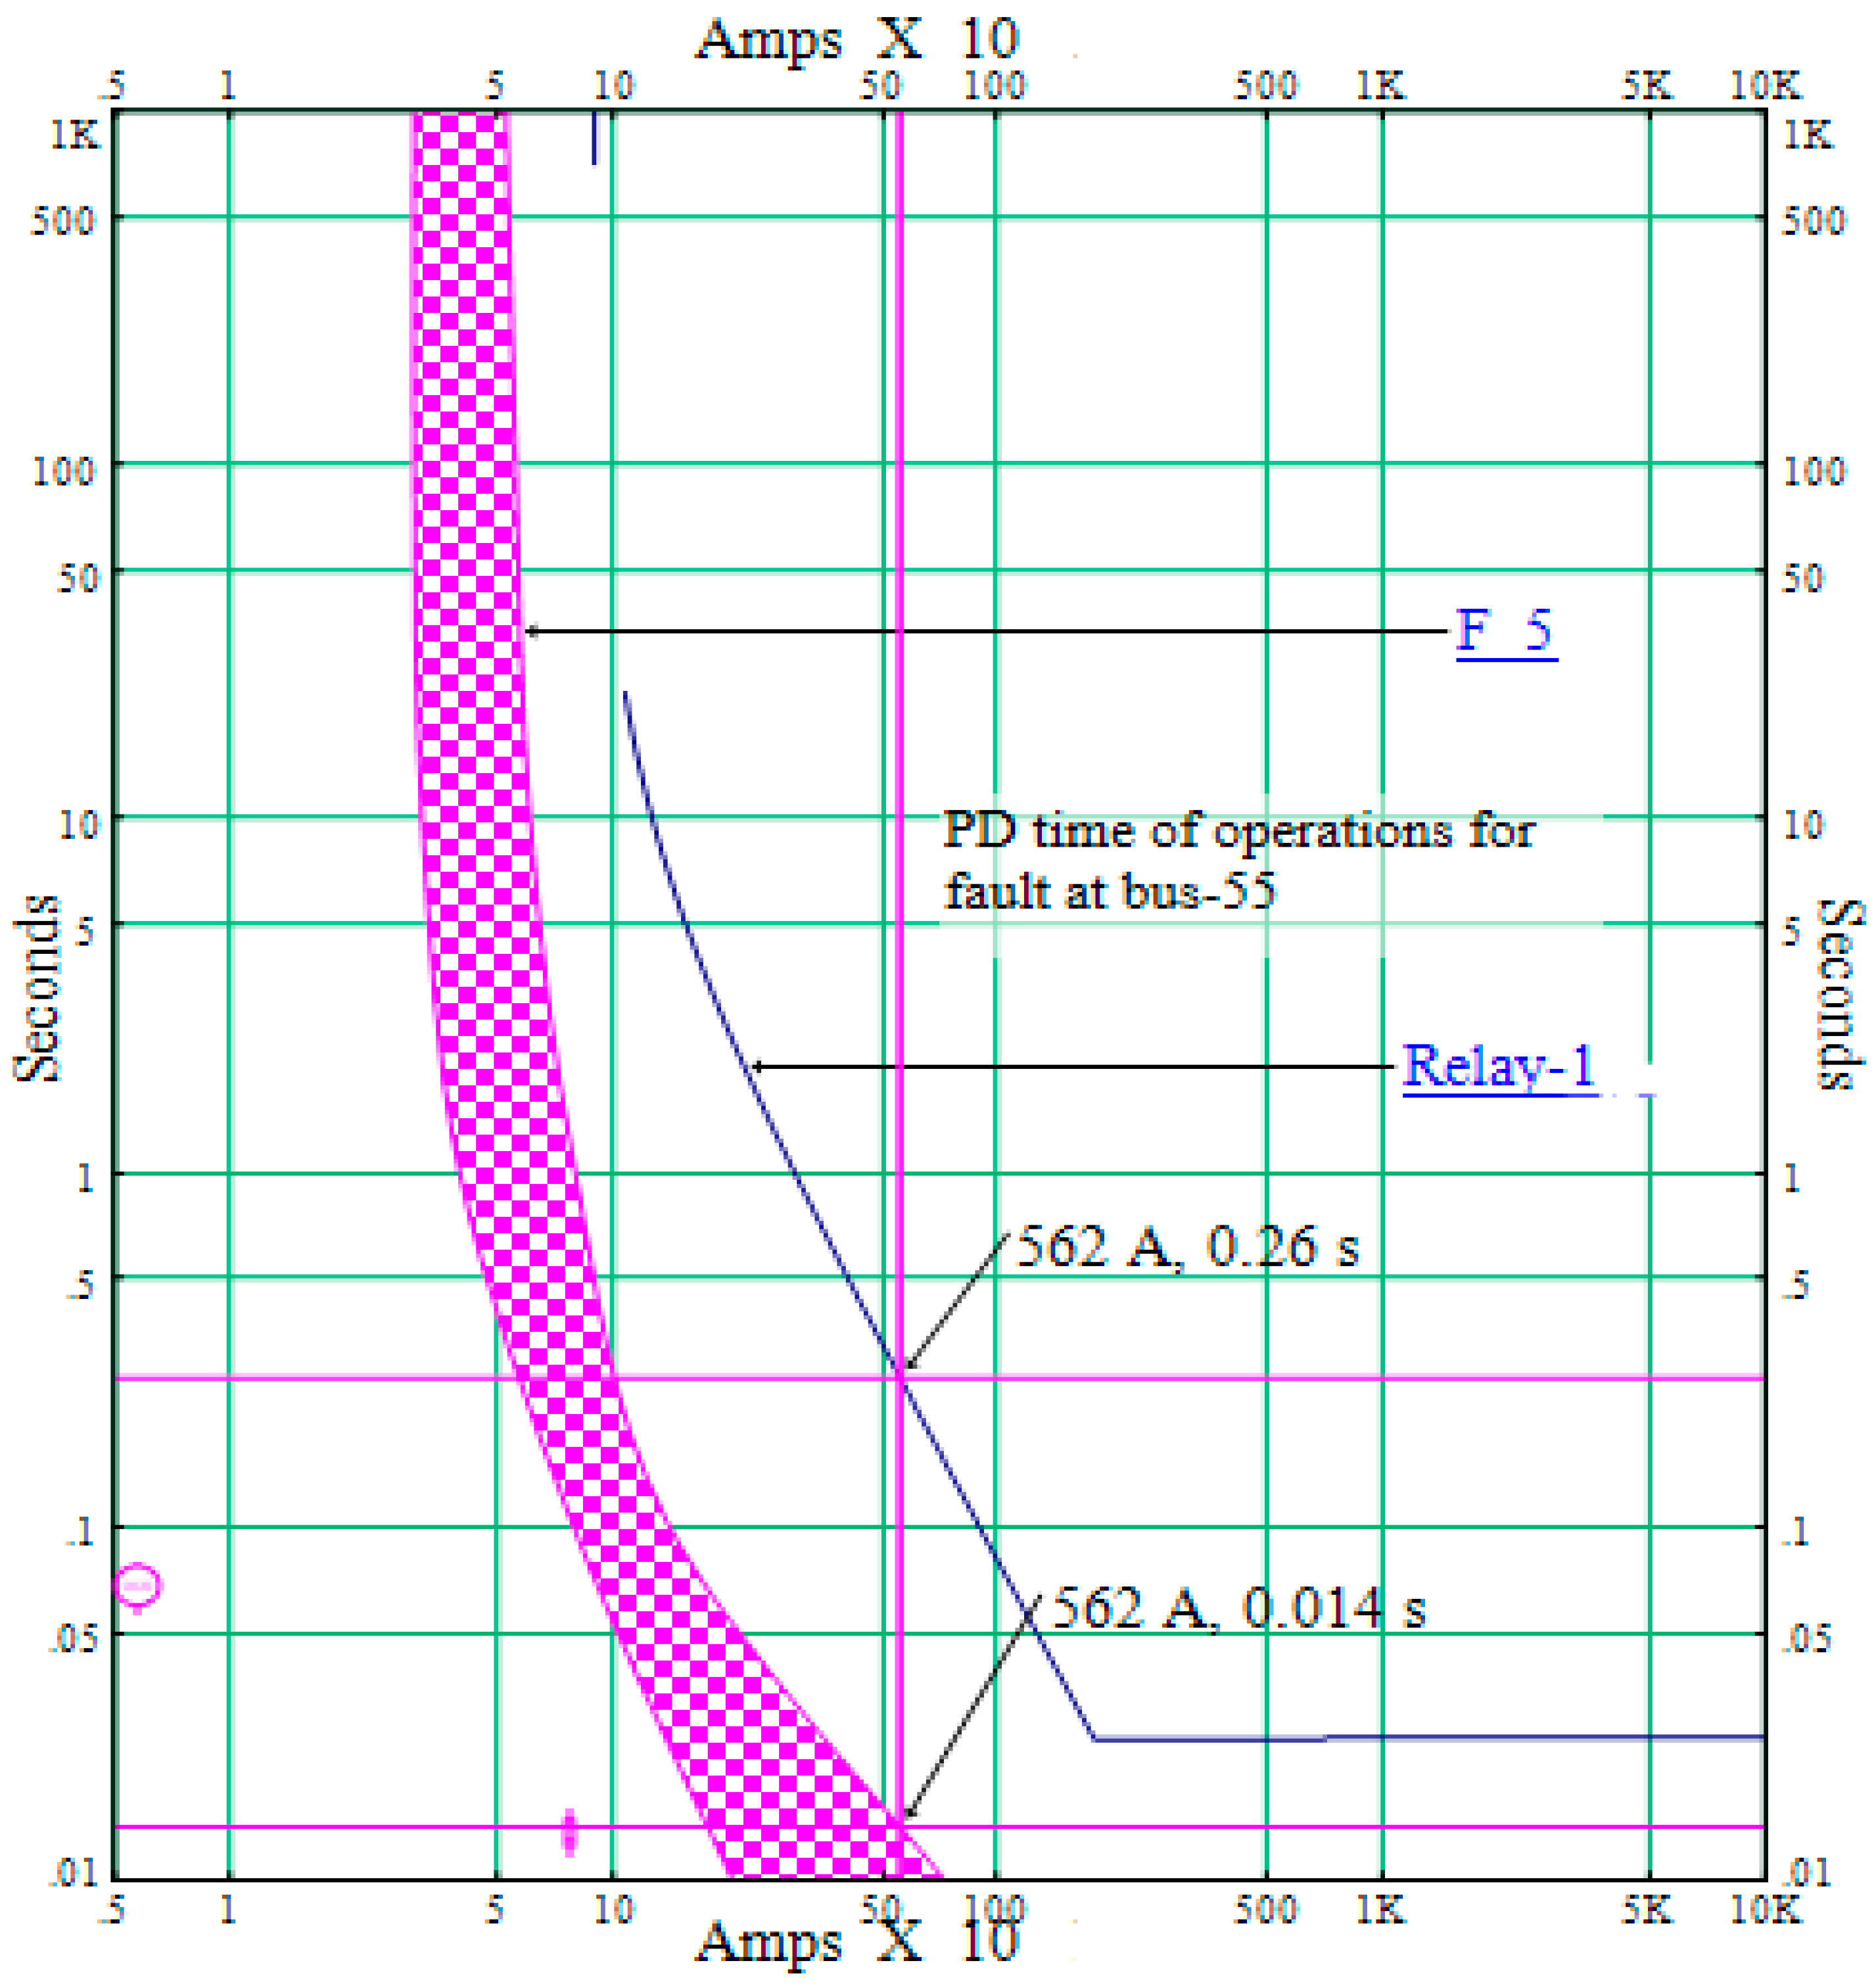
Figure 9 below shows the time current characteristic curves of the primary protection fuse 5 and backup protection of the relay. For this protection zone, the three-phase-to-ground fault is executed on bus 55 and this fault current is 562 ampers. For this fault current, the tripping times of fuse 5 and relay are 0.014 s and 0.26 s, respectively. As shown in Figure 9 below, the time of operation of protective devices is not within the range of the fuse-to-fuse coordination criterion.
In this case, the different protection zones are identified and in each zone of protection the operating times of protective device versus the fault currents are plotted. Figure 6, Figure 7, Figure 8 and Figure 9 show the restored network TCC graphs of protective devices in different protection zones. Conversely, since some protective devices fail with normal load currents, and the fuse 1, fuse 2, and relay protection zone coordination criterion is not satisfied, the obtained distribution network topology is not feasible and cannot be considered as an optimal restored network.
Case 2—SR for Single Fault Case Considering Protection Constraints
In this case, optimal service restorations are carried out by considering protection constraints. The optimal service restorations are accomplished by using TLBO, DEV, and PSO algorithms. In this case, except for the branch under fault, all healthy out-of-service branches were restored. The identified switch combinations to be opened at the final configuration using TLBO are S4, S14, S47, S18, and S48, those using DEV are S37, S75, S76, S18, and S77, and those using PSO are S40, S17, S46, S18, and S56. The Figure 10 shows the restored network configuration using TLBO algorithms.
The simulation results of case two are tabulated in Table 4 and the result shows that the power losses are increased as compared with case one. This is expected because considering protection constraints in service restoration problems may eliminate some switch combinations. Nevertheless, a high power loss reduction is obtained as compared to the existing/base case simulation results. The results support the need to perform service restoration to enhance the network distribution performance.
After executing the proposed TLBO, DEV, and PSO algorithms, active power losses were reduced by 69.932%, 54.5025%, and 62.4515%, respectively, and reactive power losses were reduced by 67.8776%, 54.6055%, and 63.8157%, respectively. The SR simulation result in Figure 11, shows that the suggested method using TLBO is better than with DEV and PSO.
The statuses of protective devices are tabulated in Table 5 below, and all the protective devices are operating well in normal and 25% overloading conditions.
The fault currents and the corresponding time operation of each protective device are tabulated in Table 6. In this case, the operation and the protection constraints are satisfied and real distribution network performance enhancement is feasible. In each protection zone, all protective devices can sense the minimum fault currents and the coordination criterion are satisfied.
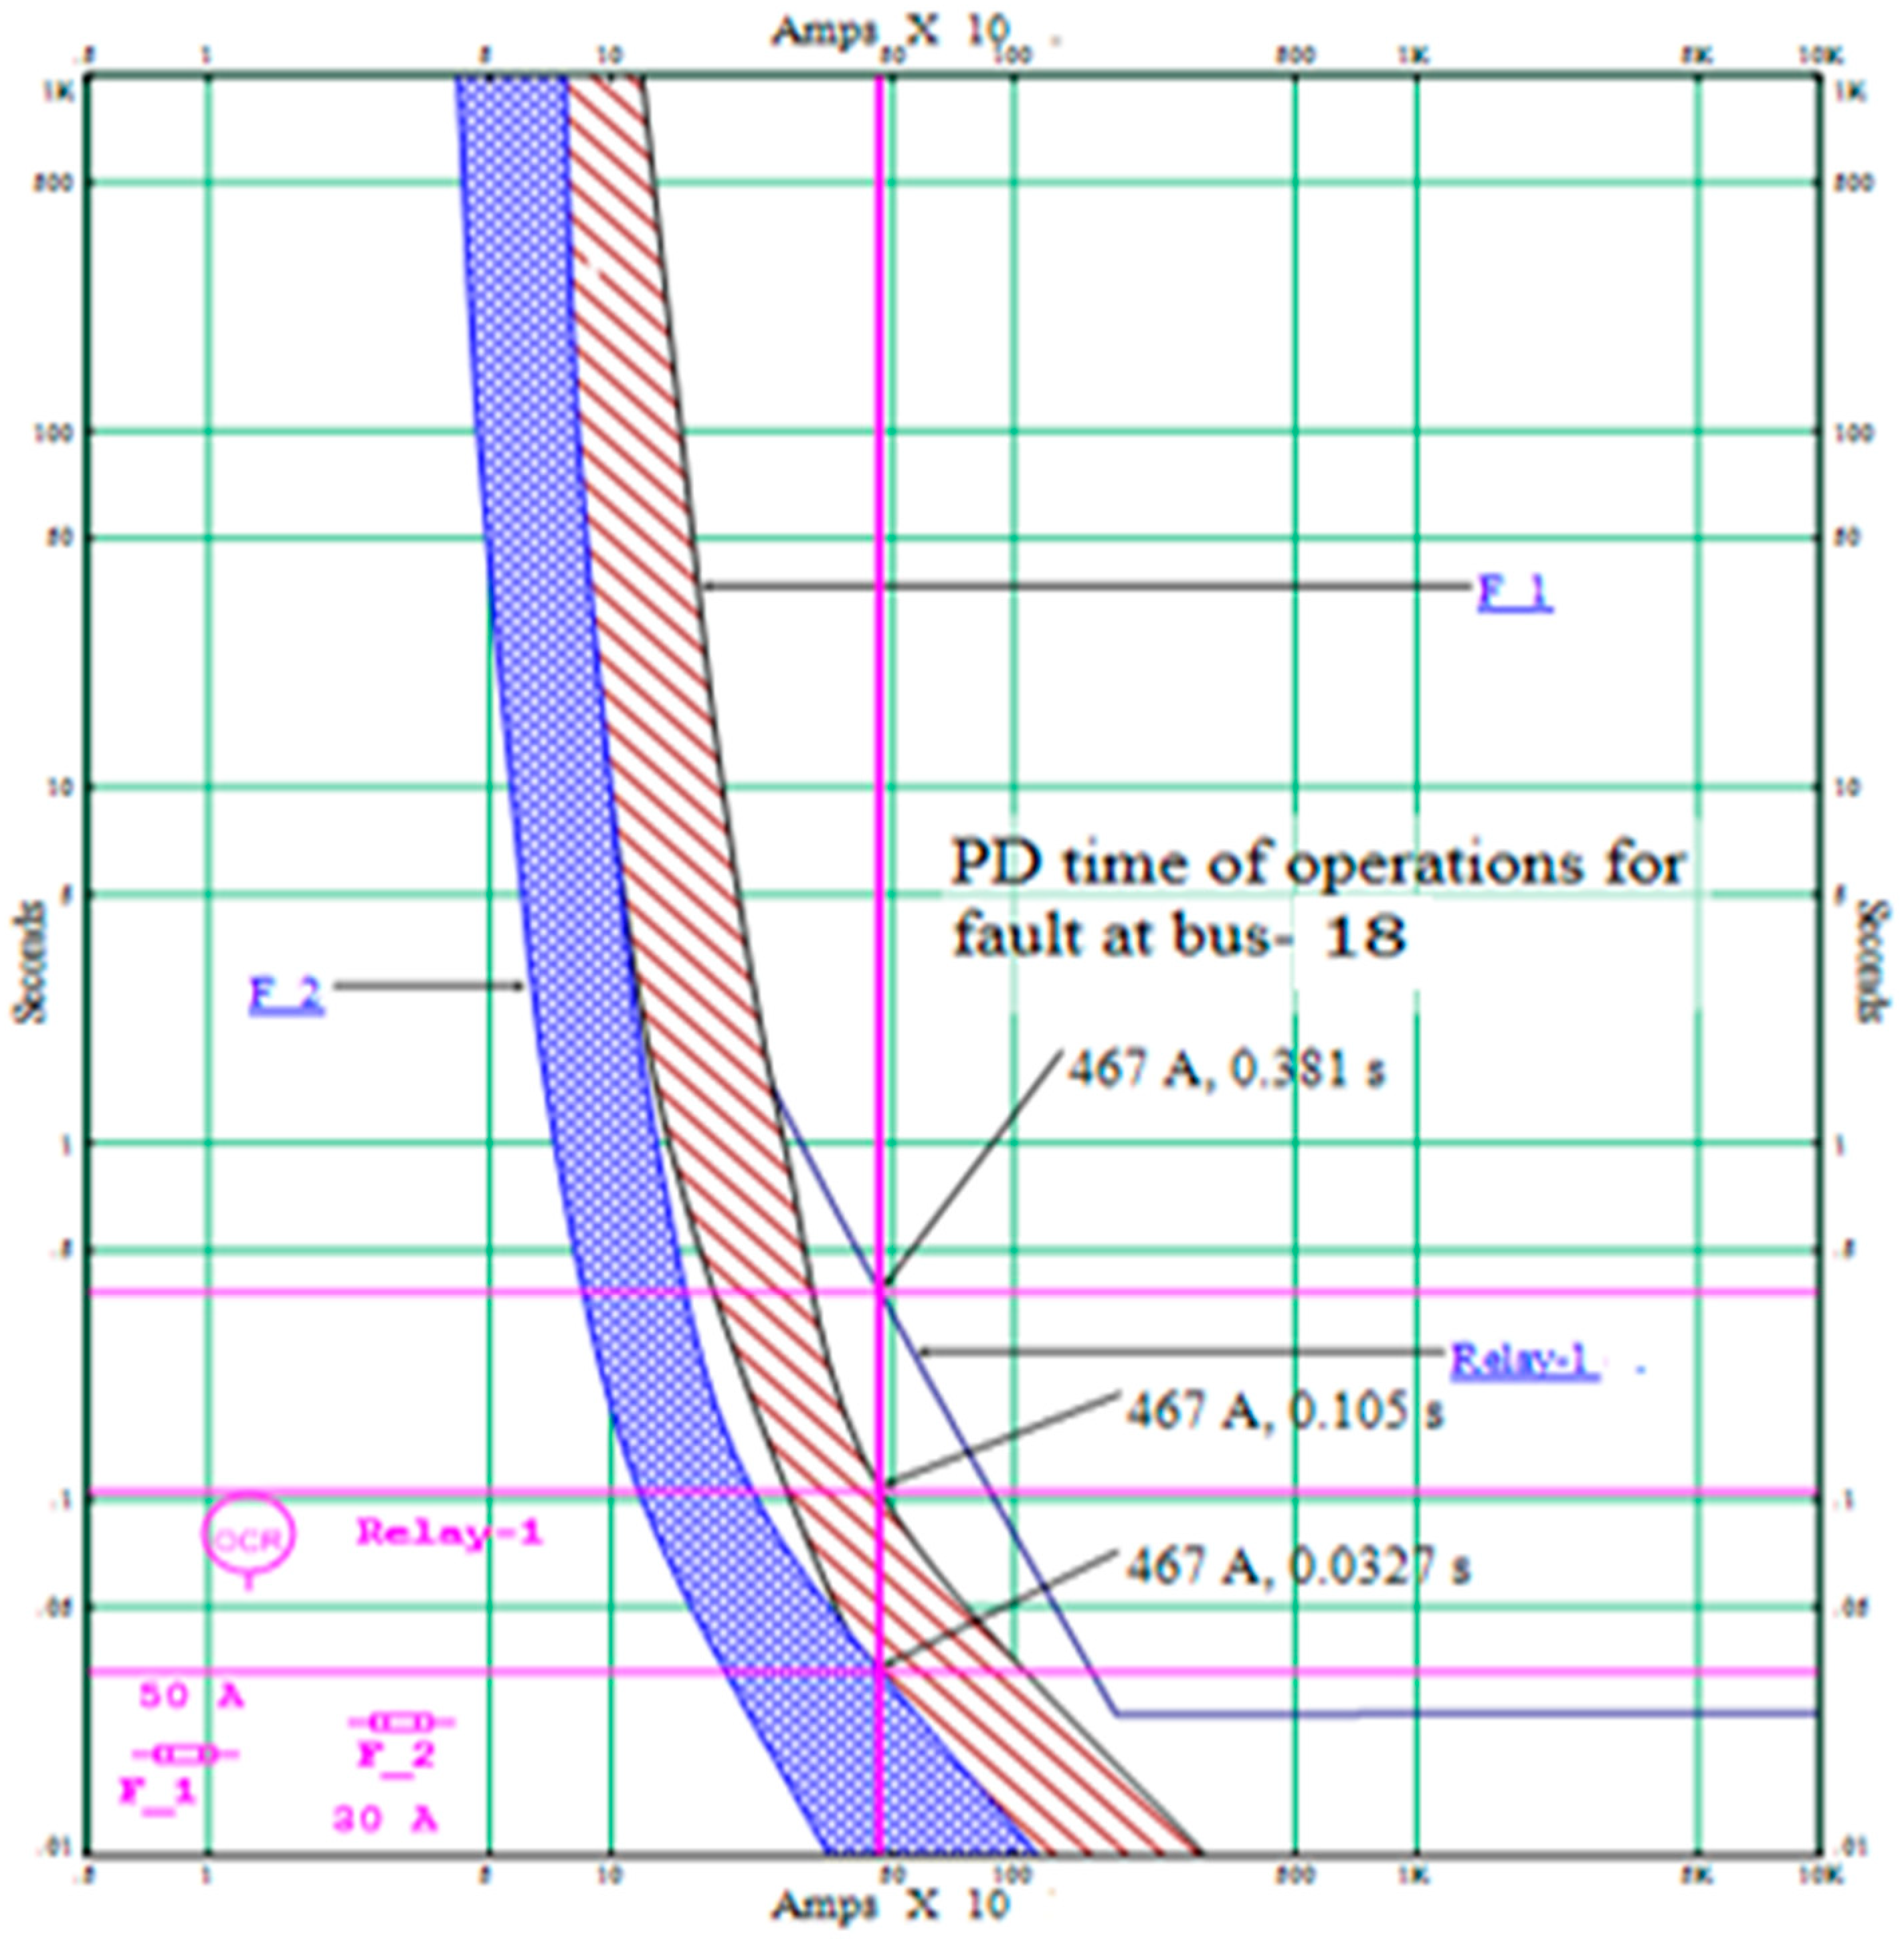
Figure 12 below shows the time current characteristic curves of the primary protection fuse 1 and backup protection of fuse 2 and relay. For this protection zone, the three-phase-to-ground fault is executed on bus 18 and this fault current is 467 ampers. For this fault current, the tripping times of fuse 1, fuse 2, and relay are 0.105 s, 0.0327 s, and 0.381 s, respectively. As shown in Figure 12 below, the time of operation of protective devices is within the range of the protective device coordination criterion.
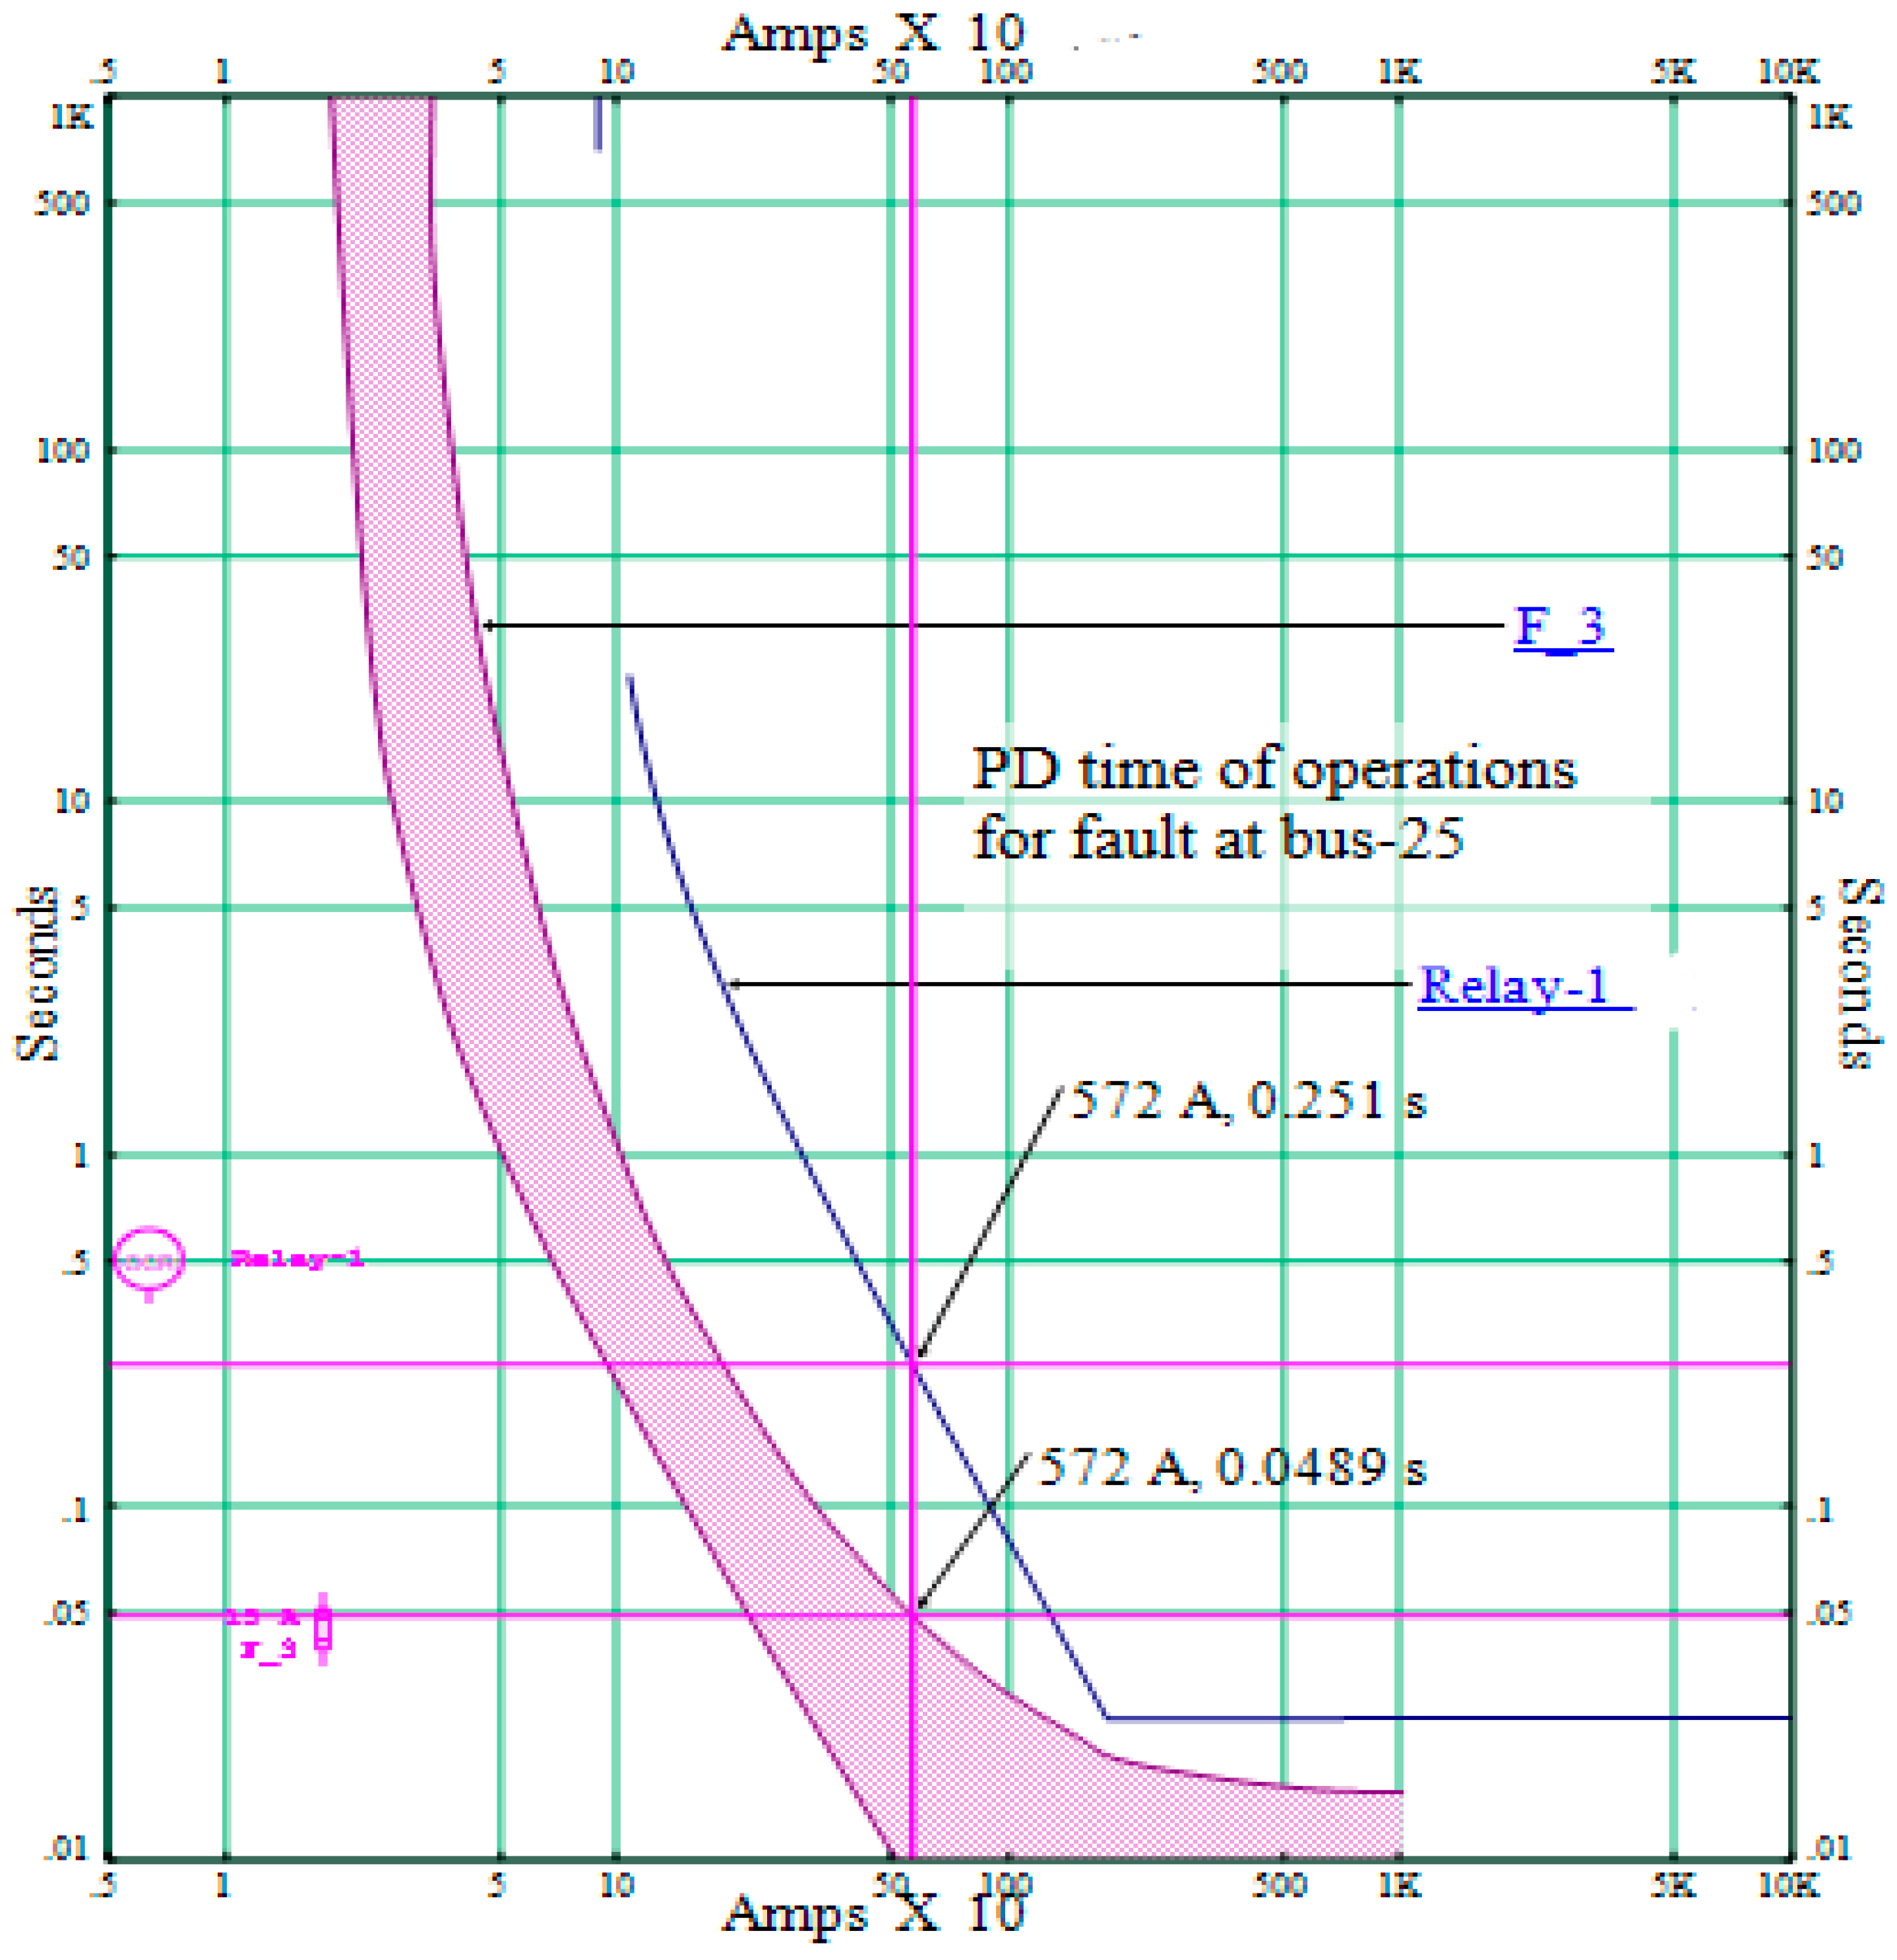
Figure 13 below shows the time current characteristic curves of the primary protection fuse 3 and backup protection of the relay. For this protection zone, the three-phase-to-ground fault is executed on bus 25 and this fault current is 572 ampers. For this fault current, the tripping times of fuse 3 and relay are 0.0489 s and 0.251 s, respectively. As shown in Figure 13 below, the time of operation of protective devices is within the range of the protective device coordination criterion.
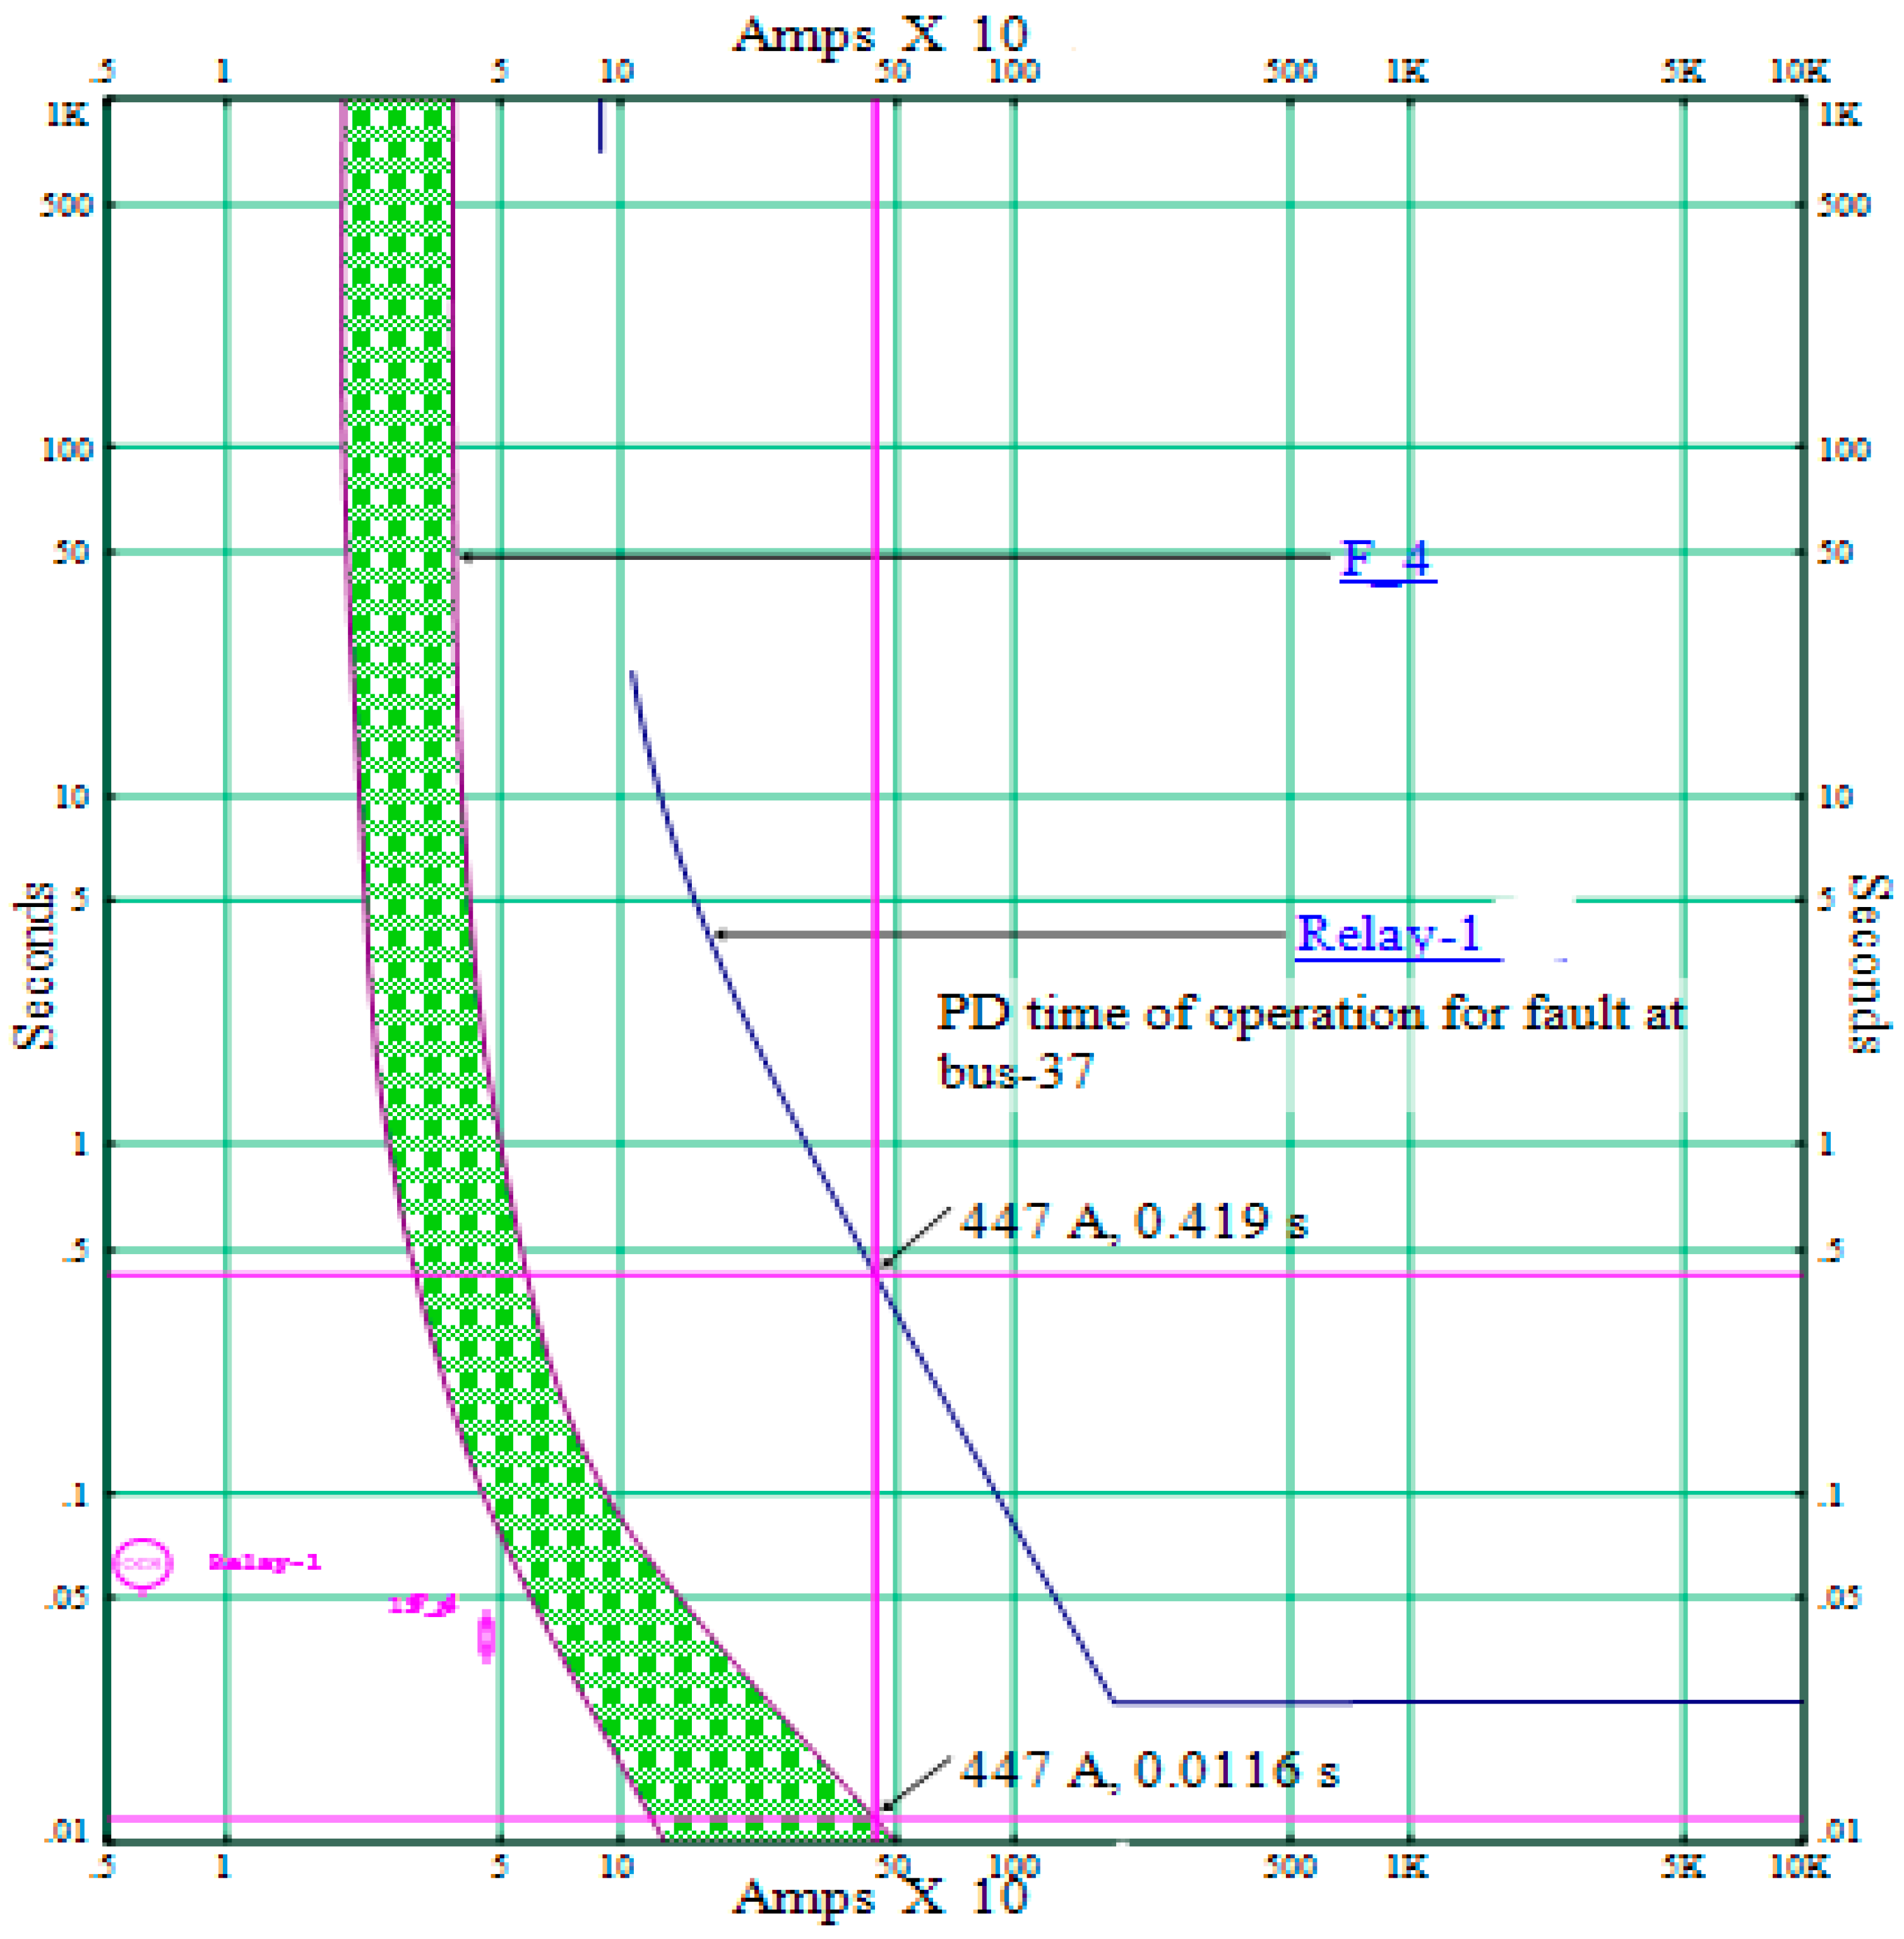
Figure 14 below shows the time current characteristic curves of the primary protection fuse 4 and backup protection of the relay. For this protection zone, the three-phase-to-ground fault is executed on bus 37 and this fault current is 447 ampers. For this fault current, the tripping times of fuse 4 and relay are 0.01116 s and 0.419 s, respectively. As shown in Figure 14 below, the time of operation of protective devices is within the range of the protective device coordination criterion.
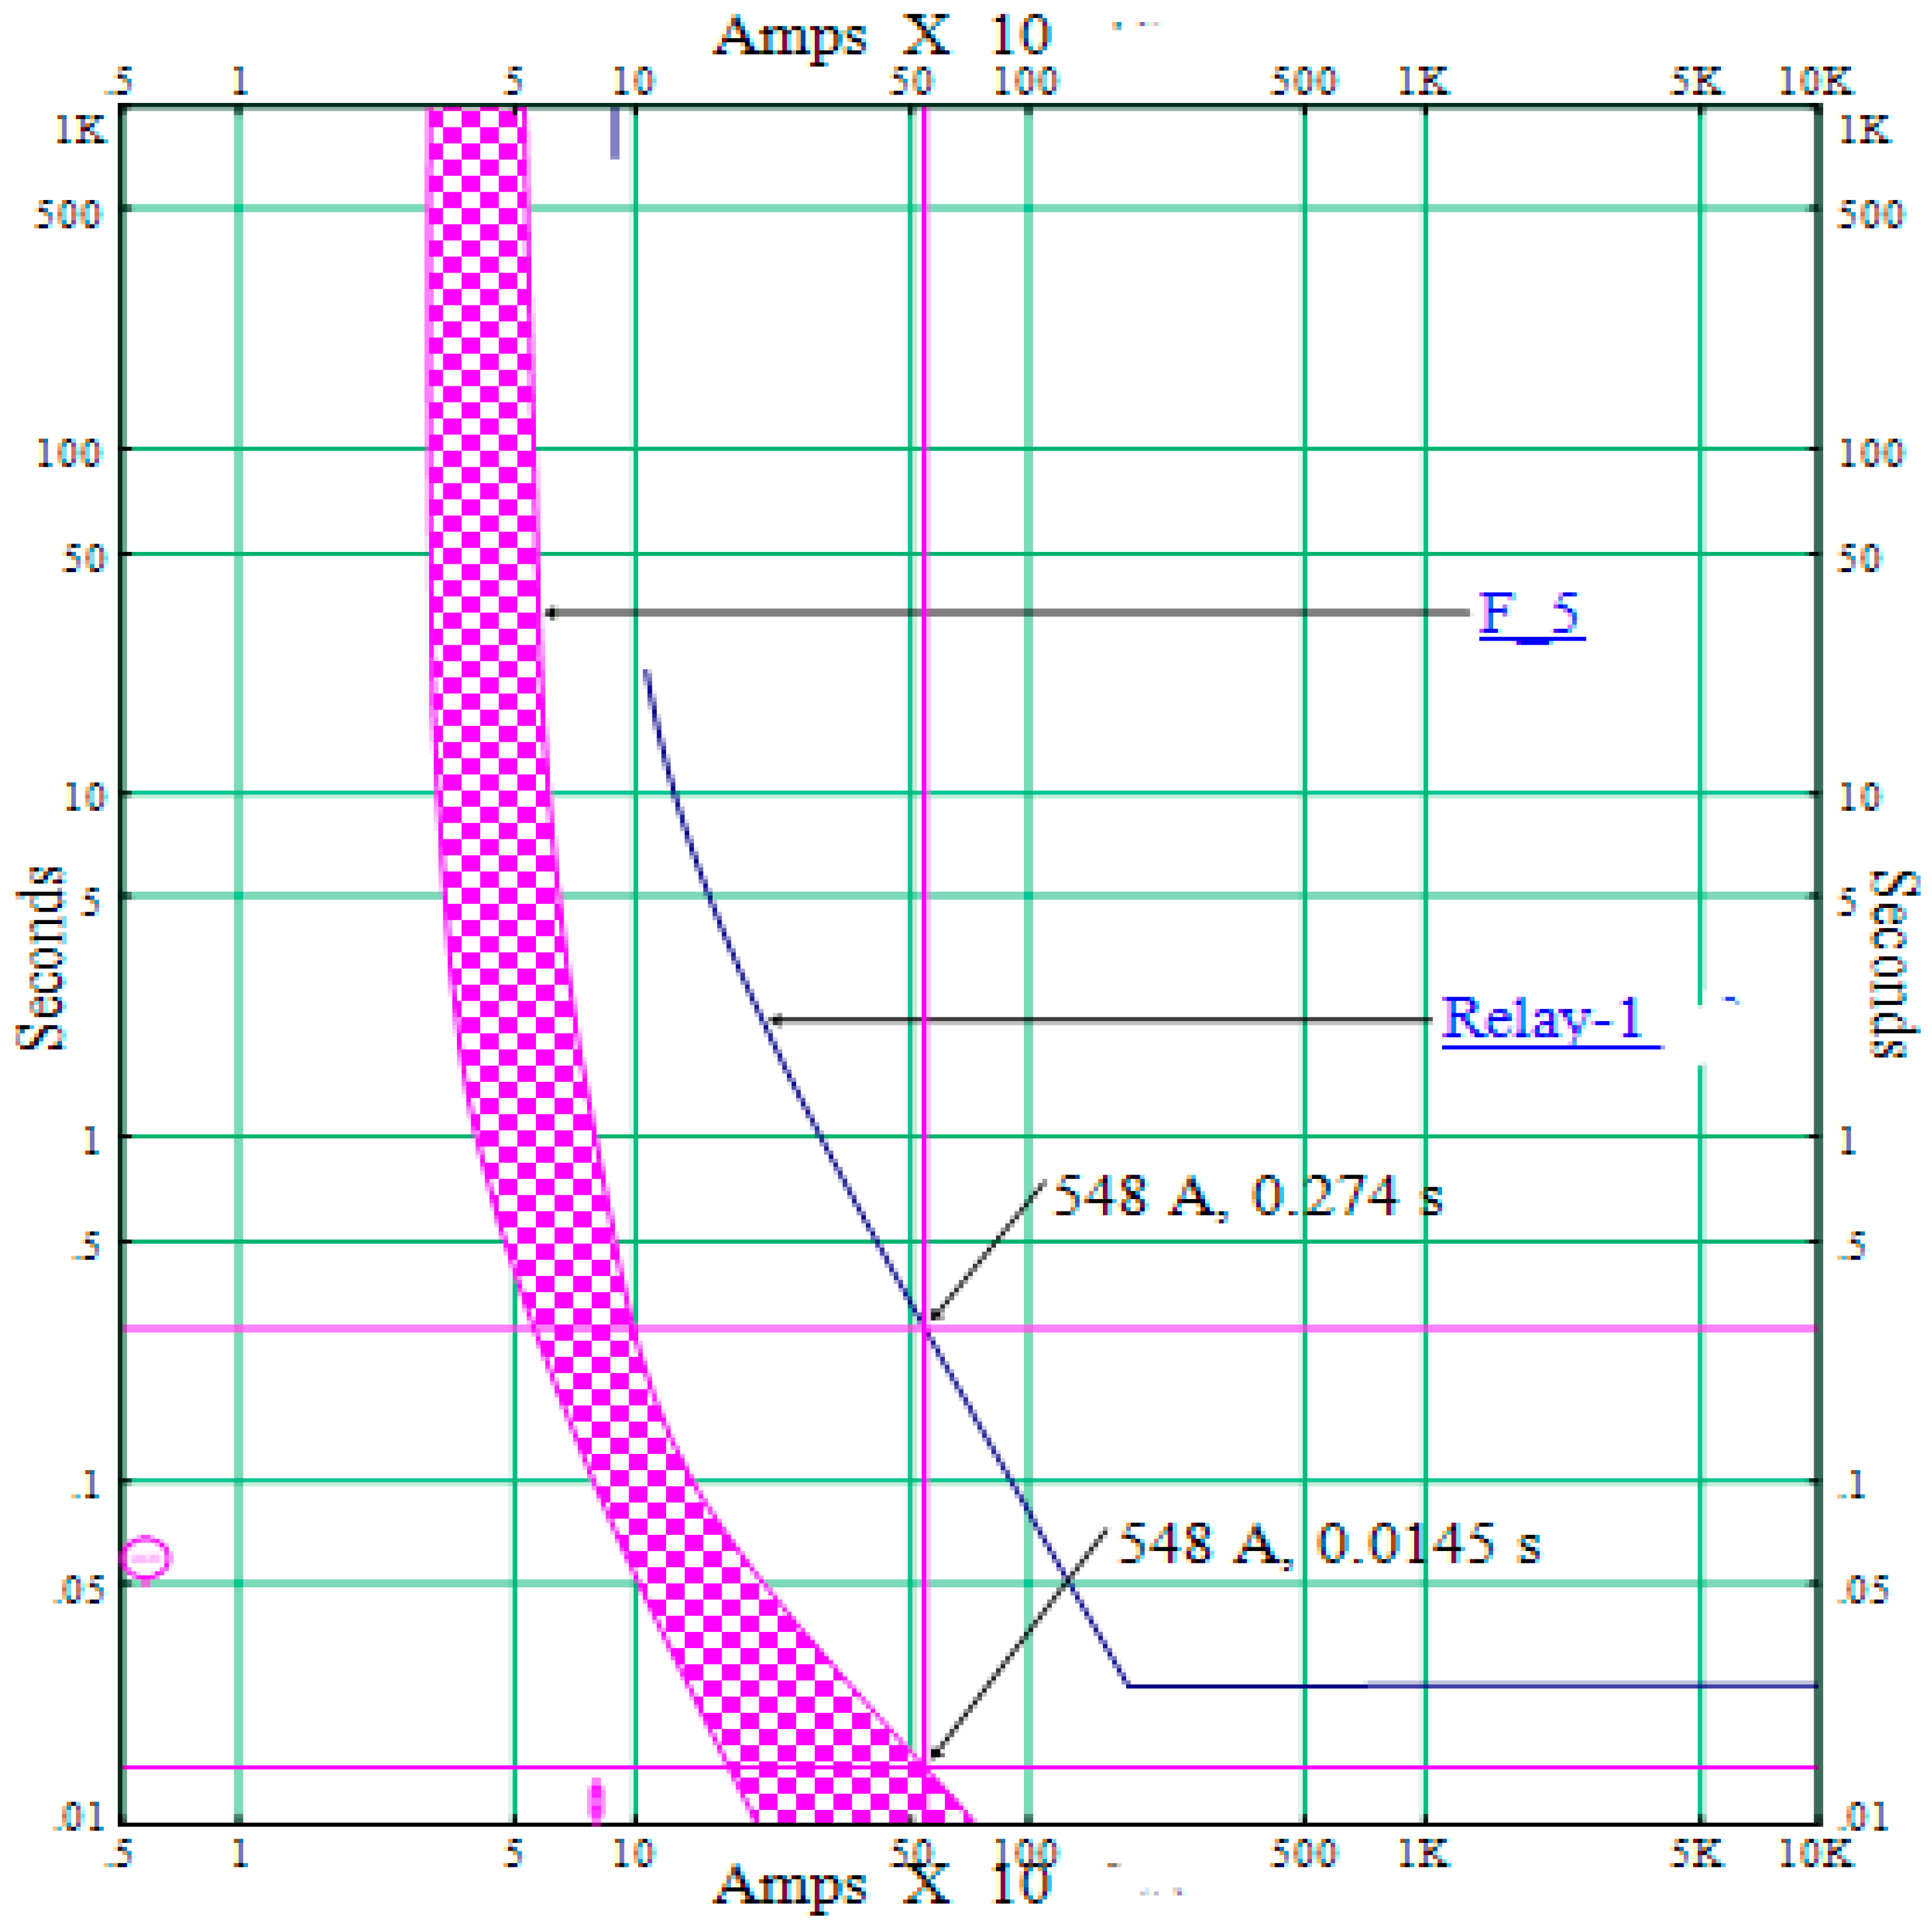
Figure 15 below shows the time current characteristic curves of the primary protection fuse 5 and backup protection of the relay. For this protection zone, the three-phase-to-ground fault is executed on bus 55 and this fault current is 548 ampers. For this fault current, the tripping times of fuse 5 and relay are 0.0145 s and 0.274 s, respectively. As shown in Figure 15 below, the time of operation of protective devices is within the range of the protective device coordination criterion.
5. Conclusions
This paper proposes a radial distribution network service restoration problem considering protective constraints. In this paper, the simulation result shows that service restoration based upon reconfiguration affects the protection system. Service restoration without consideration of protective device operation will result in dysfunction of protective devices, and the configurations cannot be used in real networks. Protective constraints formulated in this paper consist of operating constraints of the protective devices of the distribution network in the normal and loading conditions. This paper uses TLBO, DEV, and PSO as optimization algorithms. The proposed method is applied to the Debre Markos Feeder-3 radial distribution network and extensive simulations are performed to investigate the performance of the proposed methods. This paper presents optimal service restoration of the test systems which have minimum active power loss and optimal voltage profiles while the protection system is working properly.
The obtained SR topology was not feasible for SR without considering protection constraints, since some PDs fail to operate properly in normal loading conditions and the restored network coordination criteria were not satisfied. After executing the proposed SR algorithms by considering protection constraints for a single fault case, the power loss reductions in TLBO, DEV, and PSO were 64.9073%, 45.9073%, and 55.358 %, respectively. The minimum voltage profiles obtained in each proposed TLBO, DEV, and PSO algorithm were 0.96%, 0.95%, and 0.96%, respectively.
Author Contributions
Conceptualization, M.A., B.K.; methodology, M.A., B.K.; software, M.A., B.K.; validation, M.A., B.K.; formal analysis, M.A., B.K.; investigation, M.A., B.K.; resources, M.A., B.K.; data curation, B.K., M.A.; writing—original draft preparation, M.A.; writing—review and editing, M.A., B.K., Z.M.A.; visualization, B.K.; supervision, B.K.; project administration, B.K.; funding acquisition, Z.M.A. All authors have read and agreed to the published version of the manuscript.
Funding
There is no funding available for this research.
Institutional Review Board Statement
Not available.
Informed Consent Statement
Not available.
Data Availability Statement
Data will be available on request.
Conflicts of Interest
The authors declare no conflict of interest.
References
- Chen, Z. A Study of Power Distribution System Reconfiguration Based on Reliability Indices. Master’s Thesis, University of Missouri-Columbia, Columbia, MO, USA, 2016; pp. 40–42. Available online: https://mospace.umsystem.edu/xmlui/bitstream/handle/10355/59899/research.pdf?sequence=2&isAllowed=y (accessed on 19 January 2022).
- Johnathon, C.; Kennedy, J. A Proposed Algorithm for the Self-Healing of Power Distribution Networks. In Proceedings of the 2018 IEEE Innovative Smart Grid Technologies–Asia (ISGT Asia), Singapore, 22–25 May 2018; pp. 816–821. [Google Scholar] [CrossRef] [Green Version]
- Romero, R.; Franco, J.F.; Leão, F.B.; Rider, M.J.; De Souza, E.S. A New Mathematical Model for the Restoration Problem in Balanced Radial Distribution Systems. IEEE Trans. Power Syst. 2016, 31, 1259–1268. [Google Scholar] [CrossRef] [Green Version]
- Singh, A. Power System Restoration using Particle Swarm Optimization. Int. J. Comput. Appl. 2011, 30, 25–32. [Google Scholar]
- Dukovska, I.; Morren, J.; Slootweg, H.J. Switching Sequence Optimization for Service Restoration in Distribution Networks. In Proceedings of the 2020 IEEE PES Innovative Smart Grid Technologies Europe (ISGT-Europe), Delft, The Netherlands, 26–28 October 2020; pp. 6–10. [Google Scholar] [CrossRef]
- Li, Y.; Xiao, J.; Chen, C.; Tan, Y.; Cao, Y. Service Restoration Model with Mixed-Integer Second-Order Cone Programming for Distribution Network with Distributed Generations. IEEE Trans. Smart Grid 2019, 10, 4138–4150. [Google Scholar] [CrossRef]
- Oliveira, L.W.; Oliveira, E.J.; Silva, I.C.; Gomes, F.V.; Borges, T.T.; Marcato, A.L.M.; Oliveira, A.R. Optimal restoration of power distribution system through particle swarm optimization. In Proceedings of the 2015 IEEE Eindhoven PowerTech, Eindhoven, The Netherlands, 29 June–2 July 2015; pp. 1–5. [Google Scholar]
- Pal, D.; Kumar, S.; Tudu, B.; Mandal, K.K.; Chakraborty, N. Efficient and Automatic Reconfiguration and Service Restoration in Radial Distribution System Using Differential Evolution. Adv. Intell. Syst. Comput. 2013, 199, 365–372. [Google Scholar] [CrossRef]
- Guamán, A.; Valenzuela, A. Distribution Network Reconfiguration Applied to Multiple. Energies 2021, 14, 6699. [Google Scholar] [CrossRef]
- Srivastava, I.; Bhat, S.; Thadikemalla, V.S.G.; Singh, A.R. A hybrid machine learning and meta-heuristic algorithm based service restoration scheme for radial power distribution system. Int. Trans. Electr. Energy Syst. 2021, 31, e12894. [Google Scholar] [CrossRef]
- Jamil, M.; Sharma, A. Ant Colony Optimization for restoration of distribution system. In Proceedings of the 12th IEEE International Conference Electronics, Energy, Environment, Communication, Computer, Control: (E3-C3), INDICON, New Delhi, India, 17–20 December 2015; pp. 1–6. [Google Scholar]
- Soomro, D.M.; Al-Izzi, M.Y.; Soodi, H.A.; Elasager, N.M.; Chong, S.C. Optimal restoration of distribution system by using PSO and ANN. J. Telecommun. Electron. Comput. Eng. 2017, 9, 1–6. [Google Scholar]
- ElDesouky, A.A.; Reyad, E.M.; Mahmoud, G.A. Implementation of boolean PSO for service restoration using distribution network reconfiguration simultaneously with distributed energy resources and capacitor banks. Int. J. Renew. Energy Res. 2020, 10, 354–365. [Google Scholar]
- Singh, U. Radial Distribution System Reconfiguration for Loss Minimization Using Exhaustive Search Techniques. Ph.D. Thesis, Thapar University, Patiala, India, 2014. [Google Scholar]
- Abu-Elanien, A.E.; Salama, M.; Shaban, K. Modern network reconfiguration techniques for service restoration in distribution systems: A step to a smarter grid. Alex. Eng. J. 2018, 57, 3959–3967. [Google Scholar] [CrossRef]
- Rahim, M.N.A.; Mokhlis, H.; Abu Bakar, A.H.; Rahman, M.T.; Badran, O.; Mansor, N.N. Protection Coordination Toward Optimal Network Reconfiguration and DG Sizing. IEEE Access 2019, 7, 163700–163718. [Google Scholar] [CrossRef]
- Khorshid-Ghazani, B.; Seyedi, H.; Mohammadi-Ivatloo, B.; Zare, K.; Shargh, S. Reconfiguration of distribution networks considering coordination of the protective devices. IET Gener. Transm. Distrib. 2017, 11, 82–92. [Google Scholar] [CrossRef]
- IEC 60255-151:2009; Measuring relays and protection equipment Part 151 Functional requirements for over/under current protection. IEC: London, UK, 2009.
- Federal Democratic Republic of Ethiopia, Ethiopian Electric Power (EEP). Ethiopia- Additional Financing for Energy Access Project; EEP: Addis Ababa, Ethiopia, 2016.
- Mekuriaw, T. The Impact of Urban Expansion on Physical Environment in Debre Markos Town, Ethiopia. Civ. Environ. Res. 2019, 11, 16–26. [Google Scholar] [CrossRef] [Green Version]
Figure 1.
The overall methodology.

Figure 2.
TLBO algorithms for radial distribution network service restoration.

Figure 3.
Single line diagram of Debre Markos Feeder-3.

Figure 4.
Restored network in single fault cases without protection constraints using TLBO.

Figure 5.
Restored network voltage profile for single fault case using PSO, DEV, and TLBO.

Figure 6.
Log–log diagrams of the relay and downstream fuse 1 and fuse 2.

Figure 7.
Log–log diagrams of the relay and downstream fuse 3.

Figure 8.
Log–log diagram of the relay and downstream fuse 4.

Figure 9.
Log–log diagrams of the relay and downstream fuse 5.

Figure 10.
Restored networks in single fault cases considering protection constraints using TLBO.

Figure 11.
Voltage profile of single fault case considering protection constraints using PSO, DEV, and TLBO.
Figure 11.
Voltage profile of single fault case considering protection constraints using PSO, DEV, and TLBO.

Figure 12.
Log–log diagrams of the relay and downstream fuse 1 and fuse 2.

Figure 13.
Log–log diagrams of the relay and downstream fuse 3.

Figure 14.
Log–log diagrams of the relay and downstream fuse 4.

Figure 15.
Log–log diagrams of the relay and downstream fuse 5.


Table 1.
SR simulation result for single fault case without considering protection constraints.
| Item | Initial State (Normal Condition) | Using TLBO | Using DEV | Using PSO |
|---|---|---|---|---|
| Open switches | ----- | S4 S12 S11 S8 S18 | S74 S75 S9 S77 S18 | S40 S17 S46 S56 S18 |
| Power loss (kW) | 368.8018 | 101.5726 | 153.5291 | 138.3854 |
| Real power loss reduction (%) | ------ | 72.4587 | 58.3708 | 62.477 |
| Reactive power loss (Kvar) | 305.1644 | 85.5763 | 121.1927 | 110.3287 |
| Reactive power loss reduction (%) | ------ | 71.9573 | 60.2861 | 63.8461 |
| Restored load | All | All | All | |
| Minimum voltage (p.u.) | 0.876 | 0.96628 | 0.95458 | 0.95874 |
Table 2.
Protective device condition in optimal configuration without protection constraints.
| Protective Device | Using TLBO | Using DEV | Using PSO | Protective Device Condition | |||
|---|---|---|---|---|---|---|---|
| Load Current (A) | Load Current with 25% Overload (A) | Load Current (A) | Load Current with 25% Overload (A) | Load Current (A) | Load Current with 25% Overload (A) | ||
| Fuse 1, 50 A | 17.232 | 21.5405 | 16.974 | 21.2178 | 7.5466 | 9.43325 | Closed |
| Fuse 2, 30 A | 9.4223 | 11.7779 | 9.5477 | 11.9346 | 9.5072 | 11.884 | Closed |
| Fuse 3, 15 A | 11.232 | 14.04 | 11.289 | 14.112 | 11.2854 | 14.1068 | Closed |
| Fuse 4, 15 A | 12.744 | 15.9298 | 13.298 | 16.6233 | 5.8764 | 7.3455 | Open |
| Fuse 5, 20 A | 8.6064 | 10.758 | 8.6844 | 10.8555 | 0.9729 | 1.21613 | Closed |
Table 3.
Restored network protective device condition without protection constraints.
| Protective Devices | If_Min | If_Max | T_op for Relay, F1 and F2 Protection Zone | T_op for Relay and F3 Protection Zone | T_op for Relay and F4 Protection Zone | T_op for Relay and F5 Protection Zone |
|---|---|---|---|---|---|---|
| Relay | 0.336 | 1.007 | 0.0797 | 0.281 | 0.491 | 0.26 |
| F_1 | 0.336 | 1.007 | 0.0352 | - | - | - |
| F_2 | 0.336 | 1.007 | 0.012 | - | - | - |
| F_3 | 0.181 | 0.542 | - | 0.0518 | - | - |
| F_4 | 0.138 | 0.414 | - | - | 0.0127 | - |
| F_5 | 0.187 | 0.562 | - | - | - | 0.014 |
Table 4.
Simulation result of SR considering protection constraints.
| Item | Initial State (Normal Condition) | TLBO | DEV | PSO |
|---|---|---|---|---|
| Open switches | ----- | S4 S14 S47 S8 S18 | S37 S75 S76 S77 S18 | S40 S17 S46 S56 S18 |
| Real power loss (kW) | 368.8018 | 110.891 | 167.7956 | 138.4794 |
| Real power loss reduction (%) | ------ | 69.932 | 54.5025 | 62.4515 |
| Reactive power loss (Kvar) | 305.1644 | 98.0261 | 138.5278 | 110.4214 |
| Reactive power loss reduction (%) | ------ | 67.8776 | 54.6055 | 63.8157 |
| Restored load | All | All | All | |
| Minimum voltage (p.u.) | --- | 0.96304 | 0.95076 | 0.95874 |
Table 5.
Protective device conditions for restored network considering protection constraints.
| Protective Device | Using TLBO | Using DEV | Using PSO | Protective Device Condition | |||
|---|---|---|---|---|---|---|---|
| Load Current (A) | Load Current with 25% Overload (A) | Load Current (A) | Load Current with 25% Overload (A) | Load Current (A) | Load Current with 25% Overload (A) | ||
| Fuse 1, 50 A | 17.309 | 21.6371 | 17.0416 | 21.302 | 7.5478 | 9.43475 | Closed |
| Fuse 2, 30 A | 9.4648 | 11.831 | 9.5859 | 11.9823 | 9.5072 | 11.884 | Closed |
| Fuse 3, 15 A | 11.208 | 14.0106 | 11.2788 | 14.0985 | 11.2854 | 14.1067 | Closed |
| Fuse 4, 15 A | 0.7559 | 0.94487 | 0.7611 | 0.95137 | 5.8764 | 7.3455 | Closed |
| Fuse 5, 20 A | 8.6349 | 10.7936 | 8.7162 | 10.8952 | 0.9729 | 1.21612 | Closed |
Table 6.
Restored network protective condition considering protection constraints.
| Protection Devices | If_Min | If_Max | T_op for Relay, F1 and F2 Protection Zone | T_op for Relay and F3 Protection Zone | T_op for Relay and F4 Protection Zone | T_op for Relay and F5 Protection Zone |
|---|---|---|---|---|---|---|
| Relay | 0.156 | 0.467 | 0.381 | 0.251 | 0.419 | 0.274 |
| F_1 | 0.156 | 0.467 | 0.105 | - | - | - |
| F_2 | 0.156 | 0.467 | 0.0327 | - | - | - |
| F_3 | 0.191 | 0.572 | - | 0.0489 | - | - |
| F_4 | 0.149 | 0.447 | - | - | 0.0116 | - |
| F_5 | 0.183 | 0.548 | - | - | - | 0.0145 |
Publisher’s Note: MDPI stays neutral with regard to jurisdictional claims in published maps and institutional affiliations. |
© 2022 by the authors. Licensee MDPI, Basel, Switzerland. This article is an open access article distributed under the terms and conditions of the Creative Commons Attribution (CC BY) license (https://creativecommons.org/licenses/by/4.0/).
Share and Cite
MDPI and ACS Style
Ayalew, M.; Khan, B.; Alaas, Z.M. Optimal Service Restoration Scheme for Radial Distribution Network Using Teaching Learning Based Optimization. Energies 2022, 15, 2505. https://0-doi-org.brum.beds.ac.uk/10.3390/en15072505
AMA Style
Ayalew M, Khan B, Alaas ZM. Optimal Service Restoration Scheme for Radial Distribution Network Using Teaching Learning Based Optimization. Energies. 2022; 15(7):2505. https://0-doi-org.brum.beds.ac.uk/10.3390/en15072505
Chicago/Turabian StyleAyalew, Mulusew, Baseem Khan, and Zuhair Muhammed Alaas. 2022. "Optimal Service Restoration Scheme for Radial Distribution Network Using Teaching Learning Based Optimization" Energies 15, no. 7: 2505. https://0-doi-org.brum.beds.ac.uk/10.3390/en15072505
Note that from the first issue of 2016, this journal uses article numbers instead of page numbers. See further details here.