Article

Polyhumous Dystrophic Pit Lakes: Hydrographic and Hydrochemical Characteristics on the Example of Reservoirs in the Włoszczowska Basin, Central Poland

1
Faculty of Natural Sciences, University of Silesia, 40-007 Katowice, Poland
2
Central Mining Institute, 40-166 Katowice, Poland
*
Author to whom correspondence should be addressed.
Submission received: 27 December 2021 / Revised: 29 March 2022 / Accepted: 31 March 2022 / Published: 6 April 2022
(This article belongs to the Special Issue Impact of Mine Activity on Water Environment)

Abstract

:
The article presents the hydrographic and hydrochemical characteristics of post-exploitation reservoirs formed in peat excavations. Two natural bog lakes were selected as the control objects for the study. The research indicated that both the waters of post-exploitation peat reservoirs and natural bog lakes show low electrolytic conductivity (<100 µS/cm) and acidic water reaction (pH < 5.5). The concentration of major cations and anions is also very low. The concentration of calcium and magnesium does not exceed a few mg/L. Hydrochemically, all post-exploitation peat reservoirs are bi-ionic sulphate–calcium (SO42−-Ca2+). This distinguishes post-exploitation peat reservoirs from natural bog lakes in which multi-ion waters were found, for example, sulphate–chloride–calcium (SO42−-Cl-Ca2+) and sulphate–calcium–sodium (SO42−-Ca2+-Na+). The calculated water humic state index (HSI) allowed the classifying of the examined reservoirs as polyhumous. The value of this index, in all reservoirs, was >50. Based on the calculated hydrochemical dystrophy index (HDI), it was found that all post-exploitation peat reservoirs are dystrophic. So far, no such hydrochemical type has been found in other post-exploitation peat reservoirs. Therefore, the examined objects should be classified as unique post-exploitation peat reservoirs.

1. Introduction

Anthropogenic reservoirs are a new element of the natural environment, which arise from human economic activity [1]. Post-exploitation reservoirs are one of the types of anthropogenic reservoirs that develop from the flooding of workings left after open-cast mining of mineral deposits. These reservoirs do not have a natural origin; however, from their creation, that is the flooding of the excavation, they undergo the same processes as natural lakes. One of the elements developing as a result of these processes is the physicochemical composition of the water.
Research on physicochemical properties of the waters of anthropogenic reservoirs was carried out on numerous lakes. In most cases, it concerned individual reservoirs [2,3,4,5]. There are only a few studies in which the physicochemical properties of the waters of post-exploitation reservoirs were characterised more comprehensively [6,7,8,9,10]. So far, however, no comprehensive characterisation of the physicochemical properties of waters and the classification of post-exploitation peat reservoirs, which are a particularly interesting group, has been carried out. It applies, particularly, to reservoirs formed in workings after the exploitation of raised peat or transitional peat, which can be classified as disharmonious. In such reservoirs, one substance is present in a very high concentration, for example, siderotrophic lakes show a high content of iron compounds, while acidotrophic have a high content of acidic substances. These reservoirs can also show a complex of specific physicochemical features that resemble natural lakes, e.g., dystrophic or polyhumous lakes.
Often, anthropogenic reservoirs were perceived as “unnecessary” elements of the landscape and thus filled in as part of reclamation [11]. In recent years, more and more attention has been paid to these water bodies as habitats for numerous plant and animal species, including protected ones [12,13]. These reservoirs also function as the so-called “small retention”, favourably affecting the water relations of the area. Therefore, it is essential to recognise and classify the abiotic properties of these reservoirs. On this basis, it is possible to indicate protective measures to preserve them as potential habitats for flora and fauna. The research aimed to show how the hydrological properties of the reservoir catchment (natural and anthropogenic) affect the physicochemical composition of the waters of post-exploitation peat reservoirs. The classification of post-exploitation peat reservoirs according to the hydrochemical type of retained waters, the humic state index (HSI), and the hydrochemical dystrophy index (HDI) have also been presented. Two natural bog lakes near post-exploitation peat reservoirs were selected as control objects. The selection of the control reservoirs was to show the hydrochemical similarities or differences between natural and anthropogenic reservoirs. This concerned, in particular, the identification of whether pit lakes may have the features of natural dystrophic and polyhumous lakes. The research aimed to determine the variability of selected physicochemical parameters in the waters of the investigated pit lakes and natural lakes.

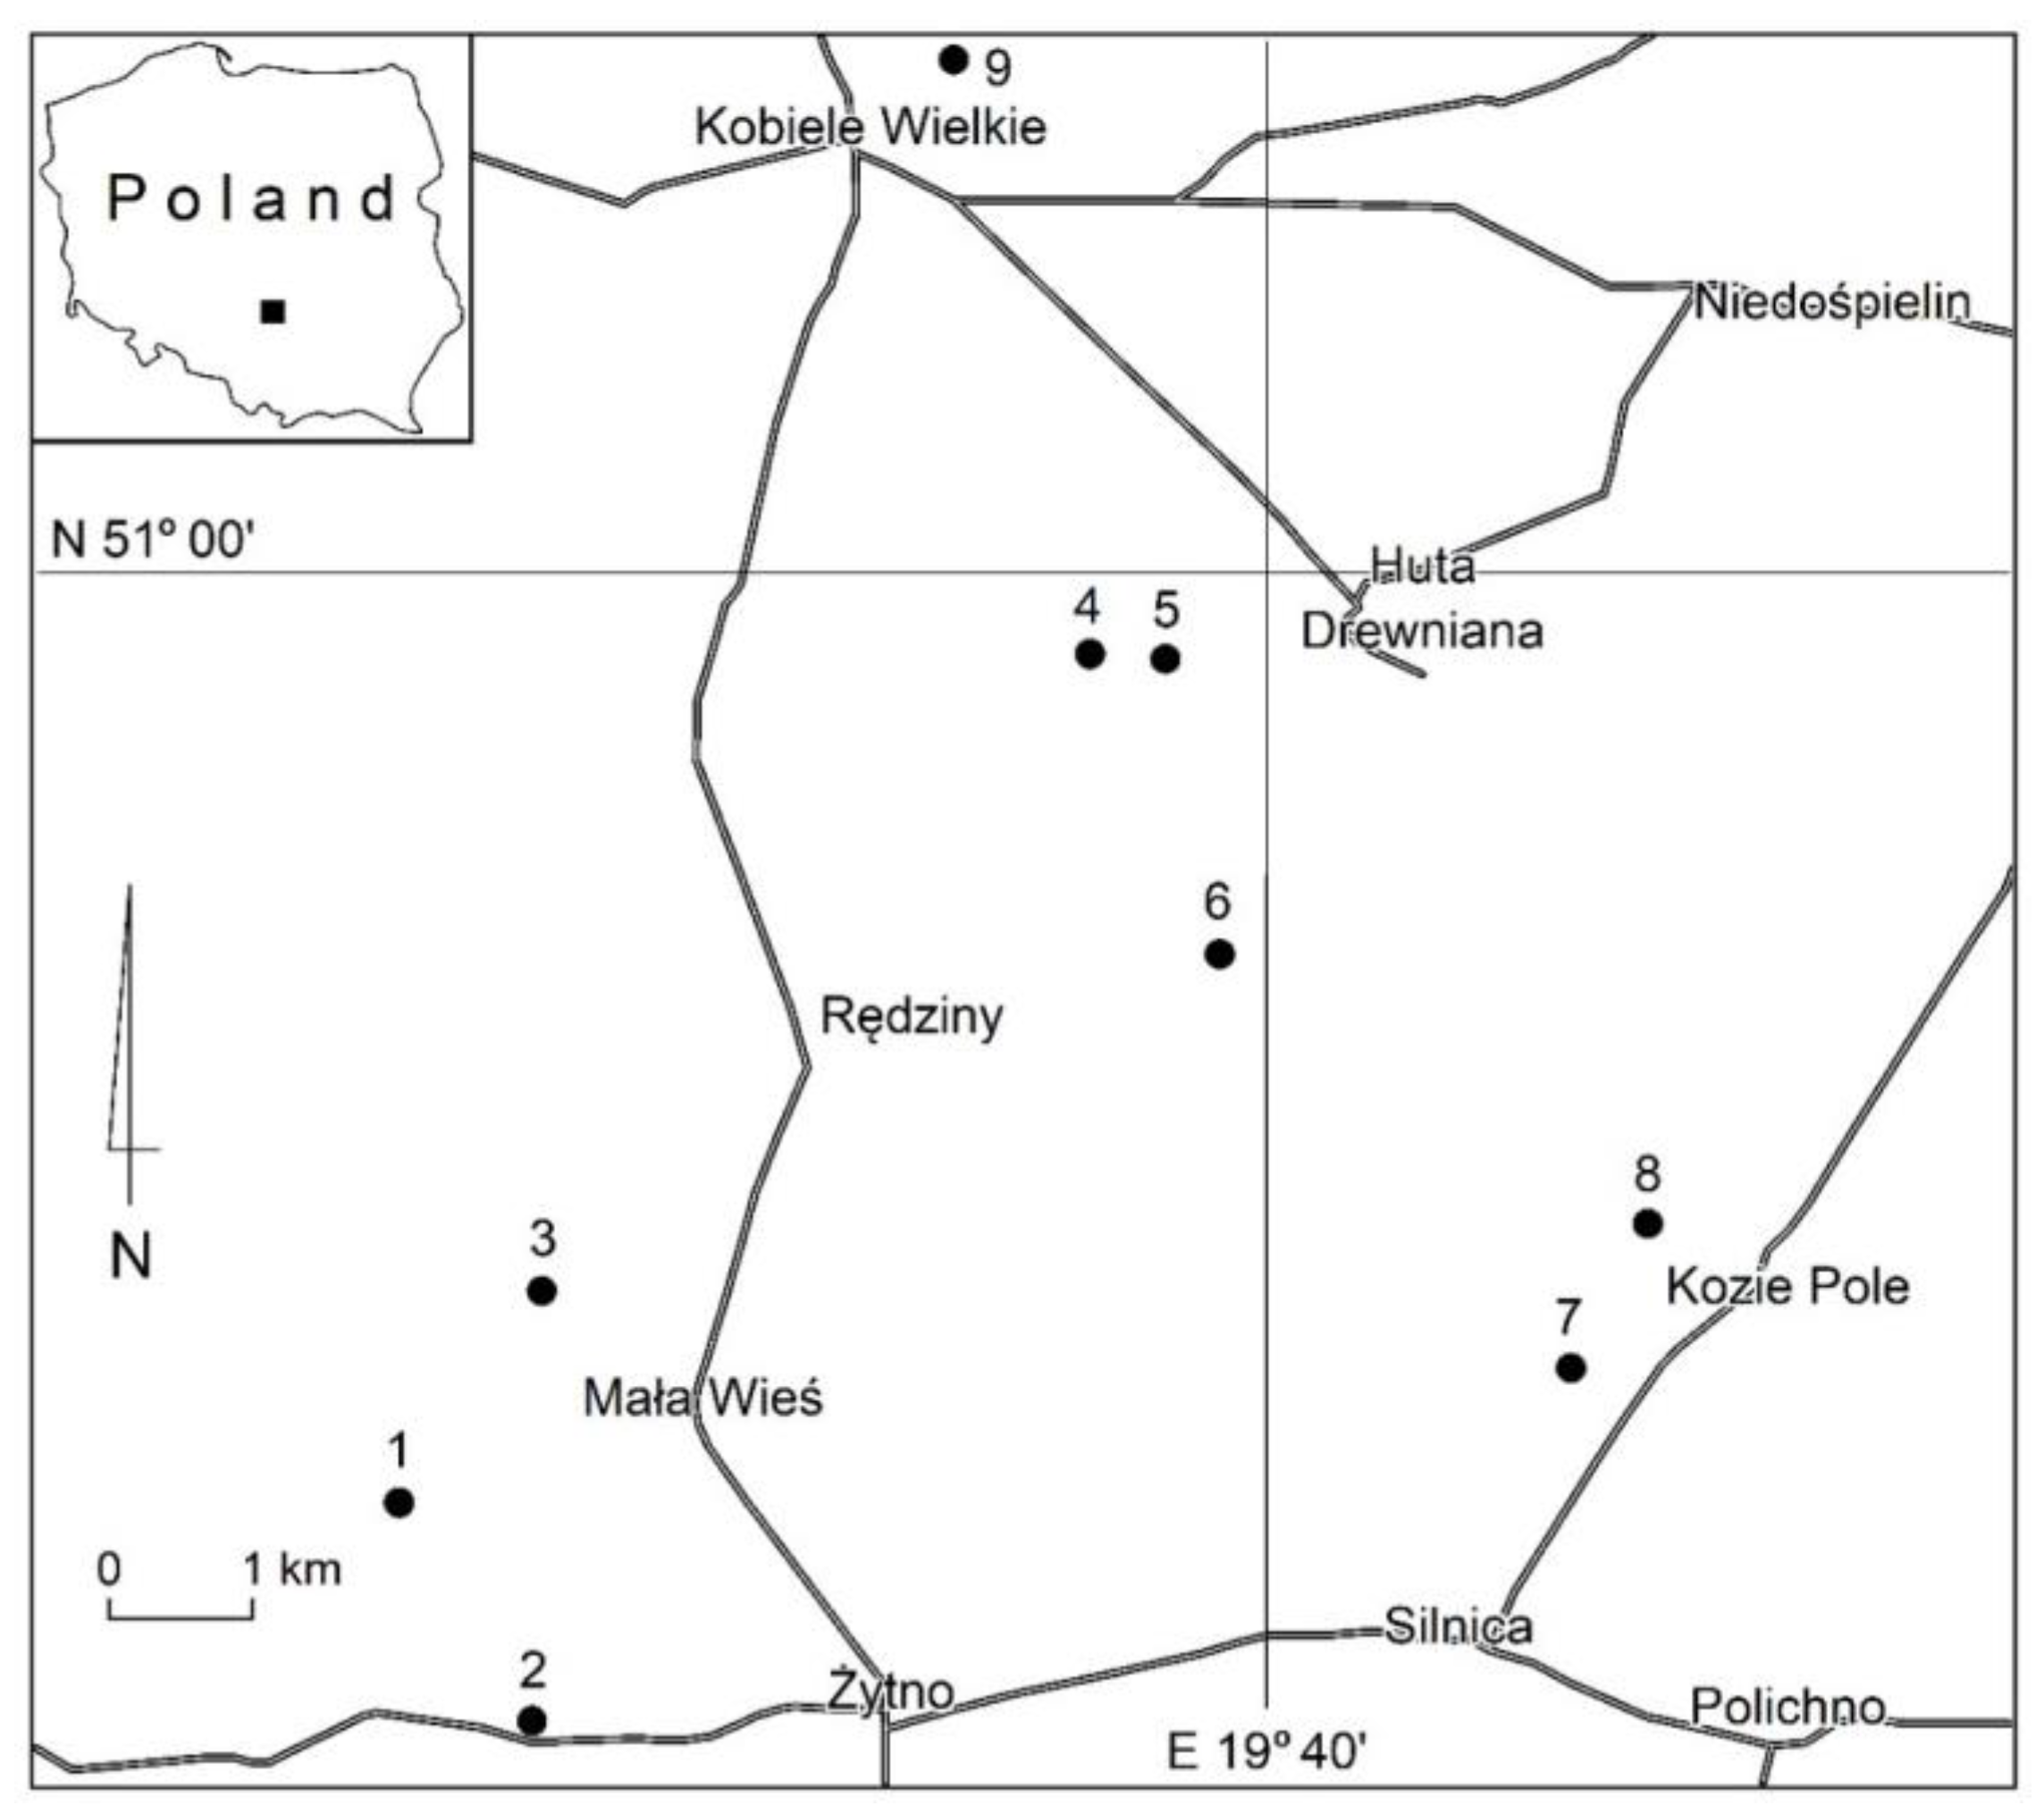
2. Location of the Research Area

The seven post-exploitation peat reservoirs selected for the research are located in central Poland, in the Włoszczowska Basin, filled with dune sands (Figure 1). The detailed location of the reservoirs is presented in Table 1.
Swamps and peat bogs developed in the depressions between the dunes. The deposited peat layers, exploited mainly at the turn of the nineteenth and twentieth centuries, were used as fuel. After the end of exploitation, the pits were flooded, resulting in the formation of reservoirs (Figure 2, Figure 3 and Figure 4).
In addition to post-exploitation peat reservoirs, there are also natural aeolian lakes in the study area. Two such lakes were selected as controls (locations 1 and 2, Figure 1). These lakes are located in the central part of peat bogs and are surrounded by floating mats (Figure 2 and Figure 5).

3. Research Methods

Hydrographic mapping, allowing the assessment of water relations in the catchment area of the studied reservoirs, followed the guidelines of Gutry-Korycka and Werner-Więckowska [14]. The main goals of hydrographic mapping were:
-
Determining the hydrological type of the reservoir (whether the reservoir is endorheic or flow-through).
-
Linking the location of the reservoir with the type of relief (the presence of dunes to confirm their aeolian origin).
-
Assessment of peat depletion in the shore zone of the reservoir.
-
Measuring the maximum depth of the reservoir.
Directly in the field, the water (pH) was measured with the potentiometric method and the electrical conductivity (EC) with the conductometric method using a Hanna HI 98,194 multi-parameter. Water samples for laboratory analyses were collected with a telescopic boom into 0.5 L polyethene bottles. The samples were collected at distinct seasons of the year (spring, summer, autumn (twice), and winter). Five samples (n = 5) were taken from each reservoir. Water samples were transported to the laboratory under refrigerated conditions at the temperature (5 ± 3) °C. Before analysis (except for the TOC), the samples were filtered through a 0.45 µm nitrocellulose membrane filter (GVS North America, Sanford, ME 04073, USA). The main cations and anions in water were determined: Ca2+, Mg2+, Na+, K+, SO42−, Cl, HCO3, and NO3. Moreover, the water colour was determined by the spectrophotometric method. The dissolved organic carbon (DOC) and total organic carbon (TOC) were determined by the high-temperature combustion method with IR detection (TOC-L CPH, Shimadzu, Japan). Determination of alkali metals and alkaline earth metals was performed using inductively coupled plasma optical emission spectrometry (ICP-OES) (Optima 5300DV, Perkin Elmer, Alexandria, VA, USA). The content of anions (SO42−, Cl, NO3) was determined by ion chromatography with conductometric suppression detection (DIONEX ICS-5000, Thermo Fisher Scientific, Waltham, MA, USA). The concentration of bicarbonates (HCO3) was calculated from the measurements of mineral alkalinity and the general method of potentiometric titration using an automatic titration station (809 Titrando, Metrohm AG, CH-9101 Herisau Switzerland).
The hydrochemical classification of water in the reservoirs was based on Altowski–Szwiec [15]. In this classification, it was assumed that the hydrochemical type is determined by those ions whose content in water is greater than (20 ± 3)% mval in relation to the sum of anions and cations. The name of water begins with the ion with the most abundant content in the water, be it a cation or an anion. Under natural conditions, the six most important ions above 20% mval are Ca2+, Mg2+, Na+, HCO3, Cl, and SO42−.
The other determined indexes included the water humic state index (HSI) proposed by Hakanson and Boulion [16]:
HSI = (100/3) LOG (COL−3)
The COL is the water colour and is expressed in colour units (mg Pt/L), and the hydrochemical dystrophy index (HDI) was proposed by Górniak [17]:
D1 = (9.5 − pH) × 20
D2 = 100/log (EC)
D3 = 50 − LOG(DIC/DOC) × 20
HDI = (D1 + D2 + D3)/3
where DIC is the dissolved inorganic carbon, mg/L, and DOC is the dissolved organic carbon, mg/L.
Due to the non-normal distribution and unequal variance of the data, non-parametric tests were used. To compare differences in the medians of the selected physicochemical parameters between the reservoirs studied, the ANOVA Kruskal–Wallis test was applied. It was followed by the Conover test for multiple comparisons, in case of rejection of the null hypothesis. To study the relationship between the DOC of the water and its colour, the Spearman rank correlation test was conducted. All data are presented as medians and quartile range, with outliers in the figures as box-and-whiskers plots (minimum, maximum, median, quartile range). All statistical analyses in this paper were done using the R program [18].

4. Results and Discussion

Besides the control 1 and 2, all the studied reservoirs are artificial lakes formed due to open-cast peat exploitation. They are endorheic, supplied mainly by rainfall and surface runoff from the immediate catchment. The area of the studied reservoirs is varied and ranges from several to several dozen areas. The exception is reservoir 9, with a maximum area of up to 10 ha. These are shallow reservoirs, and their maximum depths do not exceed 1 m. Such morphometric features are characteristic of most post-exploitation peat reservoirs [19,20,21]. Significant fluctuations in the water level in post-exploitation peat reservoirs are observed during the year, which causes changes in their surface area. The most spectacular example is reservoir 9, the surface area of which can vary from 4 to 10 ha (Figure 6).
These are astatic reservoirs. However, during the research, the water never completely disappeared from the reservoirs. The maximum water levels are observed in spring after the thaw and in summer (June/July) during heavy rainfall. The lowest water levels occur in autumn/winter. This is the characteristic course of the water level in astatic reservoirs located in the Central European lowland [22].
We can distinguish two types of post-exploitation peat reservoirs. Type “B” is where the peat deposit had been fully exploited, and the basin of the reservoir is cut in mineral deposits, or sands (Figure 2). The inflow of humic substances comes from the catchment overgrown with marsh forests. The second type, “C”, is where the reservoir basin is partially cut in the leftover peat deposit (Figure 2). The bottom of the reservoir can be mineral–organic. The inflow of humic substances occurs, mainly, through the leaching of the remaining peat deposit. The hydrogeological situation of a natural bog lake (type “A”) is entirely different. A characteristic feature of natural bog lakes is the presence of floating vegetation mats (Figure 2, [23]). Sometimes there are also floating islands, as in the case of control lake 2 (Figure 2 and Figure 5). Both the islands and the floating mats are overgrown with stunted pine trees. These reservoirs also have a thick layer of organic sediments. Lakes of this type occur mainly in the areas of north-eastern Europe within the limits of the last glaciation [24]. They are scarce across the remaining part of the continent. Their occurrence, beyond the last glaciation’s extension, is associated with areas with aeolian or karst relief [25].
The research results indicate that post-exploitation peat reservoirs contain water of low electrical conductivity, the average value of which in most of the reservoirs is <100 µS/cm (Figure 7). It mainly stems from the dominant rainfall supply. Furthermore, the presence of sands in the geological structure of the catchment does not significantly increase the mineralisation of the waters flowing into the reservoirs as surface and subsurface runoff. The values of electrical conductivity between natural bog lakes and the majority of the studied post-exploitation peat reservoirs did not show statistically significant differences (Figure 7).
The highest values of electrolytic conductivity were found in reservoirs 3 and 4. They also showed the most significant fluctuations in the water level in the annual cycle, which explains the high values of electrical conductivity. During periods of intense evaporation and a decrease in the water level, the solution thickens, and, thus, the electrical conductivity increases. High variability of hydrochemical conditions in astatic reservoirs is their characteristic feature [22].
The values of the electrical conductivity of the waters of post-exploitation peat reservoirs are comparable to those found in natural bog lakes [25,26,27,28,29]. They are also comparable to those observed in other post-exploitation raised/transitional peat reservoirs [30]. These values, however, are lower than those found in post-exploitation peat reservoirs located within blanket bogs. In this type of reservoir, the electrical conductivity of water very often exceeds 400 µS/cm [31].
The concentrations of individual cations and anions in water are deficient and do not exceed a few or a dozen mg/dm−1 (Table 2). The concentration of calcium and magnesium is extremely low. A characteristic feature caused by the highly acidic reaction of the water is, also, a very low concentration of bicarbonate ions (HCO3). Due to changes in the concentration of individual ions in the annual cycle, the waters of natural lakes show a diversified and changing hydrochemical type (Table 2).
Bi-ionic waters of the calcium–chloride type (Cl-Ca2+) dominate. There were also found three-ionic waters, for example sulphate–chloride–calcium (SO42−-Cl-Ca2+) and sulphate–calcium–sodium (SO42−-Ca2+-Na+). Periodically, there were also four-ionic waters: sulphate–chloride–calcium–sodium (SO42−-Cl-Ca2+-Na+). The multi-ion hydrochemical types, and their variability in the annual cycle, clearly distinguish natural bog lakes from post-exploitation peat reservoirs. Natural lakes are supplied only by precipitation. Therefore, the variability of hydrochemical types is a consequence of the wet and dry deposition of atmospheric pollutants. The effect of wet and dry deposition on lake water quality is well known, particularly their acidification [32,33]. In all post-exploitation peat reservoirs, the waters of the bi-ion sulphate–calcium (SO42−-Ca2+) type, which were stable throughout the year, were found. The hydrochemical types of water studied in natural bog lakes also distinguish them significantly from other natural lakes in Central European lowland. Most of these lakes contain bicarbonate–calcium (HCO3-Ca2+) waters. Moreover, the hydrochemical type is constant and does not change in the annual cycle [34]. On the other hand, variability of the hydrochemical type was found in other post-exploitation reservoirs (e.g., dolomite), although these are scarce [8]. In post-exploitation reservoirs, the sulphate–calcium hydrochemical type is also rare because this type of water is most often found in post-exploitation reservoirs of gypsum or sulphide minerals [5,8].
Another characteristic feature of the reservoirs is the acidic reaction of their waters. The median pH of the water in all the reservoirs was <5.6, and the lowest value was 3.5 (Figure 8).
The precipitation supply mainly determines the acidic reaction of the waters to the reservoirs, as does the presence of podzolic and peat soils in the catchment, also a source of acidic substances. The presence of sphagnum mosses (Sphagnum) in the shore zone is also essential, as they lead to the acidification of the waters [35].
One of the most characteristic features of the studied reservoirs is the brown-yellow colour of the water, which results from the leaching of humic substances from the peat deposits left around the reservoirs. The colour of the water is the key indicator that allowed the classification of the reservoirs according to their humic status (Table 3). Table 3 shows that most of the post-exploitation peat reservoirs can be classified as polyhumic. Polyhumicity is characteristic of most lakes located within peat complexes [23]. The highest HSI value was found in reservoir 8, classified as hyperhumic (Table 3). The calculated index reveals the regularity: the more peat left in the reservoir basin, the higher the value of the HSI index (Type “C”). In the case of reservoirs where the peat deposit had been fully exploited (sandy edge of the excavation), the index values are the lowest (Type “B”). Therefore, there is a solid correlation (rs = 0.93) between the water colour and dissolved organic carbon content (Figure 9). This correlation emphasises the critical role of humic substances in shaping the colour of the water. Most pit lakes have the same humus status (HSI) as natural peat bogs; therefore, natural and anthropogenic reservoirs are very similar.
The hydrochemical dystrophy index (HDI) was also calculated. The post-exploitation peat reservoirs are dystrophic, as the index value exceeds 50 (Table 3). The higher the index value, the more advanced the processes of dystrophy. Therefore, most of the examined reservoirs were classified at a high level of dystrophy. The division criteria were related to lakes found in Poland, where the value of this indicator rarely exceeds 100 [36]. However, it should be remembered that, in both Sweden and Finland, there may be lakes where the HDI value exceeds 150, reaching the maximum value of 280 [36]. The highest HDI values in the studied waters were found in spring, and the lowest at the end of summer. The obtained data are identical with those observed in other dystrophic lakes [22]. Thus, the post-exploitation peat reservoirs represent a unique type of dystrophic habitat. In the European Union, such natural lakes are protected under Natura 2000, code 3160. Depending on the time since the cessation of exploitation and the presence or not of the remaining peat in the deposit, regeneration processes of the peat bog are observed. They consist mainly in the spontaneous colonisation of the edge zone by typical peat bog plants such as sphagnum mosses, marsh cranberries, and round-leaved sundew. These processes will lead to the physiognomic and landscape “similarity” to natural bog lakes. It is a very favourable phenomenon, which allows the preservation of biodiversity of the formerly transformed peat bogs.

5. Summary and Conclusions

Open-cast exploitation of peat deposits has led to the creation of post-exploitation reservoirs. All reservoirs are endorheic and show large annual fluctuations in the water level. They are astatic reservoirs. The opposite is natural bog lakes with a stable water level throughout the year. The electrical conductivity of the water is very low and, therefore, the concentration of the main cations and anions in the water is also very low. Only in two pit lakes was the electrical conductivity of water statistically higher than in natural lakes. No statistically significant differences were found between the remaining pit lakes and natural lakes. The highest value of electrical conductivity was found in reservoirs with the most significant fluctuations in the water level. It is related to evaporation, which leads to the solution thickening and, thus, an increase in the concentration of ions. The waters of natural lakes have different hydrochemical types that change annually, distinguishing them from post-exploitation peat reservoirs. Depending on the degree of depletion, the water in the reservoirs has a different colour and, thus, a different HSI value. Therefore, the investigated reservoirs were classified from mesohumic to hyperhumic. Despite their anthropogenic origin, all reservoirs also belong to a sporadic type of dystrophic reservoir. The features of reservoir dystrophy (apart from the HDI) include a low concentration of calcium and magnesium and a very acidic reaction of the waters.

Author Contributions

Conceptualization, T.M.; Data curation, B.K., P.L. and W.R.; Formal analysis, J.K.; Methodology, B.K., P.L. and W.R.; Visualization, I.M.; Writing—original draft, T.M. and J.K. All authors have read and agreed to the published version of the manuscript.

Funding

This research received no external funding, from its own resources the university.

Conflicts of Interest

The authors declare no conflict of interest.

References

  1. Jankowski, A.T. From Research on Anthropogenic Water Reservoirs in the Upper Silesian Area; Selected Geographical Issues; WNoZ UŚ: Sosnowiec, Poland, 1995. (In Polish) [Google Scholar]
  2. Molenda, T. Impact of Saline Mine Water: Development of a Meromictic Reservoir in Poland. Mine Water Environ. 2014, 33, 327–334. [Google Scholar] [CrossRef]
  3. Molenda, T. Conditions for development of anthropogenic meromictic reservoirs in the workings of crystalline rocks (based on the examples of the quarries of the Žulovská pahorkatina, NE Czech Republic). Environ. Earth Sci. 2015, 74, 2259–2271. [Google Scholar] [CrossRef] [Green Version]
  4. Kubiak, J.; Machula, S.; Choiński, A. Particular Example of Meromixis in the Anthropogenic Reservoir. Carpath. J. Earth Environ. Sci. 2017, 13, 5–13. [Google Scholar] [CrossRef]
  5. Molenda, T.; Ciupa, T.; Suligowski, R. The properties of reservoir water in post mining excavations of Cambrian and Devoni-an quartzite sandstones (Holy Cross Mountains). Environ. Earth Sci. 2020, 79, 1–9. [Google Scholar] [CrossRef]
  6. Castendyk, D.N.; Eary, L.E.; Balistrieri, L.S. Modeling and management of pit lake waterchemistry 1: Theory. Appl. Geochem. 2015, 57, 267–288. [Google Scholar] [CrossRef]
  7. Castendyk, D.; Balistrieri, L.; Gammons, C.; Tucci, N. Modeling and management of pit lake water chemistry 2: Case studies. Appl. Geochem. 2015, 57, 289–307. [Google Scholar] [CrossRef]
  8. Molenda, T.; Kidawa, J. Natural and Anthropogenic Conditions of the Chemical Composition of Pit Lake Waters (Based on Example Pit Lakes from Central Europe). Mine Water Environ. 2020, 39, 473–480. [Google Scholar] [CrossRef] [Green Version]
  9. Czop, M.; Motyka, J.; Sracek, O.; Szuwarzyński, M. Geochemistry of the Hyperalkaline Gorka Pit Lake (pH > 13) in the Chrzanow Region, Southern Poland. Water, Air, Soil Pollut. 2010, 214, 423–434, ISSN 0049-6979. [Google Scholar] [CrossRef]
  10. Motyka, J.; Postawa, A. Influence of contaminated Vistula River water on the groundwater entering the Zakrzówek limestone quarry, Cracow region, Poland. Environ. Earth Sci. 2000, 39, 398–404. [Google Scholar] [CrossRef]
  11. Sierka, E.; Stalmachova, B.; Molenda, T.; Chmura, D.; Pierzchała, Ł. Environmental and Socio-Economic Importance of Mining Subsidence Reservoirs; Technicka Literatura BEN: Praha, Czech Republic, 2012; p. 128. [Google Scholar]
  12. Damnjanović, B.; Novković, M.; Vesić, A.; Živković, M.; Radulović, S.; Vukov, D.; Anđelković, A.; Cvijanović, D. Biodiversity-friendly designs for gravel pit lakes along the Drina River floodplain (the Middle Danube Basin, Serbia). Wetl. Ecol. Manag. 2019, 27, 1–22. [Google Scholar] [CrossRef]
  13. Blaen, P.J.; Macdonald, M.A.; Bradbury, R. Ecosystem services provided by a former gravel extraction site in the uk under two contrasting restoration states. Conserv. Soc. 2016, 14, 48. [Google Scholar] [CrossRef]
  14. Gutry-Korycka, M.; Werner-Więckowska, H. Przewodnik do Hydrograficznych Badań Terenowych; Wydawnictwo Naukowe PWN: Warszawa, Poland, 1996. (In Polish) [Google Scholar]
  15. Macioszczyk, A.; Dobrzyński, D. Hydrogeochemia; Wydawnictwo Naukowe PWN: Warszawa, Poland, 2002. (In Polish) [Google Scholar]
  16. Hakanson, L.; Boulion, V.V. Regularities in primary production. Secchi depth and fish yield and a new system define trophic and humic state indices for lake ecosystems. Int. Rev. Hydrobiol. 2001, 86, 23–62. [Google Scholar] [CrossRef]
  17. Górniak, A. A new version of the Hydrochemical Dystrophy Index to evaluate dystrophy in lakes. Ecol. Indic. 2017, 78, 566–573. [Google Scholar] [CrossRef]
  18. R Development Core Team, R. A Language and Environment for Statistical Computing; R Foundation for Statistical Computing: Vienna, Austria, 2009. [Google Scholar]
  19. Kowalczyk, C. Wioślarki (Cladocera) i Widłonogi (Copepoda) Dołów Potorfowych w Okolicach Parczewa; Sectio C, Biologia; Annales Universitatis Mariae Curie-Skłodowska: Lublin, Poland, 1969; Volume 24, pp. 323–339. [Google Scholar]
  20. Radwan, S. Wrotki (Rotatoria) Torfianek Okolic Parczewa; Sectio C, Biologia; Annales Universitatis Mariae Curie-Skłodowska: Lublin, Poland, 1974; Volume 29, pp. 215–230. [Google Scholar]
  21. Staniszewski, R.; Frankowski, P.; Kayzer, D.; Zbierska, J.; Achtenberg, K. Reconstruction of Ancient Lake after Peat Excavation—A Case Study about Water Quality. Appl. Sci. 2021, 11, 4213. [Google Scholar] [CrossRef]
  22. Mętrak, M.; Pawlikowski, P.; Suska-Malawska, M. Age and Land Use as Factors Differentiating Hydrochemistry and Plant Cover of Astatic Ponds in Post-Agricultural Landscape. J. Water Land Dev. 2014, 21, 29–37. [Google Scholar] [CrossRef] [Green Version]
  23. Tobolski, K. Torfowiska na Przykładzie Ziemi Świeckiej; Towarzystwo Przyjaciół Dolnej Wisły: Świecie, Poland, 2003; p. 255. (In Polish) [Google Scholar]
  24. Arvola, L.; Rask, M.; Forsius, M.; Ala-Opas, P.; Keskitalo, J.; Kulo, K.; Kurkilahti, M.; Lehtovaara, A.; Sairanen, S.; Salo, S.; et al. Food Web Responses to Artificial Mixing in a Small Boreal Lake. Water 2017, 9, 515. [Google Scholar] [CrossRef] [Green Version]
  25. Zieliński, A. Wstępne Badania Właściwości Fizyczno-Chemicznych Wód Jezior w Lasach Golejowskich koło Staszowa (Niecka Połaniecka). [w:] Ciupa T; Suligowski, R.C., Ed.; Woda w Badaniach Geograficznych: Kielce, Poland, 2010; pp. 253–259. [Google Scholar]
  26. Gos, K.; Bociąg, K.; Banaś, K. Roślinność Podwodna w Kwaśnych Jeziorach Pomorza [w:]; Banaszak, J., Tobolski, K., Eds.; Park Narodowy Bory Tucholskie, WSP: Bydgoszcz, Poland, 1998; pp. 261–277. (In Polish) [Google Scholar]
  27. Górniak, A.; Kajak, Z. Hydrobiologia-Limnologia; Wydawnictwo Naukowe PWN: Warszawa, Poland, 2020; p. 452. (In Polish) [Google Scholar]
  28. Ponziani, M.; Slob, E.C.; Ngan-Tillard, D.J.M.; Vanhala, H. Influence of water content on the electrical conductivity of peat. Int. Water Technol. J. 2011, 1, 14–21. [Google Scholar]
  29. Walter, J.; Lück, E.; Bauriegel, A.; Richter, C.; Zeitz, J. Multi-scale analysis of electrical conductivity of peatlands for the assessment of peat properties. Eur. J. Soil Sci. 2015, 66, 639–650. [Google Scholar] [CrossRef]
  30. Sugier, P. Ecological Processes and Properties of Excavated Peatlands of Eastern Poland; Towarzystwo Wydawnictw Nau-Kowych Libropolis: Lublin, Poland, 2014; p. 170. [Google Scholar]
  31. Sender, A.; Mysiak, G. Hydrobotanic Characteristic of Some Peat-Pits of the Polesie National Park with Special Emphasis on Charophytes; Sectio C, Biologia; Annales Universitatis Mariae Curie-Skłodowska: Lublin, Poland, 2010; Volume 65, pp. 47–57. [Google Scholar]
  32. Goldstein, R.A.; Gherini, S.A.; Chen, C.W.; Mok, L.; Hudson, R.J.M. Integrated acidification study (ILWAS): A mechanistic ecosystem analysis. Philos. Trans. R. Soc. B: Biol. Sci. 1984, 305, 409–425. [Google Scholar] [CrossRef]
  33. Asbury, C.E.; Vertucci, F.A.; Mattson, M.D.; Likens, G.E. Acidification of Adirondack lakes. Environ. Sci. Technol. 1989, 23, 362–365. [Google Scholar] [CrossRef]
  34. Choiński, A. Jeziora Kuli Ziemskiej; Wydawnictwo Naukowe PWN: Warszawa, Poland, 2000. (In Polish) [Google Scholar]
  35. Engelhard, W. Przewodnik-Flora i Fauna Wód Śródlądowych; Multico: Warszawa, Poland, 1998. (In Polish) [Google Scholar]
  36. Górniak, A. Dystrophy level in the “suchars” of Wigry National Park. Rocz. Augustowsko-Suw. 2004, 4, 45–52. (In Polish) [Google Scholar]
Figure 1. Map of the research area. The numbers represent the locations of the studied reservoirs. Locations 1 and 2 are the control (natural) lakes, and locations 3 to 9 are the post-exploitation reservoirs.
Energies 15 02681 g001
Figure 2. Types of the studied reservoirs: (A) natural bog lake, (B) post-exploitation peat reservoir, the basin of which is cut in mineral formations (sands), and (C) post-exploitation peat reservoir, the basin of which is partially cut in peat.
Energies 15 02681 g002
Figure 3. Geomorphological conditions of the location of the post-exploitation peat reservoir 3: 1: dune ridgeline, 2: reservoir bank (source: own study based on an image LIDAR obtained from geoportal.gov.pl (accessed on 27 December 2021)).
Energies 15 02681 g003
Figure 4. A drone image of post-exploitation peat reservoir 3.
Energies 15 02681 g004
Figure 5. A drone image of control site 2, a natural bog lake, with floating mats and islands.
Energies 15 02681 g005
Figure 6. Geomorphological conditions of the location of the post-exploitation peat reservoir 9: 1: dune ridgeline, 2: reservoir shoreline at the lowest water level, and 3: reservoir shoreline at the highest water level (source: own study based on an image LIDAR obtained from geoportal.gov.pl (accessed on 27 December 2021)).
Energies 15 02681 g006
Figure 7. Electrical conductivity of the water in the examined reservoirs (different letters demonstrate significant differences at p < 0.01).
Energies 15 02681 g007
Figure 8. Water reaction in the examined reservoirs (different letters demonstrate significant differences at p < 0.01).
Energies 15 02681 g008
Figure 9. The correlation between DOC/colour in the water of the studied reservoirs (rs = 0.92, p < 0.01).
Energies 15 02681 g009
Table 1. Location and surface area of the studied reservoirs.
Reservoir NumberLocationArea
1N: 50°56′07.14″ E: 19°34′38.71″1.90 ha
2N: 50°55′34.80″ E: 19°35′38.31″1.00 ha
3N: 50°57′14.11″ E: 19°35′59.88″7.30 ha
4N: 50°59′42.89″ E: 19°38′36.21″0.66 ha
5N: 50°59′41.04″ E: 19°38′53.22″1.70 ha
6N: 50°58′36.13″ E: 19°39′27.12″0.25 ha
7N: 50°57′03.96″ E: 19°42′09.16″0.47 ha
8N: 50°57′31.96″ E: 19°43′08.22″0.15 ha
9N: 51°07′14.11″ E: 19°39′03.33″9.80 ha
Table 2. (a,b) Chemical composition of water in the studied reservoirs [mg/L] (mean, standard deviation; n = 5.
(a)
Reservoir NumberCa2+Mg2+Na+K+Hydrochemical Type
11.9 ± 0.610.42 ± 0.121.4 ± 0.810.7 ± 0.62Cl-Ca
SO4-Cl-Ca
SO4-Cl-Ca-Na
22.4 ± 0.620.55 ± 0.171.78 ± 0.591 ± 0.61Cl-Ca
SO4-Cl-Ca
SO4-Ca-Na
Cl-SO4-Ca-Na
318.9 ± 6.93.61 ± 1.663.86 ± 2.311.69 ± 1.84SO4-Ca
429.1 ± 21.35.48 ± 4.474.58 ± 3.392.85 ± 3.43SO4-Ca
510.1 ± 3.91.77 ± 0.661.53 ± 0.50.8 ± 0.08SO4-Ca
67.1 ± 2.90.73 ± 0.231.1 ± 0.551.41 ± 1.33SO4-Ca
77.5 ± 1.51.35 ± 0.231.45 ± 0.220.95 ± 0.32SO4-Ca
810.6 ± 4.41.02 ± 0.321.43 ± 0.220.62 ± 0.16SO4-Ca
94 ± 0.451.05 ± 0.171.6 ± 0.385 ± 0.8SO4-Ca
(b)
Reservoir NumberHCO3ClSO42−NO3DOCCOLOUR
17 ± 12.67 ± 1.23.6 ± 4.30.23 ± 0.022.4 ± 3.5196 ± 6
24.8 ± 12.66 ± 0.155.1 ± 2.70.3 ± 0.0530 ± 9243 ± 98
32.5 ± 25.17 ± 2.6271.5 ± 32.40.76 ± 1.2215 ± 658 ± 12
406.32 ± 3.1799 ± 772.67 ± 3.9114 ± 744 ± 9
52.5 ± 2.51.72 ± 0.2227.7 ± 14.81.04 ± 0.9615 ± 4.750 ± 10
66.5 ± 21.97 ± 0.7822.1 ± 191.11 ± 1.0616 ± 2.272 ± 38
74.5 ± 32.25 ± 0.4215.5 ± 3.40.7 ± 0.5330 ± 9.3267 ± 80
85 ± 3.52.52 ± 0.5523 ± 8.60.28 ± 0.0636.5 ± 6.4436 ± 90
95 ± 0.81.2 ± 0.5812.2 ± 2.30.7 ± 0.2318 ± 2171 ± 9
Table 3. Value of HSI and HDI indexes in the water of the studied reservoirs (range, average; n = 5).
Water Resrvoir NumberHSIClassificationHDIClassification
1 (natural lake)72–80
76
polyhumic81–95
73
moderate
dystrophy
2 (natural lake)73–85
79
polyhumic71–96
86
high
dystrophy
3 (pit lake)51–58
54
mesohumic 87–93
89
high
dystrophy
4 (pit lake)52–59
55
mesohumic87–90
88
high
dystrophy
5 (pit lake)55–70
63
mesohumic73–92
86
high
dystrophy
6 (pit lake)58–92
76
polyhumic66–78
74
moderate
dystrophy
7 (pit lake)73–89
81
polyhumic72–95
88
high
dystrophy
8 (pit lake)79–86
84
hyperhumic79–87
83
high
dystrophy
9 (pit lake)74–79
76
polyhumic83–93
90
high
dystrophy
Publisher’s Note: MDPI stays neutral with regard to jurisdictional claims in published maps and institutional affiliations.

