
Study on the Causes of Water Blocking Damage and Its Solutions in Gas Reservoirs with Microfluidic Technology

1
School of Banking and Finance, University of International Business and Economics, Beijing 300201, China
2
School of Petroleum Engineering, Yangtze University, Jingzhou 451199, China
*
Authors to whom correspondence should be addressed.
Energies 2022, 15(7), 2684; https://0-doi-org.brum.beds.ac.uk/10.3390/en15072684
Submission received: 23 February 2022
/
Revised: 27 March 2022
/
Accepted: 31 March 2022
/
Published: 6 April 2022
(This article belongs to the Special Issue Shale Oil and Gas Accumulation Mechanism)
Abstract
:The water blocking damage to the reservoir caused by the invasion of external fluid is one of the main factors that affect the efficient development of tight sandstone gas reservoirs. In this paper, microfluidic chip technology is used to explore the causes of water blocking damage in porous media and find suitable recovery solutions. The research results show that reducing the gas-liquid capillary pressure can effectively reduce the rate and quantity of spontaneous speed of cores. After chemical treatment, the liquid phase fluidity of the non-fractured matrix core is increased by 1.72 times, and that of the fractured core is increased by 2.13 times. In water wetting porous media, there are mainly four types of liquid hold-up: (1) Liquid hold-up in the dead volume of a non-connected pore; (2) The water phase in the pore throat with a small inner diameter cannot be driven away due to its larger capillary pressure; (3) Adsorption viscous force, the wetting phase is adsorbed on the surface of the solid phase; (4) Reservoir heterogeneity. The water blocking damage can be removed to a certain extent by changing the gas injection pressure, the gas injection method, or adding a wetting modifier.
1. Introduction
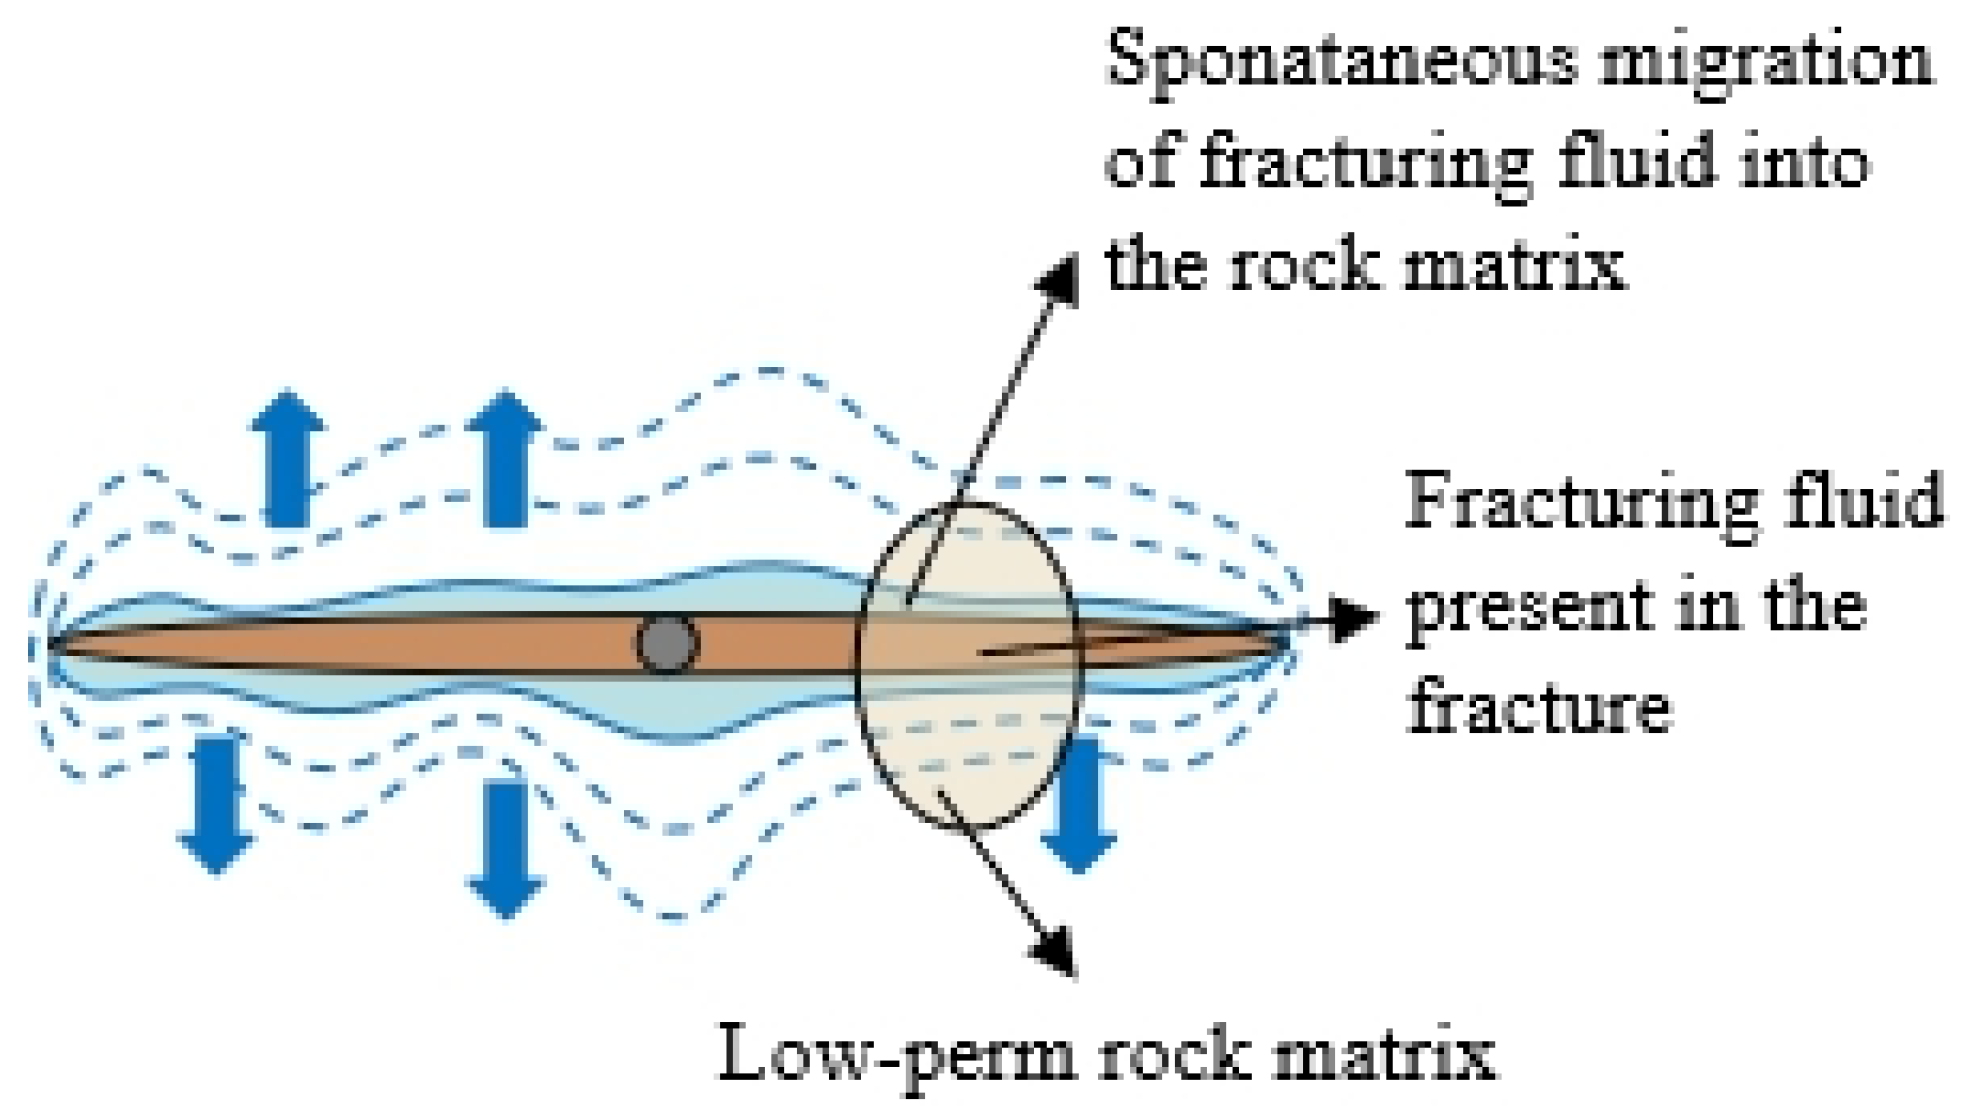
With the increase in worldwide energy consumption, developers try to realize yield maximization through modern technologies such as horizontal wells and high-temperature well drilling. An increasing number of technologies are used for the exploitation of unconventional oil and gas resources, and they can increase the oil drainage area near the wellbore and reduce the oil and gas seepage resistance. Currently, unconventional gas resources are playing an increasingly major role in supplying energy demand. At present, in the United States, unconventional natural gas production accounts for nearly 45% of the existing resources, including 70% of the undeveloped tight sandstone natural gas [1,2]. During the hydraulic fracturing of tight oil-gas reservoirs, a great quantity of water is pumped into the formation, but less than half of the water can be flowed back [3,4,5]. After fracturing, much water remains in fractured tight reservoirs [6], and residual water in the fracture network can reduce fracture diverting capacity. However, water intrusion in the reservoir matrix can generate “water blocking damage” and reduce hydrocarbon flow [7,8]. New chemicals are added to the fracturing fluid to increase the flowback rate in the fracturing process to reduce the “water blocking damage”. The formation of “water blocking damage” consists of two stages during fracturing to flowback completion (Figure 1).
(1) In tight sandstone gas reservoirs, the sentence was revised, pls refer to L44–45. “Generally, the initial saturated water (Swi) in tight sandstone gas reservoirs is lower than itself irreducible water saturation (Swir) when it is not exploited [9].” At this time, there is overpressure capillary pressure in the reservoir, which is in an ultra-low water content condition. When the external fluid contacts the reservoir, it is easily sucked into the pores. During fracturing, the injected fluid will sweep into the formation and reduce the relative permeability of invasive gas, making the gas permeability near fractures to 0 mD. According to the capillary pressure equation, when the surface tension σ of fluid-gas is reduced and the three-phase contact angle θ of rock/fluid/gas phase approaches 90°, the initial supercapillary pressure can be decreased so as to reduce the initial self-absorption and water blocking damage [10].
(2) After fracturing, the fracturing fluid and other external fluids do not flow back in time, and the tight sandstone pore-throat capillary resistance generates much fracturing fluid to stay in the reservoir, resulting in “water lock damage”. During the discharge process, the liquid is gradually discharged from the large capillary to the small capillary, and the discharge speed is gradually reduced. This is because the throat radius of the tight gas reservoir is small, the pores are bent obviously, the specific surface area is large, the liquid absorption capacity is strong, the liquid drainage is difficult, and the water phase trap is seriously damaged, which is difficult to remove effectively [11,12,13,14].
In summary, the best way to reduce the water blocking damage is to reduce the surface tension of fluid/gas, and the gas/liquid/solid three-phase contact angle. In addition, the three-phase contact angle of the rock/inflow liquid/gas phase should access to 90°, where σ and θ are capillary pressure-related parameters [15]. Li and Firoozabadi (2000) first used fluorine-containing chemicals to transform the wettability of the reservoir rocks into gas-phase wettability. At the same time, the influence of wettability transition on reducing core liquid saturation is studied by a wetting angle test, self-absorption, and core-flow experiments [14]. After that, Noh and Firoozabadi used alcohol-based surfactants to make the reservoir rocks have gas-phase wettability [14]. Sharifzadeh et al. developed a polymer surfactant with fluorine groups to make the rock surface hydrophobic [16]. Karandish, Rahimpour et al. improved the wettability of carbonate reservoirs through anionic fluorochemicals [17] and analyzed the adsorption of chemical agents on the rock surface by SEM (Scanning Electron Microscope) and EDX (Energy Dispersive X-ray Detector) methods. Aminnaji et al. and Erfani Gahrooei et al. wetted and altered carbonate and sandstone reservoir rocks through water-based fluoride nano-emulsion. The results show that nano-emulsion increases fluid flow and makes the rock surface hydrophobic [18,19].
Fluorocarbon surfactants are problematic due to their high price and environmental concerns, so they have not been widely adopted and used, and they are currently still in the experimental laboratory stage. Consequently, it is specifically required to develop non-fluorocarbon nanosurfactants for tight sandstone gas reservoirs. In this study, the causes of water blocking damage in porous media will be explored by microfluidic technology, and then, the environmentally friendly CNDAD1# nanoemulsion for removing water blocking damage was synthesized through a nanodispersion emulsion method [20,21]. Next, the basic physical and chemical characteristics of the nano-emulsion were evaluated, such as surface tension measurement, wettability change, spontaneous imbibition experiment, core flooding experiment, etc. Finally, the removal method will be explored by microfluidic technology to find out more causes of water blocking damage in porous media and a better way to remove it. It can provide visual and intuitive results for other researchers with similar problems for reference.
2. Microfluidic Chip Technology
2.1. Microfluidic Introduction
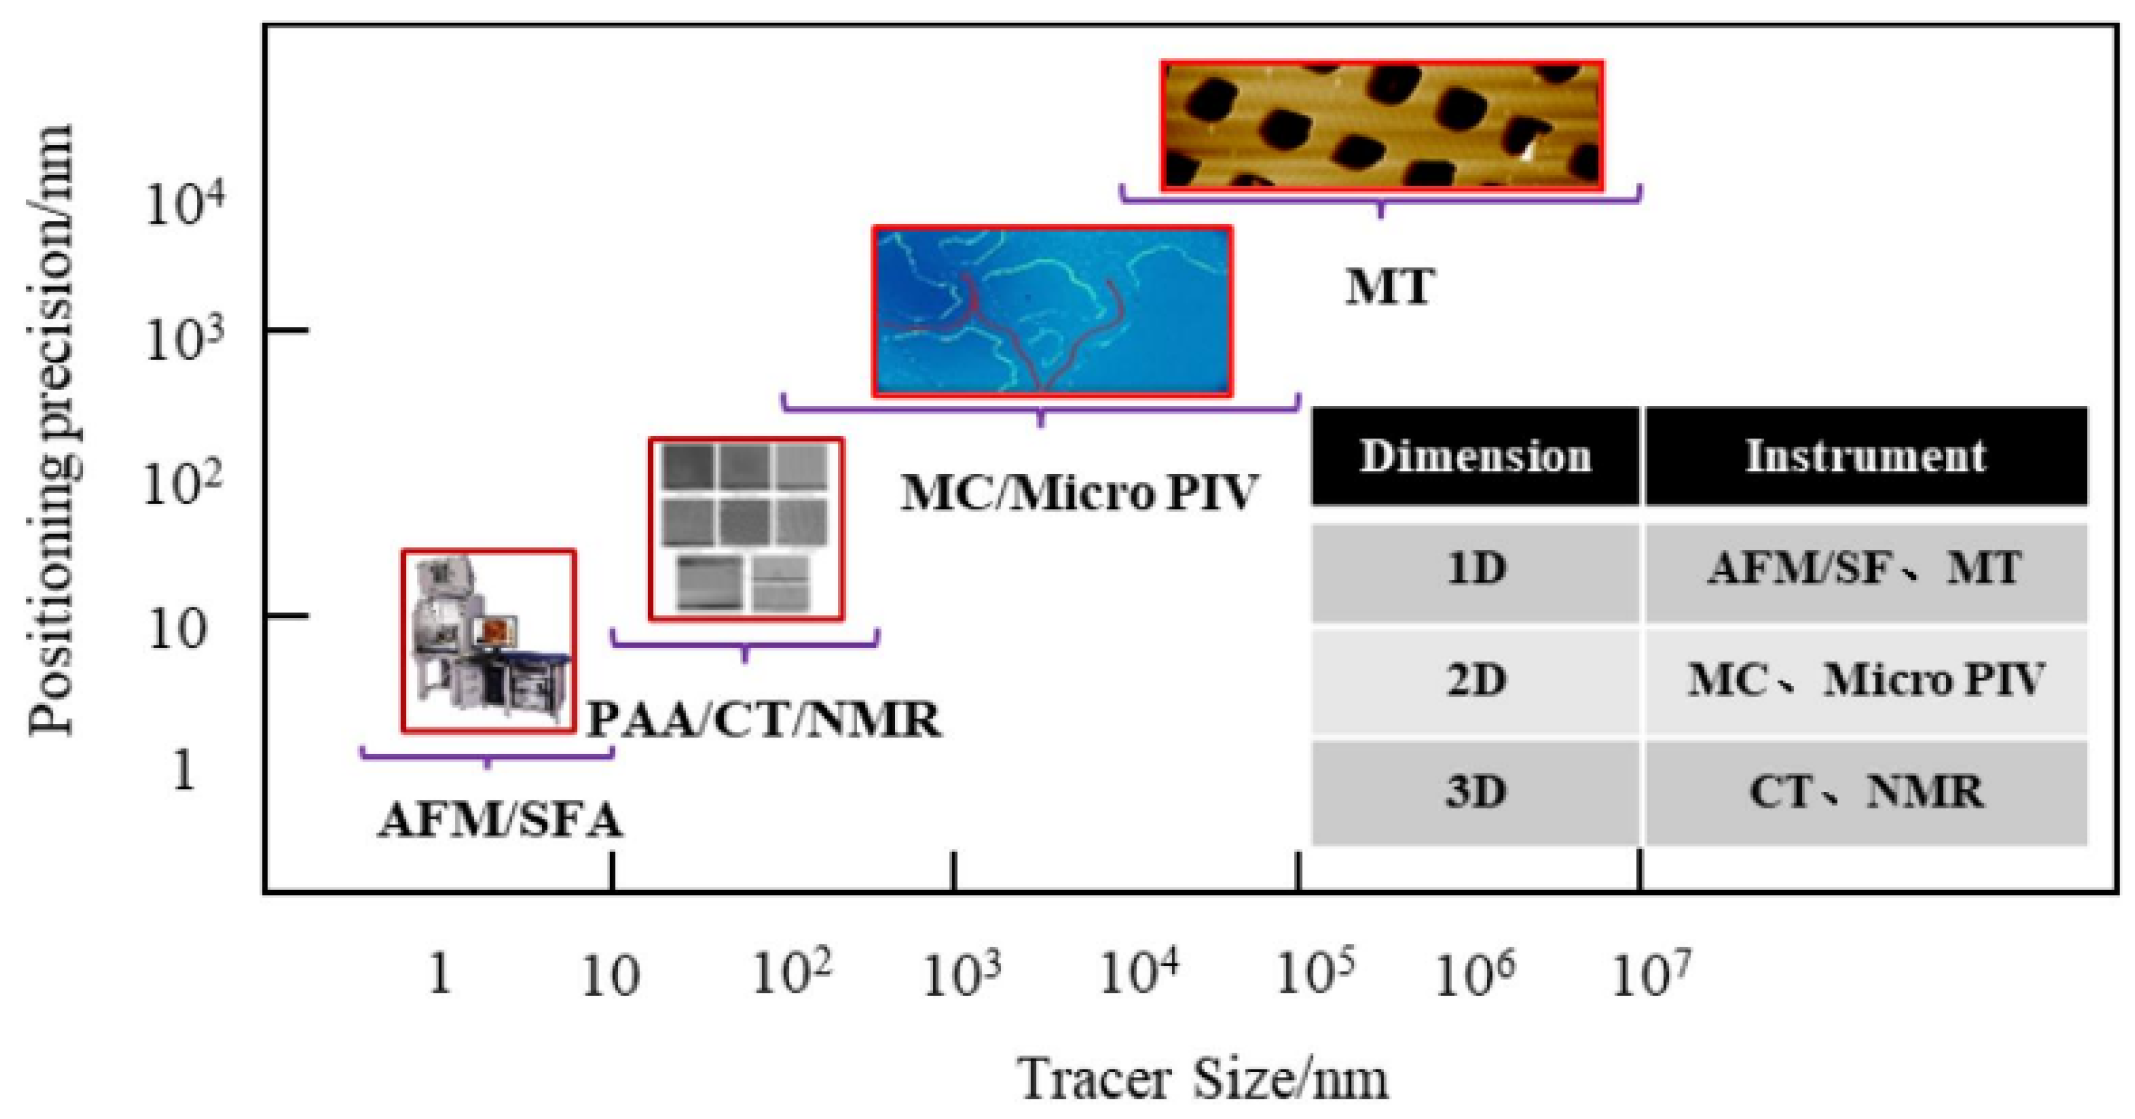
Microscopic visualization experimental research simulations include 1D, 2D, and 3D (as shown in Figure 2). Among them, the 2D visualization experimental model (also known as the microfluidic chip model) is simple to make, easy to operate, and can be reused, and has attracted researcher attention [22]. As early as 1952, microfluidic technology had been applied in the petroleum industry. Chatenever et al. [23] used a glass-made porous media displacement model and observed the microscopic distribution of remaining oil during the displacement process through microscopic magnification. The fluid flowing in micro-nano scale space is usually called micro-nano fluid, and the related technology of micro-fluid displacement control under a low Reynolds number or laminar flow conditions in the micro-nano scale channel is called micro-fluidic technology [24].
In a reservoir, fluid flow is affected by many factors, including gravity, capillary pressure, pore throat structure, viscous force, and driving force [24]. The current microscopic models include idealized grid models and complex structural models with tortuousness [25]. The idealized model does not consider the influence of pore throat structure and the influence of gravity. It can observe the changes in the three-phase contact surface after wetting modification. However, under high driving force, the liquid phase in the model is easy to be completely displaced, and the additional resistance effect in tortuous porous media cannot be simulated. In contrast, the complex structure model was made according to a real core pore throat, which includes tortuousness structure. In the complex structure model, the gas-liquid two-phase flow is mainly driven by capillary pressure when the external driving force is small, and the flow is also influenced by additional resistance. When the external driving force is large, the gas-liquid two-phase flow is mainly dominated by the driving force. Therefore, it is more reasonable to simulate the removal effect on water blocking damage of nano-emulsion under different forces.
2.2. Microfluidic Equipment
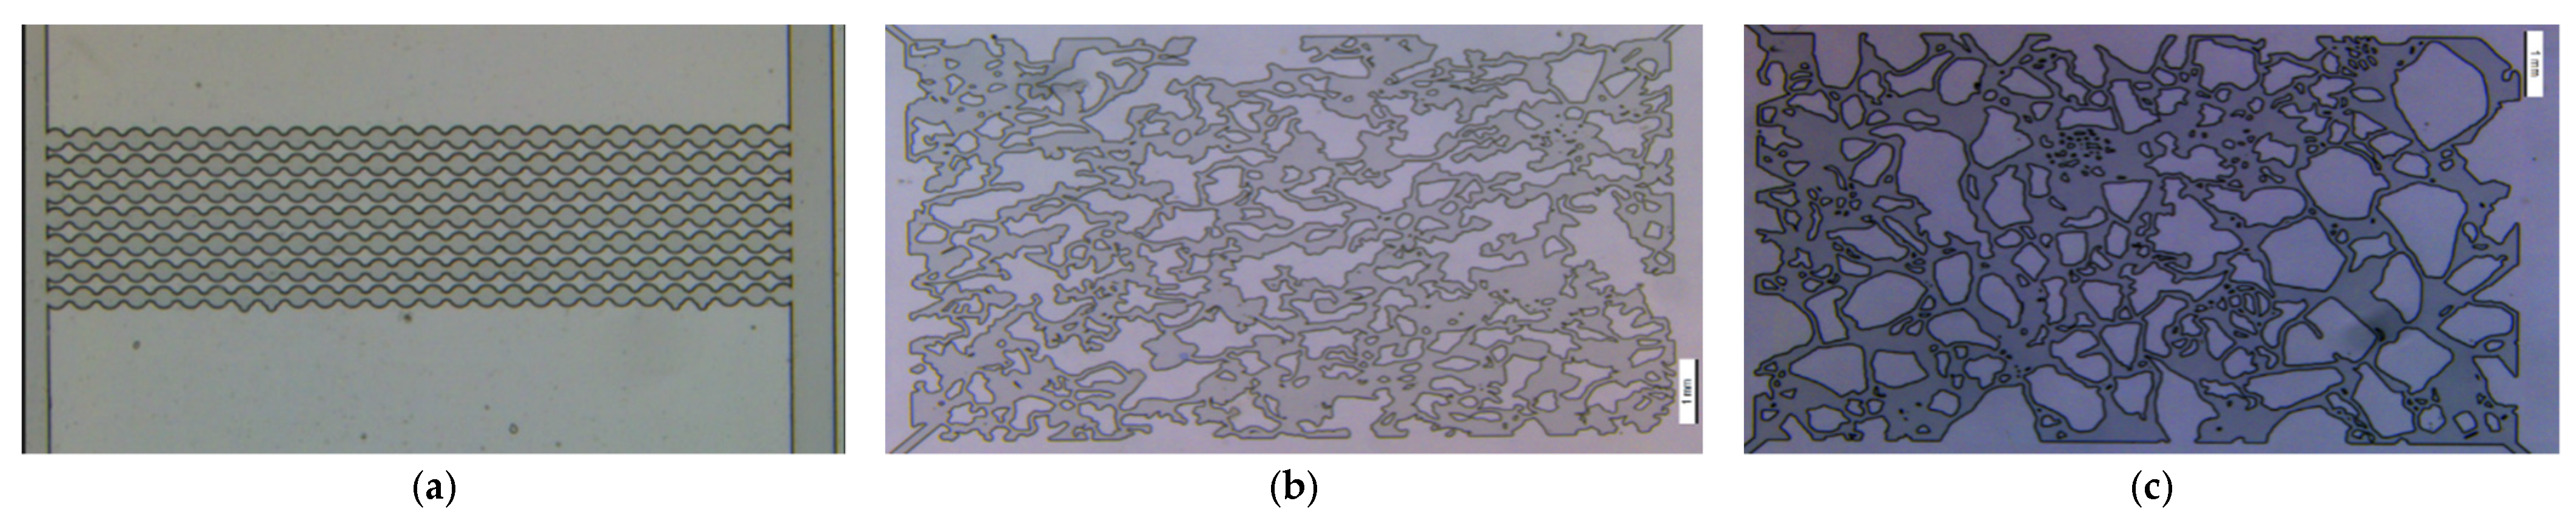
In this paper, microfluidic chip models, including an idealized pore structure mesh model and a complex tortuous structure model, were used to study the microscopic distribution of gas flooding liquid phase before and after the nano-emulsion solution was injected. The inner diameter of the idealized pore structure mesh model is 10 μm (as shown in Figure 3a, and the inner diameters of the complex tortuous structure model are 50 μm and 200 μm, respectively (as shown in Figure 3b,c).
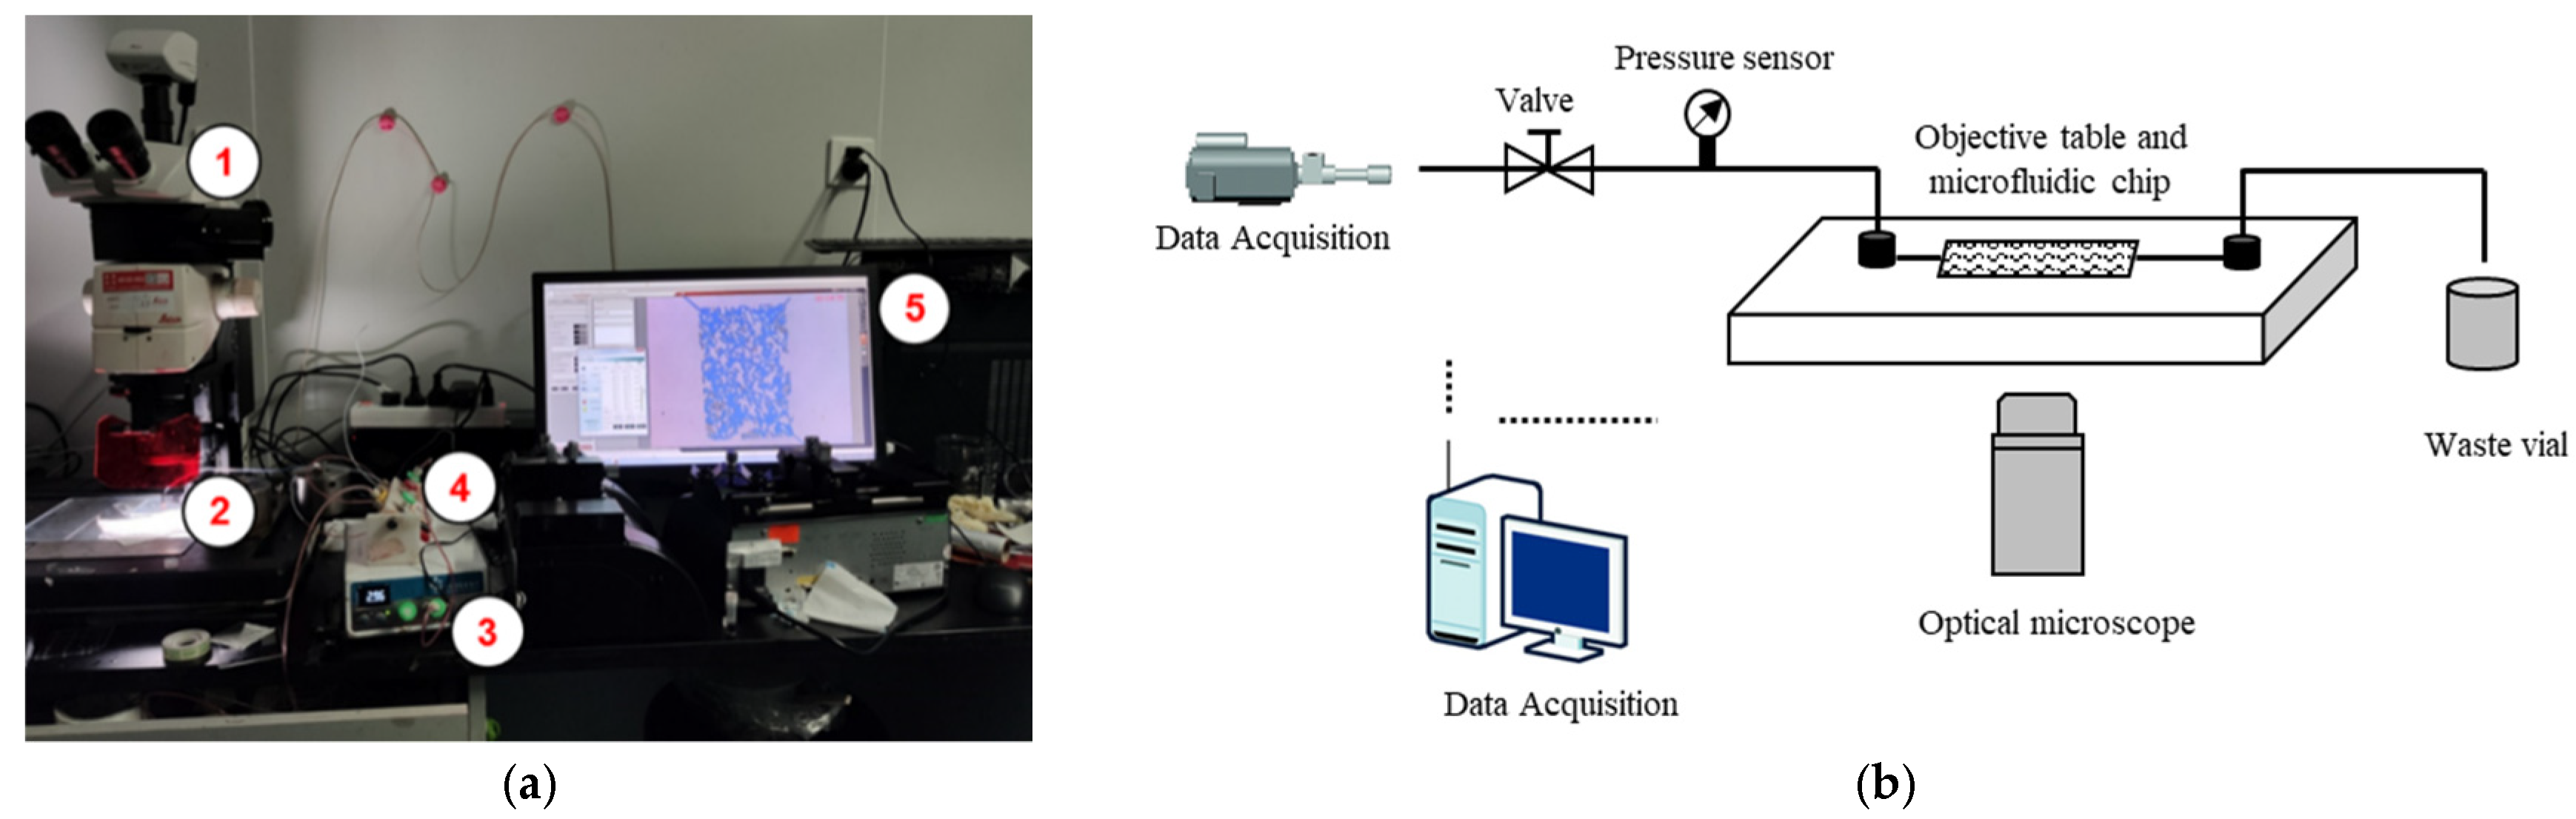
The microfluidic control apparatus is shown in Figure 4, which mainly includes: (1) A Leica M165FC optical microscope, which is mainly used to observe the gas-liquid seepage and distribution in the microfluidic chip; (2) The objective table and the microfluidic chip. The manufactured microfluidic chip was placed on the objective table and fixed in place using the fixing device to prevent the microfluidic chip from sliding during the experiment; (3) A neMESYS type gas constant speed/pressure micro flow pump, which has a small gas flow and can be smartly adjusted and controlled. Connect the gas-liquid buffer tank, and the constant gas flow pumps the liquid in the intermediate tank into the micro flow control chip [26]; (4) Gas/liquid intermediate tank. When the microfluidic chip is saturated with liquid, the intermediate tank is filled with fluid up to 2/3; when the microfluidic chip simulates the gas flooding liquid phase, the intermediate tank contains no liquid, gas flow pump driving the gas in the intermediate tank to the microfluidic chip, and then displaces the liquid in the chip; (5) The equipment control and data acquisition system was mainly composed of micro-magnification pictures and video, and the software controls the size of the gas injection valve for speed control of the gas flow pump. Note, the gas used is nitrogen.
2.3. Experiment Procedure
(1) Outline of the process for building the microfluidic chip. Select a core of the target block and cut it into thin slices; the pore throat structure of the core slices is imaged by the micro-imaging technology, and the contour of the obtained core pore throat structure is clearer by using the image processing software. The microfluidic chip simulating porous media is obtained by the application of the obtained simulation chart on etching glass.
(2) The experimental study on the formation cause analysis of water blocking in porous media. Firstly, the obtained microfluidic chip is installed on the objective table and connected with the gas injection pump. Use a 5 mL syringe to fill the distilled water mixed with dye into an intermediate tank. Turn on the micro-camera and gas flow pump control software, and displace the liquid in the intermediate tank to the chip at a constant flow rate of 500 mbar to ensure that the pores in the chip are completely saturated with liquid. Close the gas flow pump, dump the liquid in the intermediate tank and reconnect the gas flow pump; restart the gas flow pump and pump the gas into the chip at a certain flow rate to simulate gas flooding in porous media. The causes of water blocking were analyzed in different porous media and were studied with different types of microfluidic chips.
(3) Exploration of water blocking damage removal method in porous media. This series of experiments includes the exploration of water blocking damage removal methods before and after using nano-emulsion treatment.
Water blocking damage removal method before using nano-emulsion treatment. First, saturate the microfluidic chip completely with dyed distilled water following step (2), and then displace the saturated microfluidic chip with gas at various injection rates under 500 mbar, 1000 mbar, 2000 mbar, and 3000 mbar, respectively. Observe the liquid phase retention and distribution situation in the chips under each pressure. Before the gas flooding, make sure the chips are completely saturated with dyed distilled water. Alter the gas injection pressure under 500 mbar and 3000 mbar into impulse type, and the gas injection time interval was 2 s between closing and opening; the liquid phase retention and distribution in the chip during pulse gas injection were observed. Alter the types of microfluidic chips, and the liquid phase retention in the chip was studied by the same method with different gas injection pressures and gas injection modes; the liquid phase retention situation in different microchips was compared to explore the method of removing water blocking damage before nano-emulsion treatment.
Water blocking damage removal method after using nano-emulsion treatment. First, the 0.5 wt% CNDAD1# nano-emulsion fluid was prepared. The microfluidic chip was saturated with the nano-emulsion fluid following the same method as step (2), and the chip was left to age for 24 H. The nano-emulsion-treated chip was displaced with gas under 500 mbar, and liquid phase retention in the chip was observed after chemical treatment. After displacement, the dyed distilled water was saturated into the chip at a constant flow rate of 500 mbar to observe the saturated liquid phase ability of the porous media in the chip after the wetting modification. Change for a different type of chips, observe the liquid retention in different types of chips after chemical treatment, and explore the effect of nano-emulsion to remove water blocking damage.
(4) The percentage calculation of the remaining liquid phase in the model. The obtained microfluidic chip was processed into images of the same size. ImageJ software was used to calculate the pixel points of the dye liquid phase in the microfluidic chip at different experimental stages [26]. According to the proportion of remaining pixel points in the dye liquid phase in the model, the removal methods of water blocking damage were evaluated.
3. Results and Discussion
3.1. Causes of Water Blocking Damage in Porous Media
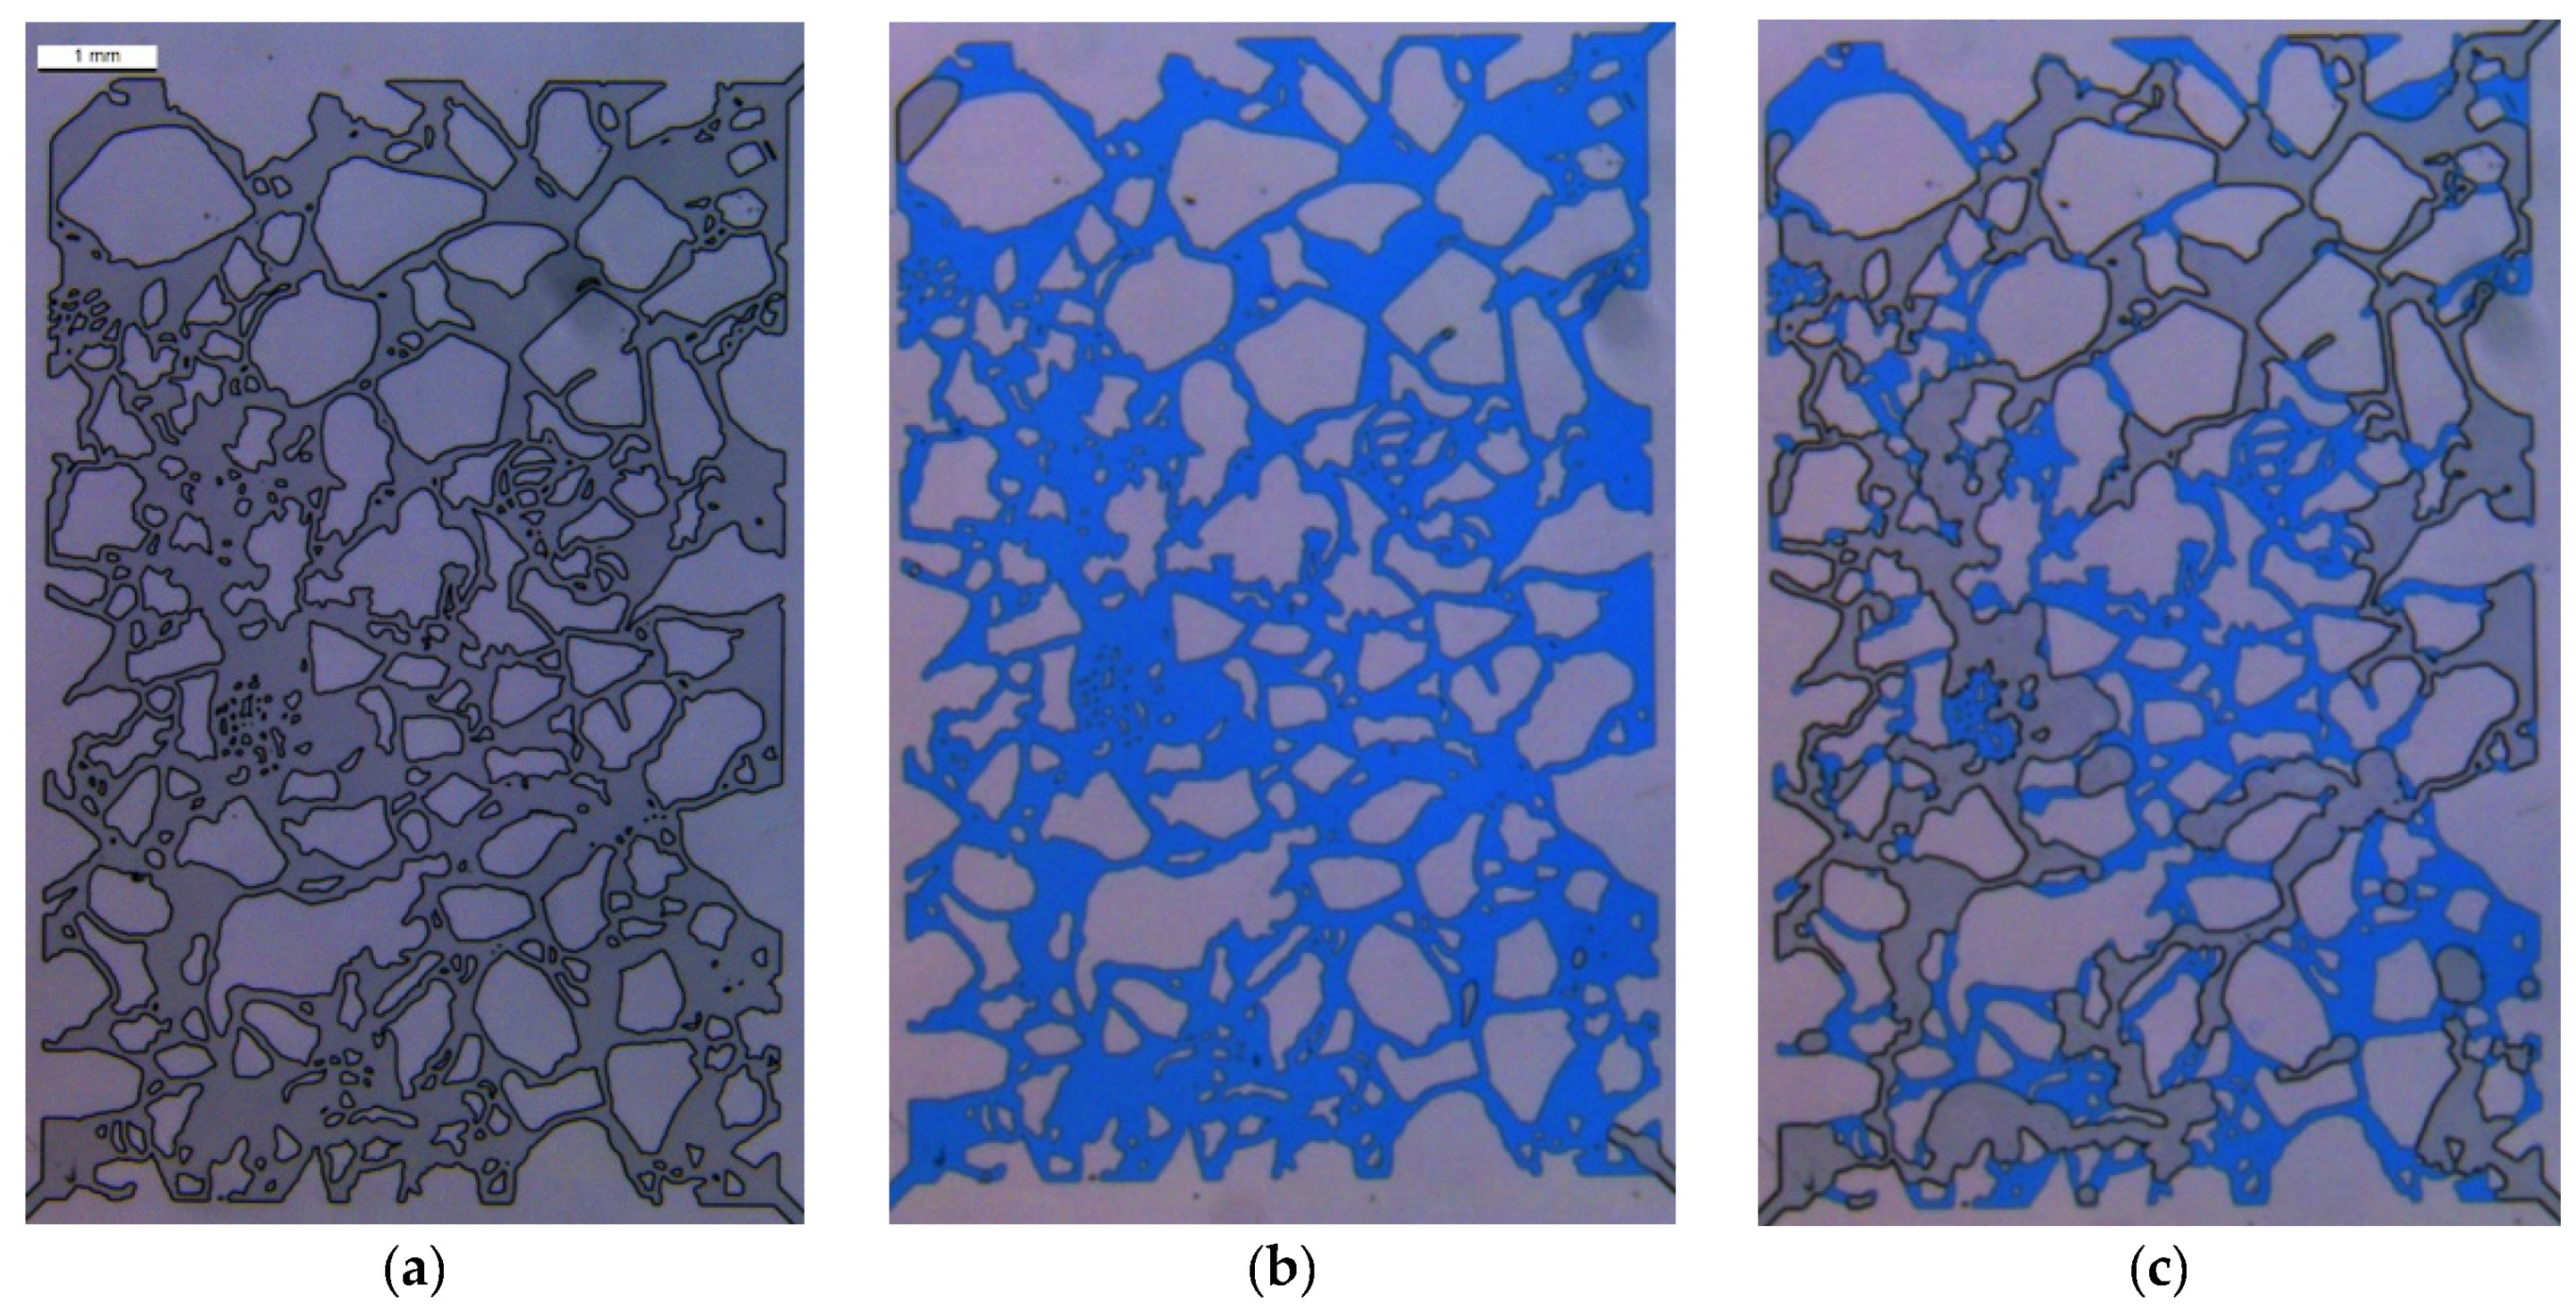
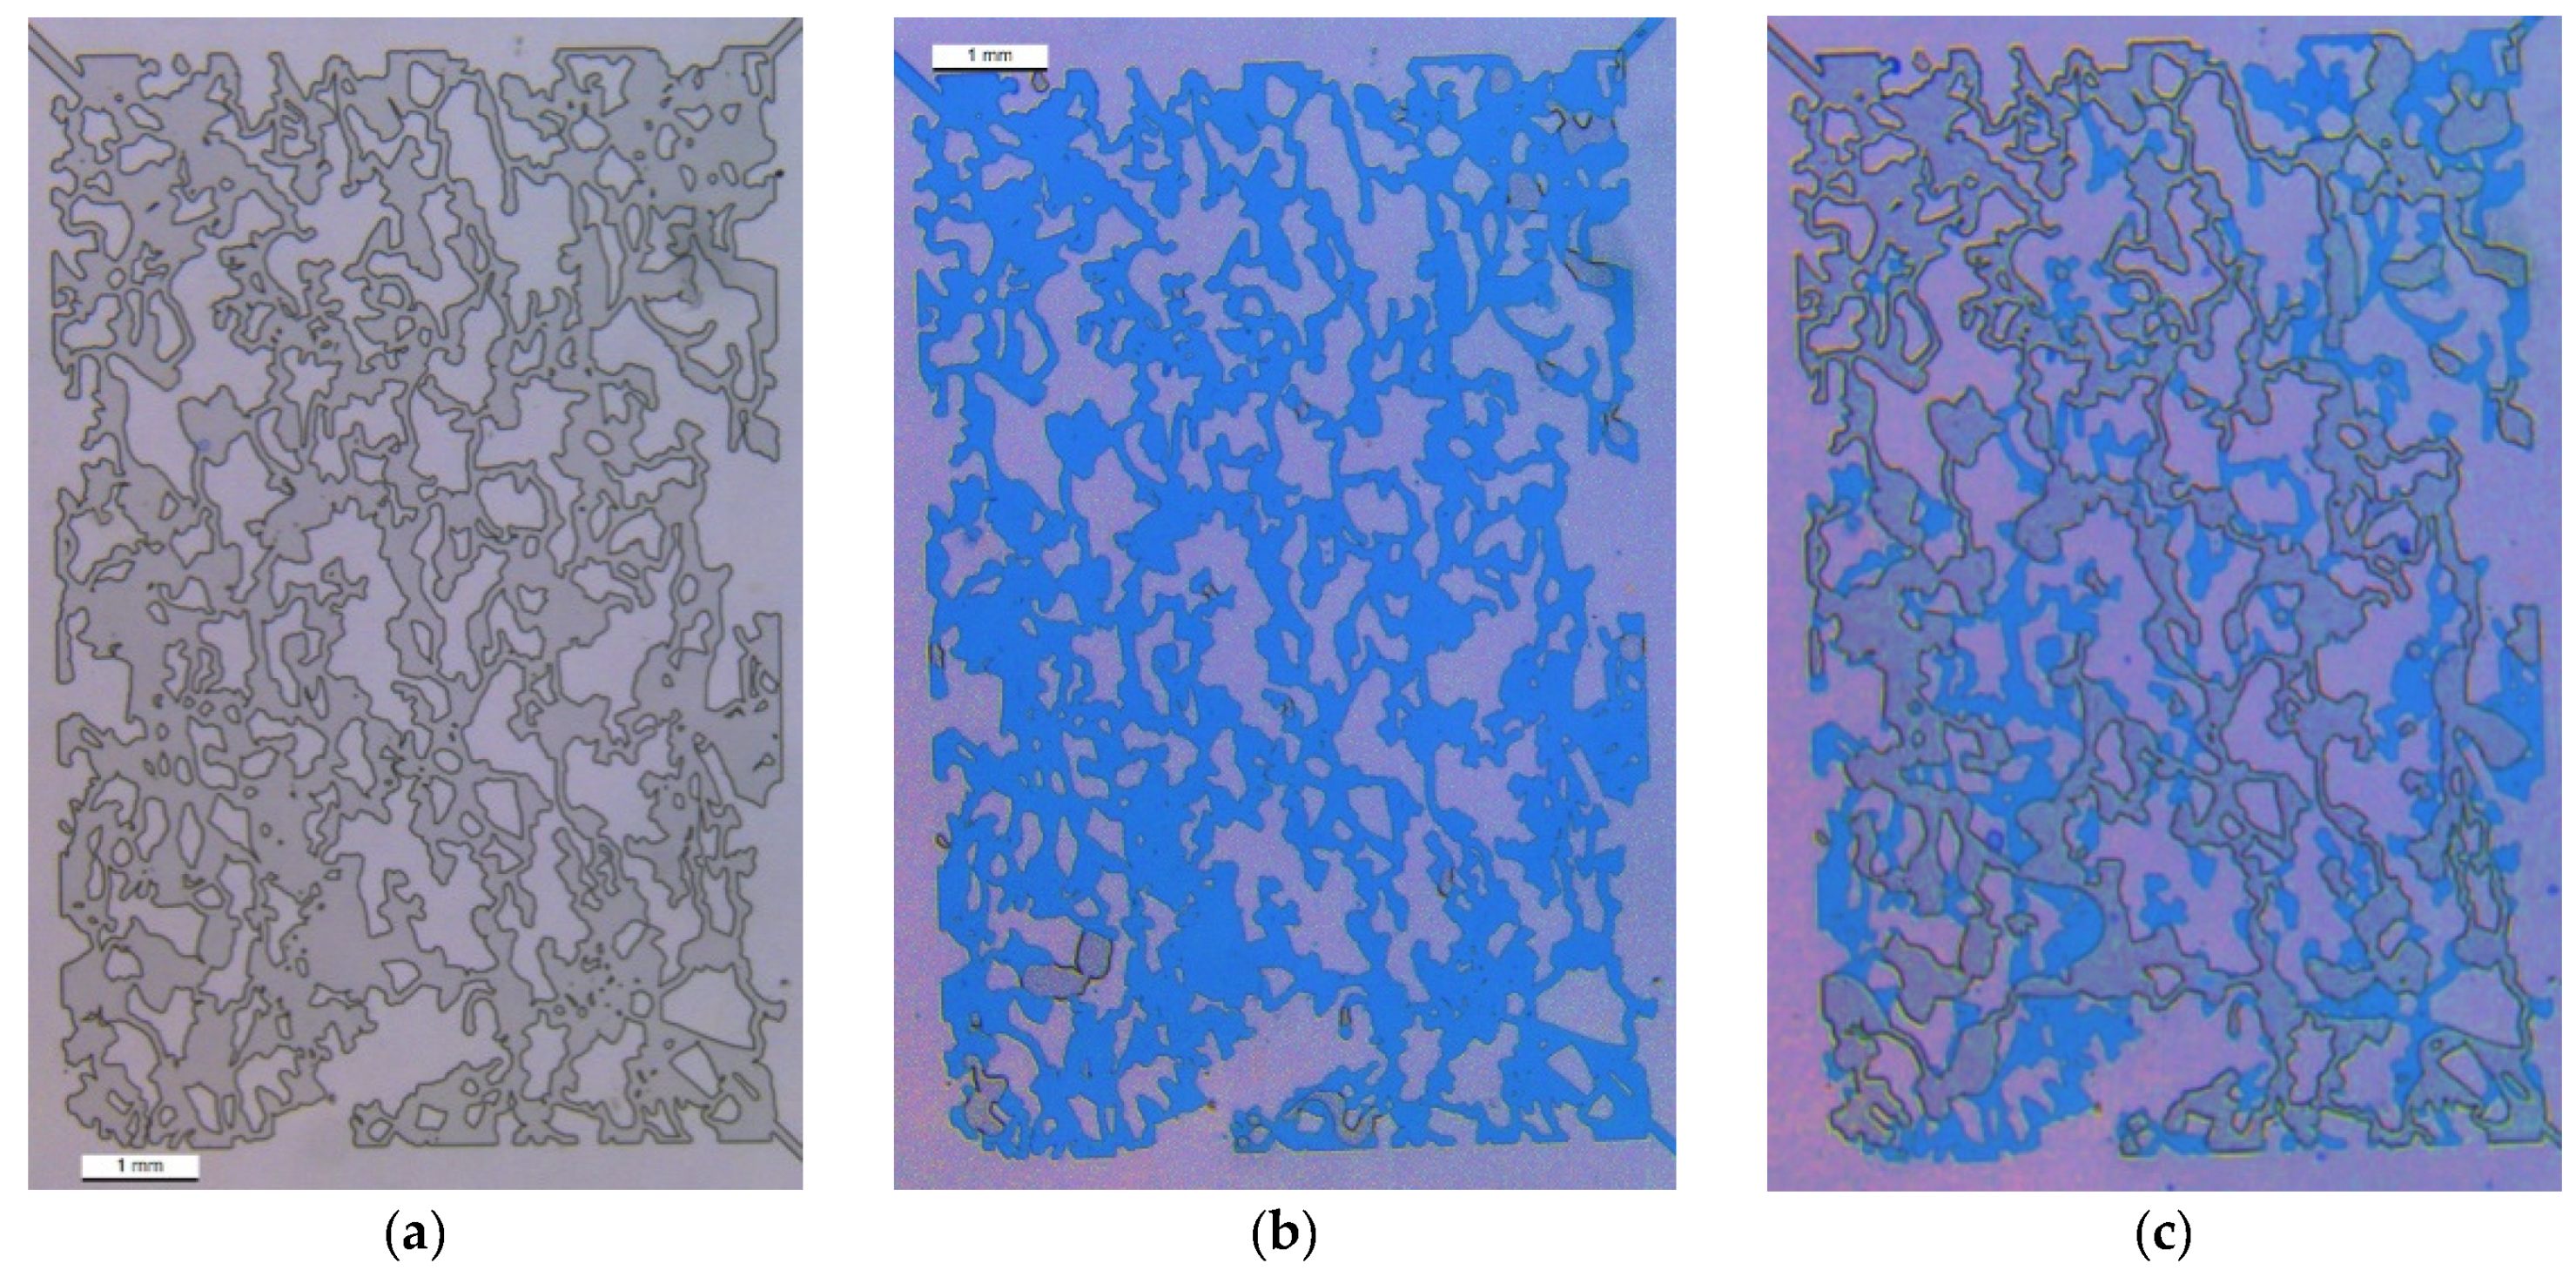
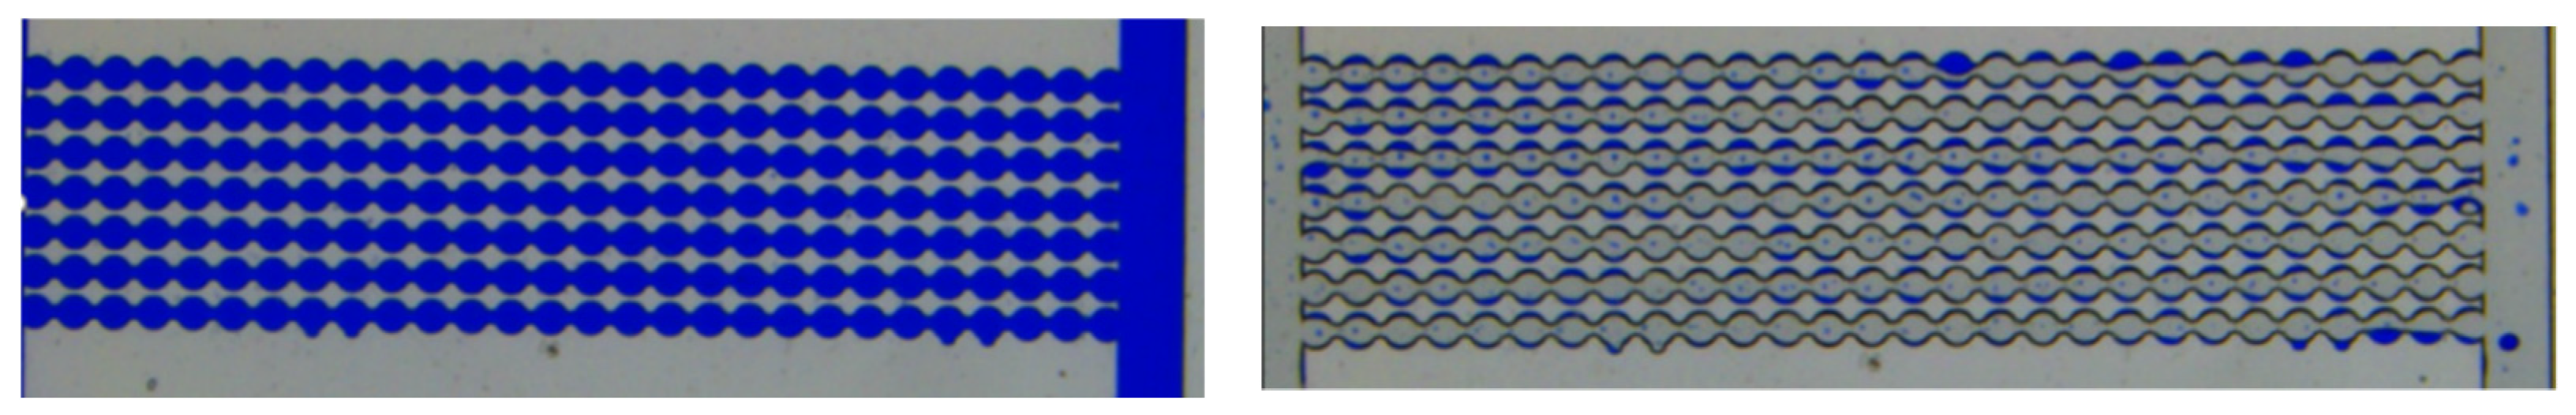
The microfluidic chip is made of glass quartz. Before the chemical treatment, the surface of the inner hole and throat is water phase wetted. Figure 5 shows the liquid retention and distribution of saturated dyed distilled water in a 200 μm model after the application of under 500 mbar of gas. Figure 6 shows the liquid retention and distribution of saturated dyed distilled water in a 50 μm model after the application of 500 mbar of gas. According to the experimental results in Figure 5 and Figure 6, the liquid phase wetting microfluidic model can fully saturate the dyed distilled water, and the constant pressure gas cannot completely displace the aqueous phase in the chip model. The comparison of the 200 μm model and the 50 μm model shows that the liquid retention in smaller inner diameter or bigger tortuosity chip model is more. Due to the fact that capillary resistance is larger for smaller inner diameter chips, the gas easily generates gas channeling when the gas is flooding the liquid ((Figure 5c) as compared with Figure 6c) [20,21].
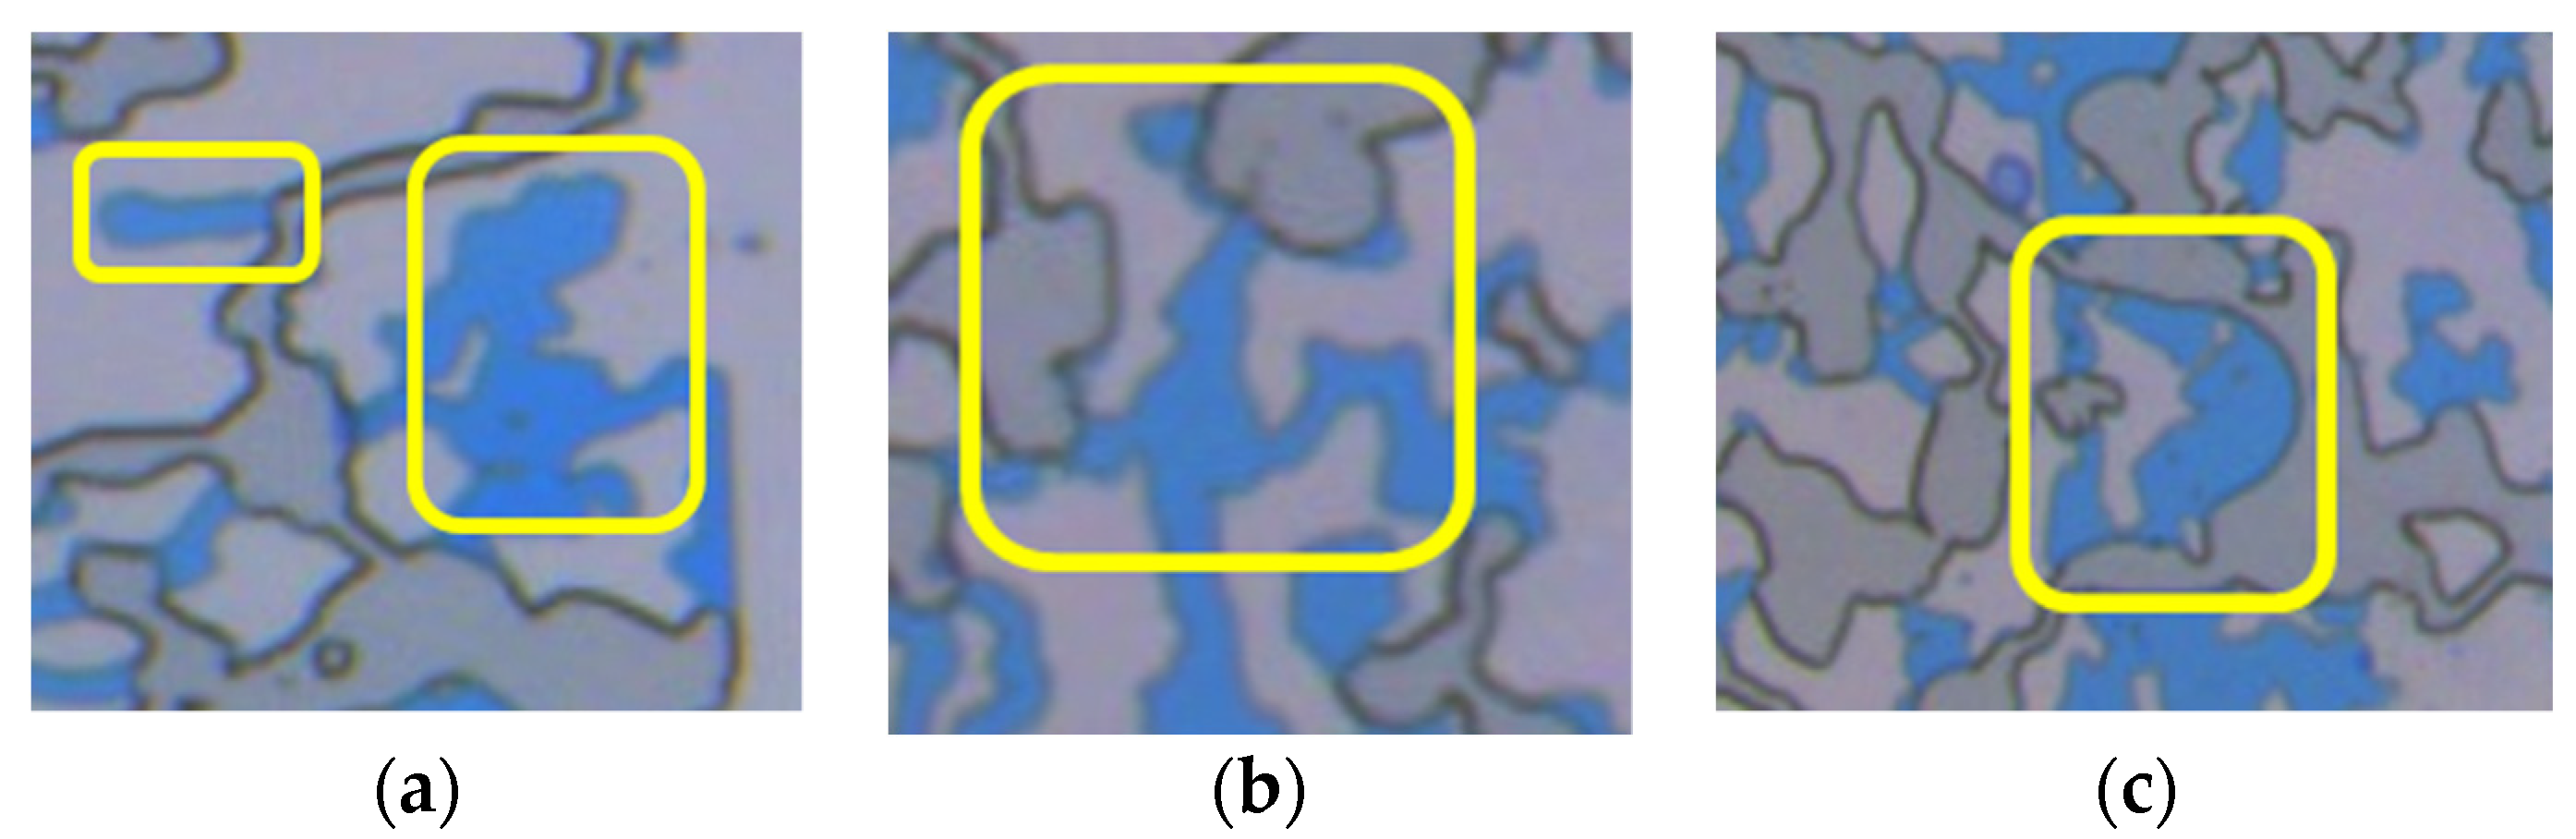
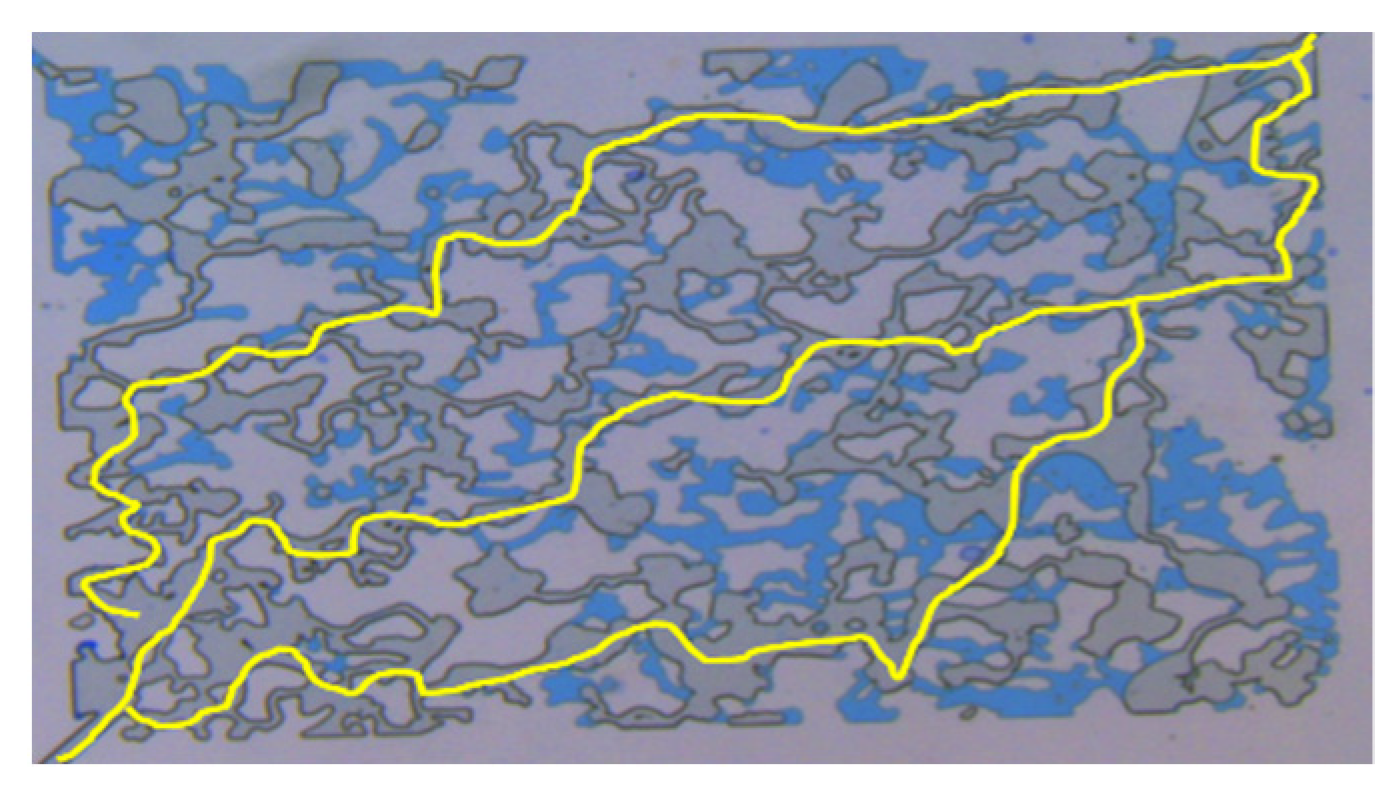
Further analysis of the 50 μm microfluidic model in Figure 6c shows that there are mainly four kinds of liquid phase retention in the water wetting capillary model: (1) Liquid phase retention in the dead volume of a nonconnected pore, as shown in Figure 7a; (2) When the inner diameter of the pore is changed, the “Jamin effect” is formed between the gas and the liquid phase (When a water droplet passes through a small pore throat from a pore throat, the water droplet is elongated and deformed, and the deformation generates additional energy consumption, slowing or hindering the flow of the water droplet. This phenomenon of additional resistance is called the “Jiamin effect”) [22]. The larger capillary pressure in the pore throat with a smaller inner diameter makes the liquid phase hard to be displaced, as shown in Figure 7b; (3) Viscous force, the wetting phase is adsorbed on the surface of the solid phase, as shown in Figure 7c; (4) Reservoir heterogeneity, gas channeling formed in the process of the gas flooding the liquid, resulting in water phase retention in the relatively low permeability pore throat, as shown in Figure 8. Figure 9 shows the liquid phase retention situation in the homogeneous model. When the liquid phase is driven by gas, gas can be evenly pushed, so there is no channeling, and most of the liquid phase can be driven out of the model, and only a small amount of wetting phase adsorbs the retained water phase at the groove.
3.2. Methods to Remove Water Blocking Damage in Porous Media
Different methods have been implemented to explore the removal of water blocking damage in porous media, as explained below. Since the experimental device does not have a gas flow meter, the gas injection volume and injection time are not measured. In each stage of the experiment, the experiment ends when the water content in the model remains unchanged during constant pressure flooding.
3.2.1. Change Gas Injection Pressure
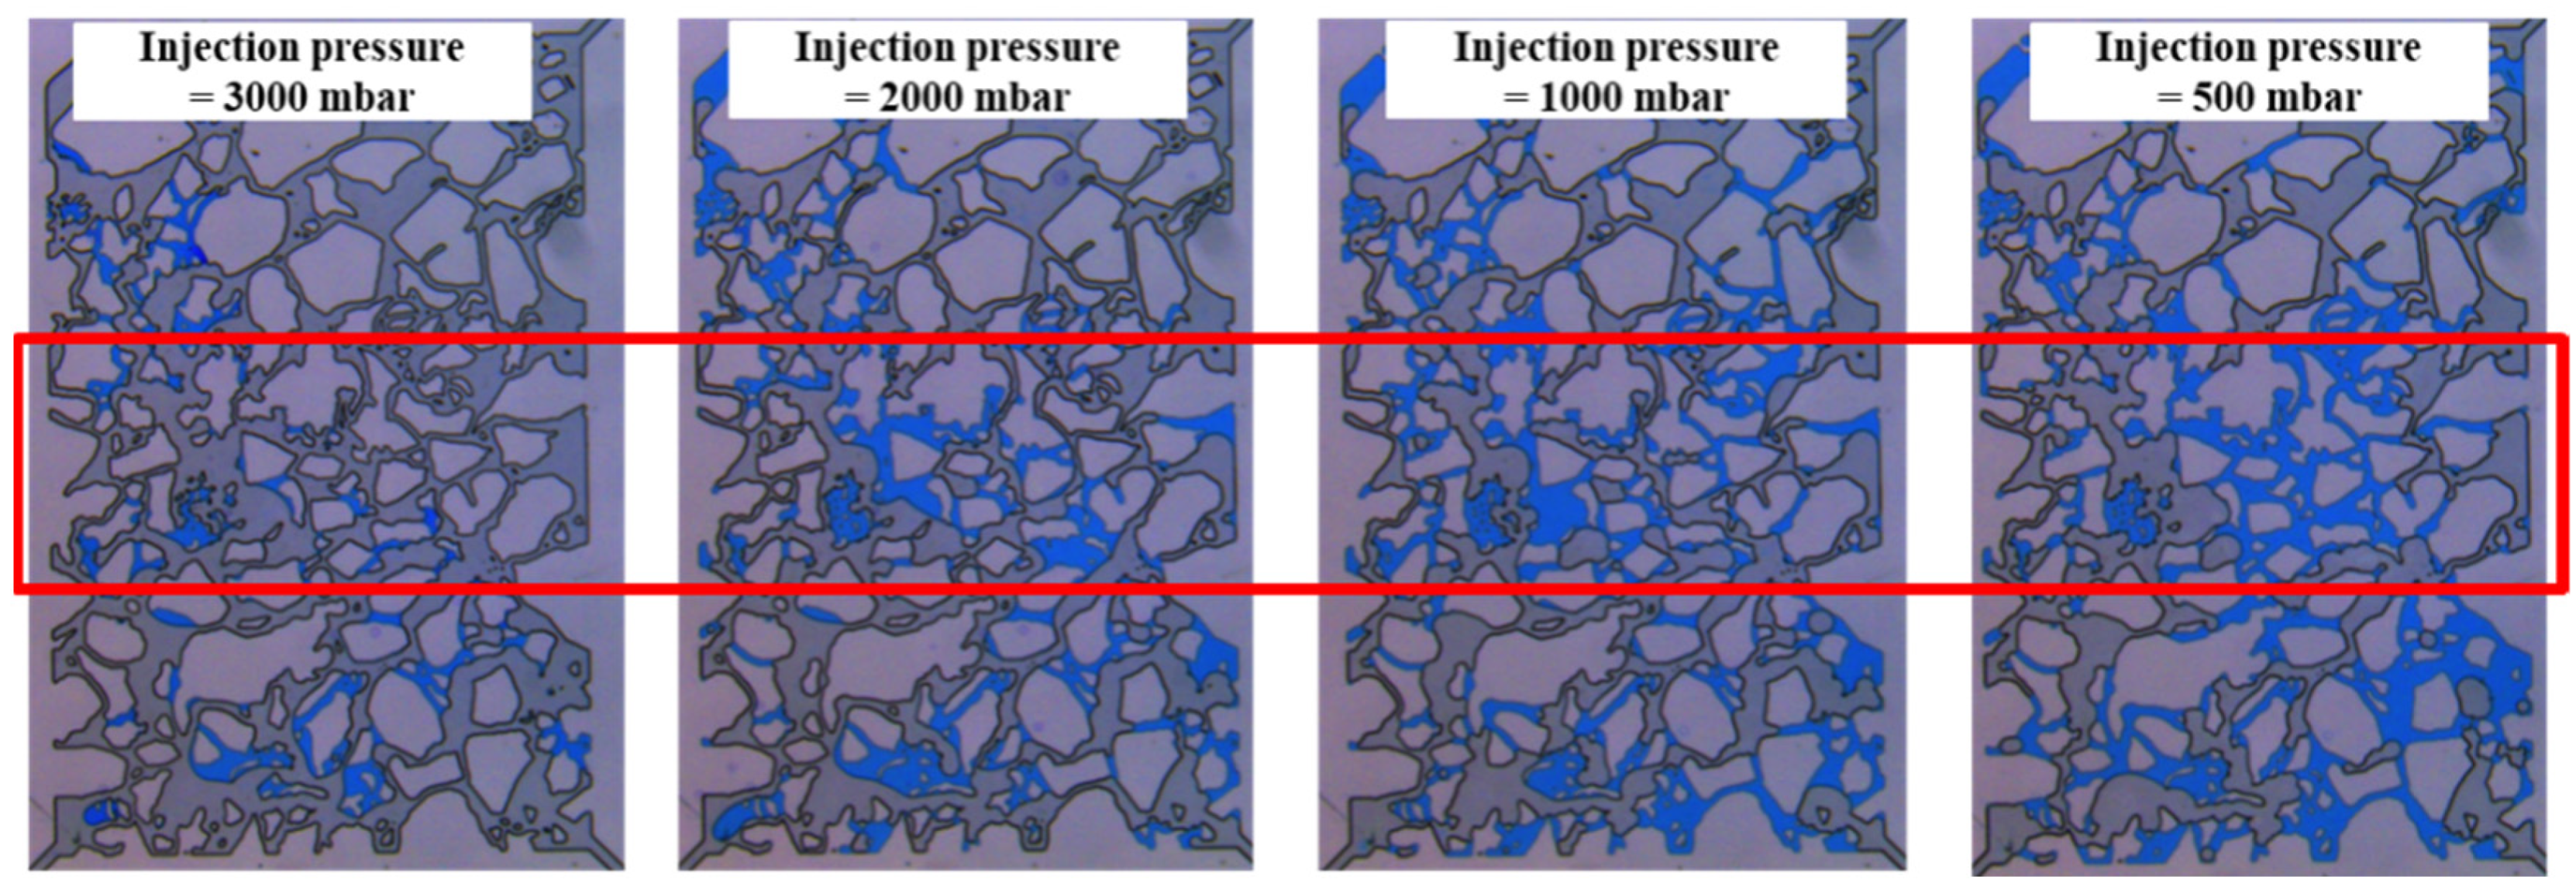
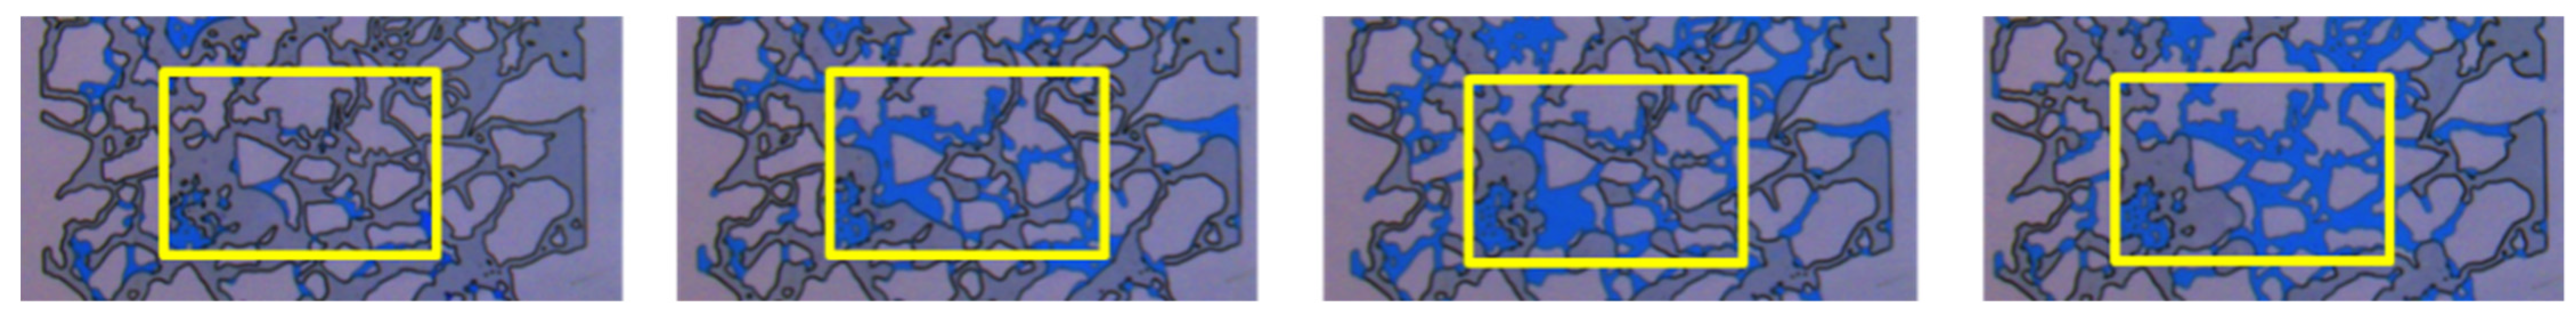
In this section, the air injection pressure was set to 3000 mbar, 2000 mbar, 1000 mbar, and 500 mbar, respectively, which simulated the effect of injected gas pressures on water phase retention. The experimental results are shown in Figure 10. Compare the experimental results in some areas, as shown in Figure 11, with the reduction in the gas injection pressure, liquid retention volume gradually increases. The retained liquid was mainly gathered in the region of the smaller pore radius, which shows that gas cannot flood the water inside the small pore under low pressure; most of the injected gas is channeling from larger pore throats. Therefore, in the field production, the water phase trapped near the wellbore can be driven into the wellbore by appropriately increasing the production pressure difference between the formation and the wellbore; in this way, the water blocking damage can be removed to a certain extent.
3.2.2. Change Gas Injection Methods
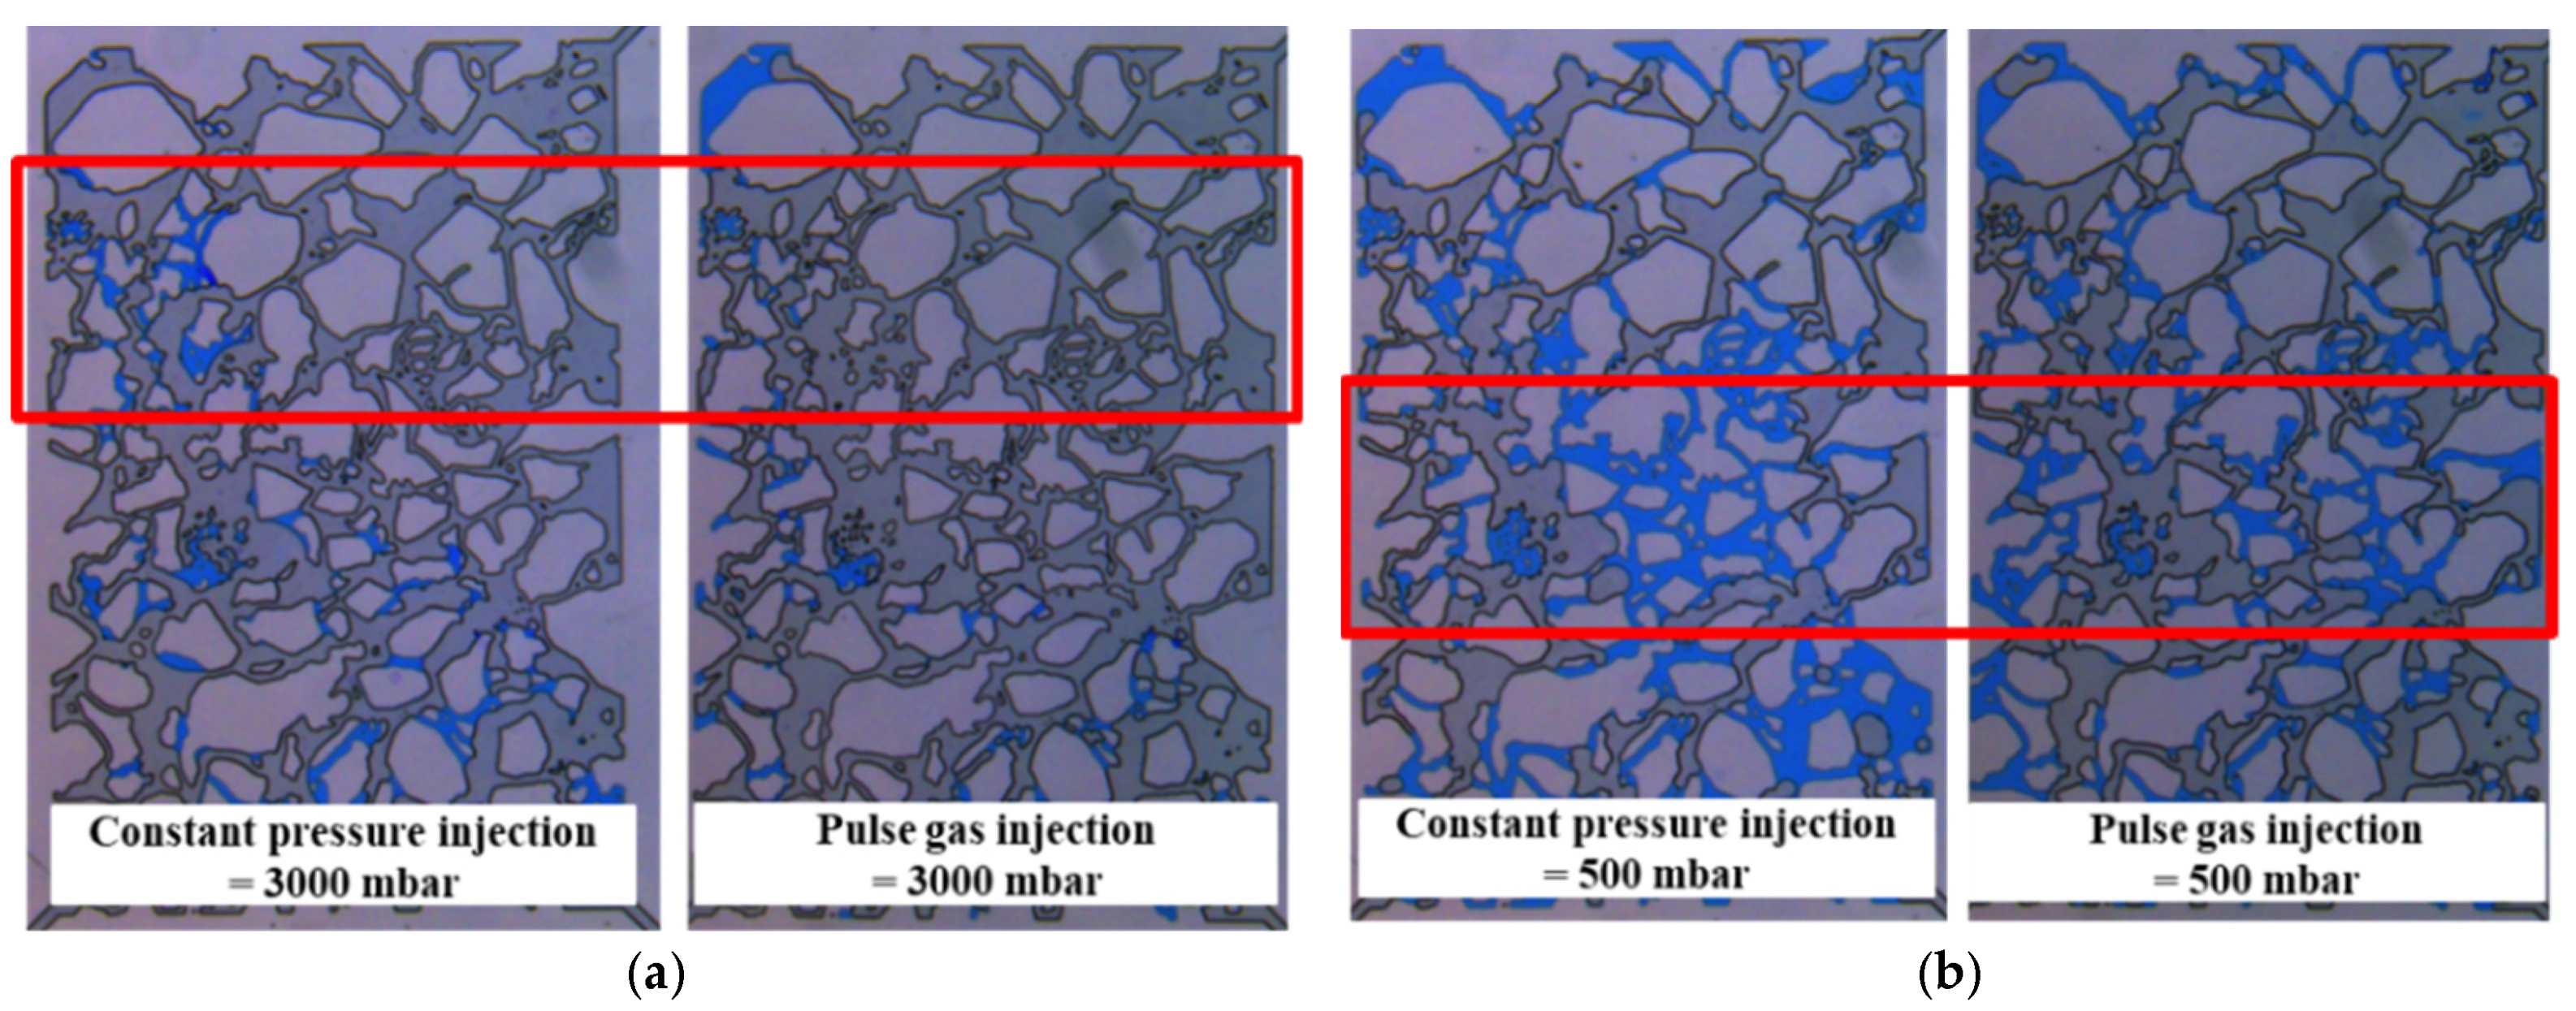
In this part, the effect of water blocking removal under two modes of pulse gas injection and constant pressure gas injection was explored. A 200 μm model was used in this part for pulse gas injection under 500 mbar and 3000 mbar. The experimental results are shown in Figure 12a,b. By comparing the water phase retention situation in the red line area, it can be seen that the water blocking damage can be removed to a certain extent under 500 mbar and 3000 mbar by means of pulse gas injection, and the water phase retention can be further reduced. At the same time, high-pressure displacement can take more water phase away, and the water blocking damage removal effect is better than low-pressure displacement. In the field production, the flow disturbance formed due to interval opening and closing, the water phase which cannot flow in the porous medium can be pushed, and through which achieve the water blocking damage removal effect.
3.2.3. Nano-Emulsion Changes Wettability
It is generally believed that the bounded water saturation Swirr is higher than the initial water-saturated state Swi in the reservoir, which means that the reservoir is in an ultra-low water content state, and there is excess capillary pressure. When the external fluid contacts the reservoir, it is easily sucked into the pores [20,21]. External flow volume penetrates into the formation and reduces the relative permeability of natural gas during reservoir development. [10,15] According to the capillary pressure in porous media, reducing the initial excess capillary pressure, thereby reducing the initial spontaneous infiltration volume and water plugging damage, can be achieved by decreasing the surface tension σ of intrusive liquid and gas or the three-phase contact angle θ of rock/intrusive liquid/gas close to 90°. However, when the external fluid enters the reservoir, the nano-emulsion in the liquor is sopped on the reservoir surface, and the wettability of the reservoir surface is modified from water phase wetting to gas phase wetting, which is conducive to improving the seepage capacity of gas flooding liquid phase, thus, achieving the effect of removing the water blocking damage [20,21,27].
- (1)
- Nano-emulsion wetting fluid synthesis composite map
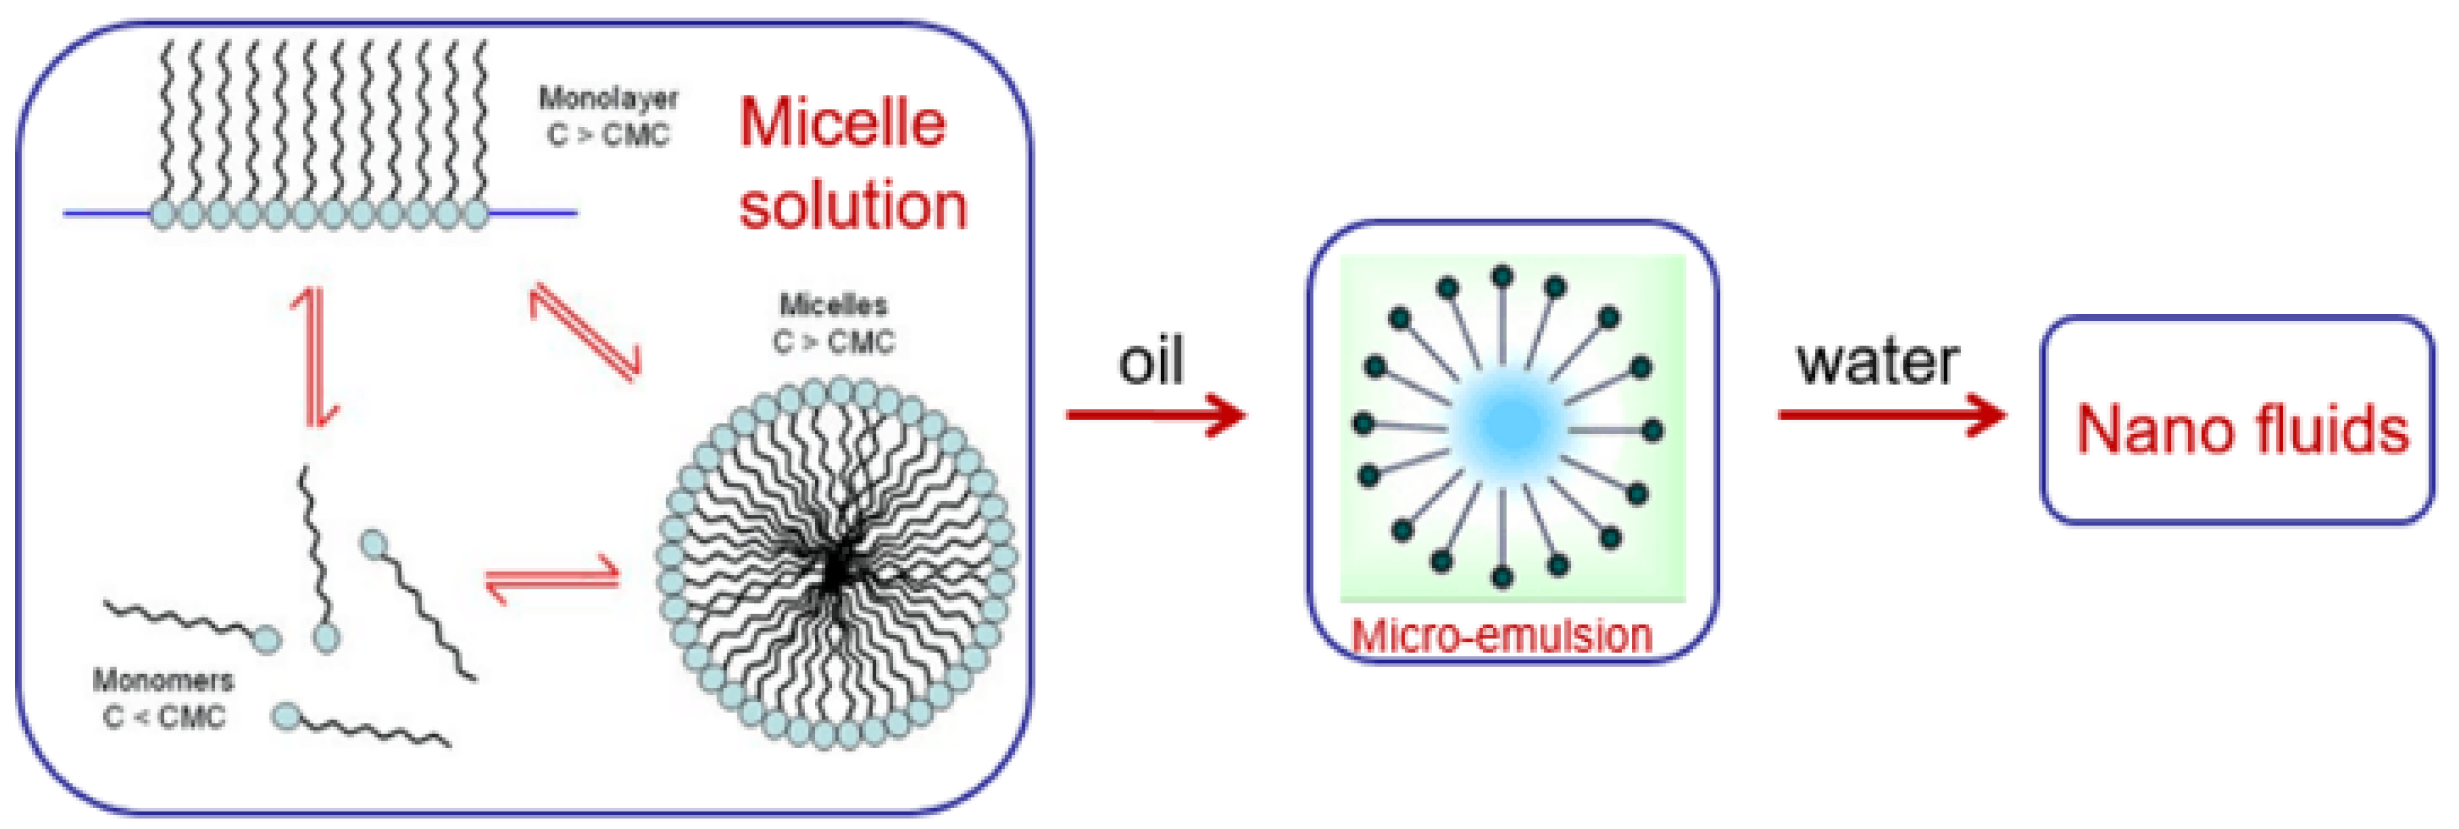
Nano-emulsion CNDAD1# was synthesized by a nanodispersion emulsion method, which was mainly composed of a water phase, oil phase, and surfactant. CNDAD1# is formed by adding nano oil droplets (i.e., nano micelles) to the dilute suspension of brine. CNDAD1# is composed of about 10% alkanes and/or alkenes (oil core of micelles), 30–50% nonionic surfactants (such as ethoxylates) stabilized micelles, and 20–40% ethanol (cosolvent). The original solution was diluted to 0.00–0.50 wt% (wt = Weight) and mixed with 2 wt% KCl in distilled water as CNDAD1# auxiliary fracturing fluid. CNDAD1# is a microemulsion with good stability at room temperature, [28], which is instrumental in the preparation and transportation of fluids. Figure 13 shows a flow path of the synthesis method [29,30,31,32,33,34,35].
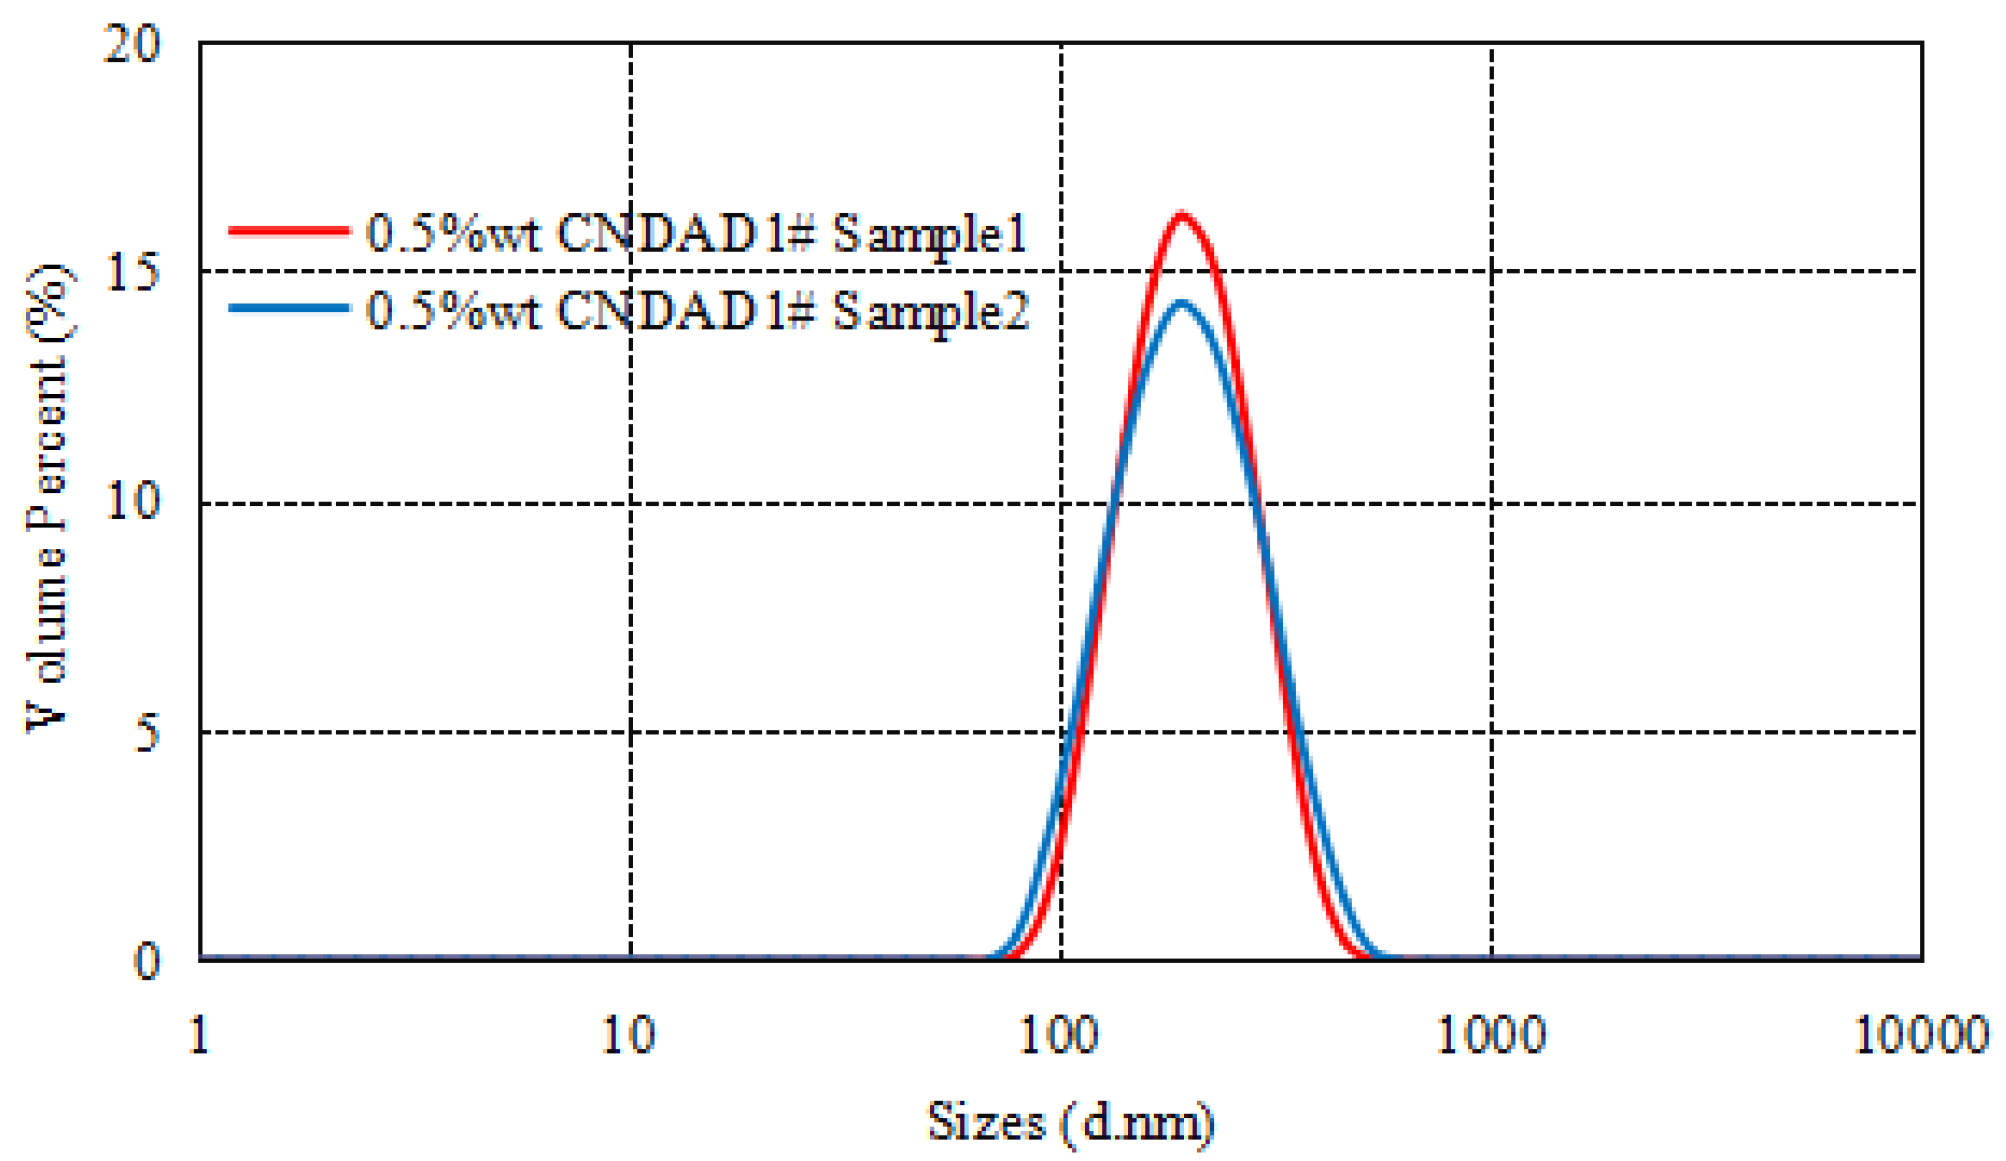
The diameters of the nanoparticles were 160.8 nm and 160.9 nm, respectively (Figure 14). The tight sandstone reservoir pore throat size is small, one of the prerequisites to achieve its injectability is to meet the gas wetting chemical agent with nanometer size.
- (2)
- Surface Tension Test
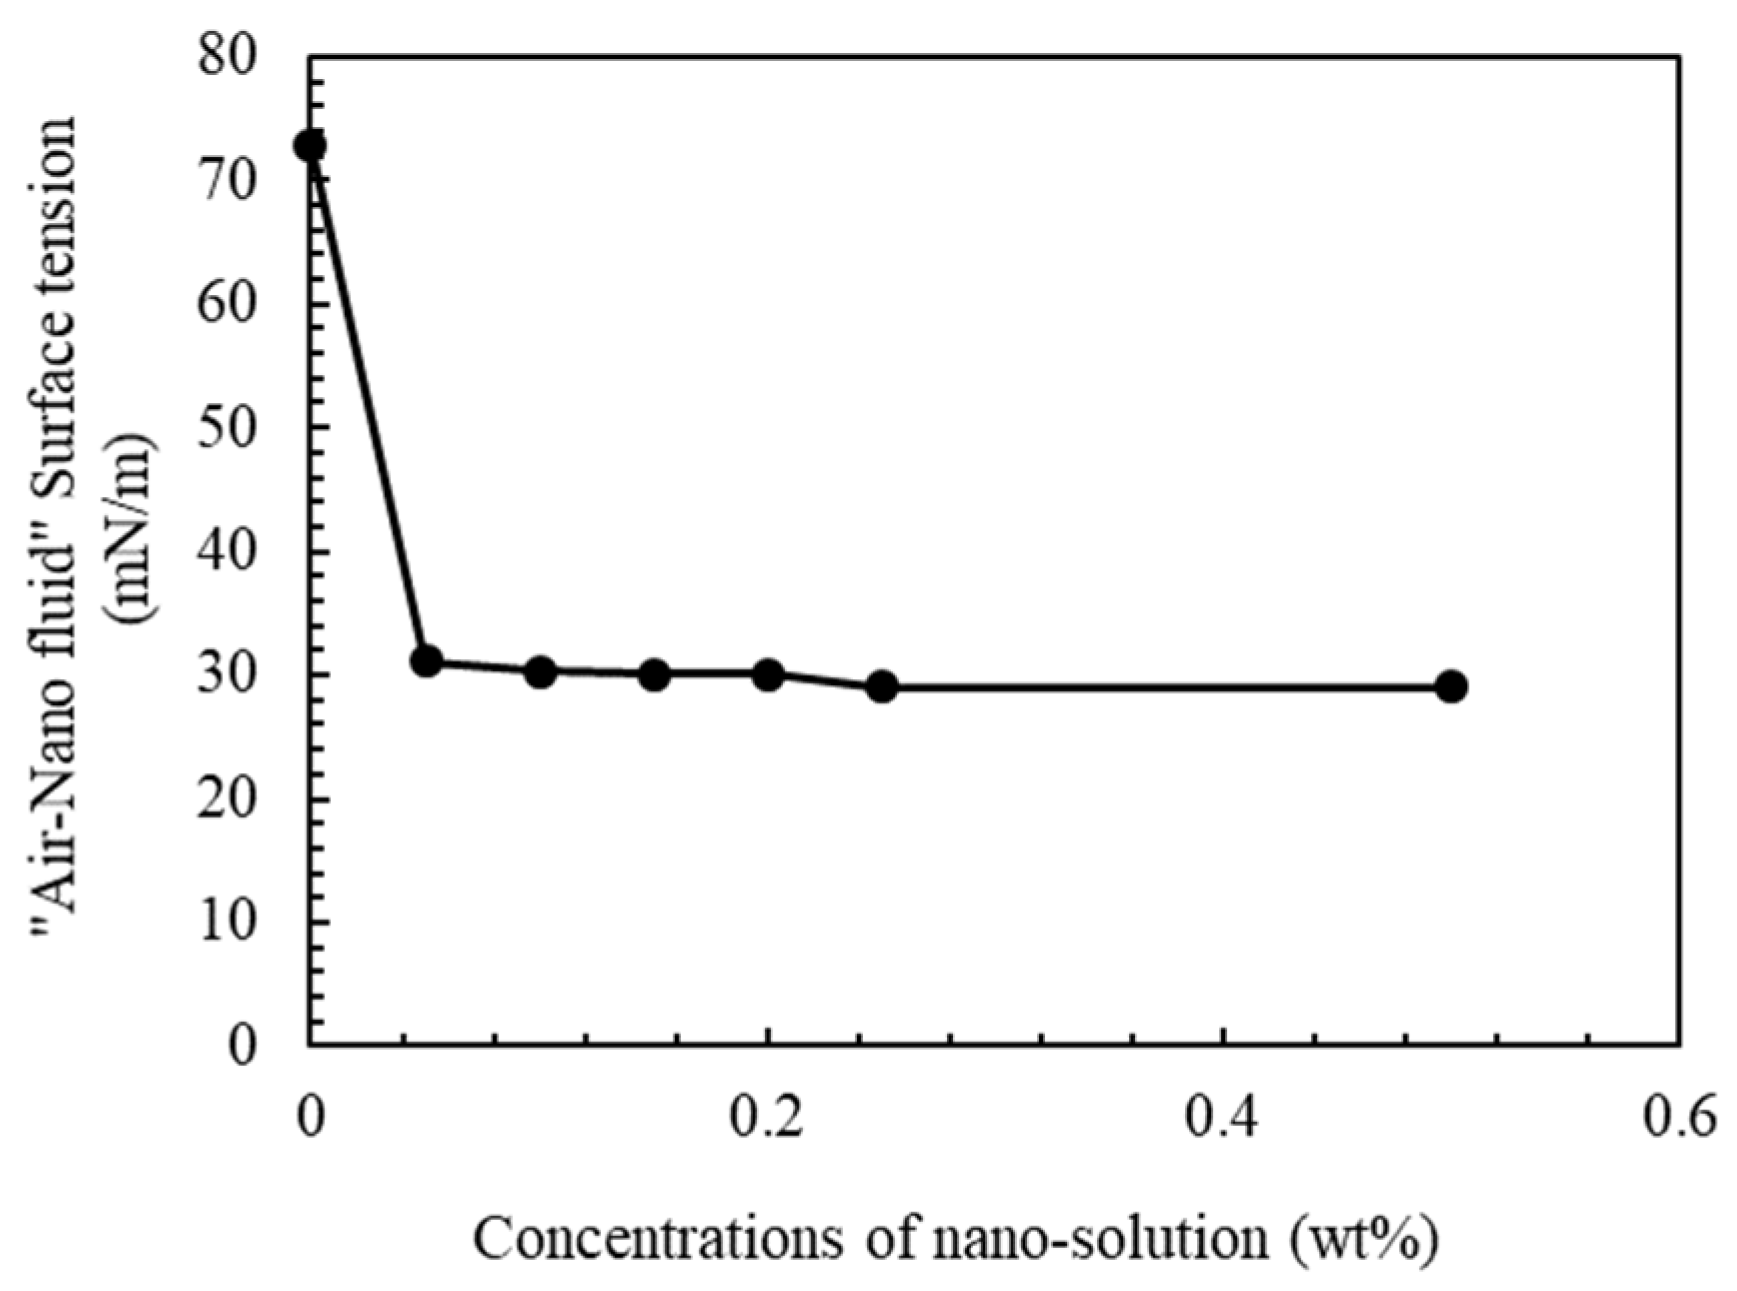
During the hydraulic fracturing process, when the outside liquid contacts the tight sandstone for the first time, the nano-emulsion in the solution does not completely adsorb on the rock surface. According to the capillary pressure equation, the resistance of liquid entering the reservoir decreases with the decrease in gas-liquid surface tension, which is beneficial to the penetration of fluid deeper into the reservoir and the release of nano-emulsion in solution, so as to realize a deep improvement. As a consequence, it is particularly important to develop nano emulsions that can reduce the surface tension of injected liquids. Figure 15 shows that the surface tension of “air water” tested in the laboratory is 72.71 mN/m without any chemical reagent; the result standard deviation is 1%~3%. When the concentration of nano emulsion in the solution is 0.05 wt%, the surface tension of “air water” is 31.08 mN/m. When the concentration of nano emulsion reaches 0.5 wt%, the surface tension of “air-water-rock” is 28.14 nN/m, and the rate of decline is not obvious. Compared with water, however, when the concentration was 0.05 wt%, the surface tension of the solution decreased by 43.67 mN/m, significantly reducing the surface tension of the “air-water-rock”.
- (3)
- Wetting modification
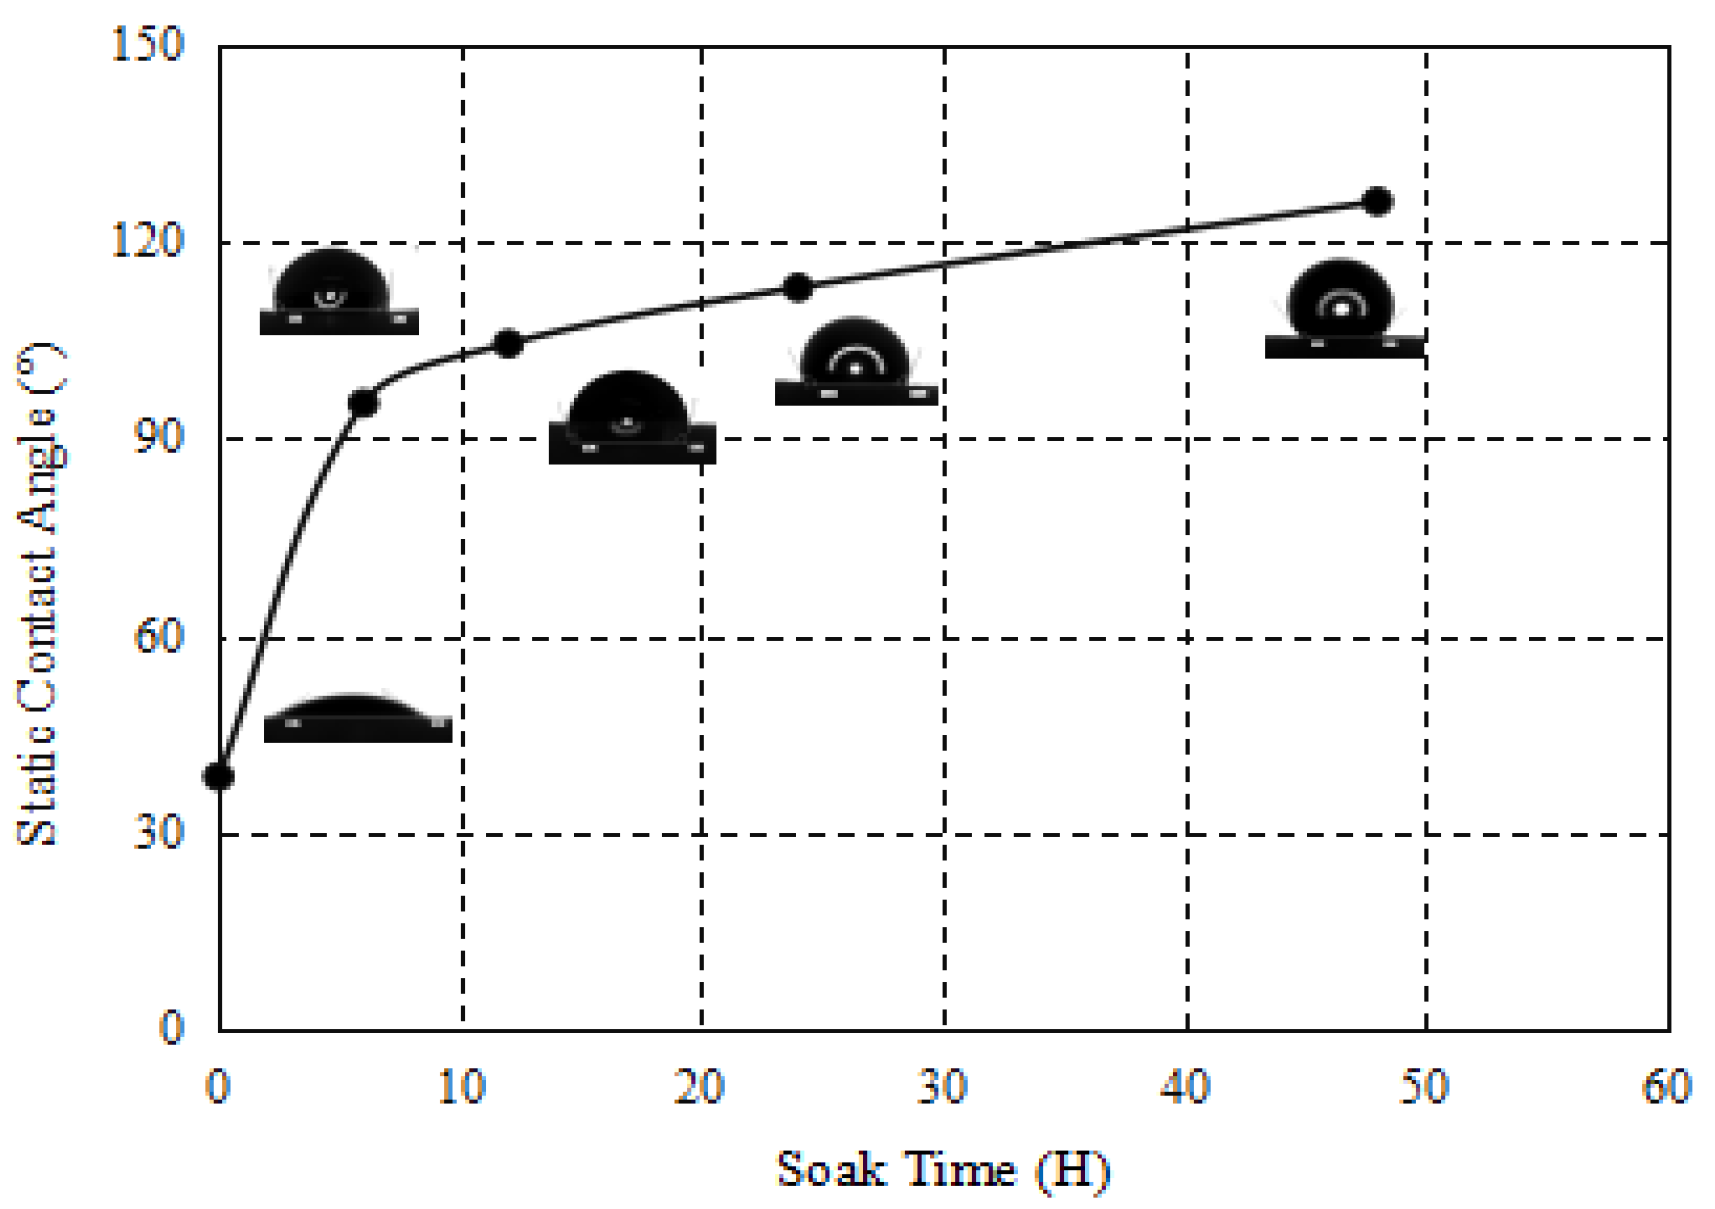
Figure 16 shows the “air-water-rock” static contact angle tested of rock slice after soaking in 0.5 wt% nano-emulsion at different times. The testing time was 0 h, 6 h, 12 h, 24 h, and 48 h, respectively, and the corresponding average contact angles were 38.5°, 95.3°, 104.4°, 112.9°, and 126.0°, respectively. The results show that as the soaking time increases, the “air-water-rock” contact angle on the sandstone surface rises gradually. When the soaking time was 6 h, the average contact angle changed the most, increasing from 38.5° to 95.3°. With the increase in soaking time, the water phase became the non-wetting phase. The change of contact angle gradually decreases with the increase in soaking time, indicating that the adsorption quantity of the chemical agent on the sandstone surface gradually attains a kinetic equilibrium [27,28,36].
- (4)
- Spontaneous Imbibition Experiment
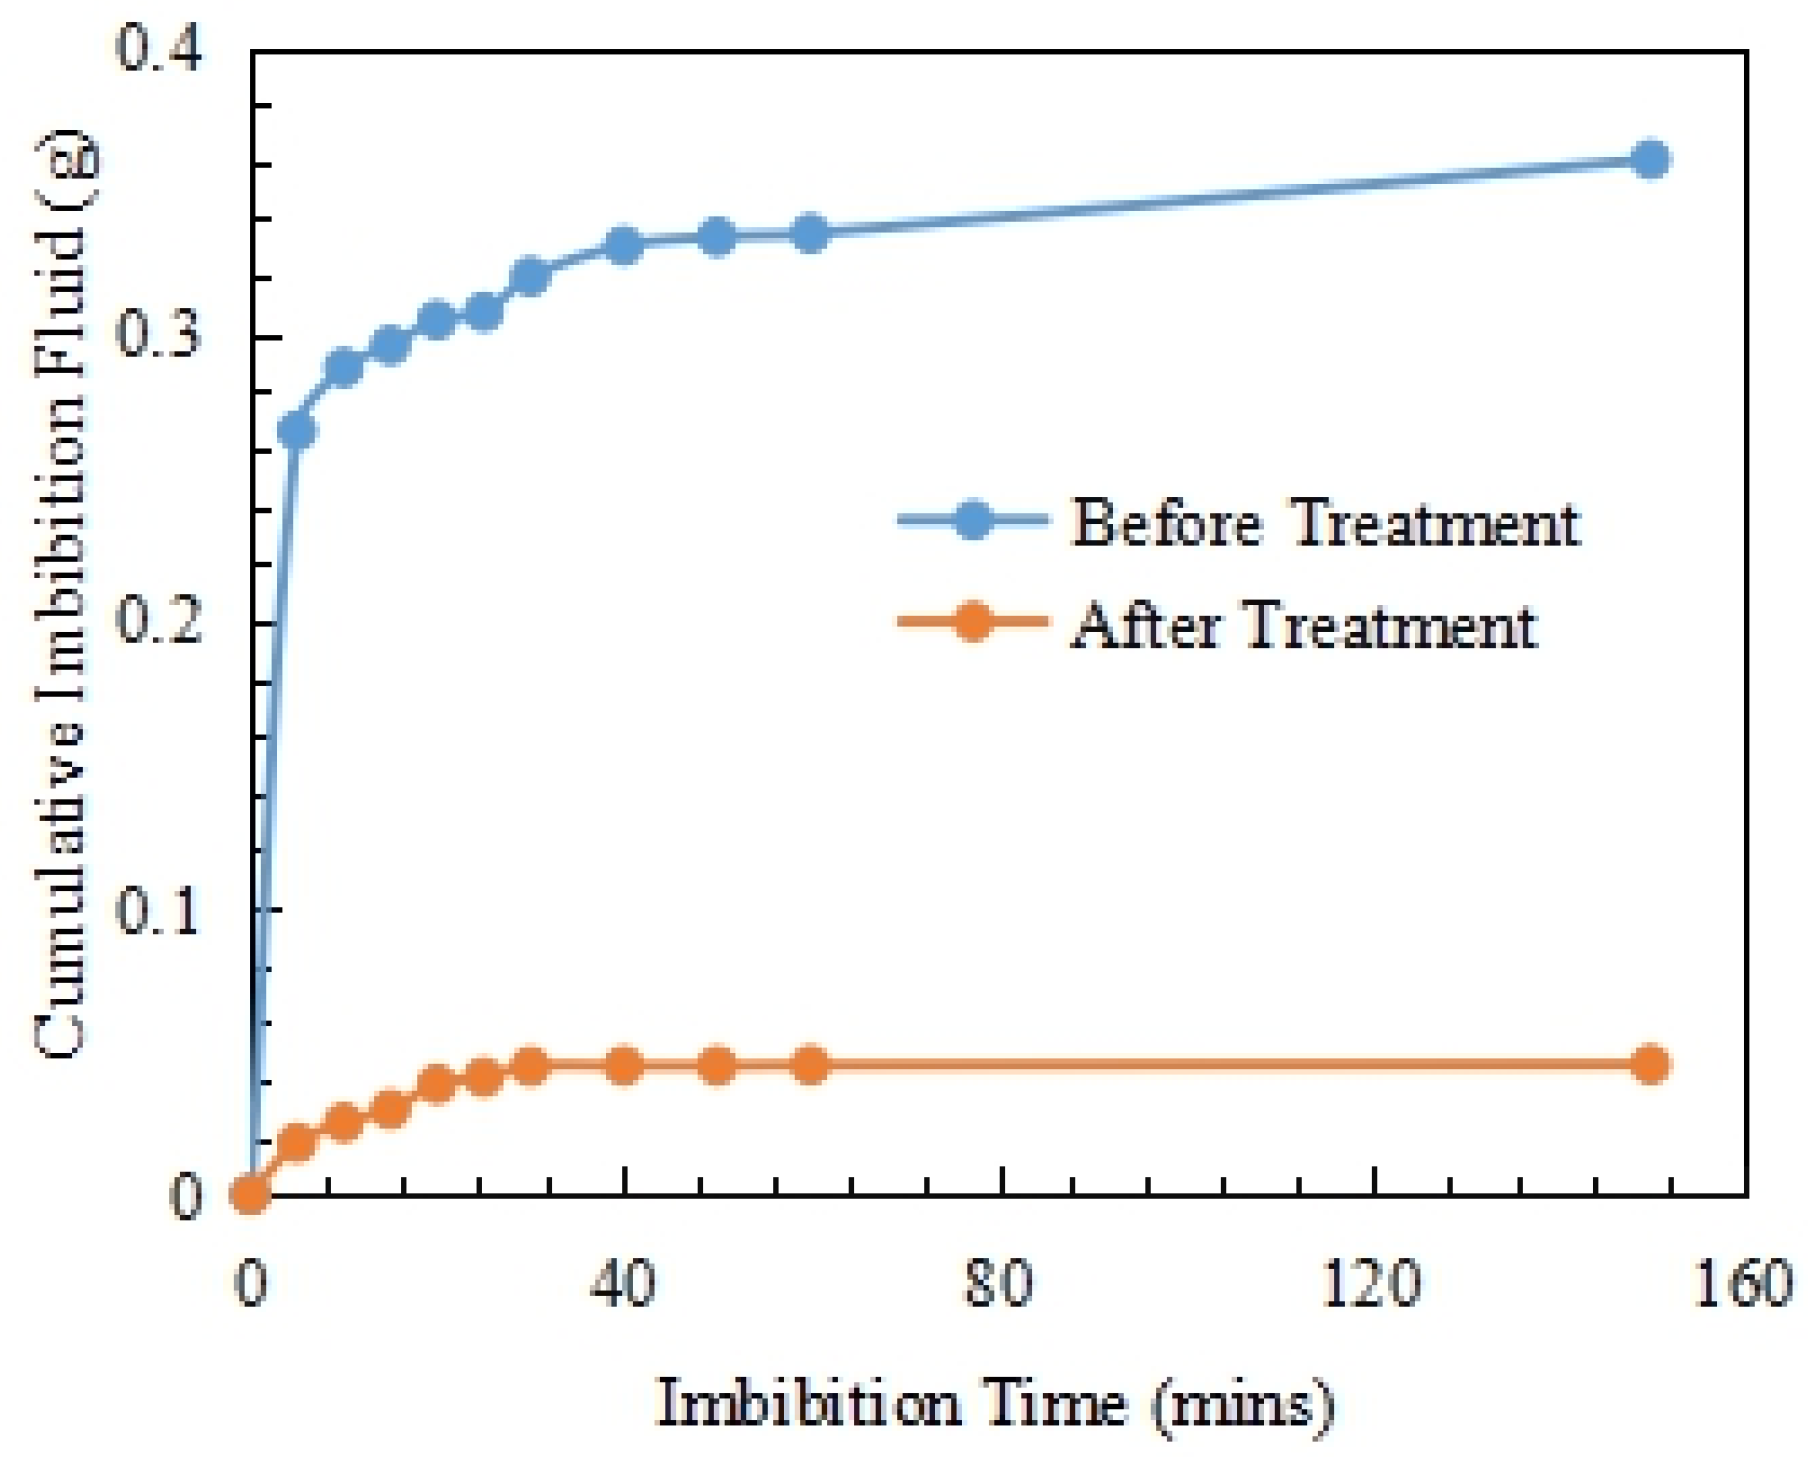
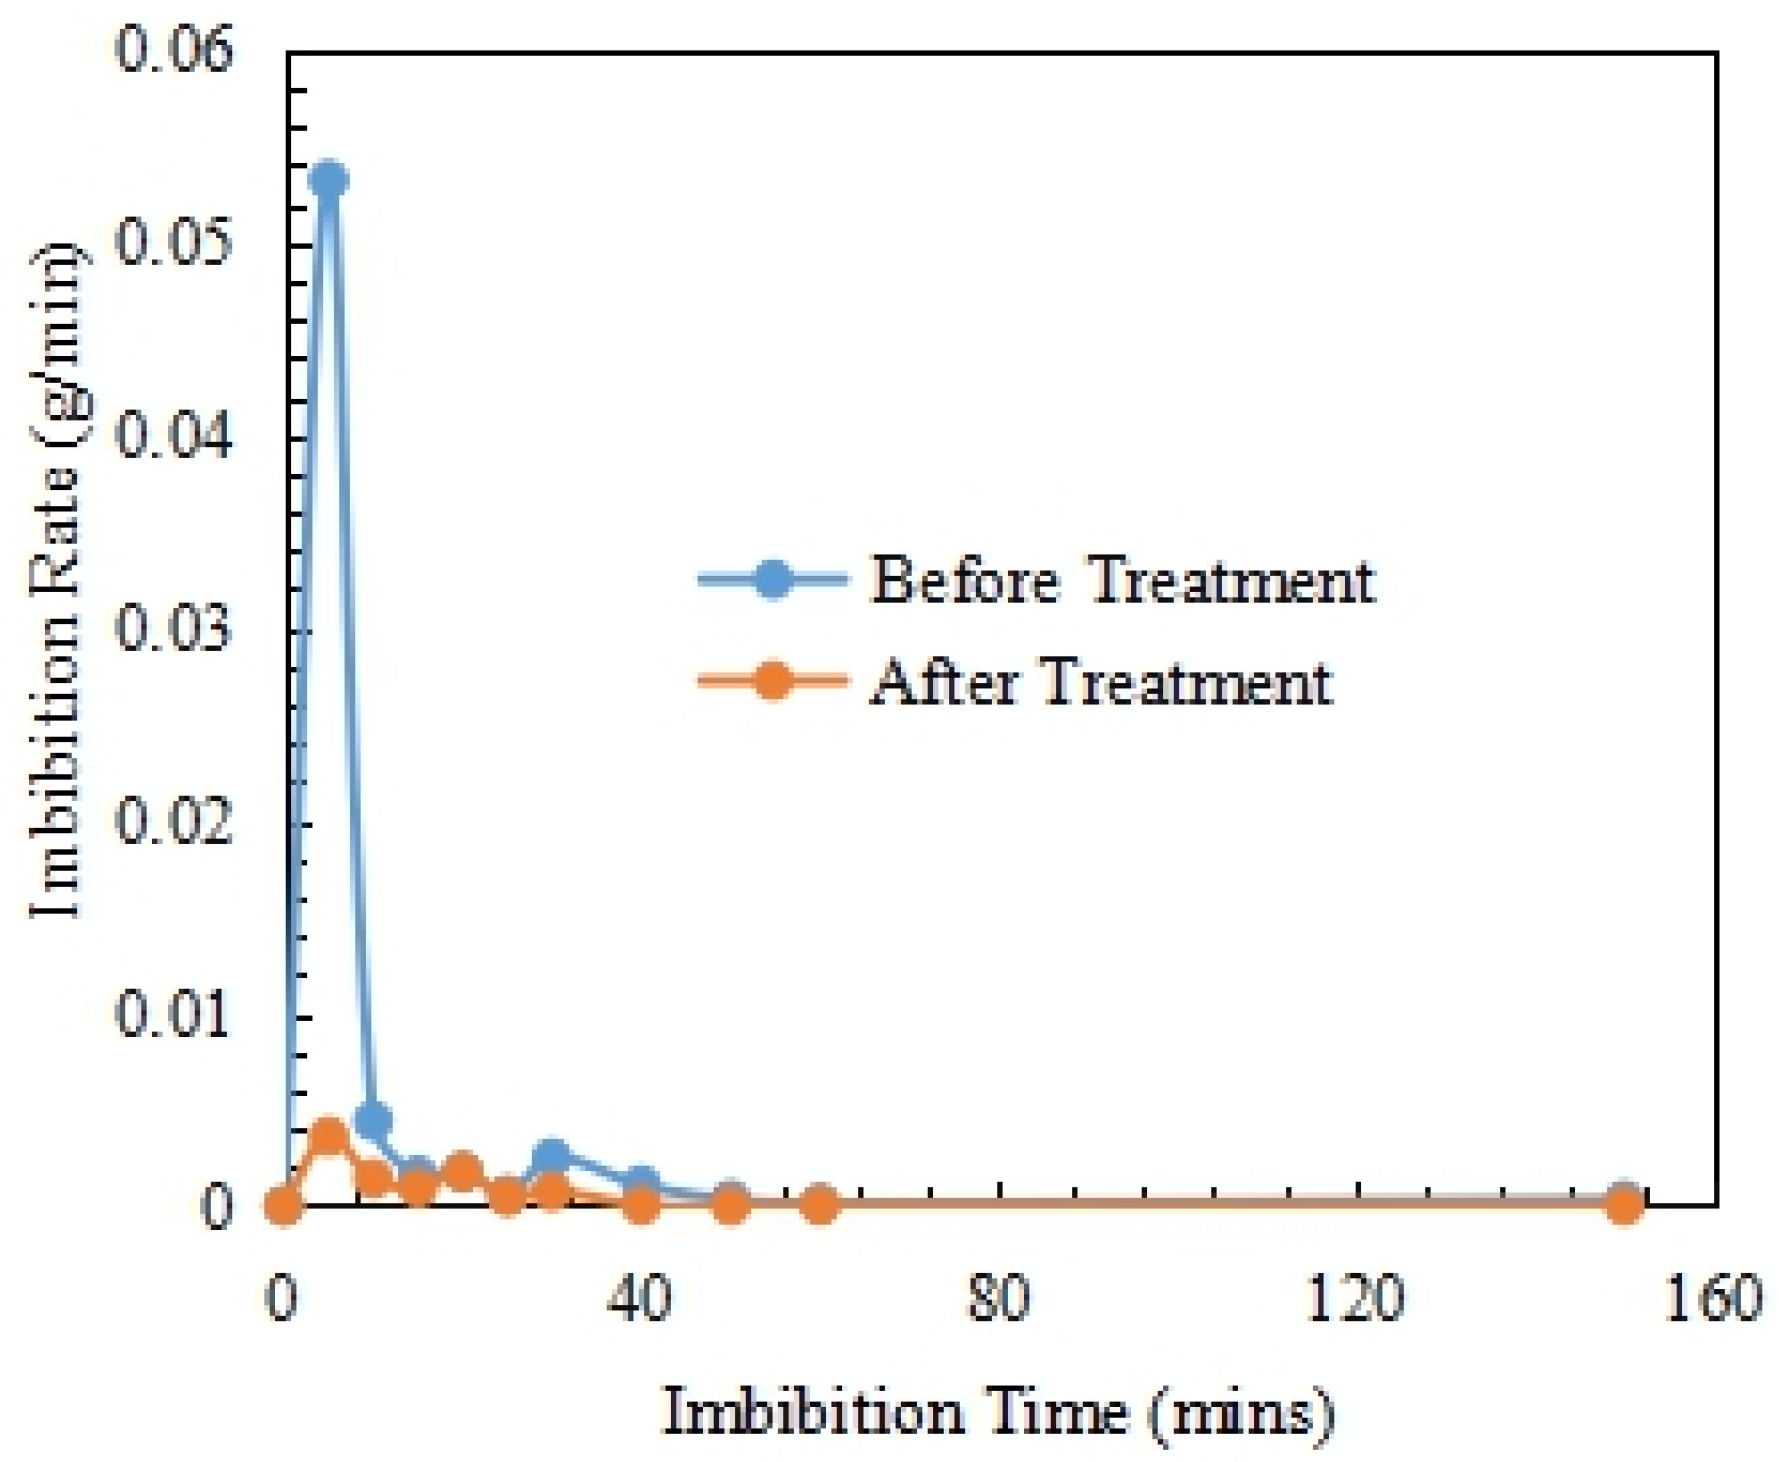
From the results of an air brine spontaneous imbibition test in Figure 17 (the result standard deviation is 5%), it is found that 0.3608 g of water infiltrates into the rock. After the wettability is changed, the water absorption weight is reduced to 0.0453 g. From the results of the imbibition rate test of air-brine in Figure 18 (the result standard deviation is 5%), it is found that the spontaneous imbibition rate of the core drops sharply from the beginning to 0 g/min before and after wettability change. After chemical treatment, the maximum imbibition rate decreased from 0.0532 g/min to 0.0036 g/min.
- (5)
- Core Flowing Pressure Drop Curve
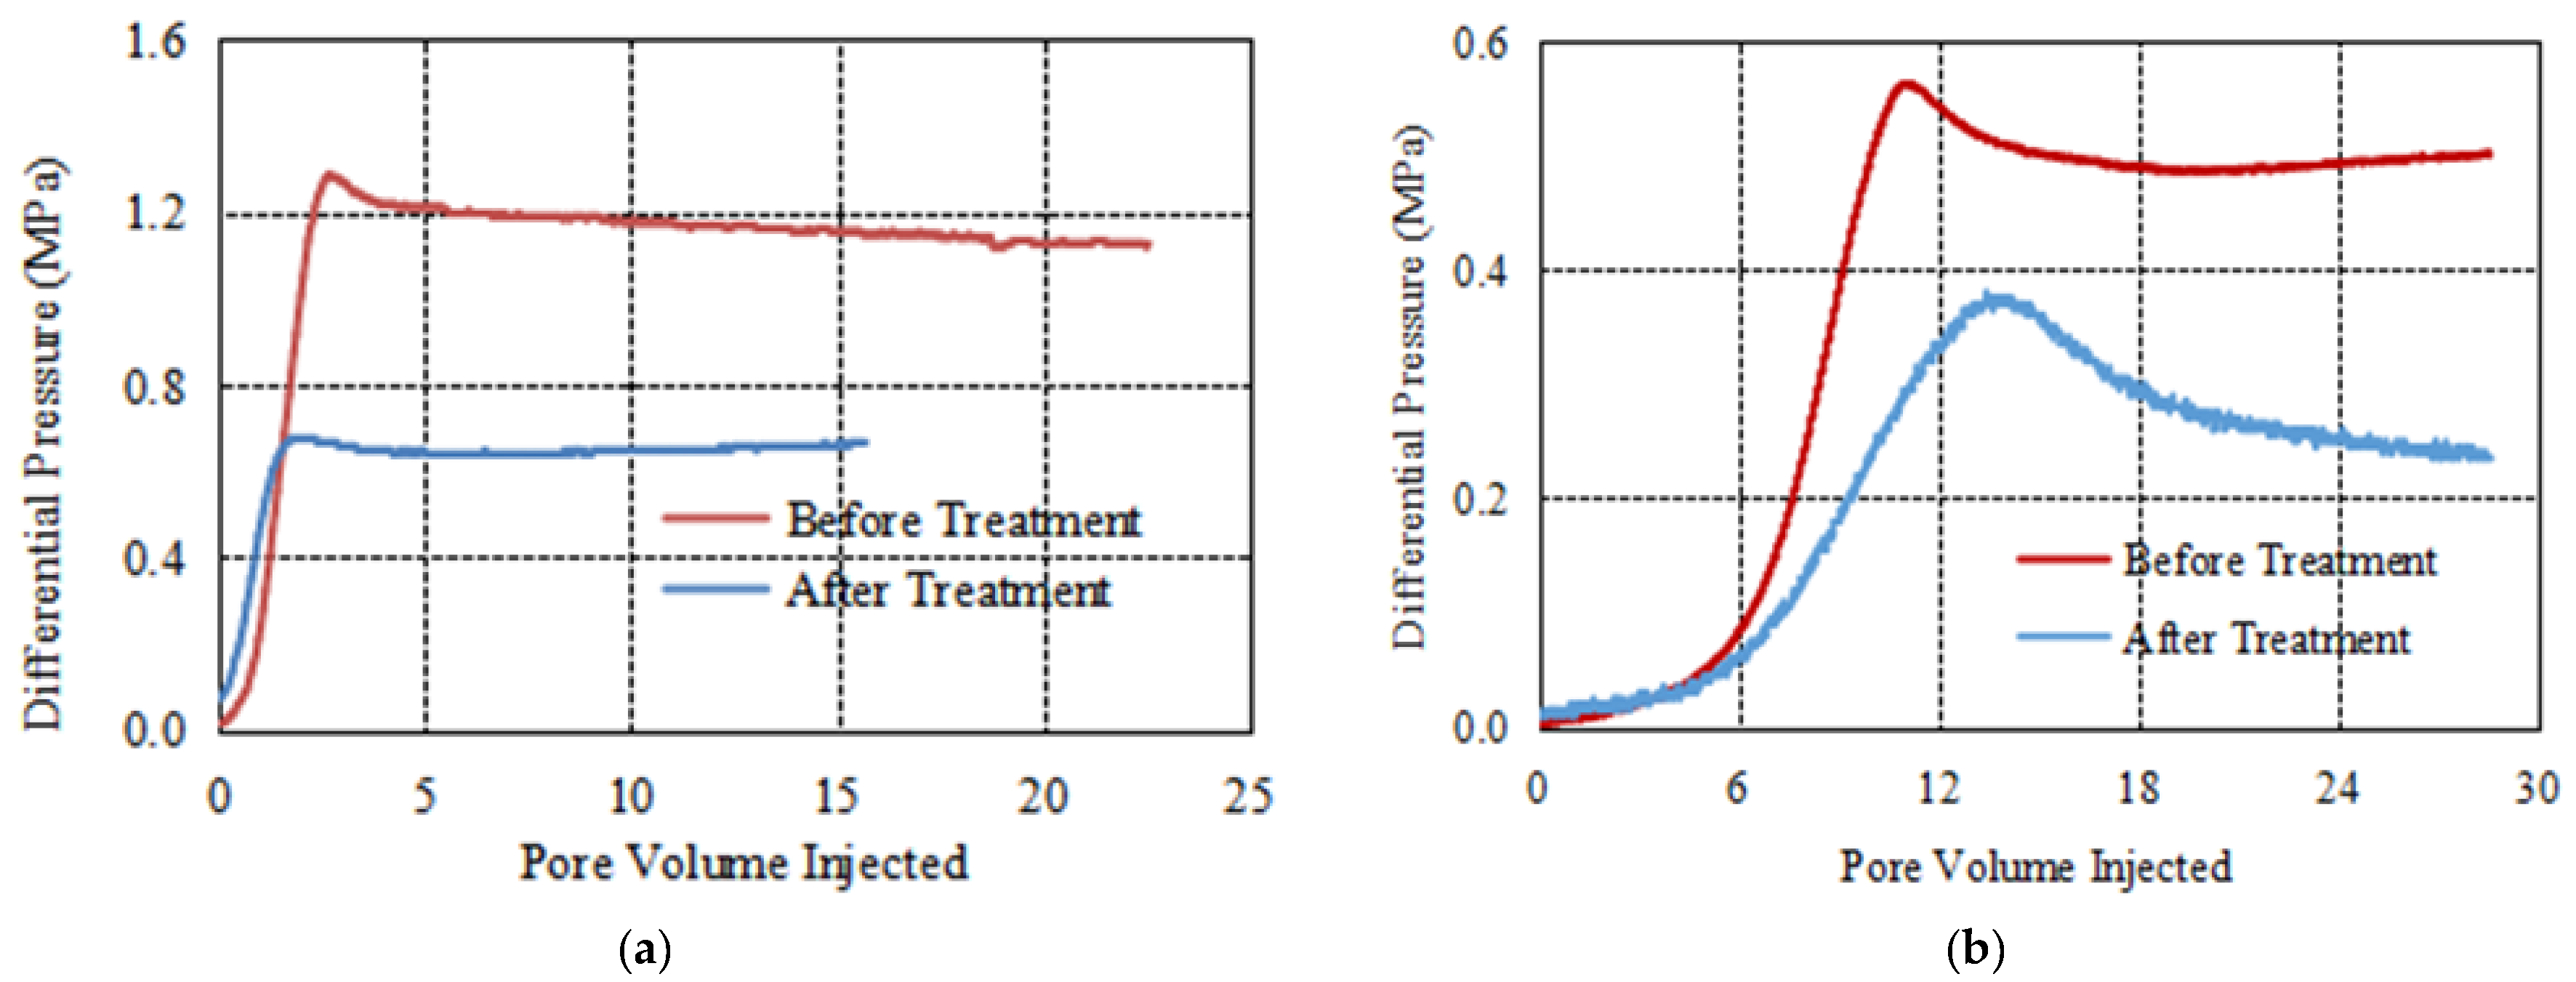
Through the core flow experiment of CNDAD1# nano solution on fractured and non-fractured cores, the permeability and drainage effects of each stage were tested, indicating its effect on the two cores. Combined with the scanning results of GE Brivo CT385, the water phase distribution in different stages of the core was observed. The physical properties of cores show that the gas permeability of the undried core is 1.2637 mD, and the porosity is 4.54%. The gas permeability of the dry fracture core is 41.8356 mD, and the porosity is 6.61%. According to the displacement curve of the core flow experiment, as shown in Figure 19a,b, the injection pressure curves of the two cores after salt water chemical treatment are lower than those before chemical treatment [36,37,38,39,40,41]. Moreover, due to the large injection pressure difference before and after chemical treatment, CNDAD1# nano solution also has excellent injection performance in tight sandstone. At the same time, the significant decline of displacement pressure is due to the change of wettability of sandstone core into gas wettability, resulting in the increase in relative permeability of the terminal liquid phase. The stable injection pressure of the undried core before and after treatment was 1.127 MPa and 0.657 MPa, respectively, indicating that the liquid phase fluidity after treatment was increased by 1.72 times. The stable injection pressures before and after the chemical treatment of salt water in dry fracture cores were 0.501 MPa and 0.235 MPa, respectively, and the liquid flow rate increased by 2.13 times.
- (6)
- Exploration on water blocking damage removal method by nano-emulsion
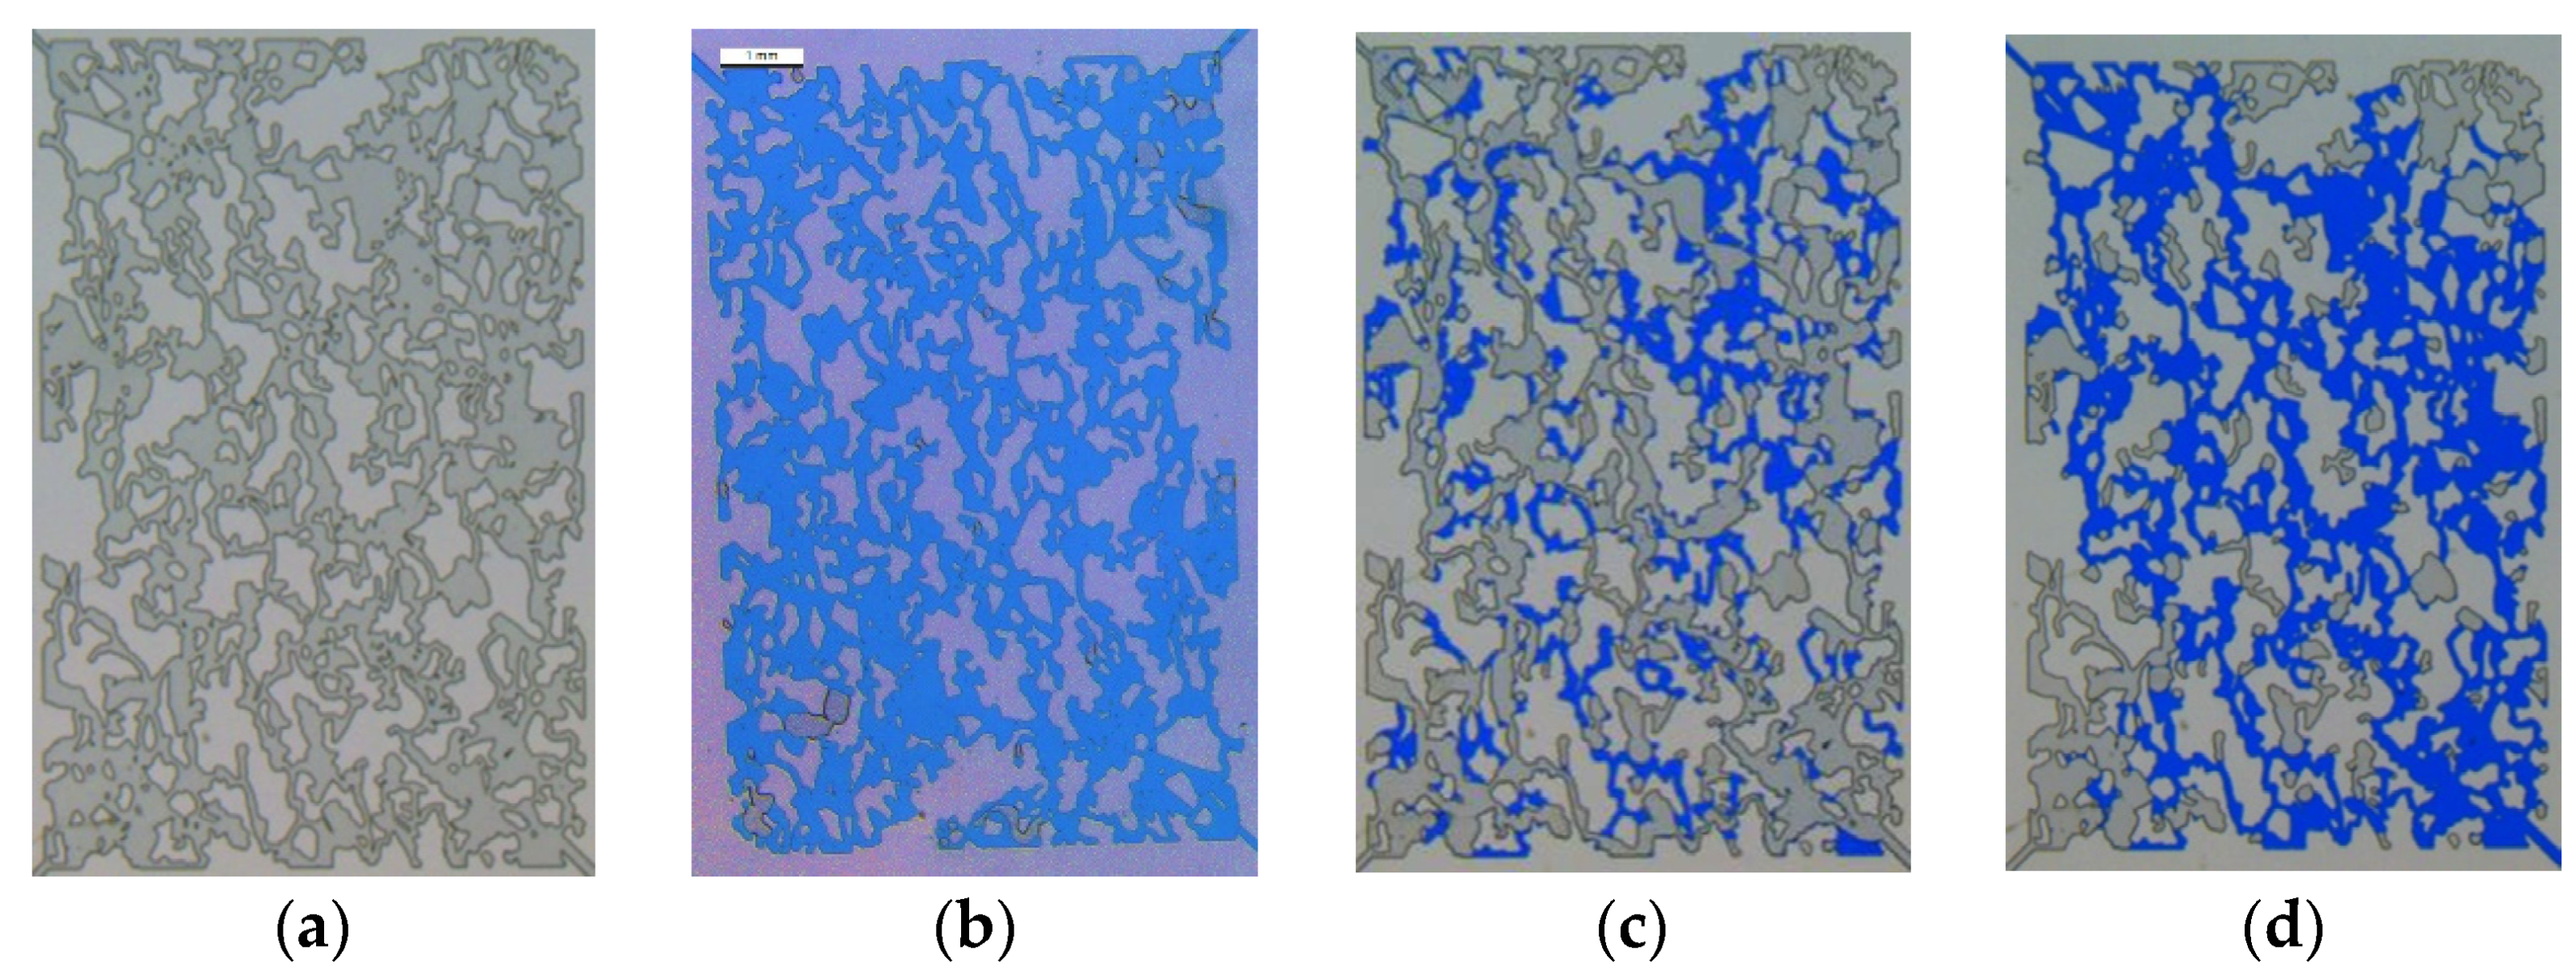
Taking 50 μm as an example, the model was saturated with 0.5 wt% CNDAD1# nano-emulsion fluid and aged for more than 24 h. Then the model underwent gas flooding under 500 mbar, then compare the liquid phase distribution diagram after the gas flooding with that before the chemical treatment to analyze the effect of nano-emulsion on improving the drainage rate. The liquid phase pixel ratios at different stages were calculated by ImageJ software. Taking all the pore throats in Figure 20a as the reference pixel points, the liquid phase ratio was 98.71%, 14.93%, and 73.66%, respectively, in Figure 20b–d (the result standard deviation is 5%). Due to the presence of a certain dead volume in the porous medium, the nano-emulsion fluid cannot be completely saturated. Therefore, the saturated liquid phase accounts for 98.71% rather than 100% of the pore volume in Figure 20b. After the surface of porous media was wetting modified by nano-emulsion, the retained liquid proportion obtained by low-pressure gas flooding accounted for 14.93%, which means nano-emulsion has a significant effect on reducing the liquid saturation in porous media. After the gas flooding, the model is difficult to be re-saturated with the water phase because of the wetting modification of the pore throat wall, so only the well-connected channels achieve a certain amount of saturation, accounting for about 73.66% of the pore volume. The results show that the nano-emulsion has a good effect in removing the retained water from the model.
4. Conclusions
The results of microfluidic experiments show that there are mainly four types of reasons which lead to the liquid phase retention in water wetting porous media: dead volume of the non-connected pore, the inner diameter of the pore is changed, viscous force, and reservoir heterogeneity. The nano-emulsion can change the surface of the microfluidic model from water-wetting to non-water-wetting, and reduce the gas-liquid surface tension. After the nano-emulsion treatment, the liquid phase fluidity increased 1.72 times and 2.13 times in the unfractured core and fractured core. During the gas displacement, more retained water phase can be taken out of the model. In the next step, it is necessary to further study the effect of nano-emulsion on the four types of water retention in porous media.
Author Contributions
Conceptualization, F.H.; methodology, F.H.; writing—original draft preparation, F.H.; writing—review and editing, F.H.; project administration, J.W.; funding acquisition, J.W. All authors have read and agreed to the published version of the manuscript.
Funding
This research was funded by Planned Project, Hubei Provincial Department of Science and Technology (Second Batch), (NO. 2021CFB249) & Project of Science and technology research, Education Department of Hubei Province (NO. Q20211303).
Institutional Review Board Statement
Not applicable.
Informed Consent Statement
Not applicable.
Data Availability Statement
Not applicable.
Conflicts of Interest
The authors declare no conflict of interest.
Nomenclature
| h | Hour |
| Pcap | capillary pressure |
| σ | surface tension of invasion fluid and gas phase |
| θ | three-phase contact angle of rock/invasion fluid/gas |
| r | capillary radius |
| L | liquid column length |
| P | drive pressure |
| μ | viscosity of external fluid |
| wt | weight |
| mbar | millibar |
| ml | mini Liter |
| MPa | mega pascal |
| CNDAD1# | one type of nano-emulsion |
References
- Clouser, G.; Wagman, D. East Texas Thrives: One of the world’s most heavily drilled regions thrives as unconventional gas plays take off. Oil Gas Investig. Tight Gas 2006, 8, 8–10. [Google Scholar]
- Khlaifat, A.L.; Qutob, H.; Barakat, N. Tight gas sands development is critical to future world energy resources. In Proceedings of the SPE Middle East Unconventional Gas Conference and Exhibition, Muscat, Oman, 31 January–2 February 2011. [Google Scholar]
- Asadi, M.; Woodroof, R.A.; Himes, R.E. Comparative study of flowback analysis using polymer concentrations and fracturing-fluid tracer methods: A field study. SPE Prod. Oper. 2008, 23, 147–157. [Google Scholar] [CrossRef]
- Zelenev, A.; Ellena, L. Microemulsion technology for improved fluid recovery and enhanced core permeability to gas. In Proceedings of the SPE 8th European Formation Damage Conference, Scheveningen, The Netherlands, 27–29 May 2009. [Google Scholar]
- King, G.E. Hydraulic fracturing 101: What every representative, environmentalist, regulator, reporter, investor, university researcher, neighbor and engineer should know about estimating frac risk and improving frac performance in unconventional gas and oil wells. In Proceedings of the SPE Hydraulic Fracturing Technology Conference, The Woodlands, TX, USA, 6–8 February 2012. [Google Scholar]
- Sharma, M.M.; Manchanda, R. The role of induced un-propped (IU) fractures in unconventional oil and gas wells. In Proceedings of the SPE Annual Technical Conference and Exhibition, Houston, TX, USA, 28–30 September 2015. [Google Scholar]
- Liang, T.; Gu, F.; Yao, E.; Zhang, L.; Yang, K.; Liu, G.; Zhou, F. Formation damage due to drilling and fracturing fluids and its solution for tight naturally fractured sandstone reservoirs. Geofluids 2017, 2017, 9350967. [Google Scholar] [CrossRef] [Green Version]
- Liang, T.; Luo, X.; Nguyen, Q.; DiCarlo, D.A. Computed-tomography measurements of water block in low-permeability rocks: Scaling and remedying production impairment. SPE J. 2018, 23, 762–771. [Google Scholar] [CrossRef]
- Zhang, L.; Zhou, F.; Mou, J.; Xu, G.; Zhang, S.; Li, Z. A new method to improve long-term fracture conductivity in acid fracturing under high closure stress. J. Pet. Sci. Technol. 2018, 171, 760–770. [Google Scholar] [CrossRef]
- Bahrami, H.; Reza Rezaee, M.; Nazhat, D.; Ostojic, J.; Clennell, B.; Jamili, A. Effect of water blocking damage on flow efficiency and productivity in tight gas reservoirs. In Proceedings of the SPE Production and Operations Symposium, Oklahoma City, OK, USA, 27–29 March 2011. [Google Scholar]
- Cheng, Y. Impact of water dynamics in fractures on the performance of hydraulically fractured wells in gas shale reservoirs. In Proceedings of the SPE International Symposium and Exhibition on Formation Damage Control, Lafayette, LA, USA, 10–12 February 2010. [Google Scholar]
- Holditch, S.A. Factors Affecting water blocking and gas flow from hydraulically fractured gas wells. J. Pet. Tec. 1979, 31, 1515–1524. [Google Scholar] [CrossRef]
- Parekh, B.; Sharma, M.M. Cleanup of water blocks in depleted low-permeability reservoirs. In Proceedings of the SPE Annual Technical Conference and Exhibition, Houston, TX, USA, 26–29 September 2004. [Google Scholar]
- Li, K.; Firoozabadi, A. Phenomenological modeling of critical condensate saturation and relative permeabilities in gas/condensate systems. SPE J. 2000, 5, 138–147. [Google Scholar] [CrossRef] [Green Version]
- Lu, H.; Guo, J.; Wang, Y.; Yang, M.; Nan, W. Trapping Damage Analysis of Water Locking/Aqueous Phase of Tight Sandstone Gas Reservoir in Ke Keya Structure. In Proceedings of the SPE IADC/SPE Asia Pacific Drilling Technology Conference and Exhibition, Tianjin, China, 9–11 July 2012. [Google Scholar]
- Sharifzadeh, S.; Hassanajili, S.; Rahimpour, M. Wettability alteration of gas condensate reservoir rocks to gas wetness by sol–gel process using fluoroalkylsilane. J. Appl. Polym. Sci. 2013, 128, 4077–4085. [Google Scholar] [CrossRef]
- Karandish, G.; Rahimpour, M.; Sharifzadeh, S.; Dadkhah, A.A. Wettability alteration in gas-condensate carbonate reservoir using anionic fluorinated treatment. Chem. Eng. Res. Des. 2015, 93, 554–564. [Google Scholar] [CrossRef]
- Aminnaji, M.; Fazeli, H.; Bahramian, A.; Gerami, S.; Ghojavand, H. Wettability alteration of reservoir rocks from liquid wetting to gas wetting using nano fluid. Transp. Porous Media 2015, 109, 201–216. [Google Scholar] [CrossRef]
- Gahrooei, H.R.E.; Ghazanfari, M.H. Application of a water based nanofluid for wettability alteration of sandstone reservoir rocks to preferentially gas wetting condition. J. Mol. Liq. 2017, 232, 351–360. [Google Scholar] [CrossRef]
- Wang, J.; Zhou, F.; Zhang, L.; Xue, Y.; Yao, E.; Li, Y.; Fan, F. Study on reason analysis and removal solution on water locking damage in tight sandstone reservoirs. J. Dispers. Ence Technol. 2020, 41, 1849–1858. [Google Scholar] [CrossRef]
- Wang, J.; Zhou, F.; Xue, Y.; Yao, E.; Zhang, L.; Fan, F.; Wang, R. The adsorption properties of a novel ether nanofluid for gas wetting of tight sandstone reservoir. Pet. Sci. Technol. 2019, 37, 1436–1454. [Google Scholar] [CrossRef]
- Zhu, W.; Li, H.; Deng, Q.; Ma, Q.; Liu, Y. Research Progress on Mesoscopic Flow Theory in Porous Media. China. J. Eng. Sci. 2021, 1, 1–13. [Google Scholar]
- Chatenever, A.; Calhoun, J.C. Visual Examinations of Fluid Behavior in Porous Media—Part I. J. Pet. Technol. 1952, 4, 149–156. [Google Scholar] [CrossRef]
- Li, J.J.; Su, H.; Jiang, H.Q.; Yu, F.W.; Liang, T.B.; Zhao, Y.; Gao, Y.; Hejazi, H. Application of microfluidic models in the oil and gas field development. Pet. Sci. Bull. 2018, 3, 284–301. [Google Scholar]
- Zhang, M. Evaluation of Gas-Moisture Properties on Porous Media Rock Surface and Its Influence on Imbibition and Fluid Distribution. Ph.D. Thesis, China University of Petroleum, Beijing, China, 2013. [Google Scholar]
- Yu, F.; Jiang, H.; Xu, F.; Fan, Z.; Su, H.; Li, J. New insights into flow physics in the EOR process based on 2.5D reservoir micromodels. J. Pet. Sci. Eng. 2019, 181, 106214. [Google Scholar] [CrossRef]
- Wang, J.; Li, Y.; Zhou, F.; Yao, E.; Zhang, L.; Yang, H. Study on the Mechanism of Nanoemulsion Removal of Water Locking Damage and Compatibility of Working Fluids in Tight Sandstone Reservoirs. ACS Omega 2020, 5, 2910–2919. [Google Scholar] [CrossRef] [Green Version]
- Eastoe, J.; Robinson, B.H.; Steytler, D.C. Influence of pressure and temperature on microemulsion stability. J. Chem. Soc. Faraday Trans. 1990, 86, 511–517. [Google Scholar] [CrossRef]
- Liu, S.; Dou, X.; Zeng, Q.; Liu, J. Critical parameters of the Jamin effect in a capillary tube with a contracted cross section. J. Pet. Sci. Eng. 2021, 196, 107635. [Google Scholar] [CrossRef]
- Sheng, G.; Su, Y.; Wang, W. A new fractal approach for describing induced-fracture porosity/permeability/compressibility in stimulated unconventional reservoirs. J. Pet. Sci. Eng. 2019, 179, 855–866. [Google Scholar] [CrossRef]
- Rahman, M.M.; Rahman, M.K.; Rahman, S.S. Multicriteria Hydraulic Fracturing Optimization for Reservoir Stimulation. Pet. Sci. Technol. 2003, 21, 1721–1758. [Google Scholar] [CrossRef]
- Mteiri, S.A.; Suboyin, A.; Rahman, M.M.; Haroun, M. Hydraulic Fracture Propagation and Analysis in Heterogeneous Middle Eastern Tight Gas Reservoirs: Influence of Natural Fractures and Well Placement. ACS Omega 2021, 6, 799–815. [Google Scholar] [CrossRef] [PubMed]
- Deng, H.; Sheng, G.; Zhao, H.; Meng, F.; Zhang, H.; Ma, J.; Ruan, J. Integrated optimization of fracture parameters for subdivision cutting fractured horizontal wells in shale oil reservoirs. J. Pet. Sci. Eng. 2022, 212, 110205. [Google Scholar] [CrossRef]
- Olayiwola, S.O.; Dejam, M. Effect of Silica Nanoparticles on the Oil Recovery During Alternating Injection with Low Salinity Water and Surfactant into Carbonate Reservoirs. In Proceedings of the SPE Annual Technical Conference and Exhibition, Virtual, 26–29 October 2020. Paper SPE 201586. [Google Scholar]
- Al-Hajri, S.; Negash, B.M.; Rahman, M.M.; Haroun, M.; Al-Shami, T.M. Effect of Silica Nanoparticles on Polymer Adsorption Reduction on Marcellus Shale. ACS Omega 2021, 6, 29537–29546. [Google Scholar] [CrossRef] [PubMed]
- Dong, X.; Trembly, J.; Bayless, D. Techno-Economic Analysis of Hydraulic Fracking Flowback and Produced Water Treatment in Supercritical Water Reactor. Energy 2017, 133, 777–783. [Google Scholar] [CrossRef]
- Noh, M.H.; Firoozabadi, A. Wettability alteration in gas-condensate reservoirs to mitigate well deliverability loss by water blocking. SPE Reserv. Eval. Eng. 2008, 11, 676–685. [Google Scholar] [CrossRef] [Green Version]
- Wang, X.; Yu, S.; Li, S.; Zhang, N. Two parameter optimization methods of multi-point geostatistics. J. Pet. Sci. Eng. 2022, 208, 109724. [Google Scholar] [CrossRef]
- Wang, X.; Hou, J.; Li, S.; Dou, L.; Song, S.; Kang, Q.; Wang, D. Insight into the nanoscale pore structure of organic-rich shales in the Bakken Formation, USA. J. Pet. Sci. Eng. 2019, 176, 312–320. [Google Scholar] [CrossRef]
- Avraam, D.G.A.; Payatakes, A.C. FIow Mechanisms, Relative permeabiities, and coupling effects in steady-state two-phase flow through porous media. The case of strong wettbiity. Ind. Eng. Chem. Res. 2016, 38, 778–786. [Google Scholar] [CrossRef]
- Chang, L.C.; Chen, H.H.; Shan, H.Y.; Tsai, J.-P. Effect of connectivity and wettability on the relative permeability of NAPLs. Environ. Geol. 2009, 56, 1437–1447. [Google Scholar] [CrossRef]
Figure 1.
Schematic diagram of liquid phase entering crack and core matrix during fracturing.

Figure 2.
Classification of physical models for microscopic visualization of multiphase seepage laws [22].
Figure 2.
Classification of physical models for microscopic visualization of multiphase seepage laws [22].

Figure 3.
Different types of microfluidic chip models. (a) Idealized pore structure mesh model, 10 μm; (b) Complex tortuous structure model, 50 μm; (c) Complex tortuous structure model, 200 μm.
Figure 3.
Different types of microfluidic chip models. (a) Idealized pore structure mesh model, 10 μm; (b) Complex tortuous structure model, 50 μm; (c) Complex tortuous structure model, 200 μm.

Figure 4.
Microfluidic experimental equipment. (a) Picture of equipment; (b) Equipment diagram.

Figure 5.
Gas flooding liquid phase retention in 200 μm model. (a) Dry microfluidic chip model; (b) Saturated liquid model; (c) After 500 mbar constant gas pressure displacement.
Figure 5.
Gas flooding liquid phase retention in 200 μm model. (a) Dry microfluidic chip model; (b) Saturated liquid model; (c) After 500 mbar constant gas pressure displacement.

Figure 6.
Gas flooding liquid phase retention in 50 μm model. (a) Dry microfluidic chip model; (b) Saturated liquid model; (c) After 500 mbar constant gas pressure displacement.
Figure 6.
Gas flooding liquid phase retention in 50 μm model. (a) Dry microfluidic chip model; (b) Saturated liquid model; (c) After 500 mbar constant gas pressure displacement.

Figure 7.
Causes analysis of wetting phase retention in porous media. (a) Retained water phase in dead volume; (b) Variable-diameter capillary pressure; (c) Adsorption retention of the surface wetting phase.
Figure 7.
Causes analysis of wetting phase retention in porous media. (a) Retained water phase in dead volume; (b) Variable-diameter capillary pressure; (c) Adsorption retention of the surface wetting phase.

Figure 8.
Gas channeling caused by heterogeneity of porous media, 50 μm model.

Figure 9.
Liquid retention of gas flooding in homogeneous model.

Figure 10.
The distribution of retained water phase in porous media when the gas injection pressure is changed, 200 μm.
Figure 10.
The distribution of retained water phase in porous media when the gas injection pressure is changed, 200 μm.

Figure 11.
The comparison of retained water in selected areas, 200 μm.

Figure 12.
Liquid phase retention comparation under different gas injection methods, 200 μm model. (a) 3000 mbar high pressure; (b) 500 mbar low pressure.
Figure 12.
Liquid phase retention comparation under different gas injection methods, 200 μm model. (a) 3000 mbar high pressure; (b) 500 mbar low pressure.

Figure 13.
Nano wetting fluid synthesis composite map.

Figure 14.
Nanometer particle test diagram of 0.5 wt% CNDAD1# solution [21].
Figure 14.
Nanometer particle test diagram of 0.5 wt% CNDAD1# solution [21].

Figure 15.
Surface tension test of different concentrations of nano-solution.

Figure 16.
Curve between soaking time of rock in chemical agent and contact angle [27].
Figure 16.
Curve between soaking time of rock in chemical agent and contact angle [27].

Figure 17.
Air-brine cumulative spontaneous fluid curve [27].
Figure 17.
Air-brine cumulative spontaneous fluid curve [27].

Figure 18.
Air-brine imbibition rate curve [20].
Figure 18.
Air-brine imbibition rate curve [20].

Figure 19.
(a) Pressure drop versus pore volumes injection for 2 wt% KCl brine before and after treatment of sandstone core plug, unfractured core. (b) Pressure drop versus pore volumes injection for 2 wt% KCl brine before and after treatment of sandstone core plug, fractured core [20].
Figure 19.
(a) Pressure drop versus pore volumes injection for 2 wt% KCl brine before and after treatment of sandstone core plug, unfractured core. (b) Pressure drop versus pore volumes injection for 2 wt% KCl brine before and after treatment of sandstone core plug, fractured core [20].

Figure 20.
Evaluation of the effect of nano-emulsion in removing water blocking damage in 50 μm model. (a) The model before liquid-saturated; (b) The chip saturated with nano-emulsion fluid; (c) The chip after gas drive saturated brine under 500 mbar; (d) The chip resaturated aqueous phase under 500 mbar.

Publisher’s Note: MDPI stays neutral with regard to jurisdictional claims in published maps and institutional affiliations. |
© 2022 by the authors. Licensee MDPI, Basel, Switzerland. This article is an open access article distributed under the terms and conditions of the Creative Commons Attribution (CC BY) license (https://creativecommons.org/licenses/by/4.0/).
Share and Cite
MDPI and ACS Style
He, F.; Wang, J. Study on the Causes of Water Blocking Damage and Its Solutions in Gas Reservoirs with Microfluidic Technology. Energies 2022, 15, 2684. https://0-doi-org.brum.beds.ac.uk/10.3390/en15072684
AMA Style
He F, Wang J. Study on the Causes of Water Blocking Damage and Its Solutions in Gas Reservoirs with Microfluidic Technology. Energies. 2022; 15(7):2684. https://0-doi-org.brum.beds.ac.uk/10.3390/en15072684
Chicago/Turabian StyleHe, Fengguo, and Jie Wang. 2022. "Study on the Causes of Water Blocking Damage and Its Solutions in Gas Reservoirs with Microfluidic Technology" Energies 15, no. 7: 2684. https://0-doi-org.brum.beds.ac.uk/10.3390/en15072684
Note that from the first issue of 2016, this journal uses article numbers instead of page numbers. See further details here.