Article

Test and Modelling of Solid Oxide Fuel Cell Durability: A Focus on Interconnect Role on Global Degradation

by
Roberto Spotorno
1,
Fiammetta Rita Bianchi
2,*,
Daniele Paravidino
1,
Barbara Bosio
2,* and
Paolo Piccardo
1
1
Department of Chemistry and Industrial Chemistry (DCCI), University of Genoa, Via Dodecaneso 31, 16146 Genoa, Italy
2
Department of Civil, Chemical and Environmental Engineering (DICCA), University of Genoa, Via Opera Pia 15b, 16145 Genoa, Italy
*
Authors to whom correspondence should be addressed.
Submission received: 16 February 2022 / Revised: 6 April 2022 / Accepted: 7 April 2022 / Published: 9 April 2022
(This article belongs to the Special Issue Solid Oxide Cells: Technology, Design and Applications)

Abstract

:
High-temperature fuel cells are a promising technology due to their high energy efficiency and low environmental impacts compared to conventional engines. Nevertheless, they have a limited lifetime which reduces the use to a few application fields. Among them, Solid Oxide Fuel Cells (SOFCs) have had a recent development at the industrial level in two possible configurations: anode- and electrolyte-supported design. Considering the impossibility to experimentally distinguish the effects of every degradation mechanism on global cell performance, each layer should be tested singularly through ex situ tests and then assembled into a virgin cell to evaluate its role on the whole system by in situ tests. However, this procedure results as quite complex, and some further microstructural changes could occur during cell sintering. In order to overcome these constraints, the proposed approach paired ex situ experimental observations on a single element with modelling results on global SOFC. As a case study, CoMnO/Crofer22 APU and CuMnO/AISI 441 interconnect samples were tested, measuring their resistance variation for some hundreds of hours, followed by a detailed post-mortem microstructural analysis. Based on a previously validated local model, SIMFC (SIMulation of Fuel Cells), the durability of commercial anode- and electrolyte-supported cells was simulated, adding specific degradation functions only for the interconnects in order to highlight their influence on SOFC performance.

1. Introduction

Solid Oxide Cells (SOCs) are a promising technology in energy production due to their possible dual operation: as fuel cells to generate electricity and heat through cogeneration units and also cooling by adsorption chillers [1], and as electrolysers to convert the surplus energy from renewable sources and/or a grid into hydrogen through energy storage units [2]. Indeed, high working temperatures allow for using ceramic materials as both electrocatalysts and electrolytes, differently from other cell designs. In such a system, hydrogen and oxygen evolutions are favoured, making feasible the use of a single device which switches between two operations, only varying the current direction [3]. At the same time, higher efficiencies are also possible: Solid Oxide Fuel Cells (SOFCs) are characterised by 55–60% as electric efficiency and 90% as CHP efficiency using heat derived from hot outlet gases, whereas Solid Oxide Electrolyser Cells (SOECs) reach 80%, providing a fraction of energy as heat instead of all electric power [4]. An alternative cell application is based on reversible operation, i.e., alternation of fuel cell and electrolysis mode, within a smart grid consisting of distributed power generation systems, which guarantee the users’ demand through the in situ production [5,6].
However, two limitations slow down the SOC spread: high system costs and short lifetime. For the first point, according to the economy of scale, the capital costs should decrease from the current EUR 2000 kWel−1 to EUR 1000 kWel−1 by 2030, and EUR 530 kWel−1 by 2050 [2]. The operation hour target is 80,000 h for stationary applications [7], a more suitable SOC working field due to the long requested transition steps. This goal has been almost reached by low-temperature cells; for instance, PEMFCs (Protonic Exchange Membrane Fuel Cells) overcome 70,000 h without defacing their performance [8], whereas SOCs are characterised by a still low durability, consisting of about 45,000 h in fuel cell mode [9] and 10,000 h in electrolysis mode [10]. The most critical cell components are usually the electrodes, where the degradation reduces the electrocatalytic activity. Indeed, high working temperatures favour microstructure changes, above all referring to Ni-cermet-based fuel electrodes. Ni particles easily agglomerate [11]; moreover, Ni tends to migrate, moving the reaction front far from the electrode–electrolyte interface and therefore worsening electrochemical processes [12]. Moreover, the fuel electrode is quite sensitive to gas composition: Ni can oxidise in fuel starvation conditions [13] or be deactivated by coking and other pollutant deposition in case of direct hydrocarbon-fed mixtures [14,15]. Looking at the oxygen electrode, the high working temperature causes the migration of metallic atoms by promoting the formation of insulating layers; for instance, a Sr-rich secondary phase deposits at the electrolyte interface, hindering reaction sites and reducing the conductivity in lanthanum-based electrocatalysts [16]. Other quite critical components are the interconnects, metallic items which provide the system structural integrity and guarantee the electric connection between adjacent cells assembled into stacks to reach the desired power value. Ferritic Stainless Steels (FSSs) are the most promising interconnect materials due to their high-temperature oxidation resistance. Such material family is characterised by the ability to form a superficial layer of passivating chromium oxide that protects alloys [17]. However, the high involved temperatures as well as the oxidant-humid cathodic environment lead to the oxide scale thickening [18]. This oxide growth implies the risk of mechanical fractures and the decrease of electrical conductivity of the interconnects [19]. Moreover, in SOFC working conditions, the further oxidation of the Cr3+ within the oxide forms Cr6+ volatile species [20]. Chromium hexavalent compounds are critical for lanthanum-based electrodes since they react with the catalytic material and dramatically reduce the system performances. This mechanism is called cathode poisoning and is one of the most crucial aspects for the air electrode degradation [21,22]. Moreover, the released chromium depletes the amount of such element in the alloy, decreasing its oxidation resistance capability. In order to mitigate the interconnect degradation characterised by the abovementioned phenomena, protective ceramic coatings are usually applied on the interconnect surface. The coating purpose consists in shielding the substrate from the environment to prevent both its oxidation and chromium volatilisation. This achievement could be reached by ceramic materials with high electrical conductivity, comparable Coefficient of Thermal Expansion (CTE) to the other components of the cell, and low oxygen and chromium permeability. State-of-the-art protective coatings are based on spinel structure compounds, among which the most studied are (Cu,Mn)3O4 and (Co,Mn)3O4, referred to in this paper as CuMnO and CoMnO, respectively [23,24].
Aiming at the increase of SOC reliability and durability, fault diagnosis and prognosis are two fundamental steps. Indeed, an early-stage identification of specifically occurring degradation mechanisms allows for both reducing possible consequences and introducing the best mitigation strategies. Moreover, the estimation of Remaining Useful Life (RUL) permits to plan maintenance works, if the complete recovery after the damage is impossible [25]. Health indicators, such as voltage or area-specific resistance changes, are commonly used in addition to the temperature monitoring in order to detect possible faults [26]. However, their correlation to specific degradation mechanisms is quite challenging for in-operando cells, since only a detailed microstructural analysis permits to understand the real cell state. Some promising attempts as degradation detectors have been obtained through electrochemical impedance and distribution of relaxation time analysis [27,28]. Indeed, variations of the obtained spectra can be attributed to specific electrochemical processes providing some suggestions of occurred phenomena. However, the knowledge of actual mechanisms characterising each layer and their weight on the global cell performance remains a quite critical point.
In such framework, this work combined test observations with cell modelling in order to highlight the role of a specific component, which cannot be solved only through the experimental approach due to the overlapping of more phenomena. Here, the proposed strategy could suggest which materials require further improvements to become competitive without a huge experimental campaign and with minimum computation efforts due to model complexity. As a case study, the analysis focused on the behaviour of cathodic side interconnects, which are quite critical layers characterised by severe microstructural changes. Here, the work aimed at evaluating both the electric performance of the single interconnect and its influence on global fuel cell behaviour in terms of conductivity reduction, looking at two state-of-the-art configurations based on Electrolyte-Supported Cells (ESC) and Anode-Supported Cells (ASC). In detail, the degradation of CoMnO and CuMnO spinel coatings deposited respectively on Crofer22 APU and AISI 441 were the subject of the present study. Such samples were characterised from the electrical point of view by measuring their electrical resistance evolution during the exposure at simulated operating conditions. Moreover, the variation of thermal dependence of the electrical conductivity was evaluated through a gradual cooling of samples after different exposure times. The testing campaign was followed by a detailed post-experiment microstructural analysis of each sample. Knowing the specific degradation of the cathodic interconnect layer, semi-empirical formulations were implemented in the home-developed code (SIMFC—SIMulation of Fuel Cells), which allowed for simulating reference cell behaviour.

2. Experimental Test Description

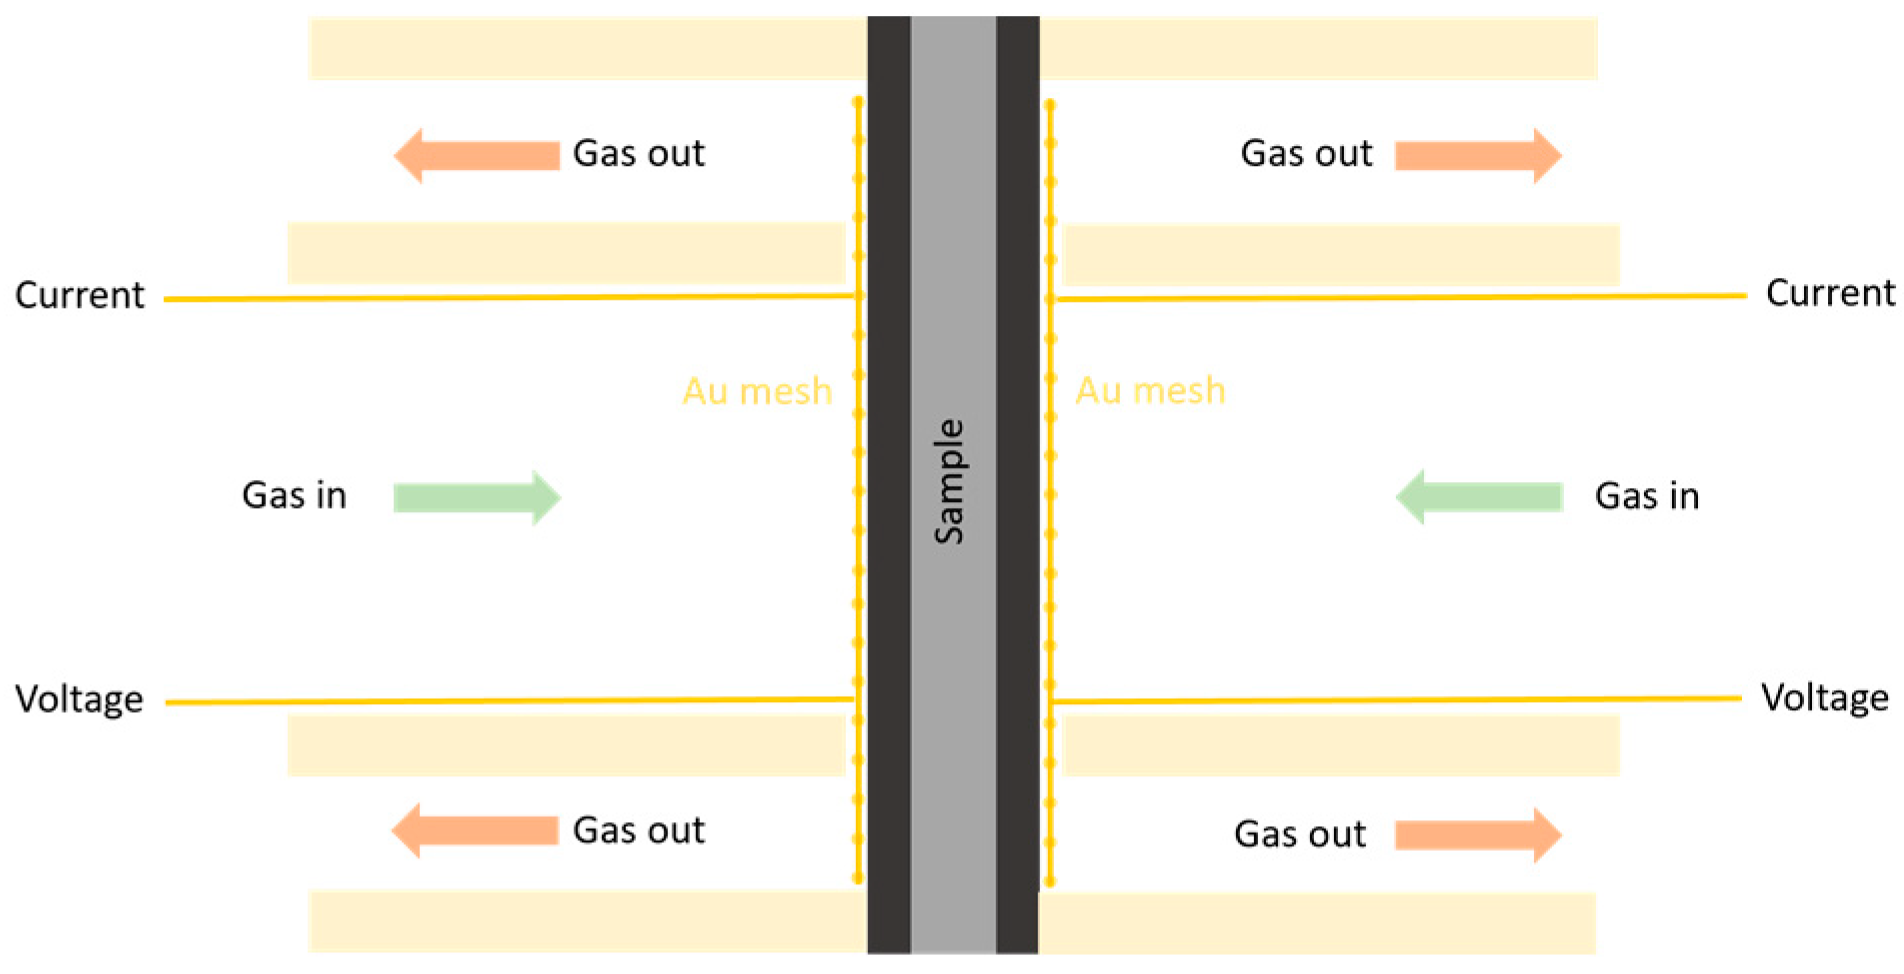
2.1. Sample Preparation and Testing

Two types of coated FSSs were investigated: AISI 441 coated with CuMnO (SOLIDpower S.p.A., Mezzolombardo, Italy) and Crofer22 APU coated with CoMnO (Sunfire GmbH, Dresden, Germany). The FSSs substrates were cut by a water jet from 5 mm-thick sheets, obtaining circular-shaped coupons with a 25 mm diameter. The coatings were applied by the respective producers using the colloidal spraying technique and firing treatment following a non-disclosed procedure.
Testing of samples was performed using a custom device designed to host one singular sample into a horizontal alumina pipe placed in a furnace that can heat the internal part of the setup up to 1173 K (Figure 1). Each side of the sample could be exposed to an independent gas flow in terms of rate and composition, and it was electrically connected to the external measuring unit through a gold mesh welded to two wires. This allowed to perform electrical measurements using a four-wire connection, thus eliminating the resistive contribution of the leads. A homogeneous and stable electrical contact was assured by applying a standardised mechanical load (12.5 N cm−2), achieved using calibrated springs.
Testing conditions were adjusted to better represent SOFC working ones. A common operating temperature for the CoMnO composition is 1123 K, while for CuMnO it is 1023 K, and for this reason the samples of CoMnO/Crofer22 APU were tested at 1123 K and the CuMnO/AISI 441 ones were exposed to 1023 K. Samples were aged at their respective operating temperatures for 200 and 400 h under an air flow of 20 mL min−1 on both sides. ASR was measured during aging every 10 h by Electrochemical Impedance Spectroscopy (EIS) with an AC signal of 10 mV in the frequency range of 600 kHz–200 mHz using a VSP galvanostat/potentiostat (Biologic, Seyssinet-Pariset, France). The use of EIS was chosen to limit the applied signal, thus avoiding possible perturbations of the system due to the effects of a DC current. The electrical resistance of the sample was calculated by fitting the measured impedance spectra with an equivalent electric circuit consisting of a resistor in series with an inductor. The obtained resistance value was divided by two to only consider one side of the sample and multiplied by its surface in order to calculate the Area-Specific Resistance (ASR) [29]. The electrical characterisation of the samples included the evaluation of the activation energy for the electrical conductivity by performing ASR measurements as a function of the sample temperature at the as-coated state, after 200 and 400 h of exposure. In particular, the ASR measurements were carried out every fifty degrees during the cooling ramp and then used to calculate the activation energy assuming an Arrhenius-type dependence on temperature [30].

2.2. Post-Experimental Characterisation

The oxide-coating chemical composition and morphological investigation were performed on surfaces and cross-sections via Scanning Electron Microscope observations (SEM, Zeiss EVO 40, Carl Zeiss, Oberkochen, Germany) and Energy-Dispersive X-ray Spectroscopy analysis (EDXS, Cambridge INCA 300, with a PentaFET EDXS detector, Oxford Instruments, Oxfordshire, UK). For the cross-section investigation, the operated samples were cold-mounted in epoxy resin, then mechanically grinded and polished following the metallurgical standard procedure ASTM E3_95, up to ¼ μm diamond suspension. Imaging analysis was performed using the software ImageJ (Fiji) on the SEM micrographs in order to measure the thickness of the coatings and their relative density.

3. Modelling of Cell Performance

The simulation was performed through SIMFC, an in-home built Fortran code, to predict high-temperature planar fuel cell behaviour [31,32]. It is a physical-based model where material, energy, momentum, and charge balances are solved on the cell plane [33]. Aiming at a local control of system performance, both anodic and cathodic sides are divided through a mesh, which allows the study of specific phenomena occurring in each created sub-cell in terms of both main physicochemical parameters and electrochemical variables. Its core consists of a detailed kinetics formulation, which considers reforming and electrochemical processes in an anionic conductive-based cell. For the first point, it assumes that Steam Reforming (SR) and Water Gas Shift (WGS) reach the thermodynamic equilibrium condition [34], expressing the equilibrium constant, Keq, in terms of reactant partial pressure, p, and temperature, T, according to a semi-empirical approach for SR (Equation (1)) [35] and the Van’t Hoff formulation for WGS (Equation (2)) [36].
K eq , SR = p CO p H 2 3 p CH 4 p H 2 O = exp ( 30.114 26,830 T )
K eq , WGS = p CO 2 p H 2 p CO p H 2 O = exp ( Δ G R T )
where ΔG is the Gibbs free energy and R is the ideal gas constant.
Looking at electrochemical kinetics, the cell voltage, V, is expressed as a function of applied current density, J, starting from open circuit voltage, E, calculated by Nernst law and subtracting different polarisation losses, η (Equation (3)). For the ohmic overpotential, ηohm, an Arrhenius-type formulation is assumed, whereas both the activation, ηact, and the diffusion, ηdiff, terms derive from the Butler–Volmer equation (Equation (4)). The complete kinetics was described in more details in the authors’ previous work [37].
V = E 0 + R T z F log ( p H 2 p O 2 0.5 p H 2 O ) η ohm η act η diff
V = E [ γ ohm T exp ( E a , ohm R T ) ] J 2 R T z F sin h 1 [ J 2 γ fuel ( y H 2 O y H 2 ) A exp ( E a , fuel R T ) ] 2 R T z F sin h 1 [ J 2 γ air ( y O 2 ) B exp ( E a , air R T ) ] 2 A R T z F log ( 1 + J J lim , H 2 O 1 J J lim , H 2 ) 2 B R T z F log [ p O 2 ϑ O 2 p ( p p O 2 ϑ O 2 ) exp ( ϑ O 2 J J lim , O 2 ) ]
where A and B are the reactant kinetic orders, E0 is the reversible potential dependent on the working temperature, Ea is the activation energy, F is the Faraday constant, Jlim is the limiting current density, z is the charge number, γ is the pre-exponential coefficient and θ is a combination of diffusion coefficients.
Focusing on the interconnect contribution, its term was distinguished from global cell ohmic resistance, adding a separated specific term, ηohm,int, to be subtracted into Equations (3) and (4). This degradation function was determined by a semi-empirical approach, where the pre-exponential factor and the activation energy values were expressed as a function of the time, t, based on ASR experimental observations (Equation (5)).
η ohm , int = A S R   J = γ ASR ( t )   exp [ E a ( t ) R T ] J
Adapting the electrochemical kinetics to the specific design, SIMFC can simulate the behaviour of two commercial cells: ESC and ASC. Considering their state-of-the-art materials, ESC was assumed as composed by a YSZ (Yttria-Stabilised Zirconia) electrolyte, on which a Ni-CGO (Cerium Gadolinium Oxide) anode and a LSCF (Lanthanum Strontium Cobalt Ferrite)-CGO cathode are deposited, whereas ASC consisted of a thick Ni-YSZ anode, providing the mechanical support for a YSZ electrolyte and a LSCF-CGO cathode. In both designs, a thin CGO barrier layer is usually introduced between the oxygen electrode and electrolyte, guaranteeing the cell chemical stability. In view of aging conditions for the interconnects described in Section 2, both designs were simulated applying the structural features and kinetics parameters reported in Table 1 and Table 2, respectively (refer to authors’ previous work for the kinetics validation of each configuration [38]).

4. Experimental Observations on Interconnect Behaviour

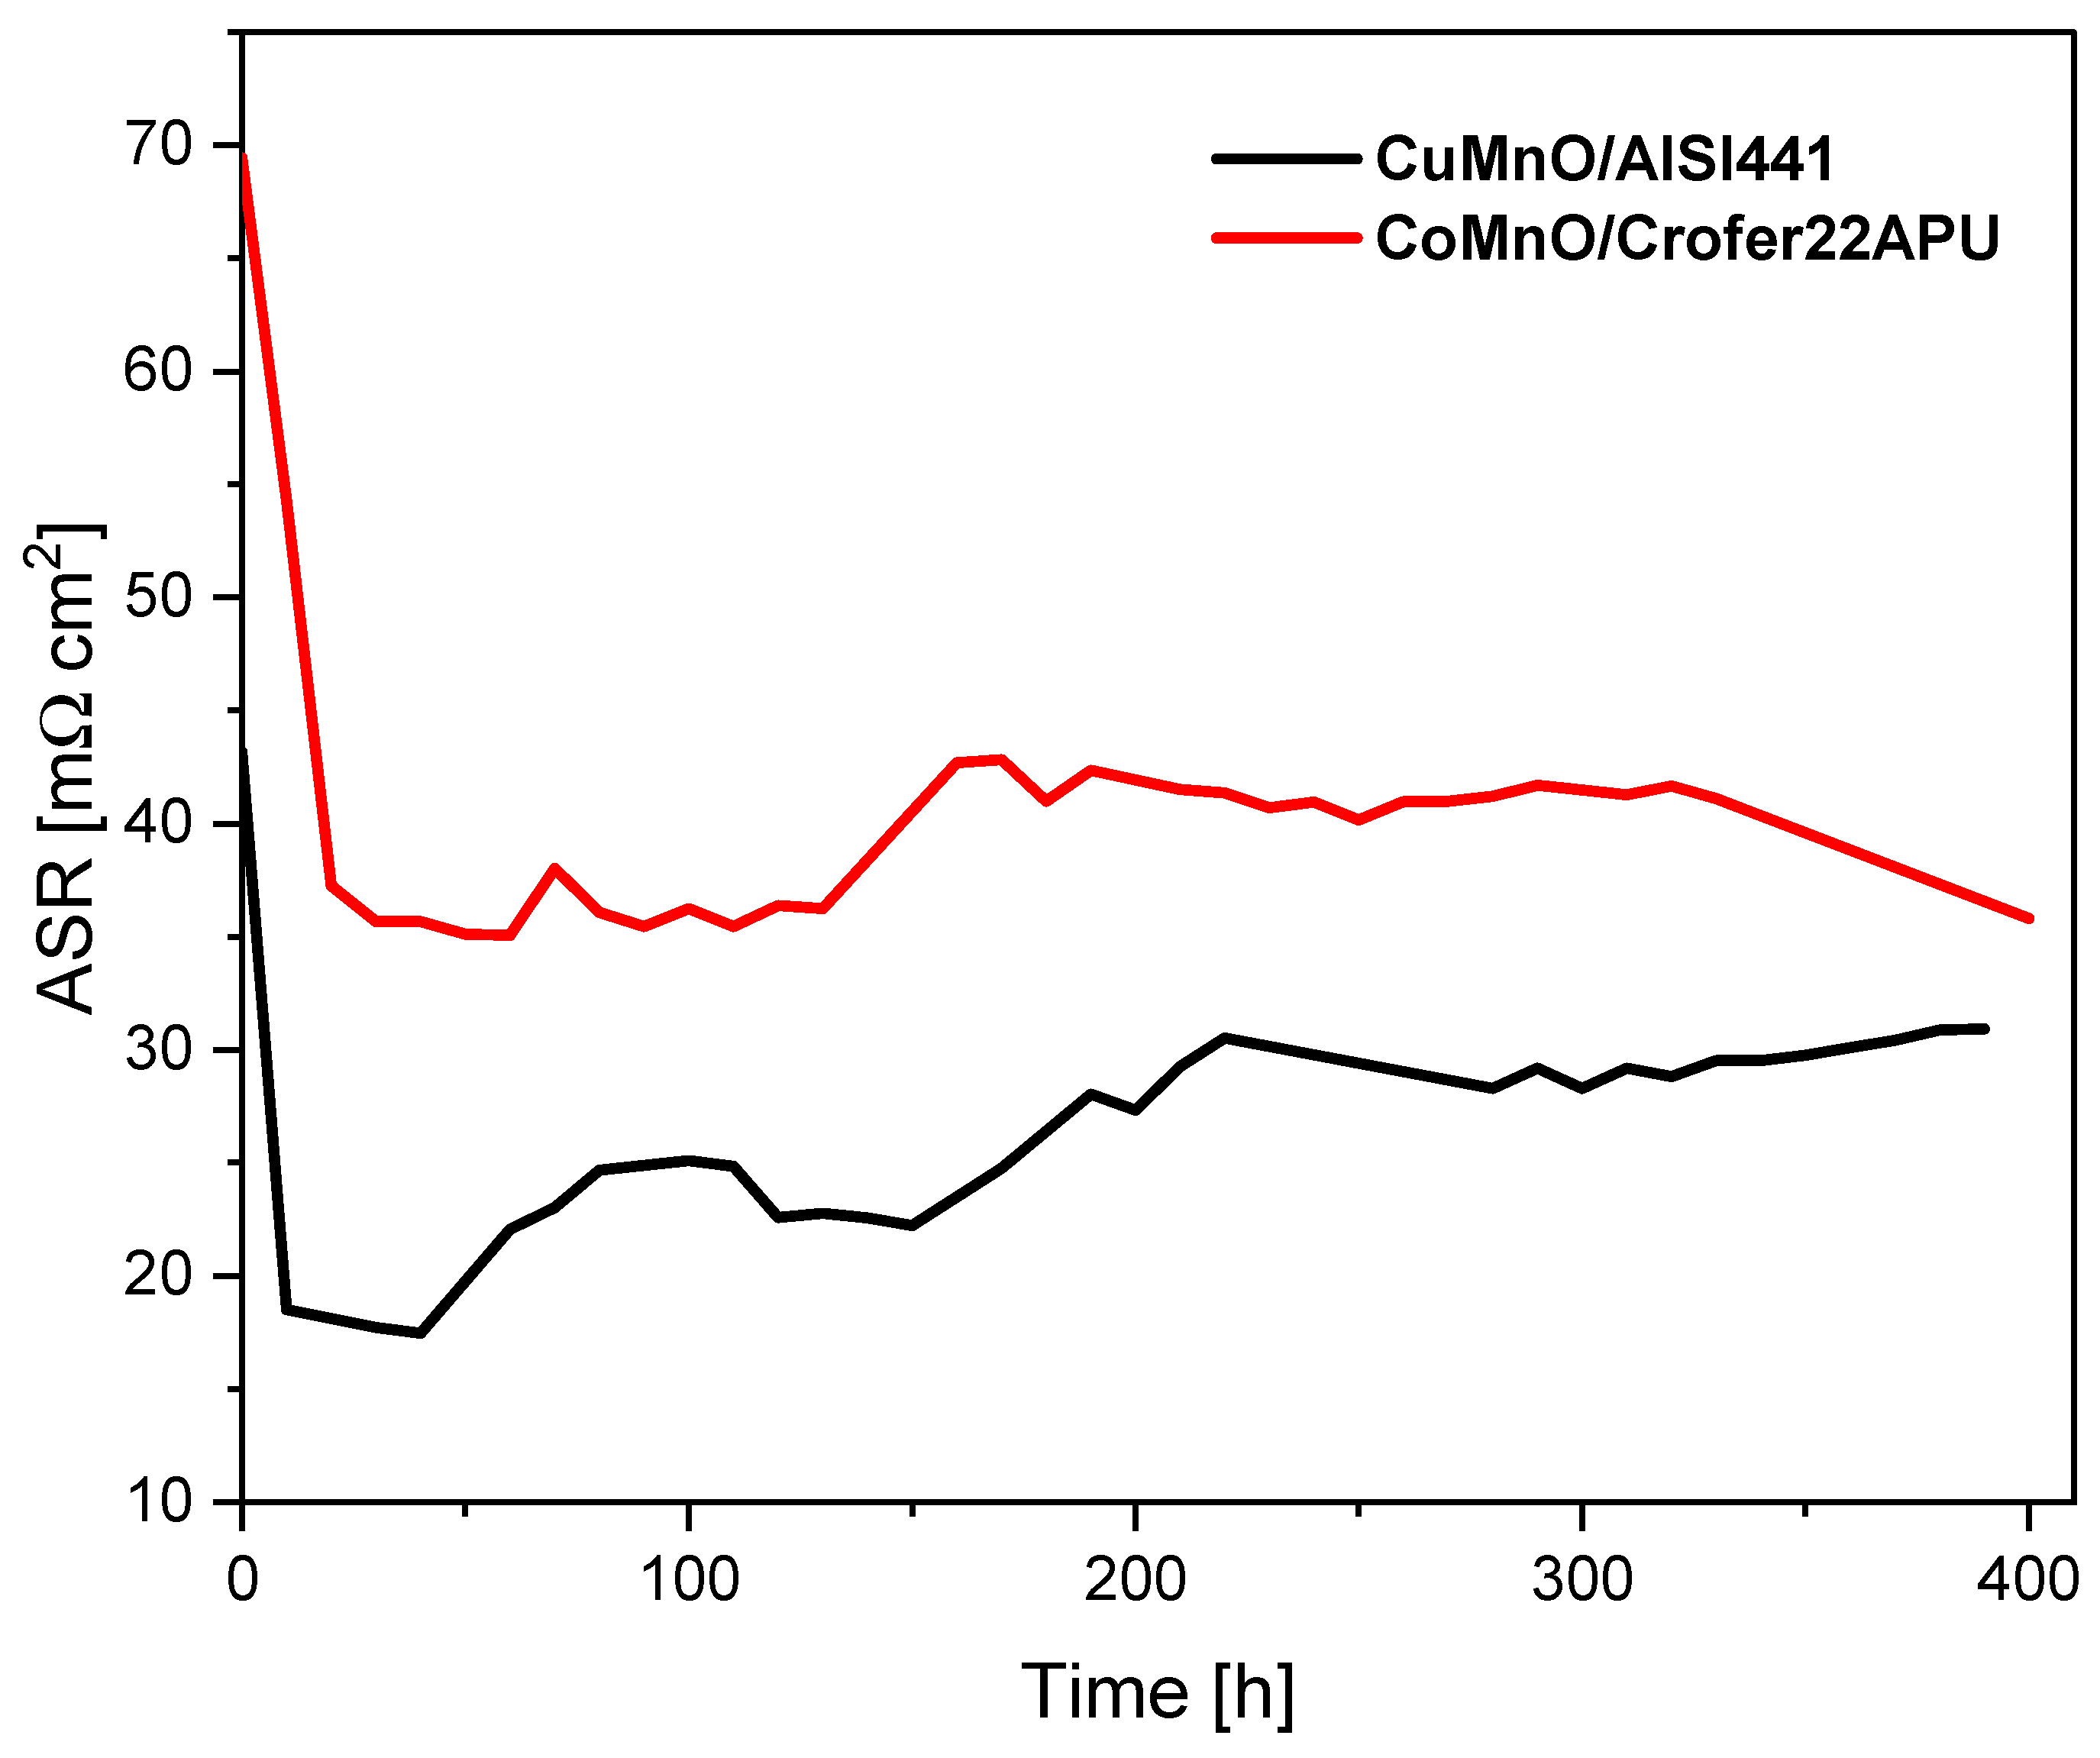
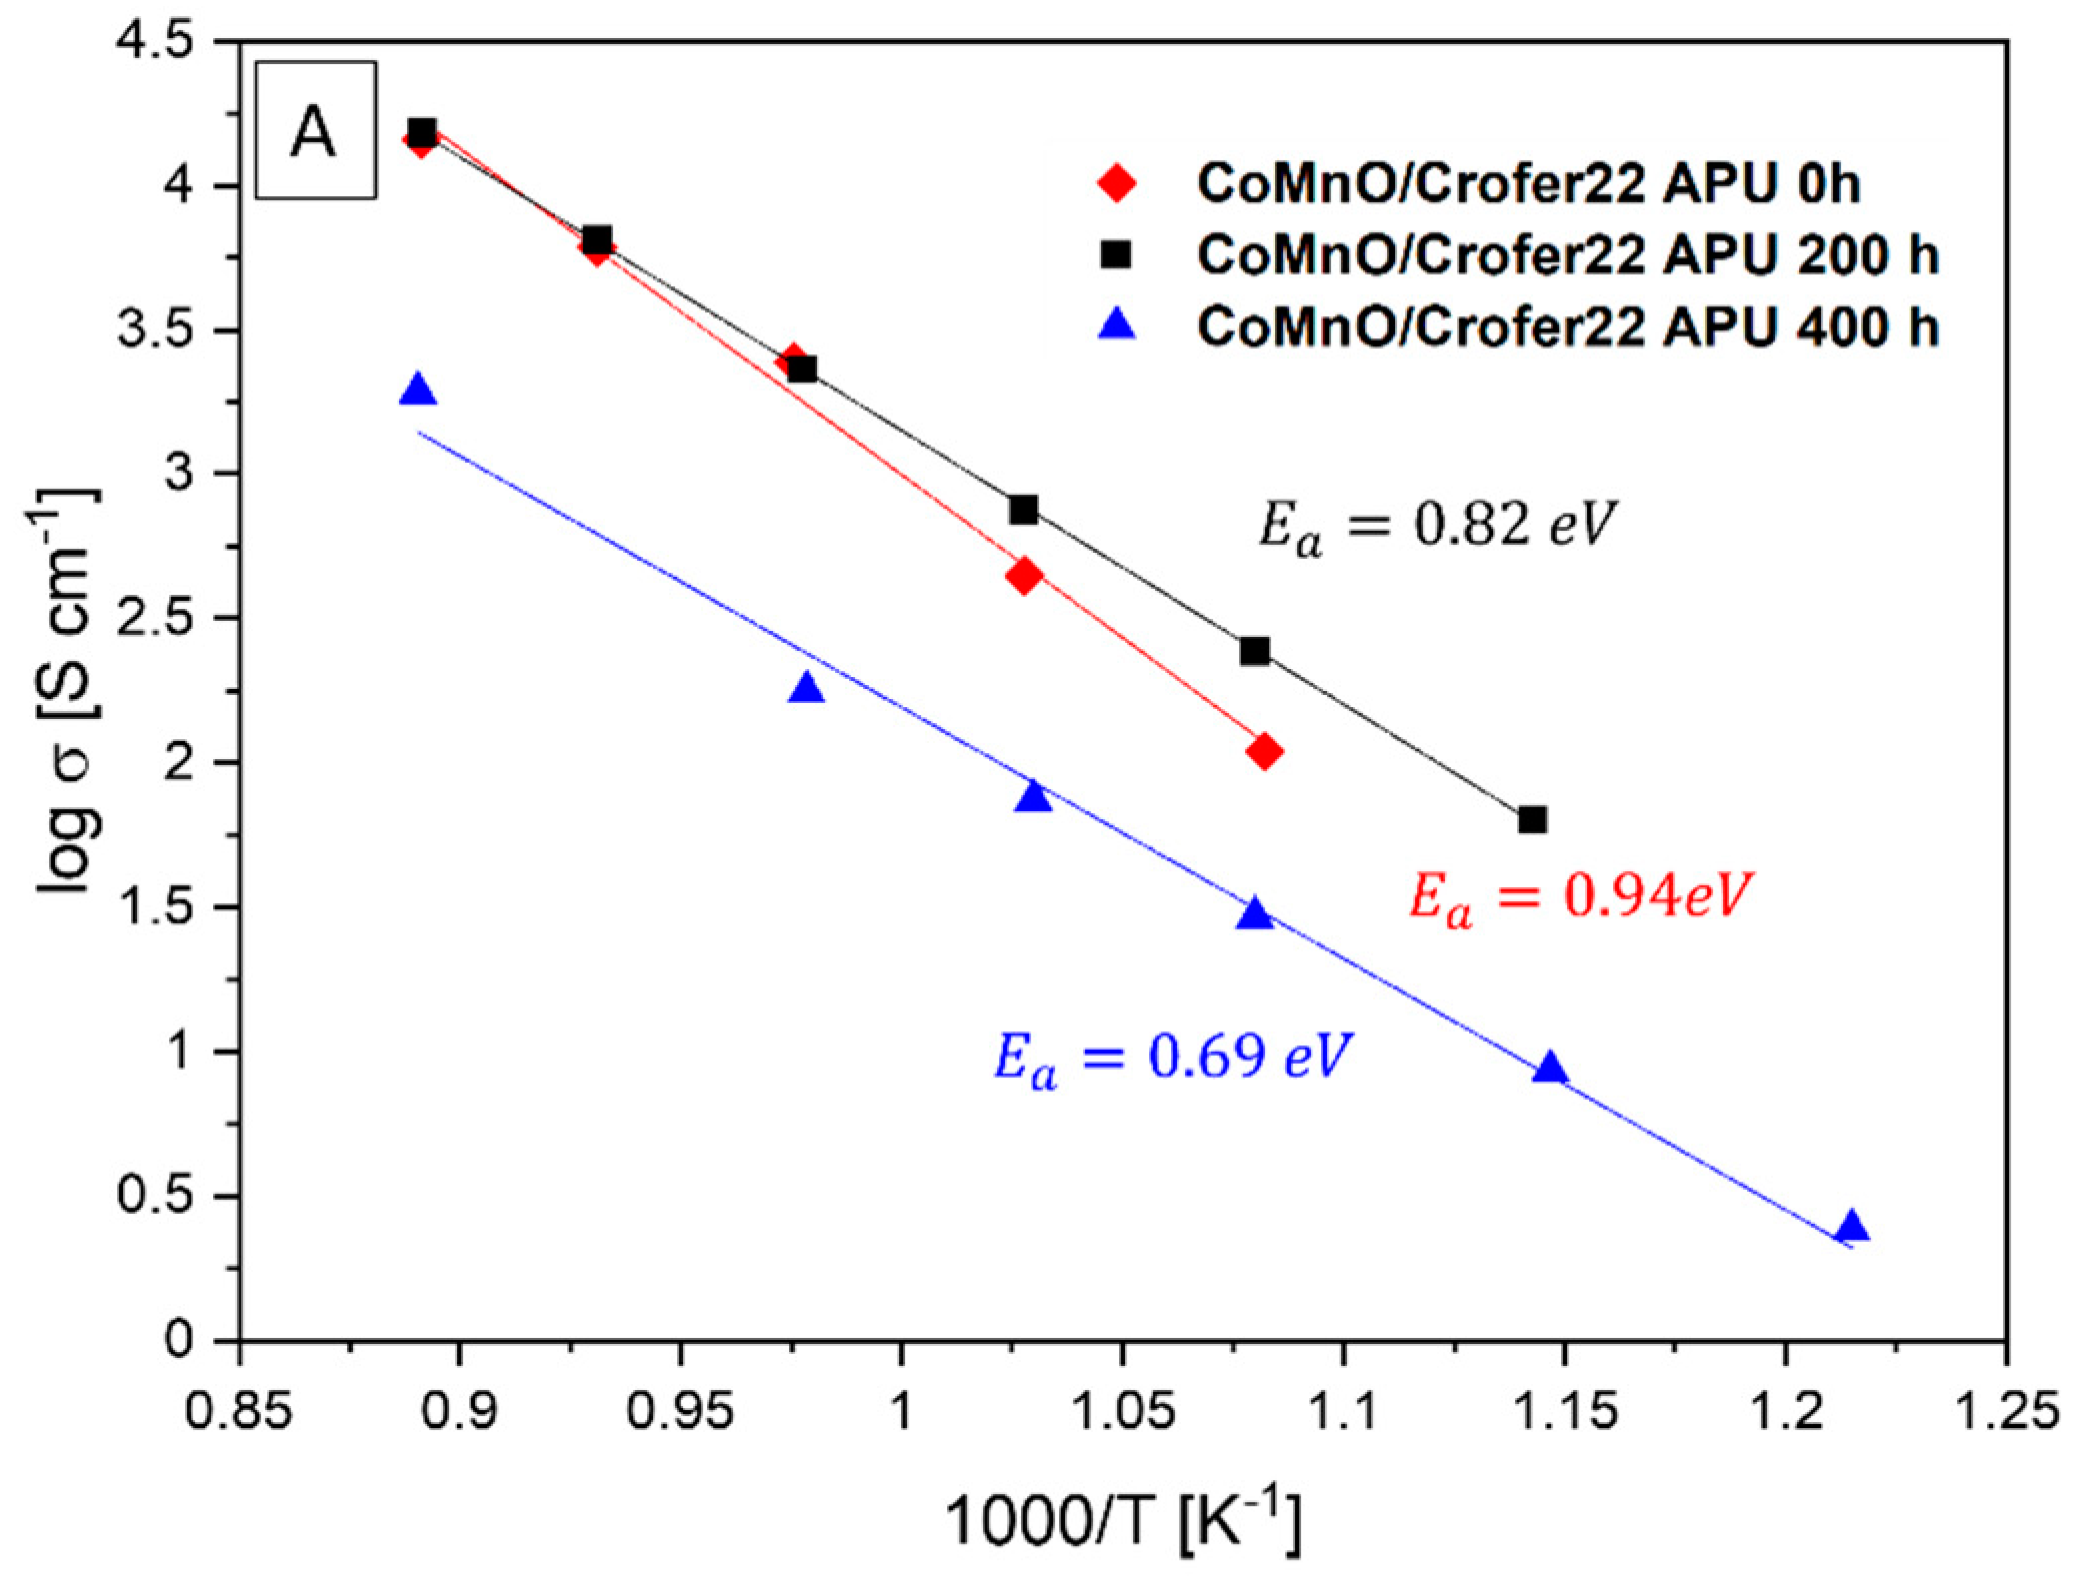
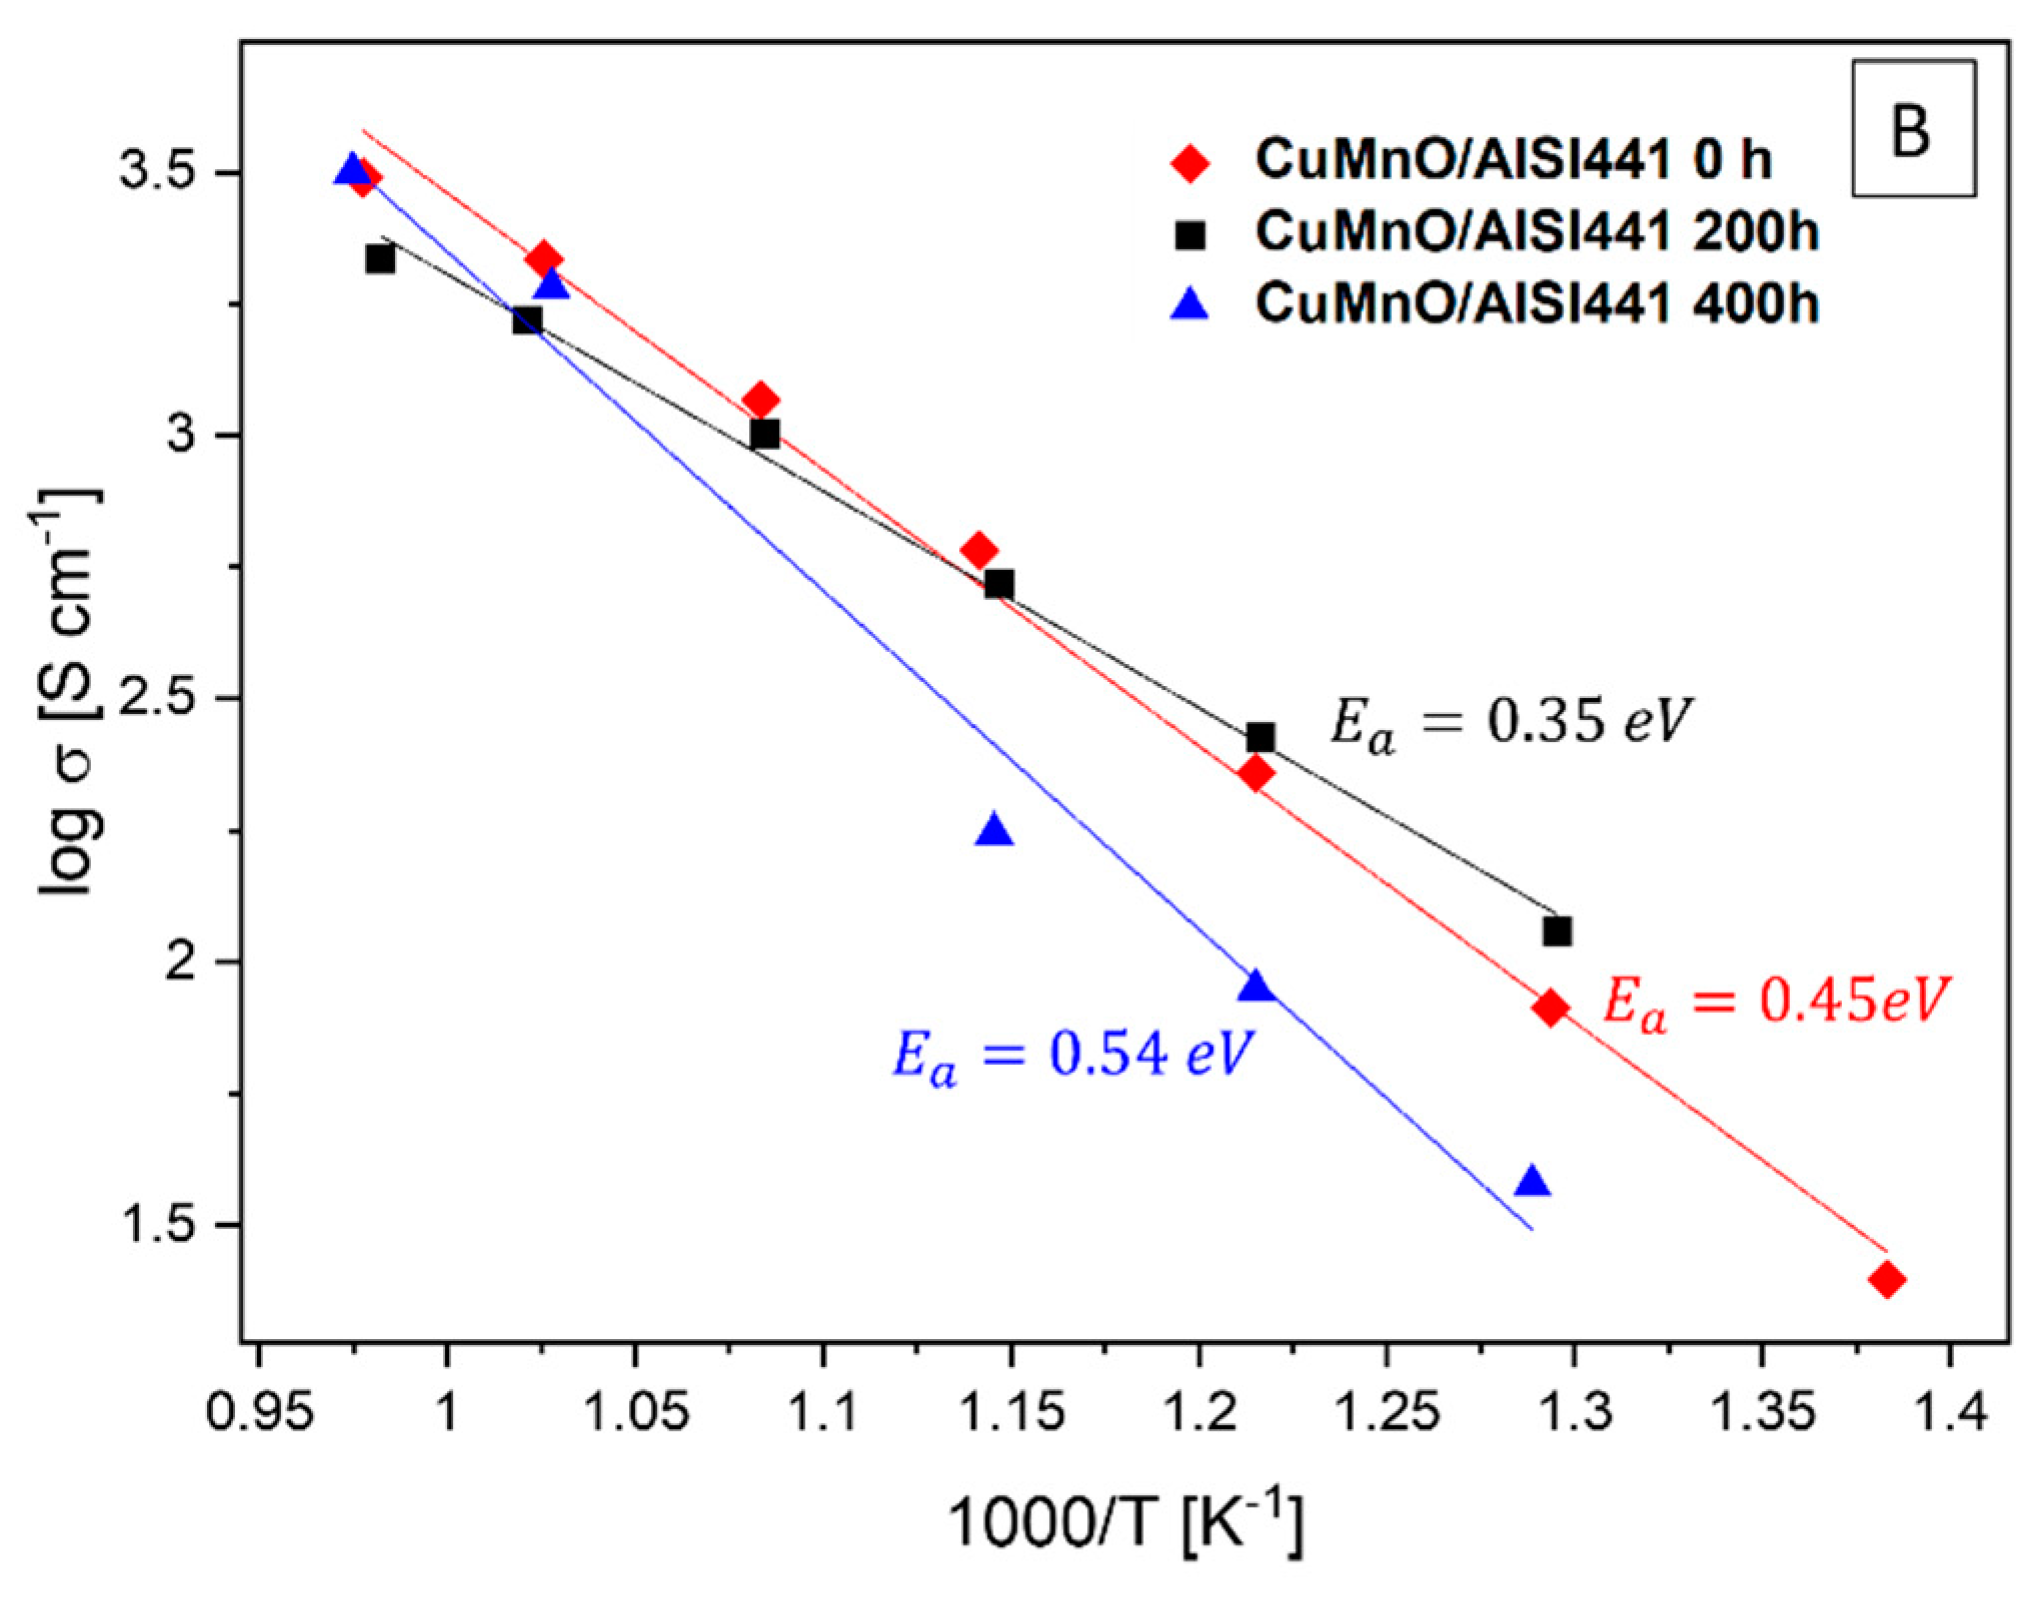
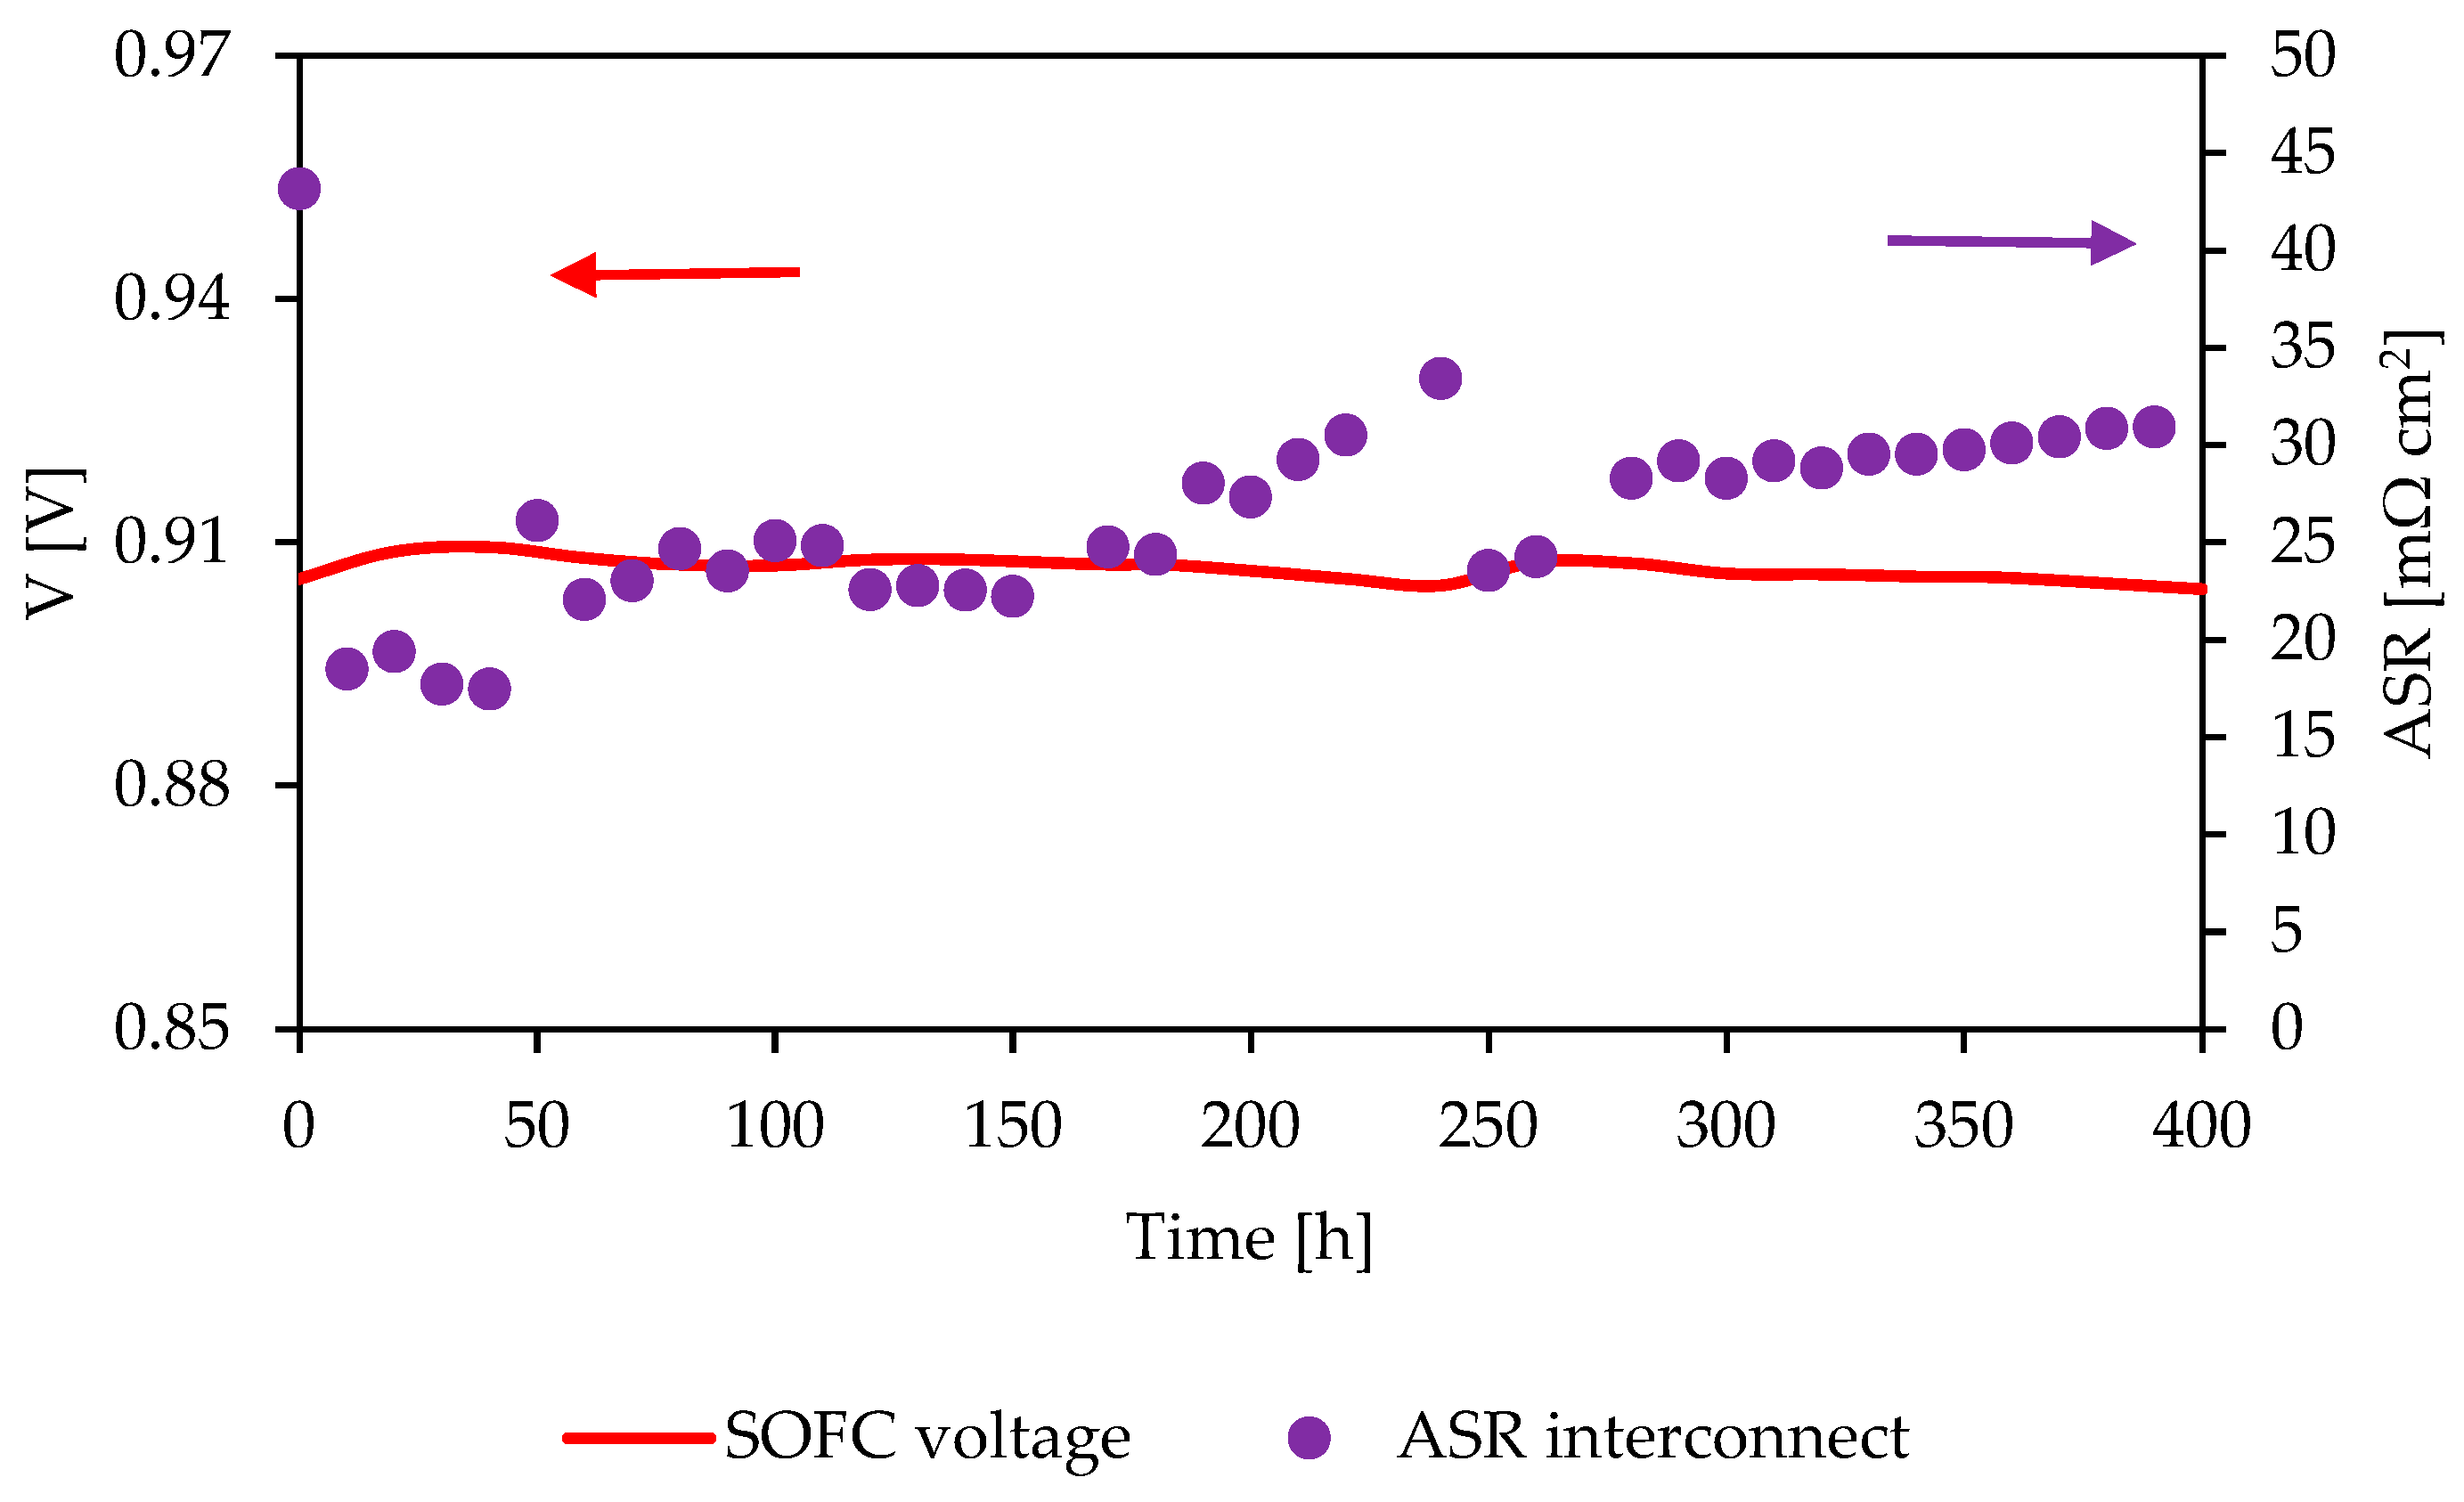
4.1. Electrical Behaviour of Interconnects

Looking at electrical behaviour according to ex situ tests, Figure 2 shows the ASR values of CoMnO/Crofer22 APU (red line) and CuMnO/AISI 441 (black line). Both samples exhibited ASR values below the 100 mΩ cm2 upper limit considered for interconnect applications [39]. The precision of the electrical measurement was connected to the instrument sensitivity, that corresponds to ± 0.001 Ω. Error bars are not reported here for graphical reasons. The evolution of the electrical resistance over time is similar for these two samples, consisting in an ASR decrease during the first hours of the experiment, attributable to the contact enhancement between the gold meshes and the sample as well as the improvement of the coating conductivity due to its densification [23]. After the initial decrease, the ASR of the CoMnO/Crofer22 APU sample remained stable at 35.1 mΩ cm2 for more than 50 h and then slightly increased, settling at values ~41.2 mΩ cm2. These observations are comparable with the results of Sabato et al. [40], who reported ~25 mΩ cm2 as ASR after 500 h of aging. Moreover, its evolution over time is also in agreement with literature data, since an increase of the electrical resistance is quite common in the first hours of exposure [40]. CuMnO/AISI 441 showed lower resistance values compared to the CoMnO/Crofer22 APU for the whole test duration. During the first aging hours, its ASR reduced until a minimum of 17.5 mΩ cm2, followed by an increase lasting about 150 h, and after that a stable value ~ 30.1 mΩ cm2 was reached.
Results of the electrical conductivity, σ, measured as a function of temperature, T, are reported in Figure 3. The linear trend between (log σ) and (1000/T) detected for all samples indicates a single conduction mechanism in the whole temperature range that can be ascribed to the small polaron hopping on octahedral sites, typical of spinel oxides [24]. CoMnO/Crofer22 APU exhibited a decrease of the activation energy during the exposure time, from 0.94 to 0.69 eV, indicating a lower temperature dependency of the conductivity mechanism (Figure 3A). This Ea range is in reasonable agreement with the reported activation energy of ~0.8 eV by Mandal et al. [41] for CoMnO pellets. The discrepancy between the literature data and the initial Ea value could be related to the doping of the coating by Cr ions coming from the steel. Indeed, the Cr effect onto the CoMnO structure was reported to increase the activation energy of the material [24]. However, despite a Cr increase, the activation energy decreased during the aging, which could be attributed to the coating densification and its improved adherence to the substrate as prevalent aspects. The activation energy for CuMnO/AISI 441 had an initial decrease from 0.45 to 0.35 eV in the first 200 h, then a value of 0.54 eV was measured after 400 h of aging (Figure 3B). Such trend may be due to the competition of two different factors: densification and degradation. In the first 200 h, the predominant factor was the noticeable densification caused by the high-temperature exposure. Then, when the maximum density was reached, the factors driving the Ea modification were the degradation and the de-mixing of the CuMnO coating that led to the observed Ea increase. Anyway, the measured Ea values appear lower than the data presented by Huang et al., who reported 0.78–0.84 eV for Cu1.2Mn1.8O4/Crofer22 APU samples [42].
Both coated samples showed lower activation energies compared to reference uncoated steels, which commonly exhibit Ea = 0.9 eV related to the formation of the chromia oxide scale [42,43,44]. Lu et al. demonstrated that such value can also be influenced by the diffusion of Mn into the thermally grown oxide, which leads to the formation of Mn1+xCr2−xO4. The highest Ea (~1.17 eV) was reported for x~0.2, and the minimum (~0.95 eV) for x~0.6 [45].

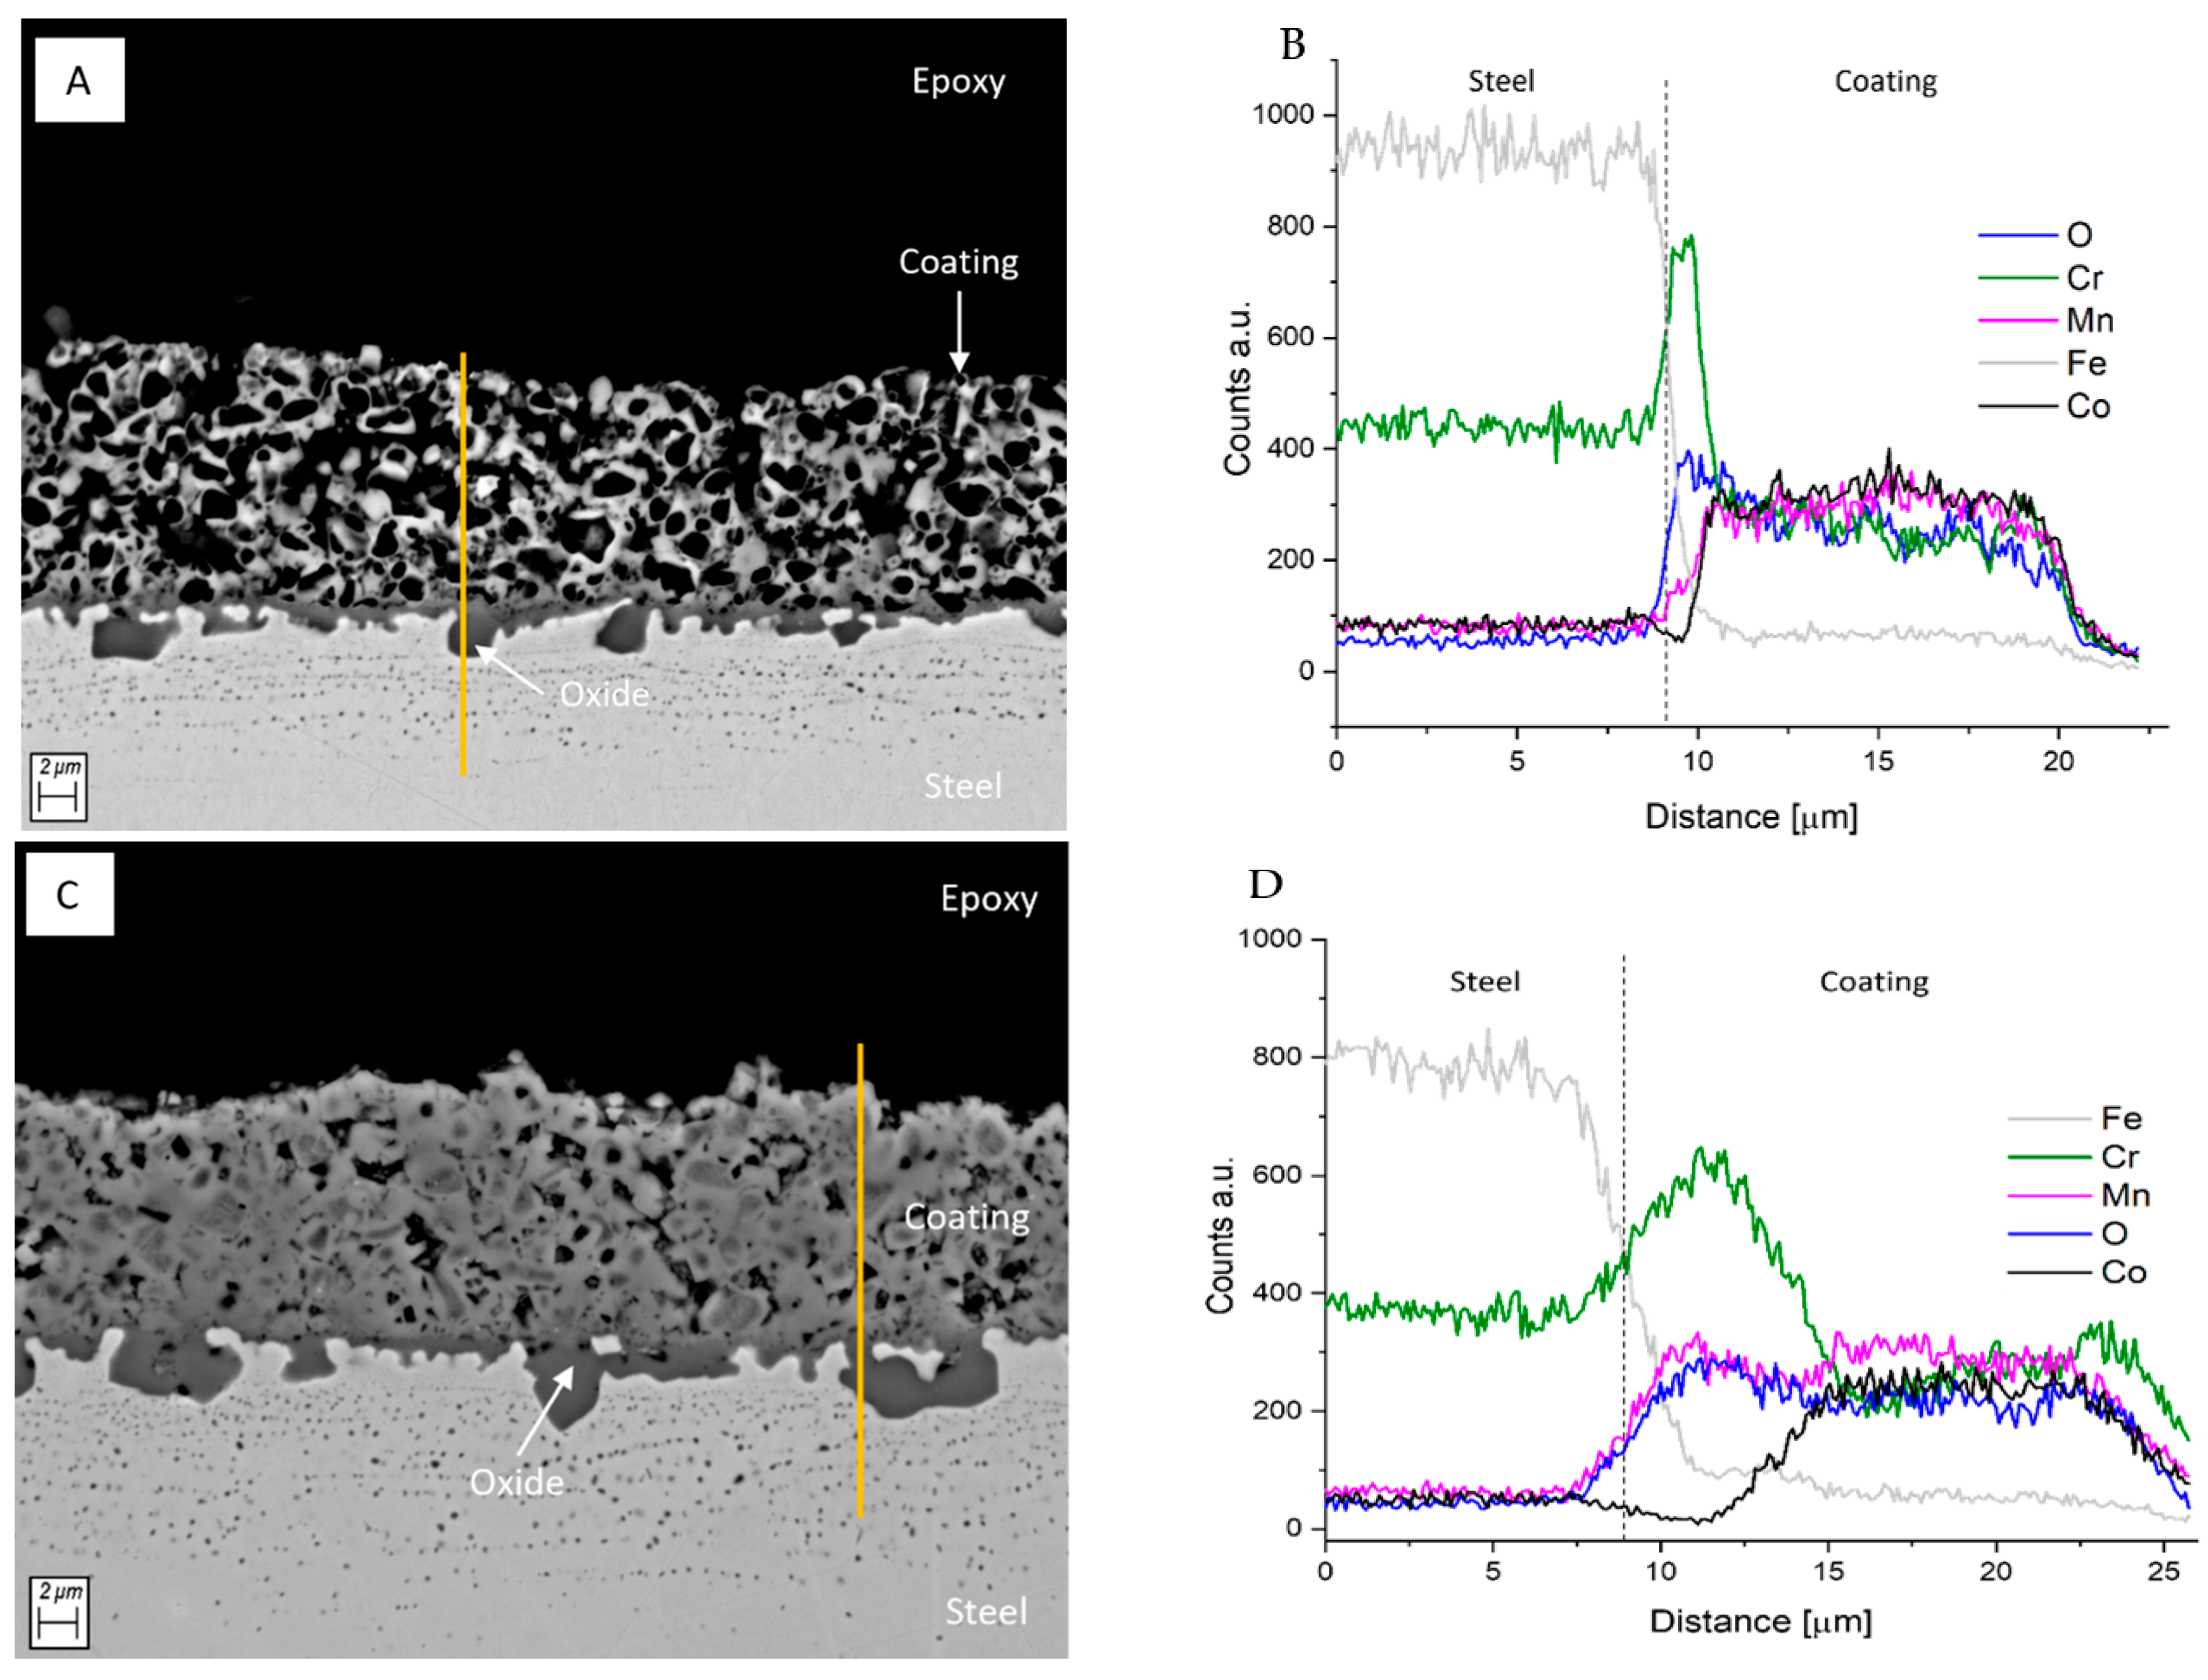
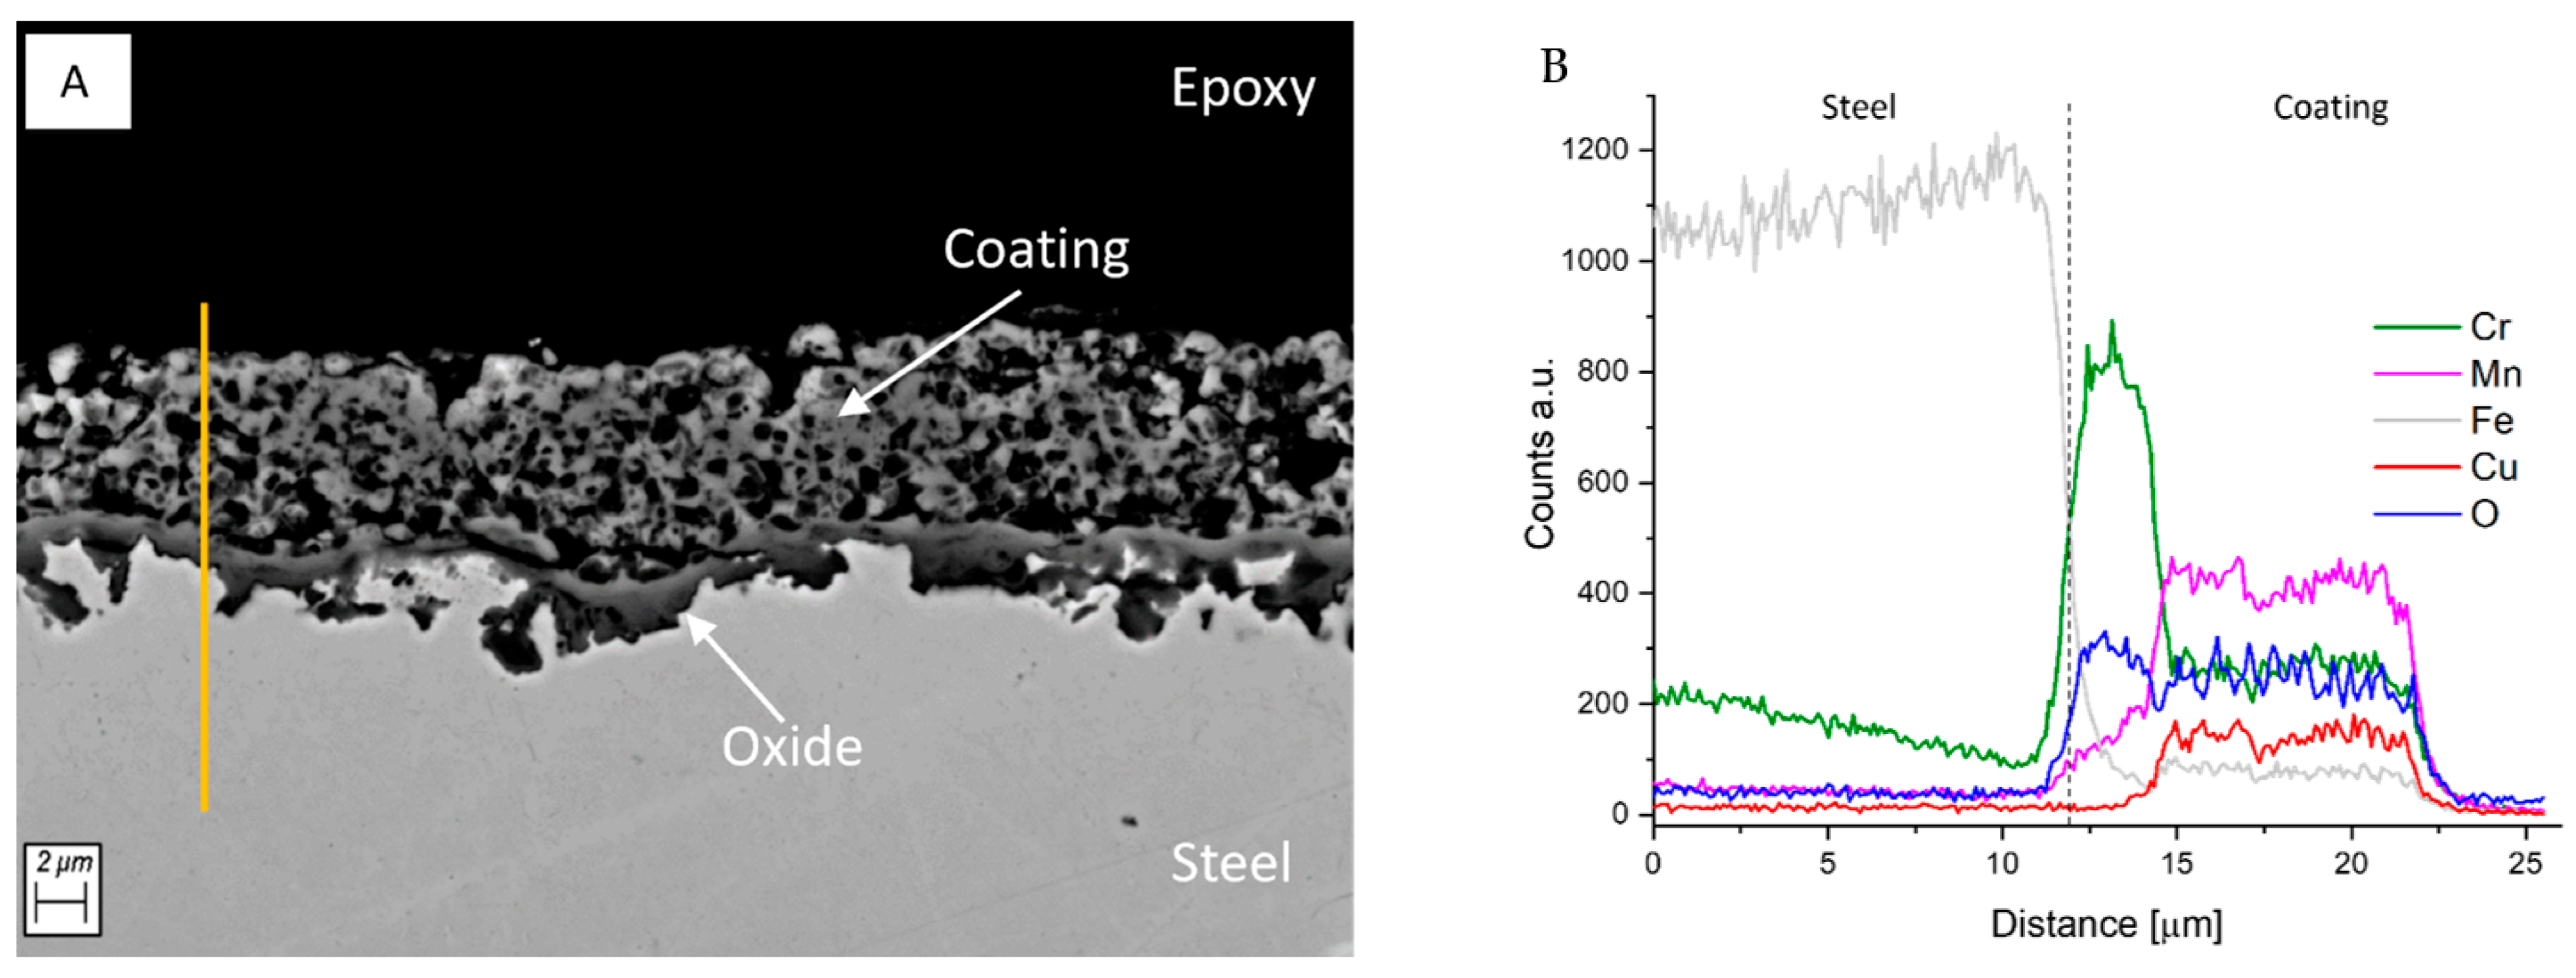
4.2. Post-Mortem Microstructural Characterisation

Durability tests were followed by a detailed comparison between the initial microstructure and observed changes by post-mortem analysis. Figure 4 shows the cross-section micrographs of the samples in the as-coated state. Both coatings were not well-bonded to the substrate and resulted as highly porous, since no sintering step has been carried out after their application and firing. Although even porous coatings may provide inhibition to oxidation and chromium evaporation to some extent [46], it has been widely studied how the coating density strongly influences the effectiveness in providing a protection to the substrate [47]. Therefore, the microstructural aspects of the studied coatings could be improved for their application in stacks by designing a sintering pre-treatment. A two-step procedure, consisting in a heat treatment in reducing atmosphere followed by reoxidation, has been demonstrated to be effective in the optimisation of spinel-based coatings [48,49,50]. The compositional contrast of the SEM-BSD pictures confirmed the presence of a single phase for CoMnO (Figure 4A), while a multiphasic composition was highlighted by brighter particles dispersed in the CuMnO layer (Figure 4B). Such variation could be due to the different manufacturing parameters used by the companies providing the respective coated samples. Moreover, the CuMnO top layer resulted already slightly densified and less porous compared to CoMnO.
Looking at degraded samples, CoMnO morphological and compositional evolution during aging was monitored, as reported in Figure 5. Figure 5A,C show that the densification of the coating layer occurred during aging. After 400 h, the coating resulted as well-sintered and adherent to the substrate (Figure 5C). There were small compositional variations but homogeneously distributed through the whole section of the layer. The line-scan measured after 200 h (Figure 5B) showed a sharp Cr peak related to the chromium oxide grown at the substrate/coating interface. The distribution of chromium detected through the whole coating section suggested its ineffectiveness in limiting the Cr diffusion due to the porosity characterizing the initial state and the high testing temperature which favoured its motion. The curves of Mn and Co confirmed the presence of these elements in comparable amounts into the coating. The line-scan measured after 400 h (Figure 5D) showed a broader Cr peak, suggesting the formation of a thicker Cr oxide layer and a higher diffusing amount within the coating compared to the previous sample. An additional peak in the chromium distribution was observed on the top of the layer, indicating the accumulation of this element at the coating/air interface due to its diffusion. By observing the SEM pictures (Figure 5) and the relative density values reported in Table 3, a significant densification during the exposure time was clearly seen, confirming its role in the decrease of the activation energy reported in Figure 3A for the CoMnO/Crofer22 APU sample.
The CuMnO/AISI 441 sample after 200 h of aging resulted denser and more homogeneous from the compositional point of view (Figure 6A). Additionally, a thick, thermally grown oxide was visible at the interface with the steel. After 400 h (Figure 6C), the coating reached a density of 74.5% without open porosity on its section (Table 3). The layer appeared well-adherent to the substrate and denser at the interface with it, however there were some additional phases in the top layer, similar to the as-coated sample. Although the increase of the coating density during aging may have led to a decrease in activation energy, the phase unmixing observed from the compositional contrast could explain its further increase after 400 h of operation. The EDXS line-scan (Figure 6D) showed a considerable Cu peak on the top of the coating, suggesting the formation of copper oxide that could be responsible for the increase of both electrical resistance (Figure 2) and activation energy (Figure 3B) [51]. The worsening of the electrical conductivity could also be attributed to the formation of cracks parallel to the surface of the samples, visible after 400 h of exposure (Figure 6C). The presence of a Cr peak near the steel surface in Figure 6B highlights the formation of a thicker Cr oxide scale compared to the CoMnO/Crofer22APU sample at the same aging time of 200 h (Figure 5B). Additionally, in this case, chromium diffused through the entire coating thickness, evidencing the detrimental effect of a high initial porosity on the chromium diffusion prevention. The compositional analysis performed on the sample aged for 400 h (Figure 6D) showed the formation of a Cr oxide scale comparable to that on CoMnO/Crofer22 APU, however the absence of a further peak at the top of the coating confirmed the coating effectiveness in blocking the chromium diffusion and accumulation because of its faster densification than CoMnO/Crofer22 APU during aging.
Comparing the thickness of the coatings on two samples, CuMnO/AISI 441 exhibited a thinner layer (8.47 μm) than CoMnO/Crofer22 APU (11.88 μm). This difference supports the highest ASR values measured for the latter case (Figure 2), even though its testing temperature was 1123 K, compared to 1023 K used for CuMnO/AISI 441. Moreover, in the literature, CuMnO was reported to exhibit a lower ASR than CoMnO at the same temperature [52,53].

5. Modelling of Global Cell Performance and Degradation

Electrolyte- and anode-supported cells were used as fuel cell reference configurations. Two analysed interconnects were tested at 1123 and 1023 K (CoMnO/Crofer22 APU and CuMnO/AISI441, respectively), which are the common operating temperatures for these designs. Indeed, when the electrolyte provides the system mechanical support, a higher temperature is required to have a good ionic conductivity within the ceramic and to reduce the ohmic resistance. Whereas in ASC, an acceptable cell performance is already reached at lower temperatures using the fuel electrode as the thickest layer. In both cases, adiabatic single co-flow square cells were simulated: ESC with an active area equal to 127 cm2 (12 × 12 mesh), whereas ASC with an 80 cm2 surface (10 × 10 mesh). Table 4 reports reference anodic and cathodic feed compositions for modelling, considering an H2-rich mixture as well as a biogas as fuel for direct internal reforming cell configuration. These conditions were carefully imposed in order to simulate cell safety operation without any possible stresses, focusing only on the role of interconnect degradation under an oxidant environment on cell ohmic resistance through the degradation functions expressed in Equation (5). Here, the fuel utilisation was always lower than 30%, avoiding hydrogen starvation on the cell plane; moreover, the steam to carbon ratio was imposed higher than 2 so that carbon deposition should not occur [54].

5.1. CoMnO/Crofer22 APU Interconnect-Based ESC Performance

Firstly, ESC performance was evaluated in a virgin cell with CoMnO/Crofer22 APU as interconnect, assuming to work in an adiabatic system and feeding H2-rich anodic mixture and dry air as the oxidant at a 1123 K inlet temperature. As Figure 7 shows, the cell voltage varied from about 1.05 V at open circuit voltage to values lower than 0.7 V because of the rapid increase of the ohmic contribution at load rise (Equations (4) and (5)), also representing the main overpotential in the ESC case. Note that the weight of ohmic term on global polarisation losses changed from 80% at 0.1 A cm−2 to 90% at 1.2 A cm−2. In this framework, the interconnect fixed at the cathodic side had a minor contribution (~3% of cell total ohmic resistance). However, its role was not much more negligible looking at cell behaviour with aged interconnects, as discussed below.
Considering the experimental observations on CoMnO/Crofer22 APU, ESC voltage variation was simulated through SIMFC under different loads. Evaluated performance worsening was expressed through the Degradation Rate (DR), which is a common index to represent the voltage change during the observed operation period expressed in hours, t, since the cell usually works in constant galvanostatic conditions [55]. DR is computed as the percentage variation between the measured voltage, Vt, and the initial value, V0, normalised to the starting point. Commonly, 1000 h is assumed as the reference time step (Equation (6)).
D R = ( V t V 0 V 0 ) 1000 t   100 %
Note that, according to this definition, the performance worsening follows a linear dependence on the considered timeframe. Here, DR was computed referring to the total test duration as well as along the cell life at different electric loads in order to underline the time intervals characterised by higher changes. Looking at testing ASR profiles (Figure 2), 60 h resulted as suitable as a simulation step to underline the main variations within the voltage profile. Moreover, measurements after 300 h were not considered since the detected decrease was due to a blackout. As shown in Figure 8, similar trends were evaluated at all considered current density values. In the first 60 h, the system stabilisation occurred, obtaining the lowest ohmic resistances (halved values with respect to initial ones), so no degradation was reported here. Then, a voltage reduction was visible, reaching the maximum DR within 120–180 h due to the interconnect ASR increase of 15%. A quite stable operation period followed, with a more gradual variation in the last working hours. For all time intervals, faster DRs characterise higher loads; indeed, the maximum obtained value was −0.7 V% kh−1 at 1.2 A cm−2. Whereas the global degradation rate between 60 and 300 h of operation moved from −0.17 V% kh−1 at 0.4 A cm−2 to −0.25 V% kh−1 at 1.2 A cm−2, confirming this trend. Considering computed DRs for common operation points at low loads, detected values are quite low with respect to the reference DR value, around −0.5 V% kh−1, for an ESC stack tested for 20,000 h [56], despite the observed Cr presence on the top of the coating due to its poor initial density (Figure 5D). This suggests that the degradation of other layers or their combined effects should have the main weight in this configuration.

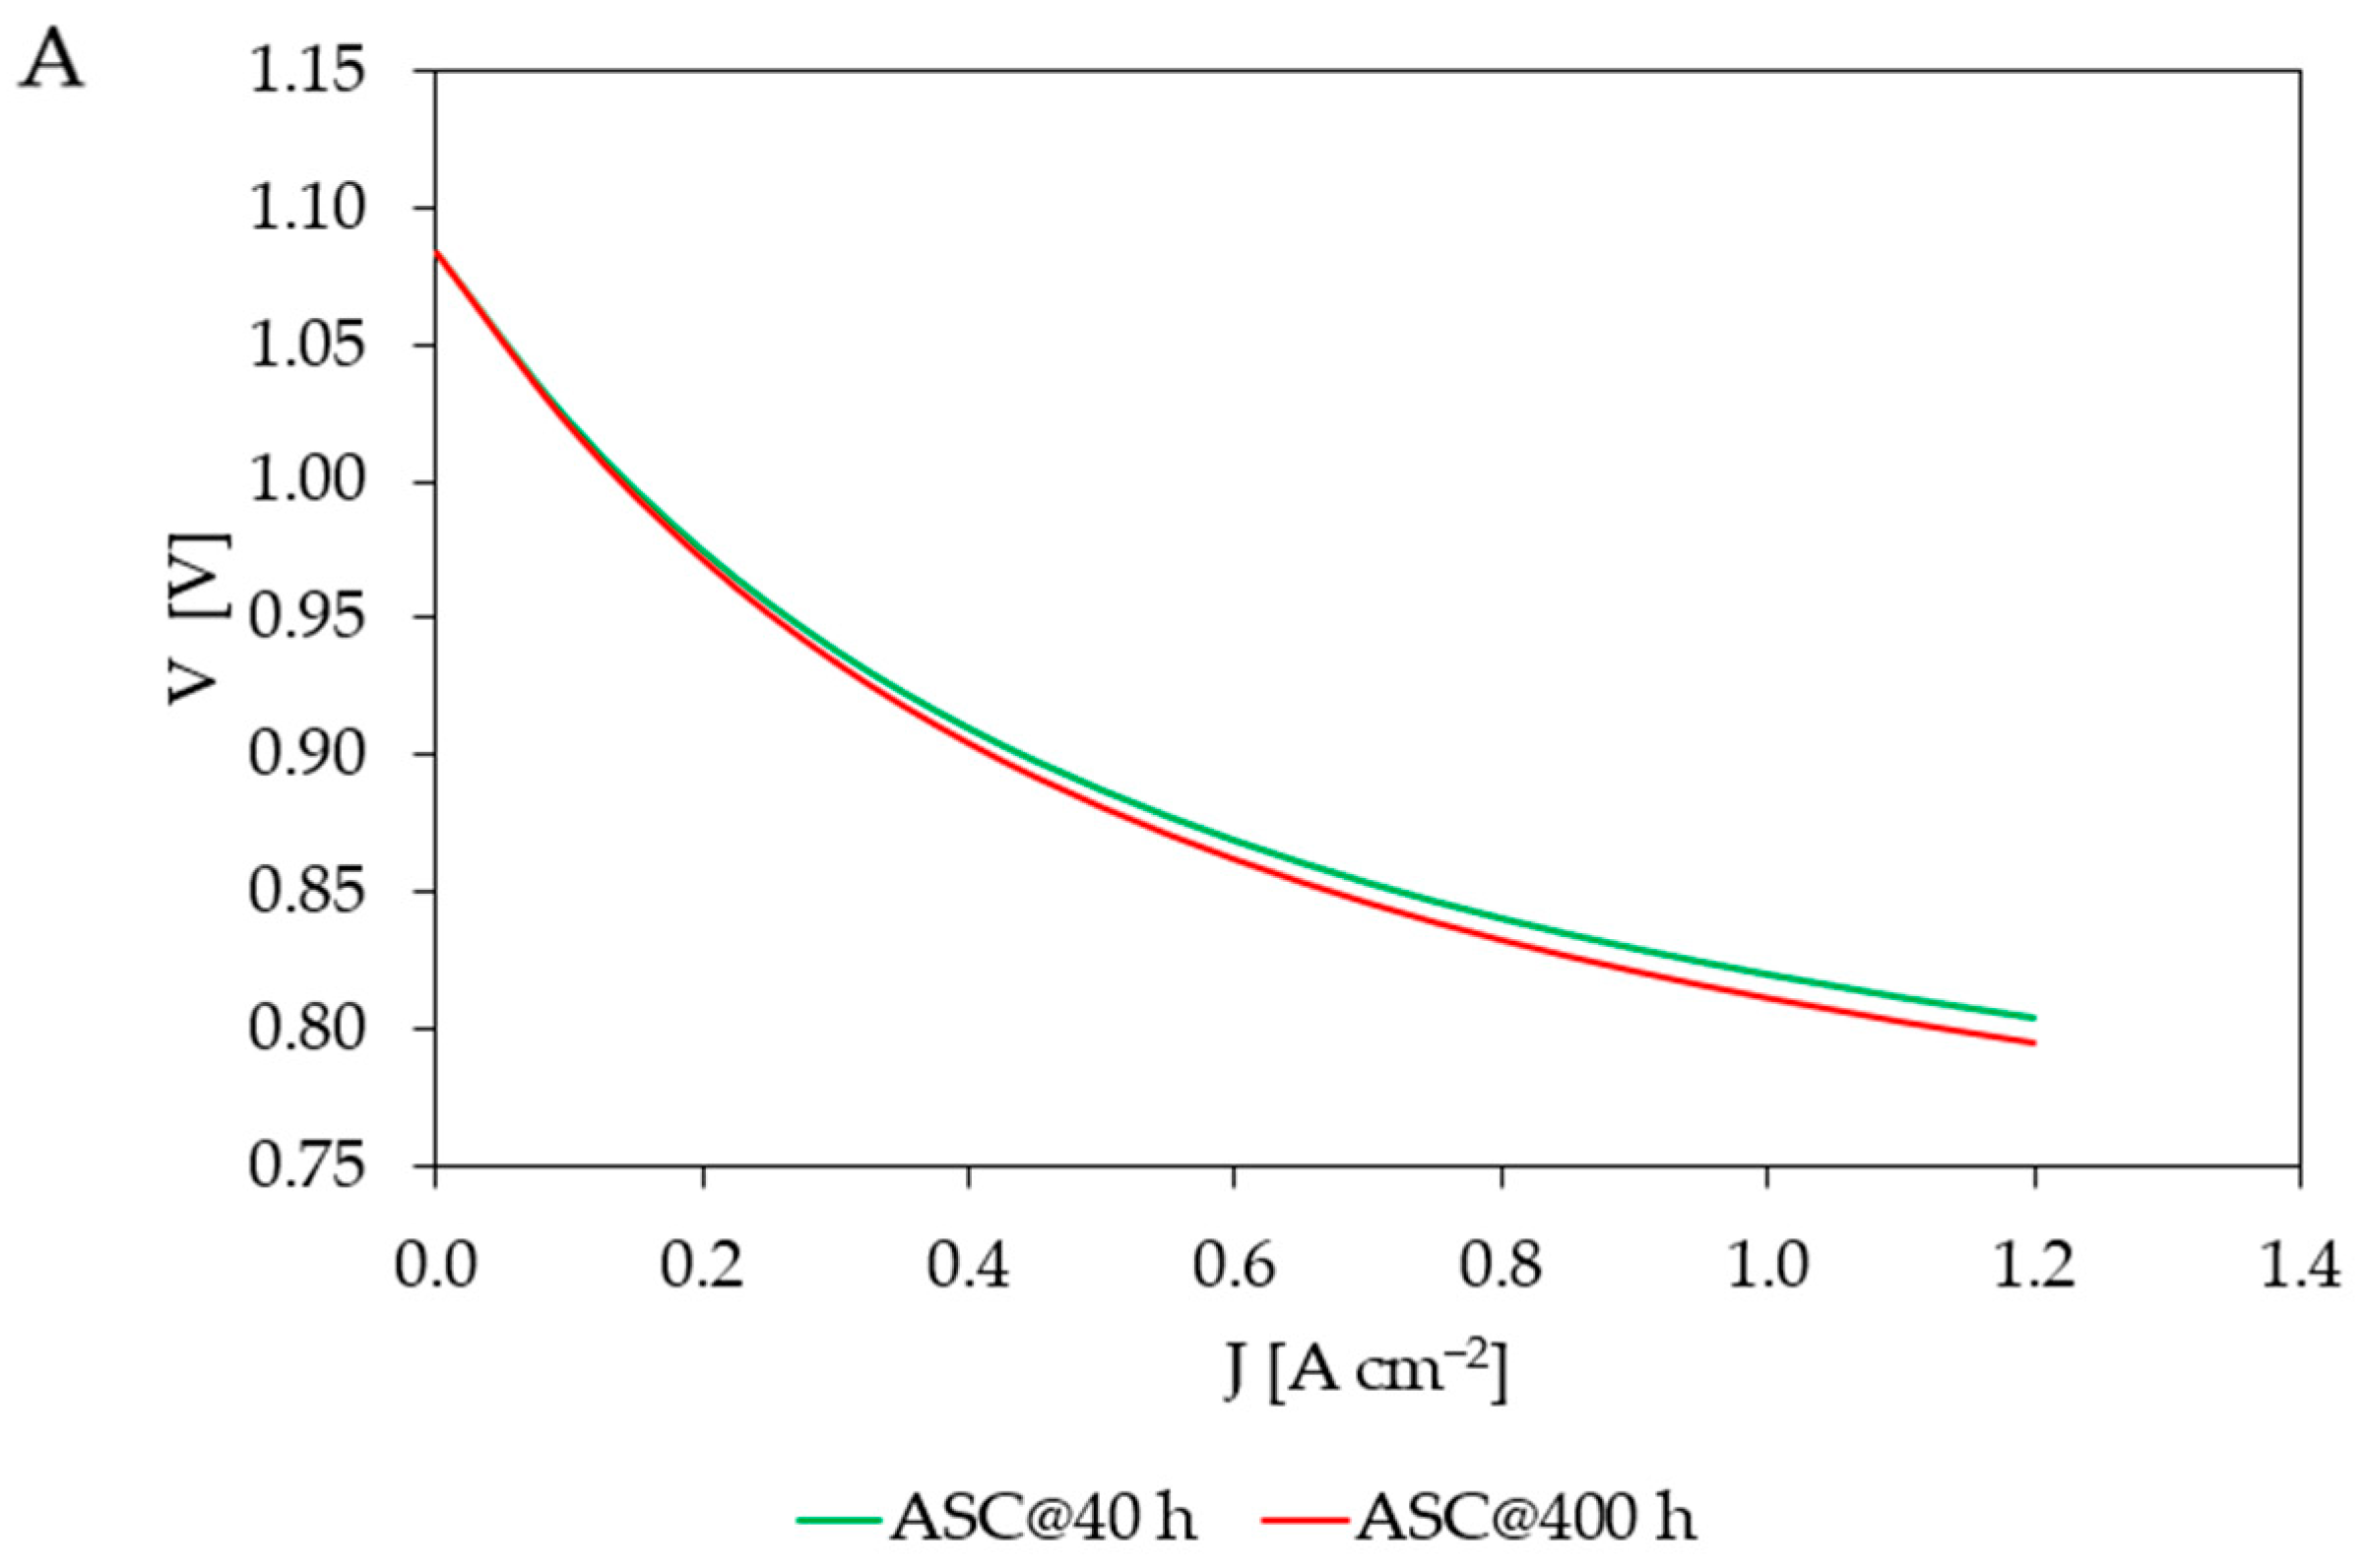
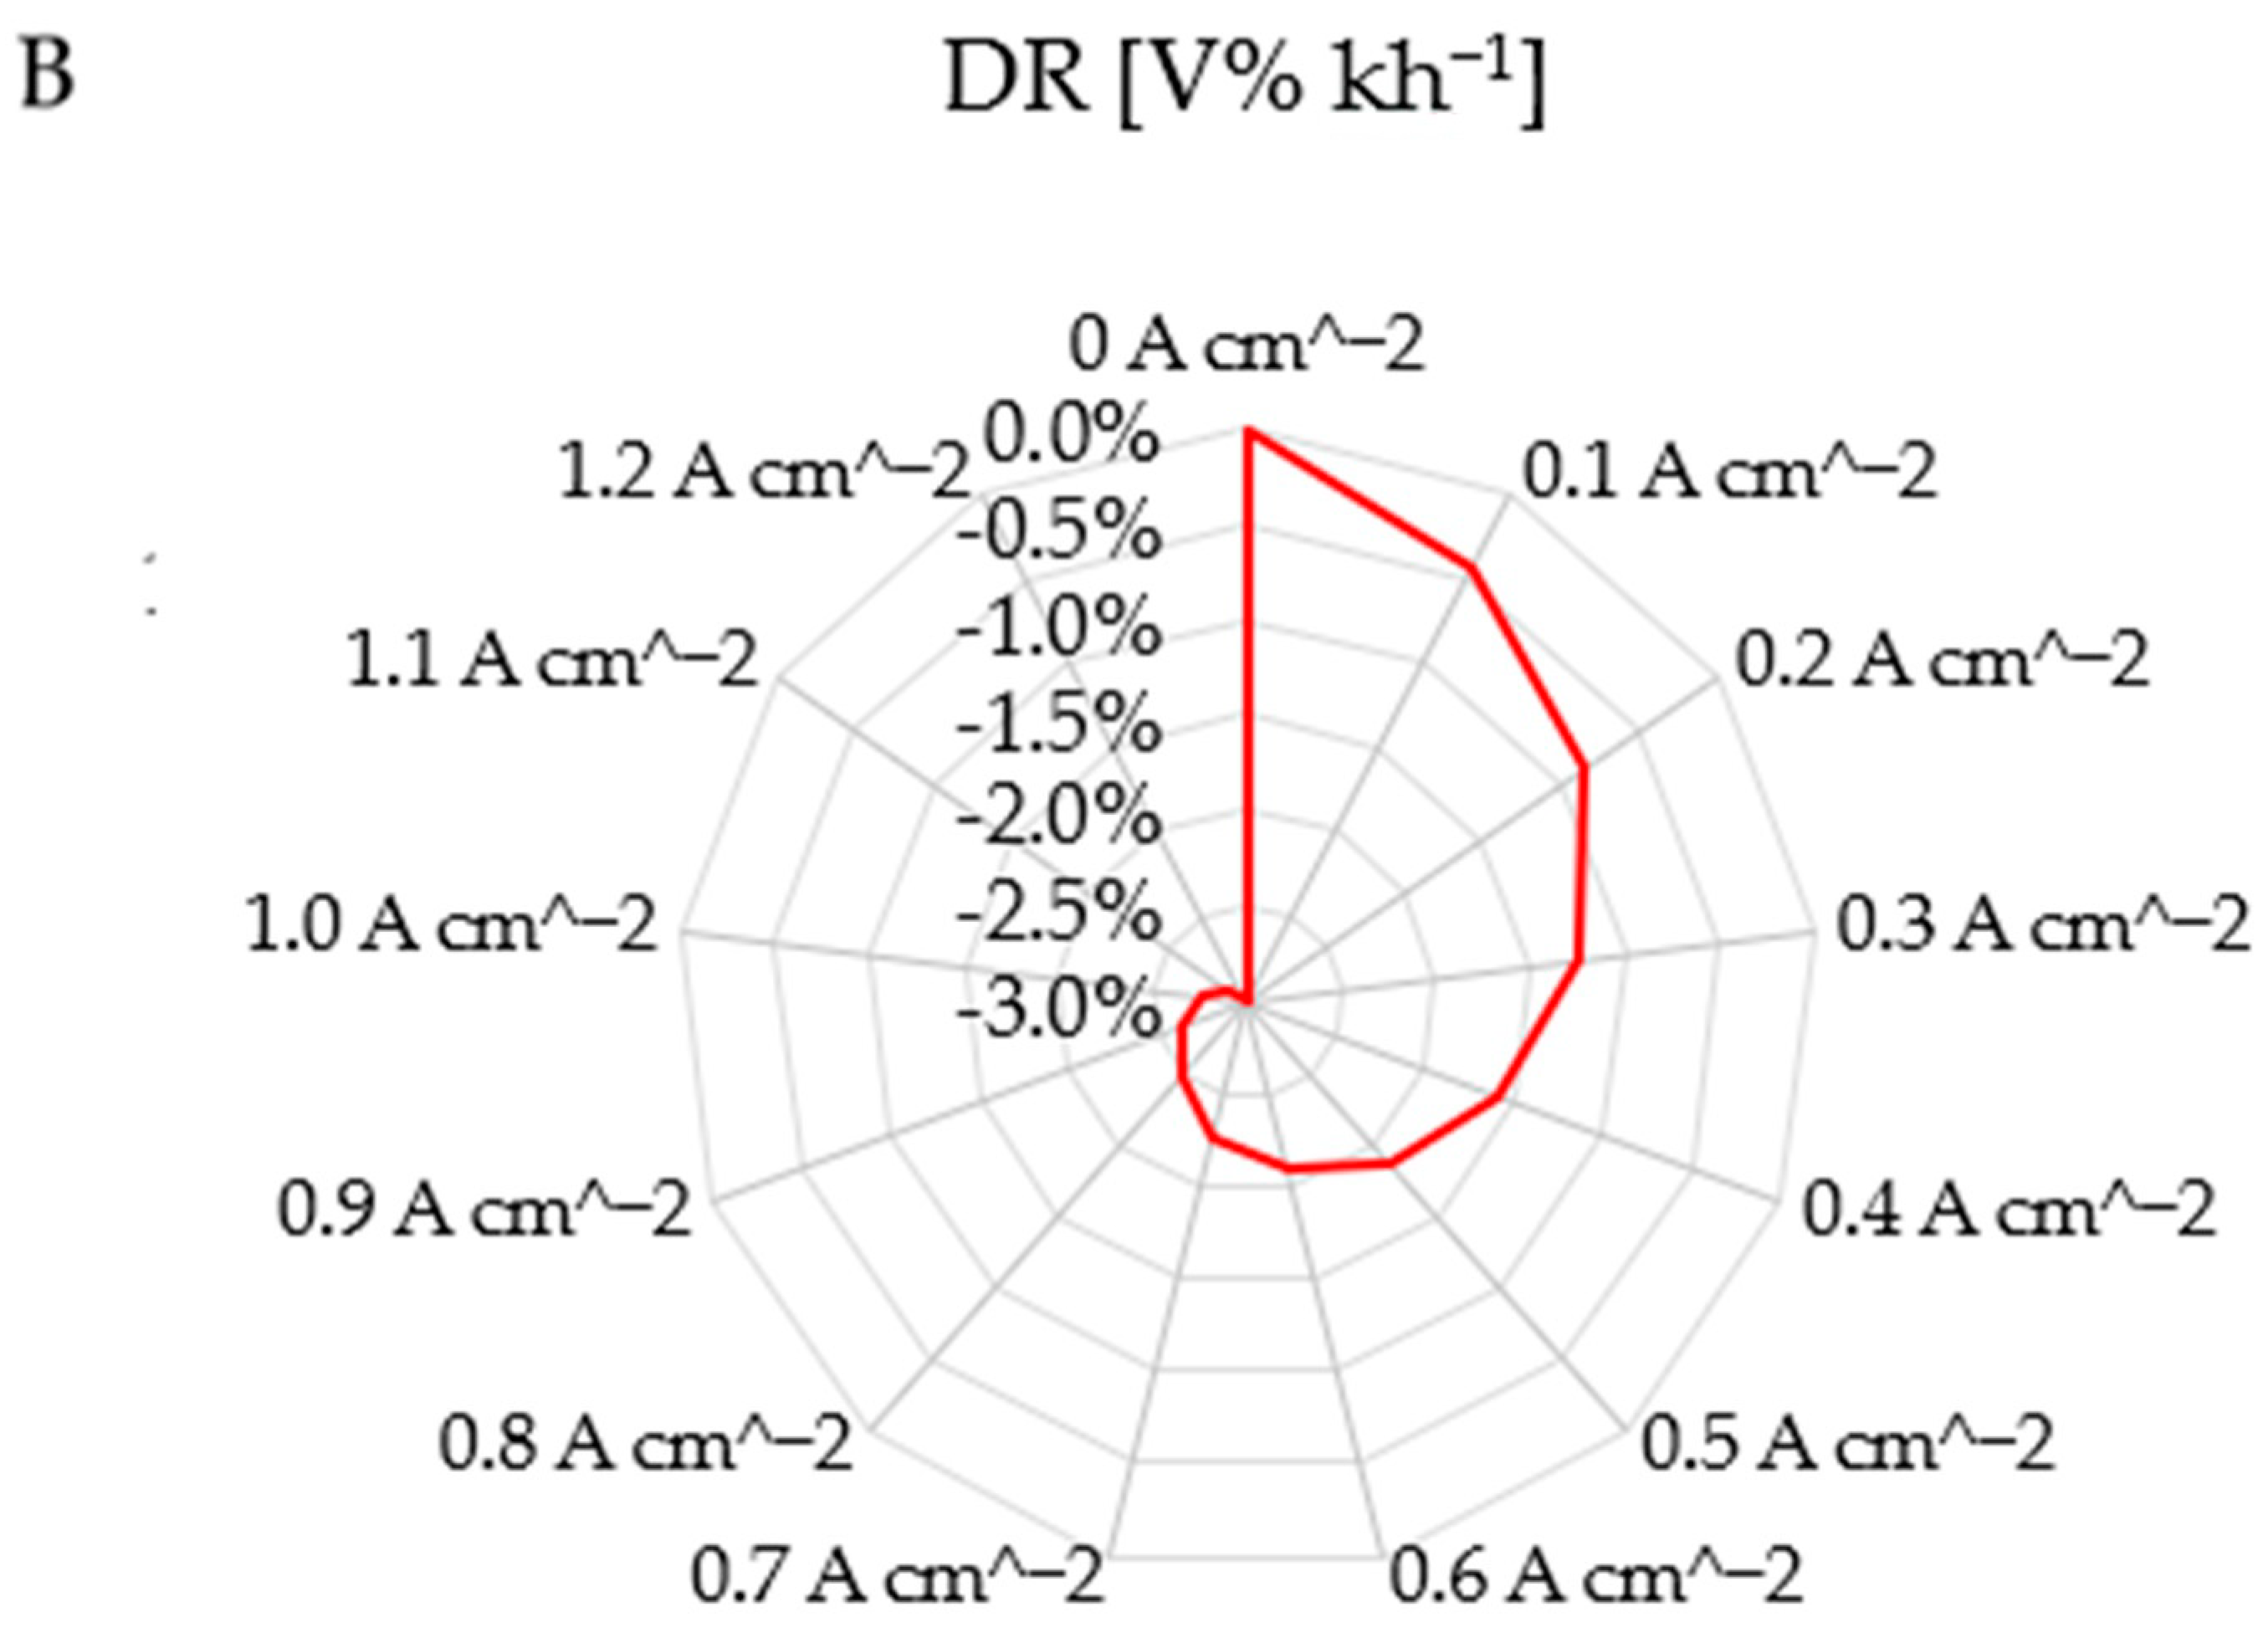
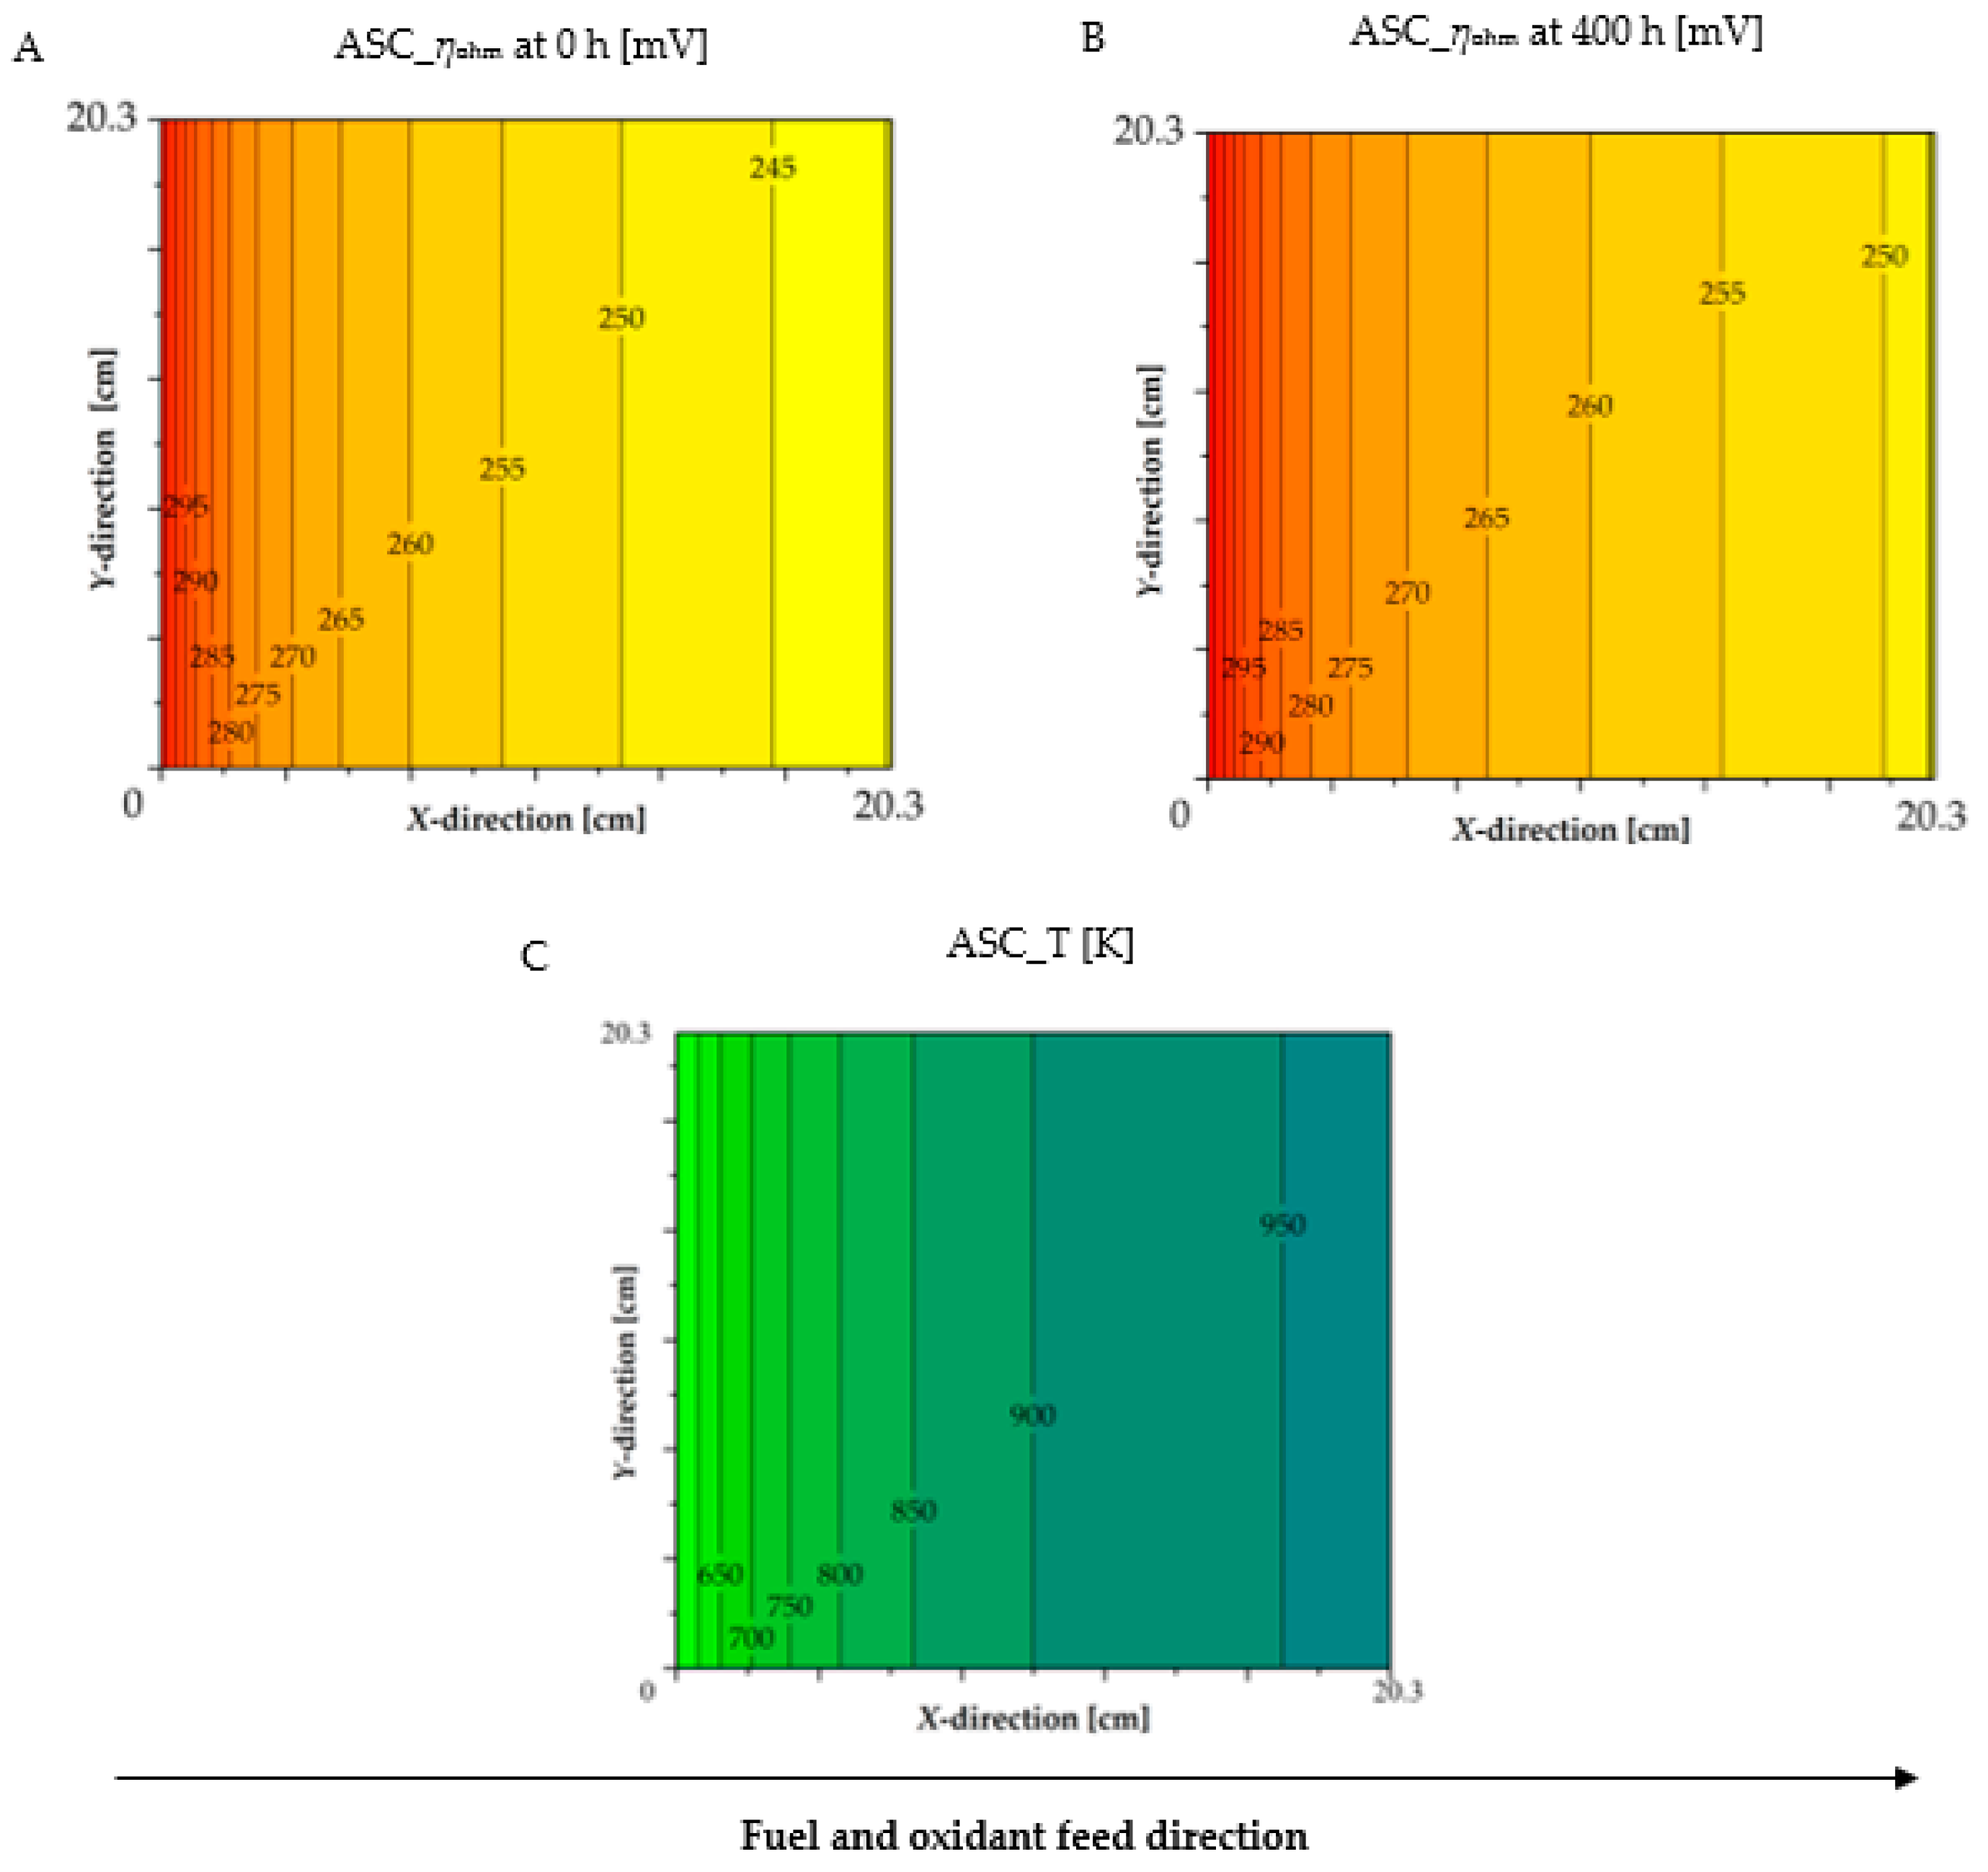
5.2. CuMnO/AISI 441 Interconnect-Based ASC Performance

Similar to the previous case, ASC with a CuMnO/AISI 441-based interconnect was modelled as an adiabatic system, working with an H2-rich mixture as fuel and dry air as the oxidant (Table 4), only reducing the inlet temperature at 1023 K, which characterizes this cell operation. Compared to virgin ESC performance, higher obtained initial voltages depended on mainly a lower ohmic overpotential due to different thicknesses of electrolytes. For instance, at the common working point of 0.4 A cm−2, ηohm moved from >80% of total losses in ESC to only 39% in ASC; indeed, the activation contribution had the main weight in the ASC design, overcoming 57%. As underlined before, simulated working conditions avoided starvation by imposing a low fuel utilisation so that the diffusion overpotential was quite negligible.
Knowing the interconnect ASR measured during the 400 h lasting durability test, the simulated SOFC voltage profile is shown in Figure 9, assuming a galvanostatic operation under 0.4 A cm−2: all changes were again completely due to the cathodic site interconnect, since no degradation function for electrodes and electrolytes was introduced into SIMFC. Initially, the interconnect loss consisted in 15% of ASC ohmic resistance (higher weight than the ESC case), which reduced by the first 50 h in view of contact improvement. Then, a gradual, quite constant voltage decrease occurred, except for a visible fluctuation at around 250 h. Total DR resulted equal to −0.35 V% kh−1, which is quite high considering that the degradation was only due to the interconnect and comparing it with the reference long operating cell value of −0.5 V% kh−1 (lab scale tests performed feeding dry hydrogen and air at 1023 K for 9000 h [7]). Note also that the state-of-the-art cells do not overcome −0.25 V% kh−1 [57]. However, it is noteworthy that the interconnect degradation is usually more pronounced in the first operation period and then stabilises in view of an asymptotic growth of the oxide layer [43]. Moreover, in tested conditions, the coating had significant microstructural variations due to its initial high porosity, which showed a weak protection to Cr migration.
Looking directly at IV characteristic profiles at times equal to 40 and 400 h (the best and the worst identified cell performance in order to again neglect the initial stabilisation period), the voltage variation consisted of some millivolts (Figure 10A), and this difference increased at high current densities, as observed in the ESC case, too. For instance, in ASC, the variation doubled from 0.4 to 1.2 A cm−2, where ηohm also overcame 45%. The consequent DRs are shown in Figure 10B, which highlights a major degradation under high electric loads, characterised by −3 V% kh−1 at most.
Focusing now on commercial kW scale fuel cells with 414 cm2 as the active area (21 × 21 mesh) and assuming to feed a biogas as fuel (Table 4), the local simulation showed a more significant degradation due to a higher temperature gradient on the cell plane coexisting endothermic reforming and exothermic electrochemical reactions. The increase of interconnect resistance became relevant, above all cooling down the sample according to experimental observations (Figure 3). For instance, at a working point of 1023 K, the CuMnO/AISI 441 interconnect ASR differed by only some microohms when comparing measurements at 0 and 400 h, whereas it increased from 62 to 106 mΩ cm2 at 873 K. This variation had a relevant influence on the performance of an adiabatic direct internal reforming cell in view of lower temperatures reached. Assuming again a galvanostatic operation at 0.4 A cm−2 and a 1023 K inlet temperature, the simulated voltages were 0.554 and 0.547 V at 0 and 400 h, respectively. This resulted in a global DR equal to −3.1 V% kh−1 (comparable value to DR of H2-direct feeding cell at higher load), with an average cell working temperature of 865 K. Here, it was ~9 times higher with respect to the previously discussed case. In view of this remarkable DR, the local analysis allowed for a better understanding of the occurring phenomena. Figure 11A,B show ohmic overpotential maps at 0 and 400 h of operation as consequences of the temperature gradient on the cell plane (Figure 11C). In both, the ohmic loss decreased, moving from the inlet to the outlet section due to higher temperatures (i.e., high conductivity). Indeed, the endothermic processes characterised the initial section, causing a significant temperature drop within 5–6 cm, whereas the effects due to the exothermic electrochemical reaction prevailed in the following zone, causing the highest reached temperature in the final section. However, the cell had a global endothermic behaviour assuming an adiabatic operation. A difference of ~50 mV was detected between the inlet and outlet section in terms of ohmic overpotential (a slightly smaller gradient after 400 h of operation as a consequence of a lower Ea value of aging interconnect, as previously discussed).

6. Conclusions

Lifetime increase is one of the main challenging tasks to be reached before a large-scale commercialisation of SOFC technology. A key point consists in identifying degradation mechanisms of the most critical layers and their effects on cell global performance. In this framework, as a case study, the work proposed the pair of ex situ durability tests on two coated interconnects, CoMnO/Crofer22 APU and CuMnO/AISI 441, tested under air at 1123 and 1023 K, respectively, and SOFC local modelling. According to experimental observations, after an initial stabilisation period, both samples showed an ASR increase during the experiment, mainly due to the predominant contribution of Cr oxide growth at the coating–substrate interface in competition with the coating densification. Moreover, Cr was detected within the coating layers due to the initial high porosity, which favoured its diffusion. Cr also accumulated at the top of the CoMnO/Crofer22 APU sample, revealing its poor protection to prevent cathode poisoning, whereas CuMnO/AISI 441 did not present this issue due to a faster densification during the aging. However, in both configurations, a sintering pre-treatment could be useful to improve the performance by reducing Cr migration in case of the whole stack assembly. On the other hand, CuMnO/AISI 441 was characterised by a larger ASR variation (15 mΩ cm−2 compared to 5 mΩ cm−2 in CoMnO/Crofer22 APU, neglecting the initial stabilisation step) because of the deposition of copper oxide on the coating top layer as well as the formation of cracks parallel to the sample surface. To highlight the effects on SOFC behaviour, specific semi-empirical degradation functions were derived, allowing for the modelling of aged CoMnO/Crofer22 APU interconnect-based ESC and CuMnO/AISI 441 interconnect-based ASC. According to local analysis, the influence of interconnect ASR reduction increased by raising the applied current density in view of the major weight of ohmic overpotential. Under galvanostatic operation and an H2-rich mixture as fuel, in case of CoMnO/Crofer22 APU-based ESC, the total DR was equal to −0.17 V% kh−1, which was lower than the −0.35 V% kh−1 detected for CuMnO/AISI 441-based ASC. More detrimental effects were obtained considering the biogas direct internal reforming ASC case, where the temperature drop characterizing the inlet section caused a voltage reduction of ~8 mV after only 400 h of operation. This resulted in a DR of −3 V% kh−1. The proposed approach, limited here to the study of the cathodic side aged interconnect influence on the system ohmic resistance, could be applied to underline the effects of other degradation phenomena penalising catalytic activity and material transport. Again, experimental observations on single-cell layers or more sections would be paired to global performance modelling through the introduction of specific degradation functions in order to identify each mechanism’s weight.

Author Contributions

Conceptualisation, F.R.B. and R.S.; formal analysis, D.P., R.S. and P.P.; investigation, D.P., R.S. and P.P.; methodology, F.R.B. and B.B.; writing—original draft, F.R.B., R.S. and D.P.; writing—review and editing, F.R.B., R.S., P.P. and B.B. All authors have read and agreed to the published version of the manuscript.

Funding

This research was funded by European Horizon 2020—Research and Innovation Framework program (H2020-JTI-FCH-2018-1), under grant agreement No. 825027 (AD ASTRA project).

Acknowledgments

The authors acknowledge SolidPower and SunFire for providing tested samples and support during work development.

Conflicts of Interest

The authors declare no conflict of interest.

Nomenclature

A, BKinetics orders [-]
ASRArea-Specific Resistance [Ω m−2]
DRDegradation Rate [V% kh−1]
EOpen circuit voltage [V]
E0Reversible voltage [V]
EaActivation energy [J mol−1]
FFaraday constant [C mol−1]
GGibbs free energy [J mol−1]
JCurrent density [A m−2]
JlimLimiting current density [A m−2]
KeqEquilibrium constant [variable]
pPressure [atm]
RIdeal gas constant [J mol−1 K−1]
TTemperature [K]
VCell voltage under load [V]
X, YSpatial directions along cell side [m]
yMolar fraction [-]
zCharge number [-]
Greek letters
γKinetic coefficient [variable]
ηOverpotential [V]
θAir electrode diffusion coefficient combination [-]
σConductivity [S m−1]
Abbreviations and Subscritps
actactivation
airair electrode (cathode)
diffdiffusion
fuelfuel electrode (anode)
intinterconnect
ohmohmic
SRSteam Reforming
WGSWater Gas Shift

References

  1. Al-Khori, K.; Bicer, Y.; Boulfrad, S.; Koç, M. Techno-economic and environmental assessment of integrating SOFC with a conventional steam and power system in a natural gas processing plant. Int. J. Hydrogen Energy 2019, 44, 29604–29617. [Google Scholar] [CrossRef]
  2. Hauch, A.; Küngas, R.; Blennow, P.; Hansen, A.B.; Mathiesen, B.V.; Mogensen, M.B. Recent advances in solid oxide cell technology for electrolysis. Science 2020, 370, eaba6118. [Google Scholar] [CrossRef] [PubMed]
  3. Bianchi, F.R.; Baldinelli, A.; Barelli, L.; Cinti, G.; Audasso, E.; Bosio, B. Multiscale Modeling for Reversible Solid Oxide Cell Operation. Energies 2020, 13, 5058. [Google Scholar] [CrossRef]
  4. Bianchi, F.R.; Bosio, B. Operating Principles, Performance and Technology Readiness Level of Reversible Solid Oxide Cells. Sustainability 2021, 13, 4777. [Google Scholar] [CrossRef]
  5. Rispoli, N.; Vitale, F.; Califano, F.; Polverino, P.; Rosen, M.; Sorrentino, M. Constrained optimal design of a reversible solid oxide cell-based multiple load renewable microgrid. J. Energy Storage 2020, 31, 101570. [Google Scholar] [CrossRef]
  6. Mekhilef, S.; Saidur, R.; Safari, A. Comparative study of different fuel cell technologies. Renew. Sustain. Energy Rev. 2012, 16, 981–989. [Google Scholar] [CrossRef]
  7. Stoynov, Z.; Vladikova, D.; Burdin, B.; Laurencin, J.; Montinaro, D.; Raikova, G.; Schiller, G.; Szabo, P. Differential analysis of SOFC current-voltage characteristics. Appl. Energy 2018, 228, 1584–1590. [Google Scholar] [CrossRef]
  8. Ruf, Y.; Kaufmann, M.; Lange, S.; Pfister, J.; Heieck, F.; Endres, A. Fuel Cells and Hydrogen Applications for Regions and Cities Vol 1. Consolidated Technology Introduction Dossiers. Available online: http://www.fch.europa.eu/page/presentations-2 (accessed on 29 December 2021).
  9. Venkataraman, V.; Pérez-Fortes, M.; Wang, L.; Hajimolana, Y.S.; Boigues-Muñoz, C.; Agostini, A.; McPhail, S.J.; Maréchal, F.; Van Herle, J.; Aravind, P. Reversible solid oxide systems for energy and chemical applications—Review & perspectives. J. Energy Storage 2019, 24, 100782. [Google Scholar] [CrossRef] [Green Version]
  10. Schmidt, O.; Gambhir, A.; Staffell, I.; Hawkes, A.; Nelson, J.; Few, S. Future cost and performance of water electrolysis: An expert elicitation study. Int. J. Hydrogen Energy 2017, 42, 30470–30492. [Google Scholar] [CrossRef]
  11. Khan, M.Z.; Mehran, M.T.; Song, R.-H.; Lee, J.-W.; Lee, S.-B.; Lim, T.-H. A simplified approach to predict performance degradation of a solid oxide fuel cell anode. J. Power Sources 2018, 391, 94–105. [Google Scholar] [CrossRef]
  12. Menzler, N.H.; Sebold, D.; Sohn, Y.J.; Zischke, S. Post-test characterization of a solid oxide fuel cell after more than 10 years of stack testing. J. Power Sources 2020, 478, 228770. [Google Scholar] [CrossRef]
  13. Mogensen, M.B.; Hauch, A.; Sun, X.; Chen, M.; Tao, Y.; Ebbesen, S.D.; Hansen, K.V.; Hendriksen, P.V. Relation Between Ni Particle Shape Change and Ni Migration in Ni-YSZ Electrodes—A Hypothesis. Fuel Cells 2017, 17, 434–441. [Google Scholar] [CrossRef]
  14. Aguiar, P.; Adjiman, C.S.; Brandon, N.P. Anode-supported intermediate temperature direct internal reforming solid oxide fuel cell. I: Model-based steady-state performance. J. Power Sources 2004, 138, 120–136. [Google Scholar] [CrossRef]
  15. Lee, H.S.; Lee, H.M.; Park, J.-Y.; Lim, H.-T. Degradation behavior of Ni-YSZ anode-supported solid oxide fuel cell (SOFC) as a function of H2S concentration. Int. J. Hydrogen Energy 2018, 43, 22511–22518. [Google Scholar] [CrossRef]
  16. Hubert, M.; Laurencin, J.; Cloetens, P.; Mougin, J.; Sanchez, D.F.; Pylypko, S.; Morales, M.; Morata, A.; Morel, B.; Montinaro, D.; et al. Solid Oxide Cell Degradation Operated in Fuel Cell and Electrolysis Modes: A Comparative Study on Ni Agglomeration and LSCF Destabilization. ECS Trans. 2017, 78, 3167–3177. [Google Scholar] [CrossRef]
  17. Bongiorno, V.; Spotorno, R.; Paravidino, D.; Piccardo, P. On the High-Temperature Oxidation and Area Specific Resistance of New Commercial Ferritic Stainless Steels. Metals 2021, 11, 405. [Google Scholar] [CrossRef]
  18. Spotorno, R. High-Temperature Oxidation of AISI441 Ferritic Stainless Steel for Solid Oxide Fuel Cells. Mater. Sci. Forum 2021, 1016, 1381–1385. [Google Scholar] [CrossRef]
  19. Fontana, S.; Amendola, R.; Chevalier, S.; Piccardo, P.; Caboche, G.; Viviani, M.; Molins, R.; Sennour, M. Metallic interconnects for SOFC: Characterisation of corrosion resistance and conductivity evaluation at operating temperature of differently coated alloys. J. Power Sources 2007, 171, 652–662. [Google Scholar] [CrossRef]
  20. Spotorno, R.; Paravidino, D.; Delsante, S.; Piccardo, P. Volatilization of chromium from AISI 441 stainless steel: Time and temperature dependence. Surf. Coat. Technol. 2022, 433, 128125. [Google Scholar] [CrossRef]
  21. Paravidino, D.; Piccardo, P.; Spotorno, R. A Novel Method for Evaluation of Chromium Evaporation from Solid Oxide Fuel Cells Interconnects: A Feasibility Study. Mater. Sci. Forum 2021, 1016, 1109–1113. [Google Scholar] [CrossRef]
  22. Kornely, M.; Neumann, A.; Menzler, N.H.; Leonide, A.; Weber, A.; Ivers-Tiffée, E. Degradation of anode supported cell (ASC) performance by Cr-poisoning. J. Power Sources 2011, 196, 7203–7208. [Google Scholar] [CrossRef]
  23. Spotorno, R.; Piccardo, P.; Perrozzi, F.; Valente, S.; Viviani, M.; Ansar, A. Microstructural and Electrical Characterization of Plasma Sprayed Cu-Mn Oxide Spinels as Coating on Metallic Interconnects for Stacking Solid Oxide Fuel Cells. Fuel Cells 2015, 15, 728–734. [Google Scholar] [CrossRef]
  24. Liu, Y.; Fergus, J.W.; Cruz, C.D. Electrical Properties, Cation Distributions, and Thermal Expansion of Manganese Cobalt Chromite Spinel Oxides. J. Am. Ceram. Soc. 2013, 96, 1841–1846. [Google Scholar] [CrossRef]
  25. Wu, X.; Ye, Q. Fault diagnosis and prognostic of solid oxide fuel cells. J. Power Sources 2016, 321, 47–56. [Google Scholar] [CrossRef]
  26. Guida, M.; Postiglione, F.; Pulcini, G. A random-effects model for long-term degradation analysis of solid oxide fuel cells. Reliab. Eng. Syst. Saf. 2015, 140, 88–98. [Google Scholar] [CrossRef]
  27. Gallo, M.; Costabile, C.; Sorrentino, M.; Polverino, P.; Pianese, C. Development and application of a comprehensive model-based methodology for fault mitigation of fuel cell powered systems. Appl. Energy 2020, 279, 115698. [Google Scholar] [CrossRef]
  28. Staffolani, A.; Baldinelli, A.; Barelli, L.; Bidini, G.; Nobili, F. Early-Stage Detection of Solid Oxide Cells Anode Degradation by Operando Impedance Analysis. Processes 2021, 9, 848. [Google Scholar] [CrossRef]
  29. WZhu, W.; Deevi, S. Opportunity of metallic interconnects for solid oxide fuel cells: A status on contact resistance. Mater. Res. Bull. 2003, 38, 957–972. [Google Scholar] [CrossRef]
  30. Talic, B.; Molin, S.; Wiik, K.; Hendriksen, P.V.; Lein, H.L. Comparison of iron and copper doped manganese cobalt spinel oxides as protective coatings for solid oxide fuel cell interconnects. J. Power Sources 2017, 372, 145–156. [Google Scholar] [CrossRef] [Green Version]
  31. Audasso, E.; Nam, S.; Arato, E.; Bosio, B. Preliminary model and validation of molten carbonate fuel cell kinetics under sulphur poisoning. J. Power Sources 2017, 352, 216–225. [Google Scholar] [CrossRef]
  32. FBianchi, F.R.; Spotorno, R.; Piccardo, P.; Bosio, B. Solid Oxide Fuel Cell Performance Analysis through Local Modelling. Catalysts 2020, 10, 519. [Google Scholar] [CrossRef]
  33. Conti, B.; Bosio, B.; McPhail, S.J.; Santoni, F.; Pumiglia, D.; Arato, E. A 2-D model for Intermediate Temperature Solid Oxide Fuel Cells Preliminarily Validated on Local Values. Catalysts 2019, 9, 36. [Google Scholar] [CrossRef] [Green Version]
  34. Audasso, E.; Bianchi, F.R.; Bosio, B. 2D Simulation for CH4 Internal Reforming-SOFCs: An Approach to Study Performance Degradation and Optimization. Energies 2020, 13, 4116. [Google Scholar] [CrossRef]
  35. Xu, J.; Froment, G.F. Methane steam reforming, methanation and water-gas shift: I. Intrinsic kinetics. AIChE J. 1989, 35, 88–96. [Google Scholar] [CrossRef]
  36. Green, D.W.; Perry, R.H. Perry’s Chemical Engineers’ Handbook, 8th ed.; McGraw-Hill Education: New York, NY, USA, 2007. [Google Scholar]
  37. Bianchi, F.R.; Bosio, B.; Baldinelli, A.; Barelli, L. Optimization of a Reference Kinetic Model for Solid Oxide Fuel Cells. Catalysts 2020, 10, 104. [Google Scholar] [CrossRef] [Green Version]
  38. Padinjarethil, A.K.; Bianchi, F.R.; Bosio, B.; Hagen, A. Electrochemical Characterization and Modelling of Anode and Electrolyte Supported Solid Oxide Fuel Cells. Front. Energy Res. 2021, 9, 668964. [Google Scholar] [CrossRef]
  39. Wu, J.; Liu, X. Recent Development of SOFC Metallic Interconnect. J. Mater. Sci. Technol. 2010, 26, 293–305. [Google Scholar] [CrossRef]
  40. Sabato, A.; Zanchi, E.; Molin, S.; Cempura, G.; Javed, H.; Herbrig, K.; Walter, C.; Boccaccini, A.; Smeacetto, F. Mn-Co spinel coatings on Crofer 22 APU by electrophoretic deposition: Up scaling, performance in SOFC stack at 850 °C and compositional modifications. J. Eur. Ceram. Soc. 2021, 41, 4496–4504. [Google Scholar] [CrossRef]
  41. Mandal, B.; Mitra, P. Grain growth correlated complex impedance spectroscopy, modulus spectroscopy and carrier hopping mechanism in MnCo2O4: Influence of sintering temperature. Mater. Chem. Phys. 2020, 251, 123095. [Google Scholar] [CrossRef]
  42. Huang, W.; Gopalan, S.; Pal, U.B.; Basu, S.N. Evaluation of Electrophoretically Deposited CuMn1.8O4 Spinel Coatings on Crofer 22 APU for Solid Oxide Fuel Cell Interconnects. J. Electrochem. Soc. 2008, 155, B1161–B1167. [Google Scholar] [CrossRef]
  43. Huang, K. Characterization of iron-based alloy interconnects for reduced temperature solid oxide fuel cells. Solid State Ion. 2000, 129, 237–250. [Google Scholar] [CrossRef]
  44. Molin, S.; Kusz, B.; Gazda, M.; Jasinski, P. Protective coatings for stainless steel for SOFC applications. J. Solid State Electrochem. 2009, 13, 1695–1700. [Google Scholar] [CrossRef]
  45. Lu, Z.; Zhu, J.; Payzant, E.; Paranthaman, M. Electrical Conductivity of the Manganese Chromite Spinel Solid Solution. J. Am. Ceram. Soc. 2005, 88, 1050–1053. [Google Scholar] [CrossRef]
  46. Kurokawa, H.; Jacobson, C.; Dejonghe, L.; Visco, S. Chromium vaporization of bare and of coated iron–chromium alloys at 1073 K. Solid State Ion. 2007, 178, 287–296. [Google Scholar] [CrossRef]
  47. Talic, B.; Falk-Windisch, H.; Venkatachalam, V.; Hendriksen, P.V.; Wiik, K.; Lein, H.L. Effect of coating density on oxidation resistance and Cr vaporization from solid oxide fuel cell interconnects. J. Power Sources 2017, 354, 57–67. [Google Scholar] [CrossRef] [Green Version]
  48. Lee, S.-I.; Hong, J.; Kim, H.; Son, J.-W.; Lee, J.-H.; Kim, B.-K.; Lee, H.-W.; Yoon, K.J. Highly Dense Mn-Co Spinel Coating for Protection of Metallic Interconnect of Solid Oxide Fuel Cells. J. Electrochem. Soc. 2014, 161, F1389–F1394. [Google Scholar] [CrossRef] [Green Version]
  49. Stevenson, J.; Yang, Z.; Xia, G.; Nie, Z.; Templeton, J. Long-term oxidation behavior of spinel-coated ferritic stainless steel for solid oxide fuel cell interconnect applications. J. Power Sources 2013, 231, 256–263. [Google Scholar] [CrossRef]
  50. Gambino, L.V.; Magdefrau, N.J.; Aindow, M. Microstructural effects of the reduction step in reactive consolidation of manganese cobaltite coatings on Crofer 22 APU. Mater. High Temp. 2015, 32, 142–147. [Google Scholar] [CrossRef]
  51. Martin, B.E.; Petric, A. Electrical properties of copper–manganese spinel solutions and their cation valence and cation distribution. J. Phys. Chem. Solids 2007, 68, 2262–2270. [Google Scholar] [CrossRef]
  52. Sun, Z.; Gopalan, S.; Pal, U.B.; Basu, S.N. Cu1.3Mn1.7O4 spinel coatings deposited by electrophoretic deposition on Crofer 22 APU substrates for solid oxide fuel cell applications. Surf. Coat. Technol. 2017, 323, 49–57. [Google Scholar] [CrossRef]
  53. Molin, S.; Sabato, A.G.; Bindi, M.; Leone, P.; Cempura, G.; Salvo, M.; Polo, S.C.; Boccaccini, A.; Smeacetto, F. Microstructural and electrical characterization of Mn-Co spinel protective coatings for solid oxide cell interconnects. J. Eur. Ceram. Soc. 2017, 37, 4781–4791. [Google Scholar] [CrossRef] [Green Version]
  54. Mogensen, D.; Grunwaldt, J.-D.; Hendriksen, P.; Dam-Johansen, K.; Nielsen, J. Internal steam reforming in solid oxide fuel cells: Status and opportunities of kinetic studies and their impact on modelling. J. Power Sources 2011, 196, 25–38. [Google Scholar] [CrossRef]
  55. Stoynov, Z.; Vladikova, D.; Burdin, B. Differential Resistance Analysis-Current Achievements and Applications. Bulg. Chem. Commun. 2018, 50, 21–30. [Google Scholar]
  56. Posdziech, O.; Schwarze, K.; Brabandt, J. Efficient hydrogen production for industry and electricity storage via high-temperature electrolysis. Int. J. Hydrogen Energy 2019, 44, 19089–19101. [Google Scholar] [CrossRef]
  57. Skafte, T.; Hjelm, J.; Blennow, P.; Graves, C. Quantitative review of degradation and lifetime of solid oxide cells and stacks. In Proceedings of the 12th European SOFC & SOE Forum, Lucerne, Switzerland, 5–8 July 2016; pp. 8–27, [B0501] European Fuel Cell Forum. Available online: www.EFCF.com/Lib (accessed on 29 December 2021).
Figure 1. Scheme of sample mounting and connections on the testing setup for ASR measurements at SOFC operating conditions.
Energies 15 02762 g001
Figure 2. ASR over time for the CoMnO/Crofer22 APU sample (red line) at 1123 K and the CuMnO/AISI 441 sample (black line) at 1023 K.
Energies 15 02762 g002
Figure 3. Arrhenius plot of CoMnO/Crofer22 APU (A) and CuMnO/AISI 441 (B): samples as-coated (red diamonds), aged for 200 h (black squares), and aged for 400 h (blue triangles).
Energies 15 02762 g003aEnergies 15 02762 g003b
Figure 4. SEM-BSD micrographs in cross-section made at 5000× of CoMnO/Crofer22 APU (A) and CuMnO/AISI441 (B) in the as-coated state.
Energies 15 02762 g004
Figure 5. SEM-BSD micrographs made at 5000× on cross-sections of CoMnO/Crofer22 APU aged for 200 h (A) and 400 h (C) at 1123 K, whereas (B,D) are the respective EDXS line-scan analyses along the orange line of (A,C).
Energies 15 02762 g005
Figure 6. SEM-BSD micrographs made at 5000 x on cross-sections of CuMnO/AISI441 aged for 200 h (A) and 400 h (C) at 1023 K, whereas (B,D) are the respective EDXS line-scan analyses along the orange line of (A,C).
Energies 15 02762 g006aEnergies 15 02762 g006b
Figure 7. ESC performance at 0 h underlining the contribution of cell ohmic overpotential under H2-direct feeding operation at a 1123 K inlet temperature according to SIMFC results.
Energies 15 02762 g007
Figure 8. DR along ESC lifetime under different current densities for H2-direct feeding operation at a 1123 K inlet temperature according to SIMFC results.
Energies 15 02762 g008
Figure 9. Measured CuMnO/AISI 441 interconnect ASR and corresponding cell voltage simulated for H2-direct feeding ASC configuration at a 1023 K inlet temperature under galvanostatic conditions.
Energies 15 02762 g009
Figure 10. IV characteristic profiles simulated at 40 and 400 h for H2-direct feeding ASC configuration (A) and resulting DR varying applied load (B) at a 1023 K initial temperature.
Energies 15 02762 g010aEnergies 15 02762 g010b
Figure 11. Local maps of ohmic overpotential at 0 h (A) and 400 h (B) because of the temperature gradient (C) considering large-scale direct internal reforming ASC configuration according to SIMFC results.
Energies 15 02762 g011
Table 1. Structure of ESC and ASC configurations.
LayerESCASC
AnodeNi-CGO (25 μm with 5 μm of Ni
contact layer—36% porosity)
Ni-YSZ (250 with 10 μm as
active layer—40% porosity)
ElectrolyteYSZ (85 μm—1% porosity)YSZ (8 μm—1% porosity)
CathodeLSCF-CGO (35 μm with 5 μm
as CGO barrier layer—35% porosity)
LSCF-CGO (55 μm with 5 μm
as CGO barrier layer—30% porosity)
Table 2. Kinetic parameters for kinetics modelling of ESC and ASC configurations [38].
ParameterESCASC
γohm,cell [Ω cm2 K−1]1.3 × 10−77.3 × 10−10
Ea,ohm,cell [kJ mol−1]73104
γfuel [A cm−2]1.1 × 1052 × 104
Ea,fuel [kJ mol−1]86107
A [-]0.450.30
γair [A cm−2]3 × 1053 × 105
Ea,air [kJ mol−1]110110
B [-]0.170.17
Table 3. Estimated coating relative density over aging time.
Aging Time
[h]
Relative Density CoMnO
[%]
Relative Density
CuMnO
[%]
030.827.9
20058.763.6
40068.374.5
Table 4. Feed molar compositions applied in cell performance simulation.
ComponentH2 Direct OxidationBiogas Internal Reforming
AnodeCathodeAnodeCathode
CH4--0.24
H20.96-0.04-
H2O0.04-0.51-
CO----
CO2--0.12-
N2-0.790.090.79
O2-0.21-0.21
Publisher’s Note: MDPI stays neutral with regard to jurisdictional claims in published maps and institutional affiliations.

