
Pore Connectivity Characteristics and Controlling Factors for Black Shales in the Wufeng-Longmaxi Formation, Southeastern Sichuan Basin, China


Abstract
:1. Introduction
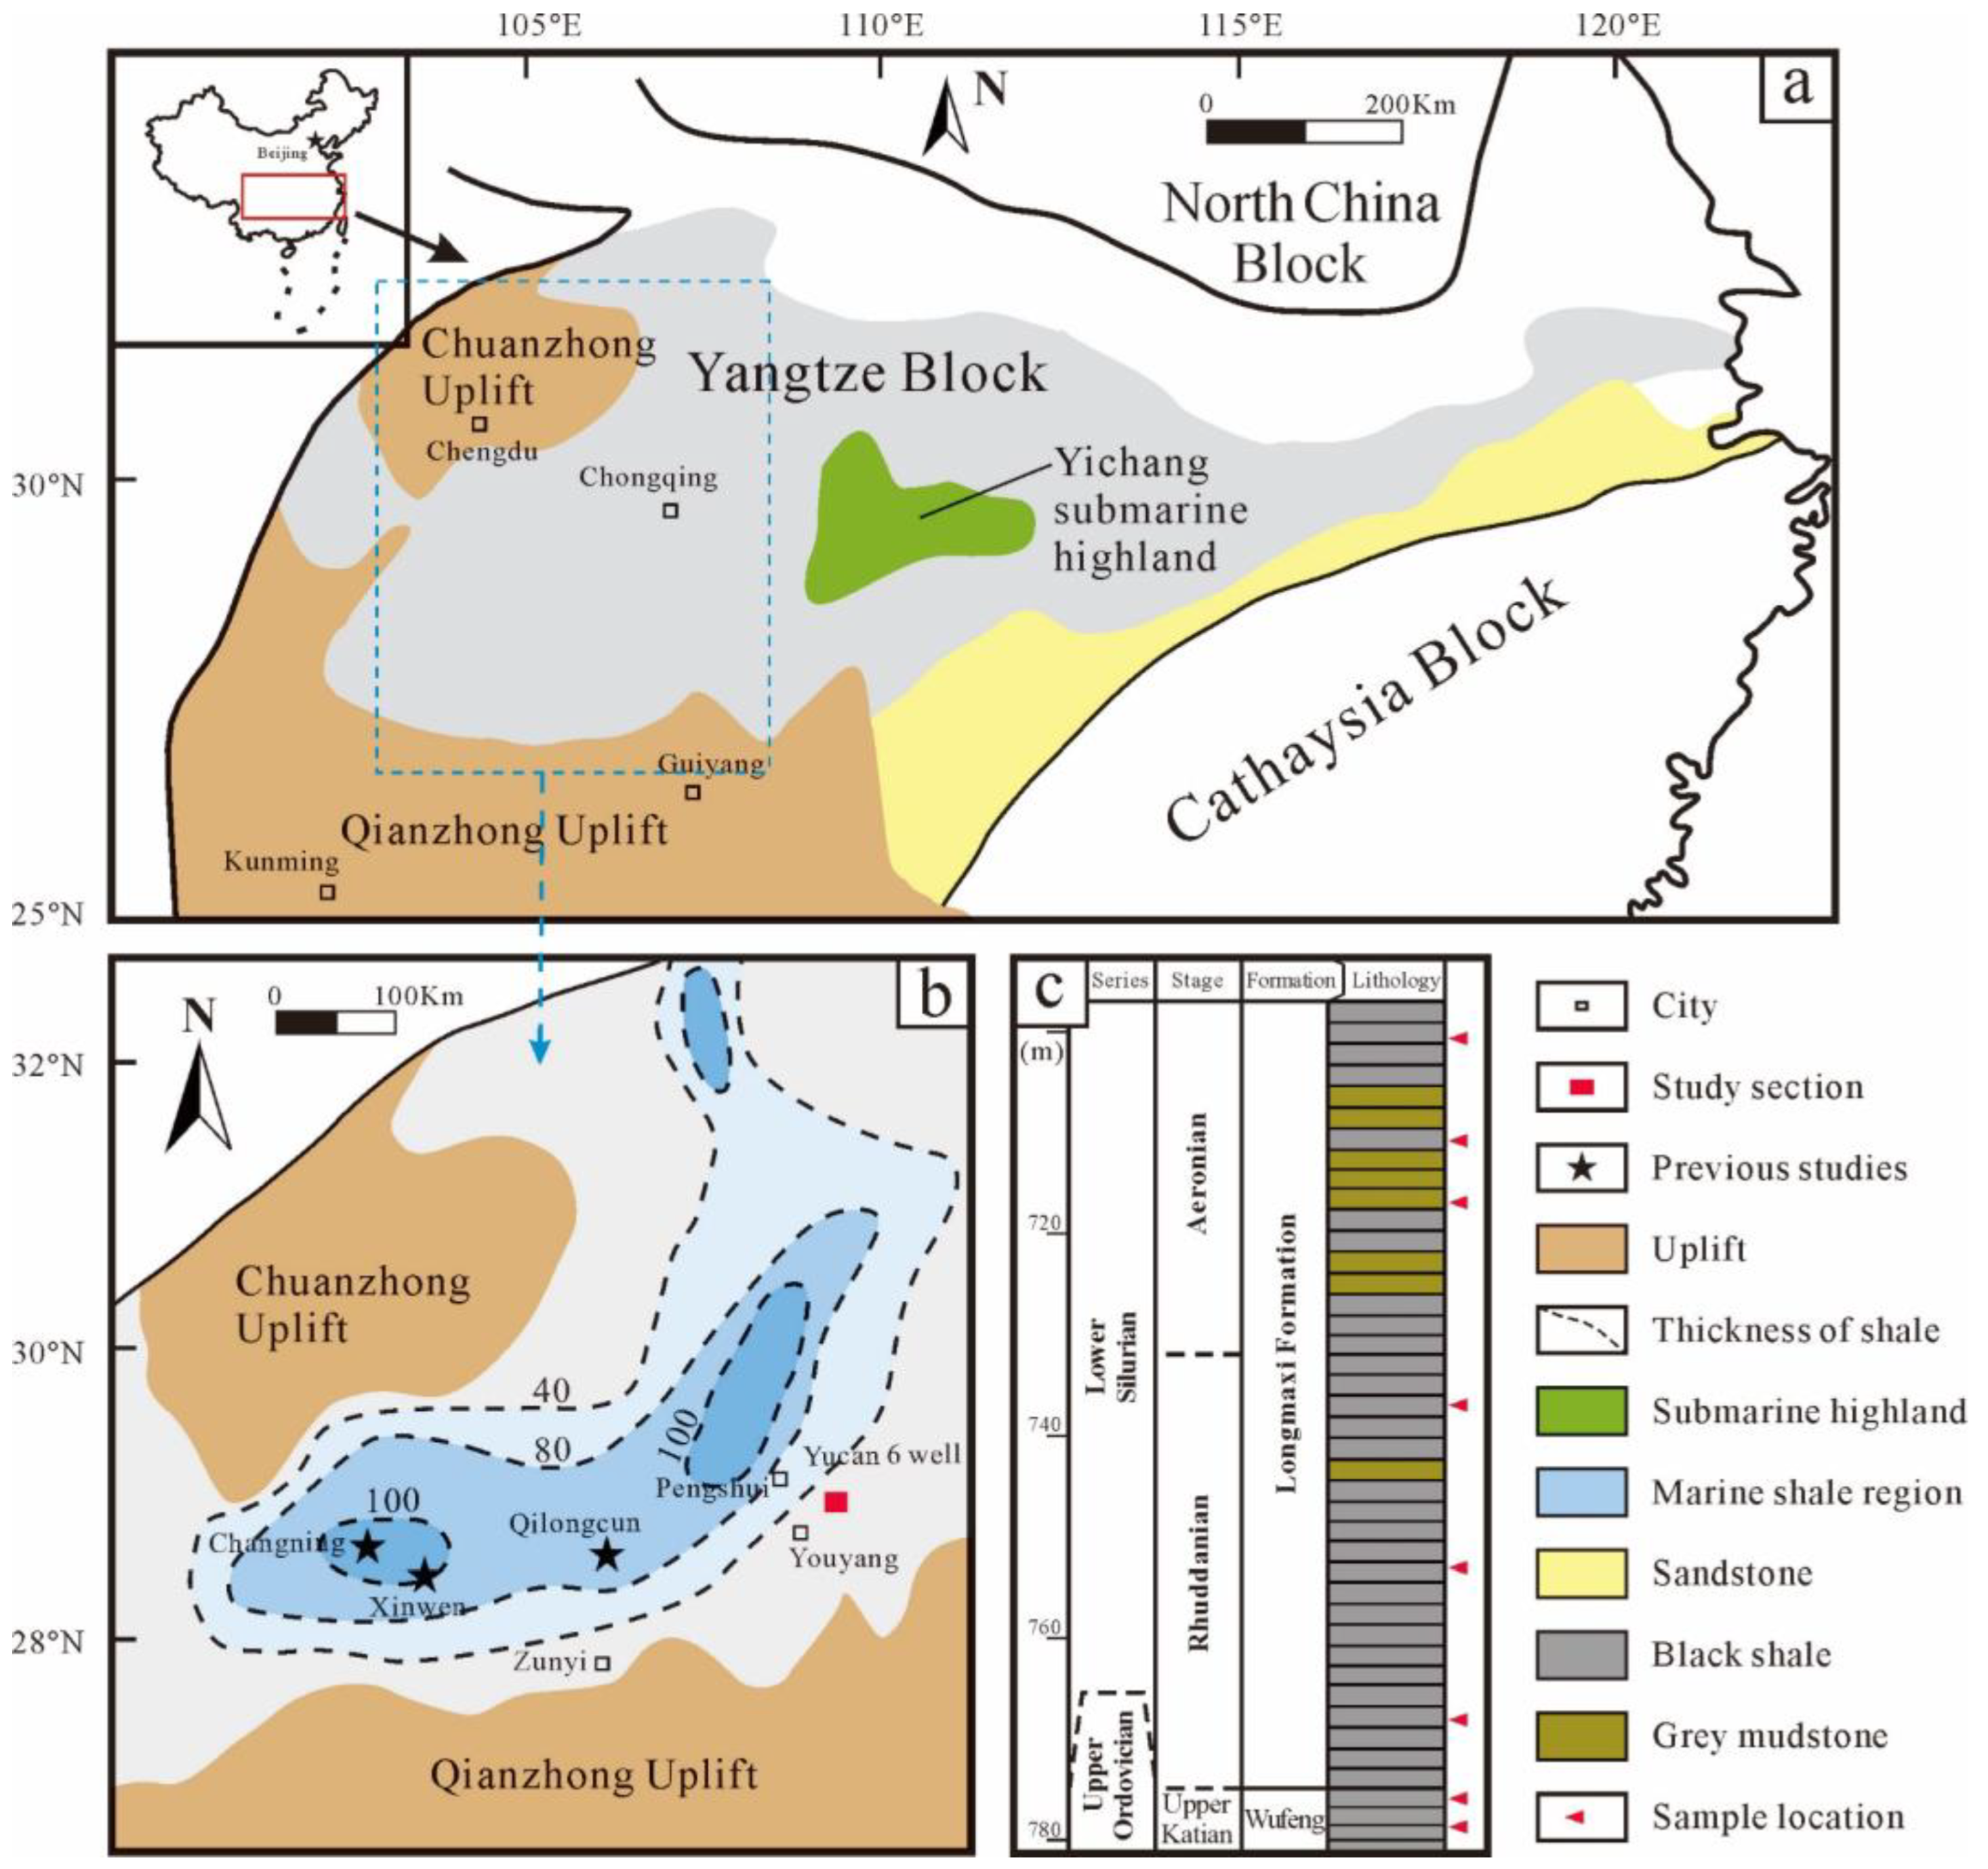
2. Geological Setting
3. Samples and Methods
3.1. Samples
3.2. Methods
4. Results
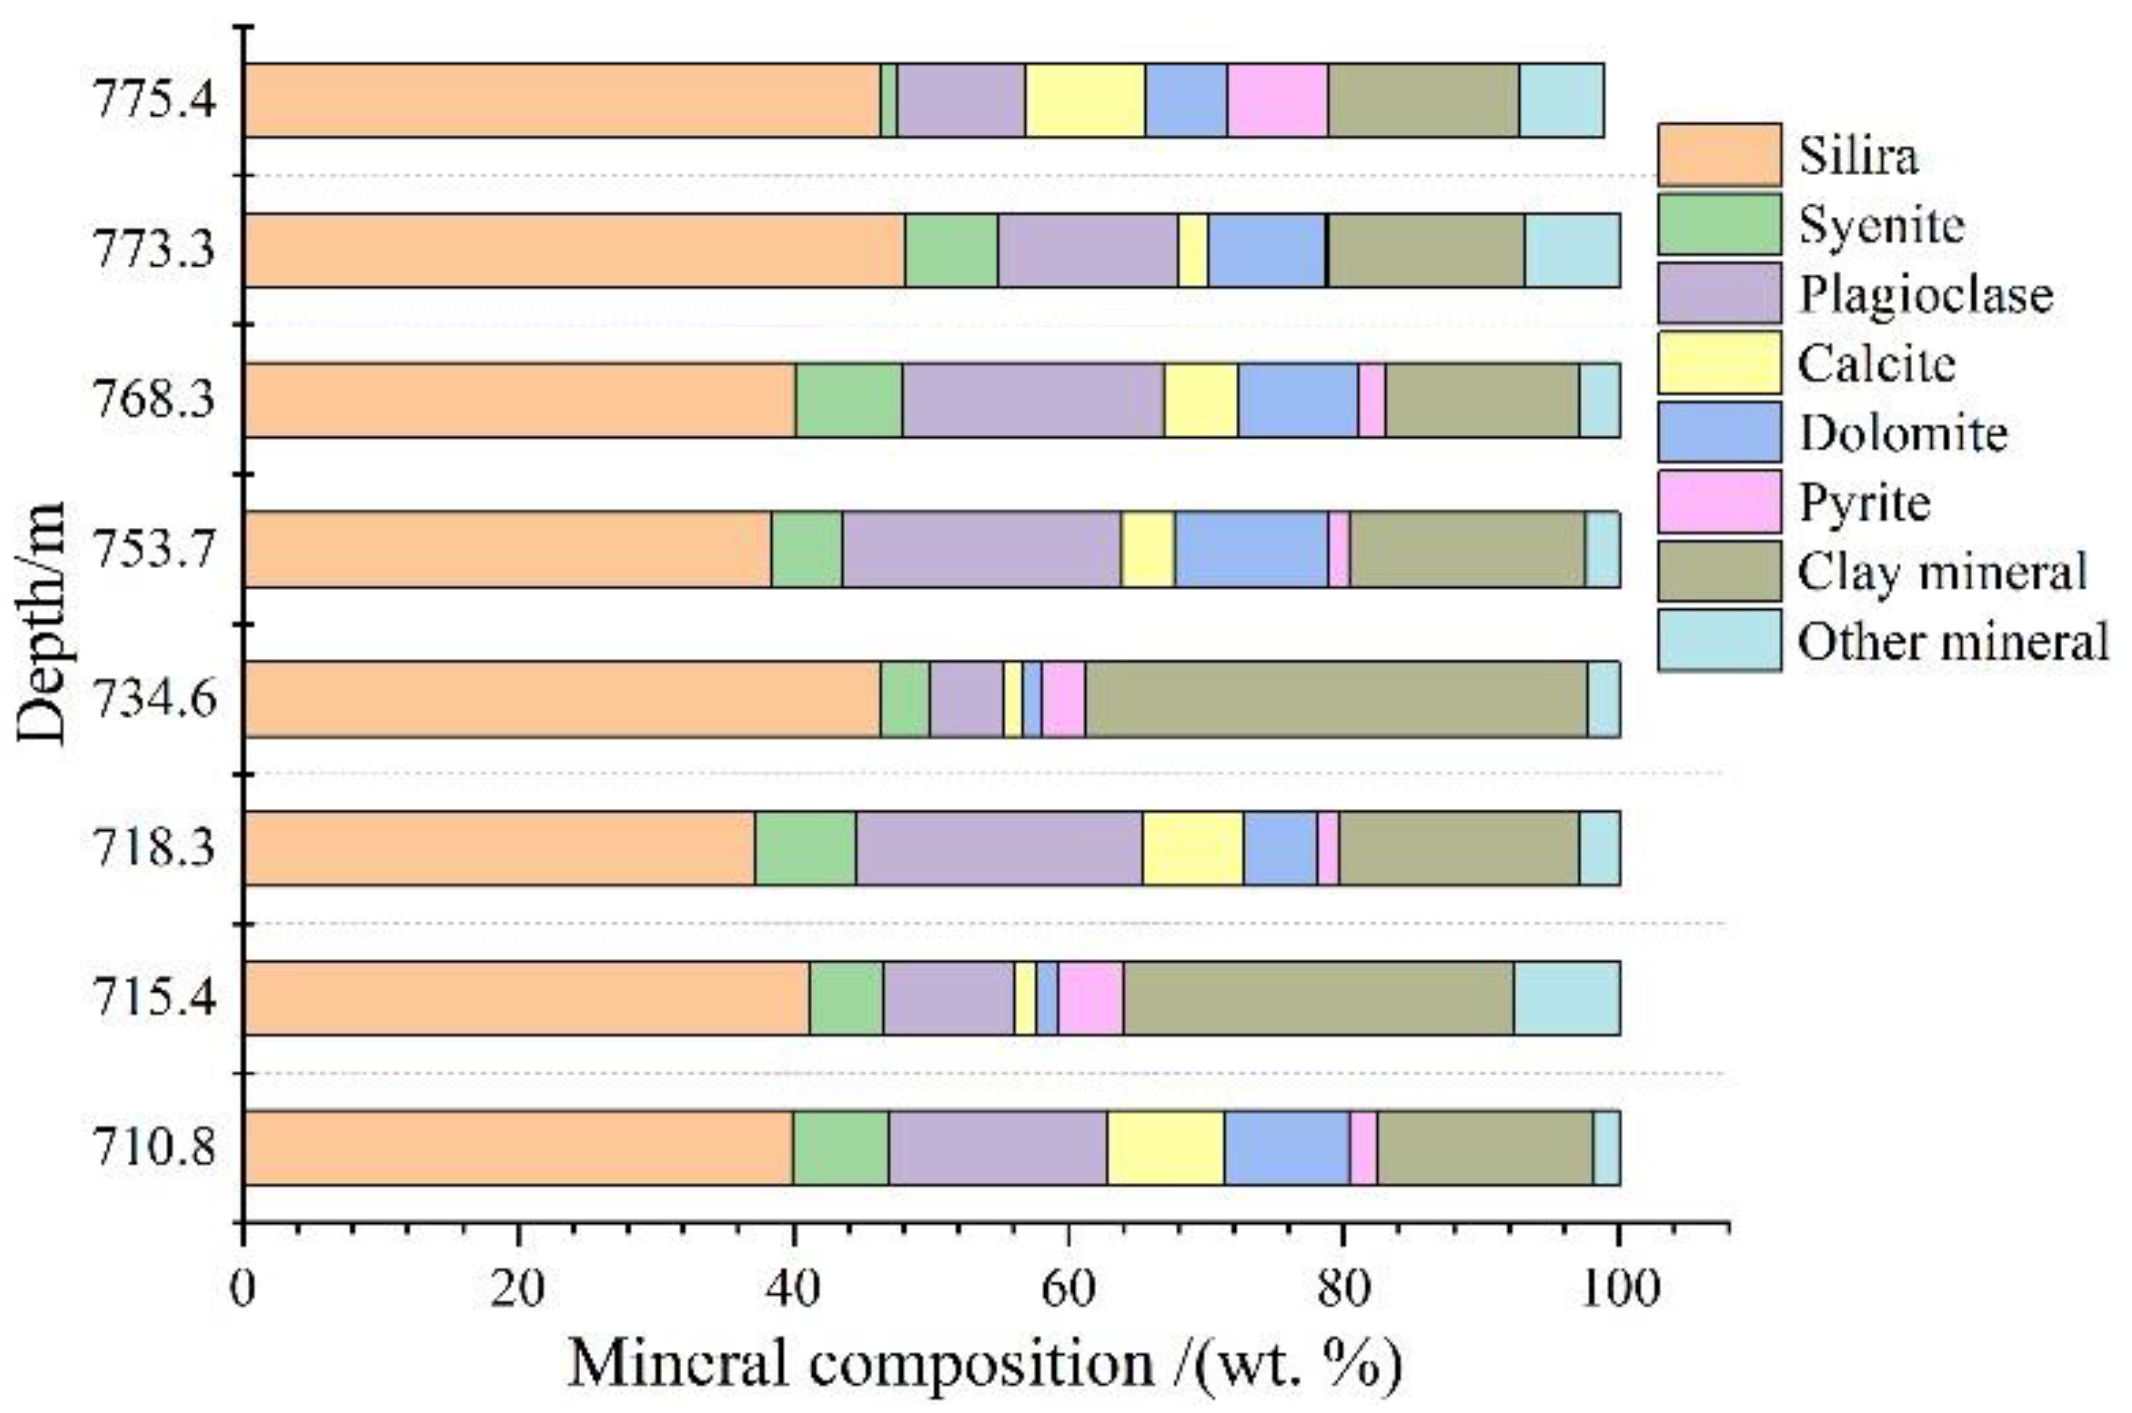
4.1. TOC Content and Mineral Composition
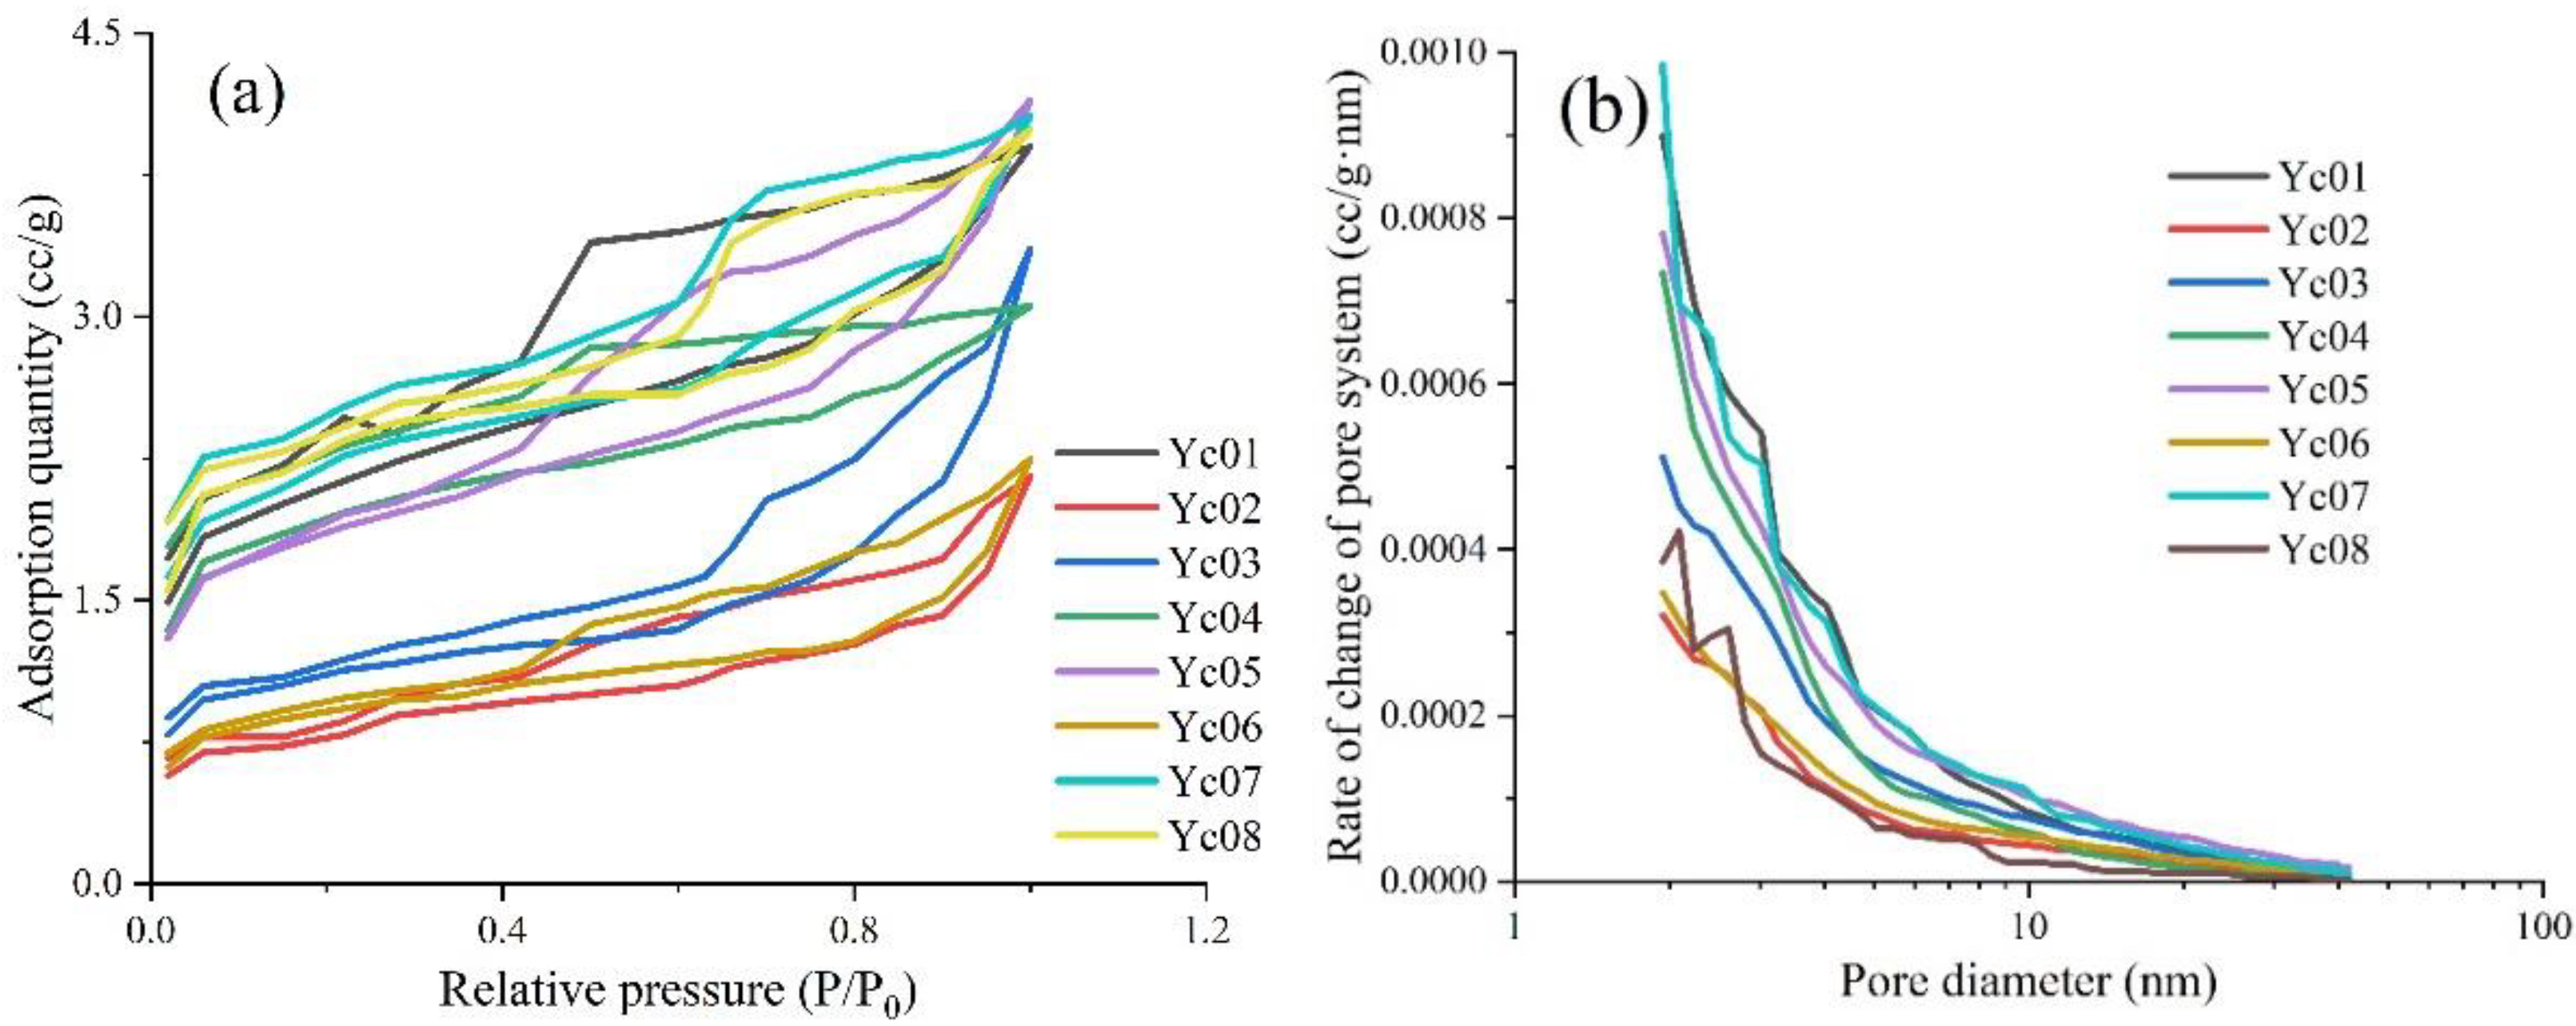
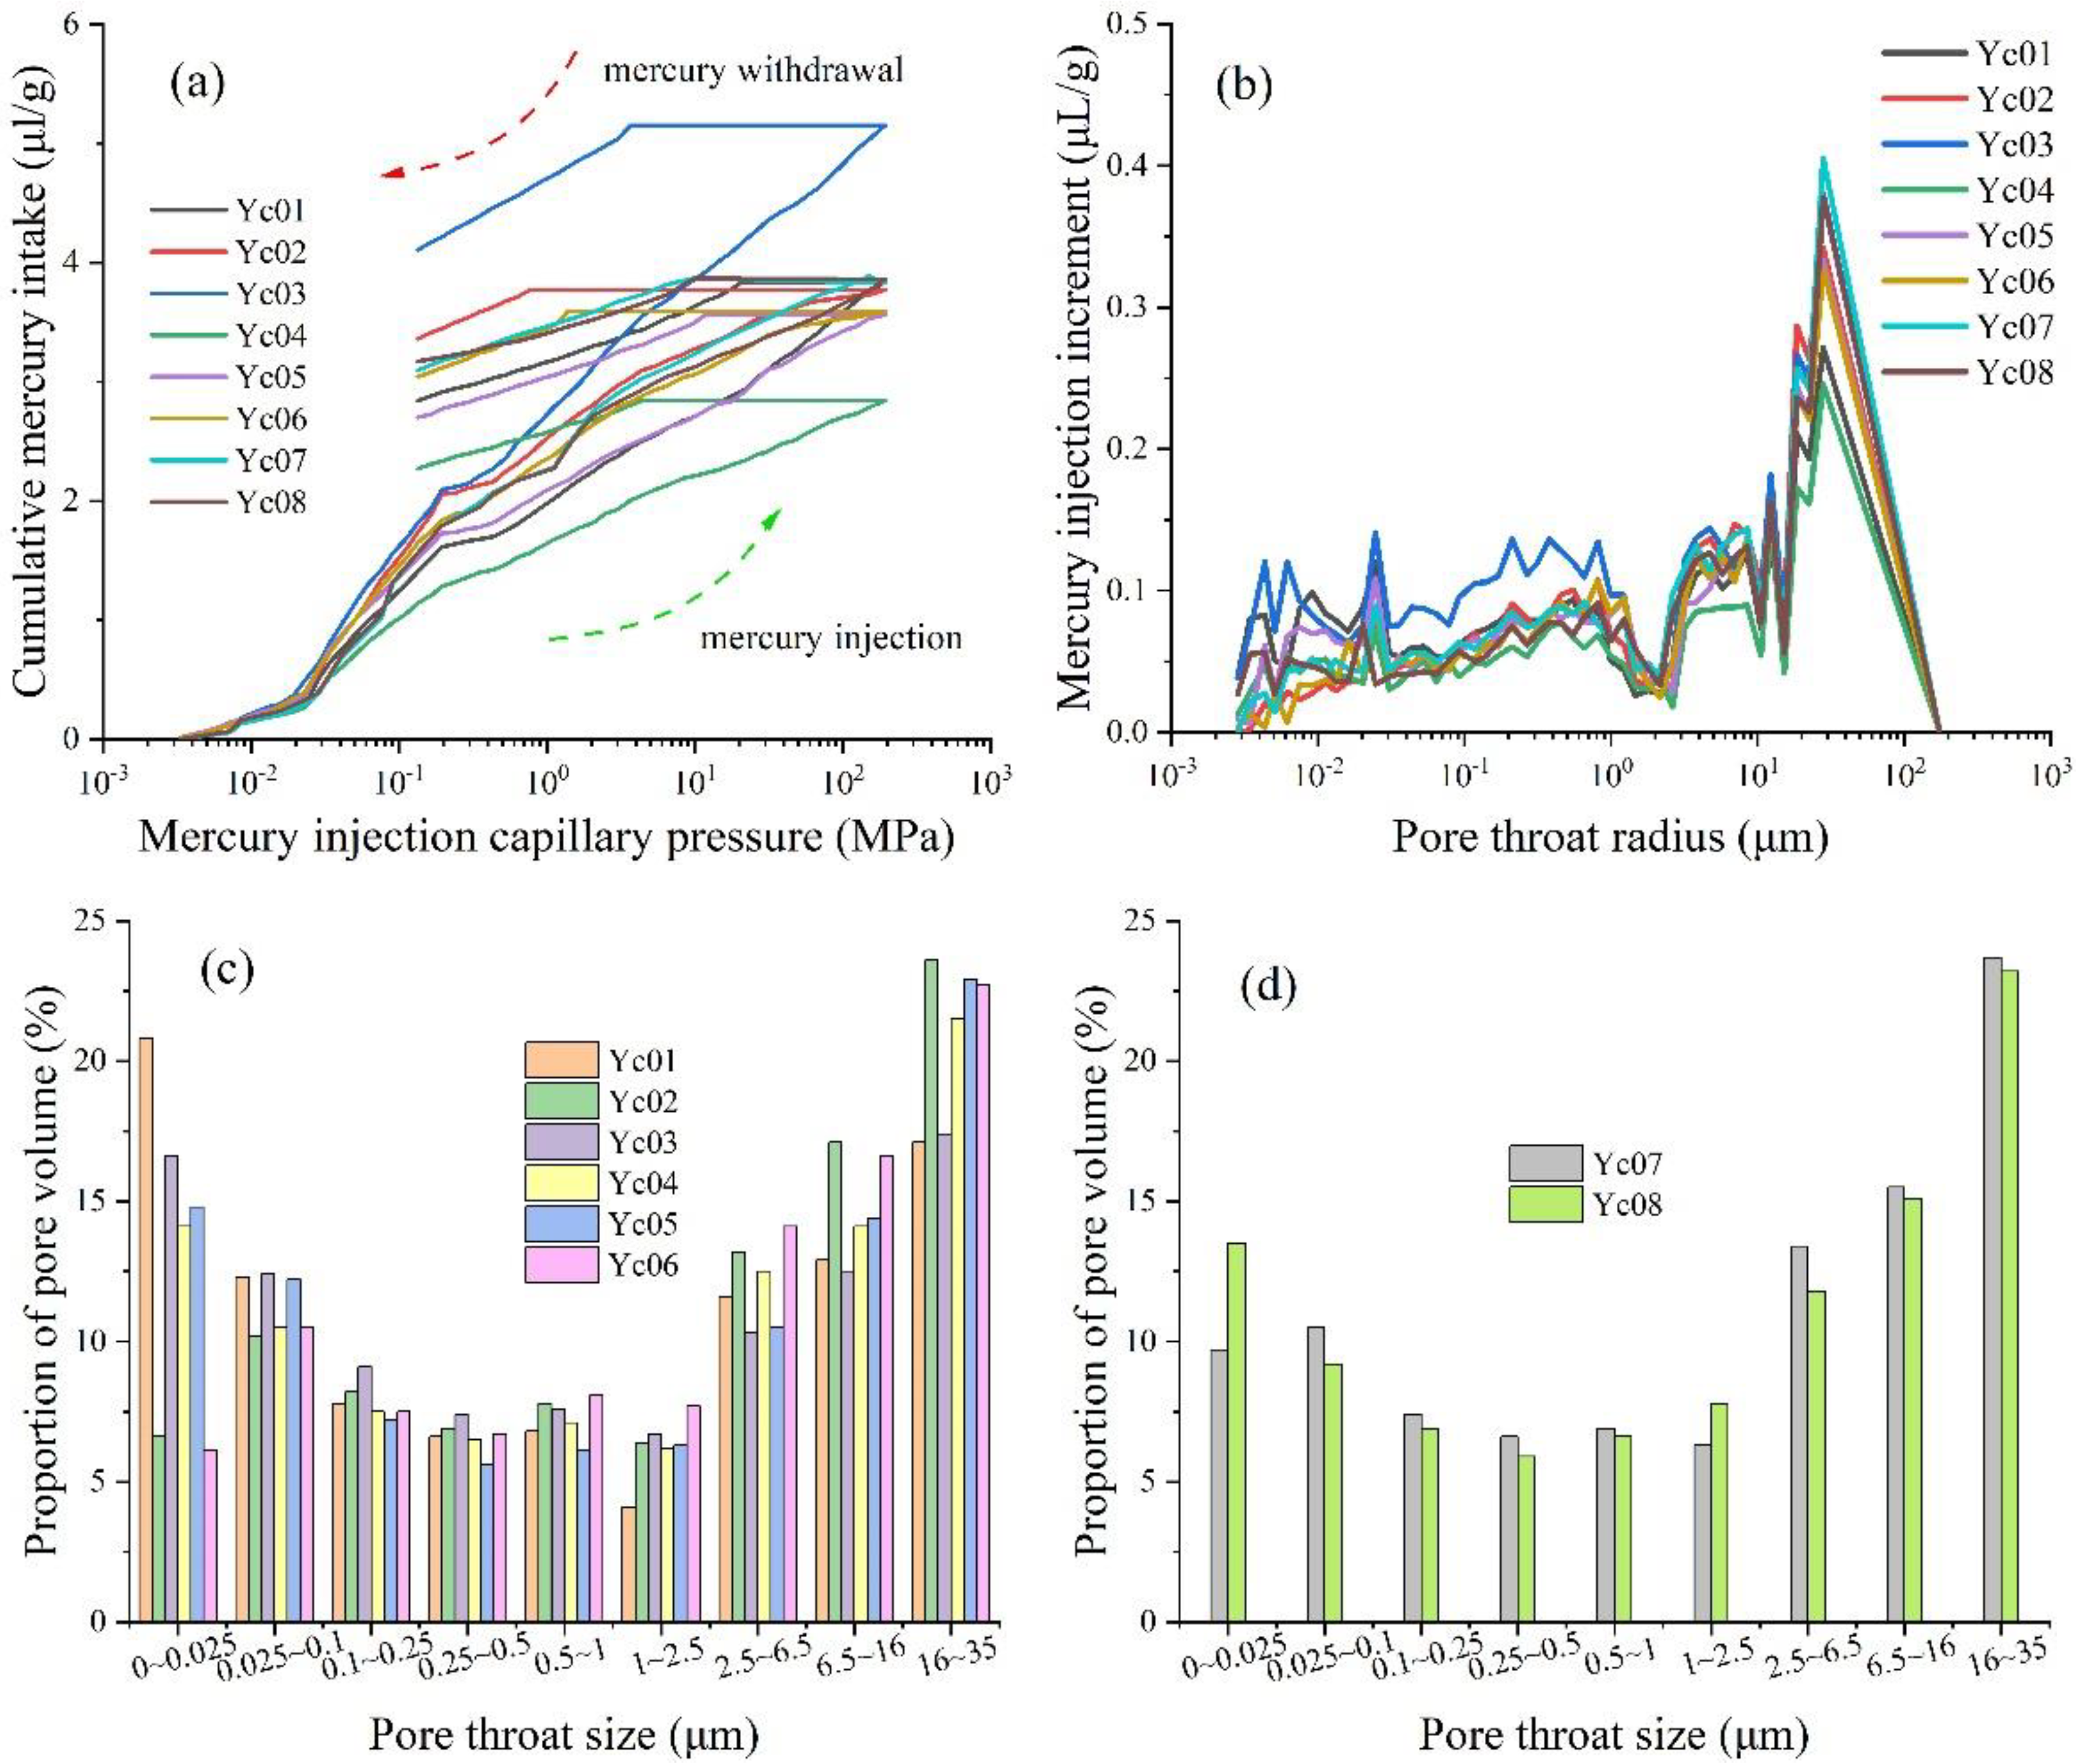
4.2. Pore Size Distribution
4.3. Connectivity of Pores
5. Discussion
5.1. Effects of Samples Size on Pore Connectivity
5.2. Contributions of Pore Types to Connectivity
5.3. Contribution of Different Pore Sizes to the Connectivity
5.4. Factors Influencing Pore Connectivity in the Shales
5.4.1. TOC Contents
5.4.2. Mineral Compositions
6. Conclusions
Author Contributions
Funding
Institutional Review Board Statement
Informed Consent Statement
Data Availability Statement
Conflicts of Interest
References
- Ma, X.; Wang, H.; Zhou, S.; Feng, Z.; Liu, H.; Guo, W. Insights into NMR response characteristics of shales and its application in shale gas reservoir evaluation. J. Nat. Gas. Sci. Eng. 2020, 84, 103674. [Google Scholar] [CrossRef]
- Feng, Z.; Hao, F.; Dong, D.; Zhou, S.; Wu, W.; Xie, C.; Cai, Y.; Li, Z. Geochemical anomalies in the Lower Silurian shale gas from the Sichuan Basin, China: Insights from a Rayleigh-type fractionation model. Org. Geochem. 2020, 142, 103981. [Google Scholar] [CrossRef]
- Hao, F.; Zou, H.; Lu, Y. Mechanisms of shale gas storage: Implications for shale gas exploration in China. AAPG Bull. 2013, 97, 1325–1346. [Google Scholar] [CrossRef]
- Hao, F.; Zou, H. Cause of shale gas geochemical anomalies and mechanisms for gas enrichment and depletion in high-maturity shales. Mar. Pet. Geol. 2013, 44, 1–12. [Google Scholar] [CrossRef]
- Curtis, J.B. Fractured shale-gas systems. AAPG Bull. 2002, 86, 1921–1938. [Google Scholar]
- Ross, D.J.K.; Bustin, R.M. The importance of shale composition and pore structure upon gas storage potential of shale gas reservoirs. Mar. Pet. Geol. 2009, 26, 916–927. [Google Scholar] [CrossRef]
- Zou, C.; Yang, Z.; Pan, S.; Chen, Y.; Lin, S.; Huang, J.; Wu, S.; Dong, D.; Wang, S.; Liang, F.; et al. Shale Gas Formation and Occurrence in China: An Overview of the Current Status and Future Potential. Acta. Geol. Sin-Engl. 2016, 90, 1249–1283. [Google Scholar]
- Chen, C.; Hu, D.; Westacott, D.; Loveless, D. Nanometer-scale characterization of microscopic pores in shale kerogen by image analysis and pore-scale modeling. Geochem. Geophys. Geosystems 2013, 14, 4066–4075. [Google Scholar] [CrossRef]
- Chen, L.; Zhang, L.; Kang, Q.; Viswanathan, H.S.; Yao, J.; Tao, W. Nanoscale simulation of shale transport properties using the lattice Boltzmann method: Permeability and diffusivity. Sci. Rep. 2015, 5, 8089. [Google Scholar] [CrossRef]
- Chen, L.; Kang, Q.; Pawar, R.; He, Y.; Tao, W. Pore-scale prediction of transport properties in reconstructed nanostructures of organic matter in shales. Fuel 2015, 158, 650–658. [Google Scholar] [CrossRef] [Green Version]
- Yuan, Y.; Rezaee, R.; Verrall, M.; Hu, S.; Zou, J.; Testmanti, N. Pore characterization and clay bound water assessment in shale with a combination of NMR and low-pressure nitrogen gas adsorption. Int. J. Coal. Geol. 2018, 194, 11–21. [Google Scholar] [CrossRef]
- Zhang, W.; Huang, Z.; Li, X.; Chen, J.; Guo, X.; Pan, Y.; Liu, B. Estimation of organic and inorganic porosity in shale by NMR method, insights from marine shales with different maturities. J. Nat. Gas. Sci. Eng. 2020, 78, 103290. [Google Scholar] [CrossRef]
- Garcia, A.P.; Han, Y.; Heidari, Z. Integrated Workflow to Estimate Permeability Through Quanti cation of Rock Fabric Using Joint Interpretation of Nuclear Magnetic Resonance and Electric Measurements. Petrophysics 2018, 59, 672–693. [Google Scholar]
- Tathed, P.; Han, Y.; Misra, S. Hydrocarbon saturation in Bakken Petroleum System based on joint inversion of resistivity and dielectric dispersion logs. Fuel 2018, 233, 45–55. [Google Scholar] [CrossRef]
- Han, Y.; Misra, S. Joint petrophysical inversion of multifrequency conductivity and permittivity logs derived from subsurface galvanic, induction, propagation, and dielectric dispersion measurements. Geophysics 2018, 83, D97–D112. [Google Scholar] [CrossRef]
- Han, Y.; Misra, S. Bakken Petroleum System Characterization Using Dielectric-Dispersion Logs. Petrophysics 2018, 59, 201–217. [Google Scholar] [CrossRef]
- Ma, Y.; Pan, Z.; Zhong, N.; Connell, L.D.; Down, D.I.; Lin, W.; Zhang, Y. Experimental study of anisotropic gas permeability and its relationship with fracture structure of Longmaxi Shales, Sichuan Basin, China. Fuel 2016, 180, 106–115. [Google Scholar] [CrossRef]
- Wang, X.; Hou, J.; Li, S.; Dou, L.; Song, S.; Kang, Q.; Wang, D. Insight into the nanoscale pore structure of organic-matter shales in the Bakken Formation, USA. J. Petrol. Sci. Eng. 2020, 191, 107182. [Google Scholar] [CrossRef]
- Wu, J.; Yuan, Y.; Niu, S.; Wei, X.; Yang, J. Multiscale characterization of pore structure and connectivity of Wufeng-Longmaxi shale in Sichuan Basin, China. Mar. Pet. Geol. 2020, 120, 104514. [Google Scholar] [CrossRef]
- Sun, M.; Yu, B.; Hu, Q.; Zhang, Y.; Li, B.; Yang, R.; Melnichenko, Y.B.; Cheng, G. Pore characteristics of Longmaxi shale gas reservoir in the Northwest of Guizhou, China: Investigations using small-angle neutron scattering (SANS), helium pycnometry, and gas sorption isotherm. Int. J. Coal. Geol. 2017, 171, 61–68. [Google Scholar] [CrossRef] [Green Version]
- Gu, X.; Mildner, D.F.R.; Cole, D.R.; Rother, G.; Slingerland, R.; Brantley, S.L. Quantification of Organic Porosity and Water Accessibility in Marcellus Shale Using Neutron Scattering. Energy Fuels 2016, 30, 4438–4449. [Google Scholar] [CrossRef]
- Klaver, J.; Hemes, S.; Houben, M.; Desbois, G.; Radi, Z.; Urai, J.L. The connectivity of pore space in mudstones: Insights from high-pressure Wood's metal injection, BIB-SEM imaging, and mercury intrusion porosimetry. Geofluids 2015, 15, 577–591. [Google Scholar] [CrossRef]
- Wang, Y.; Pu, J.; Wang, L.; Wang, J.; Jiang, Z.; Song, Y.; Wang, C.; Wang, Y.; Jin, C. Characterization of typical 3D pore networks of Jiulaodong formation shale using nano-transmission X-ray microscopy. Fuel 2016, 170, 84–91. [Google Scholar] [CrossRef]
- Tang, X.; Jiang, Z.; Jiang, S.; Li, Z. Heterogeneous nanoporosity of the Silurian Longmaxi Formation shale gas reservoir in the Sichuan Basin using the QEMSCAN, FIB-SEM, and nano-CT methods. Mar. Pet. Geol. 2016, 78, 99–109. [Google Scholar] [CrossRef]
- Hu, Q.; Ewing, R.P.; Dultz, S. Low pore connectivity in natural rock. J. Contam. Hydrol. 2012, 133, 76–83. [Google Scholar] [CrossRef] [PubMed]
- Zhang, C.; Santosh, M.; Zhu, Q.; Chen, X.; Huang, W. The Gondwana connection of South China: Evidence from monazite and zircon geochronology in the Cathaysia Block. Gondwana Res. 2015, 28, 1137–1151. [Google Scholar] [CrossRef]
- Chen, X.; Rong, J.; Li, Y.; Boucot, A.J. Facies patterns and geography of the Yangtze region, South China, through the Ordovician and Silurian transition. Palaeogeogr. Palaeoclimatol. Palaeoecol. 2004, 204, 353–372. [Google Scholar]
- Wang, C.; Dong, Z.; Fu, X.; Chen, Q.; Liu, X.; Tang, M.; Wang, Z. Spatiotemporal Evolution and Genesis of the Late Ordovician-Early Silurian Marine Euxinia in Northeastern Upper Yangtze Basin, South China. Front. Earth Sci. 2021, 9, 1–19. [Google Scholar] [CrossRef]
- Bakshi, T.; Prusty, B.K.; Pathak, K.; Pal, S.K. Pore characteristics of Damodar valley shale and their effect on gas storage potential. J. Pet. Sci. Eng. 2018, 162, 725–735. [Google Scholar] [CrossRef]
- Barrett, P.E.; Joyner, G.L.; Halenda, P.P. The Determination of Pore Volume and Area Distributions in Porous Substances. I. Computations from Nitrogen Isotherms. J. Am. Chem. Soc. 1951, 73, 373–380. [Google Scholar] [CrossRef]
- Avnir, D.; Jaroniec, M. An Isotherm Equation for Adsorption on Fractal Surfaces of Heterogeneous Porous Materials. Langmuir 1989, 5, 1431–1433. [Google Scholar] [CrossRef]
- Washburn, W.E. The dynamics of capillary flow. Phys. Rev. 1921, 17, 273–283. [Google Scholar] [CrossRef]
- Peng, S.; Zhang, T.; Loucks, R.G.; Shultz, J. Application of mercury injection capillary pressure to mudrocks: Conformance and compression corrections. Mar. Pet. Geol. 2017, 88, 30–40. [Google Scholar] [CrossRef]
- Wang, C.; Dong, Z.; Fu, X.; Hu, X.; Li, Z. Origin and paleoenvironment of organic matter in the Wufeng–Longmaxi shales in the northeastern Sichuan basin. Energy Explor. Exploit. 2021, 39, 134–155. [Google Scholar] [CrossRef]
- Yu, L.; Liu, K.; Fan, M.; Pan, Z. Pore Connectivity Characterization Using Coupled Wood’s Metal Intrusion and High-Resolution Imaging: A Case of the Silurian Longmaxi Shales From the Sichuan Basin, China. Front. Earth Sci. 2021, 9, 1–16. [Google Scholar] [CrossRef]
- Mason, G.; Fischer, H.; Morrow, N.R.; Ruth, D.W.; Wo, S. Effect of sample shape on counter-current spontaneous imbibition production vs time curves. J. Petrol. Sci. Eng. 2009, 66, 83–97. [Google Scholar] [CrossRef]
- Yang, H.; Zhang, B.; Yang, K.; Xiao, W.; Wang, Y. The study on shale electrical properties based on characterization of microscopic pore structure: A case study of Longmaxi formation shale in south Sichuan. Comput. Tech. Geophys. Geochem. Explor. 2021, 43, 646–654. [Google Scholar]
- Yang, R. Pore Structure and Tracer-Containing Fluid Migration in Connected Pores of Wufeng and Longmaxi Shales from Western Hubie and Eastern Chongqing Regions. Ph.D. Thesis, China University of Geosciences, Wuhan, China, 2018. [Google Scholar]
- Gou, Q.; Xu, S.; Hao, F.; Shu, Z.; He, S.; Wu, Z. Differences in the Nanopore Structure of Organic-Rich Shales with Distinct Sedimentary Environments and Mineral Compositions. Energy Fuels 2021, 35, 16562–16577. [Google Scholar] [CrossRef]
- Wang, X.; Zhang, F.; Li, S.; Dou, L.; Liu, Y.; Ren, X.; Chen, D.; Zhao, W. The Architectural Surfaces Characteristics of Sandy Braided River Reservoirs, Case Study in Gudong Oil Field, China. Geofluids 2021, 2021, 8821711. [Google Scholar] [CrossRef]
- Hatiboglu, C.U.; Babadagli, T. Oil recovery by counter-current spontaneous imbibition: Effects of matrix shape factor, gravity, IFT, oil viscosity, wettability, and rock type. J. Pet. Sci. Eng. 2007, 59, 106–122. [Google Scholar] [CrossRef]
- Wang, X.; Wang, M.; Li, Y.; Zhang, J.; Li, M.; Li, Z.; Guo, Z.; Li, J. Shale pore connectivity and influencing factors based on spontaneous imbibition combined with a nuclear magnetic resonance experiment. Mar. Pet. Geol. 2021, 132, 105239. [Google Scholar] [CrossRef]
- Yang, R.; Hu, Q.; Yi, J.; Zhang, B.; He, S.; Guo, X.; Hou, Y.; Dong, T. The effects of mineral composition, TOC content and pore structure on spontaneous imbibition in Lower Jurassic Dongyuemiao shale reservoirs. Mar. Pet. Geol. 2019, 109, 268–278. [Google Scholar] [CrossRef]
- Loucks, R.G.; Reed, R.M.; Ruppel, S.C.; Hammes, U. Spectrum of pore types and networks in mudrocks and a descriptive classification for matrix-related mudrock pores. AAPG Bull. 2012, 96, 1071–1098. [Google Scholar] [CrossRef] [Green Version]
- Milliken, K.L.; Rudnicki, M.; Awwiller, D.N.; Zhang, T. Organic matter-hosted pore system, Marcellus Formation (Devonian), Pennsylvania. AAPG Bull. 2013, 97, 177–200. [Google Scholar] [CrossRef]
- Shi, M.; Yu, B.; Zhang, J.; Huang, H.; Yuan, Y.; Li, B. Microstructural characterization of pores in marine shales of the Lower Silurian Longmaxi Formation, southeastern Sichuan Basin, China. Mar. Pet. Geol. 2018, 94, 166–178. [Google Scholar] [CrossRef]
- Singh, H. A critical review of water uptake by shales. J. Nat. Gas Sci. Eng. 2016, 34, 751–766. [Google Scholar] [CrossRef] [Green Version]
- Meng, M.; Ge, H.; Ji, W.; Shen, Y.; Su, S. Monitor the process of shale spontaneous imbibition in co-current and counter-current displacing gas by using low field nuclear magnetic resonance method. J. Nat. Gas Sci. Eng. 2015, 27, 336–345. [Google Scholar] [CrossRef]
- Yang, R.; Hu, Q.; He, S.; Hao, F.; Guo, X.; Yi, J.; Sun, M. Wettability and connectivity of overmature shales in the Fuling gas field, Sichuan Basin (China). AAPG Bull. 2019, 103, 653–689. [Google Scholar] [CrossRef]
- Yang, R.; He, S.; Hu, Q.; Hu, D.; Yi, J. Geochemical characteristics and origin of natural gas from Wufeng-Longmaxi shales of the Fuling gas field, Sichuan Basin (China). Int. J. Coal Geol. 2017, 171, 1–11. [Google Scholar] [CrossRef]
- Pan, J.; Ge, T.; Liu, W.; Wang, K.; Wang, X.; Mou, P.; Wu, W.; Niu, Y. Organic matter provenance and accumulation of transitional facies coal and mudstone in Yangquan, China: Insights from petrology and geochemistry. J. Nat. Gas. Sci. Eng. 2021, 94, 104076. [Google Scholar] [CrossRef]
- Wang, X.; Liu, Y.; Hou, J.; Li, S.; Kang, Q.; Sun, S.; Ji, L.; Sun, J.; Ma, R. The relationship between synsedimentary fault activity and reservoir quality—A case study of the Ek1 formation in the Wang Guantun area, China. Interpretation 2020, 8, SM15–SM24. [Google Scholar] [CrossRef]


| Formation | Longmaxi Formation | Wufeng Formation | ||||||
|---|---|---|---|---|---|---|---|---|
| Samples | Yc01 | Yc02 | Yc03 | Yc04 | Yc05 | Yc06 | Yc07 | Yc08 |
| Depth (m) | 710.8 | 715.4 | 718.3 | 734.6 | 753.7 | 768.3 | 773.3 | 775.4 |
| TOC (wt.%) | 1.03 | 1.15 | 1.01 | 1.3 | 1.16 | 1.13 | 4.34 | 4.79 |
| Silica (%) | 39.9 | 41.2 | 37.2 | 46.3 | 38.4 | 40.1 | 48.1 | 46.3 |
| K-feldspar (%) | 7 | 5.4 | 7.4 | 3.6 | 5.1 | 7.9 | 6.8 | 1.2 |
| Plagioclase (%) | 15.9 | 9.5 | 20.7 | 5.4 | 20.4 | 18.9 | 13.1 | 9.4 |
| Calcite (%) | 8.6 | 1.6 | 7.5 | 1.3 | 3.8 | 5.4 | 2.1 | 8.7 |
| Dolomite (%) | 9 | 1.5 | 5.3 | 1.4 | 11.1 | 8.8 | 8.6 | 5.9 |
| Pyrite (%) | 2 | 4.8 | 1.5 | 3.2 | 1.6 | 1.9 | - | 7.3 |
| Clay mineral (%) | 15.8 | 28.3 | 17.5 | 36.5 | 17.2 | 14.1 | 14.3 | 13.9 |
| Formation | Longmaxi | Wufeng | |||||||
|---|---|---|---|---|---|---|---|---|---|
| Samples | Yc01 | Yc02 | Yc03 | Yc04 | Yc05 | Yc06 | Yc07 | Yc08 | |
| N2 adsorption pore size distribution parameters | BET specific surface area (m2/g) | 3.94 | 6.96 | 2.78 | 7.00 | 6.37 | 6.20 | 7.47 | 7.72 |
| Micro-pores specific surface area (m2/g) | 3.04 | 5.44 | 2.15 | 5.78 | 5.36 | 5.33 | 6.21 | 6.46 | |
| Average pore size (nm) | 5.49 | 7.86 | 8.21 | 4.90 | 6.81 | 7.89 | 4.76 | 5.58 | |
| Fractal dimension (D1 + D2) | 5.2669 | 5.337 | 5.2435 | 5.4989 | 5.3869 | 5.277 | 5.0393 | 4.9794 | |
| Total pore volume (cm3/g) | 0.0027 | 0.0026 | 0.0043 | 0.0026 | 0.0047 | 0.0027 | 0.0039 | 0.0054 | |
| MICP pore size distribution parameters | Rock sample density (g/cm3) | 2.2 | 2.15 | 2.14 | 2.17 | 2.16 | 2.17 | 2.16 | 2.15 |
| Porosity (%) | 1.61 | 1.62 | 2.2 | 1.22 | 1.55 | 1.77 | 2.03 | 1.84 | |
| Total pore volume (cm3/g) | 0.0073 | 0.0076 | 0.0103 | 0.0057 | 0.0072 | 0.0081 | 0.0094 | 0.0085 | |
| Total specific surface area (m2/g) | 0.86 | 0.26 | 0.93 | 0.45 | 0.52 | 0.21 | 0.39 | 0.58 | |
| Average radius (μm) | 3.24 | 4.05 | 3.06 | 3.52 | 3.72 | 3.45 | 3.31 | 3.6 | |
| Formation | Longmaxi | Wufeng | |||||||
|---|---|---|---|---|---|---|---|---|---|
| Samples | Yc01 | Yc02 | Yc03 | Yc04 | Yc05 | Yc06 | Yc07 | Yc08 | |
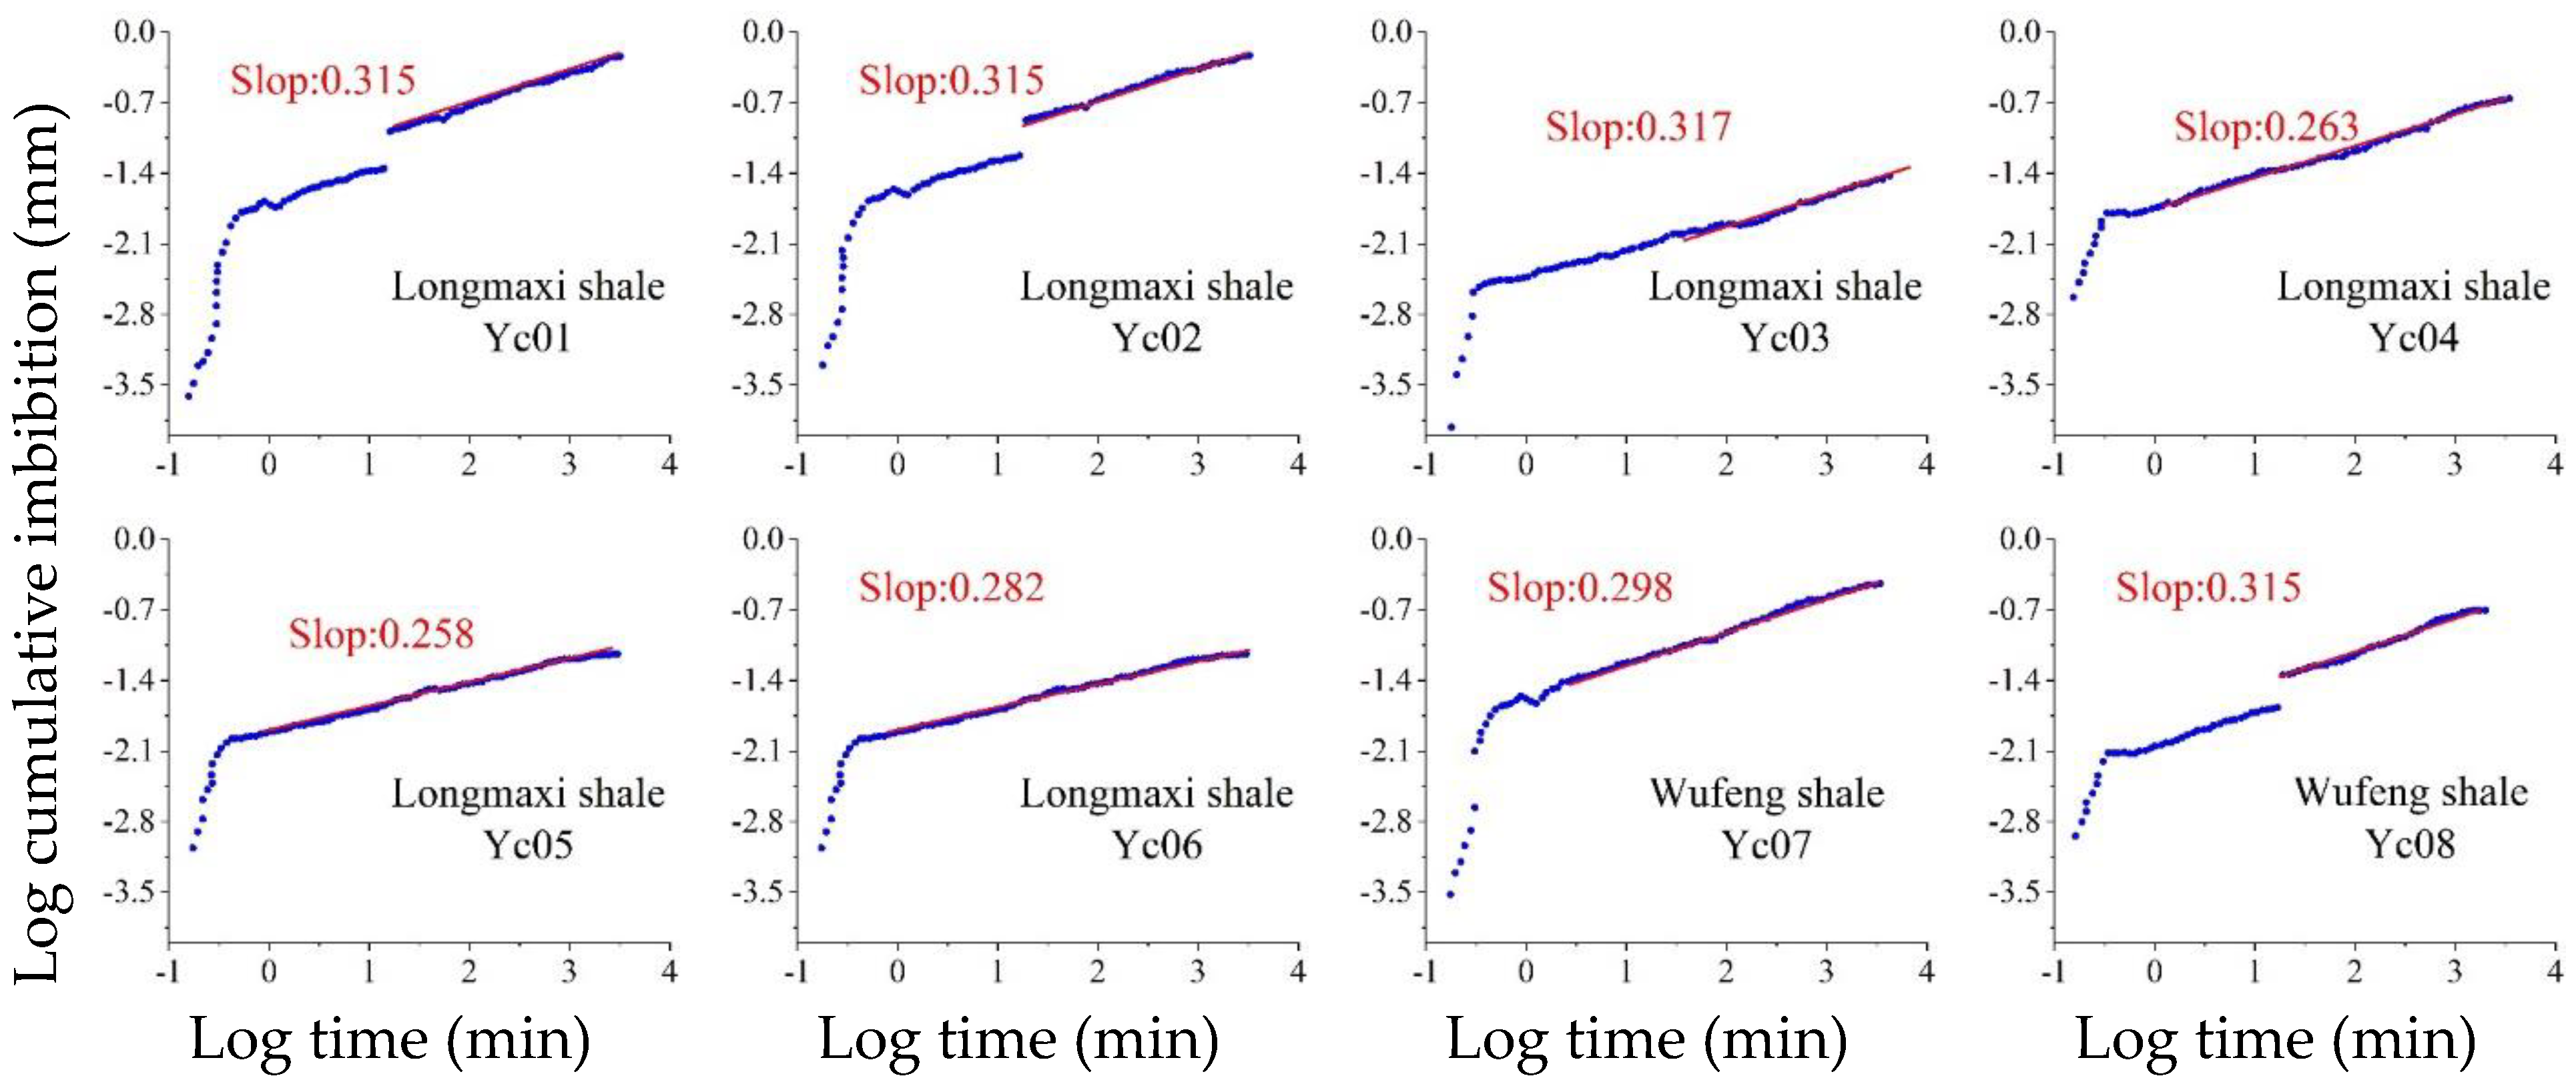
| Self-absorption slop | deionized water | 0.3147 | 0.3147 | 0.3169 | 0.2625 | 0.2576 | 0.2822 | 0.2983 | 0.3153 |
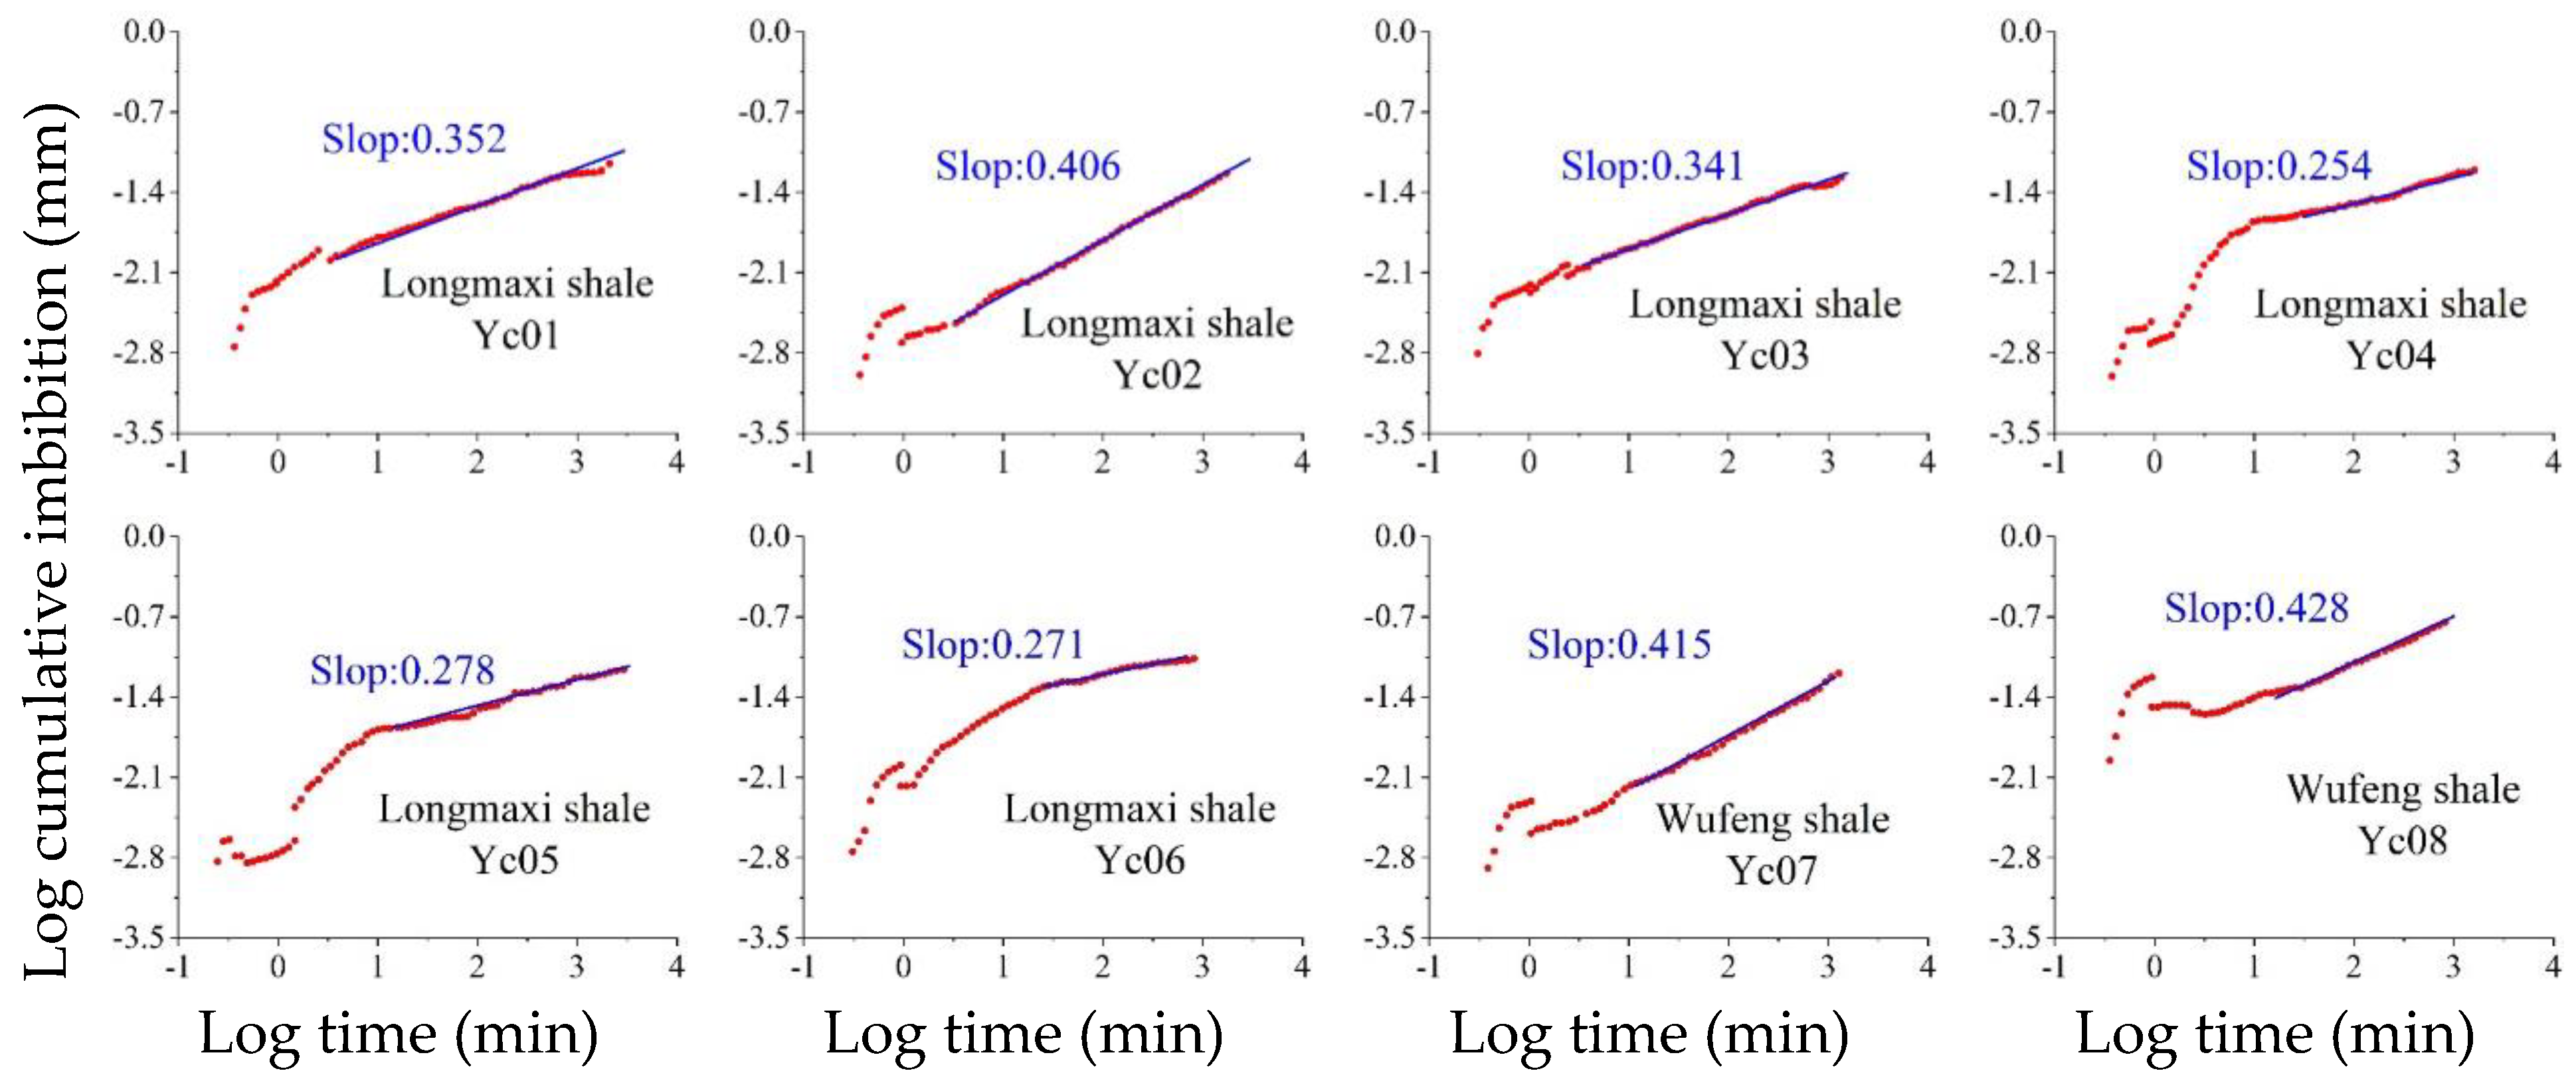
| n-decane | 0.3521 | 0.4061 | 0.3408 | 0.254 | 0.2775 | 0.2708 | 0.4154 | 0.4281 | |
| Hydrophilic pore connectivity | medium | medium | weak | medium | weak | weak | weak | medium | |
| Oilphilic pore connectivity | medium | medium | medium | weak | weak | weak | medium | medium | |
| No. | ΦS (%) | No. | ΦS (%) | No. | ΦS (%) | No. | ΦS (%) | No. | ΦS (%) |
|---|---|---|---|---|---|---|---|---|---|
| LMX01 | 7.96 | LMX10 | 12.67 | LMX19 | 18.14 | WF01 | 21.45 | WF10 | 36.79 |
| LMX02 | 11.35 | LMX11 | 19.44 | LMX20 | 18.45 | WF02 | 17.44 | WF11 | 11.55 |
| LMX03 | 17.66 | LMX12 | 21.22 | LMX21 | 20.54 | WF03 | 16.98 | WF12 | 17.99 |
| LMX04 | 18.13 | LMX13 | 18.46 | LMX22 | 22.36 | WF04 | 15.13 | WF13 | 20.06 |
| LMX05 | 19.24 | LMX14 | 18.81 | LMX23 | 24.78 | WF05 | 17.99 | WF14 | 17.32 |
| LMX06 | 8.96 | LMX15 | 14.31 | LMX24 | 31.05 | WF06 | 19.35 | WF15 | 18.66 |
| LMX07 | 9.17 | LMX16 | 19.77 | LMX25 | 22.07 | WF07 | 17.95 | WF16 | 17.89 |
| LMX08 | 12.55 | LMX17 | 18.99 | LMX26 | 19.14 | WF08 | 16.36 | WF17 | 18.35 |
| LMX09 | 21.05 | LMX18 | 19.54 | LMX27 | 19.12 | WF09 | 18.92 | WF18 | 17.33 |
| Average | 17.96 | Average | 18.75 | ||||||
Publisher’s Note: MDPI stays neutral with regard to jurisdictional claims in published maps and institutional affiliations. |
© 2022 by the authors. Licensee MDPI, Basel, Switzerland. This article is an open access article distributed under the terms and conditions of the Creative Commons Attribution (CC BY) license (https://creativecommons.org/licenses/by/4.0/).
Share and Cite
Zhao, F.; Dong, Z.; Wang, C.; Zhang, W.; Yu, R. Pore Connectivity Characteristics and Controlling Factors for Black Shales in the Wufeng-Longmaxi Formation, Southeastern Sichuan Basin, China. Energies 2022, 15, 2909. https://0-doi-org.brum.beds.ac.uk/10.3390/en15082909
Zhao F, Dong Z, Wang C, Zhang W, Yu R. Pore Connectivity Characteristics and Controlling Factors for Black Shales in the Wufeng-Longmaxi Formation, Southeastern Sichuan Basin, China. Energies. 2022; 15(8):2909. https://0-doi-org.brum.beds.ac.uk/10.3390/en15082909
Chicago/Turabian StyleZhao, Fei, Zaitian Dong, Chaoyong Wang, Wenli Zhang, and Rui Yu. 2022. "Pore Connectivity Characteristics and Controlling Factors for Black Shales in the Wufeng-Longmaxi Formation, Southeastern Sichuan Basin, China" Energies 15, no. 8: 2909. https://0-doi-org.brum.beds.ac.uk/10.3390/en15082909