
Role of On-Site Generation in Carbon Emissions and Utility Bill Savings under Different Electric Grid Scenarios †


Oak Ridge National Laboratory, Building and Transportation Sciences Division, 1 Bethel Valley Road, Oak Ridge, TN 37830, USA
†
This manuscript has been authored by UT-Battelle, LLC, under contract DE-AC05-00OR22725 with the US Department of Energy (DOE). The US government retains and the publisher, by accepting the article for publication, acknowledges that the US government retains a nonexclusive, paid-up, irrevocable, worldwide license to publish or reproduce the published form of this manuscript, or allow others to do so, for US government purposes. DOE will provide public access to these results of federally sponsored research in accordance with the DOE Public Access Plan (http://energy.gov/downloads/doe-public-access-plan , accessed on 6 May 2022).
Energies 2022, 15(10), 3477; https://0-doi-org.brum.beds.ac.uk/10.3390/en15103477
Submission received: 7 March 2022
/
Revised: 22 April 2022
/
Accepted: 7 May 2022
/
Published: 10 May 2022
(This article belongs to the Special Issue Micro-Combined Heating, Cooling, and Power Systems for Buildings: State-of-the-Art, Commercialization Challenges, and Research Opportunities)
Abstract
:Energy-efficient and sustainable technologies are necessary to lower energy and carbon footprints. Many technologies are being pursued to meet the increasing energy demand in buildings. An attractive option is efficient utilization of available energy resources, including renewables, to support current and future building energy needs while targeting grid resiliency, energy, and environmental security at an affordable cost via on-site cogeneration-based approaches. This must include energy-efficient technologies with lower greenhouse gas emissions and optimized cost, performance, and reliability. This paper presents the economic and environmental benefits associated with power technologies such as thermionics and solid oxide fuel cells. Hybrid configurations consisting of heat pumps, power systems, and renewable photovoltaics in cogeneration and trigeneration modes of operation are presented. The role of such technologies in lowering CO2 emissions while improving energy resiliency and serving the needs of underprivileged communities is discussed. The key barriers of affordability and potential solutions for large-scale implementation of these promising technologies are reviewed. Case studies demonstrating the influence of power rating, electrical efficiency, design configuration, carbon dioxide intensity of the grid, and fuel on annual greenhouse gas emissions are presented for residential and commercial buildings.
1. Introduction
Renewable energy generating capacity is necessary to reduce or eliminate the reliance on fossil fuels and curtail the impact of greenhouse gas (GHG) emissions on the climate. However, complementary strategies such as efficient utilization of chemical energy as a bridging solution in meeting near-term carbon goals are necessary for a successful and sustainable energy transition. Low- and zero-carbon fuels, such as renewable natural gas, hydrogen, biogas, and bioethanol, are a major part of the energy landscape for decades to come. According to the US Energy Information Administration, natural gas is still projected to serve the major energy needs of the residential sector in the coming decades [1]. Therefore, serious efforts are required to protect future generations from the impact of climate change induced by continued fossil fuel consumption. These efforts must include affordable energy-efficient technologies to use such primary energy resources as cleanly as possible with low GHG emissions, particularly in regions served by electrical grids with high carbon dioxide intensity.
Of all the economic sectors in the United States, the residential and commercial building sectors together consume 40% [2] of total primary energy, including 75% of total electricity generated [3] and 28% of annual natural gas supply [4], at an annual price of ~$400 billion [5]. This energy demand is projected to increase further owing to economic and population growth. Today, building energy usage accounts for ~35% of total annual CO2 emissions in the United States [6] and 40% globally [7]. Given these energy and environmental impacts and projected growth, technological solutions are needed to reduce the energy demand and carbon footprint of buildings to facilitate energy sector transformation.
Problem: Approximately 30–40% of total energy supplied to buildings goes toward fulfilling the heating needs and the balance is consumed by numerous devices including lighting, small appliances, washers, dryers, and cooking appliances [8]. Most of these needs are typically met by electricity, whereas heating loads are served by either fossil fuels or electricity. In the United States, a sustainable successful transition toward net-zero energy is set to be achieved by 2050 [9,10] and a carbon-free electricity sector is set to be achieved by 2035 [11]; globally, these targets are set to be achieved by 2070 [12]. Realizing this energy transition will require overcoming key challenges such as geopolitical concerns, technological limitations, and financial concerns [13]. Therefore, the pace of transition is anticipated to vary around the world. The electricity supply to the end consumer comes at a premium value and the average and marginal GHG emissions of the local electrical grid in meeting the energy needs of the buildings must be considered. The carbon dioxide intensity of the electrical grid supply is a key parameter until complete transition toward renewable electricity takes place.
Balancing resiliency and decarbonization is a critical challenge of the ongoing energy transition. Transformation of the electric grid transformation with extensive use of intermittent renewable power technologies requires the support of many ancillary technologies including energy storage, on-site polygeneration, and flexible grid-interactive technologies to address growing energy demand, along with the evolution of new energy consumers (e.g., electric vehicles). Buildings can lower direct energy consumption via efficiency improvements in addition to acting as prosumers (on-site generation and storage) in grid stabilization and demand management via grid-interactive technologies, thus facilitating the integration of intermittent renewable energy within the grid infrastructure. A significant reduction in existing buildings’ energy consumption is a first step in this transition, while simultaneously adopting clean renewable technologies. In this regard, polygeneration systems capable of utilizing chemical energy of available resources including renewable fuels (e.g., biogas, hydrogen, power-to-gas fuels) have a significant role to fulfill, particularly in regions with high energy demands (kilowatt-hours per day) and high electric grid carbon intensities (kilograms of CO2 per kilowatt-hour of electricity supplied).
Motivation: The use of chemical energy to sustain building energy requirements to simultaneously lower electrical demand and primary energy consumption while improving energy efficiency, grid resiliency, and carbon footprint of buildings has been investigated by several researchers [14,15,16,17,18]. For instance, a recent work [19] presented a case study with two different micro-CHP configurations in a residential building serviced by the electrical grid at a carbon intensity of 0.299 kg/kWh. The authors showcased the benefits of utilizing such configurations in lowering the carbon footprint as well as utility bills. Similarly, Renau et al., conducted a detailed analysis of a green hydrogen fuel cell based micro-CHP configuration [20] in lowering the environmental burden of the building sector. This study compared different prime movers including fuel cells, internal combustion engines, Stirling engines, and turbines along with different electrical and thermal loads in a region with an electrical grid carbon intensity of 0.331 kg/kWh. Similarly, multiple recent studies also analyzed micro-cogeneration systems in reducing the carbon footprint of the building sector via utilizing different prime movers at different power ratings [13,21,22,23].
One common drawback of the prior work discussed above is that the case studies were conducted for buildings and regions with specific electric grid carbon intensities and load profiles. Prior studies have not examined the effect of the grid’s carbon dioxide intensity on the overall carbon footprint of different energy technologies. The current work aims to fill this knowledge gap by providing an overview of the impact of the grid’s carbon dioxide intensity on the carbon footprint of a particular thermal technology.
More specifically, the work presented here sheds new light on the role of currently available energy technologies to bridge the energy transition via low-carbon fuels and renewable fuels while the grid becomes more environmentally friendly. The main goal of this study is to assess the role of cogeneration and trigeneration systems in lowering the carbon footprint of buildings supplied with grid electricity generated at various carbon intensities. The threshold carbon dioxide intensity of the electrical grid—at which point buildings can have a higher carbon footprint compared with on-site polygeneration technologies—is important to recognize. This work identifies the crossover points of different integrated energy systems that offer lower carbon footprints than state-of-the-art heating technologies.
Hybridization of such technologies with on-site renewable energy and clean fuels (e.g., biogas, hydrogen), integration with energy-efficient heat pumps, and use of energy storage technologies are also considered. The main objective of this study is to analyze and compare the influence of the cogeneration system’s prime mover’s power rating, electrical efficiency, and design configuration along with the key parameter of the carbon dioxide intensity of the electrical grid and fuel on annual GHG emissions.
The rest of the paper is organized as follows: Section 2 describes the methodology chosen for analyzing different energy configurations; Section 3 presents primary findings of the study derived from the applied method and is divided into two key building categories—residential and commercial. Additionally, this section discusses what each of the observed results mean in terms of their applicability in different scenarios. Section 4 provides a summary of key findings as well as recommendations for sustainable energy solutions.
2. Methodology
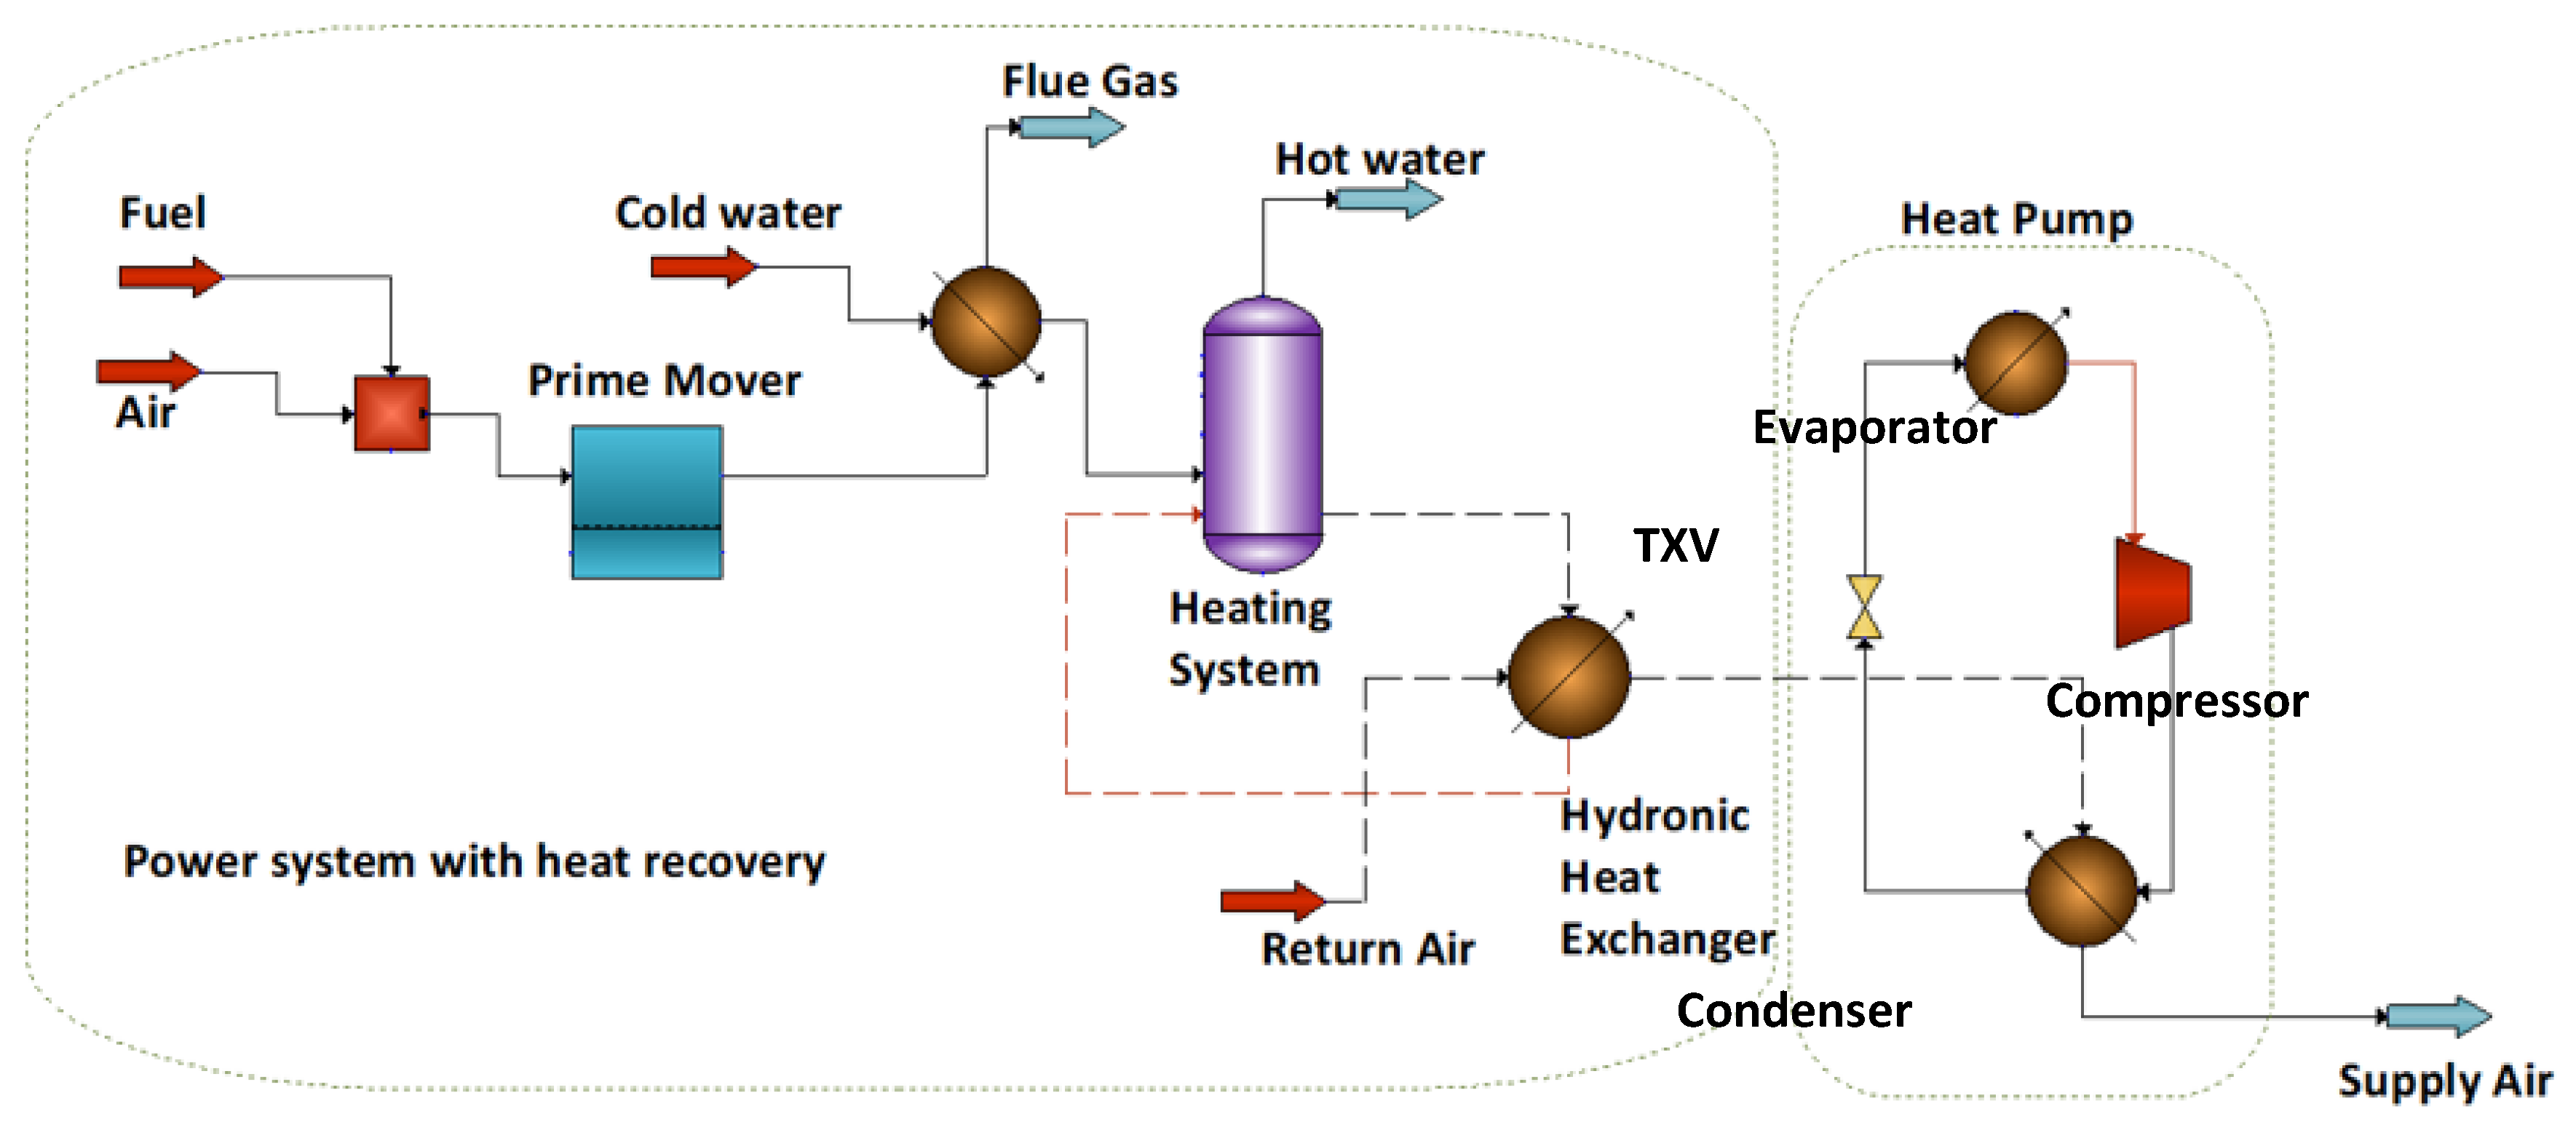
The primary modeling approach involved thermodynamic modeling of the combined energy system, including the power generation module, using the process simulation software package ChemCAD (Version 7.1) to calculate the useful thermal and electrical output. The Peng–Robinson equation of state was used for the global K-value and enthalpy models were used in the process simulation models. CHEMCAD is a powerful and flexible chemical process simulation environment. It combines a state-of-the-art graphical user interface (GUI), an extensive chemical component database, a large library of thermodynamic data, and a library of the most common unit operations. This software package is capable of modeling continuous, batch, and semi-batch processes, and it can simulate both steady-state and dynamic systems while providing an extensive array of the most up-to-date thermodynamic methods for performing heat and material balances. The primary energy sources considered involved natural gas and/or hydrogen. The effects of different configurational aspects with solid oxide fuel cells (SOFCs), thermionic emitters (TIEs), and heat pumps were studied in buildings consuming various degrees of thermal energy for hot water or space heating or both. The model accounted for complete conversion of the fuel while exchanging the thermal energy generated (after electric power generation) in a primary heat exchanger, serving the thermal loads. Figure 1 displays the thermodynamic model used in this study. The dotted lines in Figure 1 represent integration of the cogeneration configuration with a heat pump system in a commercial building. Primary components in these configurations included the following:
- Gibbs free energy minimization reactor (fuel reformer for SOFC or combustion module for TIE).
- Primary heat recovery: heat exchanger.
- Electrical heat pump consisting of a compressor, expansion valve, condenser, and evaporator heat exchangers.
- Power generation core (prime mover: SOFC, TIE).
The Gibbs reactor is based on the principle that at chemical equilibrium the total Gibbs energy of the system has its minimum value. By attempting to minimize the total energy of the system, individual equilibria constants are not considered. Rather, the possible reaction species are noted and the distribution of these species is established using a general mathematical technique to give a minimum free energy for the system. Thus, for any reaction system, all important species are noted and the solution is carried out without prior knowledge of the chemistry of the system. The achieved solution satisfies all expected equilibria and is accurate within the limits of the thermodynamic data. The prime mover was simply modeled by assuming a certain percentage of enthalpy as electrical power output, while the rest is supplied downstream as thermal energy.
The heat exchanger module is used to simulate an exchanger with one or two input streams. For one input stream, the exchanger serves as a heater or a cooler with either a stream temperature or heat duty as inputs. For an exchanger with two input streams, a thermal specification such as the temperature of one of the output streams or heat duty or temperature difference is specified. The exchanger module calculates the thermal condition of the other unspecified stream to maintain material and energy balance of the operation. The overall heat transfer coefficient, U, or area can also be calculated if one of them is specified, assuming ideal heat transfer. The prime mover is a combination of the Gibbs reactor and the heat exchanger. The heat exchanger portion of the prime mover is modeled by specifying heat duty representing electrical output at a specific electrical efficiency of the total fuel energy supplied. This allows complete energy balance where a portion of the primary energy is removed as electrical energy (specified heat duty), while the remaining energy is assumed as useful thermal energy and processed further downstream. The heating system is simply a dynamic vessel acting as a storage tank, where vessel holdup in a dynamic fashion is modeled. The compressor module simulates an isentropic or polytropic compressor operation, where the actual work and efficiency is specified and the output pressure as well as output stream conditions are calculated. The valve (TXV) unit operation performs an adiabatic flash calculation at the output pressure on the input stream, where the outlet stream’s temperature and vapor fraction are calculated based on the output pressure specified.
Since the main objective of this study was to compare the overall energy balance and useful energy provided by each energy configuration analyzed, the key parameter includes primary energy provided by individual providers—fuel and electricity. Given the focus on GHG, energy providing equipment was compared in terms of the carbon dioxide factor for each configuration.
Major design variables consisted of kilowatt rating of the power device; electrical efficiency of the power core; carbon dioxide intensity of the grid power supply and fuel; and thermal load of the building.
The electrical efficiency of the power module was varied from 20% to 40% and the waste heat recovery efficiency was assumed to be approximately 85% for SOFC-based systems and 90% for TIE-based systems. The hot water storage tank energy loss and hydronic heat transfer loss (if utilized) were assumed to be 20% each. The higher heating value of natural gas was assumed as 36.6 MJ/m3, and the coefficient of performance (COP) of the heat pump was assumed to be 3. Source-to-site distribution losses for both electricity and fuel supplied to the building were not considered in this study. The use of renewable energy (photovoltaics (PV)) was considered at a relatively small power scale of 0.25–1 kW (to lower capital costs) as an auxiliary resource to complement the primary energy source (cogeneration or heat pump system) in supporting grid resiliency and lowering the carbon footprint. The solar profile was simplified by assuming 5 h of irradiation at rated capacity since its function was to show the influence of using a solar resource on carbon footprint and utility costs.
The carbon dioxide emissions reduction was calculated based on the carbon factor (kilogram of CO2 emitted per unit of fuel or kilowatt-hour of grid electricity) for the electrical grid supply and the local fuel consumption associated with the power device and the thermal load. For each configuration investigated, the thermodynamic model provided the total fuel consumption (m3) and amount of electricity produced onsite (kWh). The net annual emissions reduction (CO2,savings, kg/year) was calculated according to Equation (1) by considering the carbon factor (CO2,grid, kg/kWh) of the electrical grid, annual utility grid purchase offset (kWhgrid sales) owing to on-site generation between cogeneration and PV (if utilized), carbon dioxide intensity of the fuel (CO2,fuel = 10.55 kWh/m3 for natural gas), and the difference in annual energy consumption between the baseline configuration and the cogeneration equipment (m3fuel savings).
Operational expenditure savings ($savings) were calculated according to Equation (2) by considering the net expenses associated with annual on-site fuel consumption reduction (m3fuel savings), annual utility grid purchase offset (kWhgrid sales), and cost of grid electricity ($grid, $/kWh). Fuel savings were calculated based on the difference in primary energy consumption estimated by the thermodynamic model.
3. Results and Discussion
Cogeneration and trigeneration systems capable of utilizing available fuels, including renewable fuels (e.g., biogas, hydrogen, power-to-gas fuels) and energy-efficient on-site power and thermal sources play a significant role in certain regions, such as in locations where the electrical grid has relatively high carbon intensities. Additionally, regions with high seasonal thermal loads in cold climate regions can impose a significant strain on the grid during peak demand periods, leading to higher marginal emissions. Considering these factors, the impact of the cogeneration system’s design configuration on carbon reduction potential and annual utility bill savings was assessed for residential and commercial buildings. The findings are organized into residential and commercial building categories, with the key difference being the total amount of energy consumed and the difference in electrical vs. thermal energy demand.
3.1. Residential Buildings
The influence of the cogeneration system’s electrical power rating on CO2 reduction in a residential building application has been shown [24]. In the previous study, when the power rating of the small-scale combined heat and power system was increased beyond 0.4 kW, excess thermal and electrical energy increased significantly. Hence, in the current study, the analysis was further extended for a 0.2 kW prime mover with an electrical efficiency of 20% and a heat recovery efficiency of 90% operating continuously and integrated with 2 kWh electrical energy storage to compare with a heat pump heating system (COP 3). Such a cogeneration system was considered for supplementing 20 kWh of thermal load per day in a residential building (typical domestic hot water energy demand in cold climate regions [25]) being serviced by the electrical grid with varying carbon intensities of 0.1 to 0.9 kg CO2/kWh of electricity produced and cost of electricity of $0.08/kWh to $0.27/kWh. TIE-based systems are suitable for such applications [26], particularly in conjunction with thermal storage technologies.
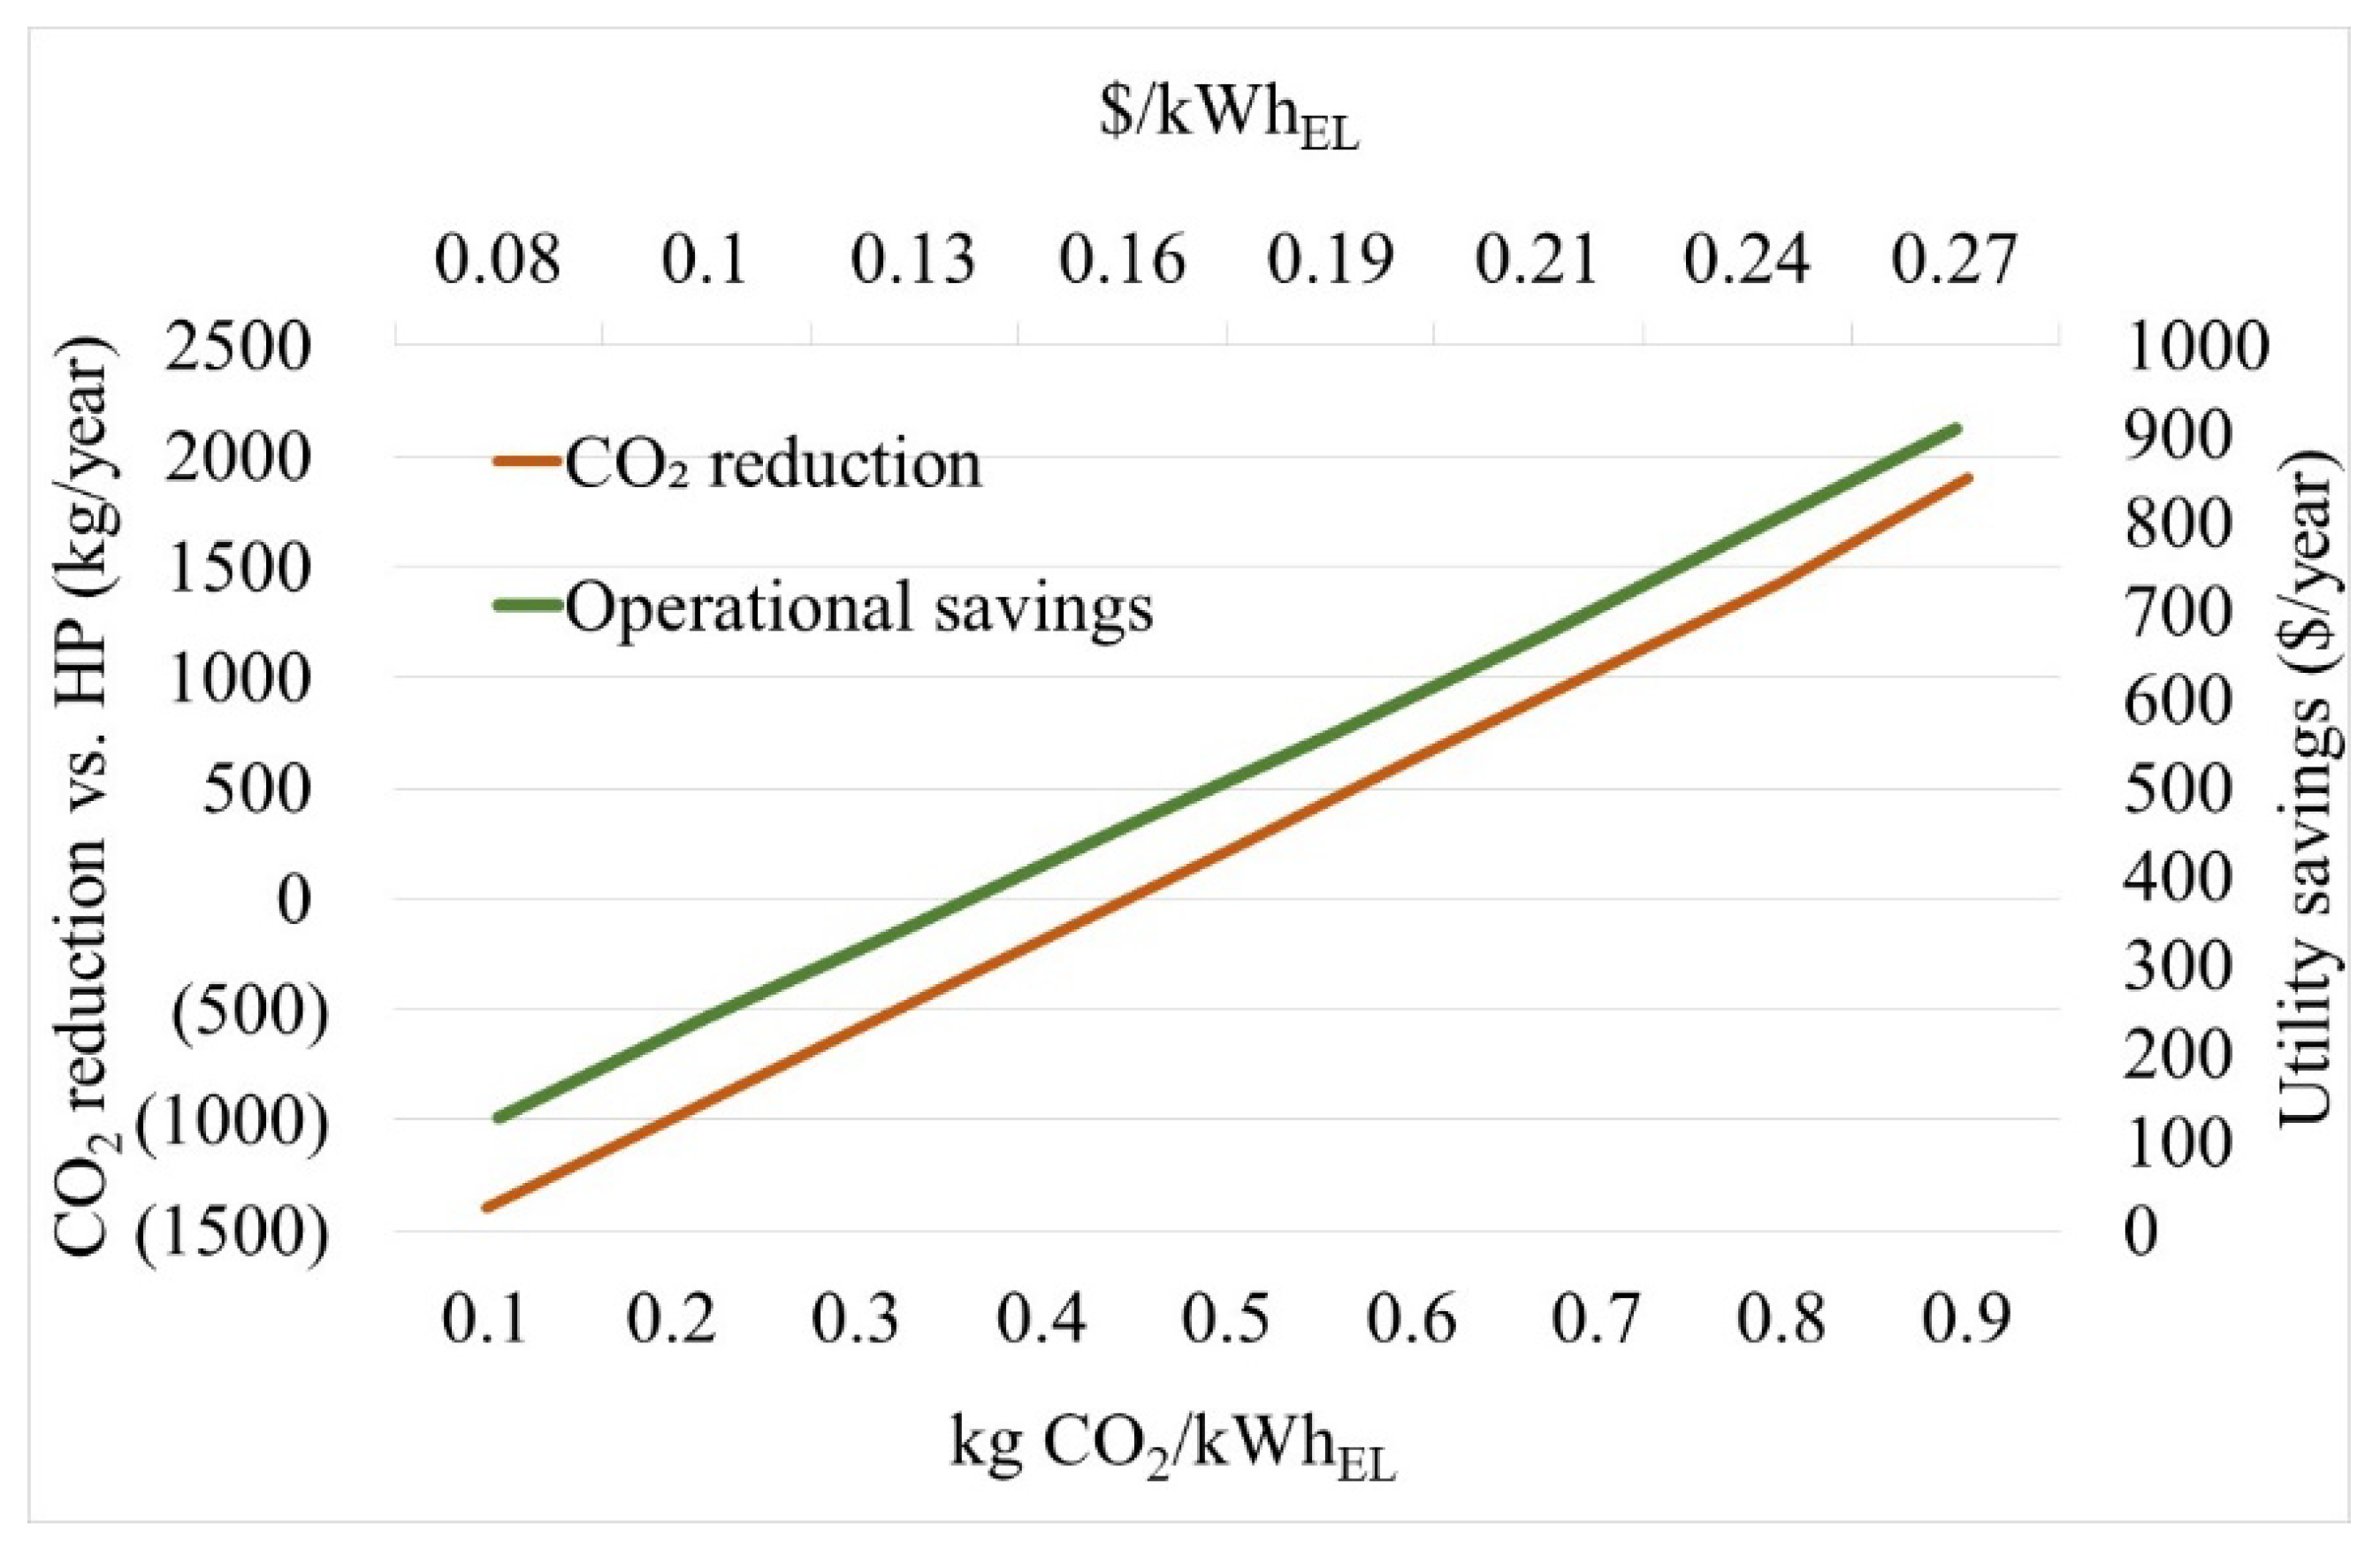
As shown in Figure 2, the annual CO2 reduction capacity of the 0.2 kW cogeneration system reaches 2000 kg at a grid carbon dioxide intensity of 0.9 kg/kW; however, no savings are achieved at a grid carbon dioxide intensity of 0.44 kg/kWh. The presence of such a cogeneration system does not offer environmental benefits at grid carbon intensities below 0.4 kg/kWh, although the annual utility bill savings reach nearly $900 at electricity costs of $0.27/kWh. Since the thermal energy is one of the significant loads in a building, it is important to consider the carbon intensity of the electrical grid in the case of utilizing highly efficient electrical heat pumps. As shown in Figure 2, as the electrical grid’s carbon intensity increases beyond 0.45 kg/kWh, the 0.2 kW cogeneration system proves to be the energy efficient approach rather than a heat pump. However, for buildings in locations served by cleaner electrical grids with carbon intensities below 0.45 kg/kWh the heat pump based thermal providers are the most effective in lowering the carbon footprint.
The heat to power ratio of the prime mover plays a significant role in the combined efficiency of the on-site energy source while being able to meet the electrical and thermal loads. The prime mover considered in Figure 2 assumes a low electrical efficiency of 20%, typical of TIE based devices. Such devices are suitable in primarily meeting the thermal load demand, while the electrical power output is the secondary energy stream. However, in regions with low thermal demand and high electrical demand, a high electrical efficiency prime mover is the optimal energy solution. SOFCs have been proven to supply electrical and thermal energy at a wide range of ratios and offer flexibility in meeting the dynamic load encountered both daily and seasonally. Hence, a high-efficiency SOFC-based prime mover was considered in conjunction with 2 kWh electrical energy storage. The electrical efficiency was assumed to be 40% [27] and the heat recovery efficiency was assumed to be 85%, servicing a residential building consuming 15 kWh of electrical load and 10 kWh of thermal load per day. Such electrical loads are representative of residential buildings in most climate regions and the thermal load is typical of hot water demand in warm to mild climate regions. Table 1 displays the CO2 reduction potential of such a configuration at different electric grid carbon intensities in comparison with an all-electric building, a grid plus a natural-gas- supported building, and a grid plus a heat-pump-supported building. These three scenarios are relevant in the ongoing energy transition as buildings currently utilize one of these three solutions in addressing various energy needs.
The on-site cogeneration system offers significant environmental benefits in buildings serviced by the electric grid with CO2 intensities above 0.2 kg CO2/kWh. Such a system also offers CO2 reduction potential in buildings that already use natural gas for thermal needs. In comparison with heat pumps, the cogeneration configuration offers benefits above grid CO2 intensity of 0.4 kg CO2/kWh. As shown in Table 1, buildings currently utilizing either natural gas or electricity (without heat pumps but ohmic heating) are the ones which benefit the most in terms of carbon reduction potential with an onsite cogeneration system in regions served by electrical grid with carbon intensity above 0.3 kg/kWh and 0.2 kg/kWh, respectively. Electrical heat pump is the preferable solution if serviced by the electrical grid with carbon intensity below 0.4 kg/kWh.
Given the environmental benefits of the SOFC-based cogeneration system, hybridization with PV was considered to further assess the ability to improve the decarbonization potential while enhancing the resiliency. An installed PV capacity of 0.25–1 kW was considered for the cogeneration system and the electrical storage capacity was increased to 3 kWh. Comparative cases included an all-electrical grid-supported building (electrical resistance-based heating for thermal load) and an electrical grid plus heat pump system with and without PV. One of the key objectives in this case study was to lower the installed PV capacity and energy storage capacity to help lower the overall capital costs. The energy supply from PV was simplified by assuming 5 h (equivalent) of solar irradiation per day at installed capacity.
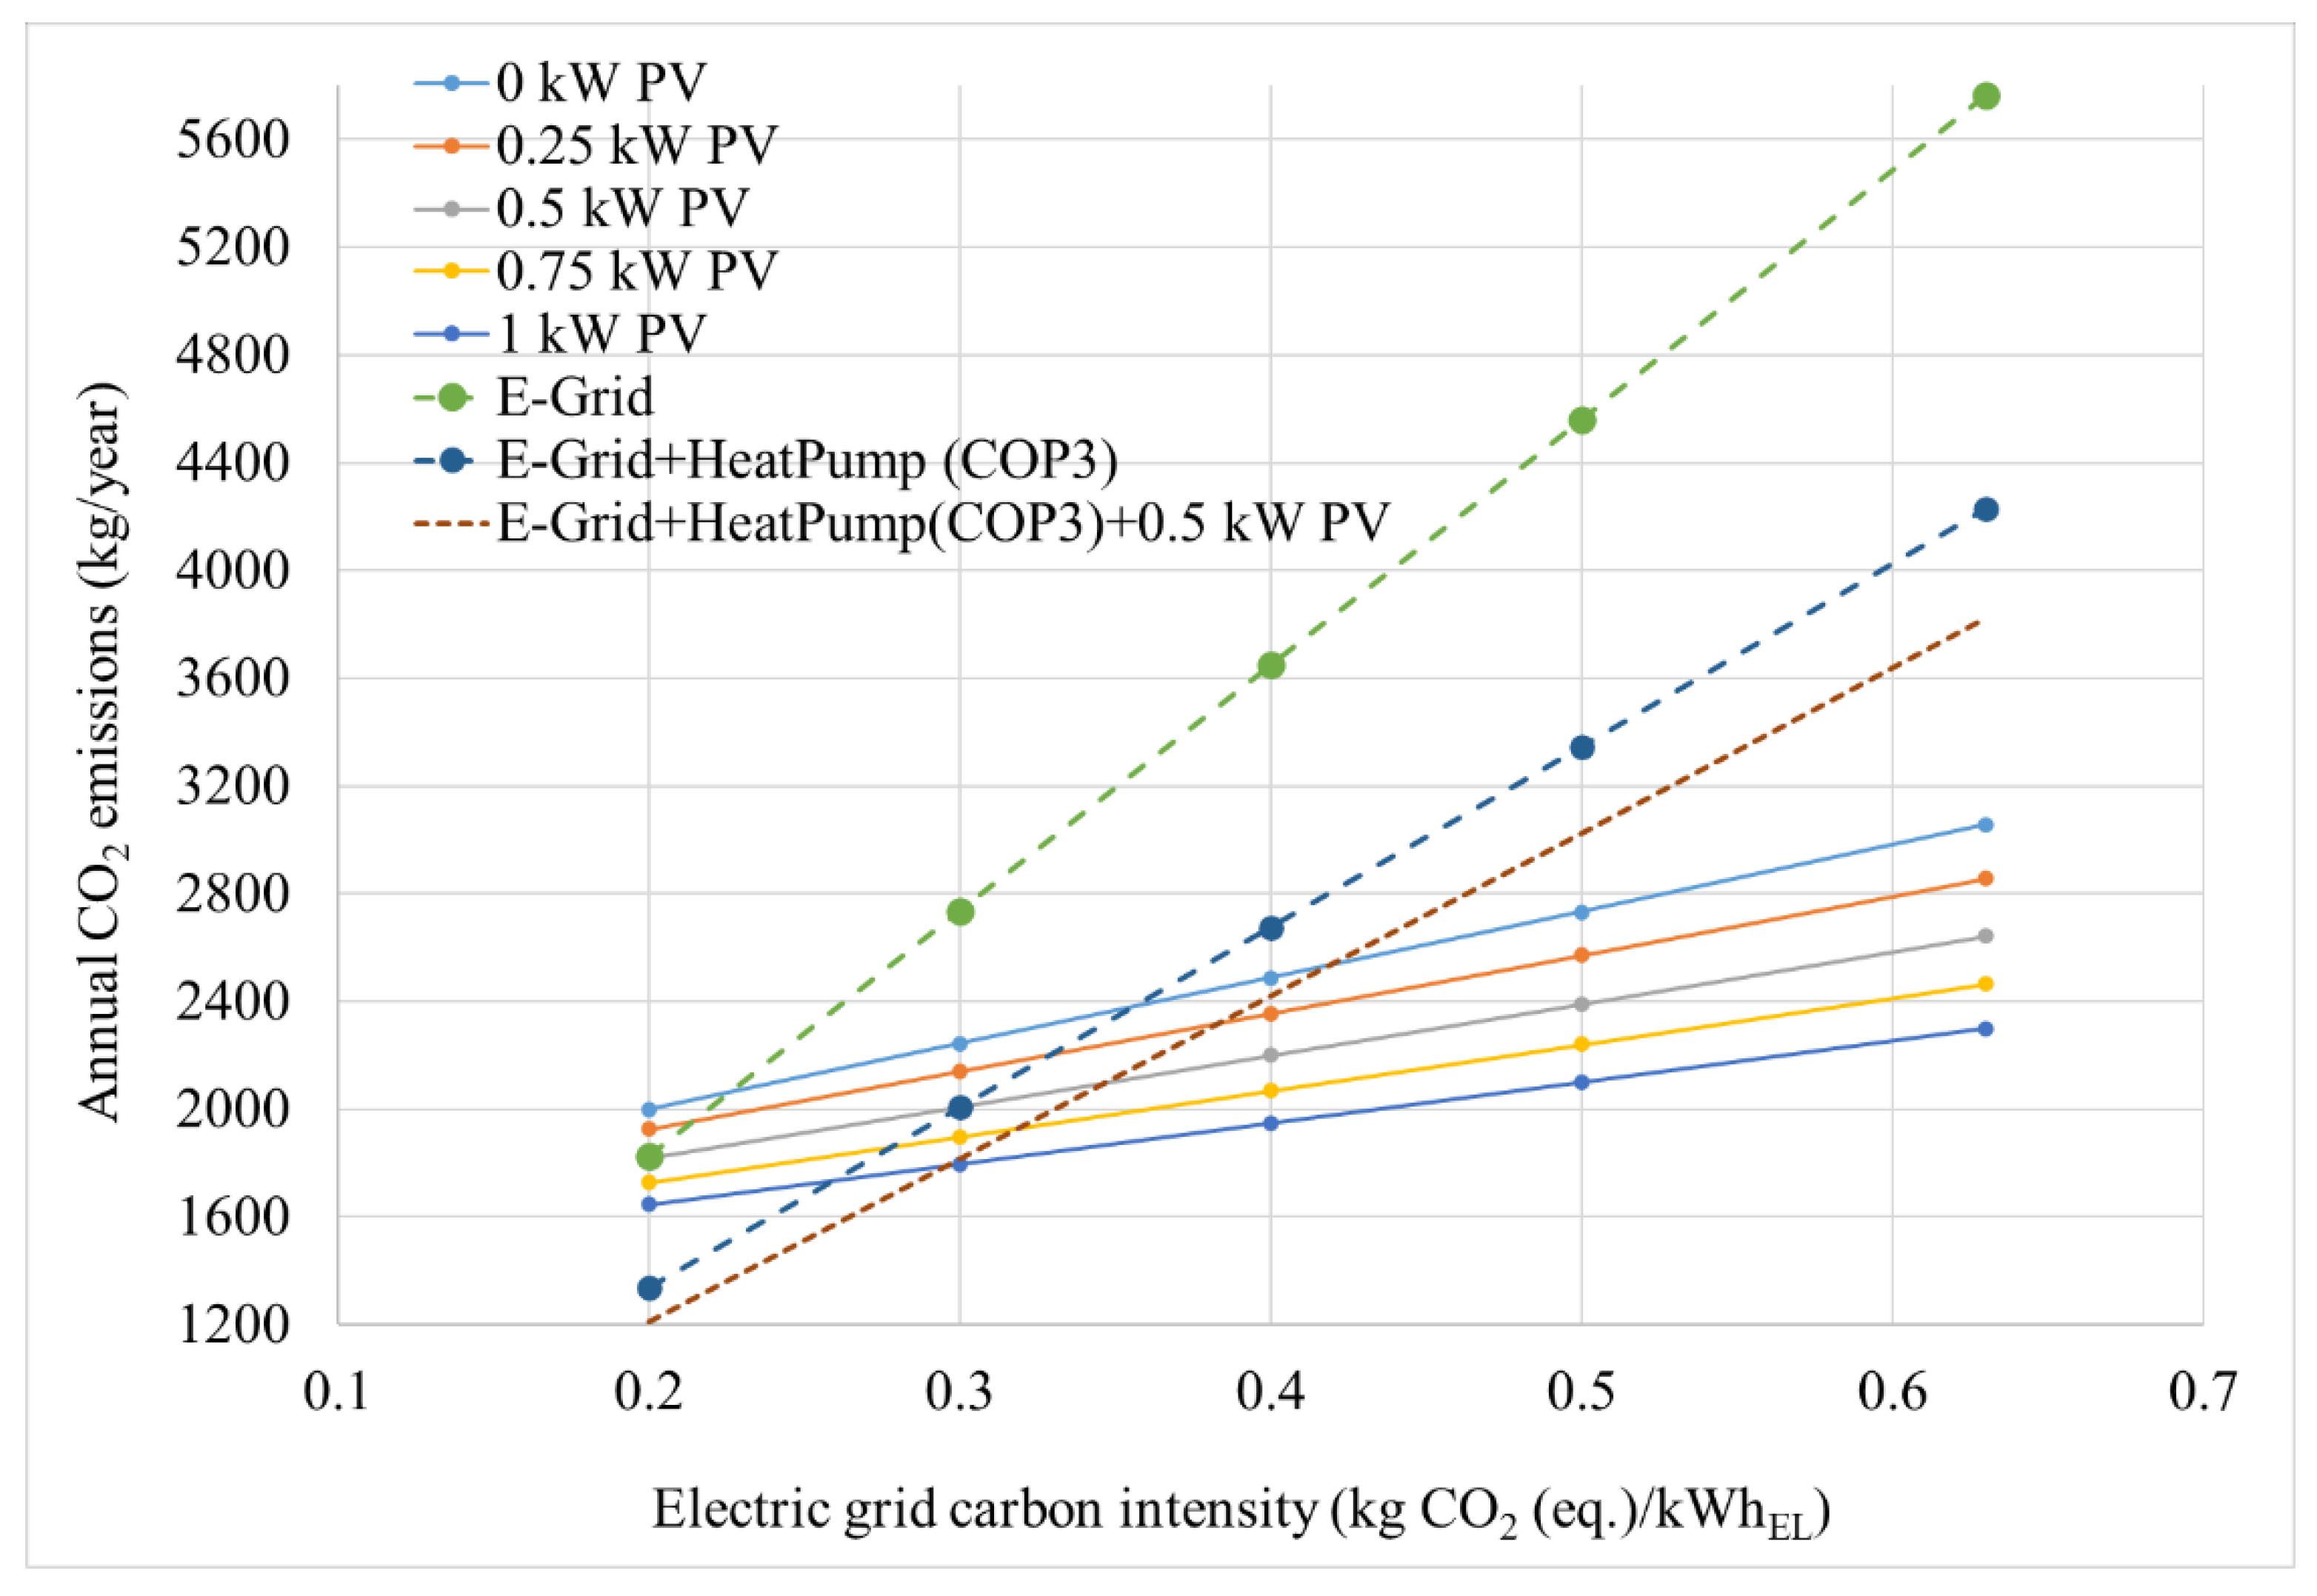
The effect of combining renewable PV with the cogeneration system was analyzed by assuming solar PV utilization. Case studies with heat pump (COP of 3) and cogeneration (electrical efficiency of 40% and heat recovery efficiency of 85%) systems were conducted in a building consuming 25 kWh/day of total energy, including 10 kWh/day of thermal energy. PV power output was varied between 0 and 1 kW in cogeneration systems and was fixed at 0.5 kW for the heat pump case. Figure 3 shows the carbon reduction potential of each configuration analyzed. Transformation of the electrical grid with higher contributions from renewable energy sources continuously lowers the effective carbon dioxide intensity of the grid; therefore, the carbon footprint analysis was conducted with CO2 intensities in the range of 0.1 to 0.63 kg CO2/kWh of electricity produced by the grid. Figure 3 displays the annual CO2 emissions generated from such a building being served by an electrical grid with different CO2 intensities. The prime mover was allowed to modulate its power output by up to 50% owing to the presence of PV generation. The solid lines displayed in Figure 3 represent cogeneration configurations with different PV power ratings. As shown, the CO2 emissions varied between 1.6 and 3.0 MT, gradually increasing with decreasing PV capacity and increasing grid carbon dioxide intensity. The dotted lines represent electrical/heat pump systems with and without 0.5 kW PV. The residential building with an electrical grid as the only primary energy resource had the highest carbon footprint of all the cases. The addition of a heat pump with a COP of 3 significantly lowered the carbon footprint and the addition of 0.5 kW PV further decreased the footprint to ~1200 kg of CO2 per year at a grid carbon dioxide intensity of 0.2 kg/kWh and ~3800 kg of CO2 per year at a grid carbon dioxide intensity of 0.63 kg/kWh. In comparison, the cogeneration system with the same 0.5 kW PV offered a lower carbon footprint at electric grid carbon intensities up to 0.35 kg/kWh. Increasing the PV capacity to 1 kW in the hybrid cogeneration configuration yielded a lower carbon footprint than the hybrid PV heat pump system at grid carbon intensities of up to 0.3 kg/kWh. The median carbon dioxide intensity of the electrical grid in the United States in 2020 was ~0.4 kg/kWh [28]. One key observation from Figure 3 is the crossover point between electrical and gas-based cogeneration systems. As the grid’s carbon dioxide intensity decreased below 0.3 kg/kWh, heat pump systems offered the best environmental benefits. For instance, the hybrid PV heat pump system had higher CO2 emissions than the hybrid cogeneration system up to carbon intensities of 0.35 kg/kWh, below which the heat pumps performed better. Another important factor to consider in the application of efficient building energy solutions is the true carbon footprint of the electrical grid rather than the average value. All the described analyses assumed an average carbon dioxide intensity rather than the marginal emissions factor, which can be significantly higher owing to the use of inefficient and fossil fuel based grid-scale power generation during peak demand periods, both daily and seasonally. The environmental impact of higher marginal emissions can further shift the crossover point to higher carbon dioxide intensity values than that shown in Figure 3. In light of this, it is clear that opportunities exist for cogeneration systems in regions with above-average carbon intensities, irrespective of the primary energy source supplied to the building. This observation is particularly applicable in cold climate regions with high seasonal heating loads, where marginal emissions tend to be significantly higher during the peak demand periods and PV capacity is generally lower. Additionally, the adoption of such cogeneration configurations also improves the energy resiliency in locations with vulnerable grids and helps address the imbalances between electrical supply and demand. However, cogeneration systems do not offer any benefits if the carbon intensity of the electrical grid is low and the grid is resilient enough to address dynamic load shift.
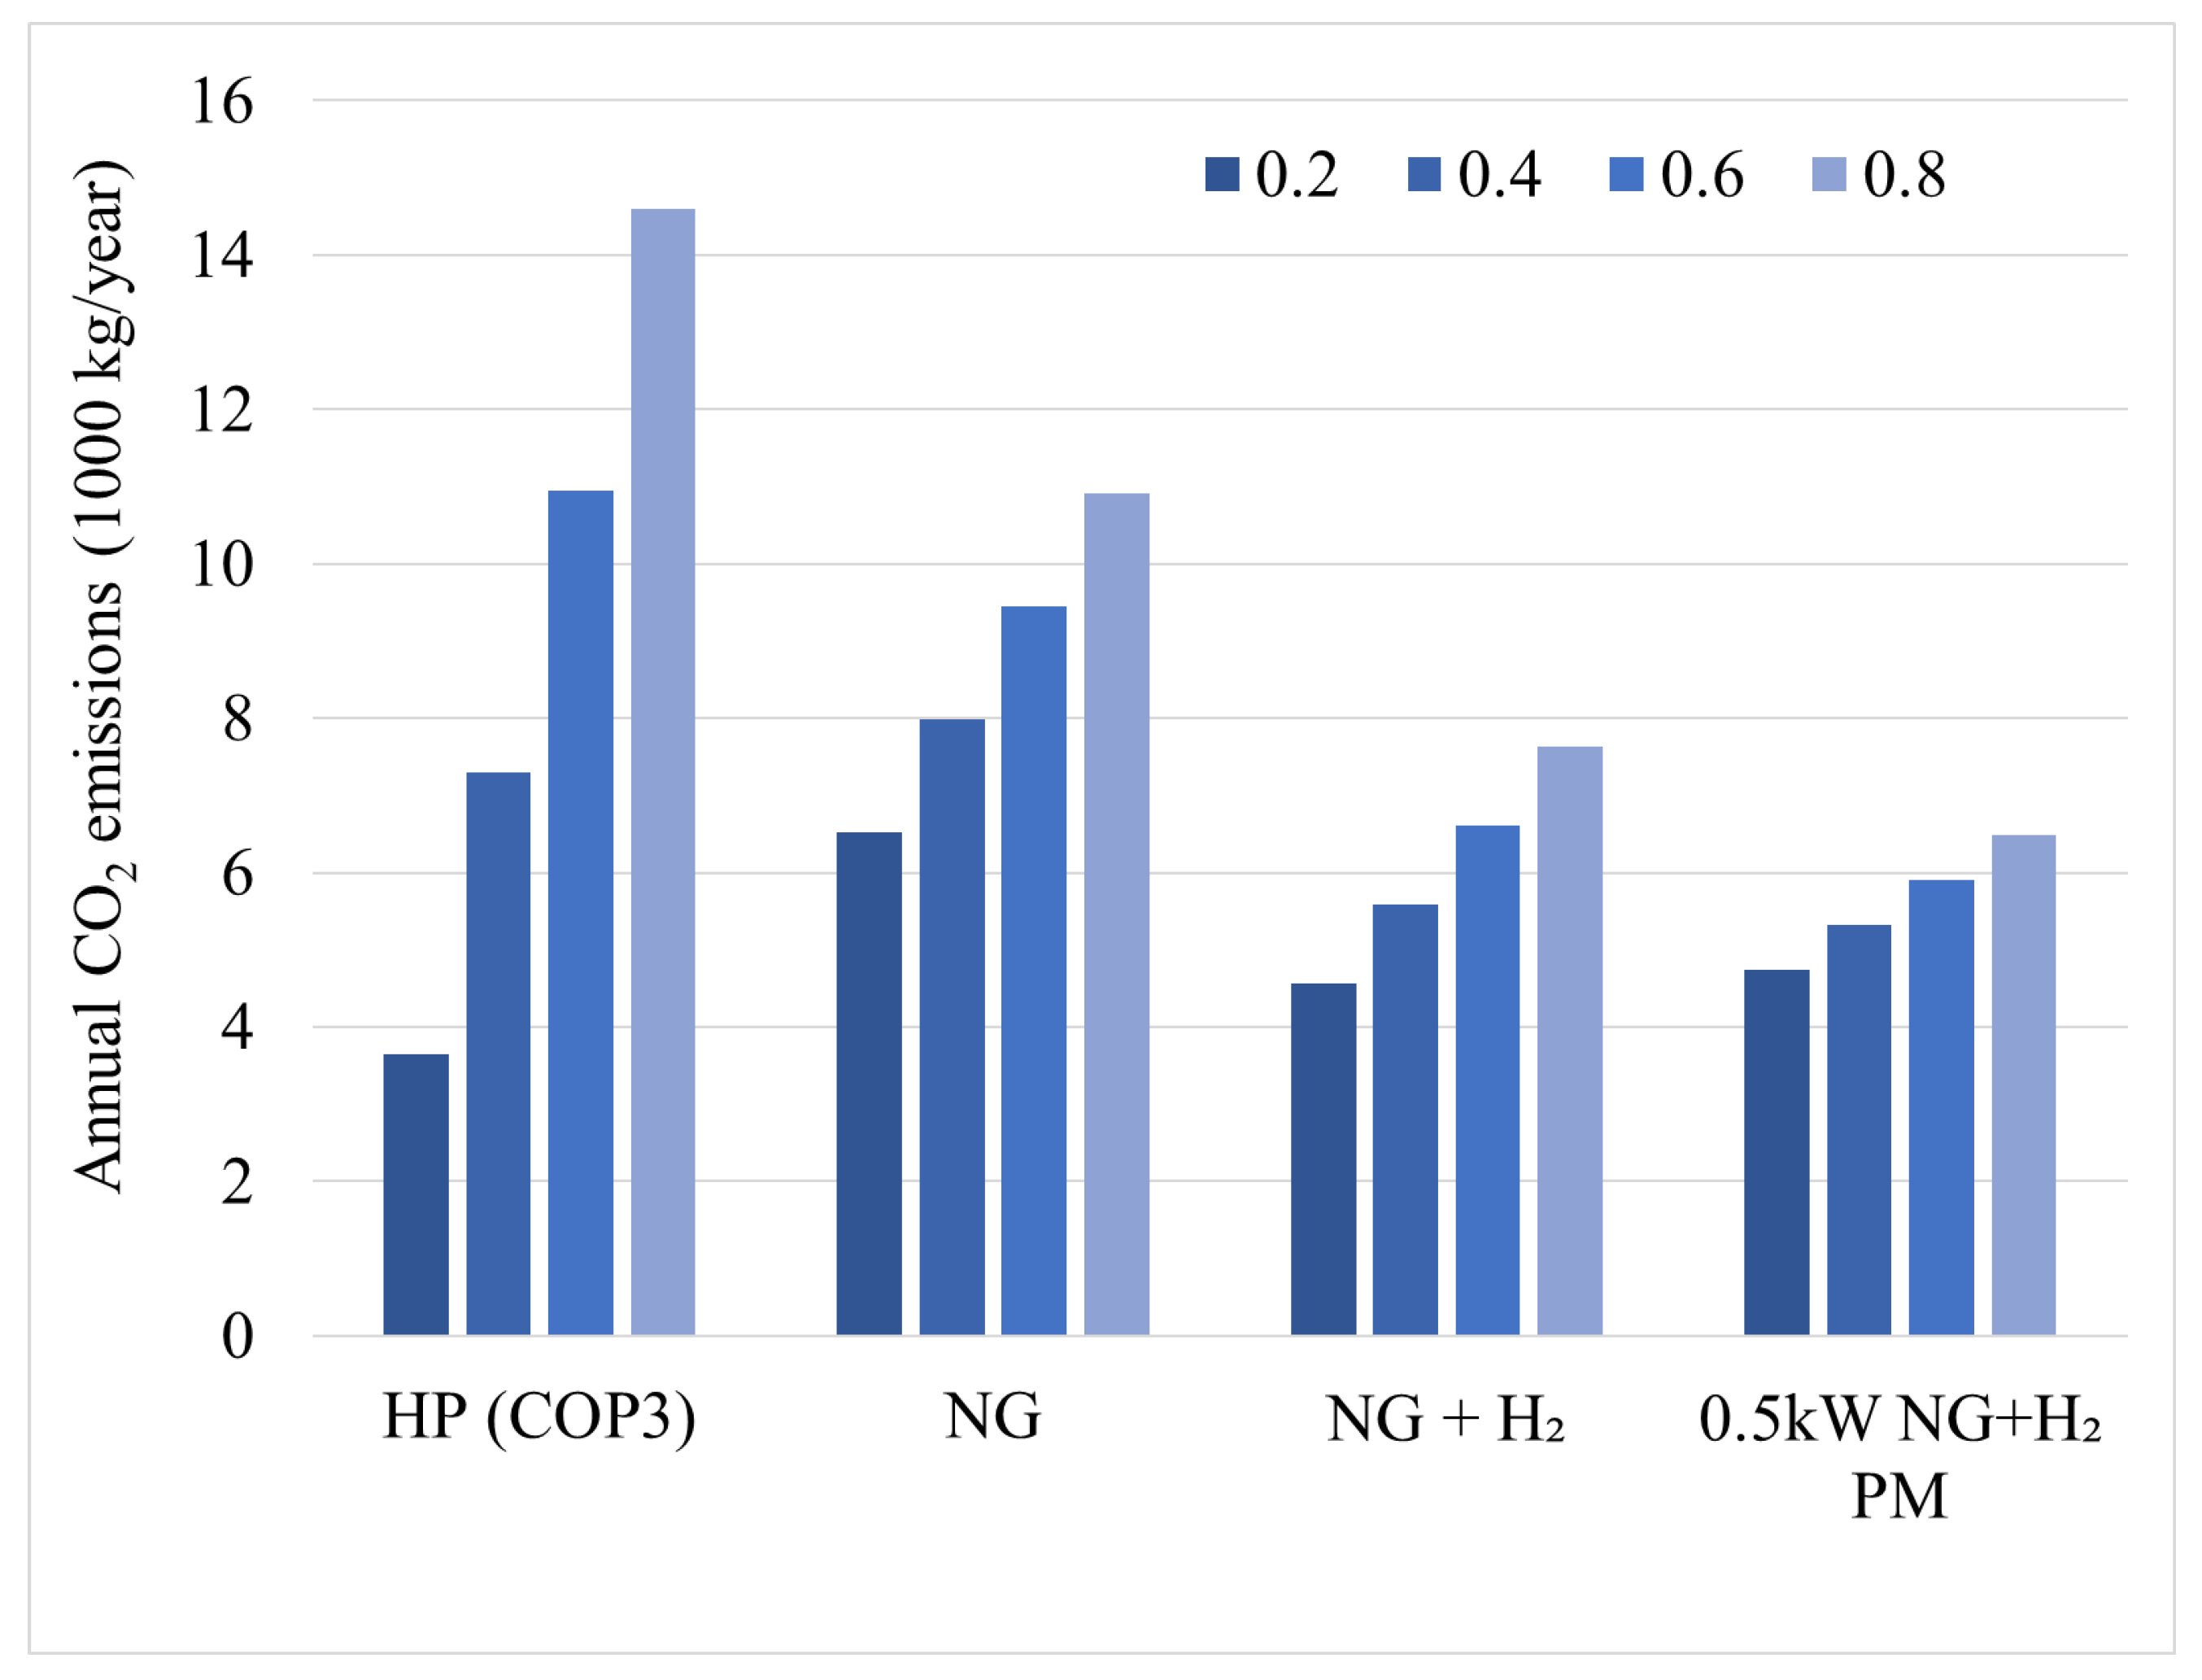
When considering different energy-efficient technological solutions for building applications, the transformation of energy supply and demand must be considered. Some of the factors that will be affected by this transition include: (1) increased electrical loads owing to the adoption of new energy consumers within a building (e.g., electric vehicles, electrical heating); (2) adoption of low-carbon fuels (e.g., renewable hydrogen); (3) seasonal, geographical, and time-of-day variance in an electric grid’s carbon dioxide intensity; and (4) regional infrastructure limitations. In light of these aspects, the analysis presented in the previous subsections was updated by considering a higher daily energy demand of 30 kWh of electrical energy and 60 kWh of thermal energy in a building. The primary energy providers considered were electrical, gas, and cogeneration systems. A heat pump was considered with a COP of 3, gas-based heating with both natural gas and 30% renewable hydrogen blended with natural gas, and a cogeneration system with electrical efficiency of 30%. The methodology used in the previous subsections was adopted in this analysis as well and the electric grid’s carbon dioxide intensity was varied from 200 to 800 gCO2/kWhEL, as shown in Figure 4. In comparison with electrical heat pumps, natural gas-fired heating equipment does not offer any environmental benefits until the grid carbon dioxide intensity exceeds 0.55 kg/kWh. The use of low-carbon fuels was also investigated by considering 30% renewable hydrogen blended with natural gas. The blended compositions offered lower the annual carbon footprint at grid carbon intensities above 0.4 kg/kWh. The use of a 30% electrical efficient prime mover capable of operating on such a blended fuel further lowered the annual carbon footprint at all grid carbon intensities except 0.2 kg/kWh.
The impact of energy consumption on the environment significantly shifts the way in which the energy needs of an average consumer will be met. Thermal needs of a building include hot water and space heating, ranging from ~5 to 400 kWh/day [25] depending on the season, climate zone, and building size. Higher efficiency standards are met via advanced technological solutions such as condensing hot water tanks, tankless hot water systems, and heat pumps. Furthermore, the desire to achieve a net-zero carbon footprint in buildings is propelling the electrification of heating equipment. The energy transition must not impose financial or site modification burdens on the end customer; therefore, affordability, retrofittability, and the ability to replace as a drop-in technology are some of the critical factors to ensure a successful transition toward sustainable clean energy with equitable participation by all sections of the consumer sector, including underprivileged and underserved communities.
3.2. Commercial Buildings
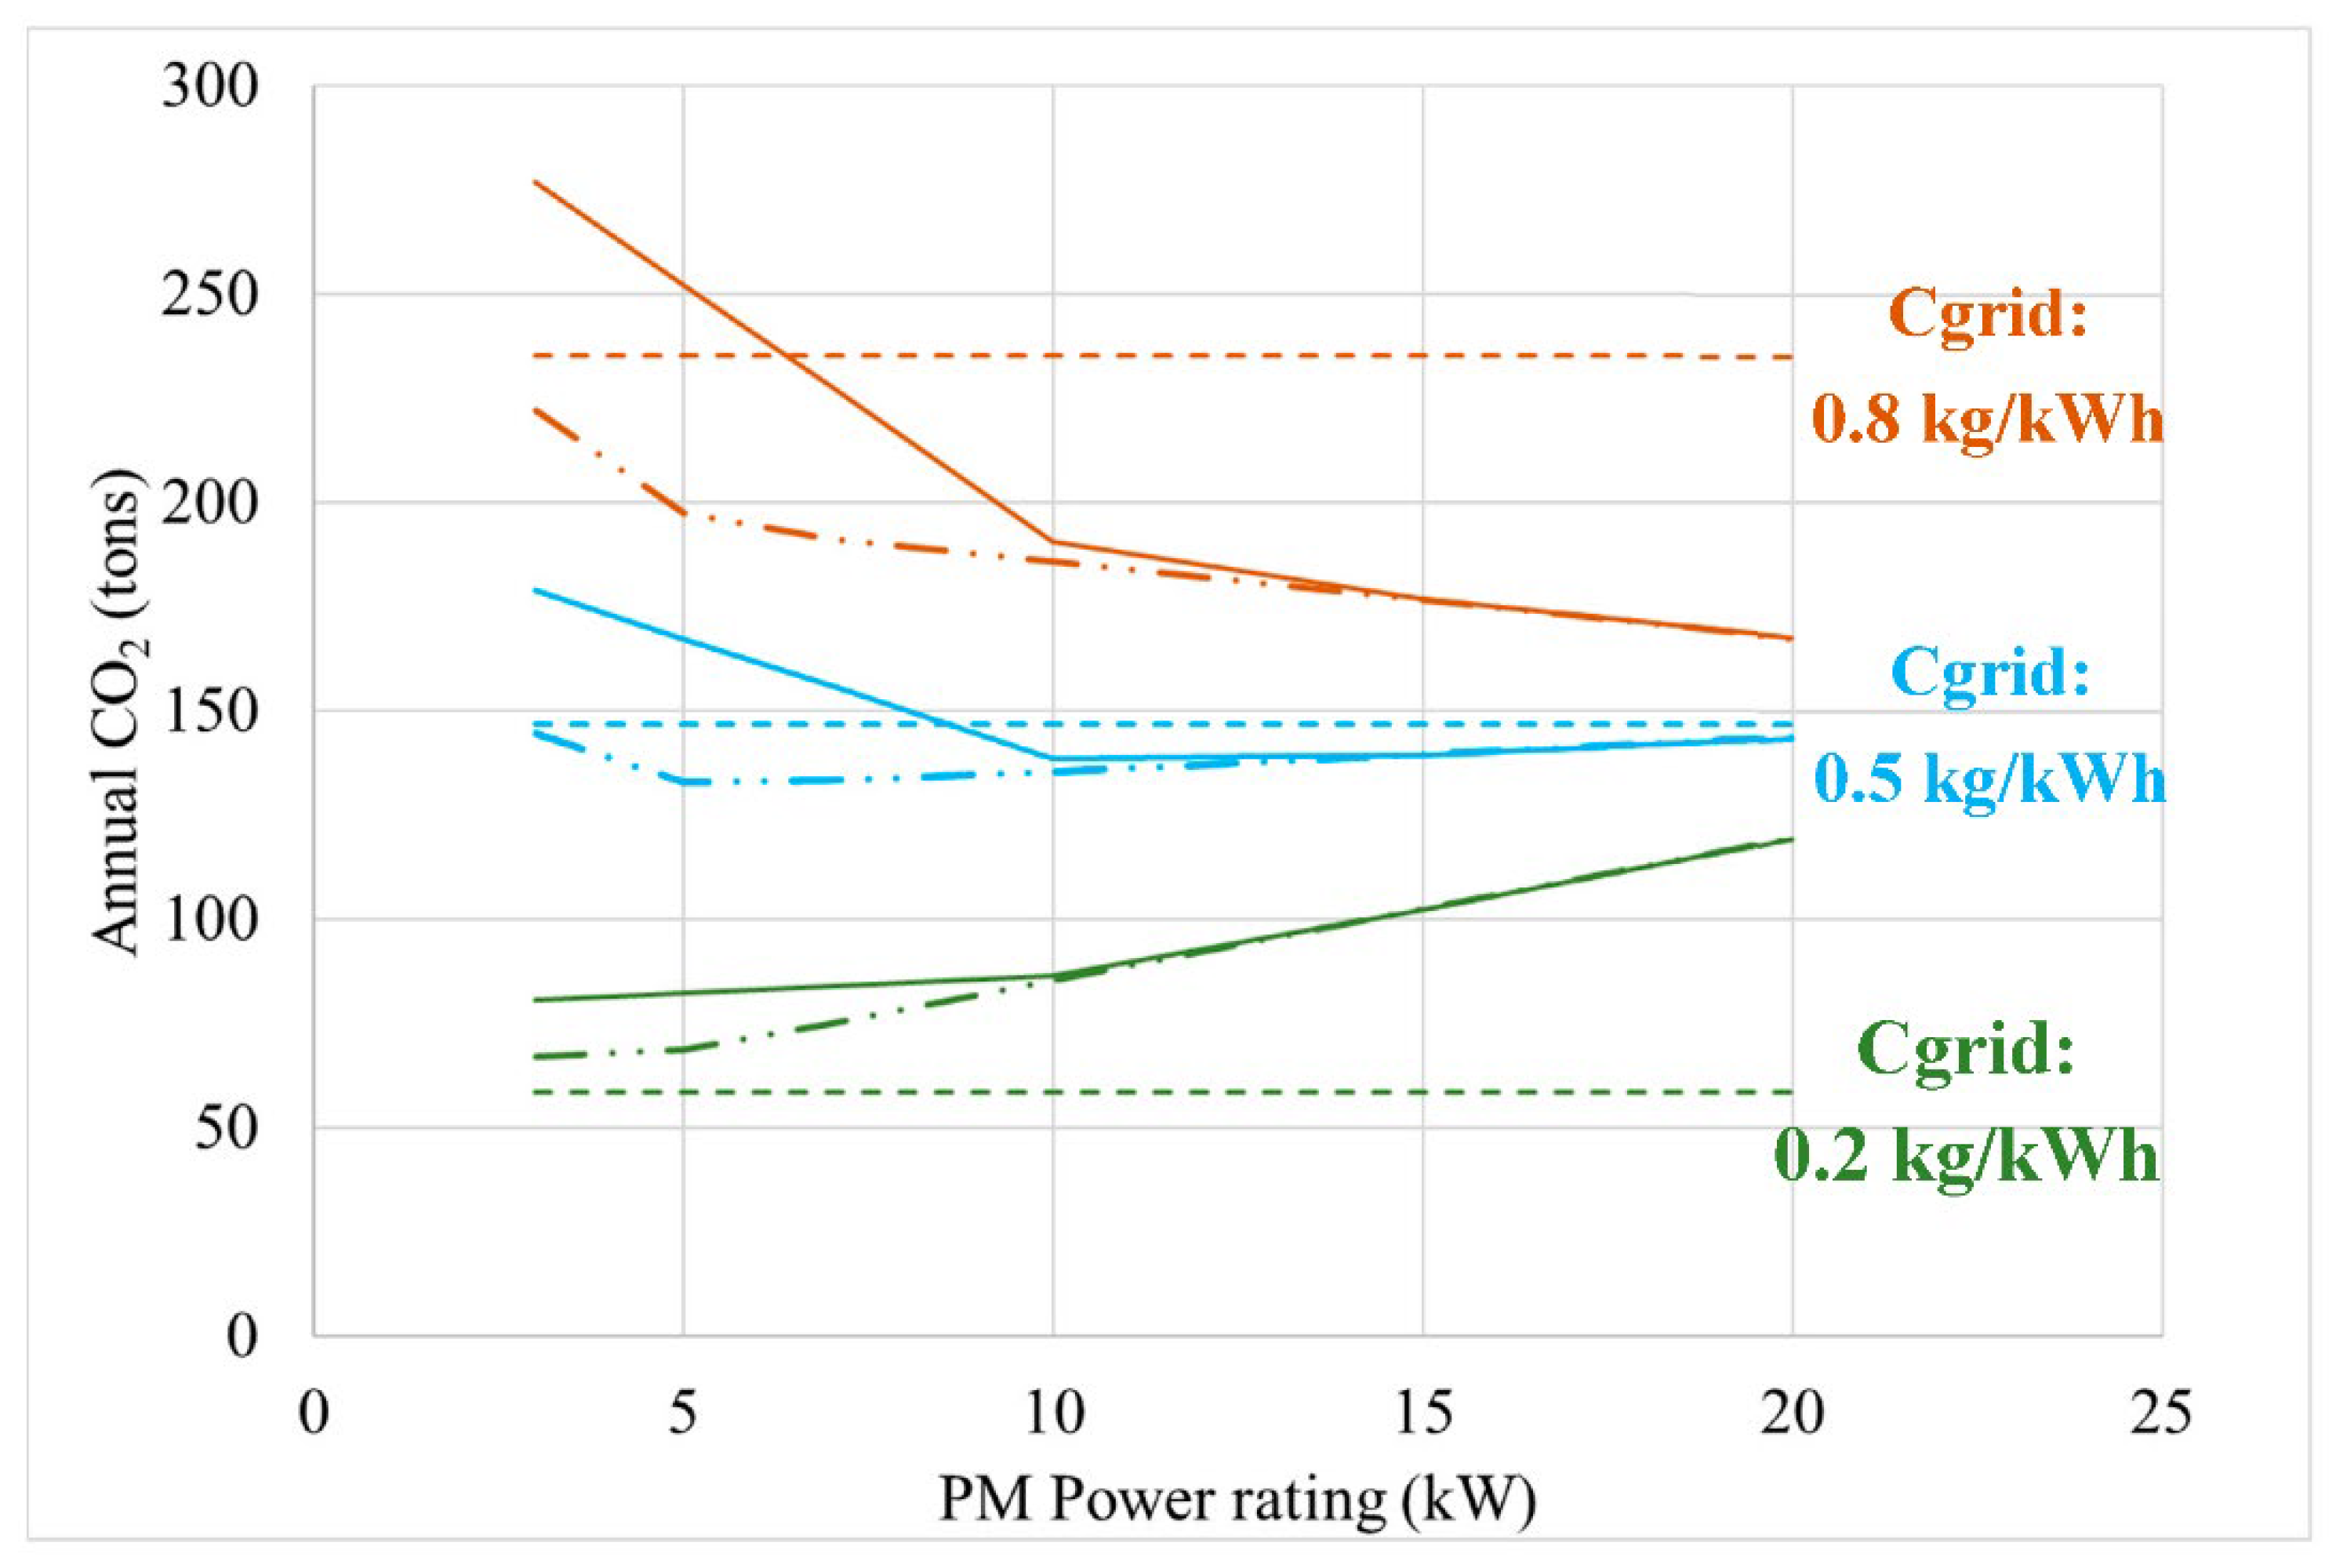
The application of a cogeneration system configuration in commercial buildings was also investigated for assessing the carbon footprint reduction potential at different grid carbon intensities. The daily electrical load was assumed to be 700 kWh, and the thermal load was assumed to be 300 kWh, 100 kWh of which was assumed as hot water demand. The electrical efficiency of the prime mover was assumed to be 30% and the heat recovery efficiency was assumed to be 80%. Internal combustion engine based cogeneration systems fit in to this category. The baseline heat pump’s COP was assumed to be three. Recovered thermal energy from the cogeneration system was utilized for domestic hot water demand and optionally for space heating via hydronic loop with 20% heat transfer loss and an additional 20% hot water storage tank loss.
Figure 5 displays the annual CO2 emissions associated with the baseline heat pump configuration, represented as dotted horizontal lines at electrical grid carbon intensities of 0.2, 0.5, and 0.8 kg/kWh. For the cogeneration system, two configurations with partial (solid lines) and complete heat energy utilization (dashed/dotted lines) via hydronic loop were considered. As shown, none of the cogeneration configurations offer any environmental benefit at a grid carbon dioxide intensity of 0.2 kg/kWh compared with the baseline heat pump system. However, at 0.5 kg/kWh grid carbon dioxide intensity, hydronic configurations decreased the net carbon footprint of the building compared with the heat pump baseline. Partial waste heat utilization provides environmental benefits at prime mover power ratings above 10 kW. At a carbon intensity of 0.8 kg/kWh, both cogeneration configurations offered significant carbon footprint reduction. Evidently, the carbon dioxide intensity of the grid plays a key role in determining the environmental benefit of the cogeneration system. The grid carbon dioxide intensity values considered here are average and do not consider higher marginal emissions. Higher carbon reduction potential is possible if marginal emissions are considered. Additionally, because of time of use charges, cogeneration systems offer significant economic benefits, particularly in regions with a high cost of electricity, and provide the necessary resiliency against grid outages in inclement weather.
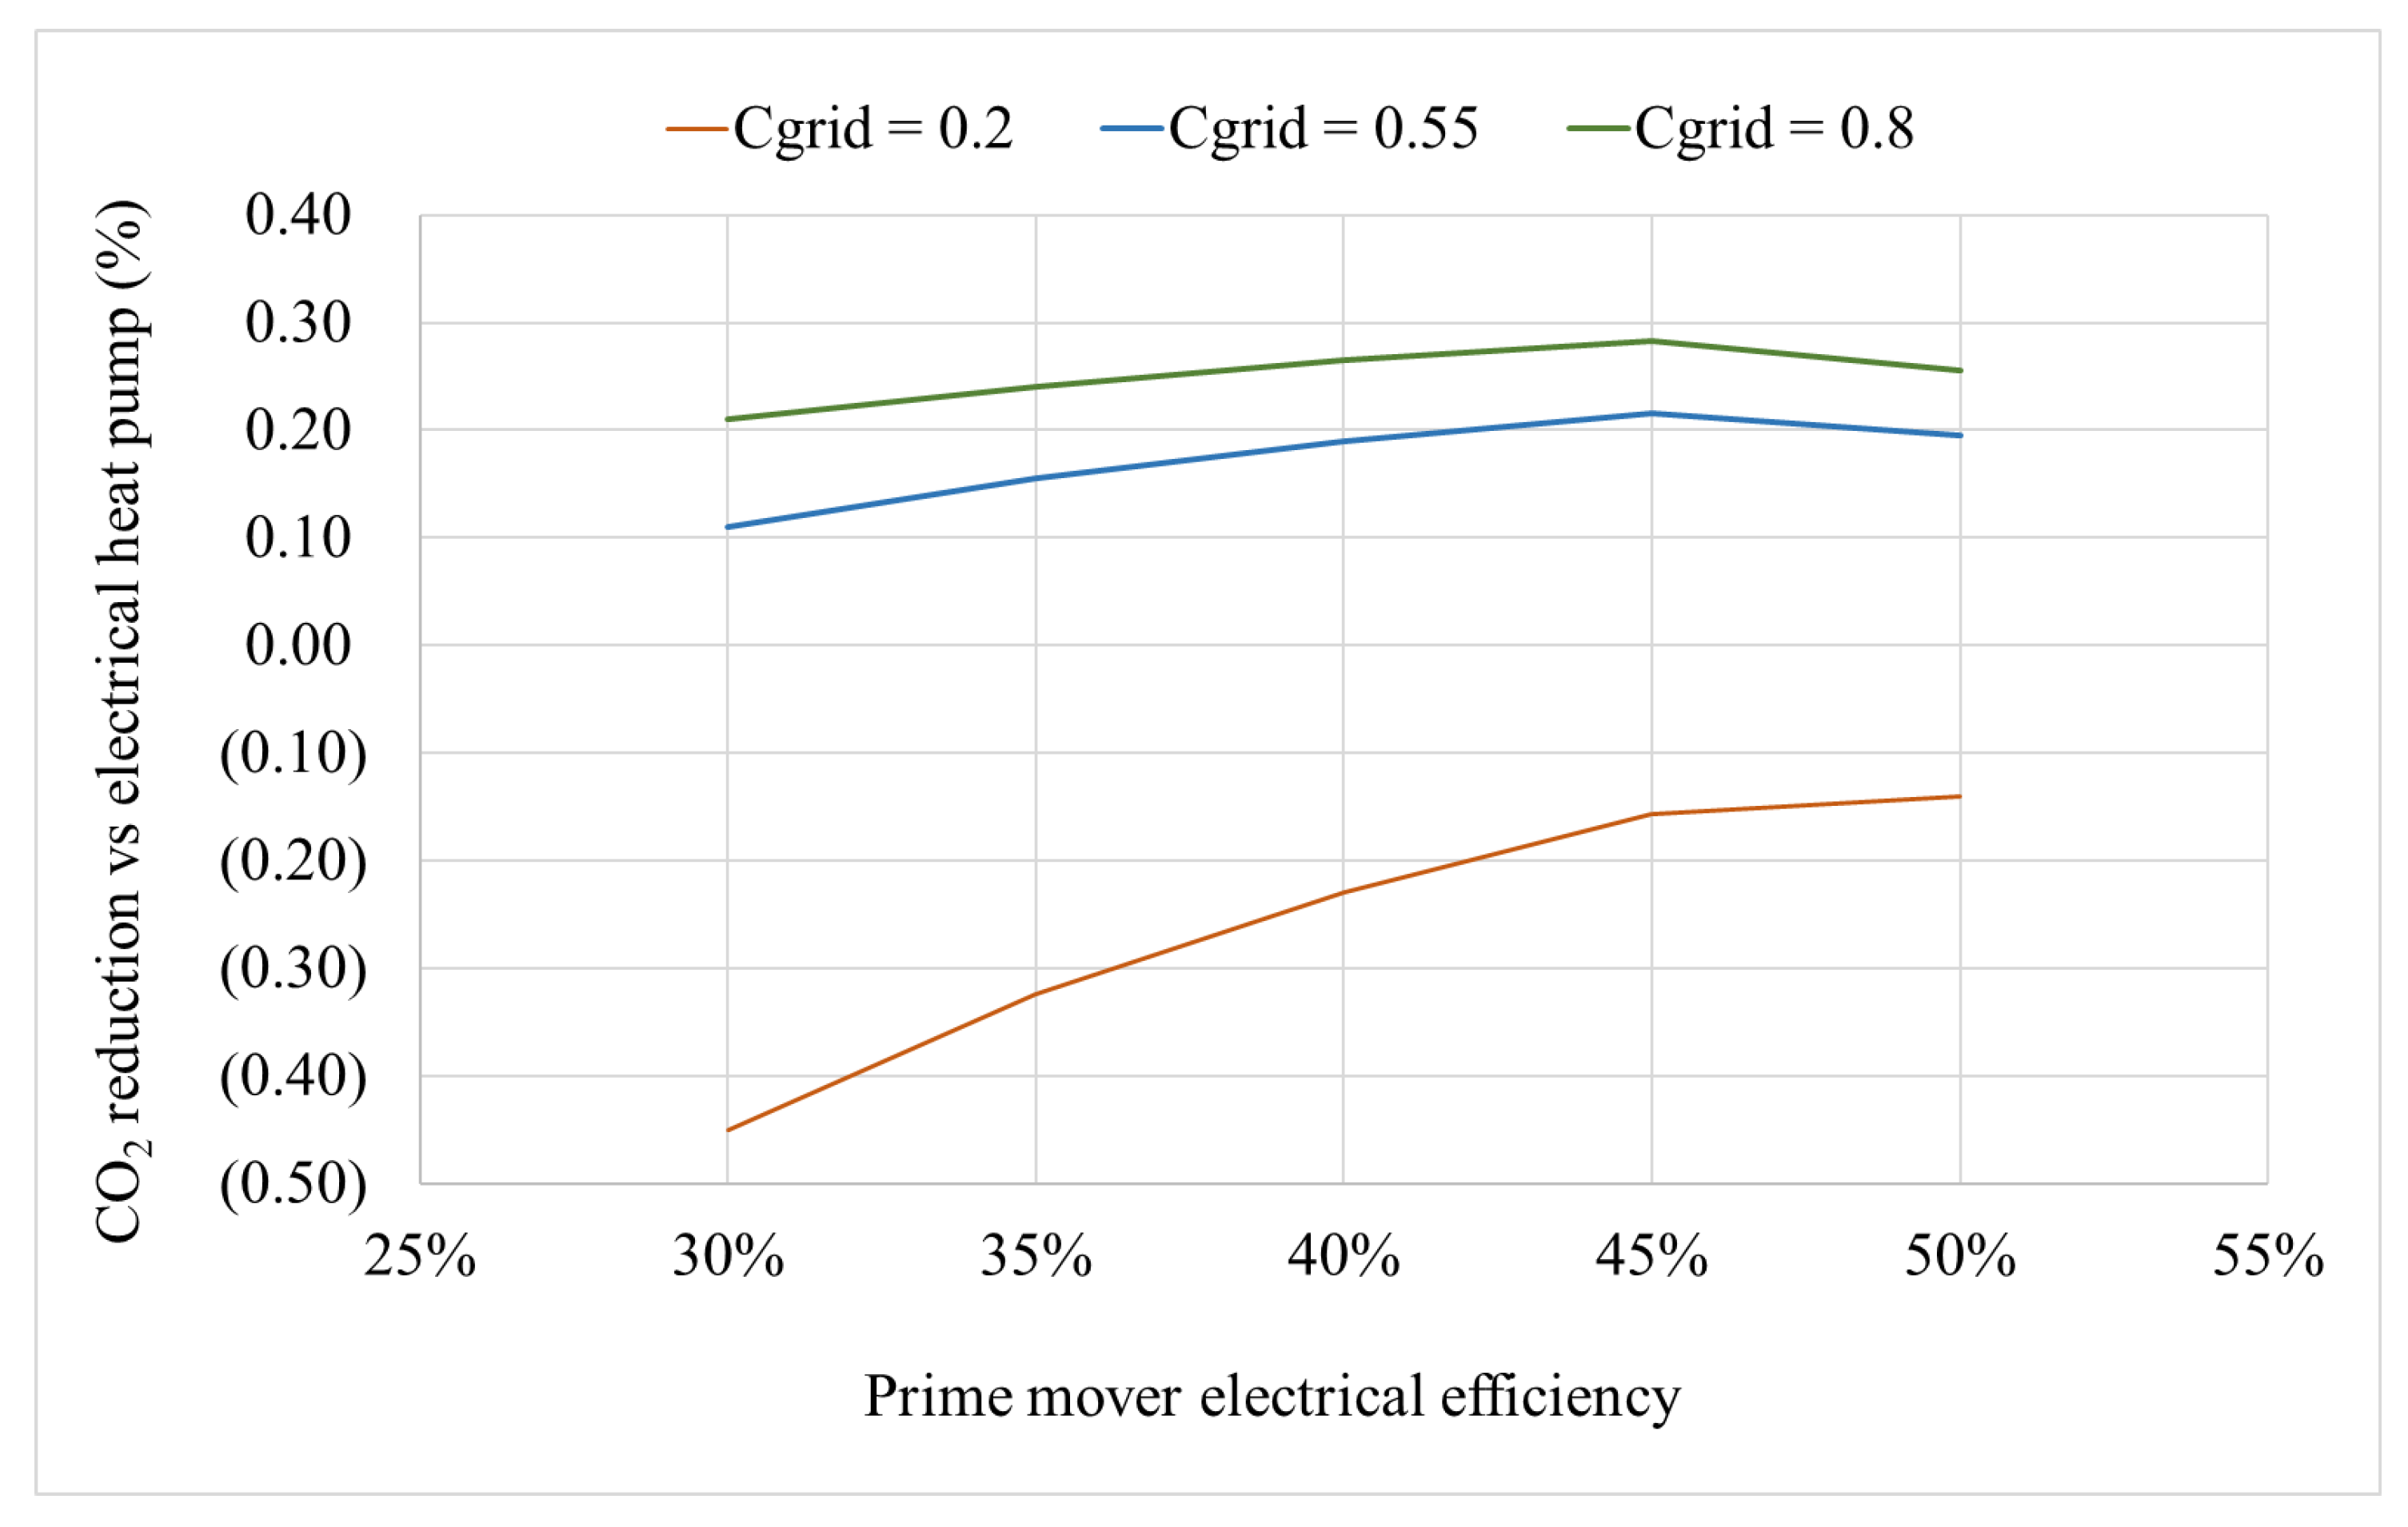
The analysis was extended for prime movers with higher electrical efficiencies than the case study presented in Figure 5. The influence of a 10 kW prime mover’s electrical efficiency on CO2 reduction potential of the cogeneration system shown in Figure 1 was extended by repeating the analysis for configurations with higher electrical efficiencies in the range of 30% to 50%, as shown in Figure 6. SOFC based cogeneration systems have the capability to achieve such electrical efficiencies in addition to offering the flexibility to modulate the heat to power ratio with little impact on combined energy efficiency. In cleaner grid environments with a carbon intensity of 0.2 kg/kWh, the cogeneration configuration did not offer any GHG emissions reduction but rather led to significantly higher emissions. However, at carbon intensities of 0.55 kg/kWh and 0.8 kg/kWh, carbon reduction potential increased up to 21% and 29%, respectively, at an electrical efficiency of 45%. However, a higher electrical efficiency of 50% slightly lowered the carbon reduction potential because of insufficient thermal energy availability for the load profile examined. The case study presented here shows the potential role of cogeneration systems in lowering the carbon emissions while the electrical grid carbon intensity continues to decrease. They are shown to serve as bridging solutions in addressing the carbon footprint, while the transformation of the electrical grid shifts towards renewable generation. Commercial buildings’ energy needs vary significantly dependent upon the building category. Hence, a cogeneration system capable of maintaining high overall energy efficiency while providing various amounts of electrical and thermal energy is the key requirement for successful adoption. Results presented in Figure 5 address one load profile; however, optimization of the kW and kWh rating is necessary to realize the complete energy, environment, and economic benefits in different commercial building categories.
Prime movers suitable for such applications in commercial buildings include SOFCs, internal combustion engines, and microturbines. Fuel flexibility, hybridization with on-site renewable power sources, and the ability to integrate with high-efficiency heat pumps at a lower capital cost are critical to realize the full potential of these cogeneration and power technologies.
4. Conclusions
The work presented in this study demonstrates that currently available cogeneration technologies can lower the GHG emissions associated with building energy consumption while improving grid resiliency, flexibility, and sustainability. The role of on-site generation technologies in lowering carbon emissions and utility bills was studied for different electrical grid carbon intensities. Critical threshold grid carbon dioxide intensity values were identified for residential and commercial buildings by conducting sensitivity analysis over the range of 0.1 to 0.9 kg/kWh. Additionally, the relative carbon footprint of different thermal energy technologies, including heat pumps, cogeneration systems, and traditional combustion systems fueled by hydrogen blends, was investigated. The cogeneration system can compete and complement heat pump systems, particularly in regions with high electric grid carbon intensities (>0.35 kg CO2/kWh electricity) in both residential and commercial buildings. One of the limitations of the work presented here is the specific electric and thermal load profile chosen in the case of the commercial building. Commercial buildings’ energy demands differ significantly, ranging from 300 to 3500 kWh/day, therefore a wide range of on-site energy generation configurations need to be studied to identify the potential to lower the carbon footprint of different commercial building categories. Capital cost minimization via kilowatt and kilowatt-hour rating reduction along with design simplification to address resiliency and peak demand is possible in residential applications. Analyses of hybrid energy configurations with PV and/or heat pumps have been shown to offer improved carbon reduction potential. These findings help efforts toward carbon emissions reductions utility bill savings in the residential and commercial building sectors.
Funding
This research received no external funding.
Institutional Review Board Statement
Not applicable.
Informed Consent Statement
Not applicable.
Acknowledgments
This research was supported by the US Department of Energy (DOE) Office of Energy Efficiency and Renewable Energy (EERE), Building Technologies Office and used resources at the Building Technologies Research and Integration Center, a DOE-EERE User Facility at Oak Ridge National Laboratory.
Conflicts of Interest
The author declares that they have no known competing financial interests or personal relationships that could have influenced the work reported in this paper.
Nomenclature
| COP | coefficient of performance |
| GHG | greenhouse gas |
| g | grams |
| kg | kilogram |
| kW | kilowatt |
| kWh | kilowatt-hour |
| MT | million tons |
| PV | photovoltaics |
| SOFC | solid oxide fuel cell |
| TIE | thermionic emitter |
References
- US Energy Information Administration. Annual Energy Outlook. 2021. Available online: https://www.eia.gov/outlooks/aeo/tables_ref.php (accessed on 3 July 2021).
- US Energy Information Administration. Energy Consumption by Sector (Annual Energy Outlook). 2021. Available online: https://www.eia.gov/todayinenergy/detail.php?id=42635 (accessed on 21 July 2021).
- US Energy Information Administration. Use of Energy Explained: Total Energy Consumption by End-Use Sector. 2021. Available online: https://www.eia.gov/energyexplained/use-of-energy/ (accessed on 6 August 2021).
- US Energy Information Administration. Natural Gas Consumption by End Use. 2021. Available online: https://www.eia.gov/dnav/ng/ng_cons_sum_dcu_nus_m.htm (accessed on 14 August 2021).
- US Department of Energy. About the Building Technologies Office. 2021. Available online: https://www.energy.gov/eere/buildings/about-building-technologies-office (accessed on 6 December 2021).
- Center for Climate and Energy Solutions. Decarbonizing U.S. Buildings. 2021. Available online: https://www.c2es.org/document/decarbonizing-u-s-buildings/ (accessed on 9 December 2021).
- International Energy Agency. Buildings, A Source of Enormous Untapped Efficiency Potential. 2021. Available online: https://www.iea.org/topics/buildings (accessed on 14 December 2021).
- US Energy Information Administration. Consumption & Efficiency. 2021. Available online: https://www.eia.gov/consumption/ (accessed on 14 December 2021).
- US Department of Energy. Net Zero Buildings Week: Commercial Buildings. 2021 [cited 2021 June 2021]. Available online: https://www.energy.gov/eere/buildings/articles/net-zero-buildings-week-commercial-buildings (accessed on 14 December 2021).
- International Energy Agency. Pathway to critical and formidable goal of net-zero emissions by 2050 is narrow but brings huge benefits. In IEA Special Report; IEA: Paris, France, 2021. [Google Scholar]
- US Department of Energy. Buildings. 2022. Available online: https://www.energy.gov/eere/buildings/articles/net-zero-buildings-week-commercial-buildings (accessed on 21 January 2022).
- International Energy Agency. India’s Clean Energy Transition Is Rapidly Underway, Benefiting the Entire World; IEA: Paris, France, 2022. [Google Scholar]
- Henderson, J.; Sen, A. The Energy Transition: Key Challenges for Incumbent and New Players in the Global Energy System; OIES Paper: ET; Oxford Institute for Energy Studies: Oxford, UK, 2021. [Google Scholar]
- Martinez, S.; Michaux, G.; Salagnac, P.; Bouvier, J.-L. Micro-combined heat and power systems (micro-CHP) based on renewable energy sources. Energy Convers. Manag. 2017, 154, 262–285. [Google Scholar] [CrossRef]
- Cheekatamarla, P. Performance analysis of hybrid power configurations: Impact on primary energy intensity, carbon dioxide emissions, and life cycle costs. Int. J. Hydrogen Energy 2020, 45, 34089–34098. [Google Scholar] [CrossRef]
- Cheekatamarla, P.K. Decarbonization of Residential Building Energy Supply: Impact of Cogeneration System Performance on Energy, Environment, and Economics. Energies 2021, 14, 2538. [Google Scholar] [CrossRef]
- Arsalis, A. A comprehensive review of fuel cell-based micro-combined-heat-and-power systems. Renew. Sustain. Energy Rev. 2019, 105, 391–414. [Google Scholar] [CrossRef]
- Budak, Y.; Devrim, Y. Investigation of micro-combined heat and power application of PEM fuel cell systems. Energy Convers. Manag. 2018, 160, 486–494. [Google Scholar] [CrossRef]
- Atănăsoae, P. Technical and economic assessment of micro-cogeneration systems for residential applications. Sustainability 2020, 12, 1074. [Google Scholar] [CrossRef] [Green Version]
- Renau, J.; García, V.; Domenech, L.; Verdejo, P.; Real, A.; Giménez, A.; Barreras, F.; Lozano, A.; Sánchez, F. Novel use of green hydrogen fuel cell-based combined heat and power systems to reduce primary energy intake and greenhouse emissions in the building sector. Sustainability 2021, 13, 1776. [Google Scholar] [CrossRef]
- Adam, A.; Fraga, E.S.; Brett, D.J. A modelling study for the integration of a PEMFC micro-CHP in domestic building services design. Appl. Energy 2018, 225, 85–97. [Google Scholar] [CrossRef]
- González-Pino, I.; Pérez-Iribarren, E.; Campos-Celador, A.; Terés-Zubiaga, J. Analysis of the integration of micro-cogeneration units in space heating and domestic hot water plants. Energy 2020, 200, 117584. [Google Scholar] [CrossRef]
- Kallio, S.; Siroux, M. Hybrid renewable energy systems based on micro-cogeneration. Energy Rep. 2022, 8, 762–769. [Google Scholar] [CrossRef]
- Cheekatamarla, P.; Abu-Heiba, A.; Gluesenkamp, K.; Laclair, T. Reliable, Energy Efficient, Cost-Effective Power and Co-Generation Technologies: Techno-Economic-Environmental Analysis. In Proceedings of the 18th International Refrigeration and Air Conditioning Conference, Purdue, West Lafayette, IN, USA, 24–27 May 2021. [Google Scholar]
- OPENEI. Commercial and Residential Hourly Load Profiles for All TMY3 Locations in the United States. 2021. Available online: https://openei.org/datasets/files/961/pub/RESIDENTIAL_LOAD_DATA_E_PLUS_OUTPUT/BASE/ (accessed on 9 December 2021).
- Go, D.B.; Haase, J.R.; George, J.; Mannhart, J.; Wanke, R.; Nojeh, A.; Nemanich, R. Thermionic energy conversion in the twenty-first century: Advances and opportunities for space and terrestrial applications. Front. Mech. Eng. 2017, 3, 13. [Google Scholar] [CrossRef] [Green Version]
- Cheekatamarla, P. Performance and Reliability Advancements in a Durable Low Temperature Tubular SOFC; U.S. Department of Energy, Office of Scientific and Technical Information: Oak Ridge, TN, USA, 2019.
- US Energy Information Administration. How Much Carbon Dioxide is Produced per Kilowatthour of U.S. Electricity Generation? 2020. Available online: https://www.eia.gov/tools/faqs/faq.php?id=74&t=11 (accessed on 14 December 2020).
Figure 1.
CHEMCAD-based simulation model used to analyze different power and energy configurations.

Figure 2.
Carbon dioxide and utility bill savings potential of an on-site cogeneration system (0.2 kW, 20% electrical efficiency) in a building consuming 20 kW of thermal energy per day, serviced by an electrical grid at different carbon intensities. Negative values are represented in ( ).
Figure 2.
Carbon dioxide and utility bill savings potential of an on-site cogeneration system (0.2 kW, 20% electrical efficiency) in a building consuming 20 kW of thermal energy per day, serviced by an electrical grid at different carbon intensities. Negative values are represented in ( ).

Figure 3.
Comparison of annual CO2 emissions from different hybrid power and energy configurations in regions with different electric grid carbon intensities.
Figure 3.
Comparison of annual CO2 emissions from different hybrid power and energy configurations in regions with different electric grid carbon intensities.

Figure 4.
Annual CO2 emissions in a residential building consuming 30 kWh of electrical energy and 60 kWh of thermal energy per day, serviced by different technological solutions and primary energy resources. HP—heat pump; NG—natural gas; H2—Hydrogen; PM—prime mover.
Figure 4.
Annual CO2 emissions in a residential building consuming 30 kWh of electrical energy and 60 kWh of thermal energy per day, serviced by different technological solutions and primary energy resources. HP—heat pump; NG—natural gas; H2—Hydrogen; PM—prime mover.

Figure 5.
Annual CO2 emissions in a commercial building consuming 1000 kWh of energy per day, supplemented by on-site hybrid cogeneration systems at different kilowatt ratings and electric grid carbon intensities (Cgrid).
Figure 5.
Annual CO2 emissions in a commercial building consuming 1000 kWh of energy per day, supplemented by on-site hybrid cogeneration systems at different kilowatt ratings and electric grid carbon intensities (Cgrid).

Figure 6.
Influence of 10 kW prime mover’s electrical efficiency on the CO2 reduction potential in a commercial building consuming 1000 kWh of energy per day vs. heat pump system with a COP of 3 via a hybrid cogeneration system at different electric grid carbon intensities. Cgrid—Electric grid carbon dioxide intensity (kg/kWh). Negative values are represented in ( ).


Table 1.
Carbon dioxide reduction potential of the on-site cogeneration system (0.4 kW, 40% electrical efficiency) in a building consuming 25 kWh of energy per day, serviced by an electrical grid at different carbon intensities.
Table 1.
Carbon dioxide reduction potential of the on-site cogeneration system (0.4 kW, 40% electrical efficiency) in a building consuming 25 kWh of energy per day, serviced by an electrical grid at different carbon intensities.
| Grid CO2 Intensity, kg/kWh | vs. Grid | vs. Grid + NG | vs. Grid + HP (COP 3) |
|---|---|---|---|
| 0.2 | −19% | −18% | −63% |
| 0.3 | 12% | −1% | −21% |
| 0.4 | 27% | 10% | 0% |
| 0.5 | 36% | 17% | 13% |
| 0.63 | 44% | 23% | 24% |
Publisher’s Note: MDPI stays neutral with regard to jurisdictional claims in published maps and institutional affiliations. |
© 2022 by the author. Licensee MDPI, Basel, Switzerland. This article is an open access article distributed under the terms and conditions of the Creative Commons Attribution (CC BY) license (https://creativecommons.org/licenses/by/4.0/).
Share and Cite
MDPI and ACS Style
Cheekatamarla, P. Role of On-Site Generation in Carbon Emissions and Utility Bill Savings under Different Electric Grid Scenarios. Energies 2022, 15, 3477. https://0-doi-org.brum.beds.ac.uk/10.3390/en15103477
AMA Style
Cheekatamarla P. Role of On-Site Generation in Carbon Emissions and Utility Bill Savings under Different Electric Grid Scenarios. Energies. 2022; 15(10):3477. https://0-doi-org.brum.beds.ac.uk/10.3390/en15103477
Chicago/Turabian StyleCheekatamarla, Praveen. 2022. "Role of On-Site Generation in Carbon Emissions and Utility Bill Savings under Different Electric Grid Scenarios" Energies 15, no. 10: 3477. https://0-doi-org.brum.beds.ac.uk/10.3390/en15103477
Note that from the first issue of 2016, this journal uses article numbers instead of page numbers. See further details here.