
Inter-Provincial Electricity Trading and Its Effects on Carbon Emissions from the Power Industry


1
Sino-Canada Energy and Environmental Research Center, North China Electric Power University, Beijing 102206, China
2
State Key Joint Laboratory of Environmental Simulation and Pollution Control, China-Canada Center for Energy, Environment and Ecology Research, UR-BNU, School of Environment, Beijing Normal University, Beijing 100875, China
3
Institute for Energy, Environment and Sustainable Communities, University of Regina, Regina, SK S4S 7H9, Canada
*
Authors to whom correspondence should be addressed.
Energies 2022, 15(10), 3601; https://0-doi-org.brum.beds.ac.uk/10.3390/en15103601
Submission received: 13 April 2022
/
Revised: 11 May 2022
/
Accepted: 12 May 2022
/
Published: 14 May 2022
(This article belongs to the Special Issue Advanced Decision-Making Methods for Hybrid Energy System Planning and Management under Complexities and Uncertainties)
Abstract
:Electricity trading is an effective measure to minimize carbon emissions and alleviate the imbalance between reverse distribution of regional energy resources and power load. However, the effects of China’s electricity trading on carbon emissions have not been fully explored due to lack of complete and balanced inter-provincial power transmission data. Therefore, the electricity generation–consumption downscaling model, logarithmic mean Divisia index (LMDI) model, and random forest clustering algorithm within a general framework were used in the present study to explore the effect of electricity trading on level of carbon emissions. Comprehensive inter-provincial electricity transmission data were generated, driving factors including electricity imports and exports were decomposed at the national and provincial scales, and clustered provincial policy implications were evaluated. The results revealed that: (i) although economic activities were the main driving factor for increase in carbon emissions at the national level, 382.95 million tons carbon emissions were offset from 2005 to 2019 due to inter-provincial electricity importation, whereas electricity export increased carbon emission by 230.30 million tons; (ii) analysis at the provincial level showed that electricity exports from Sichuan and Yunnan provinces accounted for more than 20% of the nation’s total electricity flow. Notably, this high level of exports did not significantly increase carbon emissions in these provinces owing to the abundant hydropower resources; (iii) emission reductions were only observed at the national level if the carbon intensity of the exporting provinces was lower compared with that of importing provinces, or if the electricity trading was generated from renewable sources; (iv) the effect of electricity import on emissions reduction was markedly higher relative to the effect of electricity export in most provinces, which reflected the actual situation of sustaining optimization of electricity generation structure in provincial grids of China. These findings provide a basis for decision makers to understand the contributions of electricity trading to the changes in carbon emissions from electricity generation, as well as form a foundation to explore practicable carbon emission mitigation strategies in the power industry.
1. Introduction
Electricity generation is a major source of greenhouse gas (GHG) emissions, contributing to approximately more than 40% of carbon dioxide (CO2) emissions, worldwide and in China over the past decade [1,2]. Previous findings indicate that CO2 emissions from China’s electricity generation were 5.24 billion tons in 2019, accounting for 53.0% of the national total carbon emissions in that year [3]. Policymakers and researchers have made significant efforts in exploring strategies to reduce emissions from energy and power systems [4]. Notably, inter-regional and inter-provincial electricity trading can alleviate the imbalance between the reverse distribution of regional energy resources and power load in China, as well as promote consumption of renewable energy [5]. Inter-regional and inter-provincial electricity trading is a key measure to improve the inconsistency between energy supply and demand and to promote reduction in carbon emissions [6,7]. The total amount of inter-regional and inter-provincial electricity trading increased from 276.27 billion kWh to 1444.08 billion kWh between 2005 and 2019 in China, with an average annual growth rate of 12.89% [8]. Studies should explore the effect of remotely transmitted electricity in alleviating carbon emissions.
An accurate understanding of the contributions of electricity trading to the changes in carbon emissions from power generation is necessary for providing theoretical basis to explore practical mitigation approaches in the power industry. Several studies have been conducted to evaluate the effect of electricity on levels of carbon emissions [9,10,11,12,13,14,15,16,17]. Karmellos et al. (2016, 2021) formulated logarithmic mean Divisia index-I (LMDI-I) model to explore the driving factors of CO2 emissions from electricity generation in the European Union for the periods between 2000 and 2012 as well as between 2000 and 2018. The study results showed that electricity trading had a significant effect on reduction in CO2 emissions in some countries, particularly in Lithuania (92%), Luxembourg (24%), and Hungary (18%) [10,16]. Diakoulaki et al. (2017) evaluated the driving factors of CO2 emissions from electricity generation in Greece from 2005 to 2012 using LMDI-I method. In the study, the factor of electricity trading was added to represent the increasing electricity exchanges in the liberalizing European electricity market [15]. Zhao et al. (2020) explored the structural and technological determinants of provincial carbon intensity in the electricity generation sector using the multiplicative LMDI-II method. The results demonstrated that electricity trading markedly affected level of carbon emissions, followed by the geographic distribution effect and electricity consumption intensity effect [11]. Quantification of drivers of carbon emissions from the electricity generation sector is an area that has attracted high attention among researchers and policy makers [18]. Index decomposition analysis is a technique that has been widely used for this analysis, especially the LMDI model. Currently, electricity trading effects play a significant role in carbon emissions reduction owing to advances in liberalization of electricity markets and integration of power grids, thus it is important to include the effect of electricity trading in the identity function. Electricity trading effect is generally defined as the ratio of the entire electricity production to the total electricity consumption in a certain year, whereby values greater than 1 represent net exporters whereas values less than 1 indicate net importers. This implies that electricity imports effect and export effect cannot be determined by this simplified function. Recently, Lopez et al. (2018) proposed a novel identity function, whereby the effects of electricity imports and exports on changes in CO2 emissions from electricity generation were both quantified [19]. Currently, studies have not fully explored the role of China’s energy and power systems on carbon emission. This is mainly because complete and balanced inter-provincial power transmission data are not currently available [20,21].
LMDI model and clustering algorithm have been previously integrated to explore the characteristics of different types of regions and the policy implications of carbon emissions reduction [14,22,23,24,25]. Jiang et al. (2017) combined the two-layer LMDI method with Q-type hierarchical clustering to systematically evaluate the effects of related factors from 30 provinces to changes in China’s national carbon emissions [14]. Liao et al. (2019) constructed a LMDI model based on K-means clustering to evaluate the factors that modulate the levels of CO2 emissions from the power sector in 30 provinces in China between 2005 and 2015 [22]. Wen and Hao (2020) explored the i factors that modulate levels of CO2 emissions from national, provincial, and cluster levels using the Shapley value and spectral clustering based on the time-series data of China’s power industry from 2005 to 2017 [25]. He et al. (2022) combined the two-layer LMDI method with K-means clustering analysis to explore the factors that affect carbon emissions and targeted countermeasures from the electricity industry of China and the 30 provinces [23]. However, the number of clusters in most previous studies were subjectively determined. In addition, the algorithms used were not suitable for the high-dimensional clustering problems. Random forest (RF) clustering is a more robust method for clustering of data compared with the more commonly used k-means algorithm. RF method has been widely applied in tumor classification of renal cell carcinoma [26], video segmentation [27], multidimensional clinical phenotyping [28], and social sciences [29]. RF algorithm consists of a collection or ensemble of classification trees where each tree is built with a different bootstrap sample of the original data. Each tree represents a class, and the majority rule is used for the final prediction. Out-of-sample data are available for calculation of misclassification error since each tree is grown with a bootstrap sample of the data. Moreover, the out-of-sample data can be used to determine the variable importance for each variable [28]. However, no studies have used this robust algorithm in high-dimensional energy and environmental data classification.
In the present study, comprehensive inter-provincial electricity transmission data from 2005 to 2019 were generated using the electricity generation–consumption downscaling model and the electricity balance equation. Intergovernmental Panel on Climate Change (IPCC) accounting method was then used to calculate the carbon emissions caused by power production in 31 provincial grids (PGs). Subsequently, seven factors including electricity imports and exports were decomposed using LMDI model. The 31 PGs were then divided into five clusters according to the characteristics of carbon emissions by random forest clustering technology to further explore the impact of electricity trading on reduction in carbon emissions and policy implications. The subsequent sections of the study include Section 2 which presents the methodology and data sources, Section 3, which constitutes analysis of results and policy implications, and Section 4, which presents the conclusions of the study.
2. Methodology and Data Sources
2.1. Downscaling of Inter-Regional Electricity Transmission Data
Electric power has been the main source energy that supports economic development in China. Electricity consumption in China was 7.25 trillion KWh in 2019, accounting for more than 27% of the total energy consumption [8]. However, the supply of energy from primary energy sources such as coal and hydropower does not match the current power consumption in China. The economically developed eastern coastal areas require utilization of a high amount of power (accounting for more than 60% of the national power consumption). In addition, several provinces experience bottlenecks and large power gaps in power production. The central and western regions have several energy resources, characterized by low power production costs, and excess power generation capacity. As a result, inter-provincial and inter-regional electricity transmission is an important measure to optimize power allocation and alleviate the disparity between regional power production and consumption. China’s interregional and provincial power transmission has been normalized in recent years, and the total amount of power transmission across regions has been increasing yearly. The national inter-regional electricity trading volume increased from 80.38 billion KWh in 2005 to 540.43 billion KWh in 2019. Moreover, the proportion of trading volume in the total social electricity consumption increased from 3.22% in 2006 to 7.38% in 2019 [8]. China’s power grid development will shift to inter-regional electricity trading owing to adoption of the framework of national energy strategic structure adjustment.
China’s power grids can be spatially divided into three scales namely, national grid (NG), subnational grids (SNGs), and provincial grids (PGs) [22]. Notably, NG comprises seven SNGs, including North China Grid (NCG), Northeast China grid (NEG), East China Grid (ECG), Central China Grid (CCG), Northwest China grid (NWG), Southwest China grid (SWG), and China Southern Power Grid (CSG) (Figure 1) [20]. Each SNG comprises some adjacent PGs, as shown in Table 1. The regulations of the National Energy Administration of China state that power dispatching agencies should report electricity exchanges between SNGs and PGs since 2005, including autonomous regions and municipalities, which are administrative units of the provincial level [2,30]. This implies that the provincial level should be the appropriate spatial resolution of exploring the effect of electricity trading on carbon emissions of the power industry in China.
Notably, inter-provincial electricity trading data are not directly available from statistics [20]. The actual status quo indicates that there is power transmission between provinces (PG-to-PG) and regions (PG-to-SNG or SNG-to-SNG). Therefore, the electricity generation–consumption downscaling model was firstly used in the present study to preliminarily downscale the inter-regional power transmission data to the provincial scale [20,21]. In the current study, it was assumed that is the amount of electricity transferred from subnational grid A () to B (). Two downscaling coefficient vectors for supply-side () and demand side () were then built based on the exporters’ electricity production and importers’ electricity consumption as follows [20]:
where m and n are the numbers of PGs acting as exporters in electricity-exporting SNG () and PGs as importers in electricity-importing SNG (), respectively. represents the level of electricity generation of (i = 1, 2,..., m) in . indicates the electricity consumption of (j = 1, 2,..., n) in . represents the percentage of electricity delivered by accounting for total electricity transmission (), and represents the percentage of electricity received from accounting for total electricity transmission (). The inter-provincial electricity transmission matrix () is downscaled from subnational level transmission ( to ) based on and as shown below [20]:
where represents the electricity transmission from in to in , indicates the downscaled electricity transmission matrix between m PGs of and n PGs of .
Notably, the electricity-importing/exporting balance and the actual connectivity of the power grids at provincial level were not considered in . Therefore, the data of inter-provincial electricity transmission should be adjusted according to the electricity balance equation and the actual connectivity between PGs and SNGs. Each PG is treated as a node that can produce and consume electricity, and the nodes are directly or indirectly connected to each other. The total electricity inflow consists of local electricity generation and direct imports from other nodes whereas the total electricity outflow comprises local electricity consumption and direct exports to other nodes [2,30]. The electricity balance equation for each node is presented below:
where represents the total electricity flow of grid i, indicates the total electricity generation of grid i, represents the total electricity consumption of grid i, and indicates the total amount of electricity transmitted from grid i to grid j within a year. The comprehensive inter-provincial electricity transmission data can be generated by combining all inter-provincial electricity transmission within the same SNG with data downscaled from all subnational level transmission.
2.2. Decomposition Analysis Using logarithmic Mean Divisia Method (LMDI)
The LMDI method is used to analyze the changes in carbon emissions caused by electricity production at the provincial, regional, and national scales. Traditional drivers such as carbon emissions intensity, power generation structure, and socio-economic factors, as well as the influence of electricity trading (including imports and exports) are considered in the decomposition model. The identity function in the present study was established based on the findings by Lopez et al. (2018) [19,31], and is shown in Equation (4):
where represents the aggregate total carbon emissions from electricity generation in a region or nation during period t, 106 tons of CO2e; indicates thermal power generation of province i during period t, 106 kWh; represents total electricity generation of province i during period t, 106 kWh; indicates the portion of final electricity consumption locally generated in province i during period t, 106 kWh; represents total electricity consumption in province i during period t, 106 kWh; indicates the Gross Domestic Product of province i during period t, 106 RMB and represents total population of province i during period t, 106. The ratio of carbon emissions and thermal power generation ( (kg/kWh)), represents carbon emissions intensity in province i during period t. , , , , and represent electricity generation structure, electricity export effect, electricity import effect, electricity consumption intensity, and economic activity effect of province i during period t, respectively.
Notably, is not directly available from statistic data [19]. Therefore, in the present study it was assumed that all imported electricity is consumed locally (implying that there is no secondary and higher-order transmission). is calculated as shown in Equation (5), whereby represents electricity imported from other provinces or from other foreign countries to province i during period t.
The carbon emissions change decomposition from electricity generation in a year can be presented as follows:
where ,
, , , , , and represent the impacts of changes in , , , , , , and based on the carbon emission changes from year t to year 0 (base year), respectively. The carbon emission intensity effect () indicates the change in carbon emissions caused by the change in carbon emission intensity. The structure effect () represents the change in carbon emissions caused by the change in electricity generation structure. The electricity export effect () indicates the change in carbon emissions caused by the change in electricity export among provinces or areas abroad. The electricity import effect () represents the change in carbon emissions caused by the change in electricity import among provinces or areas abroad. The electricity consumption intensity effect () indicates the change in carbon emissions caused by the change in electricity consumption intensity. The economic activity effect () represents the change in carbon emissions caused by the change in per capita gross national product. The population effect () indicates the change in carbon emissions caused by the change in total population.
2.3. Random Forest Clustering
Random forest (RF) clustering is a hard-partitioning algorithm for partitioning data into several clusters, whereby each observation belongs to only one group [26,28,32]. This clustering method combines the unsupervised RF algorithm and the partitioning around medoids (PAM) algorithm [28]. The unsupervised RF algorithm is not sensitive to skewed covariate distributions, it does not require the user to specify threshold values and can automatically dichotomize the variable expressions in a principled, data-driven way [32]. PAM is a more robust algorithm for clustering data compared with the commonly used K-means algorithm. The main difference between the k-means algorithm and the PAM algorithm is that a data point within the cluster defines the medoid in PAM algorithm, whereas the cluster center represents the average of all the data points in K-means algorithm [28]. The processes of RF clustering conducted in the presented study are presented below:
- (i)
- The unsupervised RF algorithm was used to generate a proximity matrix which gave an estimate of the distance between observations based on the frequency of observations leading to the same leaf node.
- (ii)
- The clustering in the second step of PAM analysis was performed by assigning each observation to the nearest medoid in order to find k representative objects that minimize the sum of the dissimilarities of the observations to their closest representative object.
- (iii)
- Silhouette index (SI) was used to optimize the model to determine the relevant number of clusters [28]. The SI value is a measure of how similar an object is to its own cluster (cohesion) compared with other clusters (separation). The SI can be used to explore the separation distance between the resulting clusters. A high SI value indicates that the object is well-matched to its own cluster and poorly matched to neighboring clusters. The SI is calculated using the mean intra-cluster distance (a) and the mean nearest-cluster distance (b) for each sample. The SI is defined as follows:
The carbon emissions intensity effect (), electricity generation structure effect (), electricity export effect (, electricity import effect (), electricity consumption intensity effect (), economic activity effect (), and population effect (), as well as the changes in carbon emissions (), are collectively chosen as the clustering variables based on the LMDI model parameters of 31 provincial samples.
2.4. Data Sources
The electricity-generation related carbon emissions considered in this study include carbon dioxide (CO2), methane (CH4), and nitrous oxide (N2O) emitted during fossil fuel combustion. These greenhouse gases have different characteristics, therefore, their ability to absorb infrared light is dissimilar implying that the impact on global warming is also different [33]. Global warming potential (GWP) is defined as the cumulative radiative forcing, both direct and indirect effects, over a specified time horizon resulting from the emission of a unit mass of gas related to a reference gas (CO2) [34]. Therefore, the emissions of three greenhouse gases were calculated in the current study and GWPs were used to uniformly convert the emissions into carbon dioxide equivalents (CO2e). The IPCC Fifth Assessment Report (AR5) [34,35] states that the 100-year global warming potential values (GWP100 with climate–carbon feedbacks) of CO2, CH4, and N2O are 1, 34, and 298, respectively. The total carbon emissions were calculated using Equation (15):
where represents the total carbon emissions from electricity production in province i during period t; indicates the global warming potential of the th greenhouse gas; represents the total emissions of the th type of carbon emissions caused by electricity generation in province i during period t ( = 1 for CO2, = 2 for CH4, = 3 for N2O).
The accounting method of carbon emissions developed by IPCC [35] is widely adopted by international institutions and related studies. This method was used for calculation of based on the fossil fuel combustion amount, average lower calorific value, carbon content or emission factor per unit calorific value and carbon oxidation rate in the power industry of each province. The specific calculation formula is presented below:
where represents the consumption of fossil fuel k caused by electricity generation in province i during period t; refers to the net caloric value of fossil fuel k, which is the average lower calorific value produced per physical unit of fossil fuel combustion; (carbon content) indicates the CO2 emissions per net caloric value produced by fossil fuel k; represents the oxygenation efficiency of fossil fuel k, which refers to the oxidation ratio during fossil fuel combustion; represents the emission factor of CH4 () or N2O () during the combustion of fossil fuel k.
The best spatial resolution of this study is provincial level based on the data availability. The system boundary covers 31 Chinese provinces, autonomous regions, or municipalities, not including Taiwan, Hong Kong, and Macao. The Inner Mongolia power grid is regarded as a whole belonging to NCG. The PG of Inner Mongolia is separated into east-Inner Mongolia grid and west-Inner Mongolia grid, which belong to the Northeast China grid and North China Grid, respectively. Data of thermal power generation, total power generation, social electricity consumption, and inter-provincial and inter-regional power transmission of each province from 2005 to 2019 were derived from a statistical data compilation of power Industry [8]. Notably, electricity imports and exports from abroad were also considered. The energy consumption data of thermal power generation were obtained from China Energy Statistical Yearbook [36], and the carbon emission factors of different fossil fuels (calorific value, carbon content per unit calorific value, oxidation rate level) were mainly derived from findings reported by Shan et al. [37,38]. In addition, the energy data consumed by thermal power generation in Tibet were derived from previous relevant research [39]. GDP and population data were obtained from China Statistical Yearbook [40]. The double proportion reduction method was used in the current study to convert the GDP data into constant prices in 2005 to eliminate the effect of price changes.
3. Results
3.1. Evolution of Inter-Provincial Electricity Trading
The national annual power generation from 2005 to 2019 increased from 2497.47 billion kWh to 7326.94 billion kWh, with an average annual growth rate of 30.87% (Figure 2). The power generation capacity of local power stations in most provinces met the local electricity demand before 2005. However, significant disparities were observed between the primary energy resource endowment of power generation and economic development level in all provinces. Furthermore, the regional distribution of electricity production and consumption was markedly uneven. The growing electricity demand in some developed regions in the past 15 years was mainly dependent on inter-provincial and inter-regional electricity trading owing to the continuous improvement of the interconnection level of inter-regional and inter-provincial power grids. In addition, annual trans-regional power transmission increased from 80.38 billion kWh (accounting for 3.22% of the national generation in 2005) to 540.43 billion kWh (accounting for 7.38% of the national power generation in 2019), with an average annual growth rate of 14.58%. Moreover, the electricity transmitted across provinces increased from 276.27 billion kWh (accounting for 11.06% of the national power generation in 2005) to 1444.08 billion kWh (accounting for 19.71% of the national power generation in 2019), with an average annual growth rate of 12.89%. Inter-provincial and inter-regional electricity trading extensively promote the optimal allocation of energy resources, and play an important role in ensuring power supply, promoting development of clean energy, maintaining power grid security and efficient utilization of energy resources.
Temporal and spatial changes in China’s inter-provincial electricity trading flows from 2005 to 2019 are presented in Figure 3. The findings showed that the basic flow direction of China’s inter-provincial power transmission is from the energy-rich provinces in the central and western regions to the economically developed coastal provinces in the east and south (Figure 3). Notably, the total amount of electricity trading increased yearly owing to the enrichment of inter-regional and inter-provincial power transmission networks. In addition to the abbreviations of PGs in the figure, ABR denotes PGs bought or sold electricity from abroad, which only accounted for a small proportion of the total inter-provincial and inter-regional transmission electricity. The results showed that only Heilongjiang, Liaoning, and Yunnan provinces bought electricity from abroad, whereas Inner Mongolia, Jilin, Liaoning, Guangdong, Guangxi, and Yunnan provinces sold electricity to foreign countries.
China’s inter-regional and inter-provincial power transmission networks were rapidly promoted in 2000 as the “West to East power transmission project” and the “Three Gorges power transmission and transformation project” entered the peak period of construction and the construction of UHV transmission lines began. Analysis of trans-regional power transmission data showed that Shanxi transmitted 11.60 billion kWh to Jiangsu, Inner Mongolia transmitted more than 5 billion kWh to Liaoning and Heilongjiang, and Hubei transmitted 6.74 billion kWh, 20.34 billion kWh, 3.086 billion kWh, and 18.301 billion kWh to Shanghai, Jiangsu, Chongqing, and Guangdong, respectively, in 2005. In addition, though the results did not show large amounts of cross-regional power transmission between the seven regional power grids, the inter-provincial power transmission within SNGs was significant. Analysis of NCG data showed that Shanxi and Inner Mongolia were the main transmission provinces, supplying more than 30 billion kWh of electricity. NEG results indicated that Jilin transmitted 18.58 billion kWh to Liaoning and Heilongjiang transmitted 10.98 billion kWh to Jilin. ECG data showed that Jiangsu and Anhui were the main transmission provinces. The findings indicated that Jiangsu’s transmission volume to Shanghai and Zhejiang exceeded 11 billion kWh, and Anhui’s transmission volume to Zhejiang was 5.84 billion kWh. Analysis of CCG data showed high frequency of the power exchange between Hubei and Hunan, and the electricity trading was more than 5 billion kWh. NWG data showed that Shaanxi and Gansu were the main transmission provinces, with Shaanxi transmitting 4.09 billion kWh to Gansu, and Gansu transmitting 2.57 billion kWh and 3.28 billion kWh to Qinghai and Ningxia, respectively. Analysis of SCG data showed that Sichuan transmitted 9.70 billion kWh to Chongqing and Chongqing transmitted 1.40 billion kWh to Sichuan. CSG data indicated that Guizhou and Yunnan were the main transmission provinces, transmitting 9.14 billion kWh and 6.30 billion kWh to Guangdong, respectively.
Inter-provincial power transmission network did not significantly change between 2005 and 2010. However, the total amount of inter-provincial power transmission increased to 0.59 trillion kWh in 2010, indicating a 114.73% increase. Analysis of trans-regional transmission showed that the transmission volume from Shanxi to Jiangsu and Hubei increased to 16.55 billion kWh and 7.24 billion kWh, the transmission volume from Inner Mongolia to Liaoning and Heilongjiang increased to 19.64 billion kWh and 13.46 billion kWh, respectively. Moreover, the transmission volume from Hubei to Shanghai and Jiangsu increased to 20.70 billion kWh and 13.90 billion kWh, respectively. Notably, the increase or decrease in other trans-regional transmission volumes were negligible. In addition, there was no large amount of cross-regional power transmission between regions. However, the inter-provincial power exchanges within SNGs were more frequent in 2010 and the transmission volume surged compared with that observed in 2005. More than 10 billion kWh of inter-provincial power transmission was observed in the seven SNGs. For example, in NCG, the electricity transmitted from Shanxi to Beijing was more than 16 billion kWh, that from Hebei was more than 32.40 billion kWh, and that from Inner Mongolia to Beijing, Tianjin, Hebei, and Shandong was 22.29 billion kWh, 13.49 billion kWh, 23.96 billion kWh, and 11.45 billion kWh, respectively. The national interconnection was achieved in 2011 except for Taiwan, forming the power allocation pattern of “West to East power transmission” and “North to South power transmission” which was attributed to the commissioning of the Qinghai-Tibet DC interconnection project.
The inter-provincial and inter-regional power transmission channels were markedly enriched and the transmission capacity was significantly improved attributed to development of the Southeast Shanxi–Nanyang–Jingmen 1000 kV UHV AC transmission line (under operation from December 2011), Jinping-southern Jiangsu ±800 kV UHV DC transmission line (which began operation from December 2012), Huainan–northern Zhejiang–Shanghai 1000 kV UHV AC transmission line (under operation from September 2013), south Hami–Zhengzhou ±800 kV UHV DC transmission project (which began operation from January 2014) and the completion of a number of UHV transmission lines, such as Xiluodu–West Zhejiang ±800 kV UHV DC transmission project (under operation from July 2014) and North Zhejiang–Fuzhou 1000 kV UHV AC transmission project (under operation from December 2014). The trans-regional power transmission increased to 331.11 billion kwh by 2015, with an increase of 96.11% compared with that reported in 2010. Furthermore, the trans-provincial transmission volume increased to 948.21 billion kwh, with an increase of 61.29% relative to the volume reported in 2010.
Twenty-eight cross-regional transmission channels were under operation nationwide from 2019, and the transmission capacity was 146.15 million kW. Nine inter-provincial UHV transmission lines were under operation in NCG, ECG, and CSG, with transmission capacity of 5080 kW. Construction of UHV AC/DC transmission channel promoted increase in cross-regional power transmission capacity and achieved optimal allocation of energy resources in a wider range. The top three provinces with highest power output were Inner Mongolia (208.18 billion kWh), Yunnan (166.38 billion kWh), and Sichuan (138.31 billion kWh), accounting for 14.42%, 11.52%, and 9.58% of the total inter-provincial electricity trading, respectively. Other major power exporting provinces included Shanxi (126.52 billion kWh), Ningxia (91.24 billion kWh), and Hubei (83.96 billion kWh).
3.2. Carbon Emissions from Electricity Generation
China’s carbon emissions caused by power generation soared from 1.93 billion tons to 4.25 billion tons from 2005 to 2019, with an average annual growth rate of 5.83% (Figure 4). Although the calculated values over the years are slightly lower than those reported by Liao et al. (2019) [17,22], they are still within the error range. The main reason for this difference is that the latest carbon emission coefficient used in the present study is slightly lower compared with that used in IPCC accounting method. The change trend of carbon emissions was highly consistent with changes in thermal power generation, exhibiting three development stages namely: (i) Slow growth stage (from 2005 to 2009): in this stage the growth trend of carbon emission was relatively moderate, the total carbon emissions in 2009 only increased by 659.62 million tons compared with that in 2005; (ii) Rapid growth stage (2010–2013): in this stage the total carbon emissions reached 3.60 billion tons in 2013, with an increase of 1.02 billion tons compared with that reported in 2009; (iii) Slow growth stage (2014–2019): in this stage the carbon emissions range declined between 2014 and 2015, and showed slow growth again after 2016, with an average annual growth rate of 127.46 million tons.
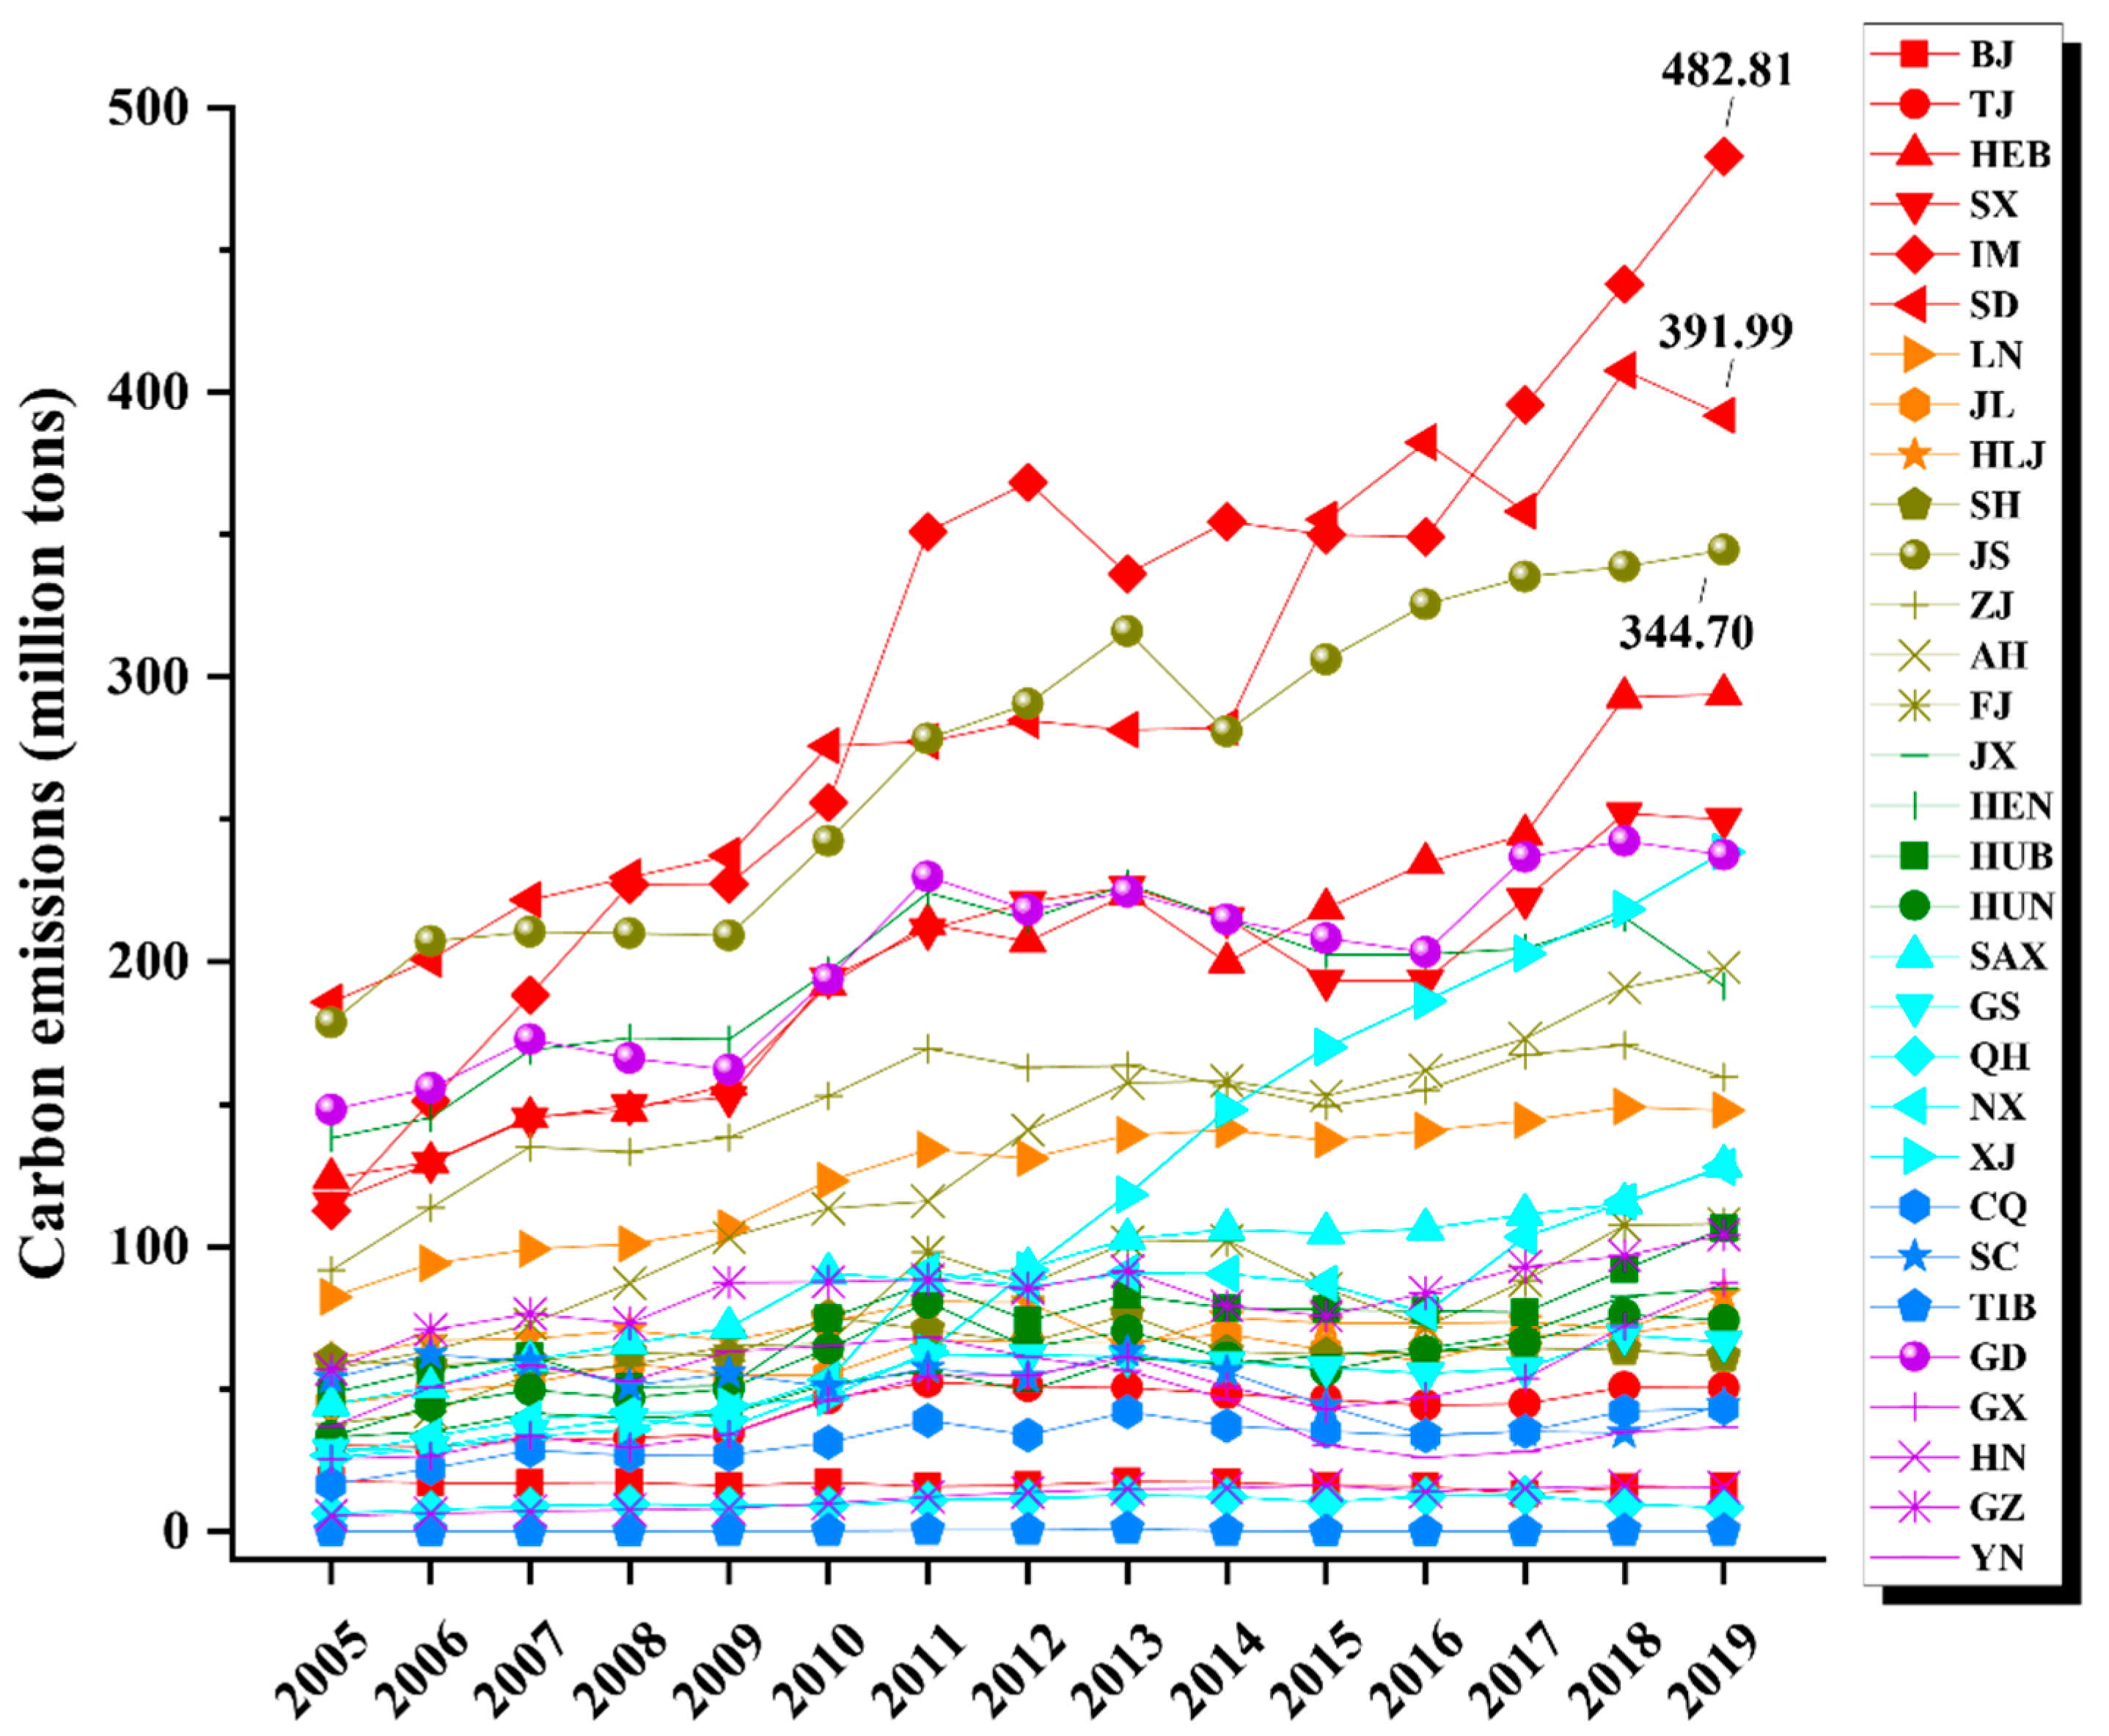
The findings showed that carbon emissions caused by electricity generation at the provincial level displayed an overall pattern of “high in the east and low in the west, high in the north and low in the south”, which was consistent with the geospatial pattern of energy consumption in China’s power industry (Figure 5). Formation of this pattern was modulated by several factors, such as energy resource endowment of each province, industrial structure and economic development level, and scale and structure of energy production and consumption. Inner Mongolia, Shandong, and Jiangsu were the top carbon emitters from electricity production between 2005 and 2019, whereas Tibet, Qinghai, and Hainan were the bottom three lowest carbon emitters. Notably, the three provinces with the highest carbon emissions in 2005 were Shandong (185.89 million tons), Jiangsu (178.60 million tons), and Guangdong (148.10 million tons), whereas Tibet, Qinghai, and Hainan only produced 0.07 million tons, 6.39 million tons, and 5.50 million tons, respectively. The top three provinces in carbon emission in 2019 were Inner Mongolia (482.81 million tons), Shandong (391.99 million tons), and Jiangsu (344.70 million tons), whereas Tibet, Qinghai, and Hainan only recorded 0.09 million tons, 8.23 million tons, and 15.41 million tons, respectively.
3.3. Electricity Trading and Drivers to Carbon Emissions
In the current research, the study period was divided into 2005–2010, 2010–2015, and 2015–2019 to explore the driving factors of carbon emissions change, especially the impact of electricity trading on carbon emissions. The decomposition results at the national level are presented in Figure 6. Carbon emission intensity effect, structure effect, import effect, and consumption intensity effect reduced carbon emissions by 175.35 million tons (−16.24%), 21.81 million tons (−2.02%), 89.81 million tons (−8.32%), and 90.20 million tons (−8.36%), respectively, during the 2005–2010 period. Increase in electricity export activities, economic activity, and increase in population increased carbon emission by 58.74 million tons (5.44%), 1291.07 million tons (119.60%), and 106.82 million tons (9.90%), respectively. The findings show that economic activities were the main driving factor for continuous increase in carbon emissions, whereas the emission reduction effect of inter-provincial electricity import was relatively significant. The emission reduction rate related to import effect from 2010 to 2015 was 162.29 million tons (−33.49%), whereas increase in electricity export increased the carbon emission by 51.35 million tons (10.60%). These findings indicate that significantly high low-carbon emission thermal power generation and renewable energy generation power were added to the inter-provincial and inter-regional power trading network. Although the proportion decreased between 2015 and 2019, electricity import modulated carbon emission reduction to 184.18 million tons (−24.01%), which markedly exceeded the carbon emission increase caused by population effect (91.70 million tons). On the other hand, export effect increased carbon emission level by 157.34 million tons (20.51%). Notably, the export effect and the import effect in these three periods showed asymmetry, and emission reduction associated with import was significantly higher relative to the emission increase related to export, which reflects the actual situation of continuous optimization of China’s electricity production structure.
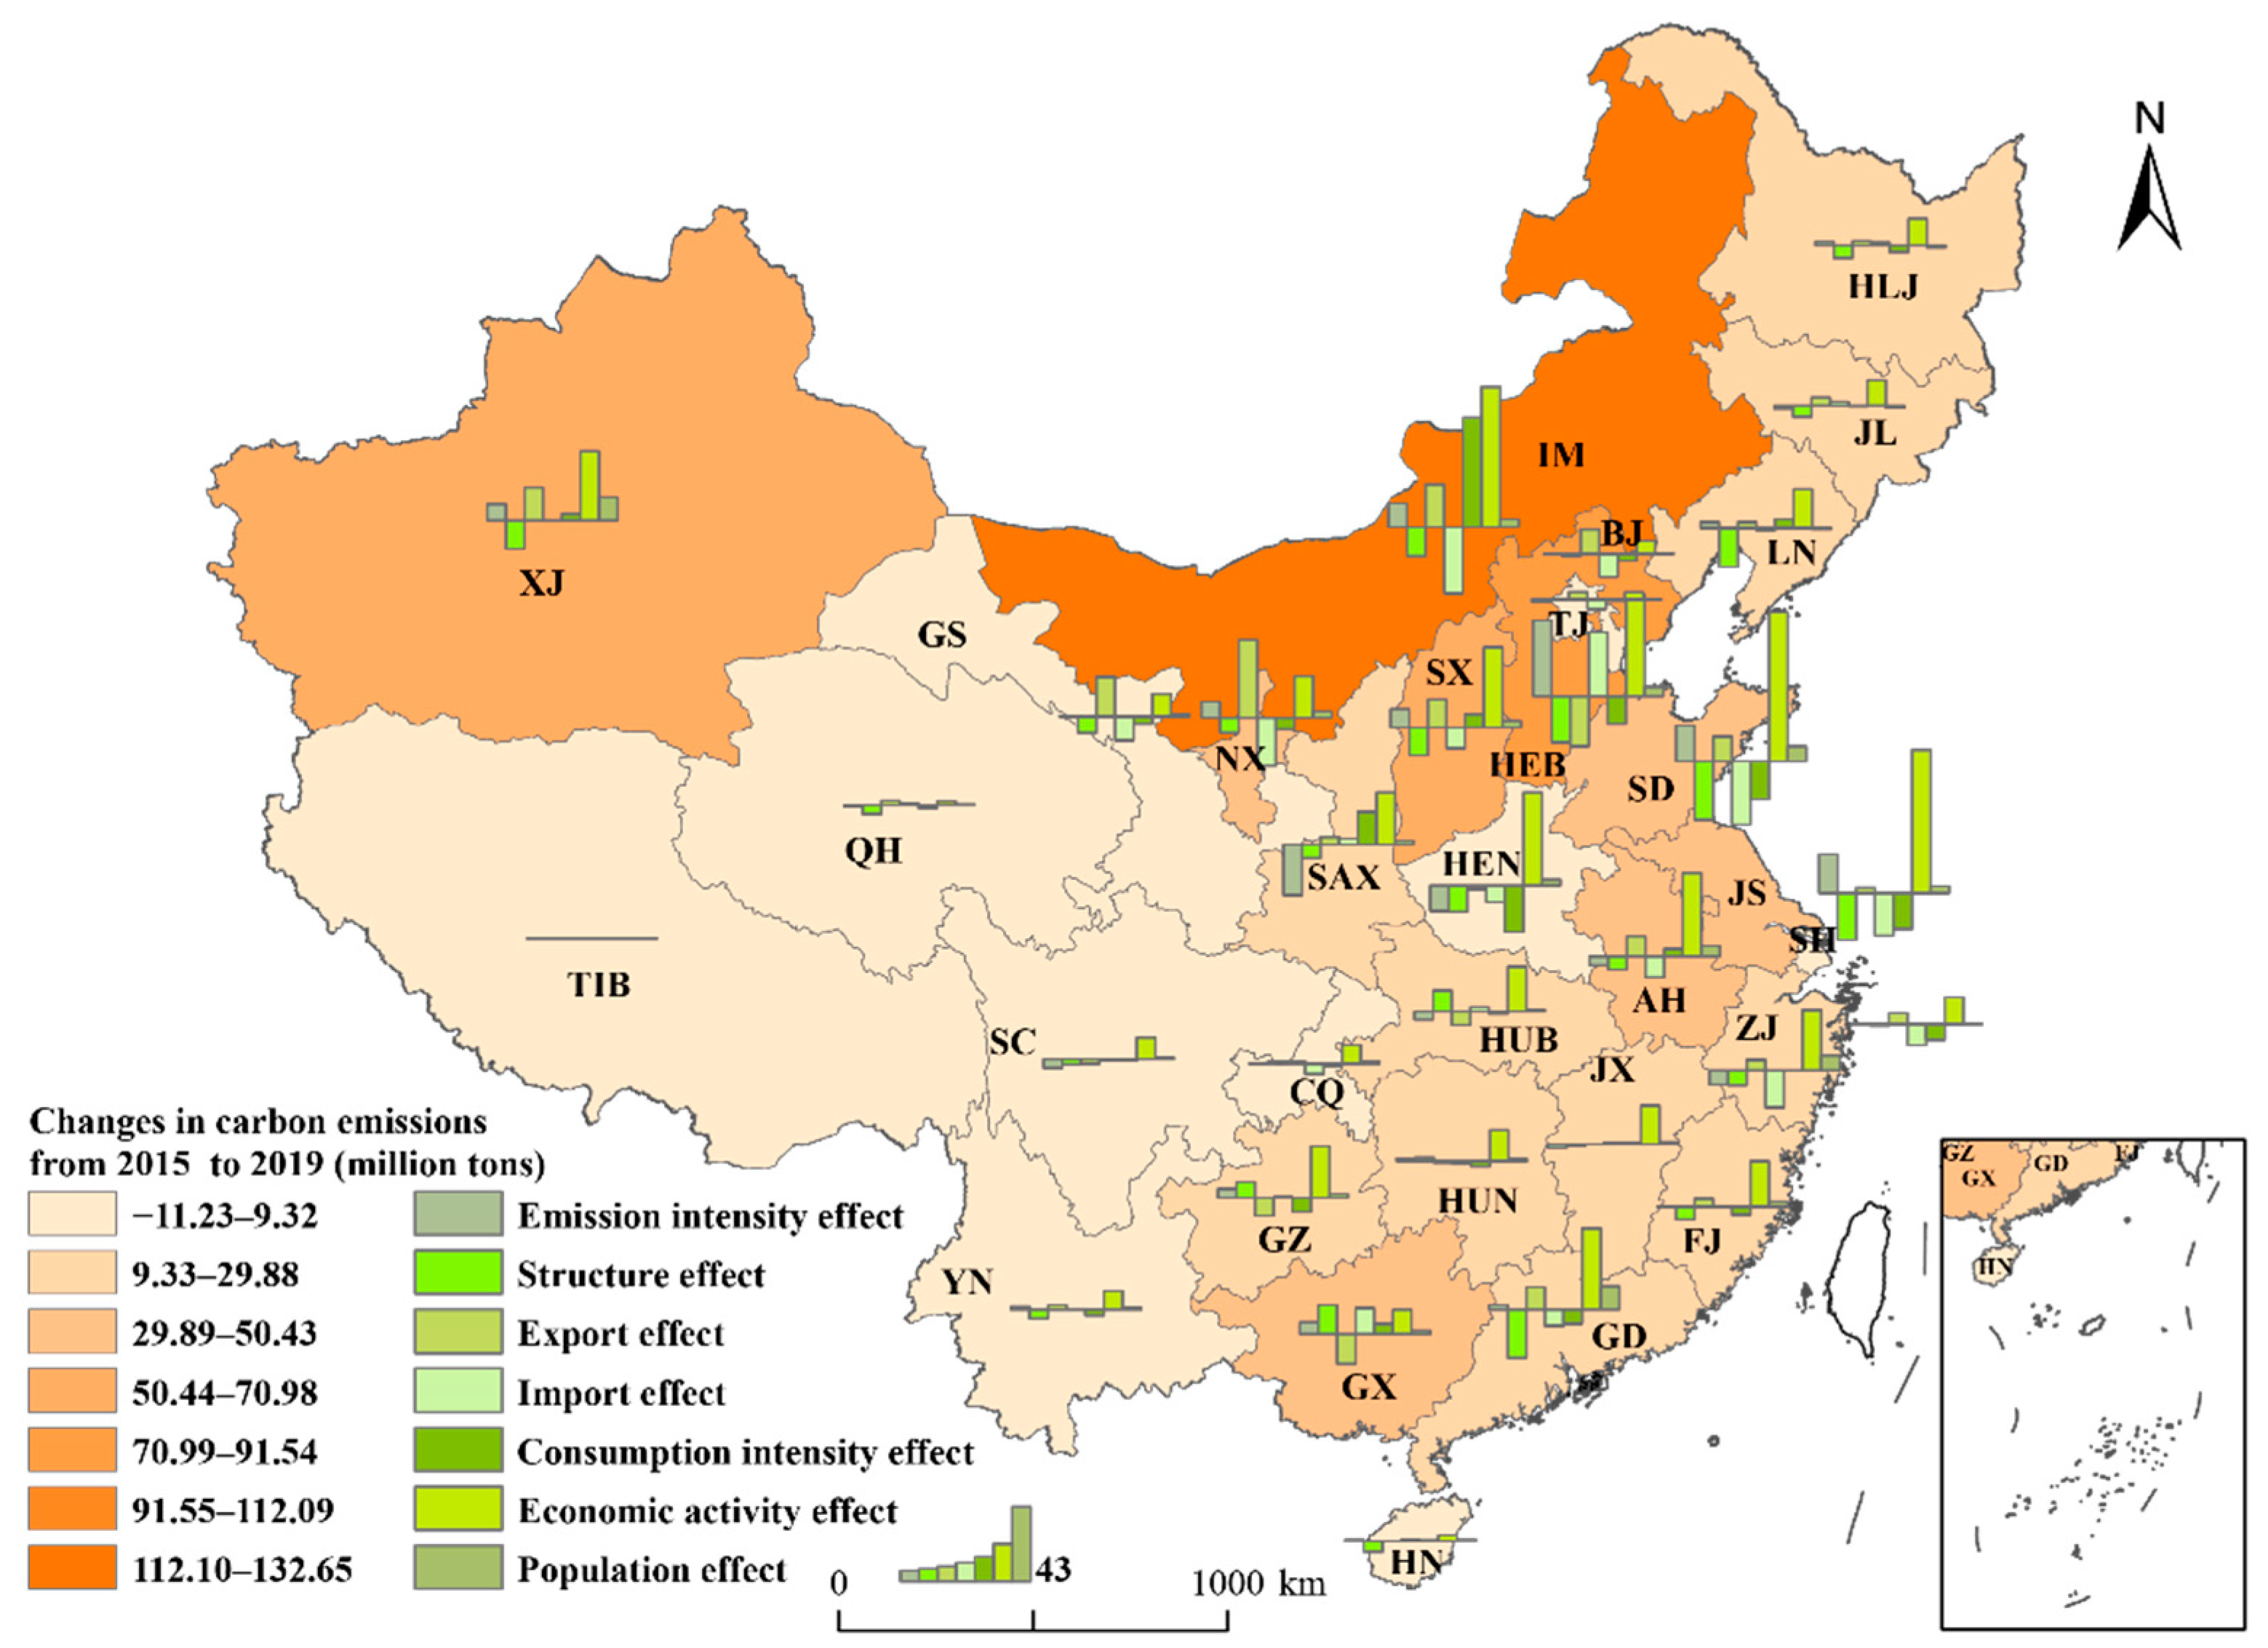
Changes and driving factors of carbon emissions in each province in the 2005–2010, 2010–2015, and 2015–2019 periods are presented in Figure 7, Figure 8 and Figure 9, respectively. The results showed significant differences in carbon emissions change among PGs. Economic activities had the highest effect on increase in carbon emissions in each PG, whereas carbon emission intensity effect, structure effect and consumption intensity effect were correlated with reduction in carbon emissions in each PG at varying degrees. Beijing was the only province whereby carbon emissions decreased in all three periods, by 0.51, 1.20, and 0.31 million tons, respectively, owing to electricity imports from other provinces and use of efficient clean power generation technologies. In addition, Sichuan and Yunnan showed significant reductions in carbon emissions owing to large-scale hydropower development and use. Notably, carbon emissions in Yunnan decreased by 34.89 million tons from 2010 to 2015, whereas carbon emissions in Sichuan decreased by 2.97 million tons from 2005 to 2010, 6.79 million tons from 2010 to 2015, and 9.25 million tons from 2015 to 2019. Guangdong was among the top three in terms of carbon emissions in 2005, but its increase in carbon emissions was not significant due to use of new energy technologies such as nuclear power and power distribution in provinces such as Yunnan. Inner Mongolia, Shanxi, Shaanxi, and Xinjiang relied on rich coal resources for production of thermal power on a large scale in order to meet the high demand of power transmission. Shandong and Jiangsu were the top two provinces in installed thermal power capacity, in order to meet the economic and social development needs, with installed thermal power capacity at 111.35 million kW and 100.79 million kW, respectively, in 2019. These six provinces made major contributions to increase in carbon emissions.
Increase in electricity import promoted carbon emissions reduction in PGs at varying degrees. Analysis of emissions reductions showed that Hebei and Guangdong provinces had the highest benefit from electricity imports in 2005–2010 and 2010–2015. Electricity import in Hebei increased from 12.62 billion kWh to 57.50 billion kWh between 2005 and 2010, resulting in reduction in carbon emissions by 23.38 million tons. Guangdong’s electricity imports increased from 42.17 billion kWh to 106.86 billion kWh, contributing to a reduction of 22.75 million tons of carbon emissions.
Hebei’s electricity imports surged to 142,21 billion kWh from 2010 to 2015, resulting in a reduction of 72.66 million tons in carbon emissions; Guangdong’s electricity imports increased to 169.95 billion kWh, causing a reduction of 16.13 million tons in carbon emissions. Notably, Hebei’s electricity import decreased to 138.9 billion kWh from 2015 to 2019, but carbon emission increased by 37.46 million tons. Hebei, Inner Mongolia, Jiangsu, Shaanxi, and Guangdong achieved significant reduction in carbon emissions by reducing power export at different periods. The effects of electricity import and export were significantly higher compared with the effect of population growth in some PGs, implying that electricity trading markedly modulates carbon emissions growth/reduction in these regions.
3.4. Provincial Clusters and Emission Reduction Strategies
The change in carbon emissions caused by electricity generation from 2015 to 2019 and the seven driving factors decomposed by the LMDI model were taken as cluster variables, and the 31 provinces were divided into five clusters based on the random forest clustering algorithm. This analysis was conducted to explore more targeted policy implications for carbon emissions reduction. The clustering factors and clustering results are presented in Table 2, whereby the mean values of the clustering factors are provided. The characteristics of PGs in each cluster can be interpreted more clearly and relevant policy implications can be obtained from these results.
Cluster 1 includes Beijing, Tianjin, Shanghai, Gansu, Qinghai, Sichuan, Tibet, Hainan, and Yunnan. The increase in carbon emissions in the nine provinces in cluster 1 was less than 9 million tons between 2015 and 2019. Notably, some provinces (Beijing, Shanghai, Qinghai, and Hainan) achieved a decrease in carbon emissions, had a moderate growth rate of carbon emissions, and exhibited the lowest average change in carbon emission. The carbon emissions intensity and consumption intensity of thermal power generation in these PGs declined since the 13th Five-Year Plan, and the electricity generation structure has been significantly optimized. The emission reduction effect of electricity imports can offset the increase in carbon emission caused by population effect. Electricity exports from Sichuan and Yunnan provinces accounted for 21.10% of the country’s total electricity flow in 2019. Increase in electricity exports did not significantly increase carbon emissions in the two provinces owing to abundant hydropower resources. Beijing, Tianjin, and Shanghai require continuous import of low-carbon electricity to support their own economic development and consumer demand. Notably, the power generation structure of Hainan province has high potential to be tapped.
Cluster 2 comprises Hebei, Shanxi, Inner Mongolia, Shandong, Jiangsu, Ningxia, Xinjiang, and Guangdong. The eight provinces had the highest carbon emission in 2019, with an average carbon emission increase of 59.82 million tons. The increase in carbon emissions for Inner Mongolia was 132.65 million tons in 2019. Although the electricity generation structure was continuously optimized, the intensity of coal-fired power generation increased at varying degrees. Hebei’s emission intensity effect caused an increase of 44.50 million tons of carbon emissions, whereas the emission intensity effect of Shandong and Jiangsu increased carbon emissions by more than 20 million tons. Electricity import effect effectively alleviated the increase in carbon emissions caused by increase in population, with an average carbon emission reduction of 14.17 million tons. Electricity exports had the most significant effect on carbon emission, with an average carbon emission increase of 13.32 million tons. The development and layout of renewable energy in electricity exporting provinces such as Inner Mongolia, Shanxi, Ningxia, and Xinjiang should be modulated by local power regulators.
Cluster 3 comprised Liaoning, Jilin, and Heilongjiang provinces. Increase in carbon emission in these three provinces was more than 10 million tons. These three provinces are old industrial bases in Northeast China, and are characterized by the slowdown of economic growth, population loss, and decline in power consumption intensity. The electricity generation structure in the three provinces was optimized over time, resulting in an average carbon emissions reduction of 12.19 million tons. Notably, reduction in carbon emissions reduction and emission increase effects were not significant. The economy of the three northeastern provinces is currently recovering owing to policies such as revitalizing the old industrial base in Northeast China. Policymakers in the power industry should explore strategies to provide sustainable low-carbon power supply.
Cluster 4 comprises Zhejiang, Anhui, Fujian, Henan, and Shaanxi. These four provinces had the fastest decline in carbon emissions intensity of thermal power generation, resulting in an average reduction in carbon emission of 11.65 million tons. Reduction in carbon emissions intensity of thermal power generation in Shaanxi led to reduction in carbon emissions by 29.20 million tons, which relatively alleviated increase in carbon emissions caused by increase in economic activities (30.45 million tons). The effects of economic activities, population increase, and emissions were significantly higher compared with those of the three eastern provinces. The electricity importing and exporting volume of the provinces were small, with the exception of Zhejiang, which had a large power import volume. The other provinces only maintained the self-sufficiency of electricity supply and demand.
Cluster 5 comprises Jiangxi, Hubei, Hunan, Chongqing, Guangxi, and Guizhou provinces. The electricity generation structure of these provinces except Jiangxi whas not been optimized, leading to increase in average carbon emissions by 6.86 million tons. Moreover, Jiangxi, Hubei, Guangxi, and Guizhou showed an increase in carbon emissions due to reduction in electricity imports, whereas carbon emissions in Hubei, Hunan, Guangxi, and Guizhou decreased due to reduction in electricity exports. These provinces should pay more attention to the optimization of their own electricity generation structure and development of renewable energy power, so as to promote energy conservation and reduction in carbon emissions.
4. Conclusions
In the present study, comprehensive inter-provincial electricity transmission data from 2005 to 2019 were generated using the electricity generation–consumption downscaling model and the electricity balance equation. In addition, the IPCC accounting method was used to determine the levels of carbon emissions associated with electricity generation in 31 PGs. Furthermore, seven driving factors, including electricity imports and exports, were decomposed using the LMDI model. Moreover, the 31 PGs were divided into five clusters according to the characteristics of these driving factors using random forest clustering algorithm to further explore the effects of electricity trading on reduction in carbon emissions and policy implications.
The main findings of the present study are: (i) Electricity imports and exports significantly modulate the levels of carbon emission in PGs, ultimately affecting realization of carbon peak and carbon neutrality of the whole country. The effects of electricity import and export were significantly higher that the effect of population growth in some PGs, compared with traditional drivers (electricity consumption intensity, economic activity, and population growth), indicating that electricity trading was a significant driver of carbon emissions’ growth or reduction in the region. (ii) The findings showed that emission reductions would only occur at the national level when the carbon intensity of the exporting PGs was lower compared with that of the importing PGs, as well as when the electricity trading was generated from renewable sources. Therefore, to the country should promote utilization of clean energy and green electricity from the trading grid to minimize carbon emission. (iii) Strategies to determine consumption-based emissions should be promoted in order to achieve sustainable development and regional equity. PGs should increase electricity import to reduce local carbon emissions from electricity production. The findings showed that carbon emissions are markedly high in electricity-exporting PGs. Policymakers should extensively evaluate inter-provincial and inter-regional electricity trading to ensure that power transmission is effectively regulated and sustainable from a national point of view.
Author Contributions
Conceptualization, Y.L. (Yanfeng Li) and Y.L. (Yongping Li); methodology, Y.L. (Yanfeng Li) and Y.L. (Yongping Li); software, Y.L. (Yanfeng Li) and R.Z.; validation, Y.L. (Yanfeng Li); data analysis, Y.L. (Yanfeng Li) and R.Z.; investigation, Y.L. (Yongping Li) and G.H.; resources, Y.L. (Yongping Li) and G.H.; data curation, Y.L. (Yanfeng Li); writing—original draft preparation, Y.L. (Yanfeng Li) and R.Z.; writing—review and editing, Y.L. (Yongping Li) and G.H.; visualization, Y.L. (Yanfeng Li) and R.Z.; supervision, Y.L. (Yongping Li) and G.H.; project administration, Y.L. (Yongping Li) and G.H.; funding acquisition, Y.L. (Yongping Li) and G.H. All authors have read and agreed to the published version of the manuscript.
Funding
This research was financially supported by the Strategic Priority Research Program of Chinese Academy of Sciences (grant No. XDA20060302), the National Foreign Expert Project (grant Nos. G2021111016L and G2021111017L).
Institutional Review Board Statement
Not applicable.
Informed Consent Statement
Not applicable.
Data Availability Statement
Not applicable.
Conflicts of Interest
The authors declare no conflict of interest.
References
- Ji, L.; Liang, S.; Qu, S.; Zhang, Y.; Xu, M.; Jia, X.; Jia, Y.; Niu, D.; Yuan, J.; Hou, Y.; et al. Greenhouse gas emission factors of purchased electricity from interconnected grids. Appl. Energy 2016, 184, 751–758. [Google Scholar] [CrossRef]
- Qu, S.; Liang, S.; Xu, M. CO2 Emissions Embodied in Interprovincial Electricity Transmissions in China. Environ. Sci. Technol. 2017, 51, 10893–10902. [Google Scholar] [CrossRef] [PubMed]
- Ma, S.; Liu, Q.; Zhang, W. Examining the Effects of Installed Capacity Mix and Capacity Factor on Aggregate Carbon Intensity for Electricity Generation in China. Int. J. Environ. Res. Public Health 2022, 19, 3471. [Google Scholar] [CrossRef] [PubMed]
- Ji, L.; Huang, G.H.; Niu, D.X.; Cai, Y.P.; Yin, J.G. A stochastic optimization model for carbon-emission reduction investment and sustainable energy planning under cost-risk control. J. Environ. Inform. 2020, 36, 107–118. [Google Scholar] [CrossRef]
- Kang, J.D.; Ng, T.S.; Su, B.; Yuan, R. Optimizing the Chinese Electricity Mix for CO2 Emission Reduction: An Input-Output Linear Programming Model with Endogenous Capital. Environ. Sci. Technol. 2020, 54, 697–706. [Google Scholar] [CrossRef] [PubMed]
- Li, W.; Long, R.; Zhang, L.; Cheng, X.; He, Z.; Chen, F. How the uptake of electric vehicles in China leads to emissions transfer: An Analysis from the perspective of inter-provincial electricity trading. Sustain. Prod. Consum. 2021, 28, 1006–1017. [Google Scholar] [CrossRef]
- Wang, F.; Shackman, J.; Liu, X. Carbon emission flow in the power industry and provincial CO2 emissions: Evidence from cross-provincial secondary energy trading in China. J. Clean. Prod. 2017, 159, 397–409. [Google Scholar] [CrossRef]
- China Electricity Council. Electricity Industry Statistics Compilation 2005–2019; China Electricity Council: Beijng, China, 2020. (In Chinese) [Google Scholar]
- Mei, H.; Li, Y.P.; Lv, J.; Chen, X.J.; Lu, C.; Suo, C.; Ma, Y. Development of an integrated method (Mgcms-sca-fer) for assessing the impacts of climate change—A case study of jing-jin-ji region. J. Environ. Inform. 2021, 38, 145–161. [Google Scholar] [CrossRef]
- Karmellos, M.; Kosmadakis, V.; Dimas, P.; Tsakanikas, A.; Fylaktos, N.; Taliotis, C.; Zachariadis, T. A decomposition and decoupling analysis of carbon dioxide emissions from electricity generation: Evidence from the EU-27 and the UK. Energy 2021, 231, 120861. [Google Scholar] [CrossRef]
- Zhao, Y.; Cao, Y.; Shi, X.; Zhang, Z.; Zhang, W. Structural and technological determinants of carbon intensity reduction of China’s electricity generation. Environ. Sci. Pollut. Res. 2020, 28, 13469–13486. [Google Scholar] [CrossRef]
- Wang, Y.; Yan, Q.; Li, Z.; Baležentis, T.; Zhang, Y.; Gang, L.; Streimikiene, D. Aggregate carbon intensity of China’s thermal electricity generation: The inequality analysis and nested spatial decomposition. J. Clean. Prod. 2020, 247, 119139. [Google Scholar] [CrossRef]
- Liu, N.; Ma, Z.; Kang, J. A regional analysis of carbon intensities of electricity generation in China. Energy Econ. 2017, 67, 268–277. [Google Scholar] [CrossRef]
- Jiang, J.; Ye, B.; Xie, D.; Tang, J. Provincial-level carbon emission drivers and emission reduction strategies in China: Combining multi-layer LMDI decomposition with hierarchical clustering. J. Clean. Prod. 2017, 169, 178–190. [Google Scholar] [CrossRef]
- Diakoulaki, D.; Giannakopoulos, D.; Karellas, S. The driving factors of CO2 emissions from electricity generation in Greece: An index decomposition analysis. Int. J. Glob. Warm. 2017, 13, 382–397. [Google Scholar] [CrossRef]
- Karmellos, M.; Kopidou, D.; Diakoulaki, D. A decomposition analysis of the driving factors of CO2 (Carbon dioxide) emissions from the power sector in the European Union countries. Energy 2016, 94, 680–692. [Google Scholar] [CrossRef]
- Liao, C.; Wang, S.; Fang, J.; Zheng, H.; Liu, J.; Zhang, Y. Driving forces of provincial-level CO2 emissions in China’s power sector based on LMDI method. Energy Procedia 2019, 158, 3859–3864. [Google Scholar] [CrossRef]
- Goh, T.; Ang, B.W.; Xu, X.Y. Quantifying drivers of CO2 emissions from electricity generation—Current practices and future extensions. Appl. Energy 2018, 231, 1191–1204. [Google Scholar] [CrossRef]
- Lopez, N.S.A.; Biona, J.B.M.M.; Chiu, A.S.F. Electricity trading and its effects on global carbon emissions: A decomposition analysis study. J. Clean. Prod. 2018, 195, 532–539. [Google Scholar] [CrossRef]
- Zhang, Y.; Fang, J.; Wang, S.; Yao, H. Energy-water nexus in electricity trade network: A case study of interprovincial electricity trade in China. Appl. Energy 2020, 257, 113685. [Google Scholar] [CrossRef]
- Wang, S.G.; Zhu, X.J.; Song, D.; Wen, Z.G.; Chen, B.; Feng, K.S. Drivers of CO2 emissions from power generation in China based on modified structural decomposition analysis. J. Clean. Prod. 2019, 220, 1143–1155. [Google Scholar] [CrossRef]
- Liao, C.; Wang, S.; Zhang, Y.; Song, D.; Zhang, C. Driving forces and clustering analysis of provincial-level CO2 emissions from the power sector in China from 2005 to 2015. J. Clean. Prod. 2019, 240, 118026. [Google Scholar] [CrossRef]
- He, Y.; Xing, Y.; Zeng, X.; Ji, Y.; Hou, H.; Zhang, Y.; Zhu, Z. Factors influencing carbon emissions from China’s electricity industry: Analysis using the combination of LMDI and K-means clustering. Environ. Impact Assess. Rev. 2022, 93, 106724. [Google Scholar] [CrossRef]
- Wen, L.; Li, Z. Provincial-level industrial CO2 emission drivers and emission reduction strategies in China: Combining two-layer LMDI method with spectral clustering. Sci. Total Environ. 2020, 700, 134374. [Google Scholar] [CrossRef] [PubMed]
- Wen, L.; Hao, Y. Factor decomposition and clustering analysis of CO2 emissions from China’s power industry based on Shapley value. Energy Sour. Part A Recovery Util. Environ. Eff. 2020, 1–17. [Google Scholar] [CrossRef]
- Shi, T.; Seligson, D.; Belldegrun, A.S.; Palotie, A.; Horvath, S. Tumor classification by tissue microarray profiling: Random forest clustering applied to renal cell carcinoma. Mod. Pathol. 2005, 18, 547–557. [Google Scholar] [CrossRef] [PubMed] [Green Version]
- Perbet, F.; Stenger, B.; Maki, A. Random Forest Clustering and Application to Video Segmentation; Citeseer: Princeton, NJ, USA, 2009. [Google Scholar]
- Conrad, D.J.; Bailey, B.A. Multidimensional clinical phenotyping of an adult cystic fibrosis patient population. PLoS ONE 2015, 10, e0122705. [Google Scholar] [CrossRef]
- Denaro, K.; Sato, B.; Harlow, A.; Aebersold, A.; Verma, M. Comparison of Cluster Analysis Methodologies for Characterization of Classroom Observation Protocol for Undergraduate STEM (COPUS) Data. CBE—Life Sci. Educ. 2021, 20, ar3. [Google Scholar] [CrossRef]
- Qu, S.; Wang, H.; Liang, S.; Shapiro, A.M.; Suh, S.; Sheldon, S.; Zik, O.; Fang, H.; Xu, M. A Quasi-Input-Output model to improve the estimation of emission factors for purchased electricity from interconnected grids. Appl. Energy 2017, 200, 249–259. [Google Scholar] [CrossRef]
- Lopez, N.S.A.; Mousavi, B.; Biona, J.B.M.M.; Chiu, A.S.F. Decomposition analysis of CO2 emissions with emphasis on electricity imports and exports: EU as a model for ASEAN integration. Chem. Eng. Trans. 2017, 61, 739–744. [Google Scholar] [CrossRef]
- Vitrano, A.; Musallam, K.M.; Meloni, A.; Addario Pollina, S.; Karimi, M.; El-Beshlawy, A.; Hajipour, M.; Di Marco, V.; Ansari, S.H.; Filosa, A.; et al. Random Forest Clustering Identifies Three Subgroups of β-Thalassemia with Distinct Clinical Severity. Thalass. Rep. 2022, 12, 14–23. [Google Scholar] [CrossRef]
- Wang, H.; Wang, W.; Liang, S.; Zhang, C.; Qu, S.; Liang, Y.; Li, Y.; Xu, M.; Yang, Z. Determinants of Greenhouse Gas Emissions from Interconnected Grids in China. Environ. Sci. Technol. 2019, 53, 1432–1440. [Google Scholar] [CrossRef] [PubMed]
- Intergovernmental Panel on Climate Change. Fifth Assessment Report, Working Group III, Summary for Policymakers. 2014. Available online: https://www.ipcc.ch/report/ar5/wg3/ (accessed on 23 February 2022).
- Intergovernmental Panel on Climate Change. 2006 IPCC Guidelines for National Greenhouse Gas Inventories; The Institute for Global Environmental Strategies: Hayama, Japan, 2006. Available online: https://www.ipcc.ch/report/2006-ipcc-guidelines-for-national-greenhouse-gas-inventories/ (accessed on 23 February 2022).
- National Bureau of Statistics. China Energy Statistical Yearbook 2006–2020; People’s Republic of China, China Statistics Press: Beijing, China, 2020; (In Chinese). Available online: https://data.cnki.net/Trade/yearbook/single/N2021050066?zcode=Z025 (accessed on 15 February 2022).
- Shan, Y.; Huang, Q.; Guan, D.; Hubacek, K. China CO2 emission accounts 2016–2017. Sci. Data 2020, 7, 54. [Google Scholar] [CrossRef] [PubMed] [Green Version]
- Shan, Y.; Guan, D.; Zheng, H.; Ou, J.; Li, Y.; Meng, J.; Mi, Z.; Liu, Z.; Zhang, Q. China CO2 emission accounts 1997–2015. Sci. Data 2018, 5, 170201. [Google Scholar] [CrossRef] [PubMed] [Green Version]
- Shan, Y.; Zheng, H.; Guan, D.; Li, C.; Mi, Z.; Meng, J.; Schroeder, H.; Ma, J.; Ma, Z. Energy consumption and CO2 emissions in Tibet and its cities in 2014. Earths Future 2017, 5, 854–864. [Google Scholar] [CrossRef] [Green Version]
- National Bureau of Statistics. China Statistical Yearbook 2005–2019; People’s Republic of China: Beijing, China, 2020; (In Chinese). Available online: https://data.stats.gov.cn/ (accessed on 15 February 2022).
Figure 1.
Spatial distribution of subnational power grids and provincial power grids in China.

Figure 2.
Total volume of inter-provincial electricity trading and national power generation in China between 2005 and 2019.
Figure 2.
Total volume of inter-provincial electricity trading and national power generation in China between 2005 and 2019.

Figure 3.
China’s inter-provincial electricity trading flows in 2005, 2010, 2015, and 2019.

Figure 4.
The total carbon emissions from the power sector over the period between 2005 and 2019.

Figure 5.
Carbon emissions from electricity production for each province from 2005 to 2019.

Figure 6.
Contributions of different factors to carbon emissions of China’s power industry in 2005–2010, 2010–2015, and 2015–2019.
Figure 6.
Contributions of different factors to carbon emissions of China’s power industry in 2005–2010, 2010–2015, and 2015–2019.

Figure 7.
Provincial changes in carbon emissions and driving forces during 2005–2010.

Figure 8.
Provincial changes in carbon emissions and driving forces during 2010–2015.

Figure 9.
Provincial changes in carbon emissions and driving forces during 2015–2019.


Table 1.
Composition of subnational grids.
| Subnational Grids | Symbol | Provincial Grids (Abbreviations) |
|---|---|---|
| North China Grid | NCG | Beijing (BJ), Tianjin (TJ), Hebei (HEB), Shanxi (SX), Inner Mongolia (IM), Shandong (SD) |
| Northeast China grid | NEG | Liaoning (LN), Jilin (JL), Heilongjiang (HLJ) |
| East China Grid | ECG | Shanghai (SH), Jiangsu (JS), Zhejiang (ZJ), Anhui (AH), Fujian (FJ) |
| Central China Grid | CCG | Jiangxi (JX), Henan (HEN), Hubei (HUB), Hunan (HUN) |
| Northwest China grid | NWG | Shaanxi (SAX), Gansu (GS), Qinghai (QH), Ningxia (NX), Xinjiang (XJ) |
| Southwest China grid | SWG | Chongqing (CQ), Sichuan (SC), Tibet (TIB) |
| China Southern Power Grid | CSG | Guangdong (GD), Guangxi (GX), Hainan (HN), Guizhou (GZ), Yunnan (YN) |
Table 2.
Clustering factors and results of random forest clustering during 2015–2019 period.
| Clusters | PGs | ||||||||
|---|---|---|---|---|---|---|---|---|---|
| 1 | BJ | −0.31 | −1.49 | −0.28 | 4.17 | −5.93 | −0.86 | 4.21 | −0.13 |
| TJ | 4.06 | −0.09 | −1.36 | 14.48 | −13.46 | −3.84 | 7.87 | 0.47 | |
| SH | −0.54 | −0.67 | −1.03 | 6.57 | −12.20 | −9.19 | 15.64 | 0.33 | |
| GS | 8.96 | −0.03 | −9.63 | 22.78 | −13.99 | −4.21 | 12.93 | 1.11 | |
| QH | −2.12 | −0.83 | −5.29 | 2.59 | 0.63 | −1.73 | 2.21 | 0.31 | |
| SC | 0.51 | −5.12 | −3.04 | −2.79 | −0.93 | −0.95 | 12.43 | 0.91 | |
| TIB | 0.07 | 0.00 | 0.03 | 0.01 | 0.00 | 0.01 | 0.01 | 0.00 | |
| HN | −0.80 | 0.77 | −6.31 | −0.06 | 0.61 | 0.19 | 3.42 | 0.58 | |
| YN | 6.28 | 1.54 | −5.40 | 2.37 | 0.09 | −3.55 | 10.43 | 0.81 | |
| Cluster 1’s mean | 1.79 | −0.66 | −3.59 | 5.57 | −5.02 | −2.68 | 7.68 | 0.49 | |
| 2 | HEB | 75.34 | 44.50 | −26.90 | −29.12 | 37.46 | −15.89 | 59.64 | 5.66 |
| SX | 56.56 | 10.86 | −16.17 | 16.11 | −12.44 | 7.68 | 46.65 | 3.88 | |
| IM | 132.65 | 13.71 | −16.87 | 24.79 | −38.57 | 63.59 | 81.26 | 4.74 | |
| SD | 36.56 | 20.57 | −34.24 | 14.33 | −36.91 | −22.26 | 86.70 | 8.36 | |
| JS | 38.40 | 22.25 | −27.53 | 2.81 | −25.05 | −20.82 | 82.94 | 3.81 | |
| NX | 41.04 | 9.51 | −8.68 | 45.69 | −27.80 | −6.40 | 24.52 | 4.21 | |
| XJ | 68.72 | 9.57 | −16.74 | 19.01 | −0.43 | 3.69 | 40.10 | 13.52 | |
| GD | 29.31 | 2.46 | −28.16 | 13.01 | −9.59 | −8.64 | 46.86 | 13.38 | |
| Cluster 2’s mean | 59.82 | 16.68 | −21.91 | 13.33 | −14.17 | 0.12 | 58.58 | 7.19 | |
| 3 | LN | 10.52 | 3.60 | −22.55 | 3.45 | −1.11 | 5.31 | 22.81 | −0.98 |
| JL | 10.53 | −1.75 | −6.55 | 4.55 | 1.91 | −0.45 | 14.38 | −1.57 | |
| HLJ | 10.01 | 2.27 | −7.47 | 2.79 | 1.80 | −3.79 | 15.67 | −1.26 | |
| Cluster 3’s mean | 10.36 | 1.37 | −12.19 | 3.60 | 0.87 | 0.36 | 17.62 | −1.27 | |
| 4 | ZJ | 10.08 | −8.54 | −8.57 | 5.75 | −21.93 | −0.15 | 35.08 | 8.44 |
| AH | 45.26 | −5.32 | −7.76 | 11.50 | −12.28 | 4.26 | 48.67 | 6.20 | |
| FJ | 22.59 | −0.27 | −7.21 | 4.96 | 0.05 | −4.85 | 26.60 | 3.30 | |
| HN | −11.23 | −14.92 | −15.15 | −2.06 | −9.72 | −27.06 | 54.39 | 3.30 | |
| SAX | 23.74 | −29.20 | −7.56 | 4.62 | 3.80 | 19.12 | 30.45 | 2.52 | |
| Cluster 4’s mean | 18.09 | −11.65 | −9.25 | 4.95 | −8.02 | −1.74 | 39.04 | 4.75 | |
| 5 | JX | 23.41 | −1.98 | −0.68 | 0.03 | 0.82 | 1.12 | 22.52 | 1.58 |
| HB | 28.68 | −4.87 | 12.25 | −7.67 | 2.87 | −1.24 | 26.17 | 1.17 | |
| HN | 17.63 | 1.79 | 2.01 | −1.01 | −1.59 | −3.20 | 18.35 | 1.28 | |
| CQ | 8.16 | 0.03 | 1.40 | 1.47 | −5.77 | −1.10 | 10.78 | 1.37 | |
| GX | 44.41 | 7.18 | 16.87 | −17.20 | 15.22 | 6.06 | 14.17 | 2.10 | |
| GZ | 28.56 | 5.36 | 9.29 | −10.55 | 0.25 | −8.21 | 30.10 | 2.32 | |
| Cluster 5’s mean | 25.14 | 1.25 | 6.86 | −5.82 | 1.97 | −1.10 | 20.35 | 1.64 | |
Publisher’s Note: MDPI stays neutral with regard to jurisdictional claims in published maps and institutional affiliations. |
© 2022 by the authors. Licensee MDPI, Basel, Switzerland. This article is an open access article distributed under the terms and conditions of the Creative Commons Attribution (CC BY) license (https://creativecommons.org/licenses/by/4.0/).
Share and Cite
MDPI and ACS Style
Li, Y.; Li, Y.; Huang, G.; Zheng, R. Inter-Provincial Electricity Trading and Its Effects on Carbon Emissions from the Power Industry. Energies 2022, 15, 3601. https://0-doi-org.brum.beds.ac.uk/10.3390/en15103601
AMA Style
Li Y, Li Y, Huang G, Zheng R. Inter-Provincial Electricity Trading and Its Effects on Carbon Emissions from the Power Industry. Energies. 2022; 15(10):3601. https://0-doi-org.brum.beds.ac.uk/10.3390/en15103601
Chicago/Turabian StyleLi, Yanfeng, Yongping Li, Guohe Huang, and Rubing Zheng. 2022. "Inter-Provincial Electricity Trading and Its Effects on Carbon Emissions from the Power Industry" Energies 15, no. 10: 3601. https://0-doi-org.brum.beds.ac.uk/10.3390/en15103601
Note that from the first issue of 2016, this journal uses article numbers instead of page numbers. See further details here.