
Data Mining-Based Cyber-Physical Attack Detection Tool for Attack-Resilient Adaptive Protective Relays


Department of Electrical and Computer Engineering, University of Waterloo, Waterloo, ON N2L 3G1, Canada
*
Author to whom correspondence should be addressed.
Energies 2022, 15(12), 4328; https://0-doi-org.brum.beds.ac.uk/10.3390/en15124328
Submission received: 1 May 2022
/
Revised: 7 June 2022
/
Accepted: 7 June 2022
/
Published: 13 June 2022
(This article belongs to the Special Issue Secure and Efficient Communication in Smart Grids)
Abstract
:Maintaining proper operation of adaptive protection schemes is one of the main challenges that must be considered for smart grid deployment. The use of reliable cyber detection and protection systems boosts the preparedness potential of the network as required by National Infrastructure Protection Plans (NIPPS). In an effort to enhance grid cyber-physical resilience, this paper proposes a tool to enable attack detection in protective relays to tackle the problem of compromising their online settings by cyber attackers. Implementing the tool first involves an offline phase in which Monte Carlo simulation is used to generate a training dataset. Using rough set classification, a set of If-Then rules is obtained for each relay and loaded to the relays at the initialization stage. The second phase occurs during online operation, with each updated setting checked by the corresponding relay’s built-in tool to determine whether the settings received are genuine or compromised. A test dataset was generated to assess tool performance using the modified IEEE 34-bus test feeder. Several assessment measures have been used for performance evaluation and their results demonstrate the tool’s superior ability to classify settings efficiently using physical properties only.
1. Introduction
Continuous research is dedicated to developing methods to improve existing security tools to better fit the nature of smart grids. However, there is no perfect security scheme for every potential threat. Instead, the new concept of resilience has emerged as a strategic objective in power system planning. Grid resilience is related to the power system’s ability to continue operating and delivering power even in the event of low-probability, high-consequence disruptions such as cyber-physical attacks. Grid resilience objectives focus on managing and/or minimizing potential consequences resulting from these disruptions.
Cyber attacks can result in critical disruptions and other consequences for different targets in the power grid. From a cybersecurity perspective, the attack on the relay can result in either a relay sending a tripping signal when it should not or failing to send that signal when it should. From a power system viewpoint, incorrect settings have a considerable effect on grid operation. False tripping interrupts network customers unnecessarily, degrading network reliability. Further, it causes component outages that can sometimes initiate cascading failure, disturbing grid stability. A real-life example is the cyber attack that targeted the substations of the Ukrainian power grid in December 2015 [1]. The attack interrupted approximately 225,000 customers by several circuit breakers tripping. As a result of this attack, research interest has been directed toward studying the cyber-physical vulnerabilities of substations.
Due to the recent advancement in technologies and equipment introduced to the network, designing a reliable protection scheme for smart grids has become more complicated. To overcome new protection challenges, several solutions have been proposed. A review of these solutions was carried out in [2], with a discussion of the practical limitations of each. The study concluded that adaptive protection schemes are the best approach to handling these challenges with the help of communication-assisted relays [3,4,5,6,7,8,9] due to their flexibility in modifying both relay settings and characteristics online using external signals [10]. In the literature, the techniques used in adaptive relays differ. First, some schemes suggest sending the network status (DGs connected/disconnected, network configuration, etc.) to the relay through communication. Then, the relay itself can calculate the appropriate settings for each case [3,4,5]. The drawback of this technique is the time delay that arises while the relay calculates the settings because grid protection applications are time sensitive. Second, other schemes propose calculating different settings offline and pre-storing them in relays. The relay should match the real-time scenario, based on the network status received through communication, with the pre-stored data to obtain the appropriate settings, as used in [6]. However, it is not realistic to obtain and establish a manageable number of relay setting groups that could cover all possible scenarios in the network [7]. Third, to overcome the drawbacks of the previous approaches, an alternative approach was adopted [7,8,9], whereby an updated setting that fits the exact existing situation is sent directly to the adaptive relay. However, the problem of compromising these settings due to the cyber vulnerabilities of smart grids is still a matter of concern. Therefore, the focus of this paper is on developing a detection tool that can be built into microprocessor-based relays for checking the incoming settings against modification attacks. Relays will be trained to differentiate between genius and compromised settings (or erroneous settings).
Due to the growing need for deploying attack-resilient designs, there has been an increasing demand for developing cyber attack detection systems for those digital adaptive relays. In [11], a comprehensive study on the cybersecurity concerns for digital relays is presented, including settings considerations. Although the existing research addressing the attack detection problem for protection systems is still limited, solutions proposed can be classified into either developing Intrusion Detection Systems (IDS) that monitor the network for malicious patterns or using Artificial Intelligence (AI)-based methods employing the physical properties of the power system.
The authors of [12] propose a rule-based IDS for cyber threats of the IEC61850-based substations. The IDS was developed based on the collected data generated from simulated attacks on Intelligent Electronic Devices (IEDs). Detection capability is tested through genuine user activity along with simulated attacks. In [13], a probabilistic decision-tree-based IDS for the IEDs in IEC61850-based substations was developed. Simulated attacks on IEDs have been used to obtain two types of genuine user activity (casual browsing of data and downloading IED data) and two types of common malicious IED attacks (DOS and password crack attacks). The authors of [14] performed systematic extraction of intrusion events within a substation for its proposed detection method. Different scenarios, including single and multiple attacks on more than one substation, are simulated in this work. These methods can effectively identify some cyberattacks against IEC 61850 and IEDs by investigating the footprints of the attacker’s logs. However, they are not able to detect new or previously unknown cyberattacks. Therefore, after installation, they will require additional maintenance effort to keep their signature database updated.
In addition to previously unknown attacks, false data injection (FDI) and Man-in-the-middle (MITM) attacks can target the payload of communication packets. Hence, sensor readings or relay settings can be modified to cause undesired actions without being noticed. The detection of such complex attacks is better recognized using advanced data analytics and AI methods with the help of power system properties. In [15], a deep-learning-based detection system was proposed, which was trained using voltage and current measurements resulting from the simulation of different types of faults. In this way, the proposed detection system can detect the maliciously injected voltage and current measurements. The authors of [16] propose a new model for cyber attack detection on SAS by utilizing criteria from both cyber and physical domains. The method uses protection coordination principles to help check the changes in protection settings. The method also runs real-time power system analysis to assess the consequences of the control commands. This method can protect against sensor data injection and direct circuit breaker control attacks. In [17], an artificial intelligence expert system-based model was used for characterizing the power system in a multi-agent microgrid security framework. The model can detect malicious and erroneous CB switching commands. The authors of [18] used physical limitations to help the Network Intrusion Detection System (NIDS). The proposed IDS keeps monitoring and analyzing the network traffic exchanged within the physical system. The IDS identifies traffic that deviates from the expected communication pattern or physical limitations. The physical limitation used is a predefined range for the pickup current of the instantenous overcurrent relay; hence, anything outside this range will be considered malicious.
As noted, the use of physical properties helps IDSs detect unknown kinds of attacks. However, to the best of our knowledge, none of the existing methods address the problem of detecting compromised settings for the adaptive relays with online updated settings. In addition, the long execution time of most of these methods makes them inadequate for protection relaying applications, as will be discussed in Section 5. The main objective of this work is to fill this security gap by developing a detection tool that can be built into microprocessor-based relays to check the incoming settings against data integrity attacks. The technique proposed is based on splitting the process into two steps, offline and online, which satisfies the time requirements. This has also made it possible to implement this technique directly in a relay because, as an embedded system, it has limited computational overhead.
The rest of this paper is organized as follows: Section 2 explains the concept of rough set classification and how to apply it. Section 3 explains the proposed detection by determining system uncertainties used for the probabilistic analysis for fault calculation, modeling these uncertainties, and discussing how to generate the training dataset for the initialization phase. Section 4 holds the simulation study and generates classification rules. Section 5 tests the rules to evaluate tool performance using various measures. Finally, Section 6 concludes this paper.
2. The Rough Set-Based Rule Learning
The rough set theory was first proposed by the Polish computer scientist Zdzisław Pawlak in 1982 [19] and is concerned with classifying and analyzing imprecise knowledge [20]. The concept behind this classification is employing indiscernibility relations to evaluate to what extent two objects are similar.
2.1. Information Tables
A dataset is modeled in the form of an information table, wherein each row represents an object (a case or an event), and each column represents an attribute (a variable) that can be measured/supplied for each object [20]. Attributes are divided into two types: conditional and decisional.
Let be an information system, where (the universe) is a finite set of objects and is a finite set of attributes such that is called the value set of attributes.
2.2. Indiscernibility Relation and Set Approximation
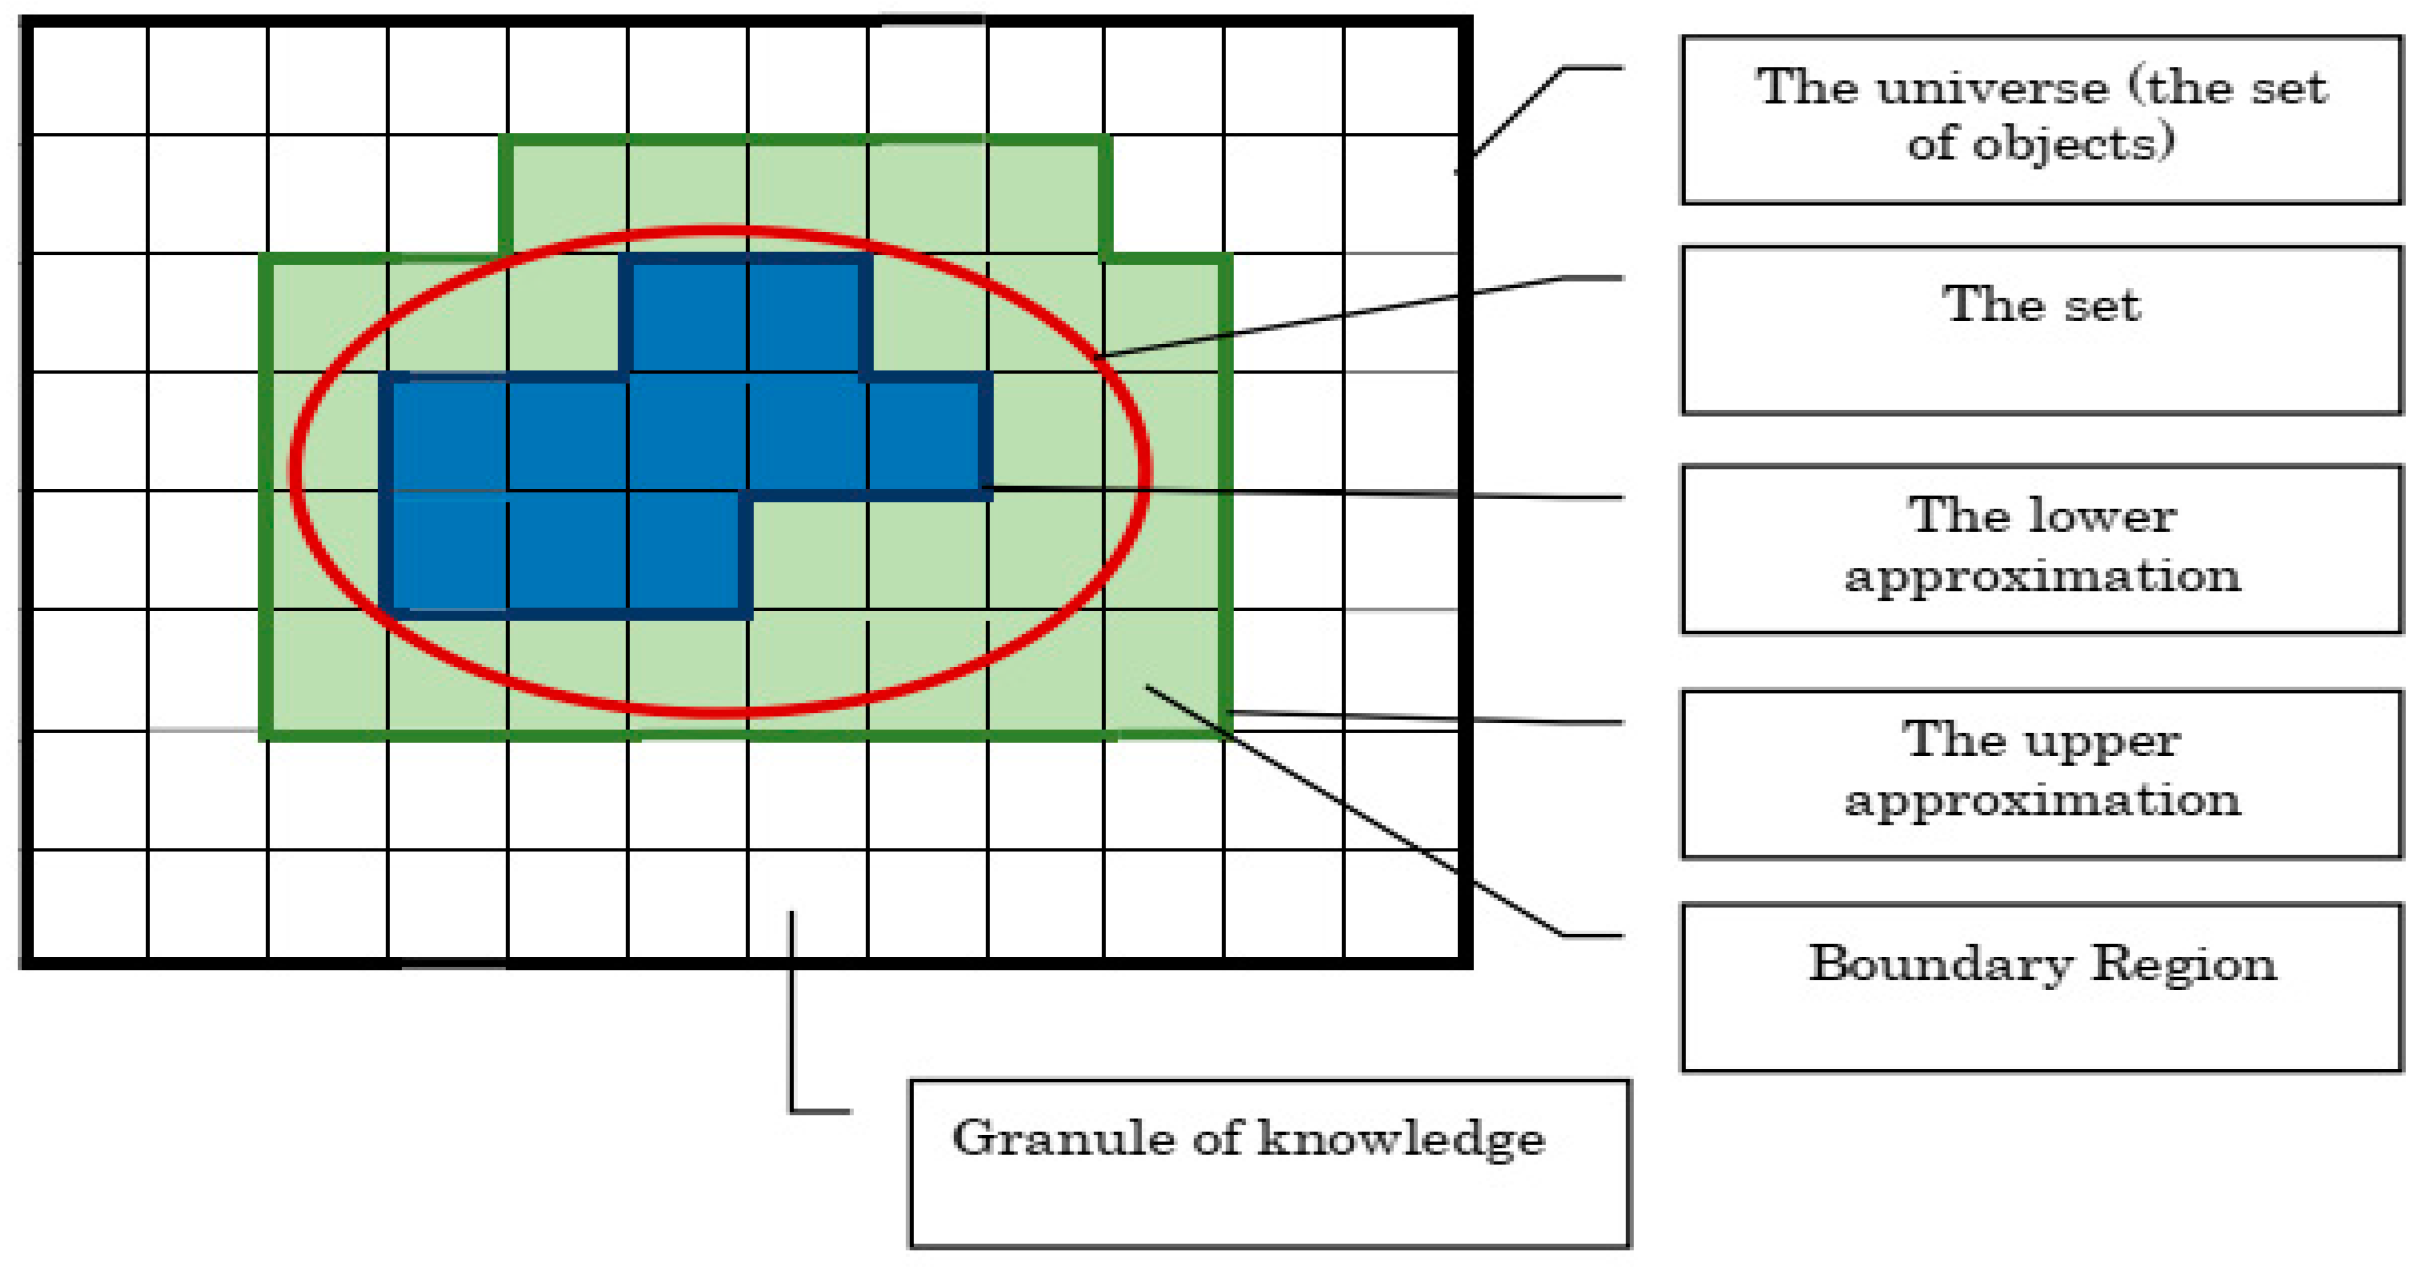
The theory sees the data as equivalence classes; in other words, sets of objects indiscernible with regard to the attributes. A rough set is a set of objects that the equivalence classes cannot exactly represent because the set may include and exclude objects which are indiscernible with regard to the attributes [21].
For any ,
where is called the P-indiscernibility relation; that is, if , then objects and are indiscernible from each other by attributes. In that way, any target set, , can be approximated using (1) the equivalence classes that are completely contained in the set (the lower approximation of or the positive region) and (2) the equivalence classes with at least one object in the set (the upper approximation of or the negative region):
Lower approximation:
Upper approximation:
where denotes the equivalence classes of the P-indiscernibility relation. Additionally, the difference between the upper and the lower approximation creates the boundary region, which consists of the objects that cannot be ruled in or out of the target set, . The representation of these approximations can be depicted in Figure 1.
2.3. Reducts
After obtaining the equivalence classes, a reduction is required to attain the set approximation by keeping only attributes that preserve the indiscernibility relation while rejecting any redundant attributes. Hence, a reduct can be defined as a minimal subset of attributes that enables the same discernibility as the whole set of attributes. In other words, it distinguishes one object from all objects with a different decision [19]. Unfortunately, finding the set of all reducts is an NP-complete problem [22]. However, finding reducts can be achieved by several approximation algorithms, e.g., greedy algorithms and genetic algorithms [22], which are all based on constructing a discernibility matrix and the corresponding discernibility functions.
2.4. Decision Rules
Based on the values for each attribute in the reduct, If-Then rules can then be generated. The Then part can include more than one decision class, depending on whether the decision class is rough with respect to the attributes in the reduct.
3. Proposed Detection Tool for Digital Relays
The arrangement of the targeted adaptive overcurrent protection scheme employs digital relays that isolate faults by taking appropriate tripping decisions based on settings obtained from a central processing unit. This unit calculates the settings required for each relay based on the current status of the network, e.g., the network topology, and connected DGs/loads.
To solve the problem of a relay’s limited computational capabilities, rough set classification can be implemented in two phases. First, the knowledge extractor generates a set of rules that will determine the normal and abnormal behavior of the system. This phase can be carried out offline during the initialization process, and its output (the set of rules) can be loaded into the relay during this process. Then, the second phase is implemented online during operation, wherein the incoming settings will be checked using the preloaded set of rules. This second phase is simple and could easily be implemented in the digital relay. The verification of the settings received can be determined by three attributes: the bus voltage of the associated relay, its line current, and the relay setting (TDS).
3.1. Probabilistic Analysis and System Uncertainties Associated with Fault Calculation
Probabilistic short circuit analysis aims to calculate a probability distribution of short circuit current magnitudes at various locations in the system. This approach can provide information on the likelihood that short circuit currents exceed/fall below certain values. In this work, the probabilistic analysis is used to build a database of:
- The bus voltages, which are considered the pre-fault voltages,
- The load currents seen by each relay before the fault occurrence, and
- The fault currents seen by each relay in the network.
To build this database, an algorithm based on Monte Carlo simulation will be developed.
Probabilistic analysis of short circuit currents for relay coordination is primarily affected by the statistical variables, which are associated with the power system operating conditions at the time of fault occurrence, namely DG availability, renewable DG levels, and loading levels. The output variables are the pre-fault voltages, loading currents, and fault currents.
3.2. Modeling of Load Demand and DG Injected Power
For load demand modeling, the load data given in the IEEE RTS [23] is used. Then, the whole year is divided into four seasons, and each season is represented by two clusters: a weekday and a weekend cluster. Consequently, the whole load curves should be classified into eight clusters (4 seasons × 2 clusters/season. The IEEE RTS assigns the same data for spring and fall, which reduces the number of clusters to six, as listed in Table 1.
Each model is intended to be denoted by a representative load curve (centroid) along with a PDF for the error around this centroid. For obtaining the centroids, the K-means clustering is applied by minimizing the squared error function between a data point that belongs to a cluster and the cluster centroid , represented by the following optimization problem,
3.3. Simulation Results
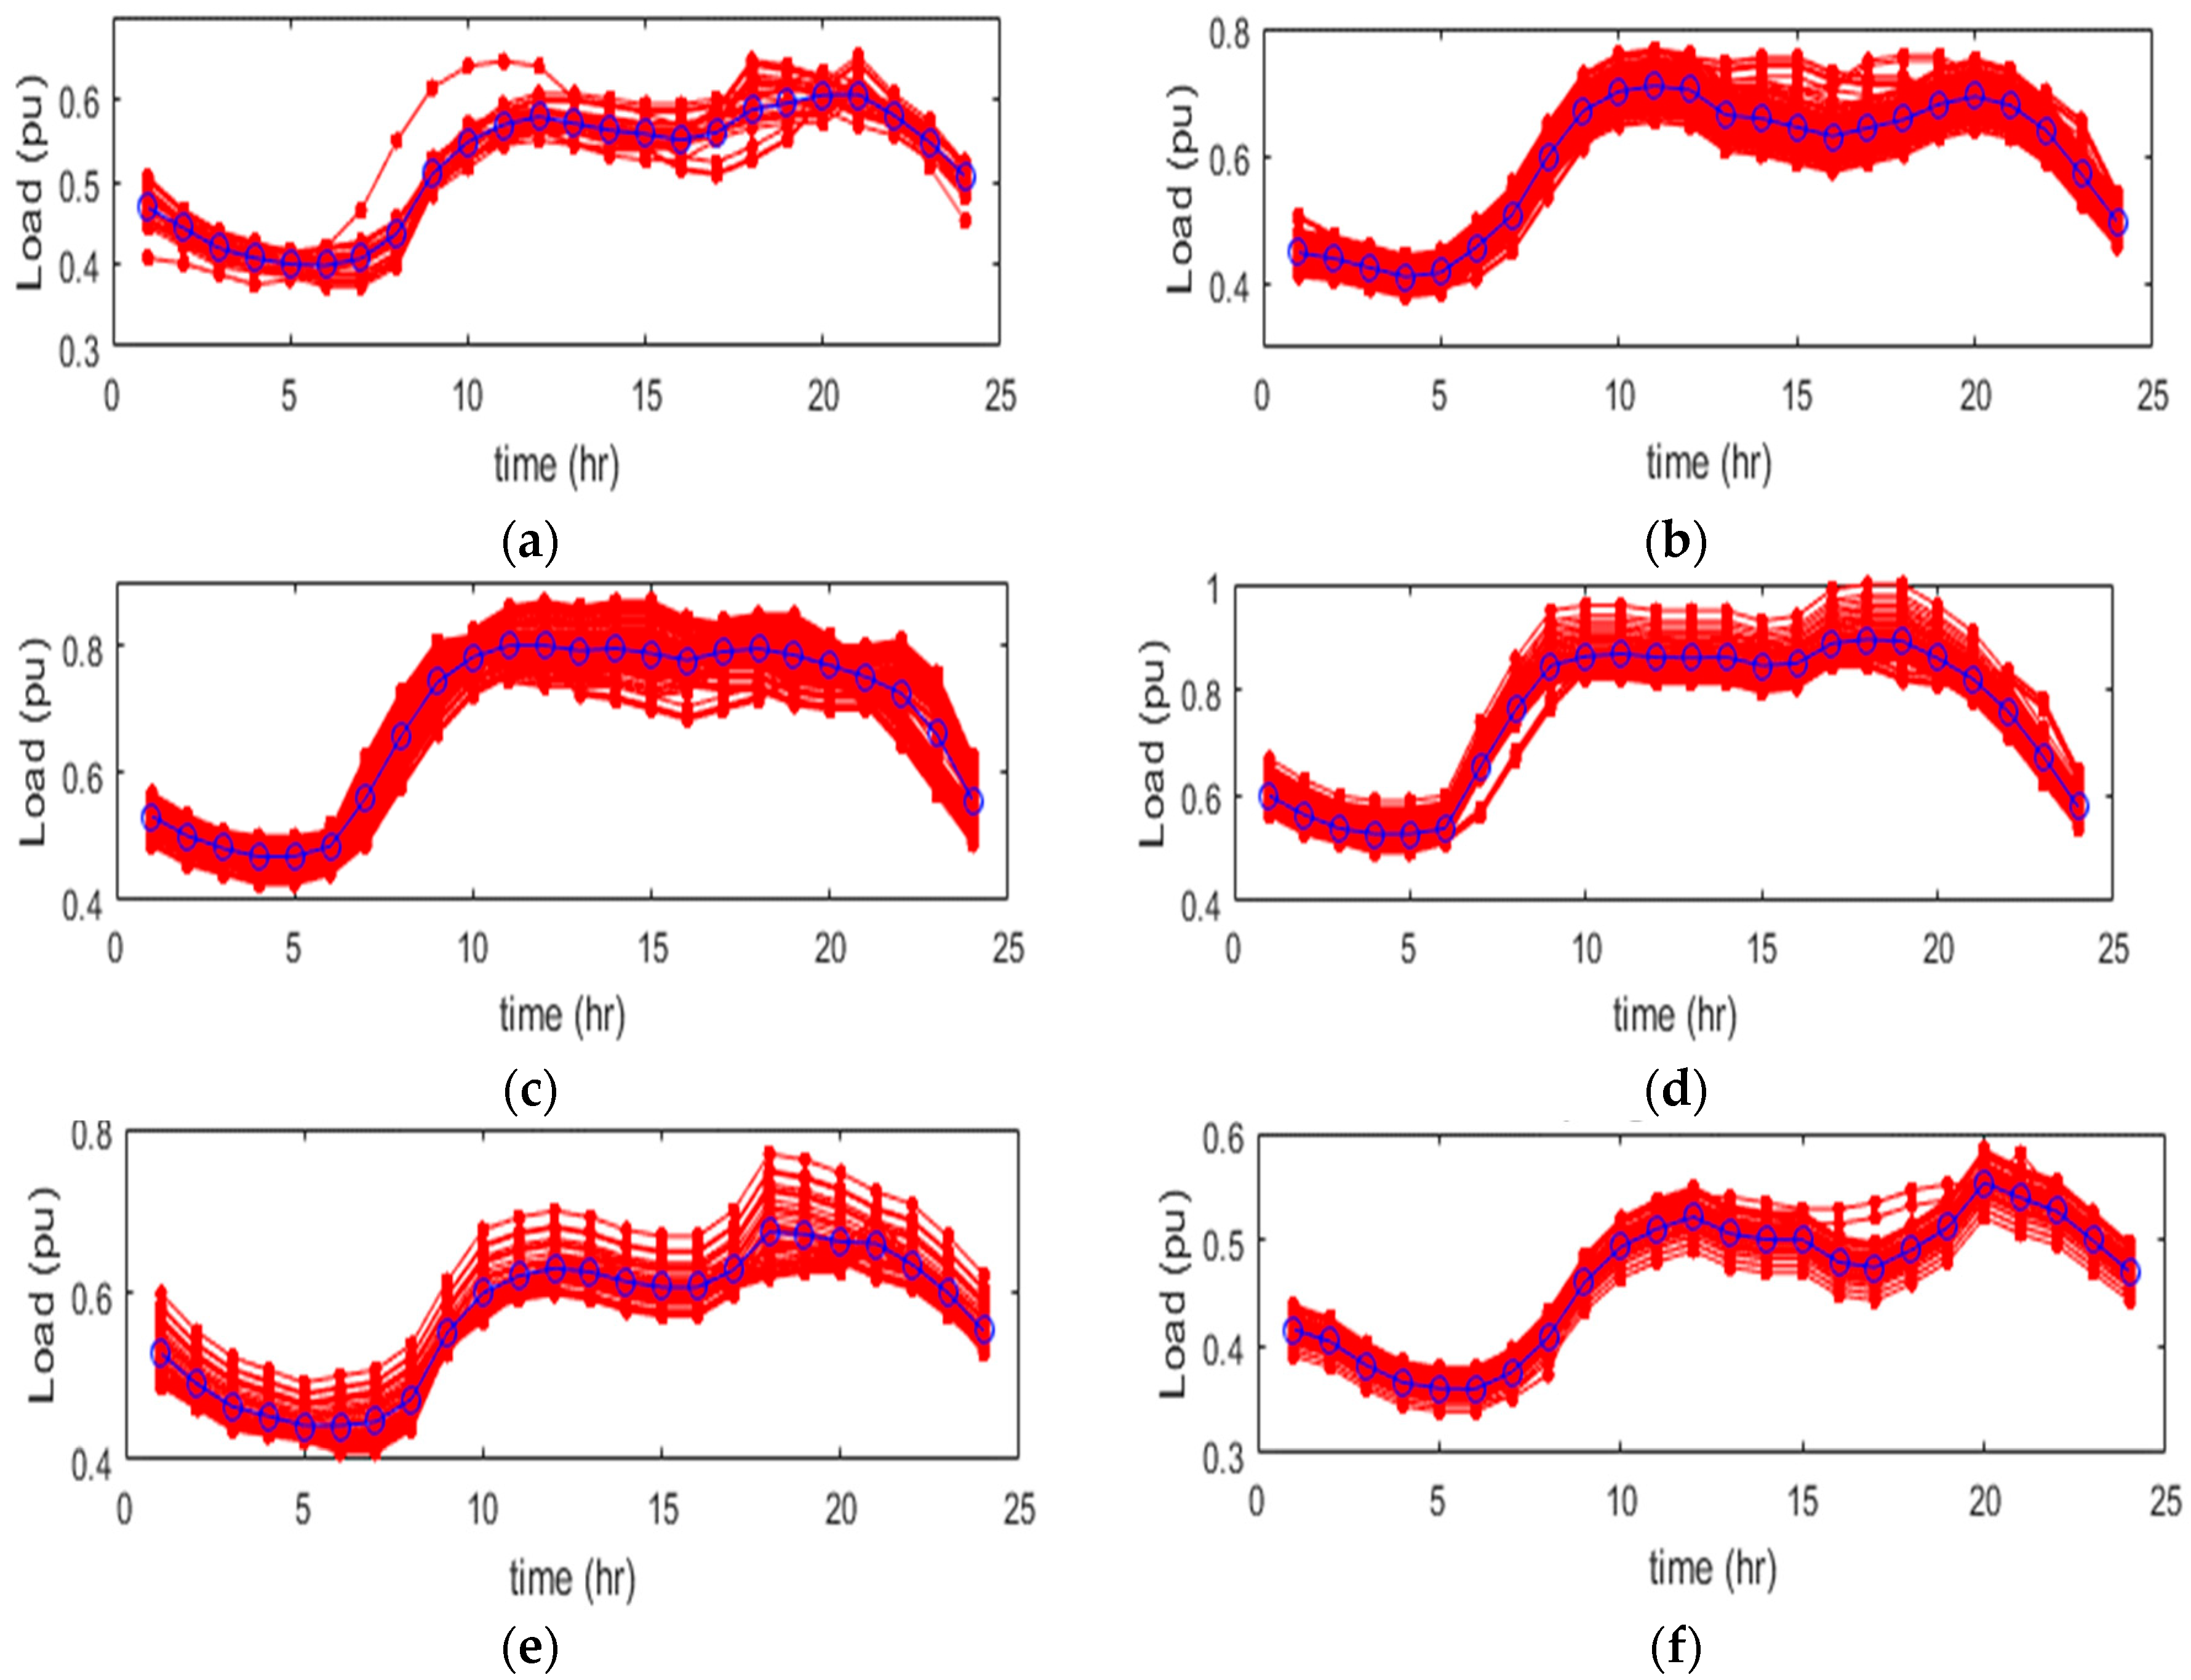
A MATLAB m-file was developed for clustering the data; the obtained centroid values for the 24 h are listed in Table 2. Each centroid is plotted with associated curves of the same cluster, and the results are presented in Figure 2.
The differences between all load curves belonging to a certain cluster and their representative load curve are calculated to select a proper PDF. The PDF for the error is best fitted to the Weibull distribution [24]. The Weibull parameters are given in Table 3, where αw, βw, and Γw are the Weibull shape, scale, and location parameters, respectively.
Similarly, DGs injected output power can be clustered. The data used are taken from [25]. The best PDF to fit the wind output power data, according to that reference, is the Johnson SB distribution during all the seasons. The Johnson SB PDF parameters obtained are shown in Table 4, where γ and δ are shape parameters, λ is a scale parameter, and ζ is a location parameter.
3.4. Proposed Algorithm for Initialization Phase
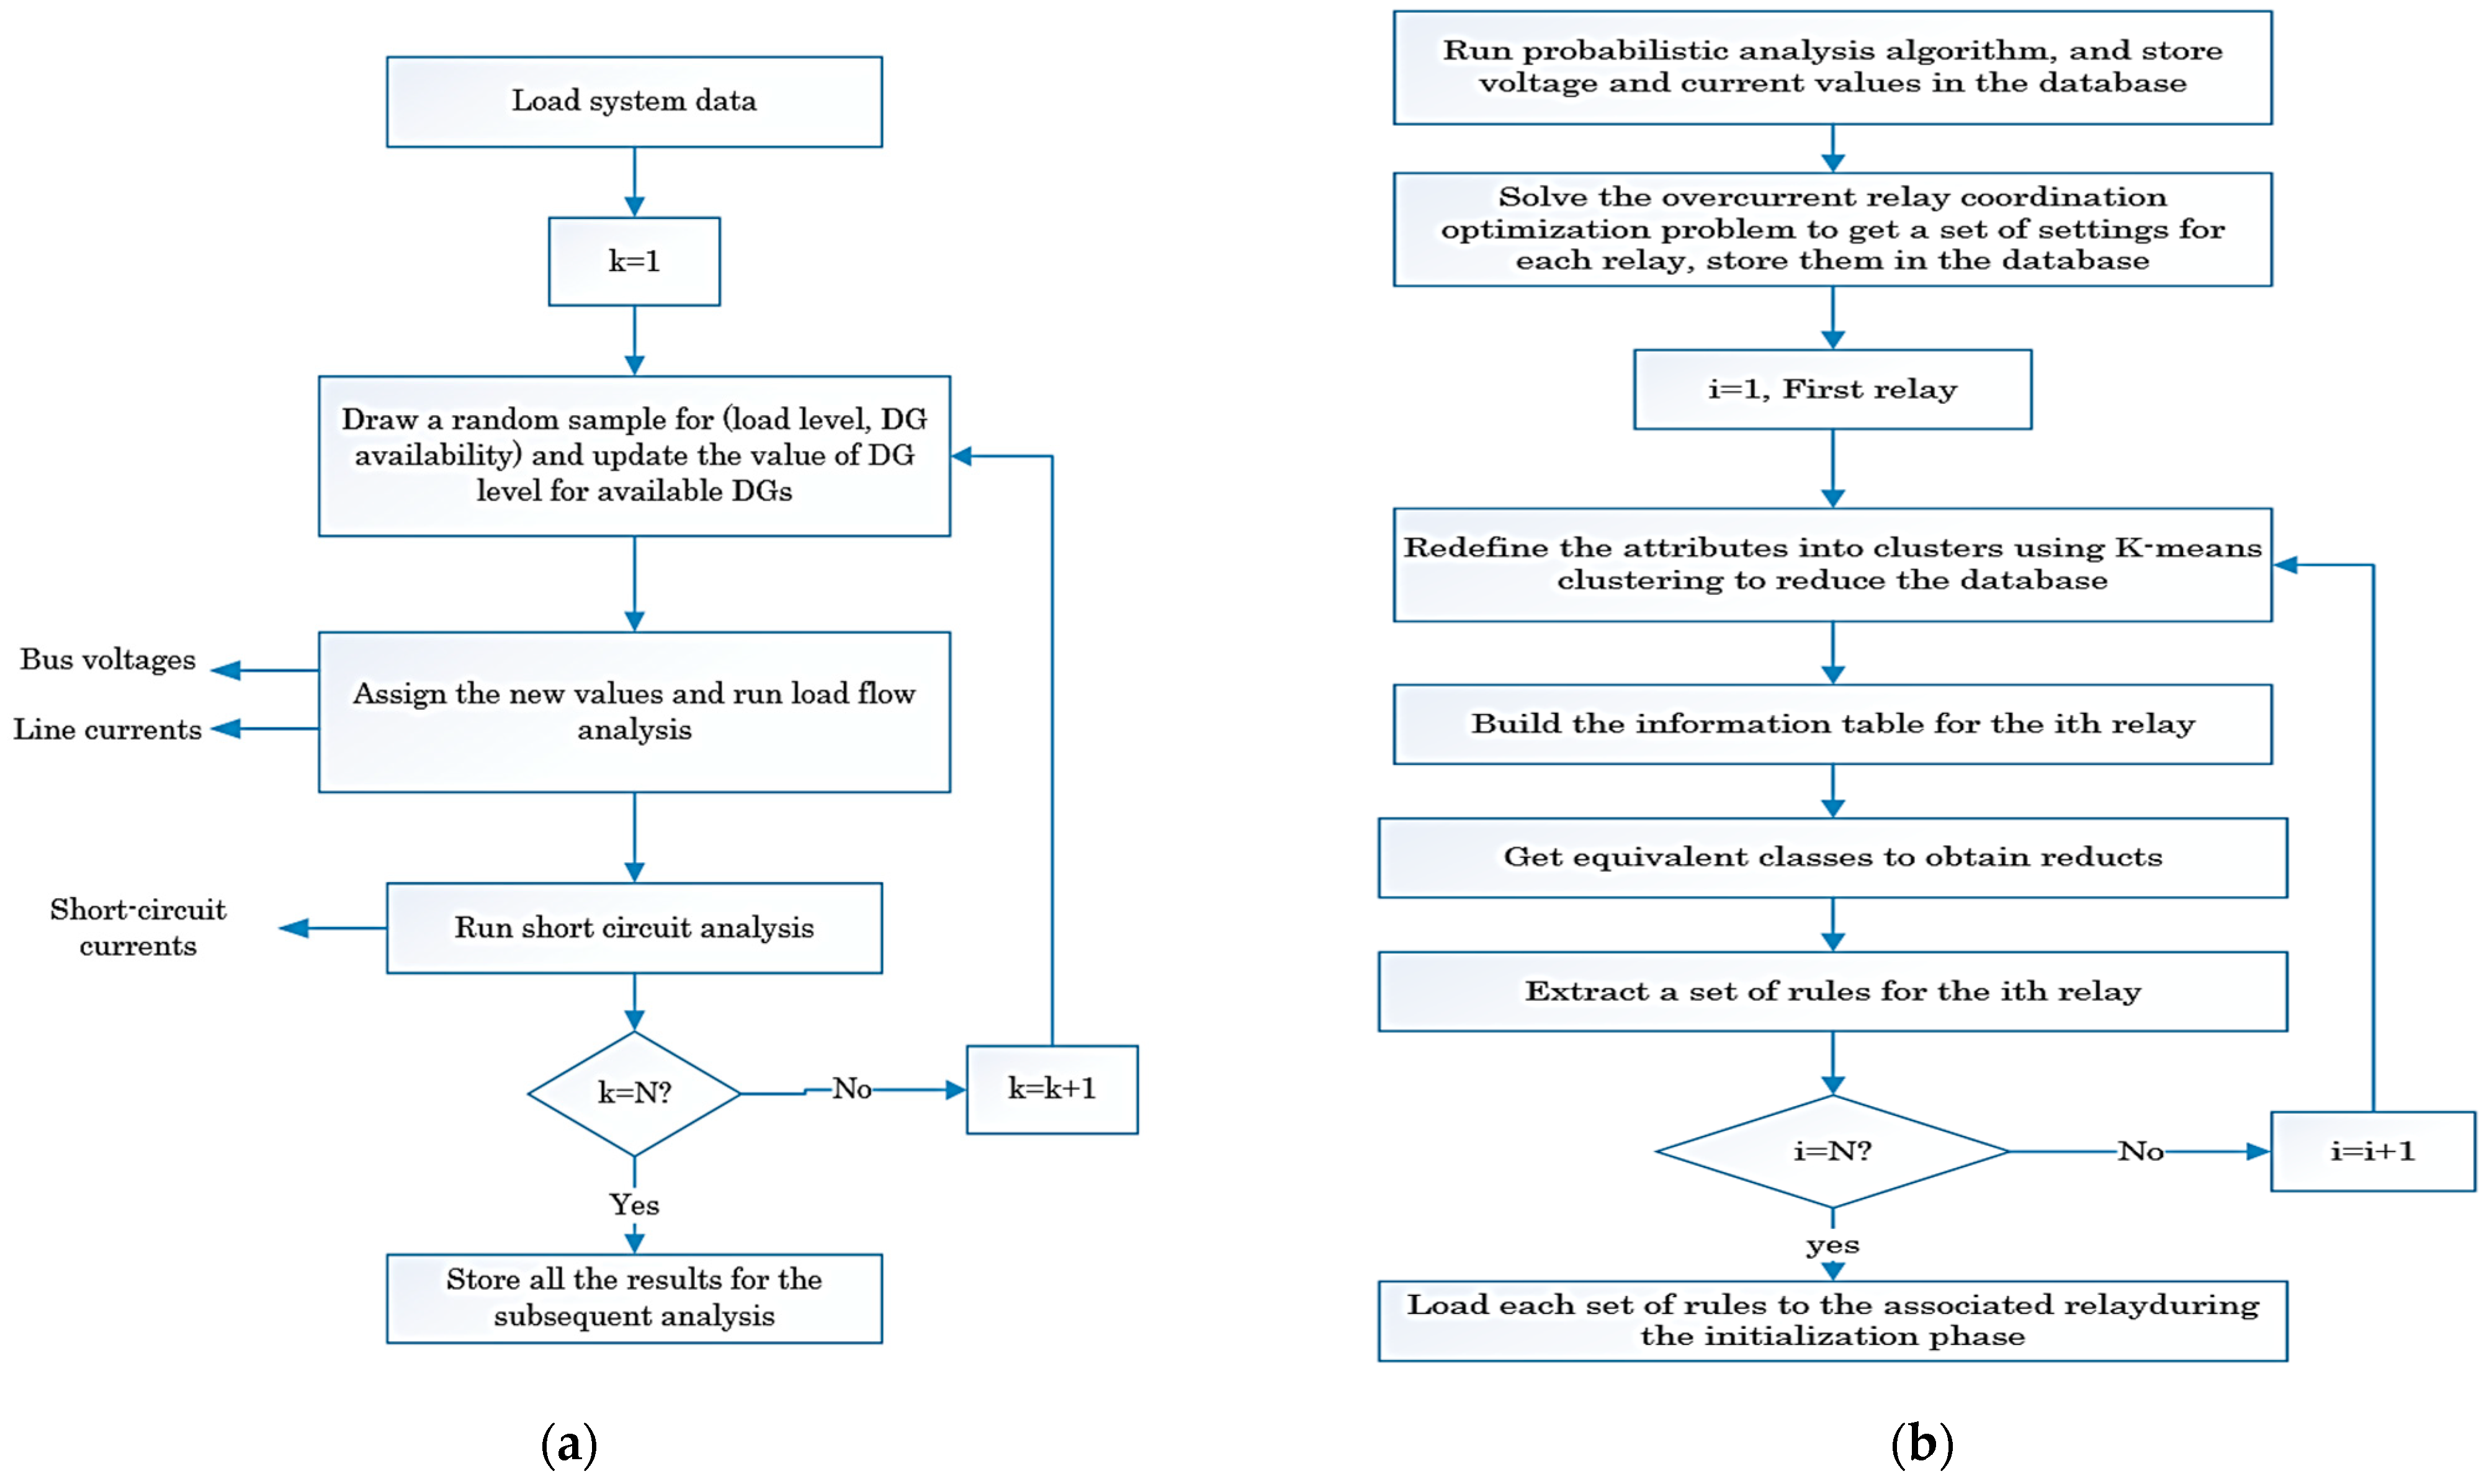
A Monte Carlo simulation-based algorithm that models the required network was developed as shown in Figure 3a. The algorithm consists of running the load flow analysis to obtain the pre-fault voltages and currents and then performing short circuit calculations to obtain short circuit currents. The outputs of this simulation are used for the second step, wherein the relay settings are calculated. For realizing the offline procedures, the flowchart shown in Figure 3b is proposed. The steps can be explained as follows.
The relay time-current characteristic can be given as [26],
where is the relay operating time and the parameters are standard values determining the degree of the inverse of the relay characteristics. is the time dial setting (relay setting). is the relay pickup current and is the short circuit current passing through the relay. An optimization problem is formulated where the objective function, denoted by ‘’, is the summation of the operating times of all relays. These times will be minimized while maintaining the conditions of protection coordination.
where is the total number of relays, and is the operating time of the relay. The weighted coefficient, is a value that depends on the probability of a short circuit fault occurring in the zone, which is assumed to be one here. This problem is subject to the following constraints,
Limits of the relay settings:
where and are the minimum and maximum TDSs for each relay, respectively.
Coordination criteria:
The time is the operating time of the backup relay, and is the set of the main/backup relay pairs. The values of each attribute can be redefined into levels/clusters to classify them based on their values. Using k-means clustering, each attribute is classified into 10 clusters. Performing this step for all the attributes can reduce the set of relations but conserves the same classification of the original set of examples.
A knowledge database (information table) must then be built. The rows will contain the events which are the study cases in this application; the columns hold the attributes. The conditional attributes in this application are the bus voltage of the associated relay and its line current, whereas the decisional attribute is the relay setting (TDS). Next, the reducts are found, and the set of rules—in the form of If-Then rules—will be generated.
4. Simulation Setup and Results
4.1. System Description
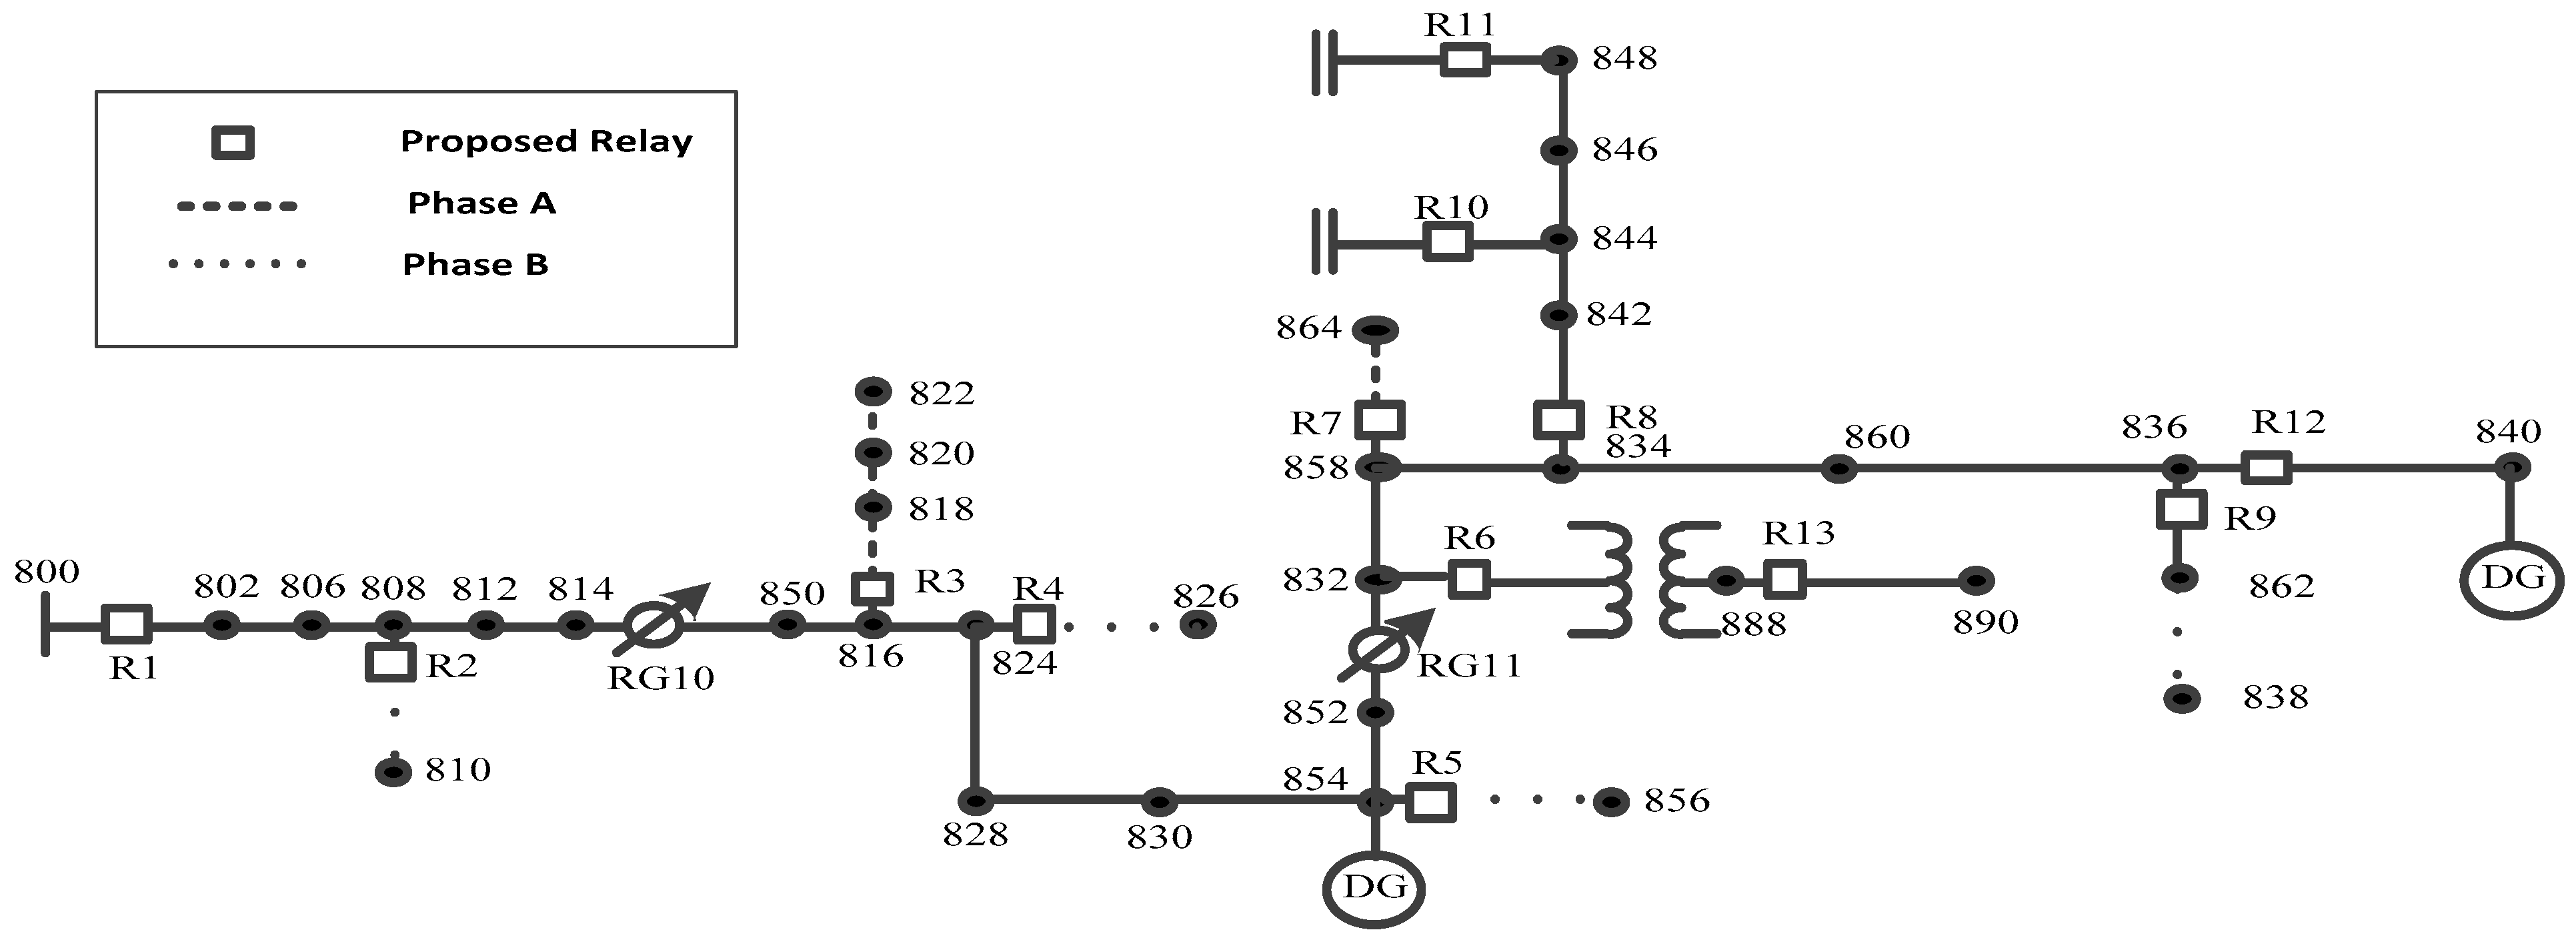
The IEEE 34-bus distribution test system [27] was adopted for this case study with some modifications. Two identical distributed generators are connected to buses 854 and 840, with an installed capacity of 336 KW each. The relays are then located as well. All relays are communicating with the central processing unit to obtain the updated settings. The single-line diagram is shown in Figure 4.
4.2. System Modeling
This system was modeled in the Electric Power Distribution System Simulator (OpenDSS) [28]. An OpenDSS script file was created to perform load flow and short circuit analysis in the presence of the DGs. This script is driven by a MATLAB m-file developed to perform Monte Carlo simulation. The DG availability’s random variable here is represented by a binomial distribution, with a probability p that the DG is connected to the network. For the DG connected to Bus 854, p = 0.9, and p = 0.5 for the one connected to bus 840. DGs are assumed to supply 50% of the load demand, shared equally between them. The simulation runs 2000 iterations, giving a maximum percentage error of the voltage mean of 0.2811% and the current mean of 3.2%, for all the relays, for a 95% confidence interval (assuming normal distribution). Using the outputs of this step, the coordinated relays TDSs are then calculated for the 2000 cases.
4.3. Rough Set and Rule Generation
Relay#1 is located at the main substation, Relay#8 protects a feeder with spot and distributed loads, and Relay#12 is located on a line that has a DG connected. Due to their importance and diversity, those relays are selected for testing. For these relays, each voltage and current attribute is clustered into 10 clusters using K-means. However, when clustering the attributes of the relays, a fewer number of distinct centroids have been obtained. The results are given in Table 5. An information table was constructed using the clustered attributes. Using Rosetta software [29], the information table was first reduced using genetic algorithms. The sets of rules were generated: 44 rules for Relay#1’s case, 42 rules for Relay#8’s case, and 38 rules for Relay#12’s case. If the incoming setting satisfies any of these rules, it is marked as genuine and will be used by the relay.
As an illustration, Table 6, Table 7 and Table 8 show samples of the generated rules for Relay#1, Relay#8, and Relay#12, respectively. Support refers to the number of objects in the training set matching the corresponding rule, and the rule coverage is its support divided by the number of objects in the training set.
5. Performance Evaluation
To assess the proposed tool’s performance, a test dataset (set of attributes) of 200 cases was generated for each relay under investigation. For relay settings: 100 left genuine, and 100 have been compromised using the following attack template. The classification results are then presented. Finally, the performance measures and execution times have been calculated.
5.1. Attack Template and Model
To modify the relay setting, a scaling attack is used, which involves modifying true values to higher or lower ones depending on the scaling attack parameter [30].
where and τ represent time and attack period, respectively. The choice of depends on the degree of an attackers’ knowledge of the system and their desired impacts. The scaling parameter is selected to cover a wide range of values, extending from . The values in the range ( simulate attacks by an adversary who wants the breaker to trip faster for normal currents or currents below the short circuit values. This case results in interrupting customers unnecessarily, and in some cases, can cause overloading over other lines, which can lead up to cascading failure. The rest of the range (i.e., ), however, simulates the intention of delaying the breaker operation when it should act faster. That case can result in miscoordination between devices or even fires, safety hazards, and asset damage when main and backup protection devices are all targeted.
The following limitations and assumptions are considered to model the cyber attack.
- 1-
- It is assumed that an attacker can gain access to the information of the protection systems and their communication protocols to manipulate the digital relay setting signal coming from a remote control center.
- 2-
- The measured voltages and currents are local and secure.
- 3-
- Attackers can target one or more relays at the same time.
- 4-
- Attackers know the lines protected by the smart relays.
- 5-
- Attackers cannot trip circuit breakers directly.
- 6-
- Attacker capabilities are limited.
5.2. Classification Results
5.3. Performance Measures
The following outcome measures have been calculated, and the results are presented in Table 12:
- Accuracy (classification rate) is calculated as the number of all correct predictions divided by the total number of cases in the dataset.
- Error rate (ERR) is calculated as the number of all incorrect predictions divided by the total number of cases in the dataset.
- Sensitivity (probability of detection) measures the proportion of actual positives correctly identified. This measure is crucial for attack detection tools since false positives are better tolerated by the system than false negatives.
5.4. Execution Time
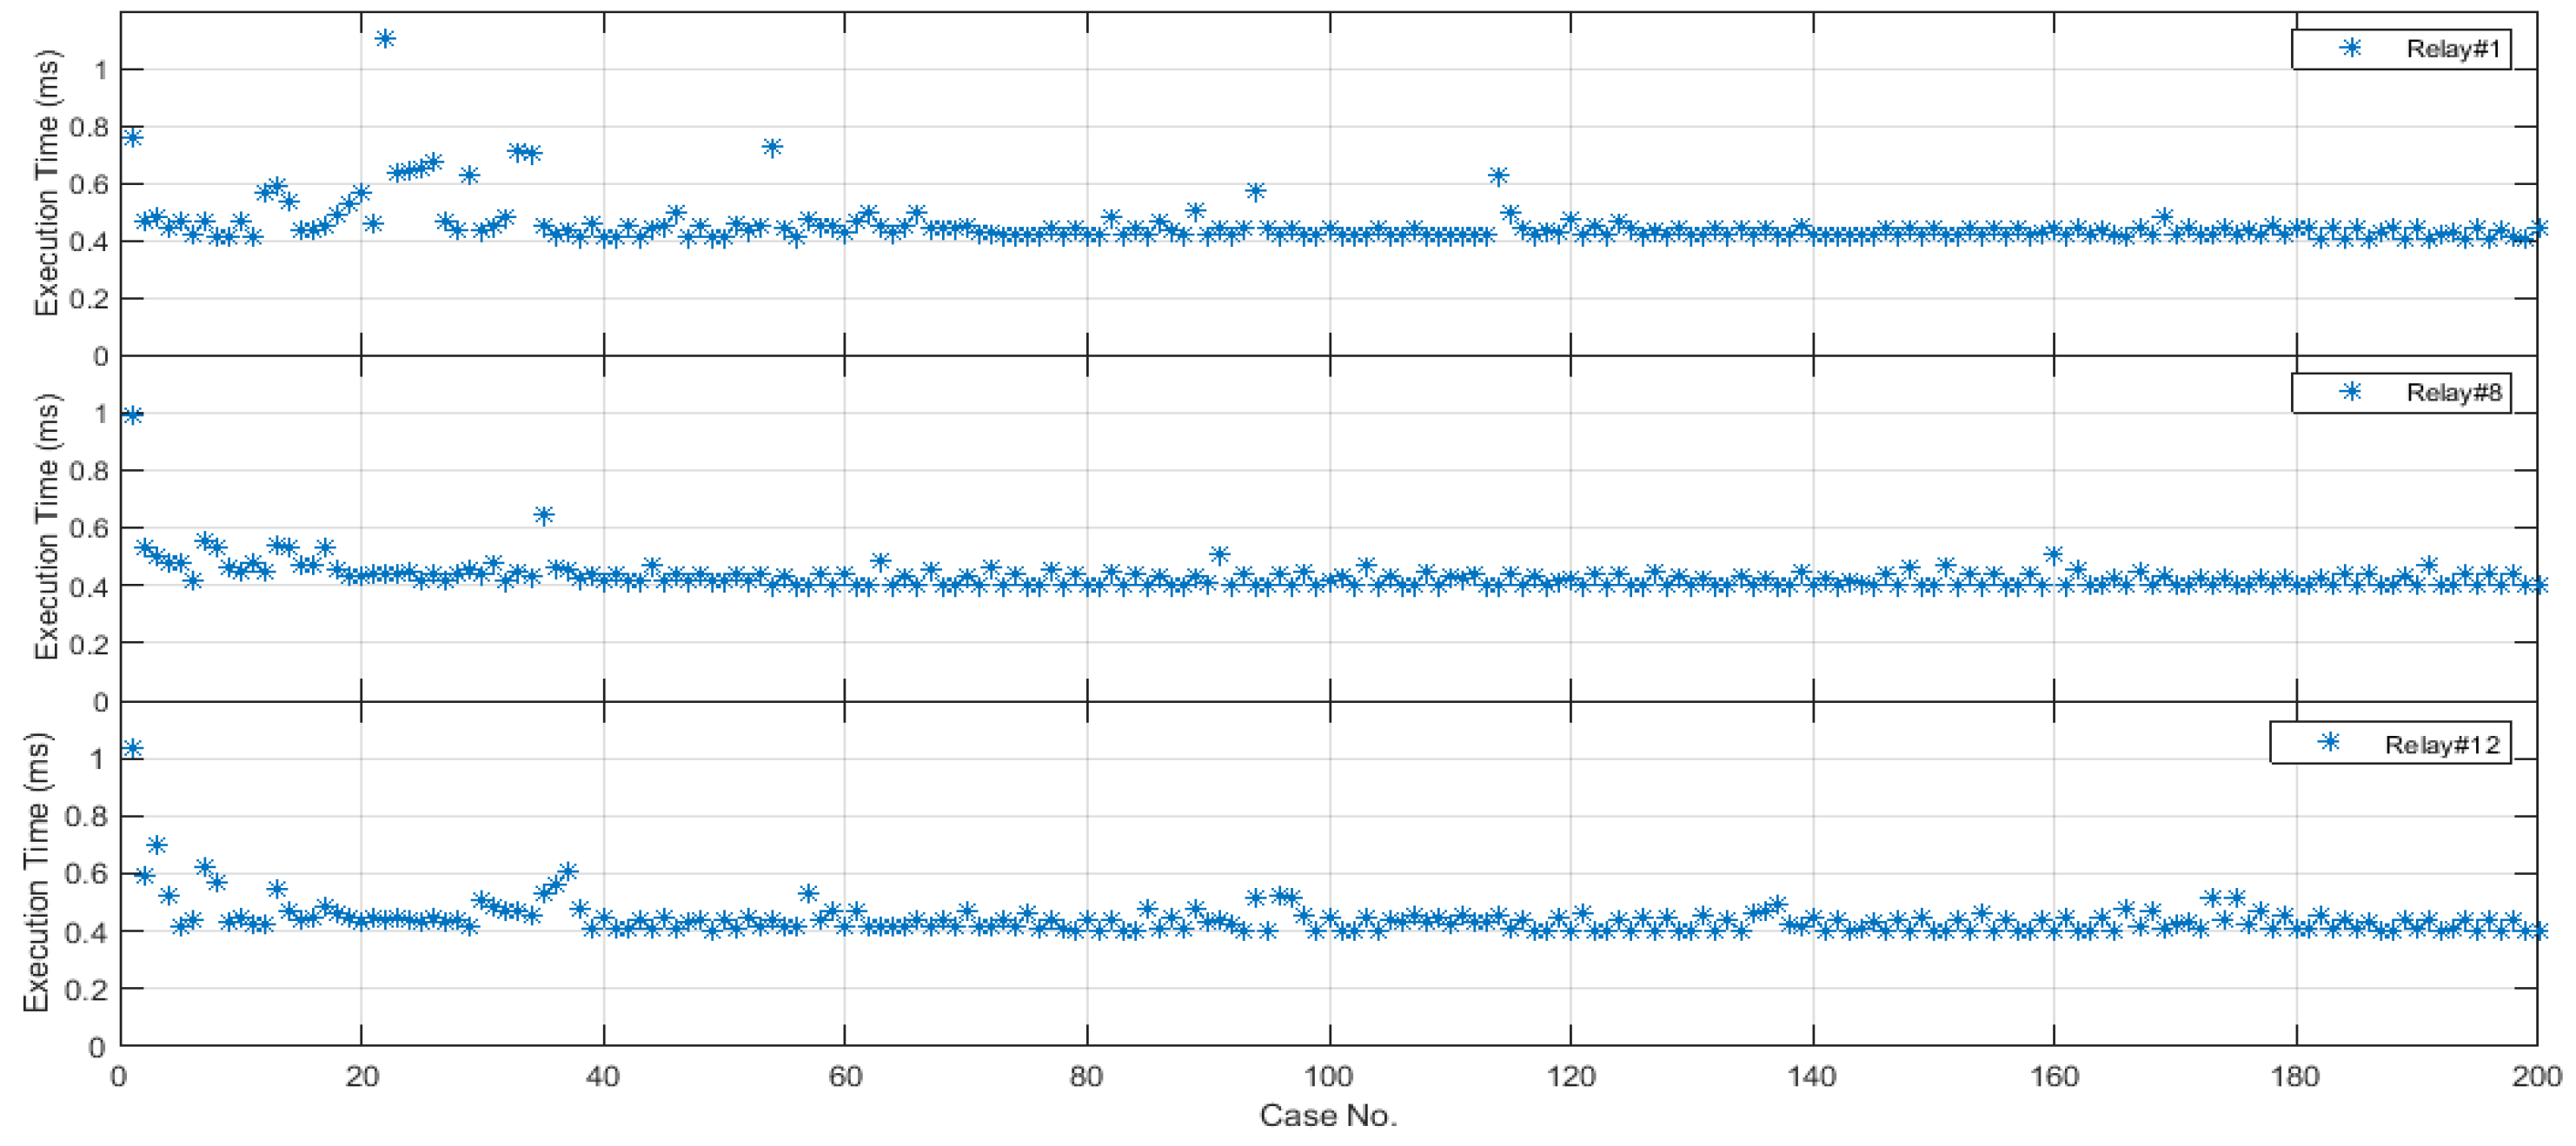
Needless to say, protection system applications are time sensitive. Therefore, the time latency of real-time communication used is always restricted to 4 ms [31,32]. In this section, the execution times of classifying the incoming settings have been monitored for all the relays under investigation using the test dataset used earlier. These times have been measured and are plotted in Figure 5. The simulation was performed in MATLAB, which can easily convert this code into other forms suitable for any smart relay hardware platform used, e.g., C, C++, or Structured Text and Ladder Diagrams (for PLC and Programmable Automation Controller (PAC) devices). Based on the simulation results, the average execution times measured for Relay#1, Relay#8, and Relay#12 are 0.45269 ms, 0.43166 ms, and 0.44203 ms, respectively. Considering the time requirements, the very rapid execution times here are because simple calculations only are needed during the online stage, and these results confirm the tool’s practicality for protection system applications.
6. Summary and Conclusions
This paper proposes a rough-set-based detection tool that can identify incorrect settings for overcurrent relays in active distribution networks. This work aims to enhance the security of communication-based overcurrent relays used in adaptive protection schemes. Using the tool proposed, protective relays can assess the accuracy and consistency of the settings they receive, maintaining the data integrity requirements. The tool is reliable since it uses only local measurements and pre-stored physical properties to judge the settings.
The detection tool was tested on the IEEE 34-bus benchmark systems with DGs added. The evaluation assessment of the tool’s performance was conducted using various measures: accuracy, error rate, sensitivity, and execution time. The results demonstrate the tool’s superior ability to classify settings rapidly and efficiently. These results make the tool trustworthy to be used whenever there is a lack of security measures due to the narrowband communication channels used in a power system or the time-critical communication protocols. In addition, it can be used as an extra line of defense when applying the defense-in-depth strategy.
Since detection takes place within the relay itself, the tool proposed in this paper can judge incoming settings regardless of the type of attack resulting in those incorrect settings. Incorrect settings have a wide range of undesirable effects ranging from unnecessarily customer interruption and equipment damage to a cascading failure and grid stability problems. Additionally, the test dataset used has covered a broad range of settings to simulate different potential attacker profiles, e.g., script kiddies and cybercriminals.
The results of the modified IEEE 34-bus test system model in this study show high accuracy (up to 99.537%) and a high probability of detection (sensitivity) ranging from 97% to 99%. Additionally, the investigations showed that the detection process required a very short time frame. The obtained results prove that this technique is suitable for real-time applications to protect the power network from moving into insecure states and ensure that the power system remains prepared in the face of cyber-physical attacks conducted through adaptive relays.
In conclusion, securing adaptive protection schemes help enable the broad deployment of these schemes in smart grids. In turn, several problems in modern power grids, such as all microgrid protection challenges, including changing network topology, intermittent natures of renewable DGs, varying short circuit currents, selectivity problems, and islanding, can be overcome. Therefore, securing adaptive schemes is considered crucial for modern power grids and grid cyber-physical resilience enhancement. In our future work, we will consider changing the network topology by changing the statuses of tie and sectionalizing switches to deal with the dynamic topology of smart grids.
Author Contributions
Conceptualization, N.M. and M.M.A.S.; methodology, N.M.; investigation, N.M. and M.M.A.S.; writing—original draft preparation, N.M.; writing—review and editing, M.M.A.S. and N.M. All authors have read and agreed to the published version of the manuscript.
Funding
This research received no external funding.
Conflicts of Interest
The authors declare no conflict of interest.
References
- Deng, R.; Zhuang, P.; Liang, H. CCPA: Coordinated Cyber-Physical Attacks and Countermeasures in Smart Grid. IEEE Trans. Smart Grid 2017, 8, 2420–2430. [Google Scholar] [CrossRef]
- Mohamed, N.A.; Salama, M.M.A. A review on the proposed solutions to microgrid protection problems. In Proceedings of the Canadian Conference on Electrical and Computer Engineering, Vancouver, BC, Canada, 15–18 May 2016. [Google Scholar] [CrossRef]
- Oudalov, A.; Fidigatti, A. Adaptive Network Protection in MIcrogrids. ABB Int. J. Distrib. Energy Resour. 2009, 5, 201–226. [Google Scholar]
- Orji, U.; Schantz, C.; Leeb, S.B.; Kirtley, J.L.; Sievenpiper, B.; Gerhard, K.; McCoy, T. Adaptive Zonal Protection for Ring Microgrids. IEEE Trans. Smart Grid 2017, 8, 1843–1851. [Google Scholar] [CrossRef]
- Ustun, T.S.; Khan, R.H.; Hadbah, A.; Kalam, A. An adaptive microgrid protection scheme based on a wide-area smart grid communications network. In Proceedings of the 2013 IEEE Latin-America Conference on Communication, Santiago, Chile, 24–26 November 2013. [Google Scholar] [CrossRef]
- Ibrahim, A.M.; El-Khattam, W.; ElMesallamy, M.; Talaat, H.A. Adaptive protection coordination scheme for distribution network with distributed generation using ABC. J. Electr. Syst. Inf. Technol. 2016, 3, 320–332. [Google Scholar] [CrossRef] [Green Version]
- Coffele, F.; Booth, C.; Dyśko, A. An Adaptive Overcurrent Protection Scheme for Distribution Networks. IEEE Trans. Power Deliv. 2014, 30, 561–568. [Google Scholar] [CrossRef] [Green Version]
- Osman, A.H.; Hassan, M.S.; Sulaiman, M. Communication-based adaptive protection for distribution systems penetrated with distributed generators. Electr. Power Compon. Syst. 2015, 43, 556–565. [Google Scholar] [CrossRef]
- Souza, F.C.; Souza, B.A. Adaptive overcurrent adjustment settings: A case study using RTDS®. In Proceedings of the 2013 IEEE PES Conference on Innovative Smart Grid Technologies, Sao Paolo, Brazil, 15–17 April 2013. [Google Scholar] [CrossRef]
- Rockefeller, G.D.; Wagner, C.L.; Linders, J.R.; Hicks, K.L.; Rizy, D.T. Adaptive transmission relaying concepts for improved performance. IEEE Trans. Power Deliv. 1988, 3, 1446–1458. [Google Scholar] [CrossRef]
- Ward, S.; O’Brien, J.; Beresh, B.; Benmouyal, G.; Holstein, D.; Tengdin, J.T.; Fodero, K.; Simon, M.; Carden, M.; Yalla, M.V.V.S.; et al. Cyber Security Issues for Protective Relays; C1 Working Group Members of Power System Relaying Committee. In Proceedings of the 2007 IEEE Power Engineering Society General Meeting, Tampa, FL, USA, 24–28 June 2007. [Google Scholar] [CrossRef]
- Premaratne, U.K.; Samarabandu, J.; Sidhu, T.S.; Beresh, R.; Tan, J.C. An intrusion detection system for IEC61850 automated substations. IEEE Trans. Power Deliv. 2010, 25, 2376–2383. [Google Scholar] [CrossRef]
- Premaratne, U.; Ling, C.; Samarabandu, J.; Sidhu, T. Possibilistic decision trees for intrusion detection in IEC61850 automated substations. In Proceedings of the 2009 International Conference on Industrial and Information Systems, Peradeniya, Sri Lanka, 28–31 December 2009; pp. 204–209. [Google Scholar] [CrossRef]
- Ten, C.W.; Hong, J.; Liu, C.C. Anomaly detection for cybersecurity of the substations. IEEE Trans. Smart Grid 2011, 2, 865–873. [Google Scholar] [CrossRef]
- Khaw, Y.M.; Abiri Jahromi, A.; Arani, M.F.M.; Sanner, S.; Kundur, D.; Kassouf, M. A Deep Learning-Based Cyberattack Detection System for Transmission Protective Relays. IEEE Trans. Smart Grid 2021, 12, 2554–2565. [Google Scholar] [CrossRef]
- Hong, J.; Nuqui, R.F.; Kondabathini, A.; Ishchenko, D.; Martin, A. Cyber Attack Resilient Distance Protection and Circuit Breaker Control for Digital Substations. IEEE Trans. Ind. Inform. 2019, 15, 4332–4341. [Google Scholar] [CrossRef]
- Hariri, M.; Faddel, S.; Mohammed, O. An artificially intelligent physical model-checking approach to detect switching-related attacks on power systems. In Proceedings of the 2017 IEEE 7th International Conference on Power and Energy Systems, Toronto, ON, Canada, 1–3 November 2017; pp. 23–28. [Google Scholar] [CrossRef]
- Koutsandria, G.; Muthukumar, V.; Parvania, M.; Peisert, S.; McParland, C.; Scaglione, A. A hybrid network IDS for protective digital relays in the power transmission grid. In Proceedings of the 2014 IEEE International Conference on Smart Grid Communications (SmartGridComm), Venice, Italy, 3–6 November 2014; pp. 908–913. [Google Scholar] [CrossRef] [Green Version]
- Yao, Y.; Zhao, Y. Discernibility matrix simplification for constructing attribute reducts. Inf. Sci. 2009, 179, 867–882. [Google Scholar] [CrossRef] [Green Version]
- Saini, P.; Sethi, N.; Scholar, M.T. Decision Support in Data Mining Using Rough Set Theory. IJIRST 2013, 1, 14–21. [Google Scholar]
- Komorowski, J.; Polkowski, L.; Skowron, A. Rough Sets: A Tutorial. In Rough Fuzzy Hybridization: A New Trend in Decision-Making; Pal, S.K., Skowron, A., Eds.; Springer: Singapore, 1999; pp. 3–98. [Google Scholar]
- Skowron, A.; Rauszer, C. The Discernibility Matrices and Functions in Information Systems. In Intelligent Decision Support; Springer: Heidelberg, The Netherlands, 1992; pp. 331–362. [Google Scholar] [CrossRef]
- Grigg, C.; Wong, P. The IEEE reliability test system—1996 a report prepared by the reliability test system task force of the application of probability methods subcommittee. IEEE Trans. Power Syst. 1999, 14, 1010–1020. [Google Scholar] [CrossRef]
- Nassar, M.E.; Salama, M.M.A. A novel probabilistic load model and probabilistic power flow. In Proceedings of the Canadian Conference on Electrical and Computer Engineering, Halifax, NS, Canada, 3–6 May 2015; pp. 881–886. [Google Scholar] [CrossRef]
- Nassar, M. Microgrid Enabling Towards the Implementation of Smart Grids. Ph.D. Thesis, University of Waterloo, Waterloo, ON, Canada, 21 June 2017. [Google Scholar]
- Yue, Q.; Lu, F.; Yu, W.; Wang, J. A novel algorithm to determine minimum break point set for optimum cooperation of directional protection relays in multiloop networks. IEEE Trans. Power Deliv. 2006, 21, 1114–1119. [Google Scholar] [CrossRef]
- Distribution Test Feeders—IEEE Distribution System Analysis Subcommittee. Available online: https://0-www-ewh-ieee-org.brum.beds.ac.uk/soc/pes/dsacom/testfeeders.html (accessed on 27 June 2021).
- OpenDSS. Available online: https://www.epri.com/pages/sa/opendss. (accessed on 22 January 2021).
- ROSETTA. A Rough Set Toolkit. Available online: http://bioinf.icm.uu.se/rosetta/ (accessed on 5 August 2021).
- Sridhar, S.; Govindarasu, M. Model-based attack detection and mitigation for automatic generation control. IEEE Trans. Smart Grid 2014, 5, 580–591. [Google Scholar] [CrossRef]
- Zhang, J.; Gunter, C.A. Application-Aware Secure Multicast for Power Grid Communications. In Proceedings of the 2010 First IEEE International Conference on Smart Grid Communications, Gaithersburg, MA, USA, 4–6 October 2010; pp. 339–344. [Google Scholar] [CrossRef]
- Feng, Y.; Qian, Y.; Ju, R.Q. Smart Grid Communication Infrastructures: Big Data, Cloud Computing, and Security; John Wiley & Sons: Hoboken, NJ, USA, 2018. [Google Scholar]
Figure 1.
Representation of approximation sets.

Figure 2.
The cluster of load demand curves and the associated representative centroids for (a) summer weekdays; (b) summer weekends; (c) winter weekdays; (d) winter weekends; (e) spring/fall weekdays; (f) spring/fall weekdays.
Figure 2.
The cluster of load demand curves and the associated representative centroids for (a) summer weekdays; (b) summer weekends; (c) winter weekdays; (d) winter weekends; (e) spring/fall weekdays; (f) spring/fall weekdays.

Figure 3.
(a) Probabilistic analysis algorithm; (b) cyber attack detection—offline phase.

Figure 4.
IEEE 34-bus test system with DGs and proposed relays.

Figure 5.
Execution times for Relay#1, Relay#8, and Relay#12.


Table 1.
Load models.
| Season Clusters | Model |
|---|---|
| Summer Weekday | L1 |
| Summer Weekend | L2 |
| Winter Weekday | L3 |
| Winter Weekend | L4 |
| Fall/Spring Weekday | L5 |
| Fall/Spring Weekend | L6 |
Table 2.
Clusters’ representative centroids.
| L1 | L2 | L3 | L4 | L5 | L6 | |
|---|---|---|---|---|---|---|
| 1 | 0.523 | 0.478 | 0.576 | 0.530 | 0.449 | 0.423 |
| 2 | 0.491 | 0.452 | 0.542 | 0.489 | 0.442 | 0.411 |
| 3 | 0.474 | 0.426 | 0.516 | 0.462 | 0.428 | 0.389 |
| 4 | 0.458 | 0.420 | 0.508 | 0.449 | 0.414 | 0.372 |
| 5 | 0.458 | 0.413 | 0.508 | 0.435 | 0.421 | 0.366 |
| 6 | 0.474 | 0.401 | 0.516 | 0.442 | 0.464 | 0.366 |
| 7 | 0.523 | 0.401 | 0.637 | 0.449 | 0.514 | 0.383 |
| 8 | 0.621 | 0.426 | 0.740 | 0.476 | 0.606 | 0.417 |
| 9 | 0.711 | 0.523 | 0.817 | 0.544 | 0.678 | 0.468 |
| 10 | 0.777 | 0.556 | 0.826 | 0.598 | 0.706 | 0.502 |
| 11 | 0.810 | 0.588 | 0.826 | 0.612 | 0.713 | 0.519 |
| 12 | 0.818 | 0.601 | 0.817 | 0.618 | 0.706 | 0.530 |
| 13 | 0.810 | 0.601 | 0.817 | 0.612 | 0.664 | 0.513 |
| 14 | 0.818 | 0.594 | 0.817 | 0.598 | 0.656 | 0.507 |
| 15 | 0.818 | 0.588 | 0.800 | 0.591 | 0.642 | 0.507 |
| 16 | 0.793 | 0.588 | 0.809 | 0.591 | 0.628 | 0.485 |
| 17 | 0.785 | 0.594 | 0.852 | 0.618 | 0.642 | 0.479 |
| 18 | 0.785 | 0.607 | 0.860 | 0.680 | 0.656 | 0.496 |
| 19 | 0.760 | 0.614 | 0.860 | 0.673 | 0.685 | 0.519 |
| 20 | 0.752 | 0.614 | 0.826 | 0.659 | 0.699 | 0.564 |
| 21 | 0.752 | 0.646 | 0.783 | 0.639 | 0.685 | 0.547 |
| 22 | 0.760 | 0.601 | 0.714 | 0.625 | 0.642 | 0.535 |
| 23 | 0.711 | 0.568 | 0.628 | 0.591 | 0.571 | 0.507 |
| 24 | 0.589 | 0.517 | 0.542 | 0.550 | 0.499 | 0.479 |
Table 3.
Weibull PDF parameters for different load models [24].
Table 3.
Weibull PDF parameters for different load models [24].
| Model | αw | βw | Γw |
|---|---|---|---|
| L1 | 2.4226 | 0.09934 | −0.08812 |
| L2 | 1.7979 | 0.05353 | −0.04758 |
| L3 | 5.247 | 0.22676 | −0.20872 |
| L4 | 5.1698 | 0.16188 | −0.14876 |
| L5 | 8.2088 | 0.21547 | −0.20307 |
| L6 | 17.046 | 0.29313 | −0.28402 |
Table 4.
Johnson SB PDF parameters for different wind DG models [25].
Table 4.
Johnson SB PDF parameters for different wind DG models [25].
| Model | Season | Γ | δ | λ | ζ |
|---|---|---|---|---|---|
| WD1 | Spring | 0.40832 | 0.46673 | 0.97881 | −0.0765 |
| WD2 | Fall | 0.1866 | 0.49059 | 0.98015 | −0.00616 |
| WD3 | Summer | 0.48423 | 0.55561 | 0.97956 | −0.00874 |
| WD4 | Winter | −0.0199 | 0.48906 | 0.95746 | 0.005568 |
Table 5.
Centroids for relays under investigation.
| No. | Relay#1 | Relay#8 | Relay#12 | ||||||
|---|---|---|---|---|---|---|---|---|---|
| V (p.u) | I (A) | TDS | V (p.u) | I (A) | TDS | V (p.u) | I (A) | TDS | |
| C1 | 1.014 | 27.33 | 0.206 | 0.851 | 17.78 | 0.102 | 0.949 | 8.20 | 0.001 |
| C2 | 0.993 | 45.44 | 0.001 | 1.0173 | 14.19 | 17.857 | 1.008 | 1.23 | 20 |
| C3 | 1.047 | 33.37 | 0.105 | 0.939 | 21.35 | 0.095 | 0.968 | 7.98 | |
| C4 | 1.031 | 50.77 | 0.208 | 0.996 | 14.53 | 0.001 | 0.898 | 0.82 | |
| C5 | 1.008 | 19.64 | 0.202 | 1.061 | 18.76 | 0.098 | 1.055 | 2.09 | |
| C6 | 1.019 | 23.29 | 0.959 | 15.29 | 1.029 | 8.39 | |||
| C7 | 1.026 | 36.19 | 0.976 | 16.88 | 0.846 | 1.60 | |||
| C8 | 0.985 | 40.06 | 1.039 | 14.87 | 0.988 | 1.39 | |||
| C9 | 1.000 | 56.61 | 0.912 | 19.84 | 0.874 | 1.86 | |||
| C10 | 1.039 | 30.55 | 0.883 | 15.95 | 0.925 | 1.03 | |||
Table 6.
Sample of results of Relay#1’s rules.
| No. | Rule | Support | Coverage |
|---|---|---|---|
| R1 | IF Voltage = 4 AND Current = 1 Then TDS = 1 | 103 | 0.0515 |
| R2 | IF Voltage = 1 AND Current = 3 Then TDS = 4 | 151 | 0.0755 |
| R3 | IF Voltage = 10 AND Current = 6 Then TDS = 1 | 91 | 0.0455 |
| R4 | IF Voltage = 2 AND Current = 4 Then TDS = 1 OR 4 | 74 | 0.037 |
| R5 | IF Voltage = 6 AND Current = 10 Then TDS = 4 | 107 | 0.0535 |
| R6 | IF Voltage = 4 AND Current = 3 Then TDS = 5 | 18 | 0.009 |
| R7 | IF Voltage = 10 AND Current = 10 Then TDS = 5 | 26 | 0.013 |
Table 7.
Sample of results of Relay#8’s rules.
| No. | Rule | Support | Coverage |
|---|---|---|---|
| R1 | IF Voltage = 8 AND Current = 4 Then TDS = 1 OR 5 | 85 | 0.0425 |
| R2 | IF Voltage = 4 AND Current = 4 Then TDS = 5 | 183 | 0.0915 |
| R3 | IF Voltage = 4 AND Current = 2 Then TDS = 1 | 89 | 0.0445 |
| R4 | IF Voltage = 2 AND Current = 4 Then TDS = 1 OR 5 | 129 | 0.0645 |
| R5 | IF Voltage = 10 AND Current = 1 Then TDS = 1 OR 3 | 51 | 0.0255 |
| R6 | IF Voltage = 10 AND Current = 9 Then TDS = 3 | 25 | 0.0125 |
Table 8.
Sample of results of Relay#12’s rules.
| No. | Rule | Support | Coverage |
|---|---|---|---|
| R1 | IF Voltage = 6 AND Current = 4 Then TDS = 1 | 16 | 0.008 |
| R2 | IF Voltage = 8 AND Current = 2 Then TDS = 1 | 90 | 0.045 |
| R3 | IF Voltage = 9 AND Current = 9 Then TDS = 1 OR 2 | 13 | 0.0065 |
| R4 | IF Voltage = 1 AND Current = 1 Then TDS = 1 | 93 | 0.0465 |
| R5 | IF Voltage = 3 AND Current = 1 Then TDS = 1 | 82 | 0.041 |
| R6 | IF Voltage = 5 AND Current = 4 Then TDS = 1 | 59 | 0.0295 |
Table 9.
Results for Relay#1.
| Total = 200 | Predicted | ||
|---|---|---|---|
| Yes | No | ||
| Actual | Yes | True Positive (TP) = 97 | False Negative (FN) = 3 |
| No | False Positive (FP) = 0 | True Negative (TN) = 100 | |
Table 10.
Results for Relay#8.
| Total = 200 | Predicted | ||
|---|---|---|---|
| Yes | No | ||
| Actual | Yes | True Positive (TP) = 97 | False Negative (FN) = 3 |
| No | False Positive (FP) = 1 | True Negative (TN) = 99 | |
Table 11.
Results for Relay#12.
| Total = 200 | Predicted | ||
|---|---|---|---|
| Yes | No | ||
| Actual | Yes | True Positive (TP) = 99 | False Negative (FN) = 1 |
| No | False Positive (FP) = 0 | True Negative (TN) = 100 | |
Table 12.
Results of evaluation measures.
| Measures | Relay#1 | Relay#8 | Relay#12 |
|---|---|---|---|
| Accuracy | 98.5% | 98% | 99.5% |
| ERR | 1.5% | 2% | 0.5% |
| Sensitivity | 97% | 97% | 99% |
Publisher’s Note: MDPI stays neutral with regard to jurisdictional claims in published maps and institutional affiliations. |
© 2022 by the authors. Licensee MDPI, Basel, Switzerland. This article is an open access article distributed under the terms and conditions of the Creative Commons Attribution (CC BY) license (https://creativecommons.org/licenses/by/4.0/).
Share and Cite
MDPI and ACS Style
Mohamed, N.; Salama, M.M.A. Data Mining-Based Cyber-Physical Attack Detection Tool for Attack-Resilient Adaptive Protective Relays. Energies 2022, 15, 4328. https://0-doi-org.brum.beds.ac.uk/10.3390/en15124328
AMA Style
Mohamed N, Salama MMA. Data Mining-Based Cyber-Physical Attack Detection Tool for Attack-Resilient Adaptive Protective Relays. Energies. 2022; 15(12):4328. https://0-doi-org.brum.beds.ac.uk/10.3390/en15124328
Chicago/Turabian StyleMohamed, Nancy, and Magdy M. A. Salama. 2022. "Data Mining-Based Cyber-Physical Attack Detection Tool for Attack-Resilient Adaptive Protective Relays" Energies 15, no. 12: 4328. https://0-doi-org.brum.beds.ac.uk/10.3390/en15124328
Note that from the first issue of 2016, this journal uses article numbers instead of page numbers. See further details here.