Article

Feasibility and Techno-Economic Analysis of Electric Vehicle Charging of PV/Wind/Diesel/Battery Hybrid Energy System with Different Battery Technology

Department of Electrical Engineering, National Taiwan University of Science and Technology, No.43, Sec. 4, Keelung Rd., Taipei 106, Taiwan
*
Author to whom correspondence should be addressed.
Submission received: 10 May 2022 / Revised: 8 June 2022 / Accepted: 13 June 2022 / Published: 15 June 2022
(This article belongs to the Special Issue Artificial Intelligence (AI) in the Power Grid and Renewable Energy)

Abstract

:
Promoting the development of green technologies and replacing fossil fuel vehicles with electric ones can abate the environmental anxieties and issues associated with energy supply security. The increasing demand for electric vehicles requires an upgrade and expansion of the available charging infrastructure to accommodate the fast public adoption of this type of transportation. Ethiopia set a pro-electric cars policy and made them excise-free even before the first electric vehicle charging stations were launched by Marathon Motors Engineering in 2021. This paper presents the first ever technical, economic and environmental evaluation of electric vehicle charging stations powered by hybrid intermittent generation systems in three cities in Ethiopia. This paper tests this model using three different battery types: Lead-acid (LA), Flow-Zince-Bromine (ZnBr) and Lithium-ion (LI), used individually. Using these three battery technologies, the proposed hybrid systems are then compared in terms of system sizing, economy, technical performance and environmental stability. The results show that the feasible configuration of Solar Photovoltaic (PV)/Diesel Generator (DG)/ZnBr battery systems provide the lowest net present cost (NPC), with values of $2.97M, $2.72M and $2.85M, and cost of energy (COE), with values $0.196, $0.18 and $0.188, in Addis Ababa, Jijiga and Bahir Dar, respectively. Of all feasible systems, the Wind Turbine (WT)/PV/LI, PV/LI and WT/PV/LI configurations have the highest values of NPC and COE in Addis Ababa, Jijiga and Bahir Dar. Using this configuration, the results demonstrate that ZnBr battery is the most favorable choice because the economic parameters, including total NPC and COE, are found to be lowest.

1. Introduction

Energy demand and consumption are expected to increase by 50% from 2018 to 2050 due increasing population and industrial growth around the globe [1]. Despite environmental emissions reduction, countries have agreed to reach a solution and most of them are beginning to shift their direction from fossil energy to alternative resources, forming new opportunities with a focus on meeting growing energy demands by reducing energy demand through improved energy efficiency [2], specifically, the implementation of electric vehicles (EVs) is a likely option with the availability of a public charging infrastructure [3].
In global energy consumption, one of the biggest items supplied by conventional energy resources is “Transportation”, with 24% usage [4]. Electric Vehicle (EV) Charging Stations (EVCS) are increasingly coupling power and transportation networks as EV penetration continues to increase [5]. Electric vehicle usage is expected to grow exponentially due to wasted oil and environmental impact [6]. Sustainability issues also arise, such as; supplying electricity from renewable energy sources in an effective and sustainable manner; managing the electrical demand on the grid and; installing new charging stations [7]. Electric vehicles can help to improve air quality and the rise of car-sharing services is accelerating the adoption of electric vehicles over gasoline-powered vehicles [8].
Recently, electric vehicles have received more attention and the market for them has increased significantly. EVs can be used as mobile storage devices to support the load balancing in the power grid as a specialized electricity load [9]. Load flattening, voltage and frequency regulation, peak load shaving, straightforward integration of renewable energies and reactive power compensation are among the positive and negative effects of EV development on the grid. In [10], the effects of vehicle-to-grid (V2G) and charging procedure, along with their operation, control issues, and the advantages to both EV owners and the power grid are looked into. Alongside the fast transition to electric versatility, EVs are wanted to convey a more drawn out driving reach, more limited charging time and higher security [11]. The highpower demand and its impact on the grid because of fast-charging stations that can help to fully charge the EV’s battery within 15 min or less, can be managed by renewable sources and storage systems [6].
To enhance renewable energy systems performance and management to align supply and demand, energy storage has become a solution. An energy storage system (ESS) is chosen to address the power oscillations, frequency and voltage instability problems caused by the intermittent characteristics of Renewable Energy Sources (RESs). Currently, the global energy storage demand is rapidly increasing and is predicted to reach 160 GWh by 2030 [12]. A battery management system (BMS) can help by using different battery technologies simultaneously. When considering lithium-ion, lead-acid, vanadium redox-flow or a combination of storage technologies, the optimal approach is to combine redox-flow batteries with RES [13]. To reduce the direct dependency on variable renewable energy generation, the role of energy storage in hybrid system and the sum of energy covered by it is improved; [14], analyzes the different combinations of renewable energies and storage technologies for an off-grid power grid.
Several studies have been conducted on the implementation of charging infrastructure integrated with hybrid RES and ESS, as well as how to size these extra resources optimally. Because uncontrolled EV charging cycles have a significant impact on the electricity grid, hybrid charging stations are incorporating renewable energy sources and battery storage [15]. Issues such as cost and economic indicators can be optimized using a single-objective solution and reliability and environmental benefits can be solved using a multi-objective optimization [16]. To remove the negative effects of electric car charging by precisely calculating the renewable energy share derived from the battery’s stored energy [17], a hybrid electric vehicle charging station solution is offered, along with a small-scale photovoltaic system and battery energy storage. ESS is one of the challenges in installing hybrid renewable energy systems [18].
In [19], an intelligent grouping technique is offered that considers the coupling relationship between EV trip data, battery state and other variables, and produces a charging/discharging priority model based on the charging process contribution index. [20] proposes a novel fast charging strategy to charge lithium-ion batteries safely, which includes a voltage spectrum-based charging current profile that is optimized using a physics-based battery model and a genetic algorithm to address the shortcomings of long charging times and charging-related degradations.
A battery’s characteristics and lifespan is determined by the depth of discharge (DOD) as well as the repetitions of the charging/discharging cycle [21]. Battery heat generation challenges the safety and performance of electric vehicles when power is rapidly increased under dynamic working circumstances [22]. Because of their high energy density, extended lifespan and great stability, lithium-ion batteries have been widely employed to power electric vehicles (EVs) [8]. The limitations of Li-ion batteries in EVs are due to safety concerns due to the inevitable heat buildup throughout varied operations [23]. In [24], by using a revolutionary placement planning strategy for fast charging stations, operators, drivers, vehicles, traffic conditions and the power grid may be optimized.
By developing a hybrid thermal control system incorporating heat pipe arrays, air cooling and irregular water scattering for a Li-ion battery pack [25], it was discovered that the hybrid system’s adjustable cooling capacity enables a good cooling effect with minimal energy consumption to remove heat generated under various operating conditions of EVs. A separate study [26], based on the prediction of residential demands, charging loads and renewable production at the edge calculating nodes, the control center in the distribution network at cloud-side calculates a power supply plan for each charging station proposed an orderly charging scheduling approach for EVs based on cloud-side relationship and deep learning method to mitigate the impact of disorderly charging behaviors of large-scale EVs on the distribution networks.
Combining several types of technology has a relatively better chance of solving reliability concerns and lowering cost challenges in hybrid renewable energy systems [27]. Energy storage systems for micro grid applications can be configured in two ways: centralized and distributed [28]. The reliability of a hybrid system improves when additional renewable energy systems are connected to DG, and the configuration has an impact on the cost of the system’s generated energy [29]. One study [30] proposed to use a load control method to reduce the operating complexity of big EV charging stations grouped as undersized charger clusters and their charging profiles. A techno-economic investigation of Li-ion and lead-acid batteries in conjunction with a PV grid-Connected system was carried out [31].
In the field of automobile technology, battery-powered electric vehicles are beginning to play a significant role in achieving the highest possible energy storage efficiency, structural qualities, cost pricing, safet, and usage life [32]. With the selection of the appropriate energy storage technology, a better energy management strategy and optimal sizing, it is possible to reduce the system’s initial cost, difficulties in disposal and frequent replacement [33].
To make the transition away from traditional energy sources, renewable energy sources are the answer to creating economic incentives and increasing the use of consumer-interactive technology [34]. Globally, approximately 2.1 million electric vehicles were sold in 2019, bringing the total number of electric vehicles on the road to 7.2 million, accounting for 2.6% of all vehicles sold and this is expected to expand in the future decades. While car technology faced an additional challenging year in 2021, owing to the global semiconductor scarcity, electric car sales additionally doubled in the previous year, hitting 6.6 million units, up from hardly 3 million in 2020 [35]. The infrastructure for electric vehicles is likewise rising at a rapid pace and investment in the system is increasing. Ethiopia plans to make 30% of its domestic automobiles electric by 2030 as part of its climate-resilient green economy strategy of becoming a middle-income country [36].
Ethiopia has the capacity to generate over 60,000 MW of electricity from hydro, solar, wind and geothermal sources. Hydropower accounts for 89 percent of total electricity generation, with a total capacity of 4284 MW [37]. Distinct energy-related concerns in Ethiopia were investigated in a variety of studies with various goals [38]. No studies have been conducted to evaluate electric vehicle charging stations that use hybrid energy sources. Previous research has looked at the adoption of clean renewable energy in rural Ethiopia and identified obstacles that limit its expansion [39,40,41,42,43,44]. In another study [37], in three different regions of Ethiopia, the feasibility of integrating PV/wind power systems with the existing unreliable grid or diesel generator systems for providing critical loads to industrial parks is investigated, as well as how to provide a reliable supply with cost-effective and environmentally friendly resources [45].
The given techno-economical case study of the integration of EV charging with a hybrid solar PV, WT, DG system with different battery technologies is, to the best of the authors’ knowledge, the first of its kind. The feasibility and techno-economic analysis of electric vehicle charging and hybrid PV/WT/DG systems with various battery technologies are presented in this study. The remainders of the paper are organized as follows: Section 2 outlines the methodology of the proposed system, Section 3 covers the results and discussion and Section 4 draws conclusions.

2. Materials and Methods

In this section, the mathematical design of the implemented EV load and components of the hybrid energy system is described. The optimization process is then explained, followed by a discussion of the proposed strategy for attaching data to the optimization tool.

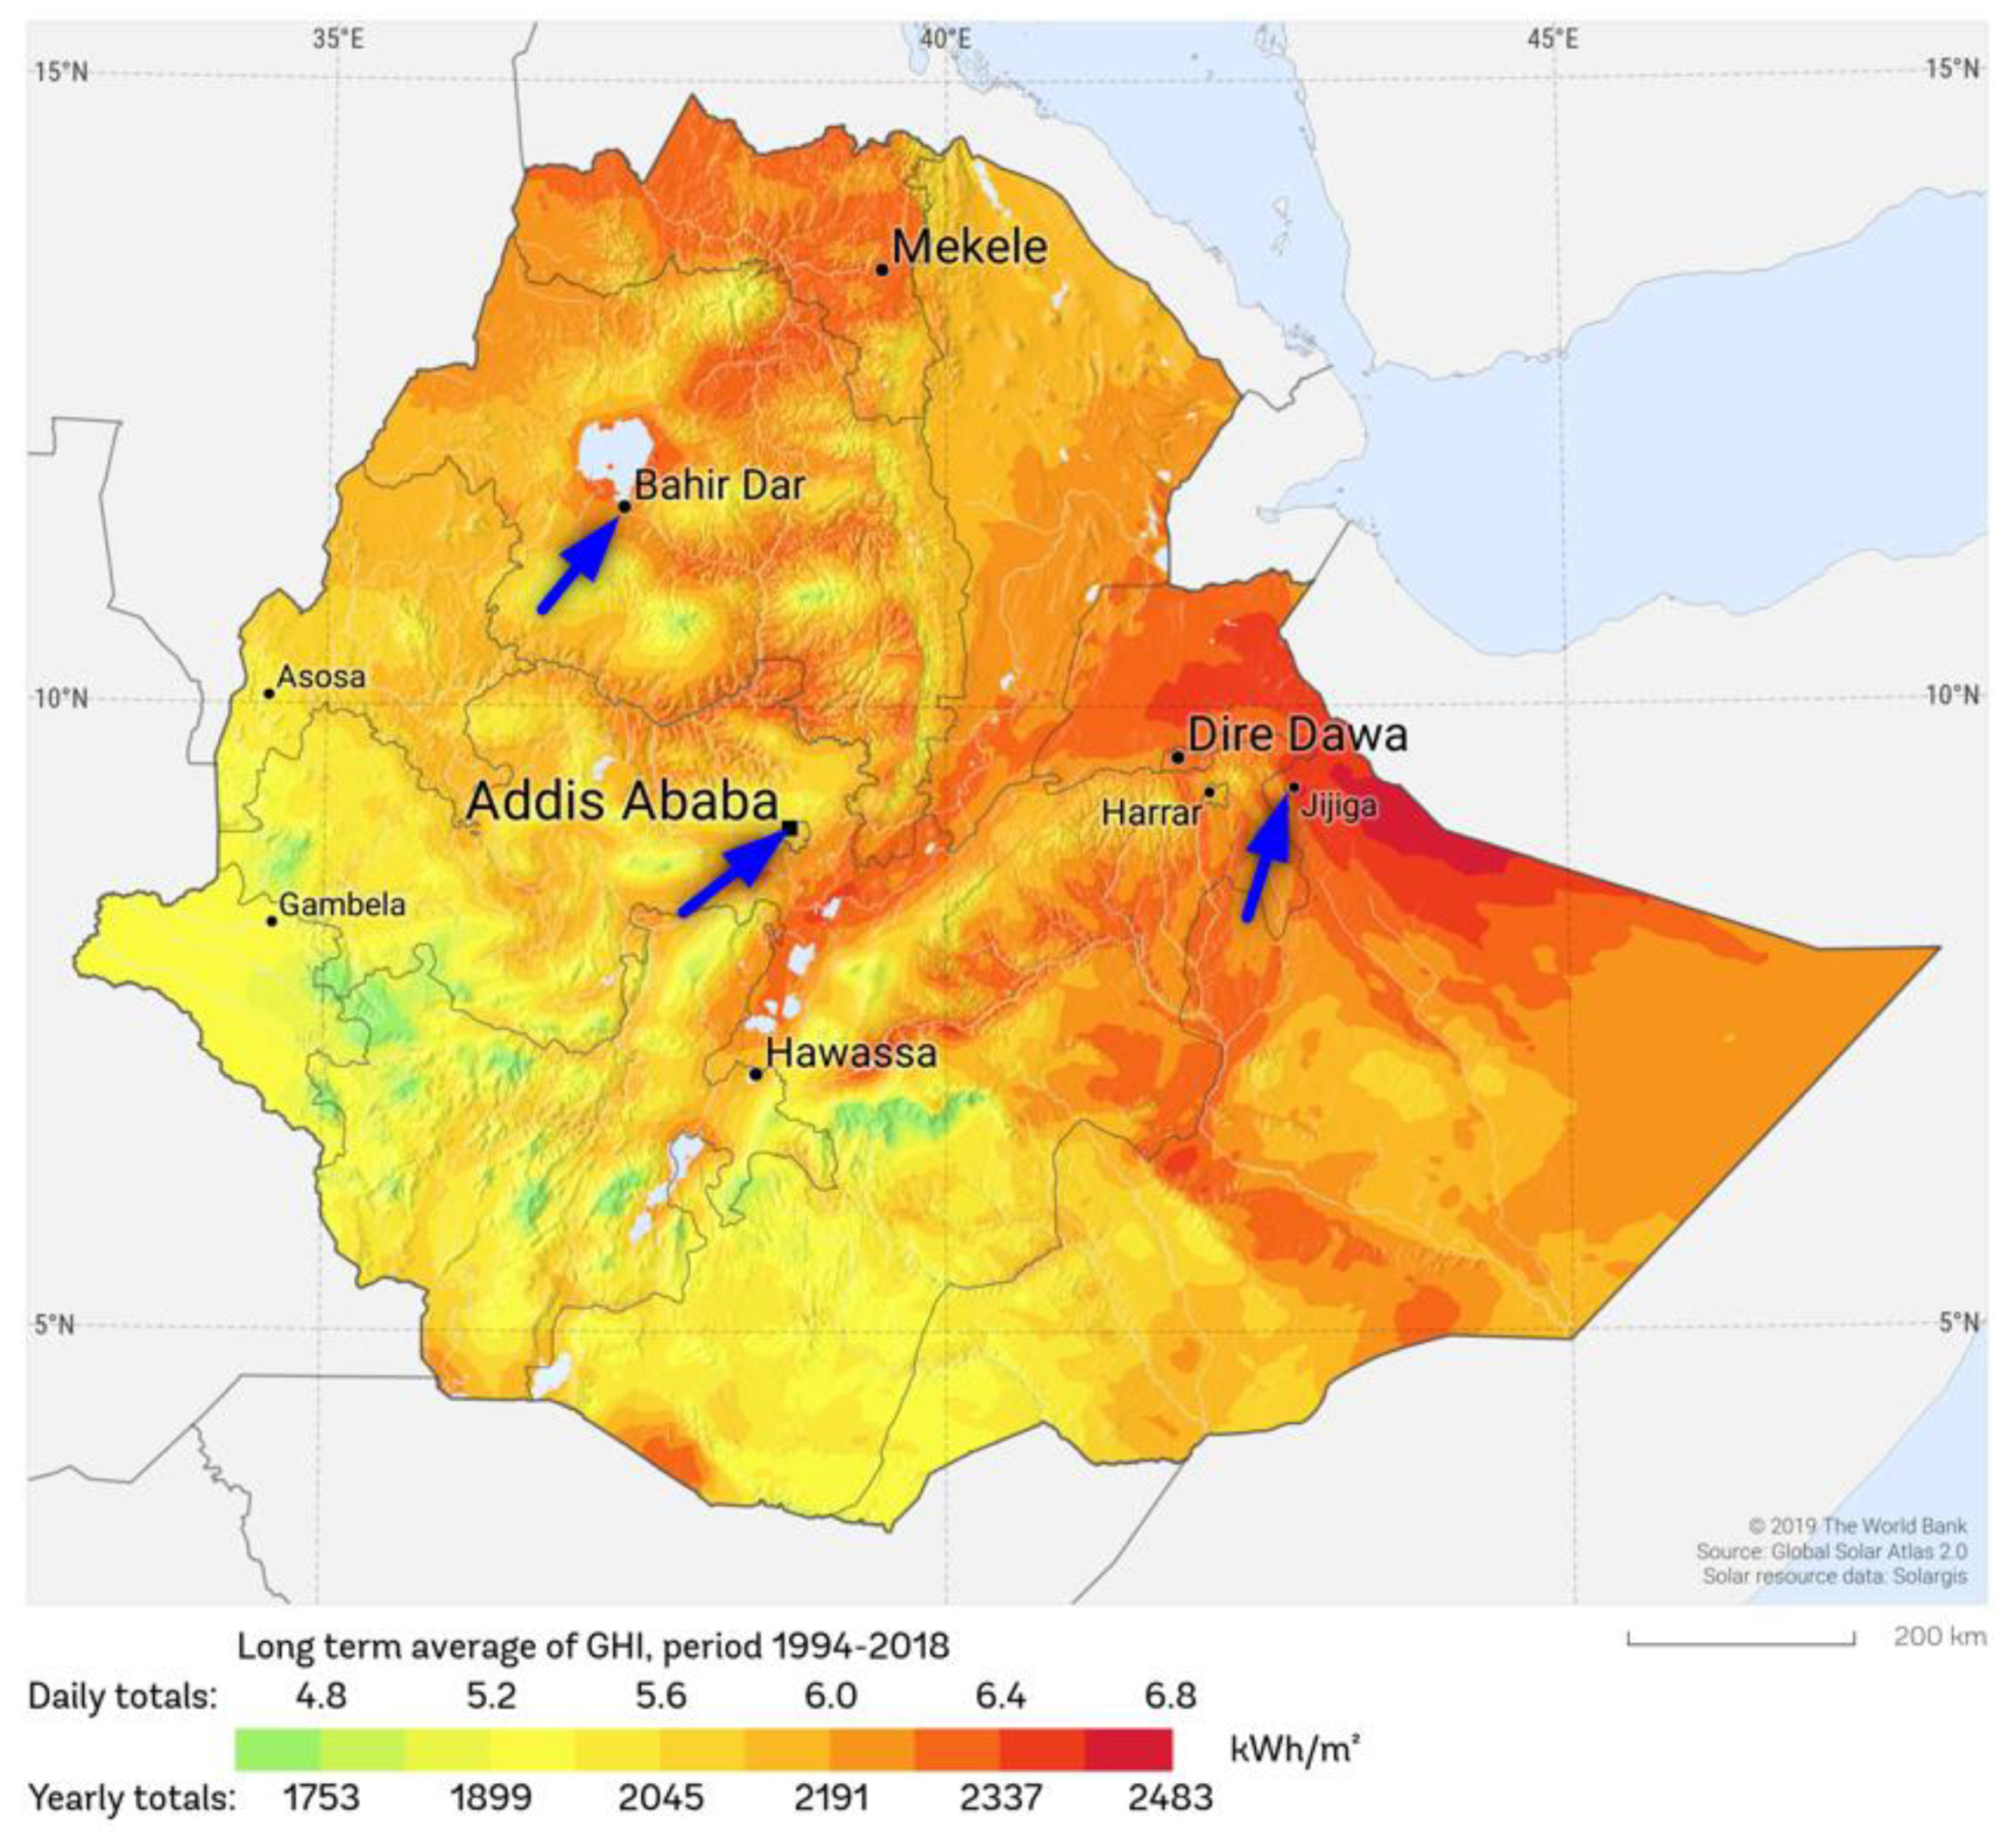
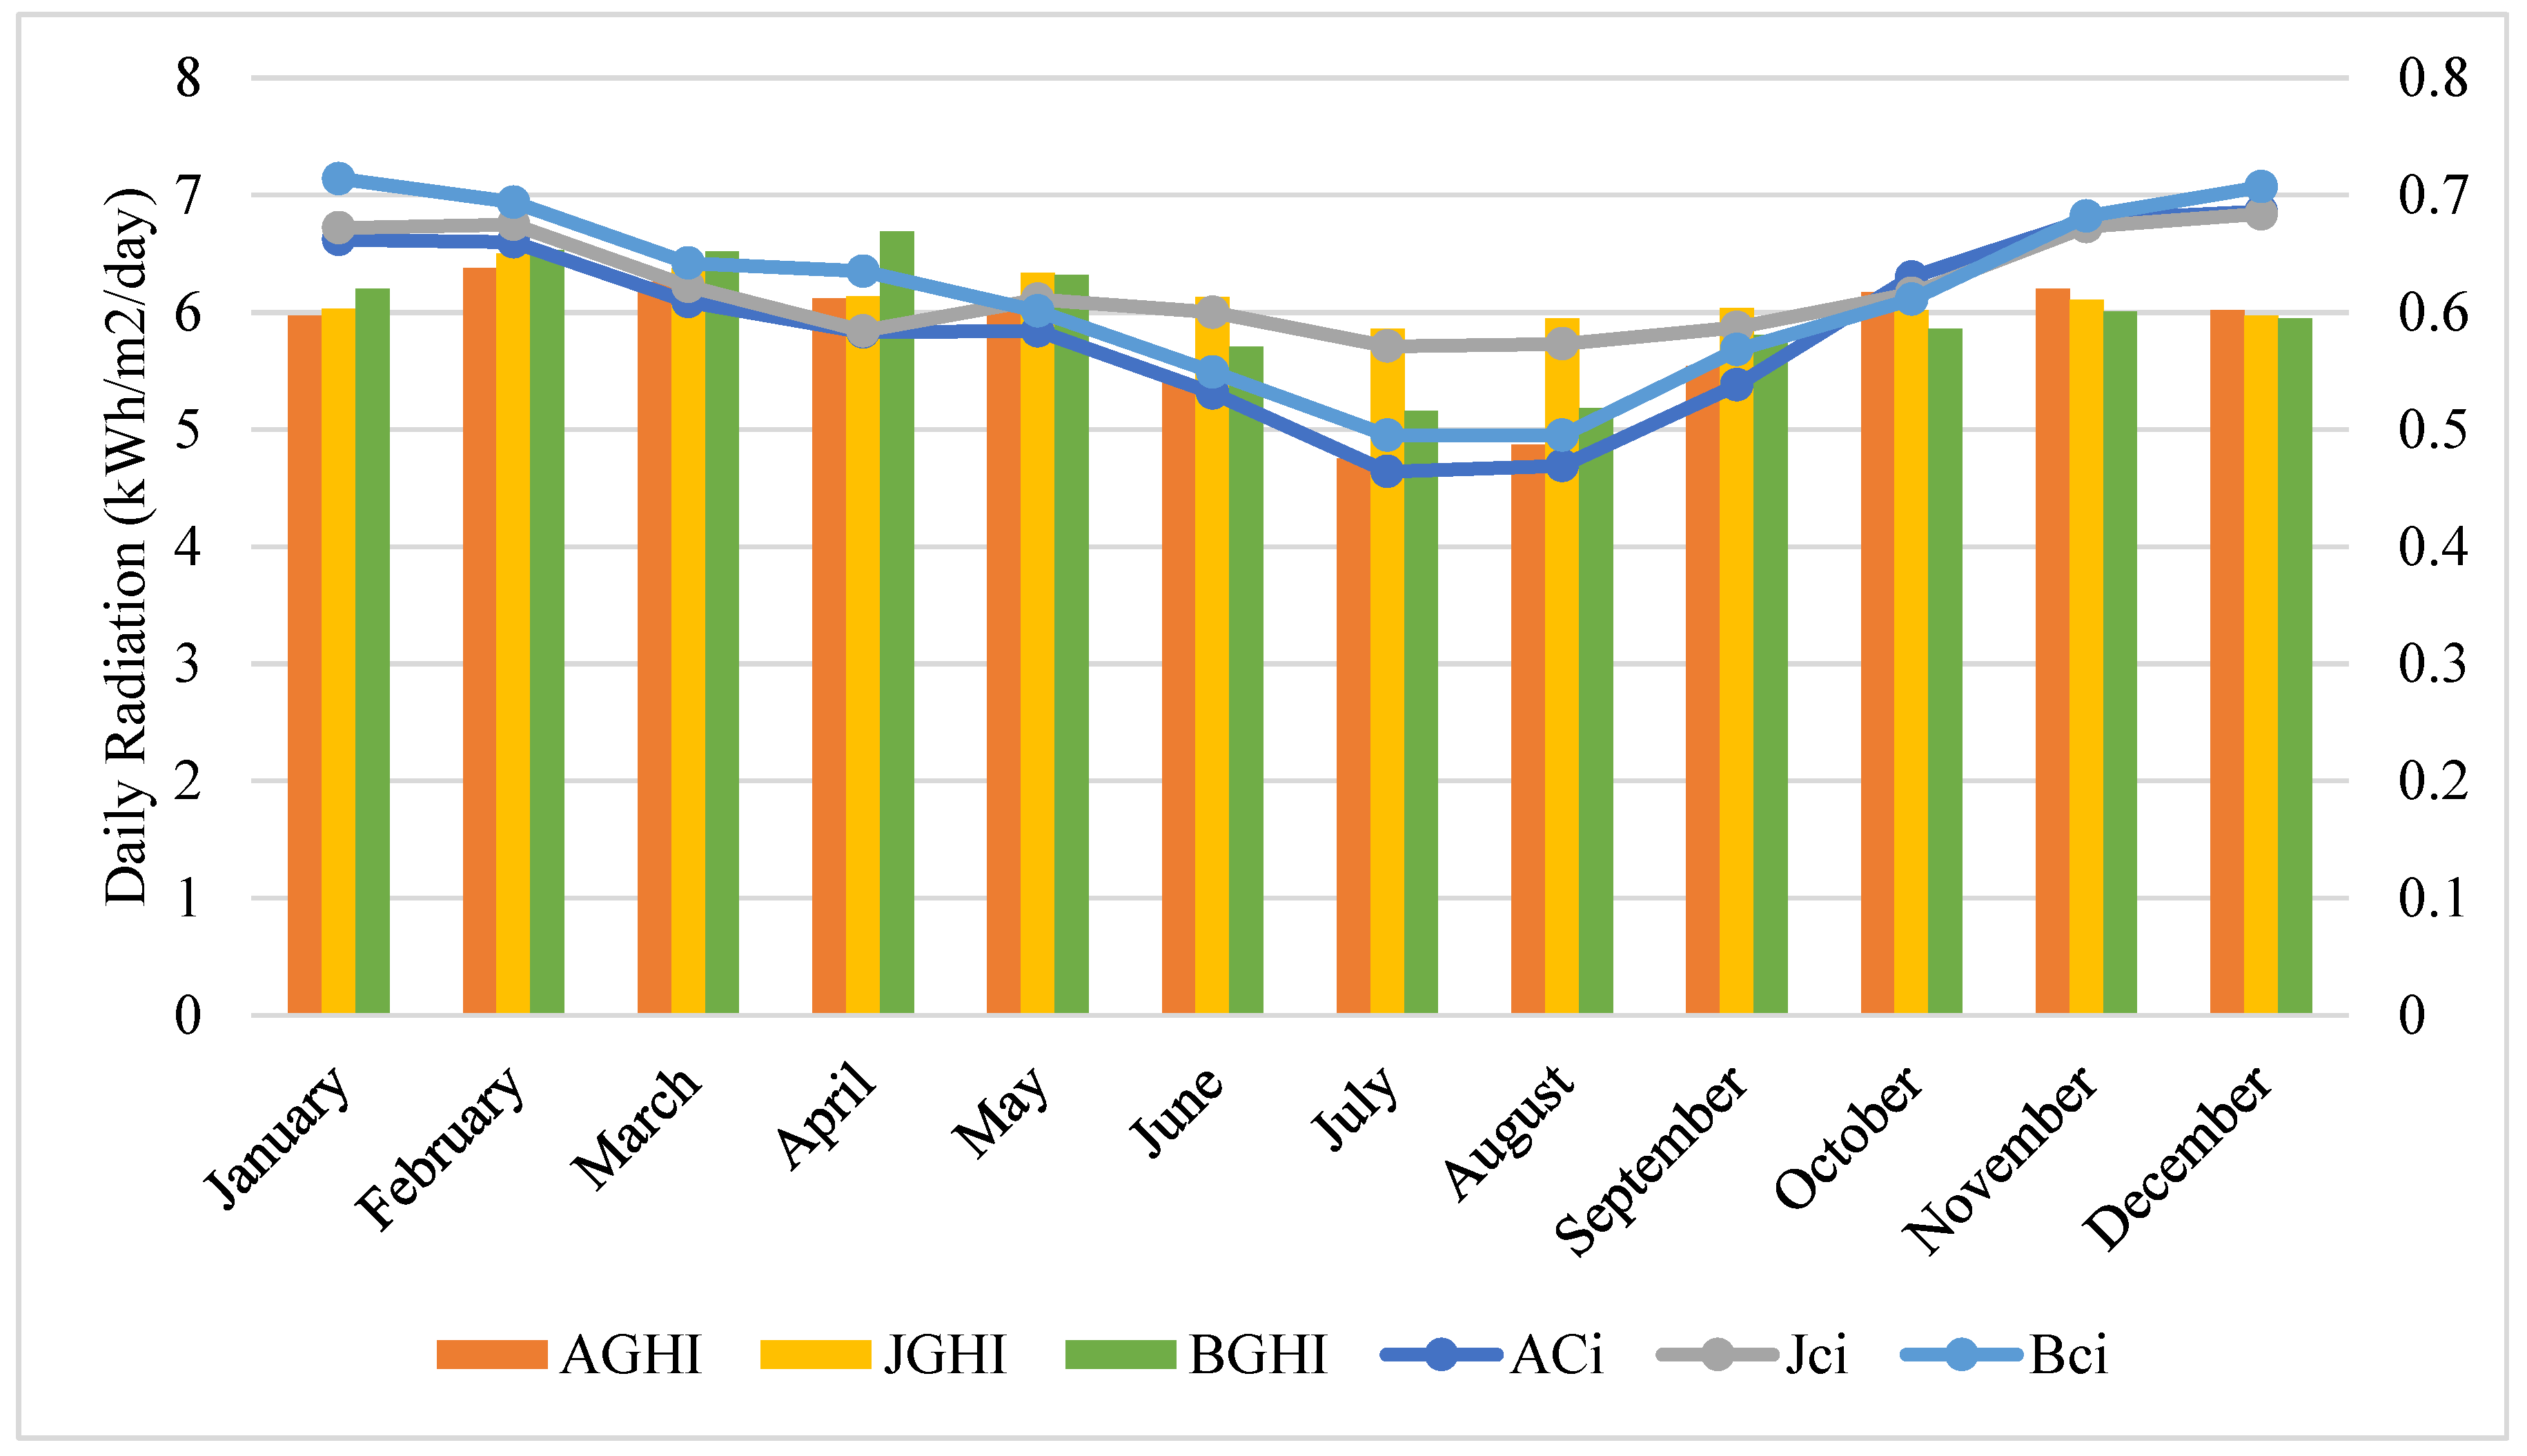
2.1. Study Area, Meteorological Resources Data and Load Profiles

In this study, three cities, Addis Ababa (8°58.8′ N, 38°45.5′ E), Jijiga (9°21.4′ N, 42°47.7′ E) and Bahir Dar (11°34.5′ N, 37°21.7′ E) were chosen to analyze PV/Wind/DG/Battery hybrid design with different battery chemistry for electric vehicle charging as shown in Table 1, in which average solar irradiation, clearness index, and wind speed and yearly load demand and peak load are provided. Figure 1 depicts the geographical arrangement, overview and coordinates of the locations. Because there are relatively few cars in cities, it is easy to get to the charging station, and this region has been picked as one of the charging station installation sites.
Despite the fact that the sizing study was completed for a specific location, the conclusions and technique may be applied elsewhere in the world by modifying the solar and wind energy statistics. In Ethiopia, electric car adoption is only just getting started, with only one charging station. A national road map for sizing, regulation and other issues is needed. As a result, the three cities in Ethiopia with the highest number of cars and the highest wind and solar energy potential have been chosen to demonstrate the sizing of EV charging station applications. Figure 1 and Figure 2 show the solar energy potential of the cities, whereas Figure 3 depicts the wind energy potential of the cities.

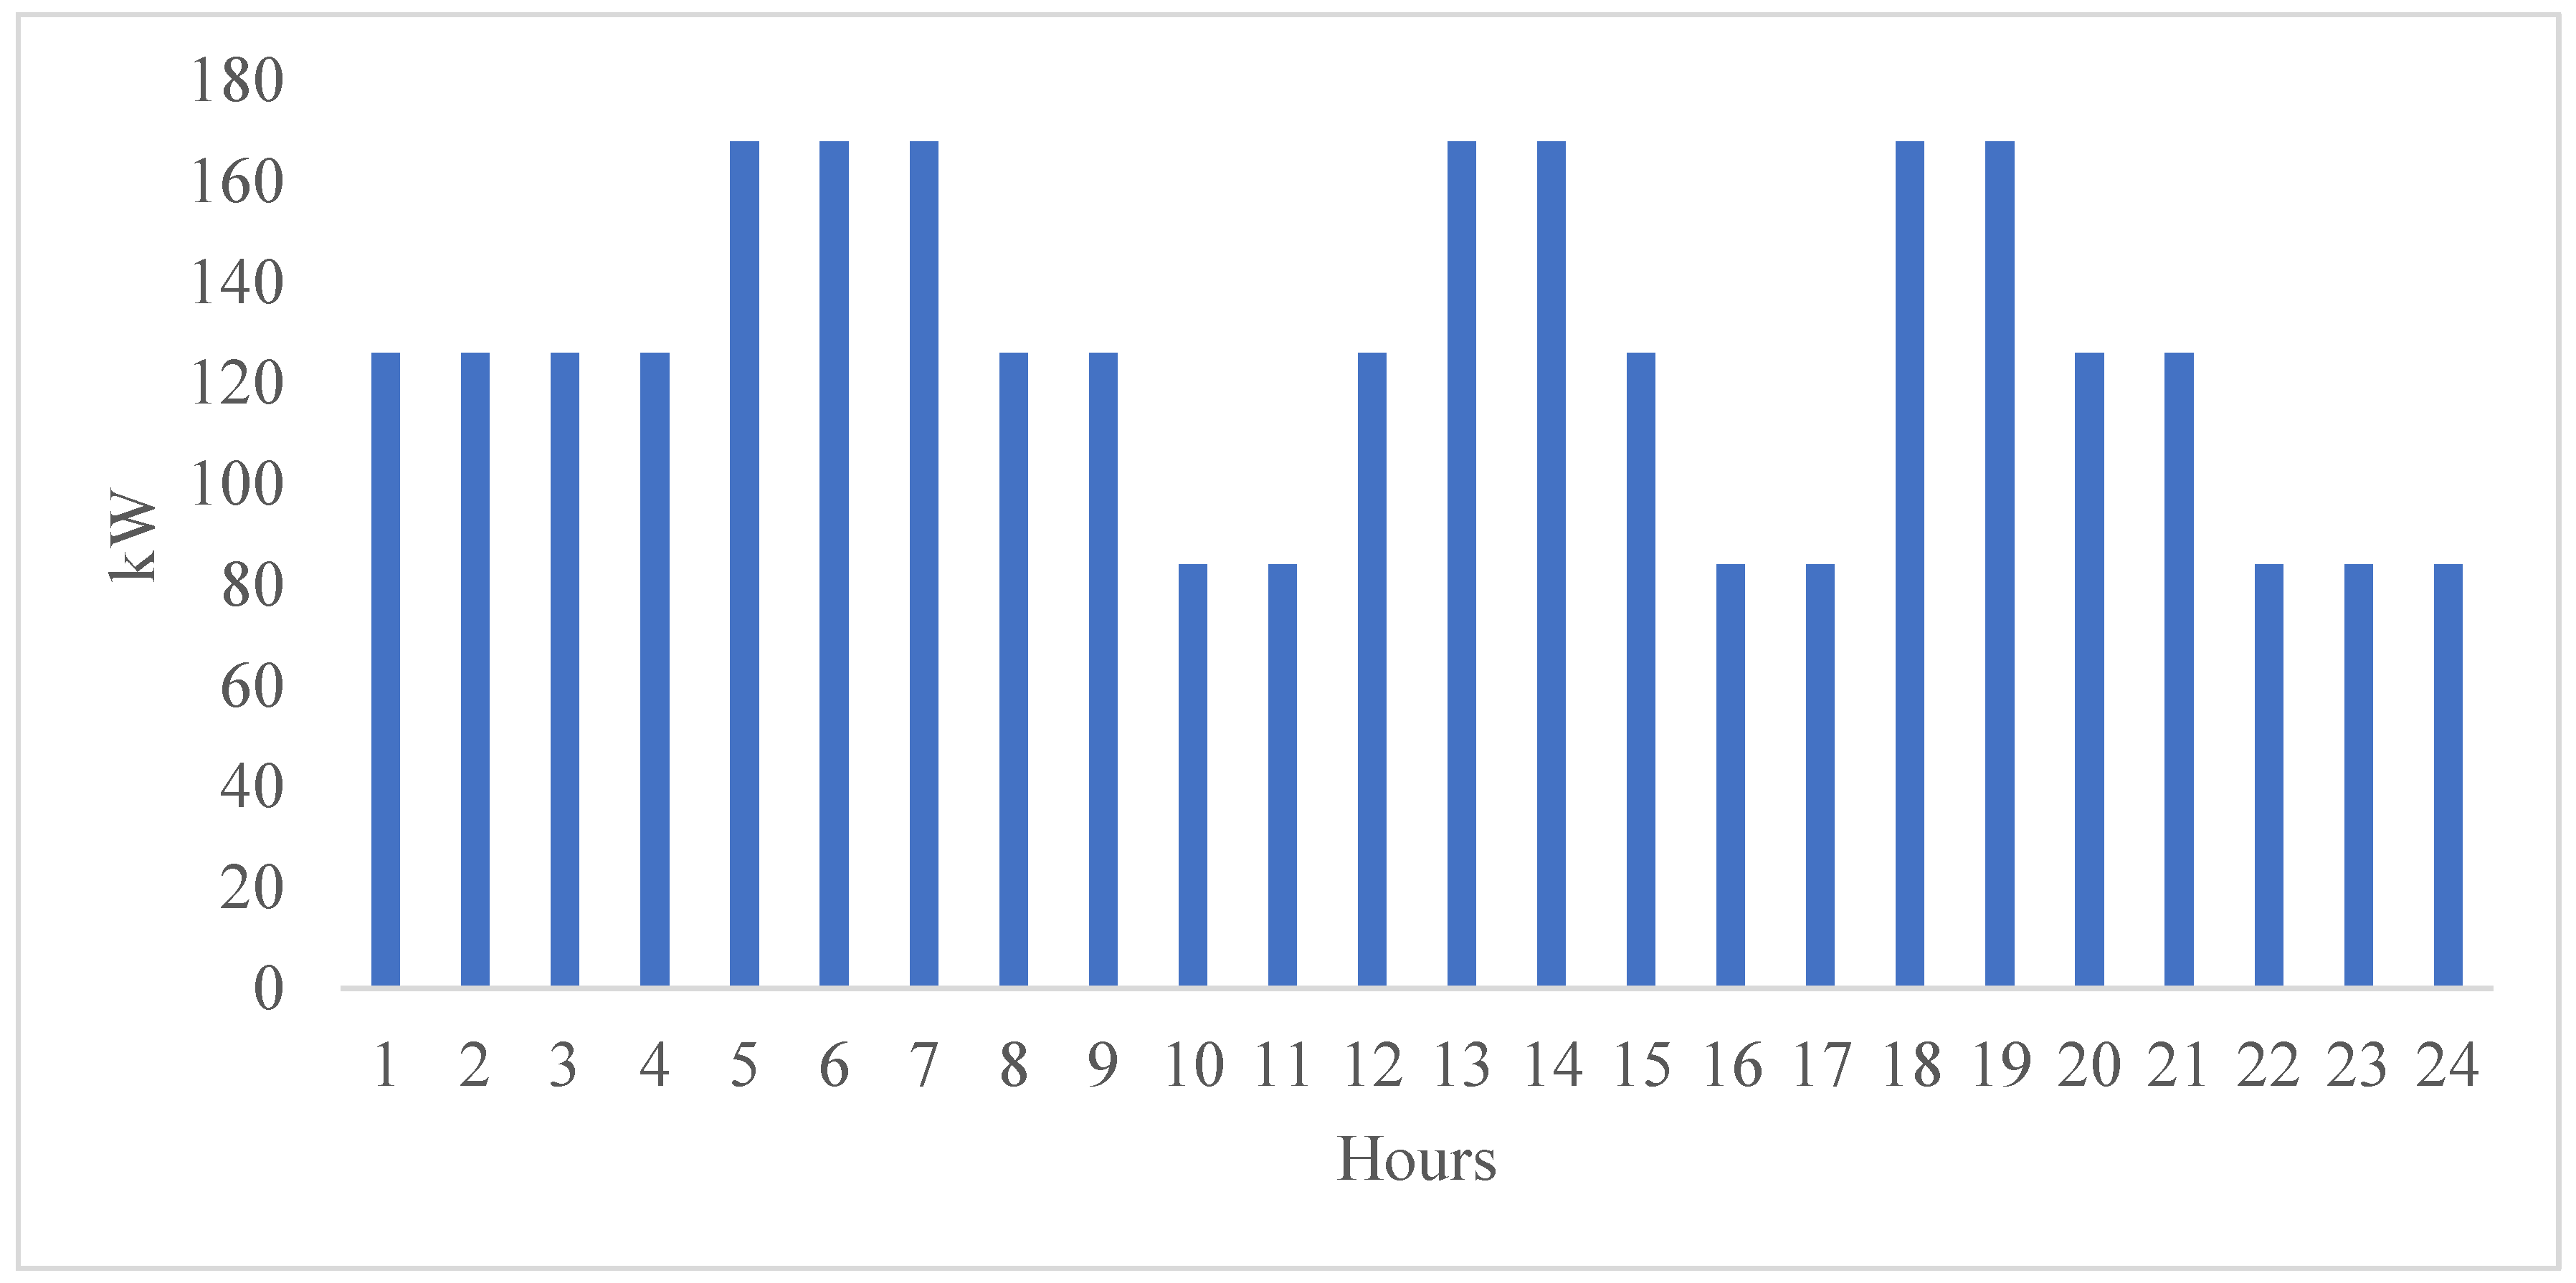
2.2. Conditions of Electric Vehicles and Charging Stations

The global market for electric vehicles is expected to rise in the future decades, as shown in Figure 4 [35]. As a champion and promoter of a green economy, Ethiopia is encouraging pro-green investments with subsidies In November 2017 it inaugurated the “Light to All” National Electrification Program to provide electricity access to all by 2025. The first electric vehicle was launched by Marathon Motors Engineering on July 2020 and is assembled locally. Ethiopia has set pro-electric cars policies and made them excise-free even before the launch of the first EV or there being any charging stations.
The charging station installation site should be conveniently accessible in the outskirts or outside of the city to maximize the use of wind and solar energy, and face south to handle maximum solar power. The site’s solar and wind energy potential should be practical. Design aspects of the charging station, wind speed and solar irradiation of the installation location, description of the system components, energy production formulations of the selected system and optimization of the hybrid energy system, are all factors to consider when sizing a charging station for a WT/PV/DG hybrid EV charging station. Aspects of constructing a charging station include taking into account and checking criteria such as the number of vehicles that can be charged, the duration of the charge, the type of outlets and battery capacity, the potential of energy sources and the station’s size [47].
In Ethiopia, the first electric vehicle business company, Marathon Motors Engineering, launched the Hyundai Kona SUV model and an electric car charging station. The launch is in line with the company’s policy of creating a pollution-free environment through its slogan “Leading the way to Zero Emission”. It is to be recalled that the first model of its electric car series, Hyundai Ioniq, was launched in July 2020. The owner of Marathon Engineering, Major Haile G/Selassie said, “The event is symbolic that will herald Ethiopia’s leap into the heights of economic prosperity”.
The most important element here is the number of electric vehicles that charge in the station every hour. Because the charging capacity and socket type differ from car to car, each vehicle must be described separately. The Kona SUV, for example, is Ethiopia’s only electric vehicle type, with a battery capacity of 42 kWh, a range of 300 km and a CO2 emission of 0 g/km. The number of EVs that arrive at a charging station, as well as the batteries’ capacity and their state of charge, determine EV demand. Thus, the first assumption is that the cars will be fully charged and a maximum of four cars will arrive in the early morning, at midday and after working hours, and the minimum arrival is two cars per hour at the charging station, as shown Figure 5. This means that the charging station must produce between 84 kWh and 172 kWh of energy per hour.

2.3. Solar PV Power Generation

The solar PV power output ( P P V ), can be found as:
P P V = G P V f P V ( I T I T , S T C )   [ 1 + α P ( T C T C , S T C ) ]
where I T is incident solar radiation on the PV array in kW/m2, G P V stands for PV nominal capacity in kW, f P V denotes derating factor of PV, I T , S T C represents the solar incident radiation at standard temperature conditions (STC) which is considered as 1 kW/m2, T C is the cell temperature of the PV in °C, α P is the temperature coefficient of power (%/°C) and T C , S T C is PV cell temperature at STC (25 °C) [48].
The hourly output power of the PV panels, P P V , can be estimated by:
P P V = G i · A · η
where G i is the global solar irradiance at the tilted surface, A is the installed area and η is, among other things, the efficiency of the PV cell system [6].
In this investigation, a generic PV system with a rated capacity of 1 kW was used. The PV with DC voltage output that was chosen has a derating factor of 80% and a lifetime of 25 years. Capital, replacement, and operation and maintenance (O&M) expenditures for the WT are estimated to be $2500/kW, $2500/kW and $10/year, respectively. Because concentric is less expensive than a generic flat plate, the flat plate was chosen for this study. The solar GHI resource is used to assess the output of flat-panel PV arrays [49].

2.4. Battery

Primarily, the status and safety of a battery’s operation and integration are monitored and maintaining by State of Charge (SoC) and Depth of Discharge (DoD). The State of Charge (SoC) is a measurement of how much energy is stored in a completely charged and empty battery. The SoC can be calculated by using the following formula:
S o C = S o C ( t 0 ) 1 Q ( t 0 0 i ( t ) d t )
The depth of discharge (DoD) of a battery is measured as a fraction of the capacity that has been discharged in comparison to the total capacity of a fully charged battery. The voltage source, internal resistance and current are all important aspects to consider when examining the charge and discharge characteristics of batteries. Depth of discharge is defined as the amount of load current i ( t ) divided by the maximum battery capacity ( Q ) over a period of time:
D o D ( % ) = 100 [ 1 Q 0 1 i ( t ) d t ]
SoC is opposite to DoD and can be interrelated as: “DoD = 1 − SoC”. The voltage at zero load and the battery’s terminal voltage can be articulated as follows:
E = E 0 K Q Q i t + A e B i t
V b a t t = E I R
where, A = Exponential voltage (V), B = Exponential capacity (Ah)−1, I = Battery current (A), i t = Extracted capacity (Ah), t = Discharge time (h), E = No load voltage (V), E 0 = constant voltage (V), K = Polarization constant voltage (V), Q = Maximum battery capacity (Ah), V b a t t   = Terminal voltage (V), R = Internal resistance (Ohm) [31].
The maximum amount of power consumption of a battery system is given by Equation (7) and the maximum battery discharge power can be calculated using Equation (8) [50].
P b ( t ) = k Q s ( t ) e k + Q ( t ) k c ( 1 e k Δ t ) 1 e k Δ t + c ( k Δ t 1 + e k Δ t )
P b ( t ) = k c Q m a x + k Q s ( t ) e k + Q ( t ) k c ( 1 e k Δ t ) 1 e k Δ t + c ( k Δ t 1 + e k Δ t )
whereby Q s ( t ) denotes the available energy at the starting of the time step and above lowest state of charge level (BOCmin = 20% for lead acid battery), Q ( t ) is the total energy at the beginning of the time step, Q m a x is the total capacity of the storage, the storage capacity ratio is represented by c , k is the storage rate constant and Δ t is the time taken in the time step.
There are various potential energy storage systems in the power sector, each having its own operational, performance, cycling and durability properties. (1) Lithium-ion batteries (Li-ion) have several desired features, such as high efficiencies, a long cycle life, high energy and high-power density, and are among the most extensively utilized energy storage technologies. (2) Lead-acid batteries are suitable for uninterruptible power supplies, power quality and spinning reserve applications because they have high dependability during their lifetime, robust surge capabilities and medium-to-high efficiency. (3) Zinc-bromine (ZnBr) flow batteries have a high energy density, a long discharge time and good reversibility [51].
In this paper, to govern the hybrid systems that are the most practicable, Hoppecke 24 OPzS 3000-Vented lead-acid (LA), EnerStore 50 Agile Flow-Zince-Bromine (ZnBr) flow, and Tesla Powerwall 2.0-Lithium-ion (LI) batteries have been chosen, and which accept surplus energy during charging and deliver energy when renewable energy sources are unable to meet load needs. Table 2 shows the relevant data of nominal voltage (V), maximum capacity (Ah), nominal capacity (kWh), maximum charge current (A), maximum discharge current (A), capital cost ($), replacement cost ($), operating and maintenance cost ($/years) and lifetime (years) of the LA, ZnBr flow and LI batteries.

2.5. Wind Turbine

Wind turbines (WT) produce electrical energy from mechanical energy generated by the wind and are dependent on wind speed. Equation (9) can be used to express the power output of a wind turbine under normal pressure and temperature [50].
P W T ( t ) = { 0 ,     v ( t )   v c u t i n   o r   v ( t )   v c u t o u t P r ( v ( t ) 3 v c u t i n 3 v r 3 v c u t i n 3 ) , v c u t i n < v ( t ) < v r P r , v r   v ( t ) < v c u t o u t    
where P r , v r , v c u t i n and v c u t o u t represent the rated power, nominal velocity, cut-in and cut-out velocity of the wind turbine.
Furthermore, wind velocity is affected by height and wind velocity at a specific level. Because the probability distribution of wind power production fluctuates with actual output, a model of power output probability distribution will be established by fitting to the Weibull distribution.
f ( V ) = r c ( V c ) 2 e x p [ ( V c ) r ]
where r and c are Weibull parameters, which were designed using the maximum likelihood approximation method for each group in step two. f is the Weibull probability density function (PDF) and V is wind speed in m/s.
Due to wind speed variations from location to location, it can be measured based on height using Equation (10):
V = V 0 ( H W T H 0 ) a
where V ,   V 0 and α are the wind speed at an essential height H W T , the wind speed at reference height H 0 and the friction coefficient, respectively. The friction coefficient depends on the terrain over which the wind blows [52], an approximated value of α is 1/7.
The following formula can be used to compute the mechanical power received from the WT:
P w i n d = 1 2 ρ A v 3 C p ( λ ,   θ )
In Equation (12), ρ is the air density and A is area of the blades. Moreover, the speed of wind is shown by v and C p is the power coefficient relating to the rotor efficiency as a function of tip speed ration (TSR) shown by λ and pitch angle shown by θ [53].
In this study, the Northern Power NPS100C-21 WT, with a rated capacity of 100 kW, developed by Northern Power Systems, featuring power regulation with variable speed, stall control and a lifetime of 20 years, has been adapted as shown in Table 3. The WT and AC voltage output that was chosen has a rotor diameter of 20.7 m and a hub height of 37 m. Capital, replacement and operation and maintenance (O&M) expenses for the WT were estimated to be $275,000/kW, $225,000/kW and $100/year, respectively [23].

2.6. Converter

A bi-directional converter has been considered to preserve energy flow between the DC to AC (inverter) and AC to DC (rectifier) components. Equation (13) is used to calculate the converter’s power rating. The inverter efficiency has been expected to be 96 percent, with a 15-year lifetime. The rectifier has a capacity of 100%, and its efficiency is estimated to be 90%. The converter’s original capital, replacement and O&M expenses are considered to be $550/kW, $500/kW and $20/kW/year, respectively.
P c o n v = P p e a k η c o n v
where P p e a k is peak load at consumption and η c o n v is the converter efficiency.

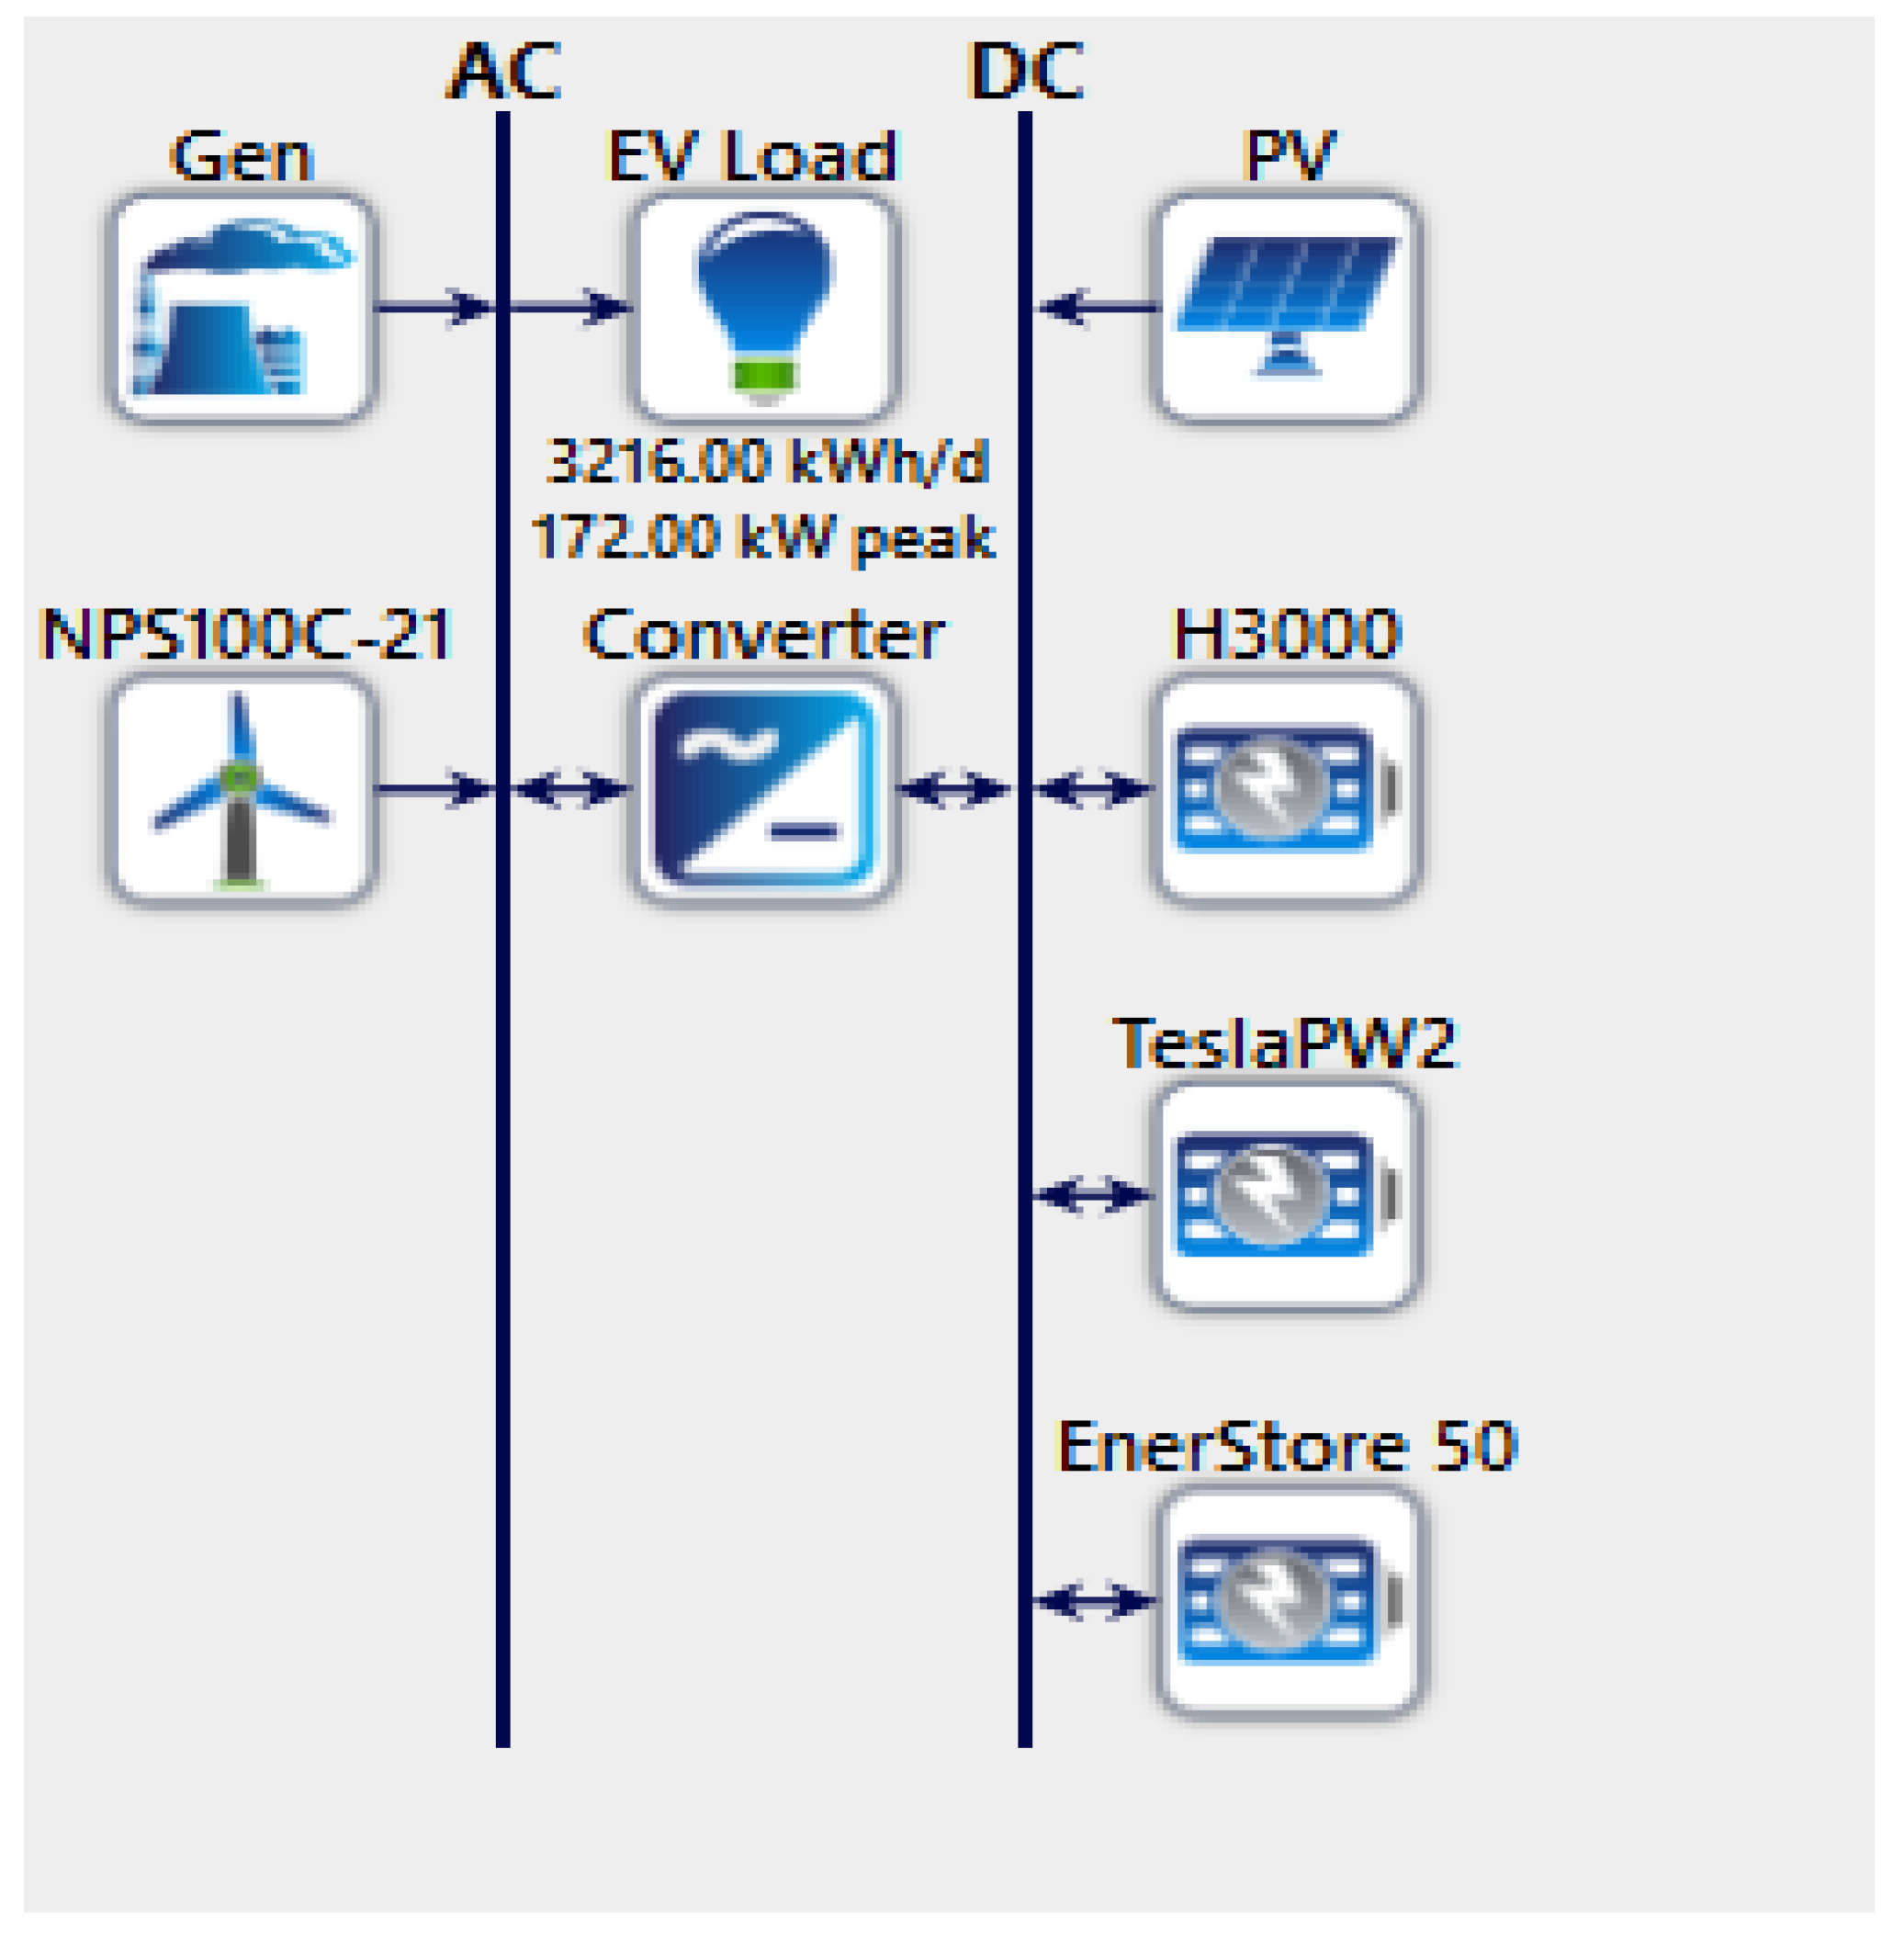
2.7. Hybrid Energy System Design with Electric Vehicle Charging Station

The proposed hybrid energy system with electric vehicle charging load was then utilized to explore the impact of different battery technology characteristics on the feasibility and techno-economic analysis of the hybrid energy source’s design. Wind turbines (WT), photovoltaics (PV), diesel generators (DG) and batteries are all part of a typical hybrid system and are illustrated in Figure 6.
In this system, the DC bus is connected to the PV module and battery, while the DG, wind turbine and load demand are connected to the AC bus. The energy flows from DC to AC bus for meeting the demand load or vice-versa to charge the battery through a bi-directional converter. The excess energy from the renewables (PV/Wind) after sustaining the electricity demand and charging the battery is dumped. A diesel generator (DG) was used as a base case energy source system to compare the results.

3. Results and Discussion

The optimization findings are given and discussed in this section. As a result, using HOMER-Pro software, three battery technologies are introduced to assess the feasibility and techno-economic analysis of a hybrid system based on electric vehicle charging load in three different Ethiopian cities. Each location’s suggested system is identified based on cost-effectiveness and environmental parameters. COE, NPC, PV capacity, wind power, diesel generator contribution, battery capacity, bi-directional converter capacity, excess energy production and RE penetration are all included while evaluating the outcomes. The following sections summarize the findings of the analysis for various places.
Monthly average solar radiation values, monthly average wind speed values and wind speed frequency values of the installation sites were employed in the hybrid energy optimizations with HOMER. The values of the photovoltaic panels, wind turbines, diesel generator, inverter, battery and load are used to construct a system diagram.

3.1. Optimized System Architecture

The feasible configuration of the hybrid system that shows the optimal results among all the sets of systems, fulfils all technical requirements and also has not only minimum NPC (net present cost), but also COE (cost of energy) of the system, was calculated using HOMER software.
After the optimization process began, combinations of 15,563, 19,535 and 14,311 were found in Addis Ababa, Jijiga and Bahir Dar, respectively. The results revealed the solar energy system installed capacity, the number of wind turbines, the initial investment cost, the operational cost, the total cost of the charging station for all combinations and the cost of electricity production. The system with the lowest cost was found among these obtained combinations, which is the PV/DG/ZnBr system, as calculated by the HOMER software.
As stated in Table 4, the optimal hybrid energy configuration is the PV/DG/ZnBr scheme in the three cities. This system includes PV modules with outputs of 829 kW, 815 kW and 803 kW; diesel generators with outputs of 190 kW each; battery storage with outputs of 162 kWh, 170 kWh and 166 kWh; a bi-directional converter with outputs of 173 kW, 178 kW and 174 kW, in Addis Ababa, Jijiga and Bahir Dar, respectively. The greatest energy distribution from the DC/AC to the AC/DC bus determines the capacity of a bi-directional converter. The better solution for all cities is combined dispatch (CD), which determines the most cost-effective load following (LF) or cycle following (CC) in each timestep.
In Figure 7, the entire NPC cost of the ideal configuration system is shown in three cities, with Jijga having the lowest NPC cost and Bahir Dar having a slightly higher NPC cost than Jijga, whereas, Addis Ababa has the highest NPC cost. The cost summary of components is shown in Figure 8 for the same optimized system.
Considering battery technology, the optimal configuration is PV/DG/ZnBr with NPC $2.97M and COE $0.196, PV/Lead-Acid/DG with NPC $4,687,826.00 and COE $0.3089, PV/LI/DG with NPC $4,813,330.00 and COE $0.3172 in Addis Ababa. In Jijga it is PV/DG/ZnBr with NPC $2.72 M and COE $0.18, PV/Lead-Acid/DG with NPC $4, 460, 253.00 and COE $0.2939, PV/LI/DG with NPC $4,569,231.00 and COE $0.3011. In Bahir Dar it is PV/DG/ZnBr with NPC $2.85 M and COE $0.188, PV/Lead-Acid/DG with NPC $4,547,210.00 and COE $0.2997, PV/LI/DG with NPC $4,646,631.00 and COE $0.30.62, as shown in Figure 8.

3.2. Comparative Evaluation of Base Case and Optimal Hybrid Systems

In this study, the sole diesel generator (DG) system is used as a baseline for evaluating environmental variables. All the lowest values of NPC compared to base case and the last highest NPC from all the feasible systems in the three cities are shown in Figure 9a–c respectively.
In the three cities, compared to the base case (DG) system, the PV/DG/ZnBr system provides the lowest NPC with values $2.97 M, $2.72 M and $2.85 M and COE with values $0.196, $0.18 and $0.188, while the WT/PV/LI, PV/LI, WT/PV/LI system has the maximum NPC and COE of all feasible systems in Addis Ababa, Jijiga and Bahir Dar respectively, as shown Figure 9a–c.
The result in Table 5 shows the present and annual worth, return on investment and internal rate of return in percent, simple and discounted payback in years, while the first rank from the feasible system, PV/DG/ZnBr is compared to base case (DG) system in Addis Ababa, Jijiga and Bahir Dar.
Furthermore, in Addis Ababa, Jijga and Bahir Dar, the renewable fraction, which is the percentage of energy provided to the load that comes from renewable power sources, was 92.8%, 96.6% and 93.7%, respectively. The monthly average electrical energy production of the PV/DG/ZnBr systems in Addis Ababa is illustrated in Figure 10. As shown from the figure, the electrical energy production of the solar PV is lower in Jun, July and August, which is rainy season in Ethiopia, whereas in season the diesel consumption of the generator is maximum, as shown in Figure 11.
Additionally, Figure 12 shows the behavior of the best hybrid system in three cities over three days. PV systems fulfill energy demand and charge the battery bank during the day in all three graphs, starting to charge about 7:00 a.m. and stopping to discharge around 4:30 p.m. During the night, the battery bank assists the system in meeting energy demands.
The environmental analysis part of the model involves the calculation of the avoided costs for CO2, PM and NOx. The obtained results of CO2 emissions at Addis Ababa, Bahir Dar and Jijiga are 63,747, 55,489 and 29,726 kg/year with base case 885,349 kg/year, respectively.
The modelling of the hybrid system and its sensitivity analysis was done using HOMER software. The results represent different combinations of components in hybrid systems, which are PV, WT, DG and battery. However, sensitivity variables must be taken into account in order to produce a rational hybrid renewable energy system solution. The solar radiation, wind speed and different chemistry of battery are the sensitivity variables considered for the optimal design of the system. It is used to find the optimal configuration among all the possible results that can be simulated to reach the least possible cost of energy.

4. Conclusions

This paper focuses on the feasibility and techno-economic analysis of electric vehicle charging of PV/wind/diesel/battery hybrid energy systems with different battery technology, which is the first in Ethiopia, and includes PV and Wind power sources, different technology battery storage, diesel generator and grid connection. The proposed methodology is discussed through the creation of a technical and economic tool for local stakeholders, authorizing them to identify the initial requirements and feasibility conditions for PV/wind/diesel/battery hybrid energy system EV charging stations that lead to this hybrid system benefitting growth: the required space, the generated investment cost and an assessment of the infrastructure’s environmental and technological character.
In this study, we have analyzed the technical feasibility and economy of the WT/PV/DG/battery hybrid system with three different batteries for electric vehicle charging stations in three different Ethiopia cities. The main results are summarized below:
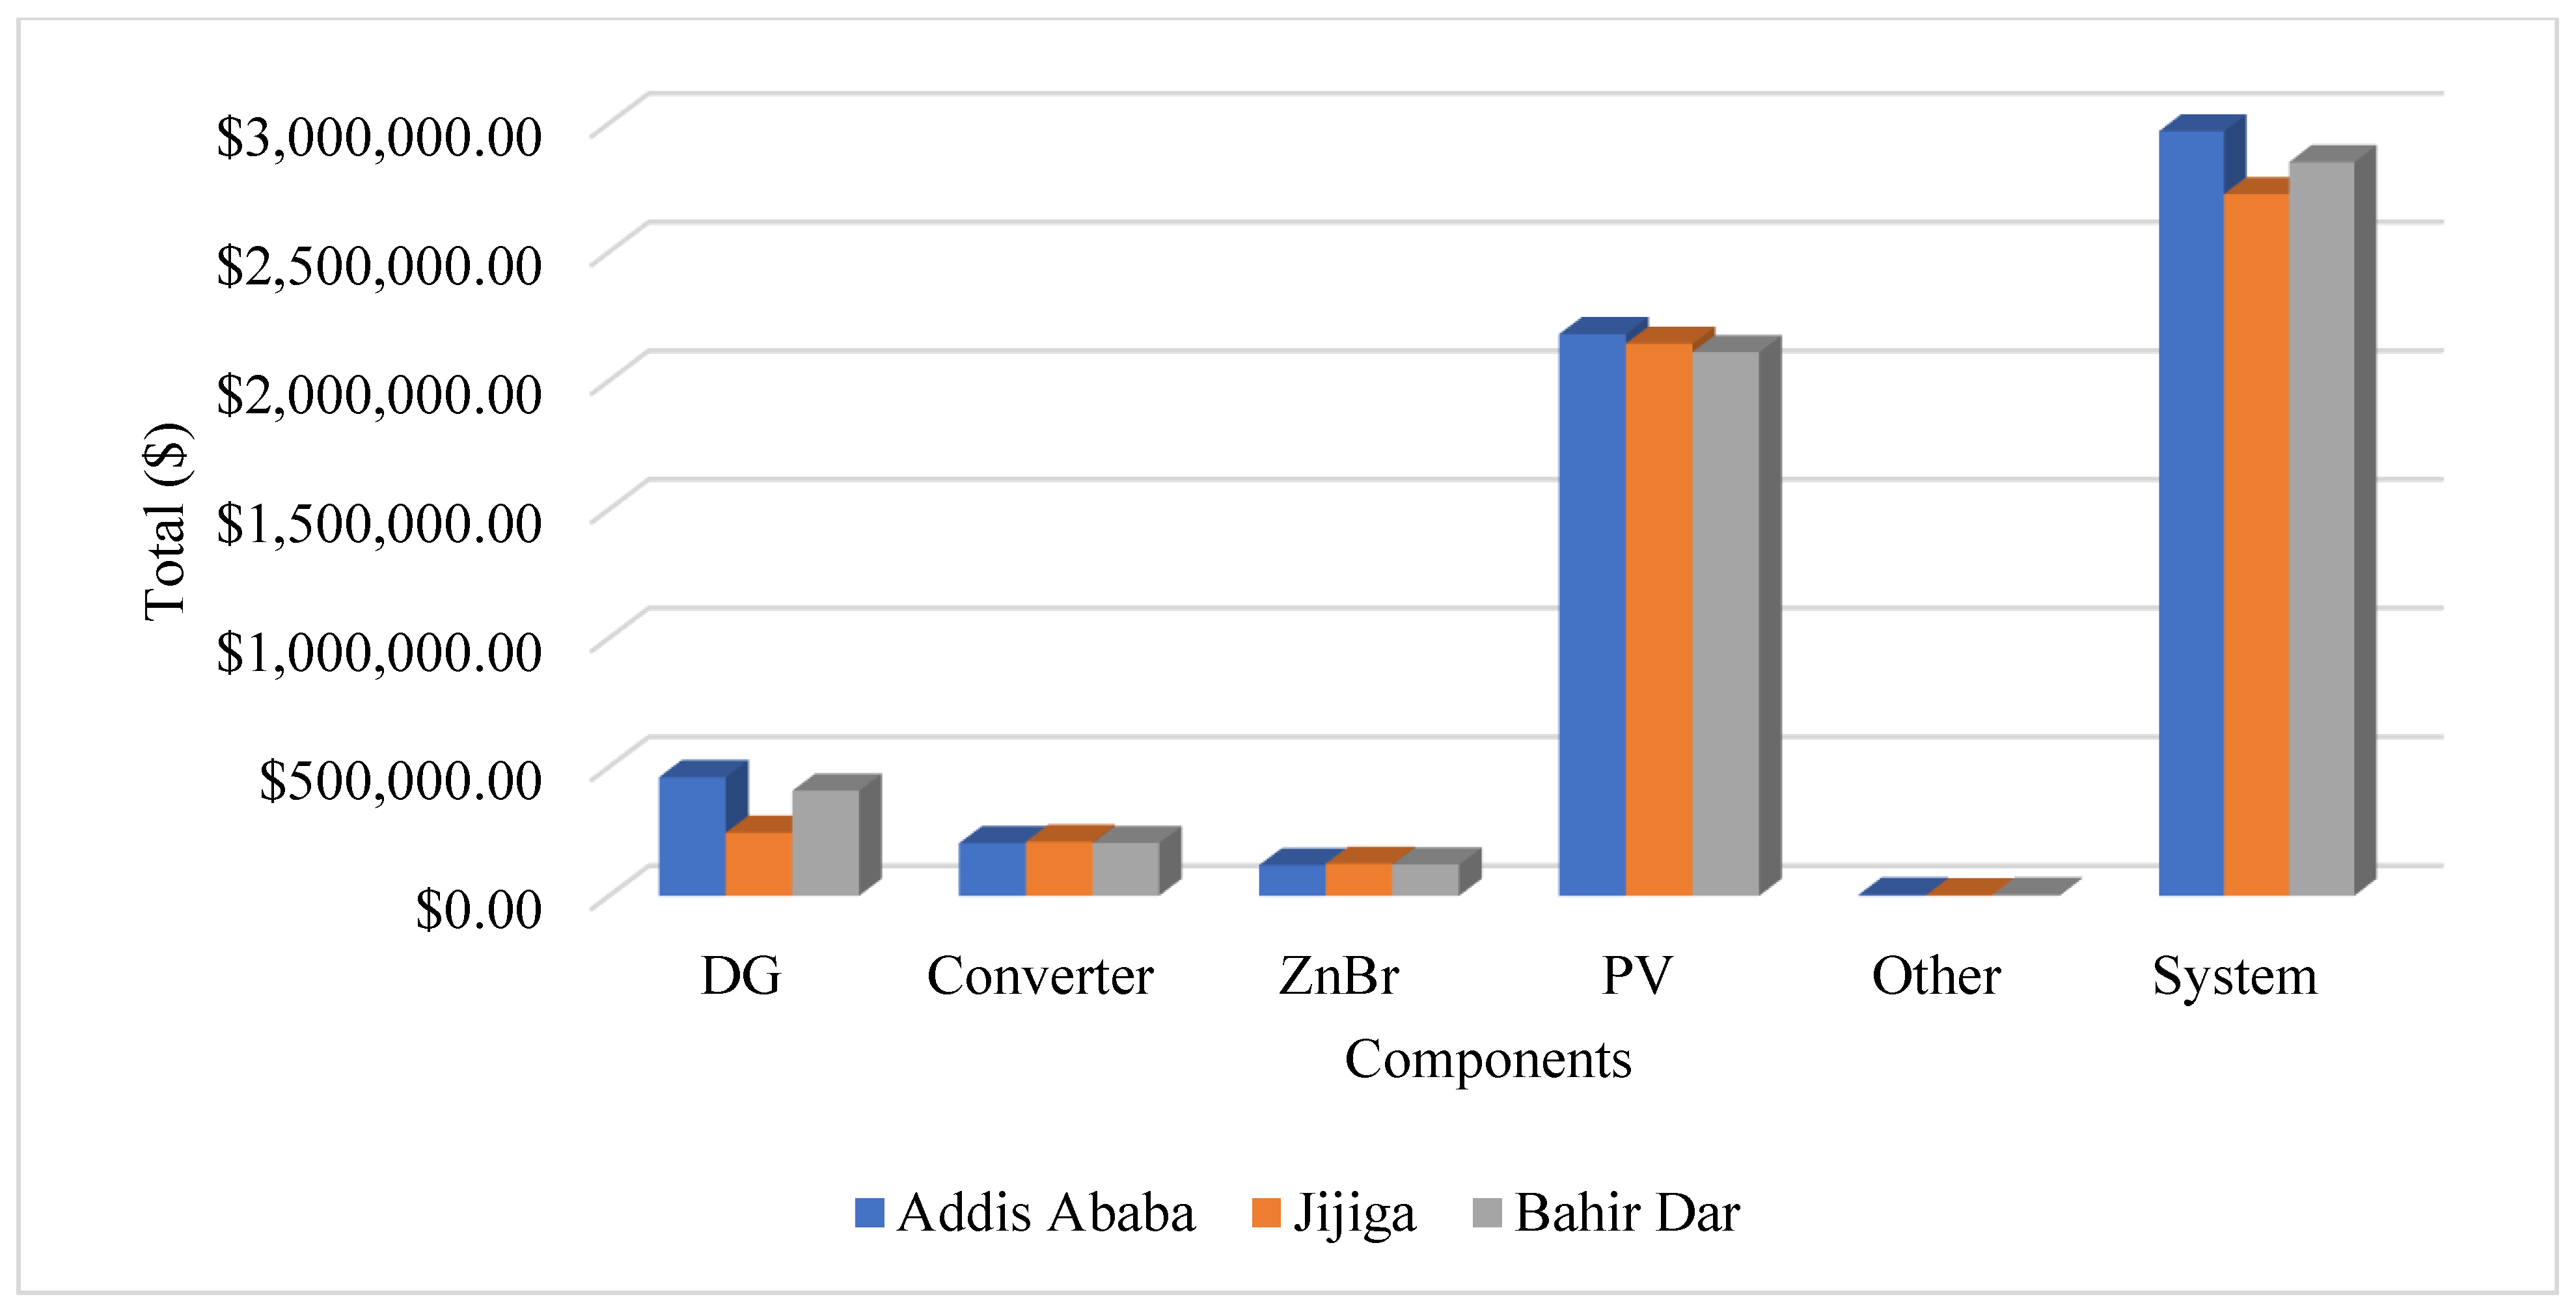
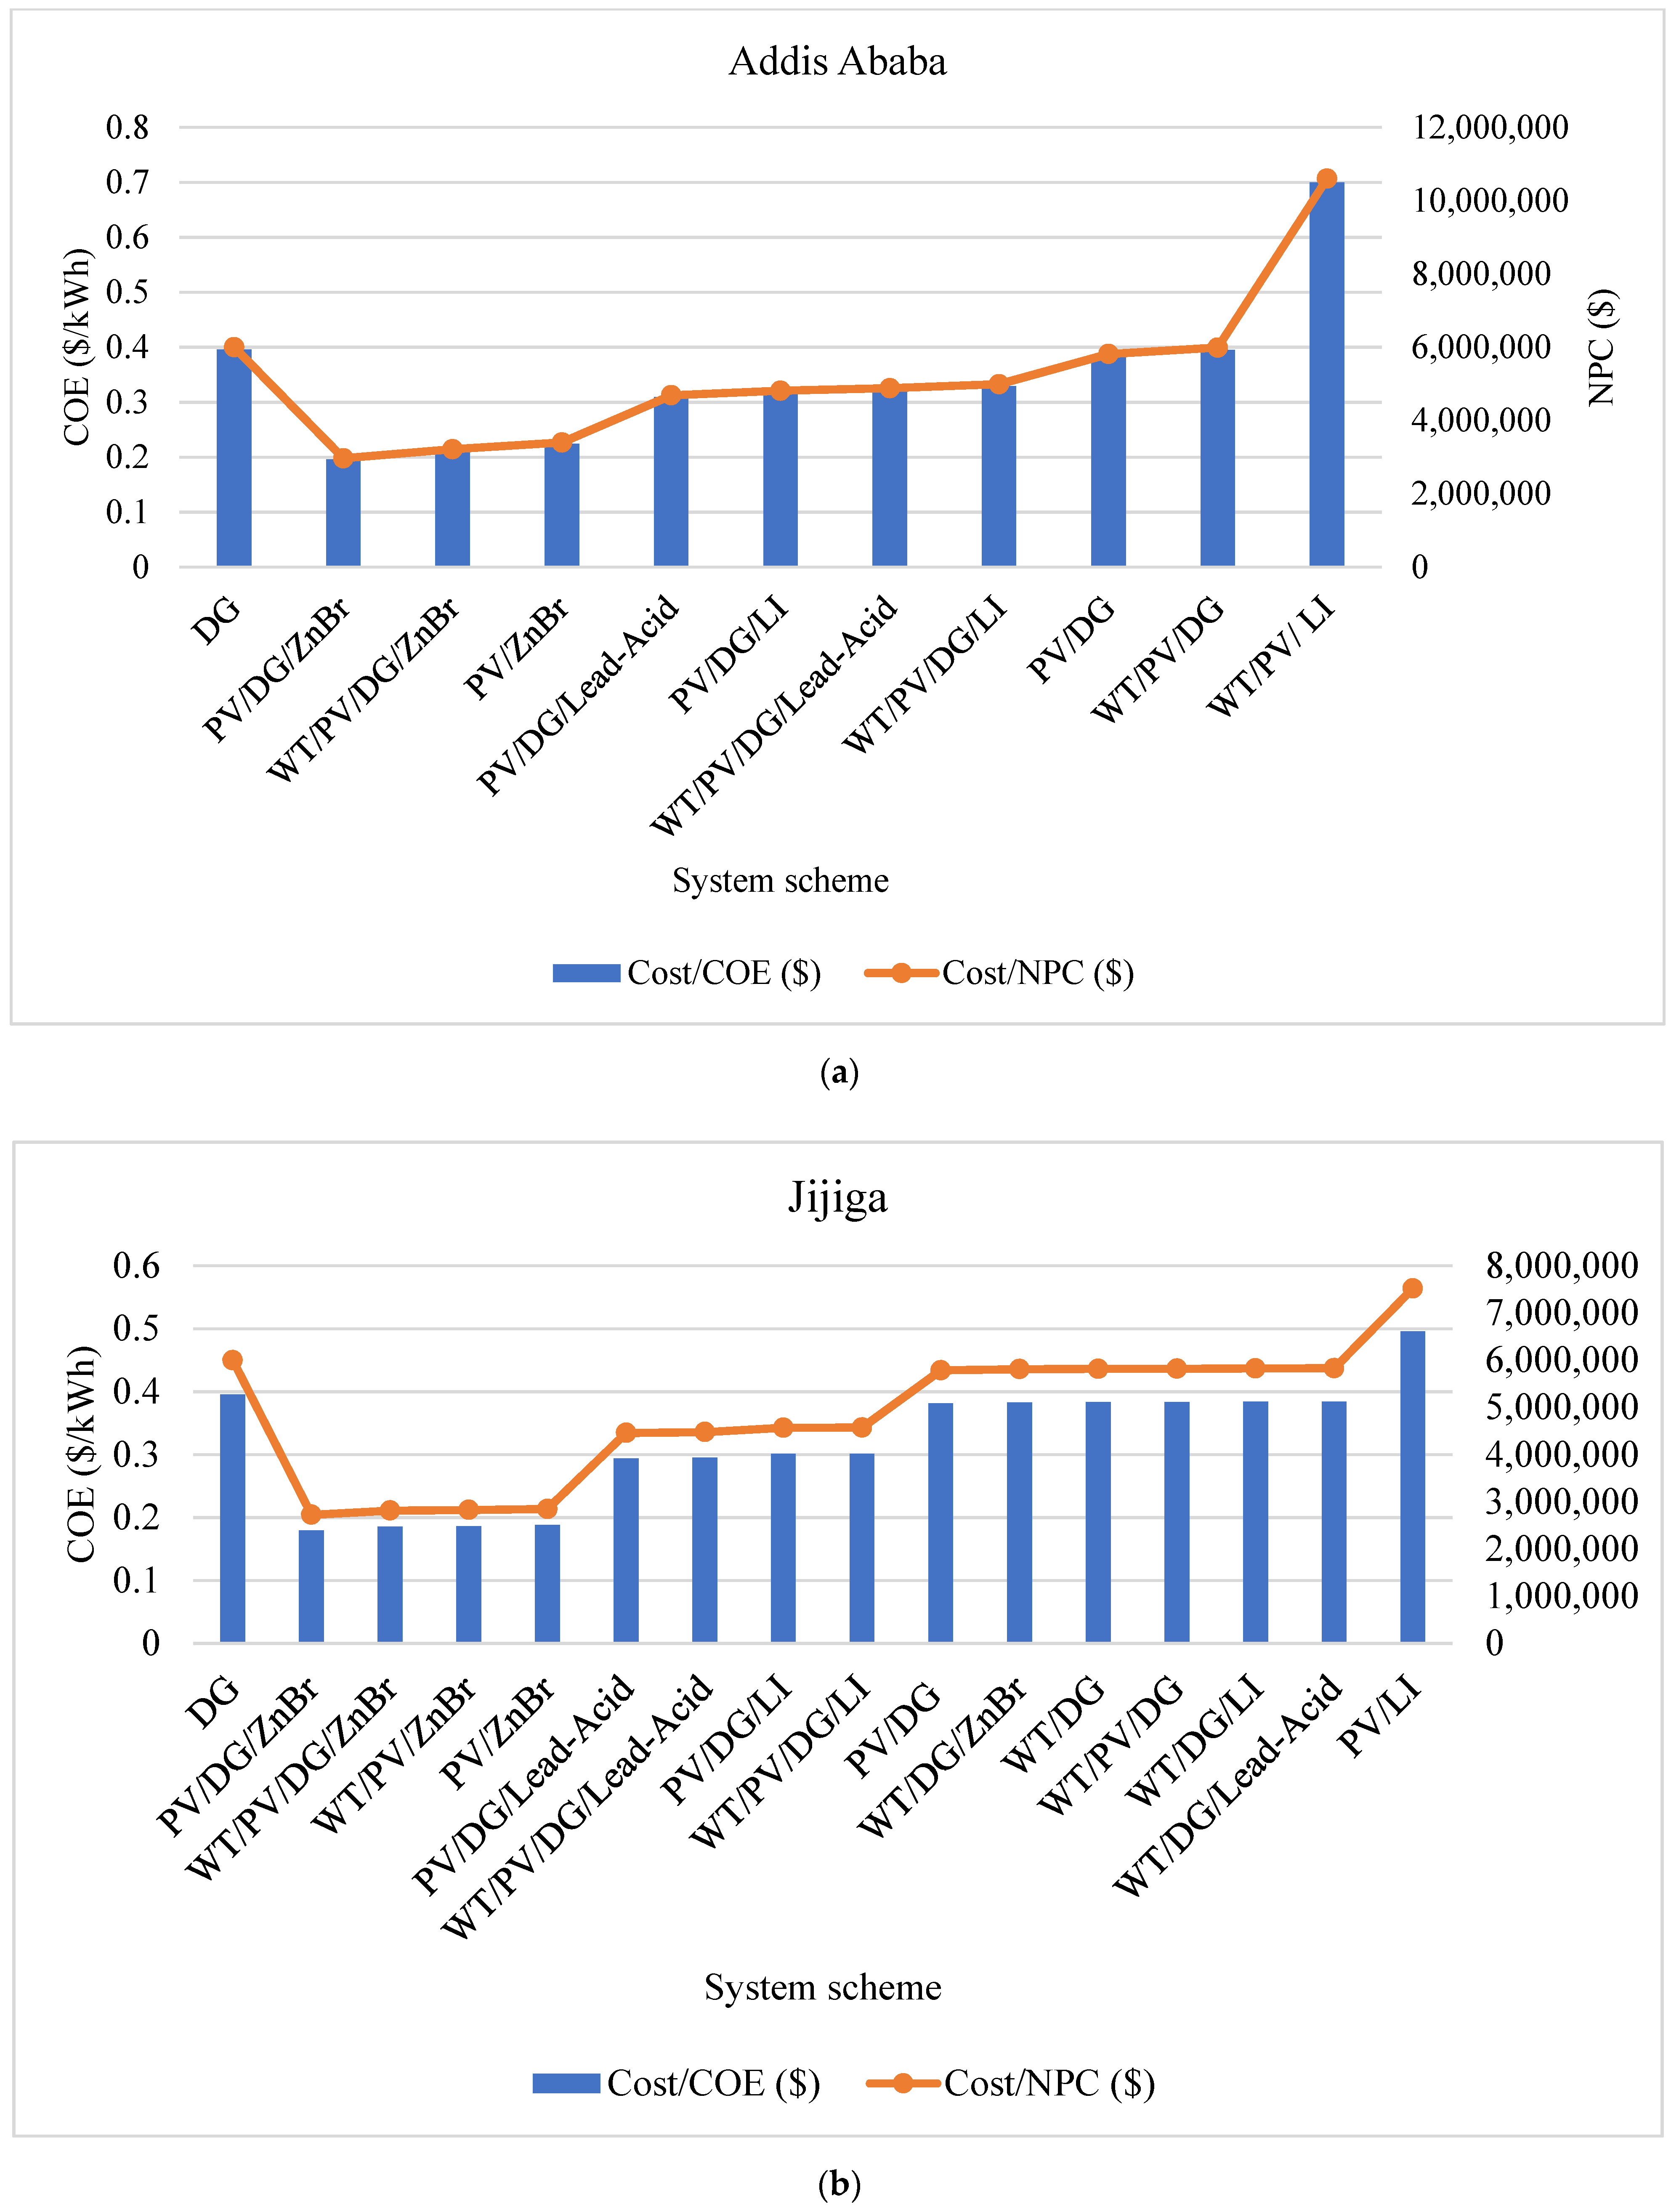
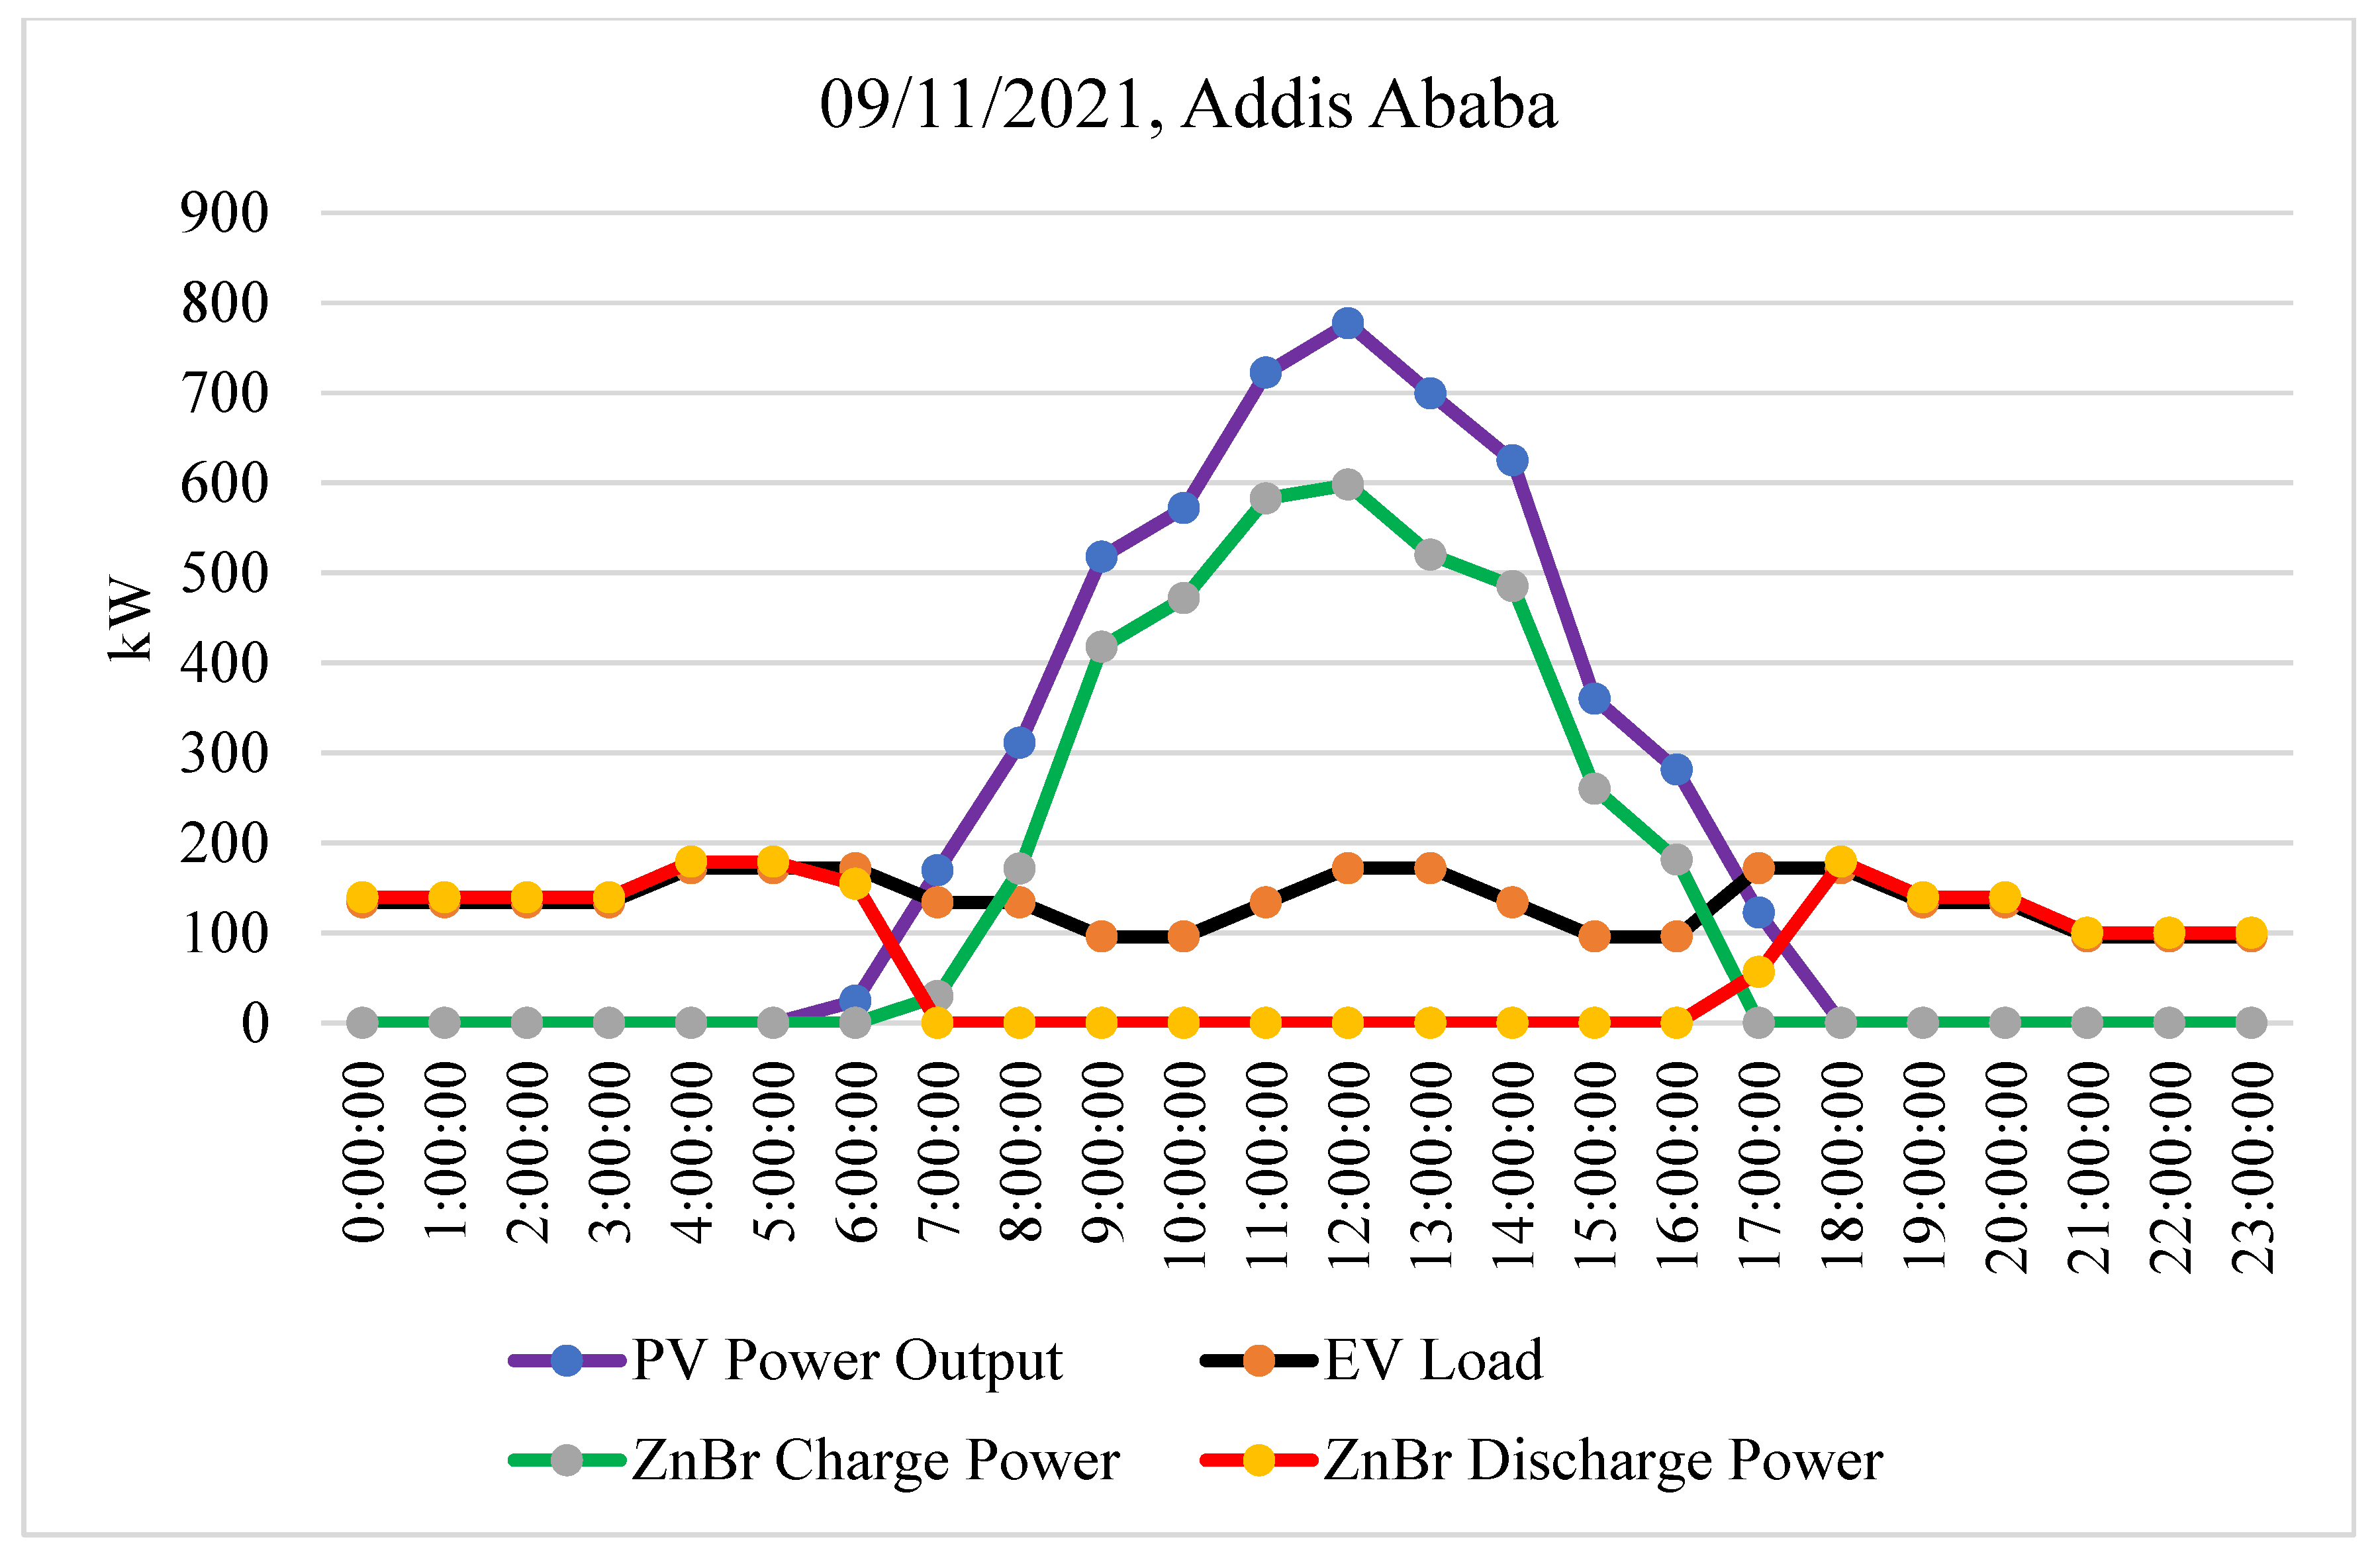
In Addis Ababa, the optimal result is an initial capital of $2,371,108.83, an operating cost of $46,248.70/year, a total NPC of $2,968,990.00 and a levelized COE of $0.1957/kWh under a combined dispatch (CC) strategy. The configuration corresponds to the PV/DG/ZnBr system, which contains an 829 kW PV, 190 kW DG, 162 ZnBr batteries and a 173 kW converter.
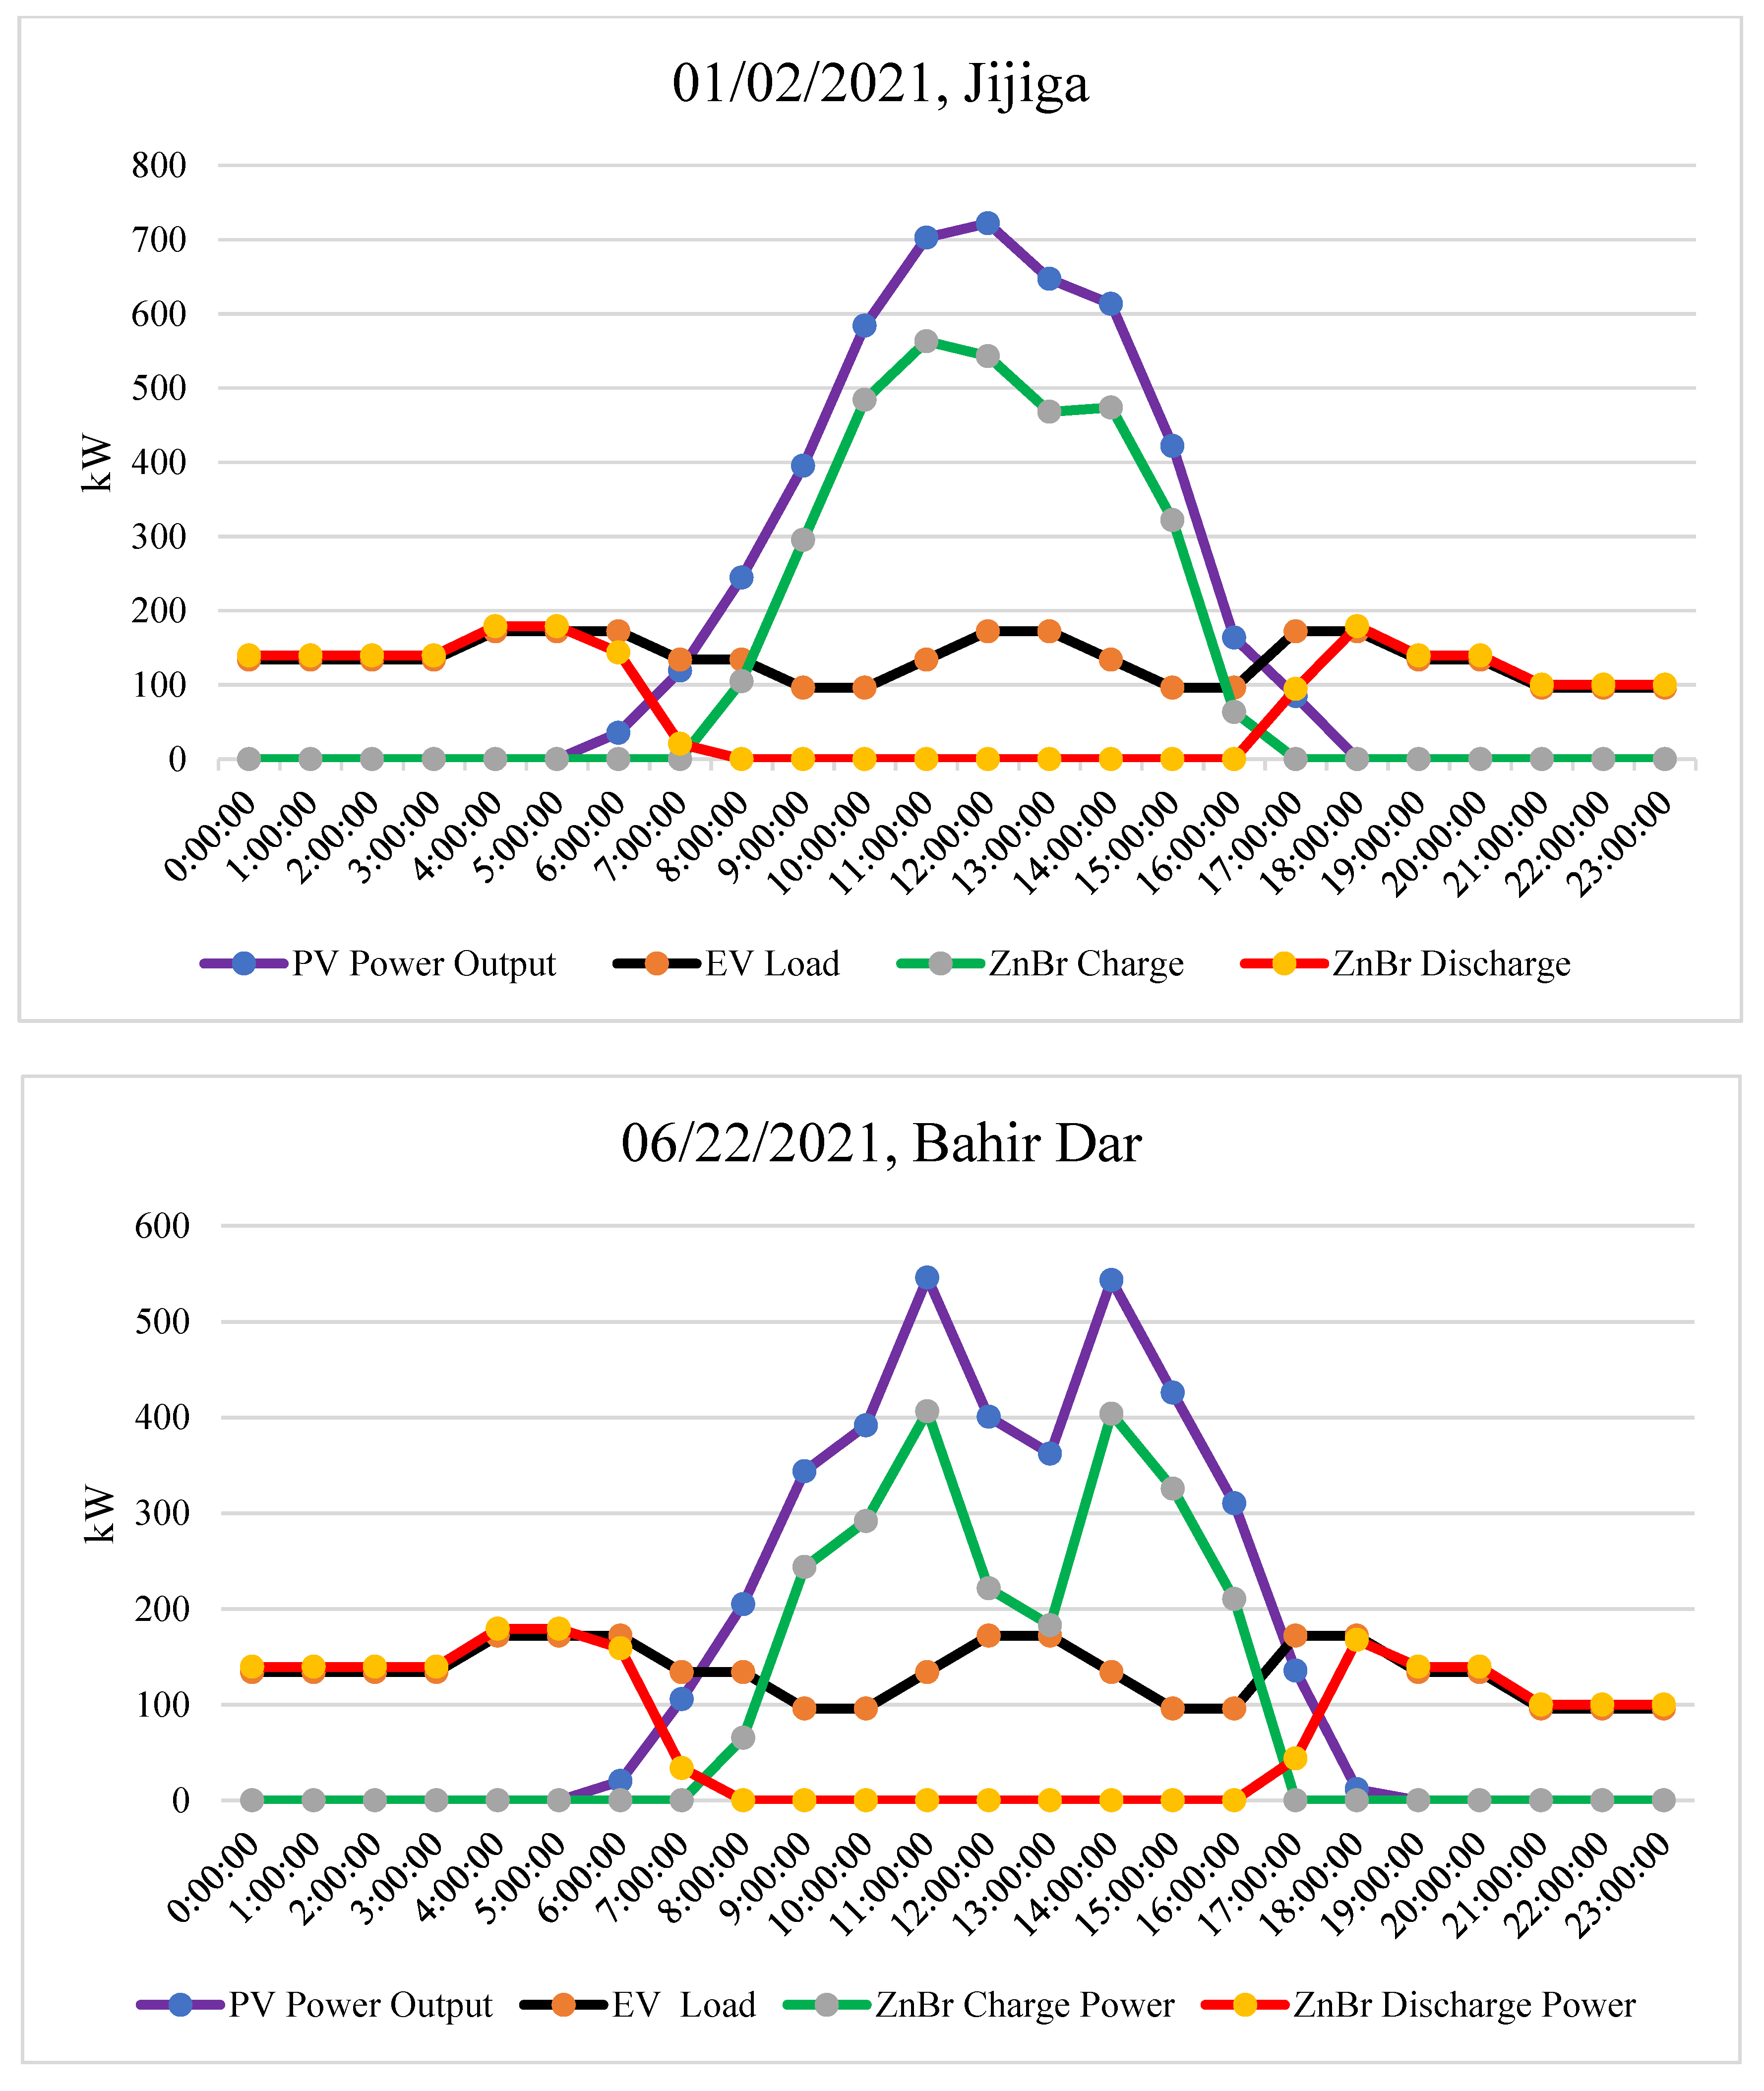
In Jijiga, the optimal hybrid energy system is an initial capital of $2,344,549.17, an operating cost of $29,412.77/year, a net NPC of $2,724,783 and COE of $0.1796/kWh with a CC strategy. The configuration corresponds to the PV/DG/ZnBr layout, which contains an 815 kW PV, 190 kW DG, 170 ZnBr batteries and a 178 kW converter.
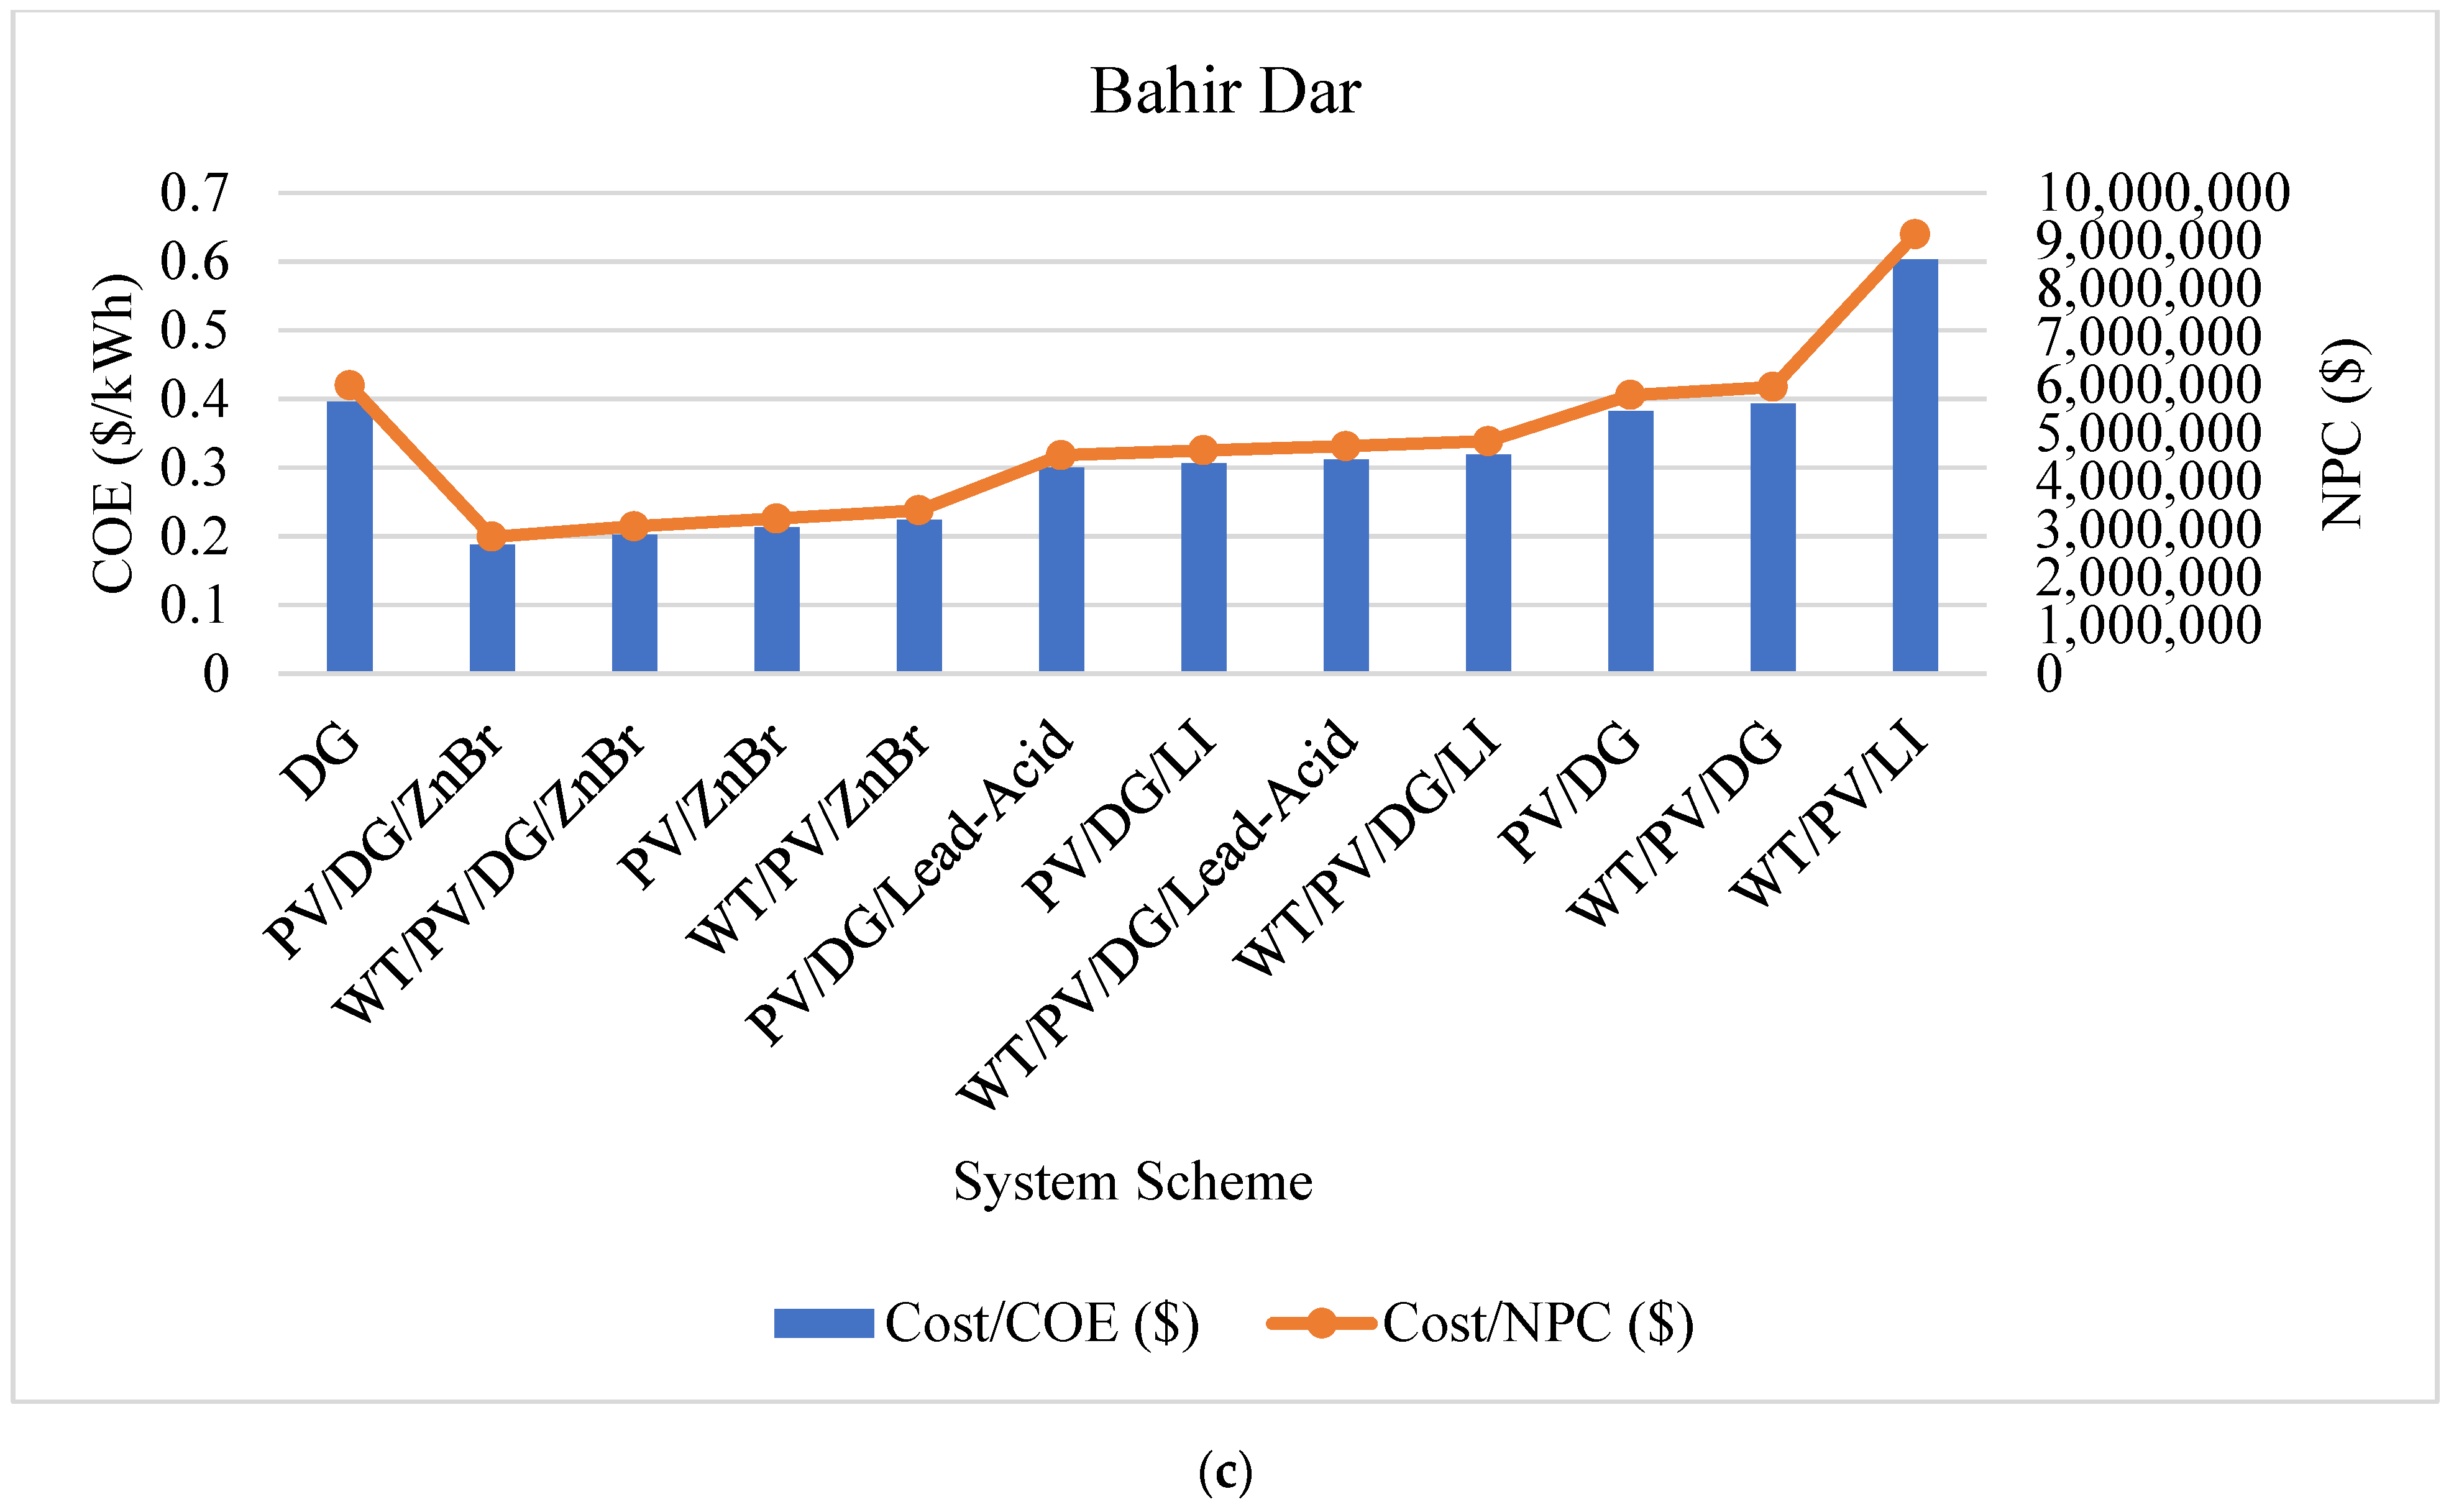
In Bahir Dar, the optimal hybrid energy system is an initial capital of $2,307,413.03, an operating cost of $41,890.54/year, a total NPC of $2,848,954.00 and a levelized COE of $0.1877/kWh with a CC strategy. The configuration corresponds to the PV/DG/ZnBr system, which contains an 803 kW PV, 190 kW DG, 166 ZnBr batteries and a 174 kW converter.
The PV/DG/ZnBr system delivers the lowest NPC and COE associated to the DG system, whereas the WT/PV/LI, PV/LI, WT/PV/LI system has the highest NPC and COE of all feasible combination systems in Addis Ababa, Jijiga and Bahir Dar respectively.
Based on the battery technology, PV/DG/ZnBr with NPC $2.97M and COE $0.196, PV/Lead-Acid/DG with NPC $4,687,826.00 and COE $0.3089, PV/LI/DG with NPC $4,813,330.00 and COE $0.3172 in Addis Ababa, PV/DG/ZnBr with NPC $2.72M and COE $0.18, PV/Lead-Acid/DG with NPC $4,460,253.00 and COE $0.2939, PV/LI/DG with NPC $4,569,231.00 and COE $0.3011 in Jijga, PV/DG/ZnBr with NPC $2.85 M and COE $0.188, PV/Lead-Acid/DG with NPC $4,547,210.00 and COE $0.2997, PV/LI/DG with NPC $4,646,631.00 and COE $0.3062 in Bahir Dar, are the lowest values.
Although this paper analyzed techno-economic feasibility, there are still shortcomings. Therefore, in future work, we will consider other stochastic optimizing algorithms methods to advance the accuracy of the consequences of the study.

Author Contributions

Conceptualization, Y.B.M. and C.-C.K.; Data curation, Y.B.M. and C.-C.K.; Formal analysis, Y.B.M. and C.-C.K.; Investigation, Y.B.M. and C.-C.K.; Methodology, Y.B.M. and C.-C.K.; Project administration, C.-C.K.; Software, Y.B.M.; Supervision, C.-C.K.; Validation, C.-C.K.; Visualization, Y.B.M. and C.-C.K.; Writing—original draft, Y.B.M.; Writing—review & editing, Y.B.M. and C.-C.K. All authors have read and agreed to the published version of the manuscript.

Funding

The support of this research by the Ministry of Science and Technology of the Republic of China under Grant No. MOST 111-2622-8-011-006-TE1 is gratefully acknowledged.

Institutional Review Board Statement

Not applicable.

Informed Consent Statement

Not applicable.

Data Availability Statement

All data are provided in this manuscript.

Acknowledgments

The authors thank the editor and the anonymous reviewers for their helpful comments and suggestions.

Conflicts of Interest

The authors declare no conflict of interest. The funders had no role in the design of the study; in the collection, analyses, or interpretation of data; in the writing of the manuscript, or in the decision to publish the results.

References

  1. Turkdogan, S. Design and optimization of a solely renewable based hybrid energy system for residential electrical load and fuel cell electric vehicle. Eng.Sci. Technol. Int. J. 2021, 24, 397–404. (In English) [Google Scholar] [CrossRef]
  2. Bryden, T.S.; Hilton, G.; Cruden, A.; Holton, T. Electric vehicle fast charging station usage and power requirements. Energy 2018, 152, 322–332. (In English) [Google Scholar] [CrossRef]
  3. Paraskevas, A.; Aletras, D.; Chrysopoulos, A.; Marinopoulos, A.; Doukas, D.I. Optimal Management for EV Charging Stations: A Win–Win Strategy for Different Stakeholders Using Constrained Deep Q-Learning. Energies 2022, 15, 2323. [Google Scholar] [CrossRef]
  4. Ekren, O.; Canbaz, C.H.; Guvel, C.B. Sizing of a solar-wind hybrid electric vehicle charging station by using HOMER software. J. Clean. Prod. 2021, 279, 123615. (In English) [Google Scholar] [CrossRef]
  5. Qian, T.; Shao, C.C.; Li, X.L.; Wang, X.L.; Shahidehpour, M. Enhanced Coordinated Operations of Electric Power and Transportation Networks via EV Charging Services. IEEE Trans. Smart Grid 2020, 11, 3019–3030. (In English) [Google Scholar] [CrossRef]
  6. Dominguez-Navarro, J.A.; Dufo-Lopez, R.; Yusta-Loyo, J.M.; Artal-Sevil, J.S.; Bernal-Agustin, J.L. Design of an electric vehicle fast-charging station with integration of renewable energy and storage systems. Int. J. Electr. Power Energy Syst. 2019, 105, 46–58. (In English) [Google Scholar] [CrossRef]
  7. Ghotge, R.; Snow, Y.; Farahani, S.; Lukszo, Z.; van Wijk, A. Optimized Scheduling of EV Charging in Solar Parking Lots for Local Peak Reduction under EV Demand Uncertainty. Energies 2020, 13, 1275. (In English) [Google Scholar] [CrossRef] [Green Version]
  8. Mounce, R.; Nelson, J.D. On the potential for one-way electric vehicle car-sharing in future mobility systems. Transp. Res. Part A Policy Pr. 2019, 120, 17–30. (In English) [Google Scholar] [CrossRef]
  9. Alkawsi, G.; Baashar, Y.; Abbas, U.D.; Alkahtani, A.A.; Tiong, S.K. Review of Renewable Energy-Based Charging Infrastructure for Electric Vehicles. Appl. Sci. 2021, 11, 3847. (In English) [Google Scholar] [CrossRef]
  10. Hannan, M.; Mollik, M.; Al-Shetwi, A.Q.; Rahman, S.; Mansor, M.; Begum, R.; Muttaqi, K.; Dong, Z. Vehicle to grid connected technologies and charging strategies: Operation, control, issues and recommendations. J. Clean. Prod. 2022, 339, 130587. [Google Scholar] [CrossRef]
  11. Ahmad, A.; Ullah, Z.; Khalid, M.; Ahmad, N. Toward Efficient Mobile Electric Vehicle Charging under Heterogeneous Battery Switching Technology. Appl. Sci. 2022, 12, 904. (In English) [Google Scholar] [CrossRef]
  12. Lin, X.; Zamora, R. Controls of hybrid energy storage systems in microgrids: Critical review, case study and future trends. J. Energy Storage 2022, 47, 103884. [Google Scholar] [CrossRef]
  13. Merei, G.; Berger, C.; Sauer, D.U. Optimization of an off-grid hybrid PV–Wind–Diesel system with different battery technologies using genetic algorithm. Sol. Energy 2013, 97, 460–473. (In English) [Google Scholar] [CrossRef]
  14. Javed, M.S.; Ma, T.; Jurasz, J.; Canales, F.A.; Lin, S.Q.; Ahmed, S.; Zhang, Y.J. Economic analysis and optimization of a renewable energy based power supply system with different energy storages for a remote island. Renew. Energy 2021, 164, 1376–1394. (In English) [Google Scholar] [CrossRef]
  15. Wang, D.; Locment, F.; Sechilariu, M. Modelling, Simulation, and Management Strategy of an Electric Vehicle Charging Station Based on a DC Microgrid. Appl. Sci. 2020, 10, 2053. (In English) [Google Scholar] [CrossRef] [Green Version]
  16. Leone, C.; Longo, M.; Fernandez-Ramirez, L.M.; Garcia-Trivino, P. Multi-Objective Optimization of PV and Energy Storage Systems for Ultra-Fast Charging Stations. IEEE Access 2022, 10, 14208–14224. (In English) [Google Scholar] [CrossRef]
  17. Petrusic, A.; Janjic, A. Renewable Energy Tracking and Optimization in a Hybrid Electric Vehicle Charging Station. Appl. Sci. 2021, 11, 245. (In English) [Google Scholar] [CrossRef]
  18. Alotaibi, M.A.; Eltamaly, A.M. A Smart Strategy for Sizing of Hybrid Renewable Energy System to Supply Remote Loads in Saudi Arabia. Energies 2021, 14, 7069. (In English) [Google Scholar] [CrossRef]
  19. Yang, Z.X.; Huang, X.L.; Gao, T.; Liu, Y.; Gao, S. Real-Time Energy Management Strategy for Parking Lot Considering Maximum Penetration of Electric Vehicles. IEEE Access 2022, 10, 5281–5291. (In English) [Google Scholar] [CrossRef]
  20. Liu, C.H.; Gao, Y.; Liu, L. Toward safe and rapid battery charging: Design optimal fast charging strategies thorough aphysics-basedmodel considering lithium plating. Int. J. Energy Res. 2021, 45, 2303–2320. (In English) [Google Scholar] [CrossRef]
  21. Mostafa, M.H.; Aleem, S.H.E.A.; Ali, S.G.; Abdelaziz, A.Y.; Ribeiro, P.F.; Ali, Z.M. Robust Energy Management and Economic Analysis of Microgrids Considering Different Battery Characteristics. IEEE Access 2020, 8, 54751–54775. (In English) [Google Scholar] [CrossRef]
  22. Li, S.Q.; Ju, C.K.; Li, J.L.; Fang, R.; Tao, Z.F.; Li, B.; Zhang, T.T. State-of-Charge Estimation of Lithium-Ion Batteries in the Battery Degradation Process Based on Recurrent Neural Network. Energies 2021, 14, 306. (In English) [Google Scholar] [CrossRef]
  23. Li, C.; Zhou, D.Q.; Wang, H.; Lu, Y.Z.; Li, D.D. Techno-economic performance study of stand-alone wind/diesel/battery hybrid system with different battery technologies in the cold region of China. Energy 2020, 192, 116702. (In English) [Google Scholar] [CrossRef]
  24. Kong, W.W.; Luo, Y.G.; Feng, G.X.; Li, K.Q.; Peng, H.E. Optimal location planning method of fast charging station for electric vehicles considering operators, drivers, vehicles, traffic flow and power grid. Energy 2019, 186, 115826. (In English) [Google Scholar] [CrossRef]
  25. Yue, Q.L.; He, C.X.; Jiang, H.R.; Wu, M.C.; Zhao, T.S. A hybrid battery thermal management system for electric vehicles under dynamic working conditions. Int. J. Heat Mass Transf. 2021, 164, 120528. (In English) [Google Scholar] [CrossRef]
  26. Zhong, J.Y.; Xiong, X.F. An Orderly EV Charging Scheduling Method Based on Deep Learning in Cloud-Edge Collaborative Environment. Adv. Civ. Eng. 2021, 2021, 6690610. (In English) [Google Scholar] [CrossRef]
  27. Hosseinalizadeh, R.; Shakouri, G.H.; Amalnick, M.S.; Taghipour, P. Economic sizing of a hybrid (PV-WT-FC) renewable energy system (HRES) for stand-alone usages by an optimization-simulation model: Case study of Iran. Renew. Sust. Energy Rev 2016, 54, 139–150. Erratum in Renew. Sust. Energy Rev. 2016, 57, 1657. (In English) [Google Scholar] [CrossRef] [Green Version]
  28. Choudhury, S. Review of energy storage system technologies integration to microgrid: Types, control strategies, issues, and future prospects. J. Energy Storage 2022, 48, 103966. [Google Scholar] [CrossRef]
  29. Eltamaly, A.M.; Al-Shammaa, A.A. Optimal configuration for isolated hybrid renewable energy systems. J. Renew. Sustain. Energy 2016, 8, 045502. (In English) [Google Scholar] [CrossRef]
  30. Gümrükcü, E.; Ponci, F.; Monti, A.; Guidi, G.; D’Arco, S.; Suul, J.A. Optimal load management strategy for large electric vehicle charging stations with undersized charger clusters. IET Electr. Syst. Transp. 2022, 12, 49–64. [Google Scholar] [CrossRef]
  31. Kebede, A.A.; Coosemans, T.; Messagie, M.; Jemal, T.; Behabtu, H.A.; Van Mierlo, J.; Berecibar, M. Techno-economic analysis of lithium-ion and lead-acid batteries in stationary energy storage application. J. Energy Storage 2021, 40, 102748. (In English) [Google Scholar] [CrossRef]
  32. Accardo, A.; Dotelli, G.; Musa, M.L.; Spessa, E. Life Cycle Assessment of an NMC Battery for Application to Electric Light-Duty Commercial Vehicles and Comparison with a Sodium-Nickel-Chloride Battery. Appl. Sci. 2021, 11, 1160. (In English) [Google Scholar] [CrossRef]
  33. Shalaby, A.A.; Shaaban, M.F.; Mokhtar, M.; Zeineldin, H.H.; El-Saadany, E.F. A Dynamic Optimal Battery Swapping Mechanism for Electric Vehicles Using an LSTM-Based Rolling Horizon Approach. IEEE Trans. Intell. Transp. Syst. (Early Access) 2022, 1–15. [Google Scholar] [CrossRef]
  34. Alvez, C.A.; Sarmiento, J.E.; de Souza, A.Z.; Ribeiro, P.F.; Leme, R.C.; Fiorese, A. Energy management of microgrids including frequency and voltage restoration. In Proceedings of the 2018 IEEE Power & Energy Society General Meeting (PESGM), Portland, OR, USA, 5–10 August 2018; pp. 1–5. [Google Scholar]
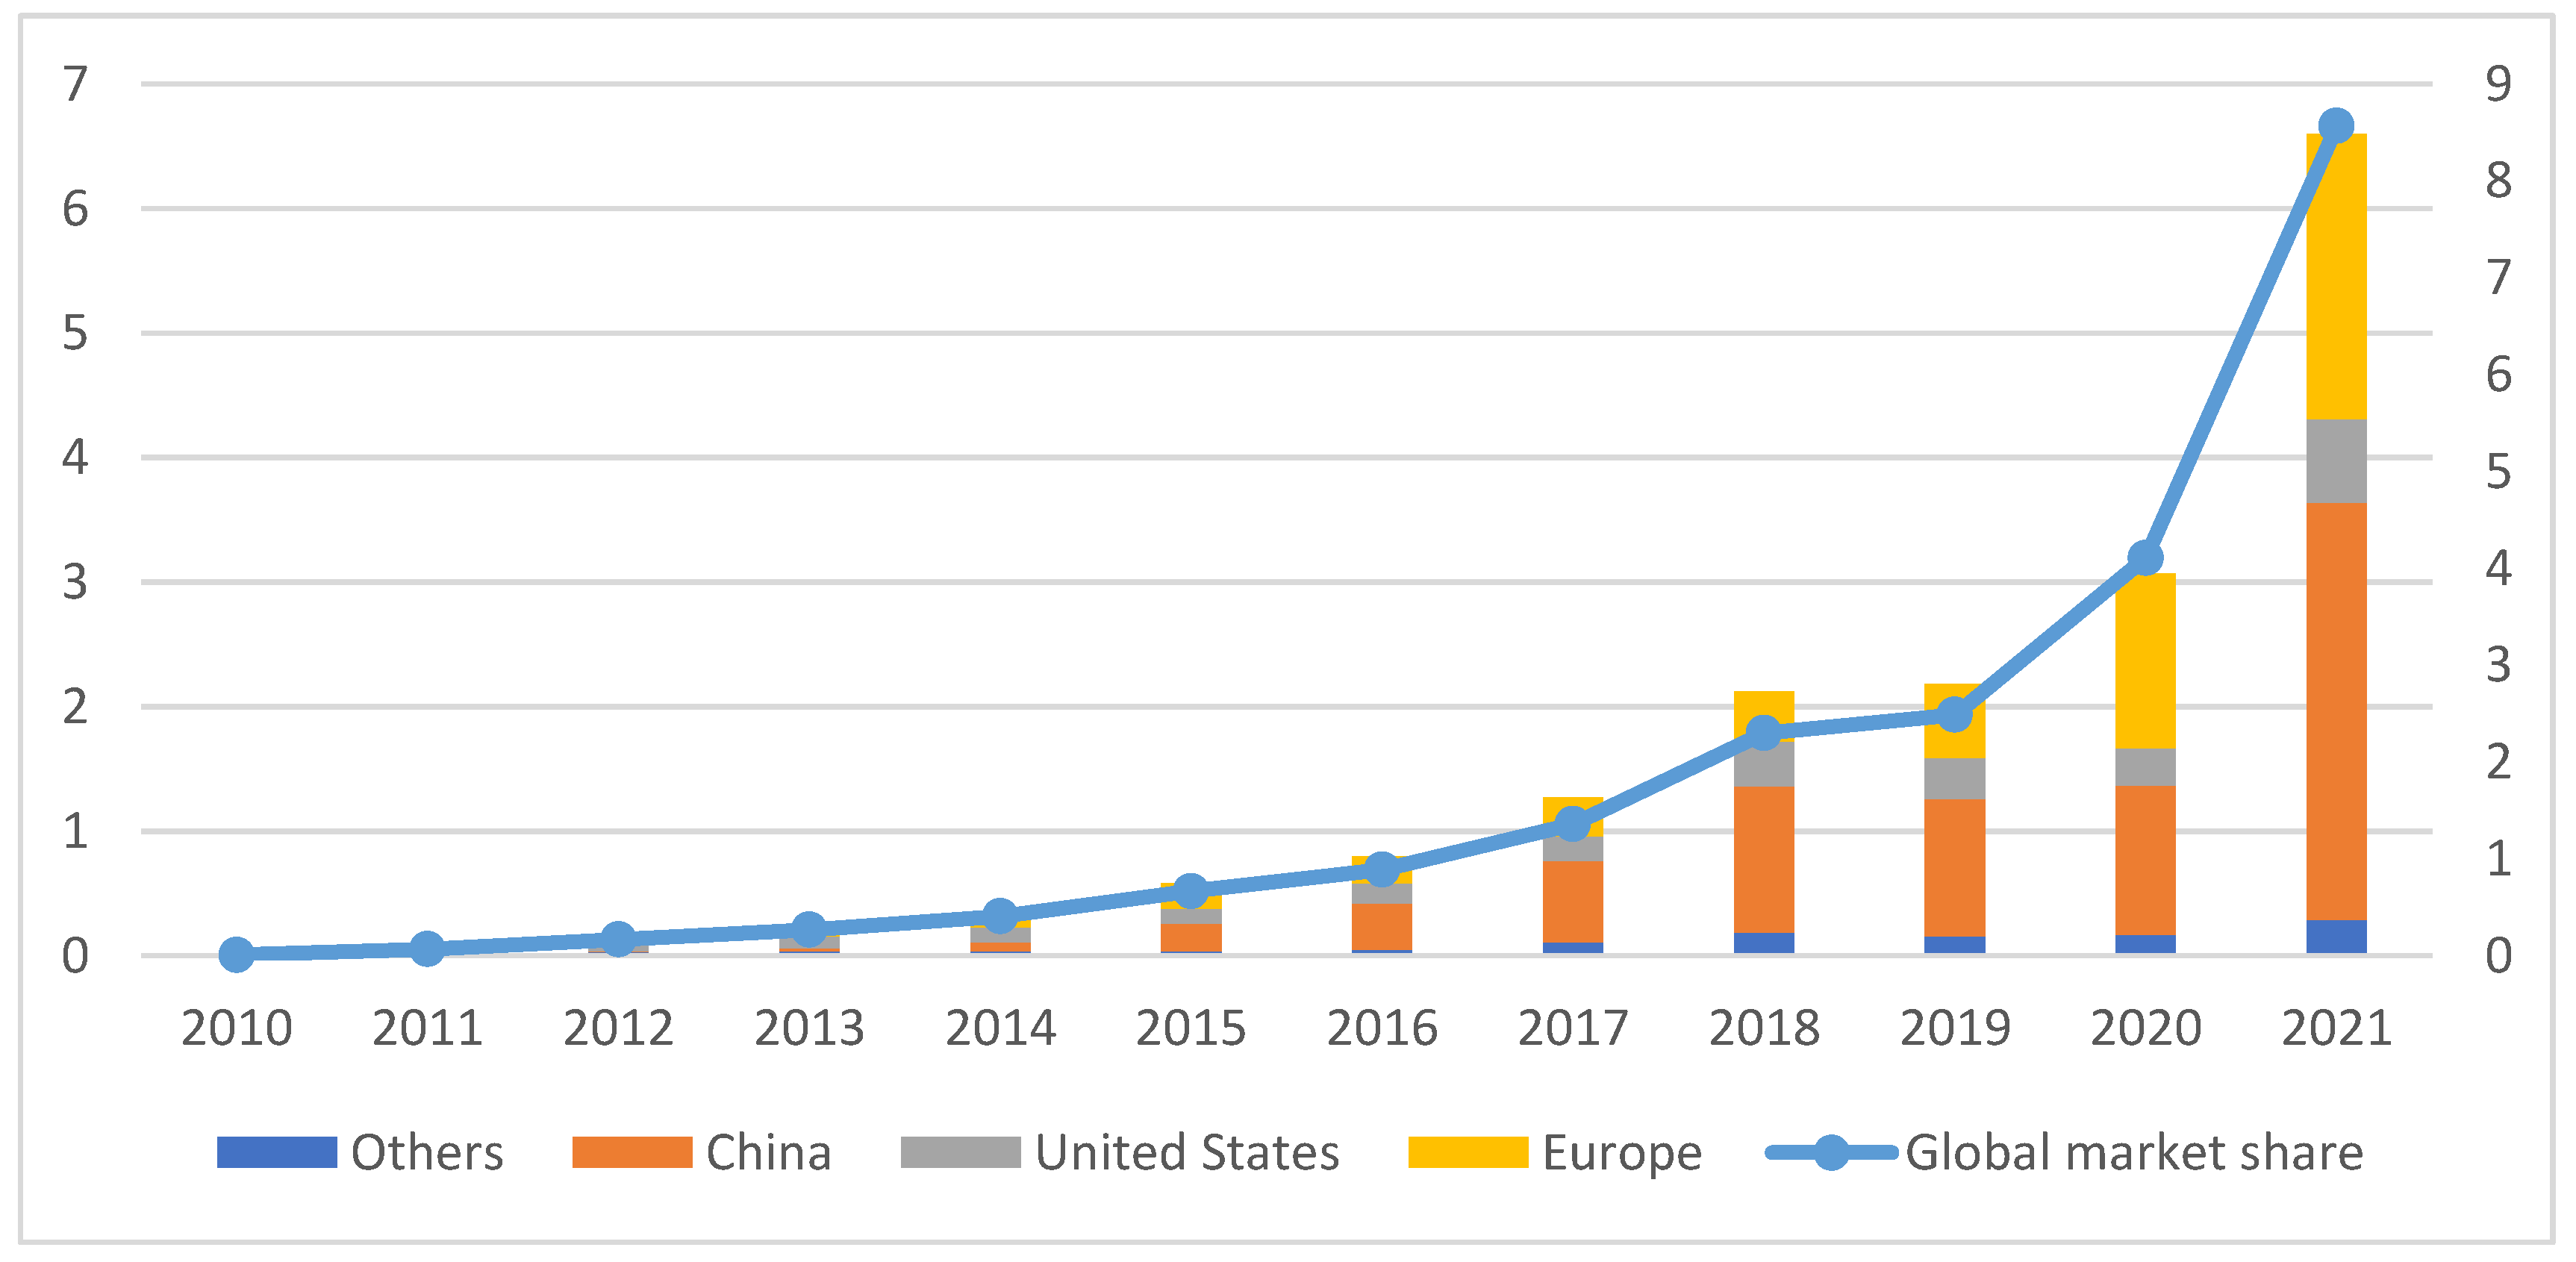
  35. IEA. Global Sales and Sales Market Share of Electric Cars. IEA: Paris, France, 2010–2021. Available online: https://www.iea.org/data-and-statistics/charts/global-sales-and-sales-market-share-of-electric-cars-2010-2021 (accessed on 16 May 2022).
  36. Araya. 2021. How Ready is Ethiopia for Electric Vehicles? Available online: www.press.et (accessed on 21 May 2022).
  37. Azerefegn, T.M.; Bhandari, R.; Ramayya, A.V. Techno-economic analysis of grid-integrated PV/wind systems for electricity reliability enhancement in Ethiopian industrial park. Sustain. Cities Soc. 2020, 53, 101915. (In English) [Google Scholar] [CrossRef]
  38. Gebremeskel, D.H.; Ahlgren, E.O.; Beyene, G.B. Long-term evolution of energy and electricity demand forecasting: The case of Ethiopia. Energy Strat. Rev. 2021, 36, 100671. (In English) [Google Scholar] [CrossRef]
  39. Nebey, A.H. Design of optimal hybrid power system to provide reliable supply to rural areas of Ethiopia using MATLAB and Homer. Renew. Wind Water Sol. 2021, 8, 4. [Google Scholar] [CrossRef]
  40. Usama, A.; Solarin, S.A.; Salahuddin, M. The prominence of renewable and non-renewable electricity generation on the environmental Kuznets curve: A case study of Ethiopia. Energy 2020, 211, 118665. (In English) [Google Scholar] [CrossRef]
  41. Samikannu, R.; Kumar, V.S.; Diarra, B.; Ravi, R. Cost Optimization and Development of Hybrid Energy Systems for Rural Areas in Ethiopia with a Balance of Their Energy Need and Resources Availability (A Case Study-On Tuludimtu). J. Test Eval. 2019, 47, 4141–4160. (In English) [Google Scholar] [CrossRef]
  42. Nyasha, S.; Gwenhure, Y.; Odhiambo, N.M. Energy consumption and economic growth in Ethiopia: A dynamic causal linkage. Energy Environ. 2018, 29, 1393–1412. (In English) [Google Scholar] [CrossRef]
  43. Guta, D.D. Determinants of household adoption of solar energy technology in rural Ethiopia. J. Clean Prod. 2018, 204, 193–204. (In English) [Google Scholar] [CrossRef]
  44. Kebede, M.H.; Beyene, G.B. Feasibility Study of PV-Wind-Fuel Cell Hybrid Power System for Electrification of a Rural Village in Ethiopia. J. Electr. Comput. Eng. 2018, 2018, 4015354. (In English) [Google Scholar] [CrossRef]
  45. Mondal, M.A.H.; Bryan, E.; Ringler, C.; Mekonnen, D.; Rosegrant, M. Ethiopian energy status and demand scenarios: Prospects to improve energy efficiency and mitigate GHG emissions. Energy 2018, 149, 161–172. (In English) [Google Scholar] [CrossRef]
  46. Group, W.B. Global Horizontal Irradiation. Available online: www.globalsolaratlas.info (accessed on 1 March 2022).
  47. Garcia-Martinez, E.; Munoz-Cruzado-Alba, J.; Sanz-Osorio, J.F.; Perie, J.M. Design and Experimental Validation of Power Electric Vehicle Emulator for Testing Electric Vehicle Supply Equipment (EVSE) with Vehicle-to-Grid (V2G) Capability. Appl. Sci. 2021, 11, 11496. (In English) [Google Scholar] [CrossRef]
  48. Himabindu, N.; Hampannavar, S.; Deepa, B.; Swapna, M. Analysis of microgrid integrated Photovoltaic (PV) Powered Electric Vehicle Charging Stations (EVCS) under different solar irradiation conditions in India: A way towards sustainable development and growth. Energy Rep. 2021, 7, 8534–8547. (In English) [Google Scholar] [CrossRef]
  49. Taghavifar, H.; Zomorodian, Z.S. Techno-economic viability of on grid micro-hybrid PV/wind/Gen system for an educational building in Iran. Renew. Sustain. Energy Rev. 2021, 143, 110877. (In English) [Google Scholar] [CrossRef]
  50. Das, B.K.; Alotaibi, M.A.; Das, P.; Islam, M.S.; Das, S.K.; Hossain, M.A. Feasibility and techno-economic analysis of stand-alone and grid-connected PV/Wind/Diesel/Batt hybrid energy system: A case study. Energy Strat. Rev. 2021, 37, 100673. (In English) [Google Scholar] [CrossRef]
  51. Abdin, Z.; Khalilpour, K.R. Single and polystorage technologies for renewable-based hybrid energy systems. In Polygeneration with Polystorage for Chemical and Energy Hubs; Elsevier: Amsterdam, The Netherlands, 2019; pp. 77–131. [Google Scholar]
  52. Singh, S.; Chauhan, P.; Singh, N.J. Feasibility of Grid-connected Solar-wind Hybrid System with Electric Vehicle Charging Station. J. Mod. Power Syst. Clean Energy 2021, 9, 295–306. (In English) [Google Scholar] [CrossRef]
  53. Li, C.; Zheng, Y.; Li, Z.Y.; Zhang, L.; Zhang, L.; Shan, Y.C.; Tang, Q.H. Techno-economic and environmental evaluation of grid-connected and off-grid hybrid intermittent power generation systems: A case study of a mild humid subtropical climate zone in China. Energy 2021, 230, 120728. (In English) [Google Scholar] [CrossRef]
Figure 1. Study locations and global horizontal irradiation in Ethiopia [46].
Energies 15 04364 g001
Figure 2. Monthly average solar irradiation for three cities in Ethiopia. AGHI, JGHI, BGHI and ACi, JCi, BCi are the Daily Radiation and Clearness Index of Addis Ababa, Jijiga and Bahir Dar, respectively.
Energies 15 04364 g002
Figure 3. Monthly average wind velocity of cities.
Energies 15 04364 g003
Figure 4. Electric vehicle sales and market share worldwide, 2010–2021.
Energies 15 04364 g004
Figure 5. EV daily demand.
Energies 15 04364 g005
Figure 6. The schematic layout of the proposed hybrid system for application in the three cities.
Energies 15 04364 g006
Figure 7. Total Net Present Costs (NPC) of the components of the PV/DG/ZnBr system.
Energies 15 04364 g007
Figure 8. Cost summary of the PV/DG/ZnBr system.
Energies 15 04364 g008
Figure 9. Feasible configurations in three cities, (a) Addis Ababa, (b) Jijga and (c) Bahir Dar.
Energies 15 04364 g009aEnergies 15 04364 g009b
Figure 10. Monthly Average Electric Production.
Energies 15 04364 g010
Figure 11. Diesel Consumption (L/hour).
Energies 15 04364 g011
Figure 12. The best systems are those that match the energy demand, PV power output and charge/discharge of the battery bank.
Energies 15 04364 g012aEnergies 15 04364 g012b
Table 1. Geographical, climatic, and load details of the selected areas.
CityFrom Addis AbabaAverage Solar Irradiation
(kWh/m2/day)
Average Clearness IndexAverage Wind Speed
(m/s)
Annual Load Demand
(kWh)
Peak Load
(kW)
Addis AbabaCenter5.810.63.73216172
JijigaEast6.120.6224.813216172
Bahir DarNorth-West6.00.623.783216172
Table 2. Specification data of Batteries.
ParameterSpecification
Battery NameEnerStore 50 Agile FlowTesla Powerpack2Hoppecke 24 OPzS 3000
Battery TypeZNBR FlowLIVented LA
Nominal voltage (V)1002202V
Maximum capacity (Ah)500603570
Nominal capacity (kWh)5013.27.15
Maximum charge current (A)15031.8610
Maximum discharge current (A)30031.8610
Capital cost ($)7606480700
Replacement cost ($)7005980645
O&M cost ($/year)00160
Lifetime (years)301020
Sizes0–5000, 500 intervals0–5000, 500 intervals0–800, 50 intervals
Table 3. Specification data of wind turbine.
ParameterSpecification
ModelNorthern Power NPS100C-21 WT
Rotor diameter (m)20.7
Hub height (m)37
Number of blades3
Power regulationVariable speed, stall control
Lifetime (years)20
Cut-in wind speed (m/s)3
Cut-off wind speed (m/s)25
Rated wind speed (m/s)15
Extreme wind speed (m/s)59.5
Capital cost ($)275,000
Replacement cost ($)225,000
O&M cost ($/year)100
Table 4. Optimal values of the PV/DG/ZnBr system.
PV (kW)DG (kW)ZnBr (Strings)Converter (kW)COE ($)NPC ($)O&M ($/Year)Initial Capital ($)
Addis Ababa 8291901621730.1962.9746,2492.37 M
Jijiga8151901701780.182.72 M29,4132.34 M
Bahir Dar8031901661740.1882.85 M41,8912.31 M
Table 5. Comparison of first rank of feasible system with base case (DG).
MetricValue
Addi AbabaJijigaBahirdar
Present worth ($)$3,032,025.00$3,276,232.00$3,152,061.00
Annual worth ($/year)$234,540.00$253,431.00$243,826.00
Return on investment (%)13.9014.9014.60
Internal rate of return (%)17.5018.5018.30
Simple payback (year)5.625.365.42
Discounted payback (year)6.916.536.62
Publisher’s Note: MDPI stays neutral with regard to jurisdictional claims in published maps and institutional affiliations.

