
A Technical Assessment of Offshore Wind Energy in Mexico: A Case Study in Tehuantepec Gulf


1
Coordinación de Hidráulica, Instituto de Ingeniería, Universidad Nacional Autónoma de México, Mexico City 04510, Mexico
2
Departamento de Engenharia Naval, Escola Superior de Tecnologia, Universidade do Estado do Amazonas, Manaus 69050-020, Brazil
*
Author to whom correspondence should be addressed.
Energies 2022, 15(12), 4367; https://0-doi-org.brum.beds.ac.uk/10.3390/en15124367
Submission received: 12 May 2022
/
Revised: 30 May 2022
/
Accepted: 9 June 2022
/
Published: 15 June 2022
(This article belongs to the Special Issue Wind and Wave Energy Potential)
Abstract
:The growing energy demand has increased the consumption of hydrocarbons in developing countries such as Mexico, which has contributed to accelerating global warming. Although Mexico has suitable offshore wind energy harvesting sites, technical assessments to identify technologies to be placed in specific locations are scarce. In Mexico, offshore wind resources are found in depths larger than 50 m. There, floating platforms are convenient for harnessing wind energy. This work presents a technical evaluation of offshore wind energy in one of the regions with a higher availability of wind resources on the Mexican coasts, the Tehuantepec Gulf, in the Pacific Ocean. First, a specific location is chosen to evaluate its maritime conditions and theoretical wind energy potential. Next, the performance of a floating offshore wind turbine platform has been investigated numerically using potential flow simulations. The motions of the platform were analyzed for different drafts when subjected to different environmental conditions in the evaluated region. These conditions include wave and wind scenarios with the highest probability of occurrence and the most extreme ones. From the evaluation of the platform dynamics in these scenarios, it was possible to identify the general working conditions of the platform. Results showed that the proposed FOWT could be suitable to be deployed in the region of interest for the most probable environmental conditions, presenting a possible energy production within 3–4 MW, approximately. However, motion stabilization should be required when subjected to extreme environmental conditions as the structure could significantly increase its surge and pitch motions. The simplified approach employed in this work can help perform the following steps in technical or practical resource assessments of wind energy in other places in Mexico or similar developing regions.
1. Introduction
The need for energy provision with the minimum emissions of gases that accelerate global warming has provoked several developed and developing countries with access to the sea to be interested in the use of offshore wind energy. This impulse has turned into rapid technological developments and a diminution in the installation costs in recent years [1,2].
The present work deals with offshore wind energy in developing countries, in which technical evaluations of the resource are scarce, and considering the case of Mexico as representative of such regions. Mexico has a coastline of 11,122 km distributed between two oceans: the Atlantic Ocean on the east coast and the Pacific Ocean on the west coast [3]. This geographical position provides the country with large extensions of the territorial sea to harness wind energy. According to [4], there are four zones with wind potential in Mexico. Two of them are in the Gulf of Mexico, particularly in the coast of Tamaulipas and in the Yucatan peninsula. The other places are the Baja California Peninsula and the Tehuantepec Gulf. The latter has one of the highest wind energy potentials worldwide [5,6].
The installation of wind turbines in the ocean shows significant advantages over those on land, mainly because wind resources available offshore can be higher and more persistent since the wind moves on the sea surface without obstacles [7]. Nevertheless, most wind turbines installed at sea are fixed structures positioned in water with depths lower than 50 m. Installing fixed platforms at greater depths is not economically viable; therefore, a convenient technology to harness the wind resource in waters greater than 50 m deep is the floating platforms [8], also known as floating offshore wind turbines. As the areas with the highest wind energy potential in the Gulf of Tehuantepec can be found in deeper locations, it is essential to perform preliminary technical assessments to verify the suitability of this type of technology. In this work, a technical study has been conducted to build up knowledge about offshore wind energy harvesting possibilities in Mexico.
The installation of offshore wind turbines has increased by around 30% in the last decade. In 2018, it was documented a production capacity of ~23 GW of offshore wind energy, from which more than 80% was installed in European countries. Worldwide, there are different areas with wind potential. Hersbach et al. [9] highlighted thirteen zones with significant wind speed potential, considering the territorial extension to produce wind energy in the exclusive economic zone of different countries. Figure 1 illustrates the distribution of the offshore wind speed in the world within the first to 200 km from the coast [10].
Assessments to evaluate the wind potential offshore have been carried out in several countries, such as on the coast of California in the United States of America [11]. Additionally, in South Korea, another assessment was carried out in a zone located southwest of the Korean peninsula [12]. In Turkey, an analysis regarding its wind speed offshore was conducted to compute the available wind potential [13]. In the same way, a study was carried out in China to evaluate the wind potential in its exclusive economic zone [14]. A similar study was carried out to assess the offshore wind potential along the whole coast of Africa [15]. For updated offshore wind data the reader is referred to [16] (Figure 1).
Floating platforms with wind turbines are excellent options to take full advantage of offshore wind potential since they can be installed at greater distances and depths from the coast, where air masses could be more persistent since the wind would tend to flow over smoother areas in relation to the ones found near the coasts. Furthermore, less social opposition could be achieved because these technologies may be installed far from coastal cities [17,18,19]. Nowadays, there are different concepts of floating platforms to support wind turbines for offshore applications. These can be classified mainly into spar platforms, tension-leg platforms (TLP), and semisubmersible platforms. They are made up of four components: the floating platform, cables or mooring chains, electrical cables, and anchors [20].
Several institutions from different countries have worked on designing and analyzing distinct types of floating platform models to obtain information on their dynamics under wave and wind conditions. Some concepts have reached full-scale construction. In the following paragraphs, some of the projects that have been carried out in the last years are described. Table 1 shows a summary of recent experiments with platforms that have been implemented and information regarding the construction of a prototype, if available.
In 2005, the concept of a spar-type Hywind platform was used to carry out experiments in the Marintek laboratory in Norway with a 1:47 scale model. The Hywind platform, designed for water depths between 200 and 700 m, consists of a metallic structure mounted on a concrete section to install a 5 MW wind turbine. The positioning of the platform in the place of work was performed by three mooring lines anchored to the seafloor. The experimental research aimed to compare the information obtained between the model and the data generated in the numerical simulation for wind turbines with the Simo/Riflex program to validate the results [32]. The full-scale Hywind platform was installed in 2009 near Karmoy, in the north of Stranvanger, 10 km from the Norwegian coast, at a depth of 200 m. The prototype has a 2 MW wind turbine that powers the Norway electricity grid [33].
Later, in 2009, the National Maritime Research Institute (NMRI) of Japan carried out a series of tests with a 1:22.5 scale model of a floating spar type platform. In the upper part of the platform, a linear force resembling the action of the wind was applied [24]. Additionally, the Japanese Ministry of the Environment started the project of floating platforms on the coast in 2010. Firstly, a model with the middle of the full scale was installed. Next, it was removed, and a full-scale spar-type platform was established in the same place. The installation place is located 1 km from the coast of the city of Goto on the Kabashima Island, Nagasaki, Japan. The depth of the site is 97.2 m [34].
In 2010, at the University of California, Berkeley, several experiments were executed with the concept of a semisubmersible floating platform, named Windfloat, at a scale of 1:105. The floating platform of the Windfloat project is made up of three cylindrical columns that act as floats and provide stability to the structure. In the lower part of each float, a horizontal disk was installed to increase the weight and reduce heave, pitch, and roll motions. In addition, a ballast system was installed to maintain the required draft under the weather conditions of the place. The model of the Windfloat platform had a foam beam disk installed on the top of the tower to generate the aerodynamic moment on the structure. Similarly, a rotor with an electric motor was installed to generate the gyroscopic effect on the floating platform.
Additionally, a temporal numerical analysis was performed by coupling the software TIMEFLOAT and FAST (Fatigue, Aerodynamics, Structure, and Turbulence) software to evaluate in detail the platform motions [23]. The prototype of the Windfloat project was built and installed in 2011, 6 km from Agucada, Portugal. The installation site has a depth of 49 m [35]. The operation of the Windfloat platform has generated fundamental information to analyze its dynamics and improve the design and construction of semisubmersible platforms [36].
On the other hand, a V-type semisubmersible platform model with a 1:64 scale wind turbine was tested in a wave basin [25]. The V-shaped structure has a rectangular hull design without arching surfaces. In the central connection, as in the edges of the platform, there are three columns. The column located in the central part was designed to mount a wind turbine of 7 MW. According to depth and weather conditions, the required draft of the platform was controlled by a system of ballast tanks. The semisubmersible platform has a length of 84.85 m, a breadth of 149.9 m, a freeboard of 15 m, and a draft of 17 m [25]. A prototype of a V-type platform with a 7 MW turbine was installed in 2015 in the Japanese sea [37].
Next, scientists from the Maritime Research Institute Netherlands (MARIN) carried out tests with the three types of floating platforms. In the experimental campaign, where the dynamics of three platforms were compared, the semisubmersible, tension leg, and spar types were used on a 1:50 scale. The semisubmersible platform used was the OC4 DeepCwind designed by the National Renewable Energy Laboratory (NREL) from the United States of America, related to the OC3 project. The column was projected to install a 5 MW wind turbine. Moreover, three external columns provided buoyancy to the structure and were integrated into the column through nine pontoons [38]. Additionally, a 5 MW wind turbine model was used from the NREL [39]. The floating platforms were tested under different maritime conditions, including regular and irregular waves and wind [40]. The main objective of the experiments was to obtain information about the degrees of freedom (DOF) of the three platforms to improve the numerical analysis. In addition, the study served to know the advantages and disadvantages of the floating platforms [27].
Finally, in the Akishima laboratory in Tokyo, Japan, the semisubmersible floating platform “Fukushima Mirai” was tested with a 1:60 scale to know its dynamics under different wave conditions. This platform was integrated by three external columns connected by three supports to the main column located in the center of the structure. The central column was designed to install a 2 MW wind turbine. The platform was placed in position by six catenary mooring lines connected to the bottom of the testing facility. After the experimental tests, numerical analysis was carried out with BLADED software. A prototype of the semisubmersible platform “Fukushima Mirai” was installed in 2013 at a distance of 20 km from the coast of Fukushima, Japan [29].
Research regarding offshore wind energy harvesting technologies has proposed different concepts in the last decade. The knowledge of FOWT concepts in which models and prototypes have been evaluated could contribute to the performance of technical assessments in other regions, including those in developing countries in which technical reviews are in the early stages of planning. In the case of Mexico, the generation of energy using the wind is a viable alternative to face the climatic change since there are extensive oceanic areas with wind resources. The Gulf of Tehuantepec is the area with the greatest wind potential on the coast of Mexico; however, offshore wind energy assessments considering the implementation of wind energy harvesting devices are scarce. To the authors’ knowledge, the feasibility of a floating platform for wind turbines has not been analyzed under wave and wind conditions of the region. Considering the Gulf of Tehuantepec as a study case, the objective of this work is to perform a preliminary technical assessment of offshore wind energy in Mexico, considering the dynamics of well-known FOWT technology. The maritime conditions and the wind energy potential of a prospective place in this region have been investigated. Then, the technical assessment is performed to analyze the feasibility of installing the FOWT under maritime conditions (most probable and extreme) of the selected area. For this, numerical simulations were performed through potential flow simulations, verifying the effect of the draft on the platform motions.
This work is organized as follows: Section 2 describes the materials and methods, including the sources available to obtain wave and wind data, the equations employed to evaluate theoretical wind power, the properties of the floating platform selected for this study, and the characteristics of the software used to assess its dynamics. The results and discussion of the statistical analysis of wave and wind and the dynamics of the platform are shown in Section 3. Finally, the conclusions and recommendations for future work are summarized in Section 4.
2. Materials and Methods
2.1. The Study Zone in Mexico: Tehuantepec Gulf
According to the GWA [16], there are four main offshore zones in Mexico with available and persistent wind resources. This work selected the zone with the highest wind potential offshore to perform the technical wind energy assessment. The area of interest is in the Tehuantepec Gulf, located south of the port of Salina Cruz, Oaxaca, as shown in zone 3 from Figure 2.
The Mexican state of Oaxaca (Figure 3) is located between longitude 93° 52’–98° 35’ west and latitude 15° 39’–18° 40’ north. It borders north with the states of Puebla and Veracruz, east with Chiapas, west with Guerrero, and south with the Pacific Ocean. The length of the Oaxacan coast is 568 km [41]. The Gulf of Tehuantepec, located south of the port of Salina Cruz, Oaxaca, is situated within the meridians 92°–97° west, and its southern limit is the parallel 12° north. It counts with an area of ~125 000 km2 [42]. The Gulf of Tehuantepec area has an excellent wind potential since it has strong winds for most of the year.
In Figure 3, it is possible to identify the Isthmus of Tehuantepec, which is a region that links the Gulf of Mexico (in the Atlantic Ocean) and the Gulf of Tehuantepec (in the Pacific Ocean). From October to April, the cold air masses that descend from the north and the Gulf of Mexico cross the Isthmus and enter the Pacific Ocean, encountering a lower atmospheric pressure. Therefore, high speed wind flows, usually known in this region as “Tehuanos”, are produced, which may affect a region of ~200–500 km from the seashore to the open sea, with an average speed of ~10 m/s with gusts greater than ~20 m/s [43].
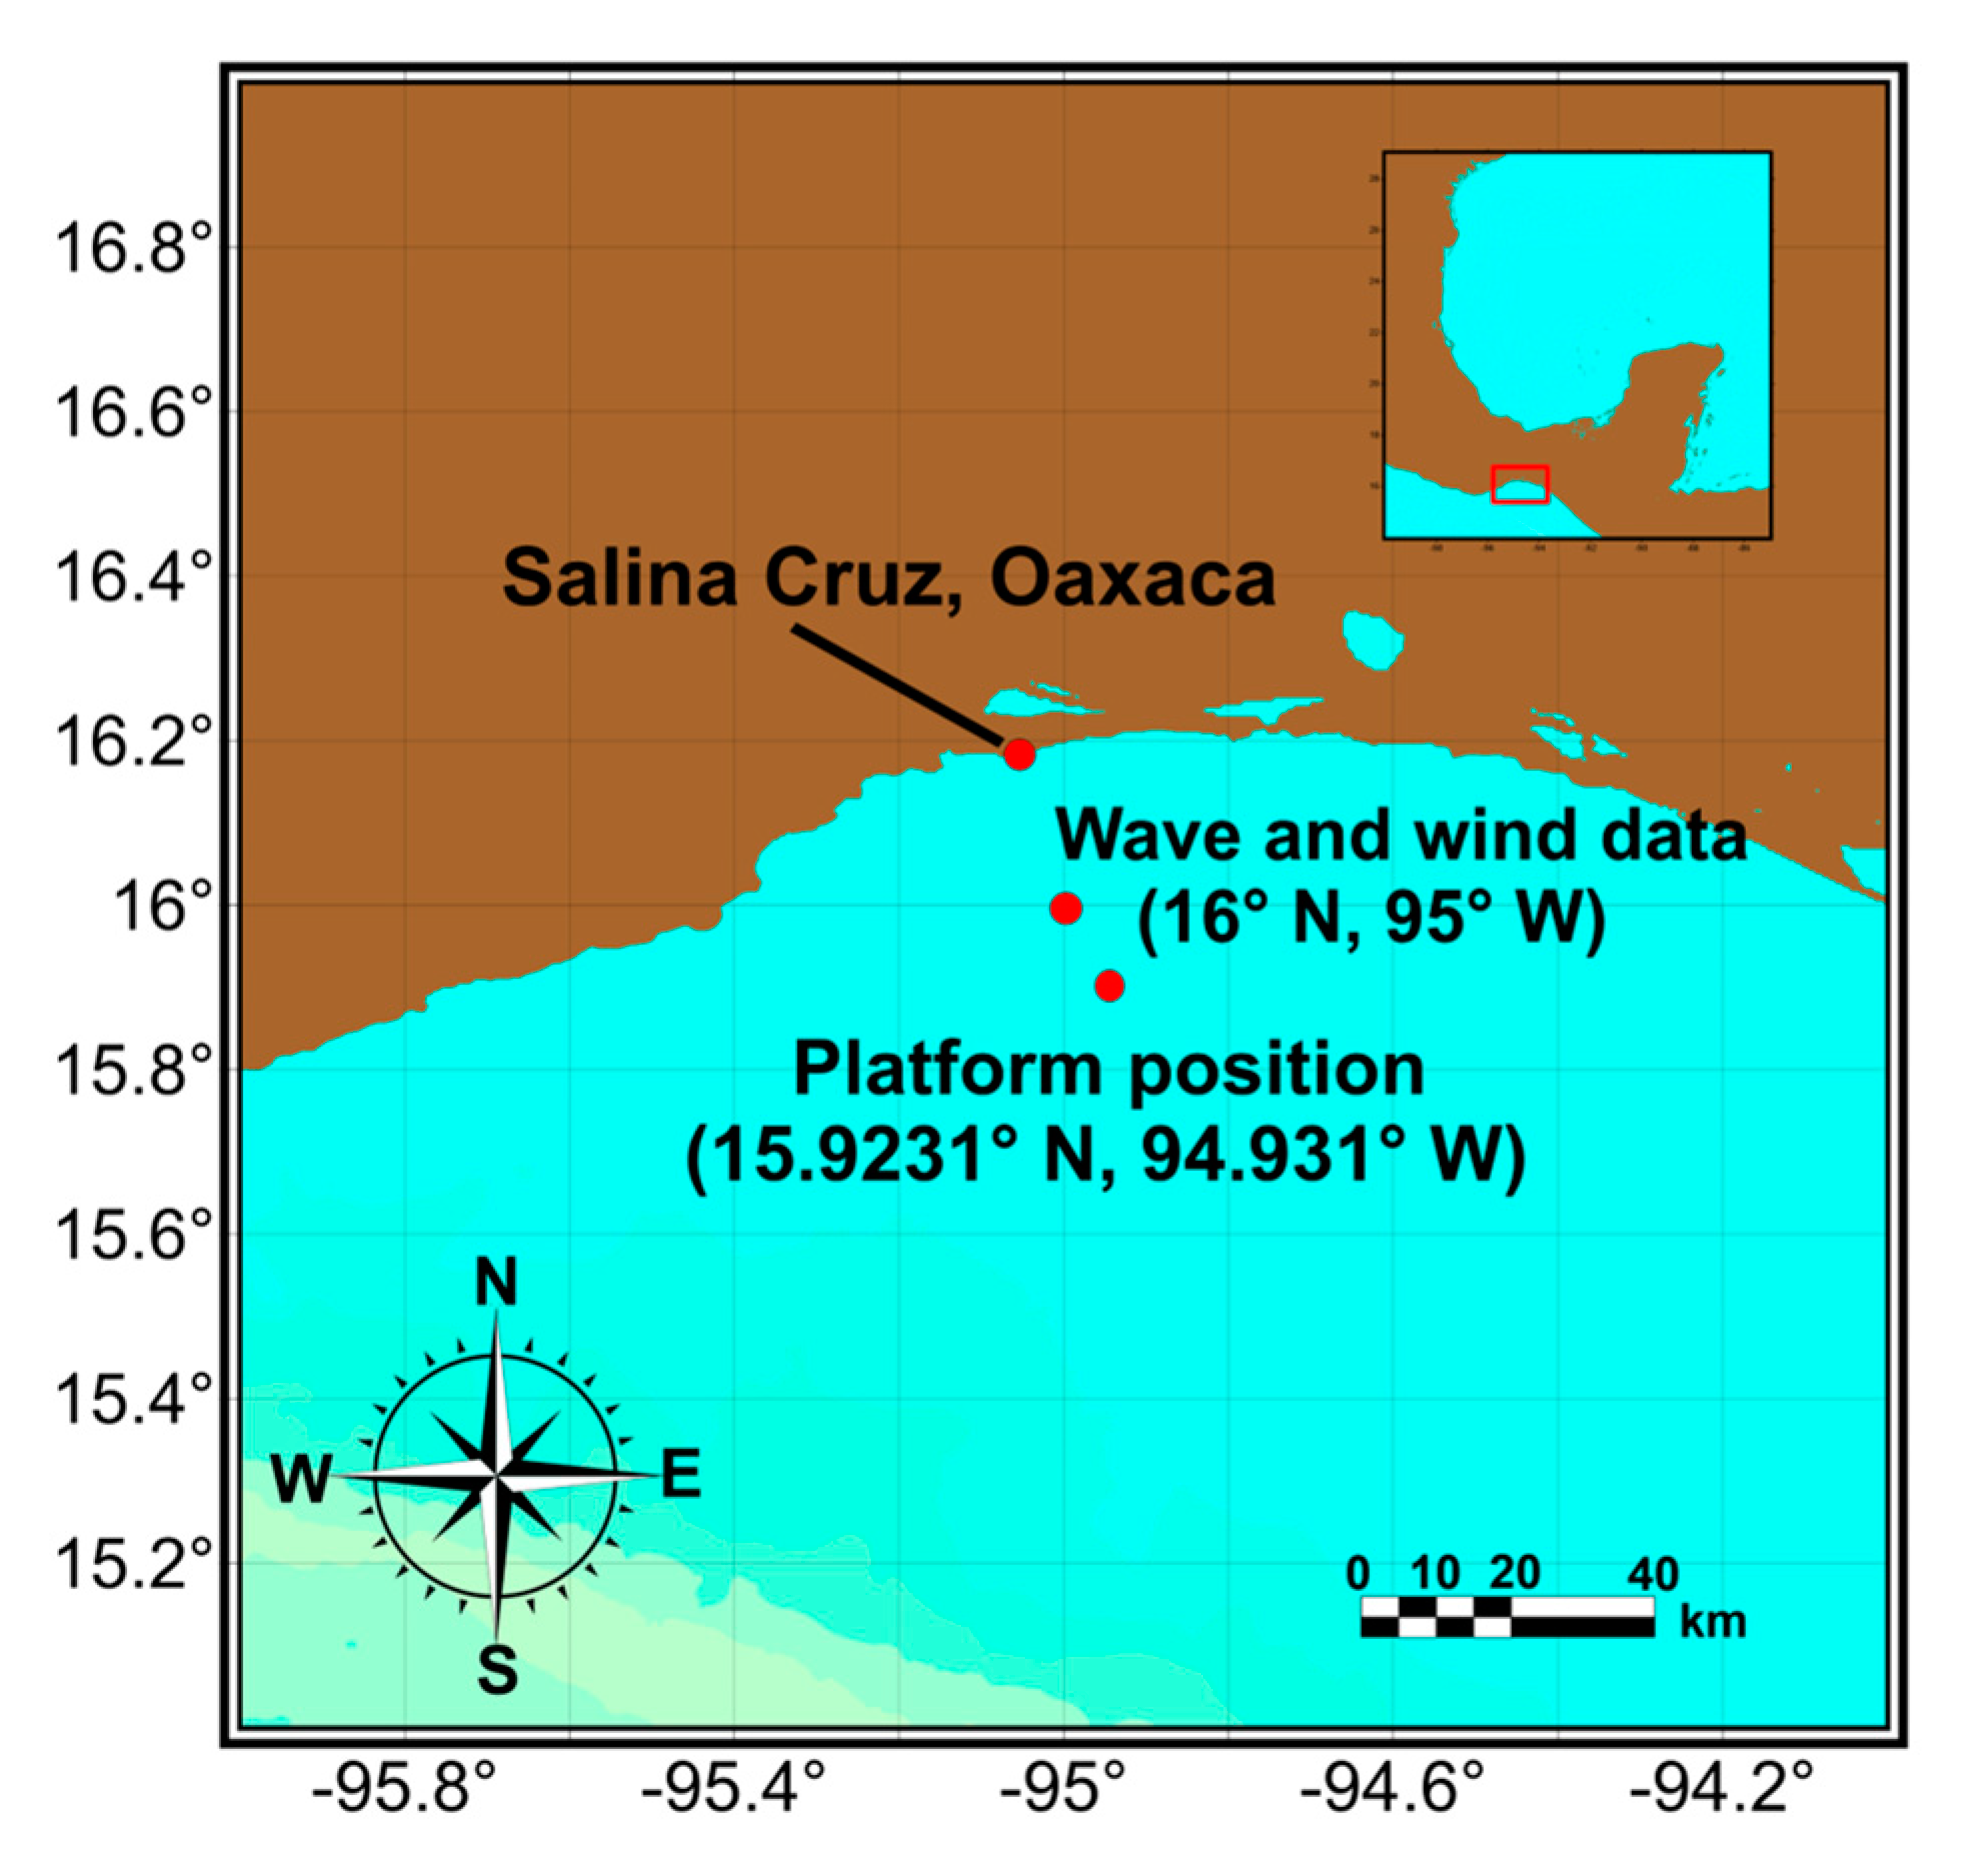
The present study considers some locations in the Gulf of Tehuantepec, as shown in Figure 4. The wave and wind conditions were evaluated at the point with the coordinates 16.0° N, 95.0° W (Figure 3 and Figure 4). This point is 11 km from the position where the installation of the prototype is proposed (location 15.9° N, 94.9° W and a depth of 200 m). The wave and wind conditions were assumed valid at the deployment point.
The maritime conditions of the study area were obtained through a statistical analysis of the wave and wind data obtained from the ERA5 data source between the years 2001 to 2020. With this data, wave and wind roses were drawn and presented in the results section. Furthermore, joint probability graphs of wave height and period, and wave direction and height, were also drawn. Additionally, the extreme maritime conditions corresponding to the most energetic phenomenon during the 20 years of the statistical analysis were acquired. According to NOAA’s (National Oceanic & Atmospheric Administration) historical record, Hurricane Barbara, category one on the Saffir–Simpson scale, presented the highest values of waves and winds (NOAA, 2021).
2.2. Wind Power Energy Assessment
A statistical analysis to represent the maritime characteristics of the Gulf of Tehuantepec was carried out with information from the public data source ERA5, which provides hourly estimates of the different ocean and land atmospheric climate variables from 1979 to five days before its consultation. The European Centre processes this information for Medium-Range Weather Forecasts, ECMWF [9]. In addition, to know the most energetic phenomenon in the Gulf of Tehuantepec during the statistical analysis period, the NOAA website of the historical record of hurricanes was consulted, where meteorological data of depressions, storms, and hurricanes can be obtained [44].
The mean offshore wind speed from the coast of Mexico was consulted on the public website Global Wind Atlas (GWA, [10]). This website allows consulting virtually and interactively in the inshore and offshore areas with wind potential. The offshore coverage is up to 200 km from the coastline. Moreover, the average wind speed at five heights above sea level, 10, 50, 100, 150, and 200 m, is available. In the GWA, the calculations of the wind model employed data from the re-analysis of ERA5 from the period 2008 to 2017 [10].
2.2.1. Wind Power Estimation Theoretical Approach
In this study, theoretical wind power, P, was calculated as:
where is the density of the air, is the area of the turbine, and corresponds to the wind speed perpendicular to the turbine plane [45].
The wind speed varies according to the height; therefore, it is important to know the vertical profile of the wind speed. To understand this on a homogeneous surface, Equation (2) was used, which expresses the exponential Hellmann’s law [46]:
where is the wind speed at a height, ; is the reference wind speed at a reference height, ; and is the exponent of Hellman’s exponential law.
2.2.2. Methods Employed to Process and Visualize Data
The maritime conditions in the region of interest were characterized using wave and wind roses. Moreover, joint probability graphs that interpret the correlation between variables were used (see Results section). The data was processed and analyzed using MATLAB software [47].
The bathymetry of the Gulf of Tehuantepec was consulted on the GEBCO website, which includes general ocean bathymetric charts [48]. This site provides information about the ocean’s depth. The bathymetric data downloaded from GEBCO were used to project the map of the study area using the SURFER data visualization program [49]. The geographic visualization maps were prepared using the open-source software QGIS [50].
2.3. The Floating Offshore Wind Turbine (FOWT)
2.3.1. Geometry and Dimensions
In this study, the semisubmersible platform of the OC4 DeepCwind project from the NREL was selected [38]. The prototype geometry was designed in the Solidworks CAD software, as shown in Figure 5a,b. It consists of the main structure that supports the tower and wind turbine. The main column is attached to three external columns that act as floats through nine cylindrical supports. Dimensions of the platform are shown in Figure 5c,d. The mass of the metallic structure is 3.8522 × 10⁶ kg (density of 7859 kg/m3), while the ballast mass is 9.6208 × 10⁶ kg. The structure with ballast has a total mass of 1.3473 × 10⁷ kg. The floating platform mass center, excluding the tower and the turbine, is located at 13.46 m below the floating line, on the central line. A disk is installed at the base of each outer column to reduce the surge, heave, pitch, and roll motions. The draft and freeboard measured in the central column are 20 m and 10 m, respectively. More details regarding the model can be found in [38].
The tower installed on the OC4 DeepCwind platform, designed to support a 5 MW wind turbine, has an upper diameter of 3.87 m and a lower diameter of 6.5 m, coinciding with the central column. The tower’s distance from the flotation line to the upper limit is 87.6 m. The total mass of the tower is equal to 2.4971 × 10⁵ kg, and the center of mass, considering the length of 77.6 m of the tower, is situated at 43.4 m above sea level [38].
The wind turbine comprises three blades with a length of 61.5 m and a mass of 1.7740 × 10⁴ kg. The hub height is 90 m, and the rotor with a diameter of 126 m has a mass of 1.1 × 10⁵ kg. The horizontal distance from the center of the rotor to the yaw axis is 5.019 m, while between the shaft and the tower top is 1.963 m. The nacelle has a mass of 2.4 × 10⁵ kg, and its gravity center is located 1.9 m along the yaw axis in the direction of the wind and 1.75 m from the yaw bearing [39].
2.3.2. Anchoring Lines
Following NREL specifications [38], a catenary mooring line system was employed to position the OC4 DeepCwind platform, as shown in Figure 6. The main system properties are shown in Table 2. The anchoring is composed of three catenary lines with a length of L = 835.5 m and angular separation of 120°. In each lower external column and under the flotation line, there is a hawsehole with a radial distance, Dh = 40.87 m, from the central line of the platform. The anchors are located at a depth of 200 m with a radial distance of Dr = 837.6 m from the central line.
2.4. Methods to Evaluate FOWT Dynamics
In this study, a numerical analysis of the OC4 DeepCwind semisubmersible platform, presented in the previous subsection, was performed to evaluate its dynamics when submitted to environmental conditions representative of the place of interest in the Gulf Tehuantepec.
The numerical analysis was carried out with the ANSYS AQWA software, which allows analyzing the behavior of maritime structures in the time and frequency (period hereafter) domain using the potential flow theory [51], i.e., disregarding viscous flow effects.
ANSYS AQWA comprises two modules: the Hydrodynamic Diffraction and Hydrodynamic Response modules. The former enables analysis in the period domain, providing an integrated environment for the study of primary parameters necessary for motion and Hydrodynamic Response analysis. The latter permits the analysis of the movements of the floating structure in the time domain, where additional effects can be considered, including the mooring line system configuration and constant wind loads over the maritime structure [52].
The numerical simulation setup for the OC4 DeepCwind semisubmersible platform is illustrated in Figure 7. Notice that waves travel from right to left at an angle θ 1, over a constant depth, h. Likewise, at a distance z above sea level, there is the wind speed, U(z), which comes to the left with an angle θ 2. The waves interact with the semisubmersible platform, which has a tower with height, r, where a turbine with a diameter D is installed. In addition, it has a distance, a, from the keel to the upper deck of the external floats that are ballasted with water to achieve a required draft, d, and a position of the center of gravity, CG. Three catenary mooring lines are used to position the platform and limit its motions, which are anchored to the seabed at a depth h.
The numerical analysis was performed for different ballast conditions. Therefore, the effect of varying the draft (d = 16, 20 and 24 m) in the surge, heave, and pitch motions of the OC4 DeepCwind semisubmersible platform were analyzed. The platform conditions were classified according to the draft to the external column height ratio (d/a). This yielded three dimensionless parameters, d/a = 0.5, 0.625, and 0.75, representing platforms with drafts equal to 16, 20, and 24 m, respectively. The period analysis range is from 5 to 25 s, which is considered normal as a wave period range and where the natural period of the heave motion of the OC4 DeepCwind platform is present [53].
2.4.1. Numerical Test Cases
In the dynamic analysis of the OC4 DeepCwind semisubmersible platform, surge, heave, and pitch motions were analyzed, considering two different excitation conditions generated with regular wave parameters. Table 3 summarizes the wave and wind parameters used in the two excitation scenarios. For case A, the incident waves employed in the numerical simulations consider the wave parameters with the highest probability of occurrence in the selected region. On the other hand, case D is the most extreme natural phenomenon in the 20-year statistical analysis. Information regarding conditions A and D can be found in Section 3.2, specifically in Table 4 and Table 5. A brief description of the methods employed to obtain and use the wind speed values, U(90), is presented in Appendix A.
2.4.2. General Considerations
In this work, a potential flow solver was employed to analyze the dynamics of the FOWT. Thus, some considerations were made for the numerical analysis. First, the incident wave and wind come from the same direction with an angle equal to zero. The wind speed effect on the structure is represented as a resultant force applied at the center of the rotor. The rotation of the turbine is neglected, so the position of the turbine is maintained. In addition to this, the aerodynamic effect on the tower and the part of the platform above sea level are disregarded. Another important aspect is the free surface effect of ballast water, which occurs when a partially full ballast tank and the floating structure incline. This may cause significant changes in the center of gravity of the ballast and a possible loss of stability [54]. Given this, in this study, a non-deformable static ballast was considered. Additionally, the ends of the mooring lines are fixed points on the prototype and the seabed, while the rest of the mooring line is slack.
Appendix B and Appendix C include complementary analyses of the numerical research. In the former, the mesh convergence study is shown. In the latter, the methods and results of the validation of the numerical approach considered in this work are presented.
3. Results and Discussion
3.1. Wave Statistical Analysis in the Selected Location
As mentioned in Section 2.1, one of the regions with the most significant offshore wind potential in Mexico could be found offshore the coast of Oaxaca state, specifically in the area corresponding to the Gulf of Tehuantepec [4]. The results of the wave statistical analysis with data from ERA5 at the place selected for this work (see location in Figure 3) are shown in this section.
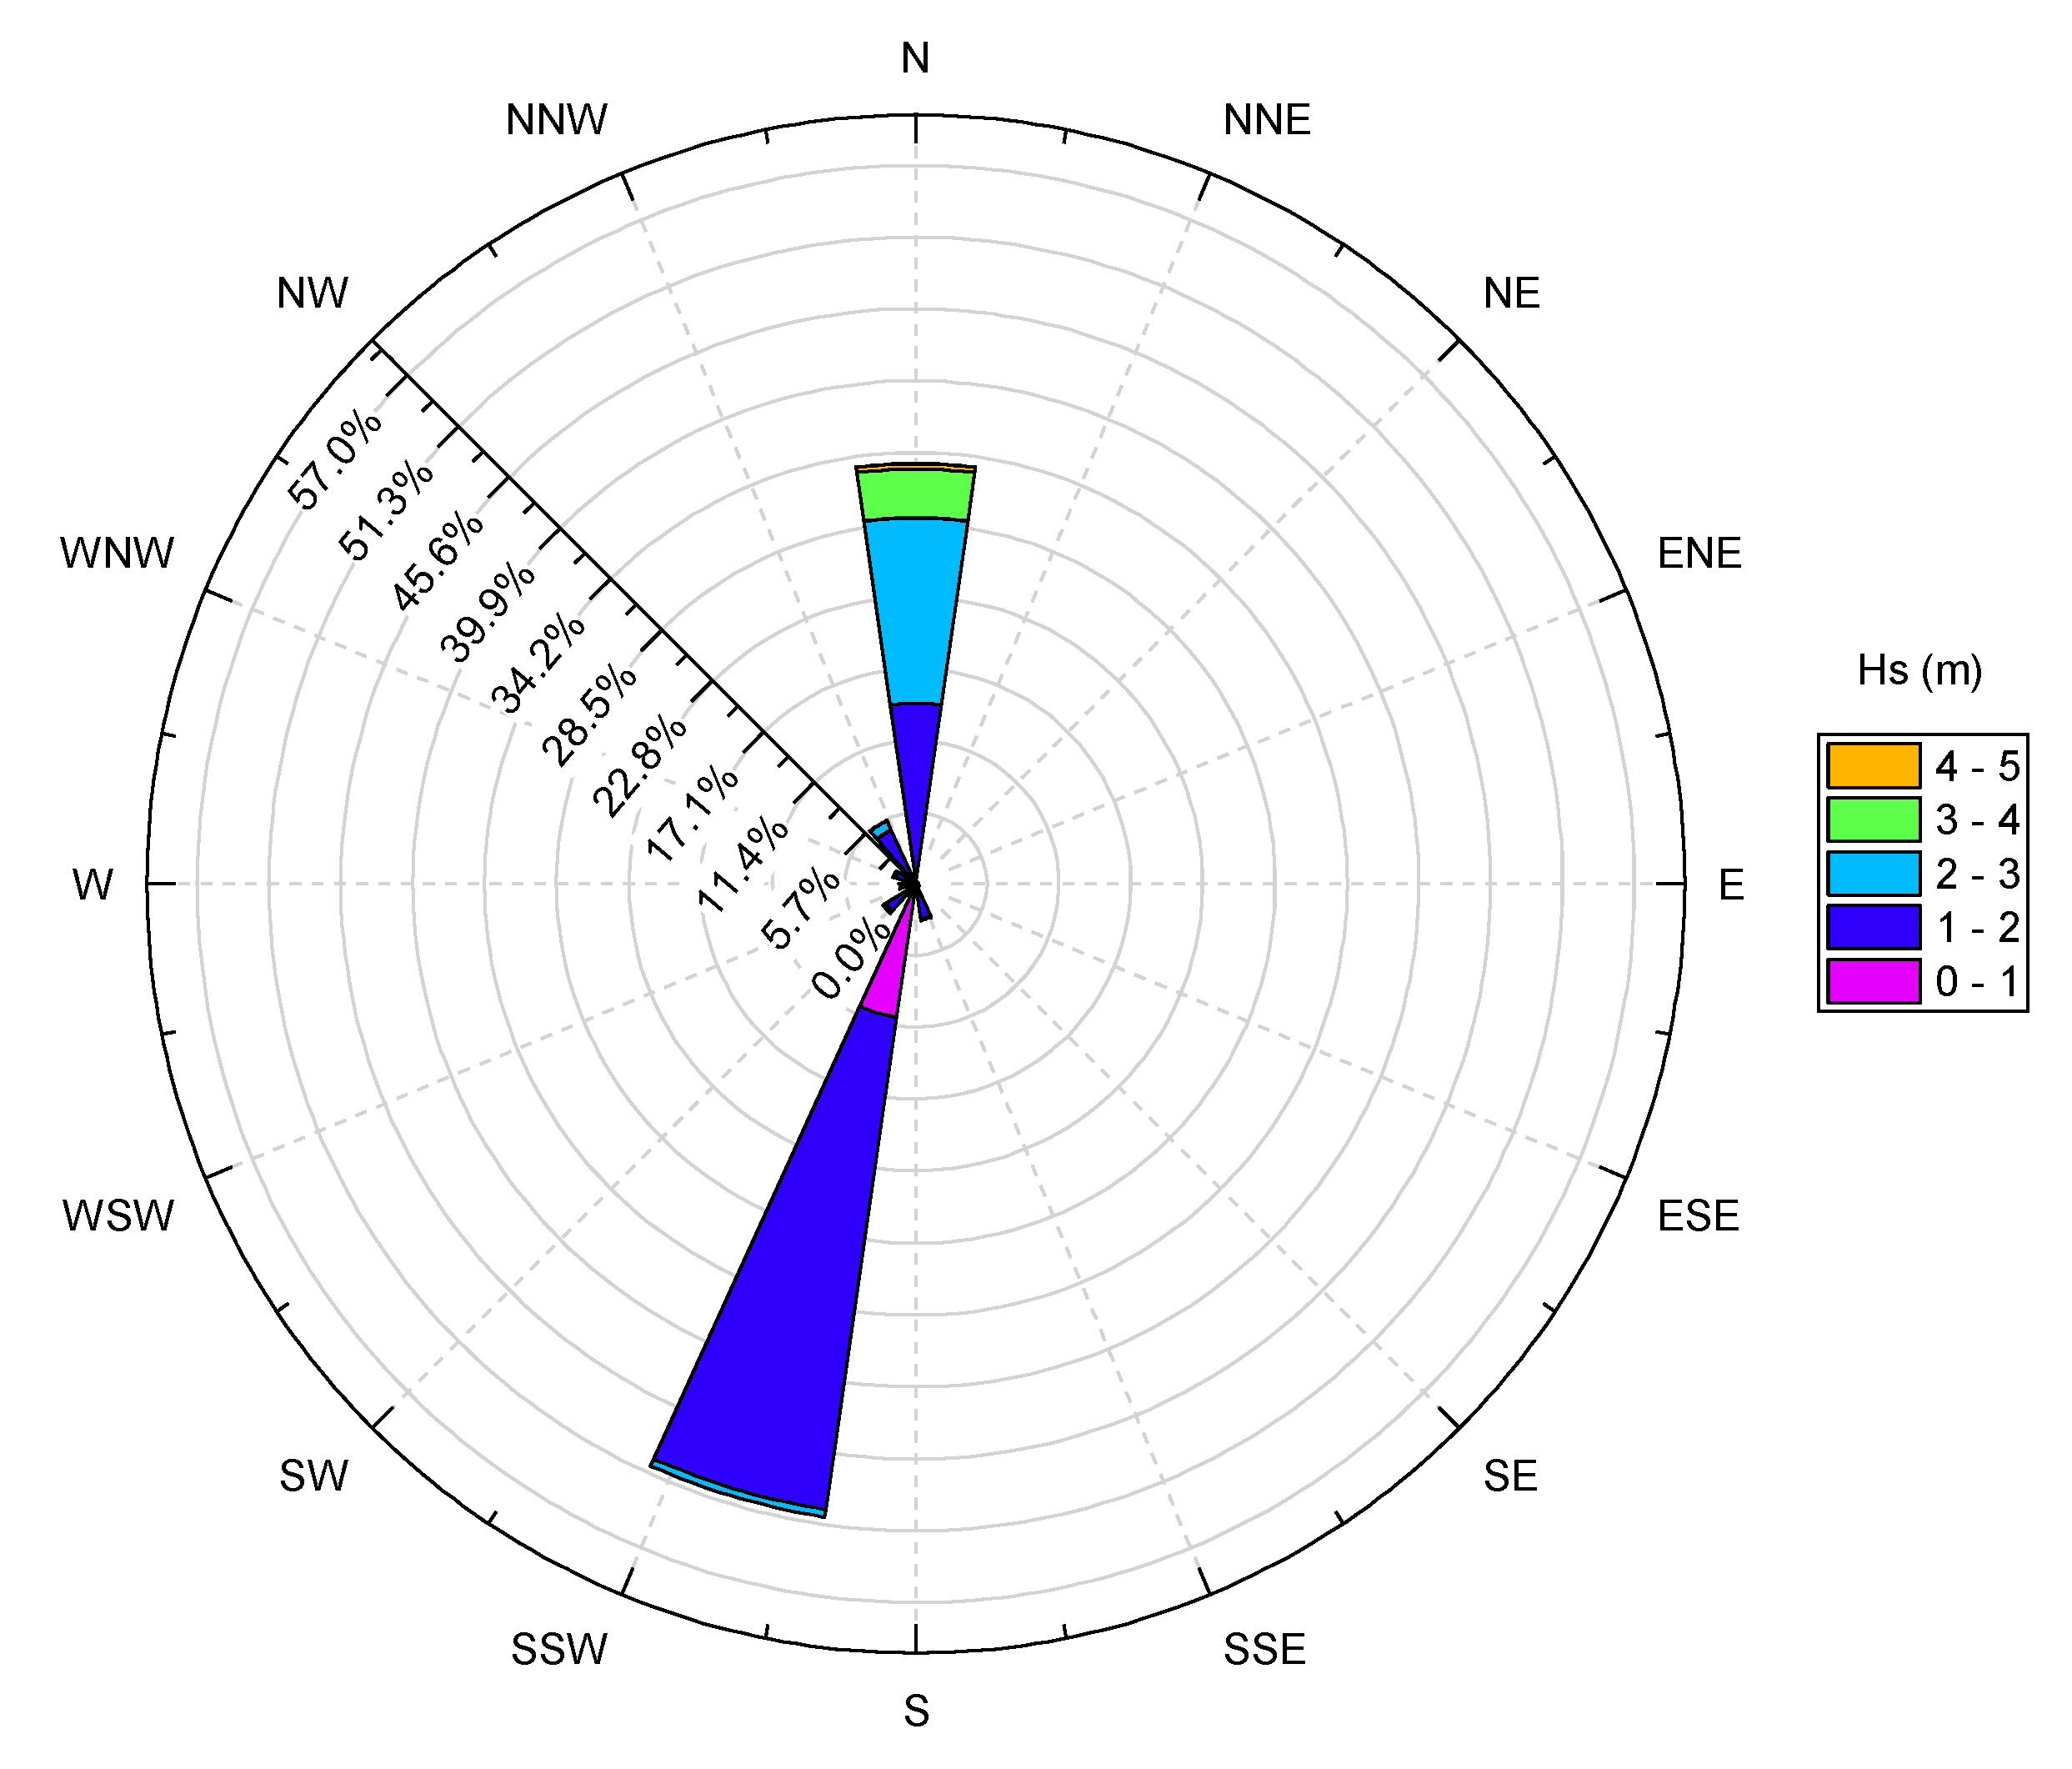
Figure 8 shows the annual wave rose. The statistical analysis results from 2001 to 2020 indicate that around 51% of the waves come from the south–southwest (SSW), where 39.4% have a significant wave height (Hs) of 1–2 m. In addition, more than 33% of the waves come from the north, where 14.7% have a wave height of 2–3 m. The waves from the north can be influenced by strong winds called “Tehuanos”, which are generated due to the difference in atmospheric pressure between the Gulf of Mexico (high pressure) and Gulf of Tehuantepec (low pressure) [42,43,55].
Figure 9 shows the annual joint probability of the peak period (Tp) and significant height (Hs). Firstly, it is observed that ~46% of the waves range between 0.5 to 2 m, with a peak period between 8 to 12 s. In turn, 28% of the waves show heights of 1.5 to 3.5 m, with peak periods in the range of 5 to 7 s.
On the other hand, the joint probability of significant height and direction of the waves is shown in Figure 10. This figure indicates that about 50% of the waves come from the direction between 175–210 degrees with a significant height that varies from 0.5–2.0 m. Furthermore, about 25% of the waves come from 345–0 degrees with significant heights between 1 and 3.8 m.
3.2. Theoretical Wind Energy Assessment in the Region of Interest
Figure 11 shows the nautical wind rose at 100 m over the sea water level for the study place in the Gulf of Tehuantepec, which shows that the wind mostly comes from the south. Specifically, about 56% of the wind comes from the south, where the more predominant wind speed is 12–15 m/s (14% of wind). Conversely, 7.6% and 11.2% of the wind come from the N and NNE, respectively, with a wind speed variation between 3–12 m/s.
Figure 12 shows the theoretical wind energy potential (i.e., power, in MW) for different wind speeds that would be available in the study place (16° N, 95° W). These results were calculated with Equation (1), considering only the swept area of the 5 MW wind turbine. The theoretical power was observed to increase exponentially between the range of 4–28 m/s.
Figure 13 shows the wind potential in the Gulf of Tehuantepec, considering the power curve for the 5 MW NREL wind turbine [27]. The wind condition with the highest occurrence probability in the 20 years of statistical analysis corresponds to southern winds (170°–190°). In this condition, the wind has a speed from 9 to 24 m/s, representing a theoretical wind energy production between 2 to 5 MW. Likewise, winds come from the north (with directions between 345°–30°) with speeds between 3 and 10 m/s. This phenomenon is commonly known locally as “Tehuanos” [56].
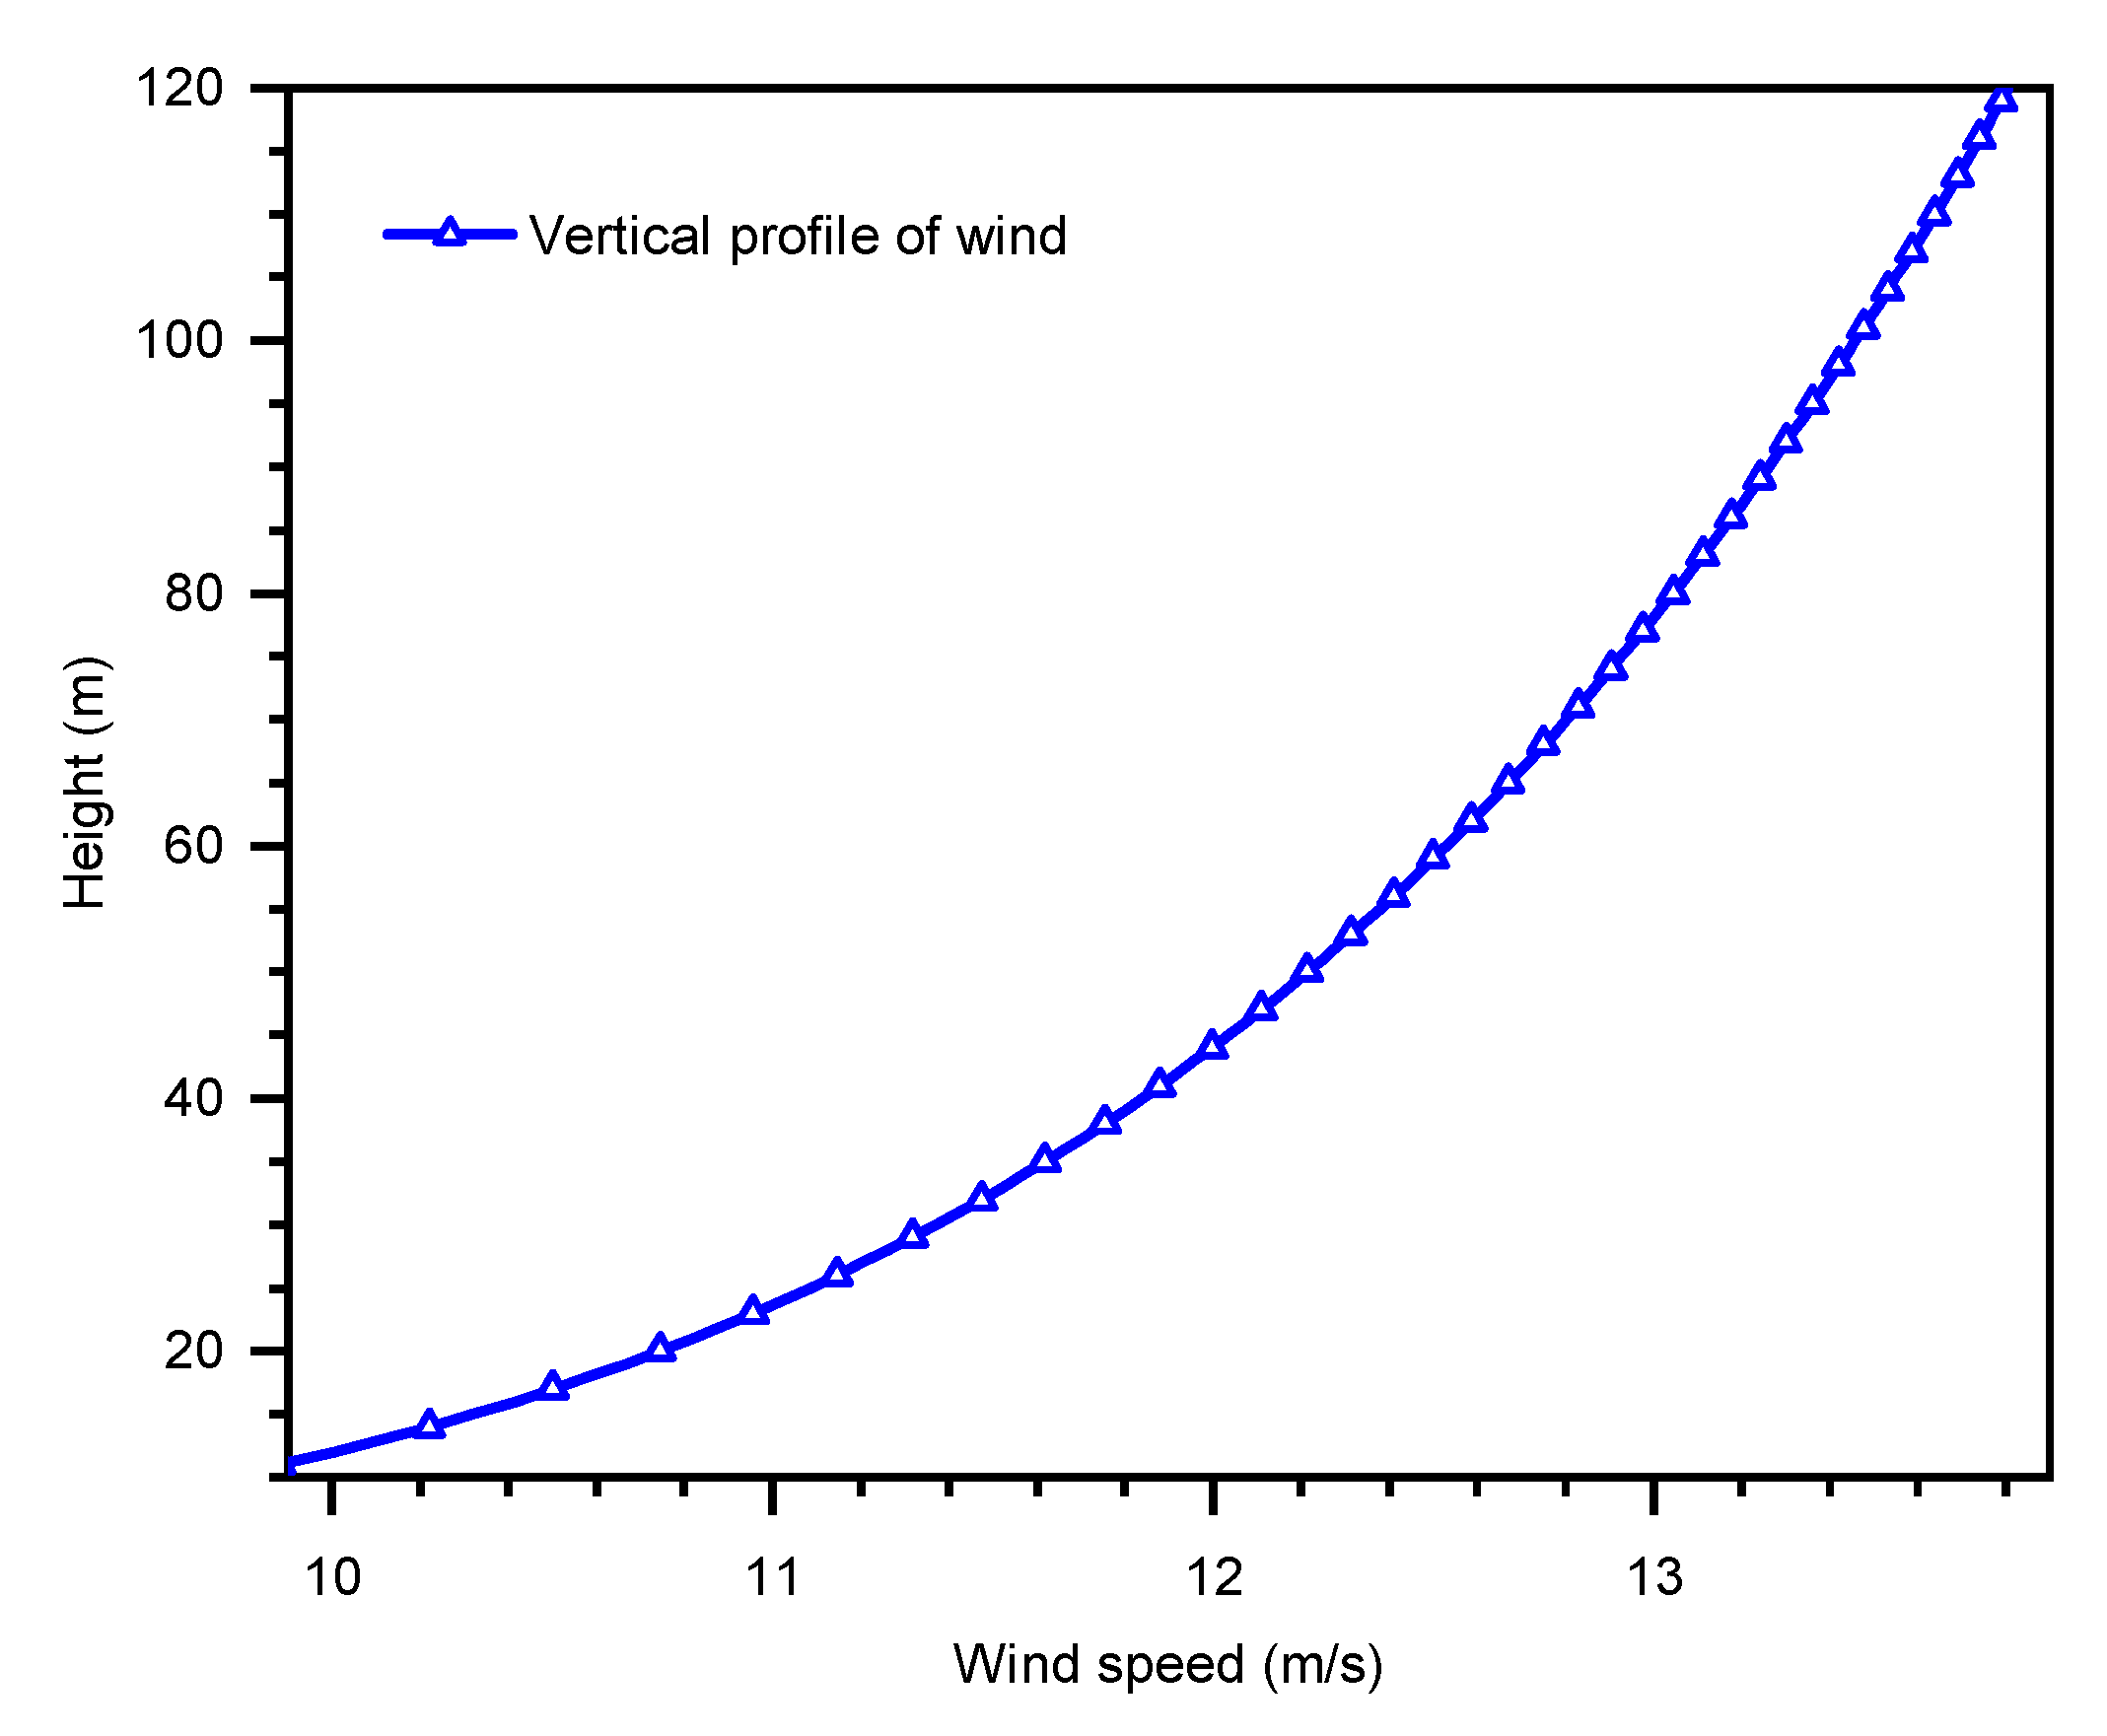
Figure 14 shows the resultant vertical profile of the wind up to 120 m. It was obtained with Equation (2), considering a value of α = 0.14, which is characteristic of the sea surface, and according to the average wind speed of 9.75 m/s at 10 m above sea level of the World Wind Atlas [10]. From this figure, it can be determined that the wind speed at 90 m height, where the rotor is located, is ~13.25 m/s.
The natural phenomenon with extreme conditions in the period of the statistical analysis was Hurricane Barbara, category one. In this phenomenon, the maximum wind speed at 10 m above sea level was equivalent to 36 m/s [57]. According to the vertical profile of the wind speed, it corresponds to 53 m/s at 90 m height, where the rotor center of the turbine is located. From the linear regression applied to the wind thrust force shown in Appendix A, a wind speed of 53 m/s would produce a thrust of 2000 kN, according to Figure 15.
The data obtained from the statistical analysis of waves were used to prepare Table 4, which shows the three-wave conditions with the highest recurrence in the study place. Likewise, the average speed equal to 13.25 m/s in the three cases corresponds to the vertical wind profile at the height of 90 m. Case A is the one with the highest probability. Thus, it was chosen to analyze the platform dynamics of Section 3.3.2.

Table 4.
Average annual wave height with most recurrent associated values.
| Case | Hs (m) | Tp (s) | Wave Direction | Wind Direction | U(90) (m/s) | Probability (%) |
|---|---|---|---|---|---|---|
| A | 1.125 | 9.75 | SSW | SSE | 13.25 | 3.06 |
| B | 1.125 | 10.25 | SSW | SSE | 13.25 | 2.79 |
| C | 1.125 | 9.25 | SSW | SSE | 13.25 | 2.73 |
The extreme conditions of waves and wind of Hurricane Barbara used in this study, are described in Table 5 with data from ERA5 [58]. This case was employed for the analysis of the platform dynamics in Section 3.3.3.
Table 5.
Maritime conditions of Hurricane Barbara.
| Case | Hs (m) | Tp (s) | U(90) (m/s) |
|---|---|---|---|
| D | 2.28 | 7.11 | 53 |
3.3. Dynamics of the FOWT
3.3.1. RAO Analysis
Firstly, a period domain analysis of the FOWT platform was conducted with the Hydrodynamic Diffraction module of ANSYS AQWA. Notably, the Response Amplitude Operators (RAOs, i.e., primary dynamic parameters of the platform) of surge, heave, and pitch for different floating conditions, defined by the d/a ratio described in Section 2.4, have been analyzed (Figure 15). The reader is referred to Appendix C for information regarding the validation of the numerical approach.
From Figure 16a, the surge motion of the three platforms has a similar trend in the RAOs. For 5 < T < 8 s, d/a = 0.5 presented the greatest amplitude (~0.23 m/m). For T > 8 s, all amplitudes increased, but d/a = 0.625 had the highest values. In general, d/a = 0.625 presented amplitude differences of ~3.2% and ~4.5% with respect to d/a = 0.75 and d/a = 0.5, respectively.
Figure 16b shows the heave RAOs’ comparison, whose curve shapes are similar. Initially, for 5 s < T < 15 s, two humps are identified in the curves, where d/a = 0.5 reached the maximum amplitudes of ~0.11 m/m and ~0.33 m/m for 5 s < T < 8 s and 8 s < T < 15 s, respectively. At T = 15 s, amplitudes of all d/a are close to zero, probably due to wave cancellation. Next, for T > 15 s, all RAOs increased, and the maximum amplitudes of ~1.75 m/m were obtained by d/a = 0.75 at T = 18.5 s.
Figure 16c compares RAOs of the pitch for the different d/a parameters. The RAOs in this comparison presented more significant differences for each d/a, particularly in d/a = 0.5, which showed the first hump with a maximum amplitude of ~0.55 deg/m. Then, a peak value of ~0.58 deg/m is seen at T = 17 s, corresponding to the natural heave period. Next, pitch amplitudes for this d/a presented a continuous decrease. On the other hand, d/a = 0.75 and 0.625 have a similar trend, showing a first hump whose peak amplitudes of 0.19 and 0.29 deg/m, respectively, occurred close to T = 10 s. Later, their amplitudes decreased to close to zero at T values close to 15 s and 18.5 s, respectively. After the two mentioned periods, the RAO values rose exponentially.
3.3.2. Case Study A
This subsection presents the results of the platform dynamics subject to the wave and wind conditions defined in case A of Table 3, which represents the event with the highest probability of occurrence (Table 4). It is important to mention that the analysis conducted in the previous section was performed with the ANSYS AQWA Hydrodynamic Diffraction module of the employed software to obtain the response operators of the platform. For the analysis of this section, these operators were needed to implement the ANSYS AQWA Hydrodynamic Response module, which allowed the effects of mooring lines distribution and wind to be considered in a simplified way.
Figure 17a–c show the comparison for the RAOs of the surge, heave, and pitch, respectively, for different floating conditions (d/a = 0.5, 0.625 and 0.75), with and without wind speed representative of the most probable maritime condition (U(90) = 13.25 m/s).
Overall, the comparisons for all the events with and without wind show similar RAO curve trends, despite small differences at some wave periods. Most significant amplitude differences are observed at the period intervals 5 s < T < 7 s and 15 s < T < 17 s for surge, 11 s < T < 15 s and 17 s < T < 20 s for heave, and 12 s < T <17 s for pitch.
For the case of the surge, results obtained by [59] presented a similar behavior despite employing different maritime conditions. For heave, the maximum values are due to resonance, coinciding with [60]. For pitch, it is observed that a first hump is followed by a greater increase in magnitudes after T = 20 s. This increase is related to the natural pitch period, located after T = 25 s. A similar analysis was performed in [61], which indicates that the natural period for d/a = 0.625 is in T = 26.8 s.
In general, when adding the aerodynamic force produced by the wind speed, the surge, heave and pitch motions presented some changes, similarly to the results in [27]. Table 6 summarizes the Mean Square Error (MSE) [62] of the RAO with and without the wind effect. For all the floating conditions (d/a), the MSE of the surge RAOs was 0.002 m/m. For heave and pitch, the greatest MSE variation was 0.034 m/m and 0.032 deg/m, respectively, corresponding to the platform with d/a = 0.625. In this floating condition, the wind had a more significant influence.
3.3.3. Case Study D
This subsection shows the results of case study D, defined in Table 3, which considers the most extreme maritime conditions in the location of interest. As shown in Table 5, these correspond to marine conditions of hurricane Barbara category one [57].
Time-domain analysis of surge, heave, and pitch motions of the platform for different d/a conditions were analyzed during 3000 s with the ANSYS AQWA Hydrodynamic Response module.
Figure 18 shows the comparison of the time series of surge (Figure 18a), heave (Figure 18b), and pitch (Figure 18c) for different floating conditions defined by the d/a parameter, whose maximum amplitudes are summarized in Table 7.
For surge, it is observed that the largest horizontal displacement from the initial position to the midpoint on the horizontal is presented by d/a = 0.75 with x = 15.95 m. For d/a = 0.625 and 0.5, it moved up to x = 14.975 m and 14.05 m, respectively.
Regarding the heave motion, the greatest vertical displacement was experienced by d/a = 0.75 (z = −14.925 m), while d/a = 0.75 and d/a = 0.5 presented z = −10.837 and z = −7.175 m, respectively, probably due to the draft of the platform.
For the pitch motion, the largest average inclination value, αm, is observed in d/a = 0.5 (i.e., 9.65°). Considering this d/a condition, the motion with d/a = 0.625 had a difference of −7.3%, and the one with d/a = 0.75 showed a reduction of 20.2% of the inclination. This occurs because, for the same excitation conditions, the platform with a lower draft has a weaker restoring force since it displaces less mass than that with a higher draft. Thus, as the draft increases, the inclination of the platform tends to decrease.
Figure 19a–c shows the trajectory of the platform, at every 0.25 T (where T is the peak wave period of 7.11 s, starting at time ti = 2130.8 s), which is represented by a rectangle in scale 1:150 on the X-axis and 1:1 on z the axis, during the surge, heave, and pitch motions, respectively. CG, on the plane x–z, has been denoted as the center of gravity. Furthermore, Figure 19d shows the theoretical free surface at x = 15 m during the time interval 2130.8 < t < 2130.8 + T to analyze the points of the free surface that interact with the platforms at different drafts. Table 8, Table 9 and Table 10 summarize the motions of the platform in the x–z plane of Figure 19 for each d/a floating condition. It is important to mention that when a period, T, is completed, the CG returns to its initial position in ti.
Results in Table 8 show that after ti for d/a = 0.5, the CG of the platform moves from the origin to x = 14.24 m, z = −7.15 m, and inclines 9.82°. At t = ti + 0.25 T, it moves −0.24 m in x, −0.11 m in z, and the inclination increases 0.06°. Then, at ti + 0.5 T, there is a displacement of −0.14 m in x, 0.08 m in z, and a reduction in inclination of 0.42°. By t = ti + 0.75 T, it stands at x = 14.09 m, z = −7.07 m and has an inclination of 9.38°. Moreover, the displacement with the greatest horizontal distance, xt; vertical distance, zt; and inclination, αt, between two positions of the CG is equivalent to 0.38 m, 0.19 m, and 0.5°, respectively.
Table 9 shows that for d/a = 0.625, the platform CG initially moved at x = 14.97 m and at z = −10.77 m and inclined 8.8°. After 0.25 T, the displacement increased 0.18 m in x, 0.04 m in z, and the inclination rose to 9.06°; after 0.5 T there is an increase in distance and in inclination of −0.08 m and 0.09°, respectively; however, the motion in x decreases to 15.01 m. Then, at t = ti + 0.75 T, the CG position is x = 14.82 m, z = −10.85 with an inclination of 8.88 °. Likewise, xt = 0.33 m, zt = 0.12 m, and αt = 0.34°.
In Table 10, for d/a = 0.750, it can be seen that at ti, CG moved to x = 16.08 m, z = −14.91 m and inclines 7.79°. After 0.25T, the x value and inclination decreased to 15.91 m and 7.78°, respectively, while z increased to −14.96 m. At 0.5 T, the three motions decreased, presenting x = 15.82 m, z = −14.92 m and an inclination of 7.59°. Then, at 0.75 T, x increases 0.16 m, z decreases 0.05 m, and the inclination remains the same with 7.59°. The values xt, zt, and αt are 0.26 m, 0.05 m, and 0.2°, respectively. Overall, the greater motions and inclination is presented by the platform d/a = 0.5, followed by d/a = 0.625 and 0.75. This is due to the platform draft since as it decreases, the structure is going to bear a greater motion. On the other hand, if the draft increases, the motions are reduced.
3.4. Joint Assessment: Wind Potential with Different Platform Inclinations
From the three floating conditions defined by the d/a parameter investigated in case studies A (most recurring maritime conditions) and B (most extreme conditions), the one with the highest RAOs values is d/a = 0.5, as shown in Figure 19 for ti = 2132.57 s. This figure illustrates the maximum displacements of both platform conditions in an x–z view. Initially, the CG is at position x = −0.08 m and z = −6.29 m. In the prototype, under more recurring maritime conditions, the CG has a horizontal displacement equal to 2.69 m and a vertical motion that reaches −7.05 m and an inclination of 1.06 °. On the other hand, the prototype under extreme maritime conditions showed more significant motions. The horizontal displacement increased ~423 %, whereas the vertical displacement incremented ~3%, and the inclination presented a greater difference with a value of ~832% higher than presented in the more-often recurring maritime conditions. The rise of the motions is due to the increase in wave height, a decrease in the associated period, and a ~670% increase in horizontal thrust because of wind speed, originating a considerable inclination.
The wind potential in more-often recurring maritime conditions to produce energy would be within 3–4 MW, considering the wind direction coming from the south, as shown in Figure 20. On the other side, the wind speed in extreme conditions exceeds the power production capacity of the 5 MW wind turbine presented in [39]. Hence, it is necessary to limit the effect of wind loads on the turbine. As indicated in [63], this could be completed by applying the following methods: by changing the yaw angle of the rotor, the attack blades’ angle, or the generator torque.
4. Conclusions
This paper presented a technical assessment of offshore wind energy in Mexico. The Gulf of Tehuantepec is considered a prospective place in the Mexican Pacific that could be suitable for wind energy harvesting using floating offshore wind turbines (FOWT). The most probable and extreme maritime conditions at this place were evaluated using databases available in the literature, and the dynamic behavior of a well-known FOWT platform technology was tested to understand some possibilities for deployment. This seems to be the first study on assessing offshore wind energy involving the possible behavior of floating harvesting devices in Mexico. The main conclusions are listed as follows:
- Along the coast of Mexico, the area with the most significant offshore wind potential corresponds to the Gulf of Tehuantepec.
- The direction of the waves in the Gulf of Tehuantepec comes mainly from the SSW. The highest percentage of swell in the study area has a height that varies from 0.5–2 m, with an associated period of 8–12 s. Hurricane Barbara category 1 presented a wave height equivalent to 2.28 m with an associated period equal to 7.11 s.
- The wind was mainly from the south, specifically from the SSO and SSE. The average wind speed at 90 m above sea level is 13.25 m/s, while in Hurricane Barbara, it was 53 m/s.
- The effects of different floating conditions (i.e., varying the drafts through the d/a parameter) of the platform were investigated. The draft variation influences the center of gravity position, moments of inertia, natural periods of the degrees of freedom, and the RAOs under the influence of the wind and waves.
- Numerical analysis with three different d/a cases showed that with d/a = 0.5, the platform had the highest RAO values for the surge. For heave motion, from wave periods 5 < T < 15 s, d/a = 0.5 presented the RAO with higher values. However, for T > 15 s the higher RAO value was obtained with d/a = 0.75. Finally, in the wave period range 5 < T < 18.5 s for the pitch motion, the largest RAO value appeared at d/a = 0.5; however, after T = 18.5 s, d/a = 0.75 had the largest RAO value.
- The three degrees of freedom surge, heave, and pitch varied when adding the effect of the wind and to a greater extent for the pitch rotation.
- In more recurring and extreme maritime conditions, the platform d/a = 0.5 experienced the highest displacements.
- In the case of extreme wave and wind conditions, it would be necessary to apply safety and stabilization methods to avoid damage to the OC4 DeepCwind semisubmersible wind turbine and platform.
Future work could validate the results obtained in this study through laboratory tests, considering maritime environmental conditions of the region of interest in the Gulf of Tehuantepec, Mexico. In addition, it is recommended to investigate the dynamics of the platform with oblique waves experimentally and numerically, in conditions with a higher probability of occurrence and considering waves and extreme winds.
Author Contributions
Conceptualization, D.F.B.-C., J.V.H.F. and E.M.; methodology, D.F.B.-C., J.V.H.F. and E.M.; software, D.F.B.-C.; validation, D.F.B.-C.; formal analysis, D.F.B.-C.; investigation, D.F.B.-C., J.V.H.F. and E.M.; resources, E.M.; data curation, D.F.B.-C. and J.V.H.F.; writing—original draft preparation, D.F.B.-C., J.V.H.F. and E.M.; writing—review and editing, D.F.B.-C., J.V.H.F. and E.M.; visualization, D.F.B.-C. and J.V.H.F.; supervision, J.V.H.F. and E.M.; project administration, E.M.; funding acquisition, E.M. All authors have read and agreed to the published version of the manuscript.
Funding
This research was funded by CONACYT-SENER-Sustentabilidad Energética, CEMIE-Océano project, Grant Agreement No. FSE-2014-06-249795.
Data Availability Statement
Not applicable.
Acknowledgments
E.M. thank the support provided by CONACYT-SENER-Sustentabilidad Energética, CEMIE Océano project, Grant Agreement No. FSE-2014-06-249795. D.F.B.C. thanks the ConCONACYT scholarship support for MSc studies at II-UNAM. J.V.H.F. thanks the support provided by “GPA/Universidade do Estado do Amazonas, Portaria Nº 086/2021-GR/UEA”.
Conflicts of Interest
The authors declare no conflict of interest.
Nomenclature
| FOWT | Floating Offshore Wind Turbine |
| TLP | Tension Leg Platform |
| NMRI | National Maritime Research Institute |
| FAST | Fatigue, Aerodynamics, Structure, and Turbulence |
| MARIN | Maritime Research Institute Netherlands |
| NREL | National Renewable Energy Laboratory |
| DOF | Degrees of freedom |
| GWA | Global Wind Atlas |
| ECMWF | European Centre for Medium Range Weather Forecast |
| NOAA | National Oceanic & Atmospheric Administration |
| GEBCO | The General Bathymetric Chart of the Oceans |
| Tp | Peak wave period |
| Hs | Significant wave height |
| WS | Wind speed |
| RAO | Response Amplitude Operator |
| MSE | Mean Square Error |
| CG | Center of Gravity |
Appendix A
This appendix briefly describes the methods used to calculate the wind speed that was used in the numerical simulations. The wind speed at 90 m above sea level, U(90), was represented as a force applied at the center of the rotor. To know the force generated by different wind speeds, the graph in Figure A1 was consulted [61].
Figure A1.
Wind thrust force at different speeds.

Regarding the wind speed in extreme conditions, a linear regression was calculated for Figure A1 to know the relationship between the wind speed and the thrust that it would produce on the platform. Equation (A1) expresses the linear regression model that was used [62].
where is the thrust generated by the wind, is the wind speed at a distance, (m), above sea level, and and are constants called regression coefficients.
Appendix B
This appendix presents the mesh independence analysis. The selection of the mesh for the numerical simulation is important, since it influences in the accuracy of the software results [64]. Thus, a mesh independence study was carried out in the Hydrodynamic Diffraction module, considering different mesh sizes. The simulation values were from 5 < T < 25 s with an increment of 0.5 s and with wave direction equal to 0°. The results of the maximum RAOs of pitch were chosen for comparison, to find an appropriate mesh size for simulations.
In the mesh independence study, was found that the appropriate mesh for the present work is made of 14,906 nodes, since the results have little variation with respect to the previous mesh. The study information is shown in Figure A2, where the number of nodes that make up the mesh and the maximum value of the RAO pitch were plotted.
Figure A2.
Mesh independence study.

Appendix C
This appendix includes the methods and results related to the validation of the numerical approach.
Appendix C.1. Description of Data Used for Validation
Surge, heave, and pitch data from the experiments carried out in [27] with a 1/50 scale model of the semisubmersible platform OC4. DeepCwind was used for the numerical validation of ANSYS AQWA software. The waves used during those experiments are representative of maritime conditions offshore the state of Maine, USA, while the wind speed values correspond to the NREL power curve for a 5 MW wind turbine [61]. In the validation, the results WN1 (White Noise 1) without wind and WN1 with steady wind are compared. The sea conditions WN1 and WN2 are shown in Table A1. The thrust force generated by the wind speed of 21 m/s in the wind turbine is ~700 kN [61].
Table A1.
Wave and wind speed conditions used for validation analysis.
| Wave Condition | Hs (m) | Tp (s) | U(90) (m/s) |
|---|---|---|---|
| WN1 | 7.1 | 5-25 | 0 |
| WN1 with steady wind | 7.1 | 5-25 | 21 |
There are several factors from the experiments that can influence the comparisons with numerical simulation results. The following factors are not included in the ANSYS software validation: the weight and motion of the cable connected in the tower top rear, rotation of the rotor, an increase in the tension of the mooring line one (bow) to counteract the weight of the wiring, and the rotor gyroscopic effect on the structure that affects the pitch motion [61].
To quantify the error between the values of the three motions of the numerical analysis with ANSYS AQWA used in this study and the experiment, the Mean Square Error (MSE) was calculated as shown in Equation (A2).
where is the value of the motion in ANSYS AQWA, is the motion in the experiment, and corresponds to the total amount of data.
Appendix C.2. Validation Results
In Figure A3a–c, the comparison between the results of the numerical analysis in ANSYS AQWA and the experiments performed in [27], in the wave period interval 5 < T < 25 s, for surge, heave, and pitch motions, are presented, respectively.
Overall, surge and heave motions presented close agreement with experiments. For surge, an excellent agreement was seen, whereas for heave, small differences at minimum and maximum displacements were observed. For pitch, the best agreement was observed in 0 < T< 13 s.
Table A2 presents the mean square error, MSE, between the experiment and the numerical results. Pitch motion presented the highest value of MSE, equal to 0.37 with WN1, followed by the surge and heave, which had lower MSE values, 0.11 and 0.09, respectively. Regarding to WN1 with steady wind, the order of the MSE value is analogous since the pitch motion had a value of 0.36, while surge was equal to 0.09, and heave presented 0.07.
Figure A3.
Comparison of RAO numerical results obtained with ANSYS AQWA and experimental tests in [27]. (a) Surge, (b) heave, and (c) pitch.
Figure A3.
Comparison of RAO numerical results obtained with ANSYS AQWA and experimental tests in [27]. (a) Surge, (b) heave, and (c) pitch.

Table A2.
Mean square error between the experiment made in [27] and ANSYS AQWA.
Table A2.
Mean square error between the experiment made in [27] and ANSYS AQWA.
| Motion | ECM–WN1 | ECM–WN1 with Steady Wind |
|---|---|---|
| Surge | 0.11 | 0.09 |
| Pitch | 0.37 | 0.36 |
| Heave | 0.09 | 0.07 |
References
- Wang, X.; Zeng, X.; Li, J.; Yang, X.; Wang, H. A Review on Recent Advancements of Substructures for Offshore Wind Turbines. Energy Convers. Manag. 2018, 158, 103–119. [Google Scholar] [CrossRef]
- Zheng, C.W.; Li, C.Y.; Pan, J.; Liu, M.Y.; Xia, L.L. An Overview of Global Ocean Wind Energy Resource Evaluations. Renew. Sustain. Energy Rev. 2016, 53, 1240–1251. [Google Scholar] [CrossRef]
- Barragan-Muñoz, J.M. Manejo Costero Integrado y Política Pública En Iberoamérica: Un Diagnóstico. Necesidad de Cambio; Red IBERMAR (CYTED): Cádiz, Spain, 2010. [Google Scholar]
- Going Global: Expanding Offshore Wind to Emerging Markets (Vol. 41): Technical Potential for Offshore Wind in Mexico—Map (English); World Bank Group: Washington, DC, USA, 2021; Available online: http://documents.worldbank.org/curated/en/540571586840981675/Technical-Potential-for-Offshore-Wind-in-Mexico-Map (accessed on 10 December 2019).
- Elliott, D.; Schwartz, M.; Scott, G.; Haymes, S.; Heimiller, D.; George, R. Wind Energy Resource Atlas of Oaxaca; No. NREL/TP-500-35519; U.S. Department of Energy: Washington, DC, USA, 2003. [Google Scholar]
- Gross, M.; Magar, V. Offshore Wind Energy Potential Estimation Using UPSCALE Climate Data. Energy Sci. Eng. 2015, 3, 342–359. [Google Scholar] [CrossRef]
- Kausche, M.; Adam, F.; Dahlhaus, F.; Großmann, J. Floating Offshore Wind—Economic and Ecological Challenges of a TLP Solution. Renew. Energy 2018, 126, 270–280. [Google Scholar] [CrossRef]
- Liu, Y.; Li, S.; Yi, Q.; Chen, D. Developments in Semi-Submersible Floating Foundations Supporting Wind Turbines: A Comprehensive Review. Renew. Sustain. Energy Rev. 2016, 60, 433–449. [Google Scholar] [CrossRef]
- Hersbach, H.; Bell, B.; Berrisford, P.; Hirahara, S.; Horányi, A.; Muñoz-Sabater, J.; Nicolas, J.; Peubey, C.; Radu, R.; Schepers, D.; et al. The ERA5 Global Reanalysis. Q. J. R. Meteorol. Soc. 2020, 146, 1999–2049. [Google Scholar] [CrossRef]
- Technical University of Denmark (DTU). Global Wind Atlas. Available online: https://globalwindatlas.info/about/introduction (accessed on 10 February 2022).
- Dvorak, M.J.; Archer, C.L.; Jacobson, M.Z. California Offshore Wind Energy Potential. Renew. Energy 2010, 35, 1244–1254. [Google Scholar] [CrossRef]
- Oh, K.Y.; Kim, J.Y.; Lee, J.K.; Ryu, M.S.; Lee, J.S. An Assessment of Wind Energy Potential at the Demonstration Offshore Wind Farm in Korea. Energy 2012, 46, 555–563. [Google Scholar] [CrossRef]
- Argin, M.; Yerci, V.; Erdogan, N.; Kucuksari, S.; Cali, U. Exploring the Offshore Wind Energy Potential of Turkey Based on Multicriteria Site Selection. Energy Strateg. Rev. 2019, 23, 33–46. [Google Scholar] [CrossRef]
- Hong, L.; Möller, B. Offshore Wind Energy Potential in China: Under Technical, Spatial and Economic Constraints. Energy 2011, 36, 4482–4491. [Google Scholar] [CrossRef] [Green Version]
- Elsner, P. Continental-Scale Assessment of the African Offshore Wind Energy Potential: Spatial Analysis of an under-Appreciated Renewable Energy Resource. Renew. Sustain. Energy Rev. 2019, 104, 394–407. [Google Scholar] [CrossRef] [Green Version]
- Global Wind Atlas 3.0. Available online: https://globalwindatlas.info/ (accessed on 12 March 2022).
- Musial, W.; Butterfield, S. Future for Offshore Wind Energy in the United States; No. NREL/CP-500-36313; National Renewable Energy Laboratory: Golden, CO, USA, 2004. [Google Scholar]
- Wilson, J.C.; Elliott, M.; Cutts, N.D.; Mander, L.; Mendão, V.; Perez-Dominguez, R.; Phelps, A. Coastal and Offshore Wind Energy Generation: Is It Environmentally Benign? Energies 2010, 3, 1383–1422. [Google Scholar] [CrossRef]
- Jonkman, J.M. Dynamics of Offshore Floating Wind Turbines—Model Development and Verification. Wind Energy Int. J. Prog. Appl. Wind Power Convers. Technol. 2009, 12, 459–492. [Google Scholar] [CrossRef]
- Nichols, J.; Ronold, K.O.; Hopstad, A.L. Key design considerations. In Floating Offshore Wind Energy The Next Generation of Wind Energy; Springer: Cham, Switzerland, 2016; pp. 241–270. [Google Scholar]
- Nielsen, F.G.; Hanson, T.D.; Skaare, B. Integrated Dynamic Analysis of Floating Offshore Wind Turbines. In Proceedings of the 25th International Conference on Offshore Mechanics and Arctic Engineering, Hamburg, Germany, 4–9 June 2006. [Google Scholar]
- Utsunomiya, T.; Sato, T.; Matsukuma, H.; Yago, K. Experimental Validation for Motion of a Spar-Type Floating Offshore Wind Turbine Using 1/22.5 Scale Model. In Proceedings of the ASME 2009 28th International Conference on Ocean, Offshore and Arctic Engineering, Honolulu, HI, USA, 31 May–5 June 2009; Volume 43444, pp. 951–959. [Google Scholar]
- Roddier, D.; Cermelli, C.; Aubault, A.; Weinstein, A. WindFloat: A Floating Foundation for Offshore Wind Turbines. J. Renew. Sustain. Energy 2010, 2, 033104. [Google Scholar] [CrossRef]
- Shin, H. Model Test of the OC3-Hywind Floating Offshore Wind Turbine. In Proceedings of the Twenty-First International Offshore and Polar Engineering Conference, Maui, HI, USA, 19–24 June 2011. [Google Scholar]
- Ohta, M.; Komatsu, M.; Ito, H.; Kumamoto, H. Development of a V-Shaped Semi-Submersible Floating Structure for 7MW Offshore Wind Turbine. In Proceedings of the International Symposium on Marine and Offshore Renewable Energy, Tokyo, Japan, 28–30 October 2013; pp. 1–5. [Google Scholar]
- Azcona, J.; Bouchotrouch, F.; González, M.; Garciandía, J.; Munduate, X.; Kelberlau, F.; Nygaard, T.A. Aerodynamic Thrust Modelling in Wave Tank Tests of Offshore Floating Wind Turbines Using a Ducted Fan. J. Phys. Conf. Ser. 2014, 524, 012089. [Google Scholar] [CrossRef] [Green Version]
- Koo, B.J.; Goupe, A.J.; Kimball, R.W.; Lambrakos, K.F. Model Tests for a Floating Wind Turbine on Three Different Floaters. J. Offshore Mech. Arct. Eng. 2014, 136, 020907. [Google Scholar] [CrossRef]
- Borisade, F.; Koch, C.; Lemmer, F.; Cheng, P.W.; Campagnolo, F.; Matha, D. Validation of Innwind.Eu Scaled Model Tests of a Semisubmersible Floating Wind Turbine. Int. J. Offshore Polar Eng. 2018, 28, 54–64. [Google Scholar] [CrossRef]
- Yamaguchi, H.; Imakita, A. Learning from Field Test Regarding Damping of a Floater Motion-2mw Fowt “Fukushima Mirai”. In Proceedings of the Grand Renewable Energy, Pacifico Yokohama, Japan, 17–22 June 2018. [Google Scholar]
- Shiohara, H.; Goncalves, R.T.; Houtani, H.; Schnepf, A.; Hirabayashi, S.; Nihei, Y. Numerical and experimental comparison of the wave response of a very light floating offshore wind turbine with guy wires. In Proceedings of the ASME 2020 39th International Conference on Ocean, Offshore and Artic Engineering, Virtual Conference, 3–7 August 2020. [Google Scholar]
- Cao, Q.; Xiao, L.; Cheng, Z.; Liu, M.; Wen, B. Operational and Extreme Responses of a New Concept of 10MW Semi-Submersible Wind Turbine in Intermediate Water Depth: An Experimental Study. Ocean Eng. 2020, 217, 108003. [Google Scholar] [CrossRef]
- Skaare, B.; Hanson, T.; Nielsen, F.; Yttervik, R.; Hansen, A.M.; Thomsen, K.; Larsen, T.J. Integrated dynamic analysis of floating offshore wind turbines. Eur. Wind. Energy Conf. Exhib. 2007, 3, 1929–1939. [Google Scholar]
- Henderson, A.; Collu, M.; Masciola, M. Overview of floating offshore wind technologies. In Floating Offshore Wind Energy; The Next Generation of Wind Energy; Springer: Cham, Switzerland, 2016; pp. 87–132. [Google Scholar]
- Utsunomiya, T.; Sato, I.; Shiraishi, T.; Inui, E.; Ishida, S. Floating Offshore Wind Turbine, Nagasaki, Japan; Springer: Singapore, 2015; pp. 129–155. [Google Scholar]
- Cermelli, C.A.; Roddier, D.G.; Weinstein, A. Implementation of a 2MW Floating Wind Turbine Prototype Offshore Portugal. In Proceedings of the Offshore Technology Conference, Houston, TX, USA, 30 April–3 May 2012; Volume 4, pp. 2678–2686. [Google Scholar]
- Roddier, D.; Cermelli, C.; Weinstein, J.; Byklum, E.; Atcheson, M.; Utsunomiya, T.; Jorde, J.; Borgen, E. State-of-the-Art. In Floating Offshore Wind Energy; The Next Generation of Wind Energy; Springer: Cham, Switzerland, 2016; pp. 271–333. [Google Scholar]
- Ohki, Y. News from Japan: Development of a braided piezoelectric cord for wearable sensors. IEEE Electr. Insul. Mag. 2020, 36, 59–61. [Google Scholar] [CrossRef]
- Robertson, A.; Jonkman, J.; Masciola, M.; Song, H.; Goupee, A.; Coulling, A.; Luan, C. Definition of the Semisubmersible Floating System for Phase II of OC4; NREL: Golden, CO, USA, 2014. [Google Scholar]
- Jonkman, J.; Butterfield, S.; Musial, W.; Scott, G. Definition of a 5-MW Reference Wind Turbine for Offshore System Development; NREL: Golden, CO, USA, 2009; pp. 1–75. [Google Scholar]
- Goupee, A.J.; Koo, B.J.; Kimball, R.W.; Lambrakos, K.F.; Dagher, H.J. Experimental Comparison of Three Floating Wind Turbine Concepts. J. Offshore Mech. Arct. Eng. 2014, 136, 1–9. [Google Scholar] [CrossRef]
- INEGI. Anuario Estadístico y Geográfico Por Entidad Federativa; Instituto Nacional de Estadística y Geografía: Aguascalientes, Mexico, 2018. [Google Scholar]
- Ortega-García, S.; Trigueros-Salmerón, J.A.; Rodríguez-Sanchéz, R.; Salvador, L.-C.; Villalobos, H. El Golfo de Tehuantepec Como un Centro de Actividad Biológica Y Su Importancia en Pesquerias. In BAC Centros de Actividad Biológica del Pacífico Mexicano; Centro de Investigaciones Biológicas del Noroeste: La Plaz, Mexico, 2000. [Google Scholar]
- Gómez, M.; Ma, D.d.L.; Ramírez, J.A. Las Surgencias Costeras de America. Rev. Geofis. 1999, 51, 38. [Google Scholar]
- Noaa Historical Hurricane Tracks. Available online: https://coast.noaa.gov/hurricanes/#map=5.57/16.365/-95&search=eyJzZWFyY2hTdHJpbmciOiJTYWxpbmEgQ3J1eiwgT2F4YWNhLCBNZXhpY28iLCJzZWFyY2hUeXBlIjoiZ2VvY29kZWQiLCJvc21JRCI6IjU5OTk2NzIiLCJjYXRlZ29yaWVzIjpbIkg1IiwiSDQiLCJIMyIsIkgyIiwiSDEiLCJUUyIsIlREIiwiRVQiXSwie (accessed on 15 March 2022).
- Tong, W. Wind Power Generation and Wind Turbine Design; WIT Press: Southampton, UK, 2010. [Google Scholar]
- Manwell, J.F.; Mcgowan, J.G.; Rogers, A.L. Wind Energy Explained: Theory, Design and Application, 2nd ed.; John Wiley & Sons: Hoboken, NJ, USA, 2009. [Google Scholar]
- Palm, W.J., III. MATLAB for Engineering Applications, 4th ed.; Mc Graw Hill: New York, NY, USA, 2019. [Google Scholar]
- GEBCO General Bathymetric Chart of the Oceans. Available online: https://www.gebco.net/ (accessed on 20 January 2022).
- GoldenSoftware. Available online: https://www.goldensoftware.com/products/surfer (accessed on 11 November 2021).
- QGIS Guía de Usuario de QGIS. Available online: https://www.qgis.org/es/site/ (accessed on 23 August 2021).
- ANSYS. Aqwa Theory Manual; ANSYS Inc.: Canonsburg, PA, USA, 2018. [Google Scholar]
- ANSYS. AQWA User Manual; SAS IP, Inc.: Canonsburg, PA, USA, 2012. [Google Scholar]
- Robertson, A.N.; Jonkman, J.M.; Goupee, A.J.; Coulling, A.J.; Prowell, I.; Browning, J.; Masciola, M.D.; Molta, P. Summary of Conclusions and Recommendations Drawn from the Deepcwind Scaled Floating Offshore Wind System Test Campaign. In Proceedings of the International Conference on Ocean, Offshore and Arctic Engineering, Nantes, France, 9–14 June 2013; Volume 8. [Google Scholar]
- Derrett, C.D.; Barrass, B. Ship Stability for Masters and Mates, 5th ed.; Elsevier: Oxford, UK, 1999. [Google Scholar]
- Trasviña, A.; Barton, E.D.; Brown, J.; Velez, H.S.; Kosro, P.M.; Smith, R.L. Offshore Wind Forcing in the Gulf of Tehuantepec, Mexico: The Asymmetric Circulation. Geophys. Res. Ocean. 1995, 100, 20649–20663. [Google Scholar] [CrossRef] [Green Version]
- Garcia, H.; Ocampo, F. Efecto Del Estado Del Mar En El Flujo De Momento Calculado Mediante Mediciones Directas En El Golfo De Tehuantepec. In Oceonografia y Meteorologia del Golfo de Tehuantepec; UGM: Ensenada, Mexico, 2005; Volume 25. [Google Scholar]
- Brown, D.P. Hurricane Barbara; National Hurricane Center: Miami, FL, USA, 2013. [Google Scholar]
- Copernicus Climate Change Service (C3S): ERA5 Copernicus Climate Change Service (C3S): ERA5: Fifth Generation of ECMWF Atmospheric Reanalyses of the Global Climate. Available online: https://cds.climate.copernicus.eu/cdsapp#!/home (accessed on 6 May 2022).
- Coulling, A.J.; Goupee, A.J.; Robertson, A.N.; Jonkman, J.M.; Dagher, H.J. Validation of a FAST Semi-Submersible Floating Wind Turbine Numerical Model with DeepCwind Test Data. J. Renew. Sustain. Energy 2013, 5, 023116. [Google Scholar] [CrossRef]
- Robertson, A.; Jonkman, L.; Vorpahl, F.; Popko, W.; Qvist, J.; Froyd, L.; Chen, X.; Azcona, J.; Uzunoglu, E.; Guedes Soares, C. Offshore code comparison collaboration continuation within iea wind task 30: Phase ii results regarding a floating semisubmersible wind system. In Proceedings of the International Conference on Ocean, Offshore and Arctic Engineering, San Francisco, CA, USA, 8–13 June 2014; Volume 45547, p. V09BT09A012. [Google Scholar]
- Gueydon, S.; Weller, S. Study of a Floating Foundation for Wind Turbines. J. Offshore Mech. Arct. Eng. 2013, 135, 031903. [Google Scholar] [CrossRef]
- Gareth, J.; Daniela, W.; Trevor, H.; Robert, T. An Introduction to Statistical Learning: With Applications in R; Spinger: Berlin/Heidelberg, Germany, 2013. [Google Scholar]
- Johnson, K.E. Adaptive Torque Control of Variable Speed Wind Turbines. Ph.D. Thesis, University of Colorado, Boulder, CO, USA, 2004. [Google Scholar]
- Sadrehaghighi, I. Elements in Fluid Dynamics; CFD Open Series; Academiay: Annapolis, MA, USA, 2017. [Google Scholar]
Figure 1.
Distribution of the offshore wind speed worldwide at 10 m above sea water level.

Figure 2.
Offshore wind speed (WS) resource in Mexico [4]. The figure was used under an authorized public disclosure; © The World Bank.
Figure 2.
Offshore wind speed (WS) resource in Mexico [4]. The figure was used under an authorized public disclosure; © The World Bank.

Figure 3.
Geographical location of the state of Oaxaca, showing the Oaxaca’s coast, isthmus of Tehuantepec, and Gulf of Tehuantepec.
Figure 3.
Geographical location of the state of Oaxaca, showing the Oaxaca’s coast, isthmus of Tehuantepec, and Gulf of Tehuantepec.

Figure 4.
Locations in the Gulf of Tehuantepec considered in the present analysis.

Figure 5.
Model of the semisubmersible platform OC4 DeepCwind considered for the technical analysis. (a) Isometric view. (b) Frontal view. (c) Plan view with dimensions. (d) Profile view with dimensions.
Figure 5.
Model of the semisubmersible platform OC4 DeepCwind considered for the technical analysis. (a) Isometric view. (b) Frontal view. (c) Plan view with dimensions. (d) Profile view with dimensions.

Figure 6.
Catenary mooring lines system to position the OC4 DeepCwind semisubmersible platform.

Figure 7.
Sketch of the setup used for the numerical simulations. (a) Front view. (b) Top view.

Figure 8.
Annual wave rose for the selected place in the Gulf of Tehuantepec (16° N, 95° W).

Figure 9.
Joint probability of significant height (Hs) and peak period (Tp) of the waves for the selected place in the Gulf of Tehuantepec (16° N, 95° W).
Figure 9.
Joint probability of significant height (Hs) and peak period (Tp) of the waves for the selected place in the Gulf of Tehuantepec (16° N, 95° W).

Figure 10.
Joint probability of significant height and direction of the waves for the selected place in the Gulf of Tehuantepec (16° N, 95° W).
Figure 10.
Joint probability of significant height and direction of the waves for the selected place in the Gulf of Tehuantepec (16° N, 95° W).

Figure 11.
Annual wind rose for the selected place in the Gulf of Tehuantepec (16° N, 95° W). Reference wind speeds were taken at a height of 100 m over the sea water level.
Figure 11.
Annual wind rose for the selected place in the Gulf of Tehuantepec (16° N, 95° W). Reference wind speeds were taken at a height of 100 m over the sea water level.

Figure 12.
Theoretical power for different wind speeds in the selected place (16° N, 95° W).

Figure 13.
Offshore wind potential (in Megawatts, MW) matrix in the study place in the Gulf of Tehuantepec (16° N, 19° W). The numbers in the cells indicate the hours of occurrence per year of the wind speed (WS) with their respective direction.
Figure 13.
Offshore wind potential (in Megawatts, MW) matrix in the study place in the Gulf of Tehuantepec (16° N, 19° W). The numbers in the cells indicate the hours of occurrence per year of the wind speed (WS) with their respective direction.

Figure 14.
Variation of the wind speed for different heights (16° N, 95° W).

Figure 15.
Linear regression analysis for the wind thrust force for different wind speeds.

Figure 16.
Comparison of Response Amplitude Operators (RAOs) of the semisubmersible platform OC4 DeepC wind for different d/a parameters. (a) Surge motion. (b) Heave motion. (c) Pitch motion. The effect of the mooring lines and wind is disregarded. The incident wave direction, θ1, is 0°, and the working depth, h, is 200 m. Data were obtained with the ANSYS AQWA Hydrodynamic Diffraction module.

Figure 17.
Comparison of Response Amplitude Operators (RAOs) for case A. The analysis include the comparison of results with and without wind, as well as different floating conditions defined by the parameter d/a. Wave and wind incidence angle is 0°, the working depth is 200 m, the wave amplitude is 0.5625 m, and U(90) is 13.25 m/s. Results were obtained in the ANSYS AQWA Hydrodynamic Response modulus. (a) Surge, (b) heave, and (c) pitch.

Figure 18.
Comparison of time series of motions of the platform during under extreme maritime conditions of Hurricane Barbara category one for d/a = 0.5, 0.625, and 0.75. Water depth, h, is 200 m; wave amplitude, A, is 1.14; wave period, T, is 7.11 s; and wind speed, U(90), is 53 m/s. (a) Surge, (b) heave and (c) pitch.

Figure 19.
Representation of the temporal motion of platform CG of the prototype during a wave period T= 7.11 s during extreme maritime conditions of Hurricane Barbara, in the x–z plane. (a) d/a = 0.5. (b) d/a = 0625. (c) d/a = 0.75. (d) Theoretical free surface at x = 15 m.
Figure 19.
Representation of the temporal motion of platform CG of the prototype during a wave period T= 7.11 s during extreme maritime conditions of Hurricane Barbara, in the x–z plane. (a) d/a = 0.5. (b) d/a = 0625. (c) d/a = 0.75. (d) Theoretical free surface at x = 15 m.

Figure 20.
Maximum displacement scenarios of the platform with the floating condition d/a = 0.5, considering the more recurring (case A) and extreme (case D) maritime conditions at ti.
Figure 20.
Maximum displacement scenarios of the platform with the floating condition d/a = 0.5, considering the more recurring (case A) and extreme (case D) maritime conditions at ti.

Table 1.
Recent experiments with offshore floating platforms.
| Reference | Project | Scale | Type of Platform | Prototype |
|---|---|---|---|---|
| [21] | Hywind | 1:47 | Spar | ✓ |
| [22] | SPAR type | 1:22.5 | Spar | ✓ |
| [23] | Windfloat | 1:105 | Semisubmersible | ✓ |
| [24] | OC3 Hywind (2011) | 1:128 | Spar | - |
| [25] | V-shape platform | 1:64 | Semisubmersible | ✓ |
| [26] | Concret star floater | 1:40 | Semisubmersible | - |
| [27] | Three different floaters | 1:50 | Spar, semisubmersible, and tension leg platform | - |
| [28] | INWIND-EU | 1:60 | Semisubmersible | - |
| [29] | Fukushima Mirai | 1:60 | Semisubmersible | ✓ |
| [30] | Light platform | 1:60 | Semisubmersible | - |
| [31] | SPIC | 1:64 | Semisubmersible | - |
Table 2.
Mooring lines properties [38].
Table 2.
Mooring lines properties [38].
| Name | Value |
|---|---|
| Mooring lines | 3 |
| Angle between mooring lines | 120 |
| Anchor depth | 200 m |
| Ratio from centerline to anchors | 837.60 m |
| Ratio from centerline to hawsehole | 40.868 m |
| Length of mooring line without tension | 835.50 m |
| Mooring line diameter | 0.0766 m |
| Mooring Line Mass Density Equivalence | 113.35 kg/m |
| Equivalence mass in water of mooring line | 108.63 kg/m |
| Rigid Extensional Mooring Line Equivalence | 753.6 MN |
| Hydrodynamic coefficient of mooring line resistance | 1.1 |
| Hydrodynamic coefficient of added mass of mooring lines | 1 |
| Coefficient of resistance of the seabed for mooring lines | 1 |
Table 3.
Test matrix.
| Case | Period T (s) | Frequency f (Hz) | Wave Length λ (m) | Wave Height H (m) | Wind Speed U(90) (m/s) |
|---|---|---|---|---|---|
| A | 9.75 | 0.102 | 148.4 | 1.125 | 13.25 |
| D | 7.11 | 0.141 | 78.9 | 2.28 | 53 |
Table 6.
Mean square error (MSE) between the RAOs with and without wind.
| d/a | Surge (m/m) | Heave (m/m) | Pitch (deg/m) |
|---|---|---|---|
| 0.500 | 0.002 | 0.005 | 0.017 |
| 0.625 | 0.002 | 0.034 | 0.032 |
| 0.750 | 0.002 | 0.017 | 0.020 |
Table 7.
Maximum platform motions in the extreme maritime condition for different floating scenarios.
Table 7.
Maximum platform motions in the extreme maritime condition for different floating scenarios.
| d/a | Surge (m/m) | Heave (m/m) | Pitch (deg/m) |
|---|---|---|---|
| 0.500 | 0.170 | 0.081 | 0.272 |
| 0.625 | 0.142 | 0.055 | 0.168 |
| 0.750 | 0.120 | 0.039 | 0.122 |
Table 8.
Platform motions for d/a = 0.5 every 0.25 T.
| Time (s) | X (m) | Z (m) | α (deg) |
|---|---|---|---|
| ti | 14.24 | −7.15 | 9.82 |
| ti + 0.25 T | 14.00 | −7.26 | 9.88 |
| ti + 0.50 T | 13.86 | −7.18 | 9.46 |
| ti + 0.75 T | 14.09 | −7.07 | 9.38 |
Table 9.
Platform motions for d/a = 0.625 every 0.25 T.
| Time (s) | X (m) | Z (m) | α (deg) |
|---|---|---|---|
| ti | 14.97 | −10.77 | 8.80 |
| ti + 0.25 T | 15.15 | −10.81 | 9.06 |
| ti + 0.50 T | 15.01 | −10.89 | 9.15 |
| ti + 0.75 T | 14.82 | −10.85 | 8.88 |
Table 10.
Platform motions for d/a = 0.750 every 0.25T.
| Time (s) | X (m) | Z (m) | α (deg) |
|---|---|---|---|
| ti | 16.08 | −14.91 | 7.79 |
| ti + 0.25 T | 15.91 | −14.96 | 7.78 |
| ti + 0.50 T | 15.82 | −14.92 | 7.59 |
| ti + 0.75 T | 15.98 | −14.87 | 7.59 |
Publisher’s Note: MDPI stays neutral with regard to jurisdictional claims in published maps and institutional affiliations. |
© 2022 by the authors. Licensee MDPI, Basel, Switzerland. This article is an open access article distributed under the terms and conditions of the Creative Commons Attribution (CC BY) license (https://creativecommons.org/licenses/by/4.0/).
Share and Cite
MDPI and ACS Style
Bernal-Camacho, D.F.; Fontes, J.V.H.; Mendoza, E. A Technical Assessment of Offshore Wind Energy in Mexico: A Case Study in Tehuantepec Gulf. Energies 2022, 15, 4367. https://0-doi-org.brum.beds.ac.uk/10.3390/en15124367
AMA Style
Bernal-Camacho DF, Fontes JVH, Mendoza E. A Technical Assessment of Offshore Wind Energy in Mexico: A Case Study in Tehuantepec Gulf. Energies. 2022; 15(12):4367. https://0-doi-org.brum.beds.ac.uk/10.3390/en15124367
Chicago/Turabian StyleBernal-Camacho, Diego Fernando, Jassiel V. H. Fontes, and Edgar Mendoza. 2022. "A Technical Assessment of Offshore Wind Energy in Mexico: A Case Study in Tehuantepec Gulf" Energies 15, no. 12: 4367. https://0-doi-org.brum.beds.ac.uk/10.3390/en15124367
Note that from the first issue of 2016, this journal uses article numbers instead of page numbers. See further details here.