Article

Experimental and Numerical Study on Thermal Hydraulic Performance of Trapezoidal Printed Circuit Heat Exchanger for Supercritical CO2 Brayton Cycle

1
State Key Laboratory of Clean Energy Utilization, Zhejiang University, 38 Zheda Road, Hangzhou 310027, China
2
Shanghai Electric Power Generation Equipment Co., Ltd., 621 Longchang Road, Shanghai 200090, China
*
Author to whom correspondence should be addressed.
Submission received: 10 June 2022 / Revised: 29 June 2022 / Accepted: 4 July 2022 / Published: 6 July 2022

Abstract

:
The supercritical carbon dioxide (sCO2) Brayton cycle is the preferred power cycle for future nuclear energy, fossil energy, solar energy, and other energy systems. As the preferred regenerator in the cycle, the printed circuit heat exchanger (PCHE) exhibits a high heat transfer efficiency, compactness, and robustness. The structure design of its internal flow channel is one of the most important factors to enhance the heat transfer and reduce pressure loss. In the present work, a trapezoidal PCHE prototype is designed and manufactured, and its thermal-hydraulic performance as a regenerator is experimentally studied in the sCO2 test loop. The overall heat transfer coefficient exceeds 1.10 kW/(m2·K) and reaches a maximum of 2.53 kW/(m2·K) with the changes in the inlet temperature, the working pressure, and the mass flow rate. Correlations of the Nusselt numbers are proposed on both sides, with the Reynolds numbers ranging from 10,000 to 30,000 and 4800 to 14,000, and the Prandtl numbers ranging from 0.91 to 1.61 and 0.77 to 0.98 on the cold side and hot side, respectively. The pressure drop of the channels calculated by the peeling method using a single-plate straight prototype is less than 7 kPa and 15 kPa on the hot and the cold side, respectively. The heat recovery efficiency is analyzed to evaluate the performance as a regenerator. Finally, simulation works are carried out to verify the experimental results and expand the Reynolds numbers ranging from 3796 to 30,000 and 1821 to 14,000, on the cold side and hot side, respectively. This work provides the test methods and experimental correlations for the development of an efficient PCHE in the sCO2 Brayton cycle.

Graphical Abstract

1. Introduction

The supercritical carbon dioxide (sCO2) Brayton cycle has the advantages of high thermoelectric efficiency, small equipment size, low compression power consumption, and compact system structure. It is very suitable for combining with the new generation of nuclear energy, fossil energy, solar energy, etc. Due to the high compactness requirement of the system equipment, it is necessary to design and manufacture a compact heat exchanger with a high specific surface area as the regenerator or precooler of the cycle. The print circuit heat exchanger (PCHE) is a preferred device because of its high heat transfer efficiency, compactness, and robustness. The flow microchannels formed by chemical etching and the heat exchange core obtained by diffusion welding can withstand the high temperature and pressure conditions of the sCO2 Brayton cycle.
Many researchers have studied the influence of different internal flow microchannel structures on the thermal-hydraulic performance by manufacturing prototypes and constructing test platforms, including straight, zigzag, S-shaped fin, and airfoil fin channels. The straight channel has received much attention for the simple etching process. Mylavarapu et al. [1] fabricated two straight-channel PCHEs and connected them in series to a high-temperature helium test facility (HTHF). The heat transfer and friction characteristics were analyzed based on the experimental data under the conditions corresponding to the laminar to turbulent transition region. Li et al. [2] improved the heat transfer correlations using the probability density function (PDF) method and compared it with the numerical and other scholars’ results. Chen et al. [3] developed a numerical dynamic model and successfully predicted the steady-state and transient behaviors of a straight PCHE by comparing with the experimental results. Shin et al. [4] tested the pressure drop and analyzed the flow instability in the Korea Advanced Institute of Science and Technology (KAIST) test facility using He and water as the medium. Chu et al. [5] studied the PCHE thermo-hydraulic performance on the sCO2-water experiment platform at the transcritical and supercritical states, indicating that the comprehensive performance reduced by about 17.6% at the transcritical state. Xu et al. [6] also studied a straight PCHE between sCO2 and water. The heat transfer and pressure drop of the two media were studied separately under the fixed conditions of one side. Park et al. [7] tested a straight PCHE precooler under the trans-critical, near-critical, and far-critical conditions and proposed a discretization method to design a precooler at the near-critical point. Arslan et al. [8] applied the sub-heat exchanger model to design a PCHE recuperator and performed the experiments using sCO2 and water, which indicated high accuracy between the numerical model and the experimental results.
The zigzag structure can significantly improve the heat transfer area and coefficient, accompanied by the disadvantage of increased pressure loss. Nikitin et al. [9] investigated the heat transfer performance and pressure drop of a zigzag PCHE through experiments and numerical simulations. The overall heat transfer coefficient ranged from 300 to 650 W/(m2·K) with a compactness of approximately 1050 m2/m3 and a maximum power density of 4.4 MW/m3. Kim et al. [10,11,12] carried out a detailed study on the zigzag-structure PCHE using He, CO2, and water as working fluids. The correlations of Nusselt numbers and Fanning friction factors were fitted, and the effects of the channel geometric parameters were analyzed. Baik et al. [13] designed a zigzag PCHE precooler and replaced the shell and tube on the KAIST experimental facility. The effectiveness and pressure loss results were compared with both the PCHE design code KAIST-HXD and the shell and tube heat exchanger. Dai et al. [14] studied the steady and transient behavior of a hydraulic-fluid PCHE under laminar flow conditions. Bae et al. [15] studied the CO2 condensation heat transfer and two-phase flow when the PCHE precooler was close to the critical point. Existing correlations for the CO2 single-phase and two-phase were compared with the experimental data, and a new set of correlations was suggested. Zhou et al. [16] designed and manufactured a 100 kW class zigzag PCHE prototype as a recuperator and tested using sCO2 on both sides. The effectiveness was over 95% and the pressure drop was less than 50 kPa on both sides. Cheng et al. [17] tested a zigzag PCHE as a precooler on the same platform, and the effects on effectiveness and pressure drop were analyzed with the inlet Reynolds number ranging from 31,157 to 52,806 on the CO2 side and from 1084 to 1947 on the water side. Further, exergy analysis of the PCHE recuperator based on the experimental results was carried out and new correlations on the Nusselt number and friction factor were developed [18]. Zhang et al. [19] studied the global and local performance of an 80 kW zigzag PCHE precooler using a combination method of experiments and numerical simulations. New correlations were developed considering the impact of Prandtl number.
There is little experimental research on the S-shaped-fin and the airfoil-fin PCHEs. Ngo et al. [20,21] developed a new S-shaped-fin PCHE and compared its thermal-hydraulic performance with that of zigzag fins. The empirical correlations of Nusselt numbers and pressure-drop factors were proposed, which proved that the pressure drop factor of the S-shaped microchannels was 4–5 times less than the zigzag one through a 24–34% reduction in the Nusselt numbers. Pidaparti et al. [22] investigated two kinds of discontinuous PCHEs with an offset rectangular and NACA0020 airfoil fin. Empirical correlations for the friction factor and the Nusselt number were proposed, which could match the experimental results.
From the perspective of channel structure, most of the above experimental research focused on the straight and zigzag structures. However, the flow and heat transfer performance still need to be improved by designing new configurations. Aneesh et al. [23] numerically compared the heat transfer performance of zigzag, S-shaped, and trapezoidal structures, and it was found that the trapezoidal channel has the highest heat transfer performance but maximum pressure loss. From the perspective of function, the existing PCHE prototypes are mostly used as precoolers, but the data and design method as regenerators are still insufficient. From the perspective of conditions, most of the studies are near the CO2 critical point, and there are few studies on the working temperature and pressure range of the regenerator in the sCO2 Brayton cycle.
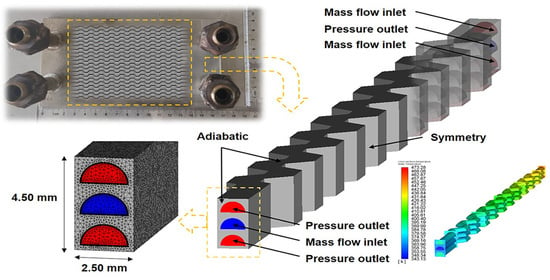
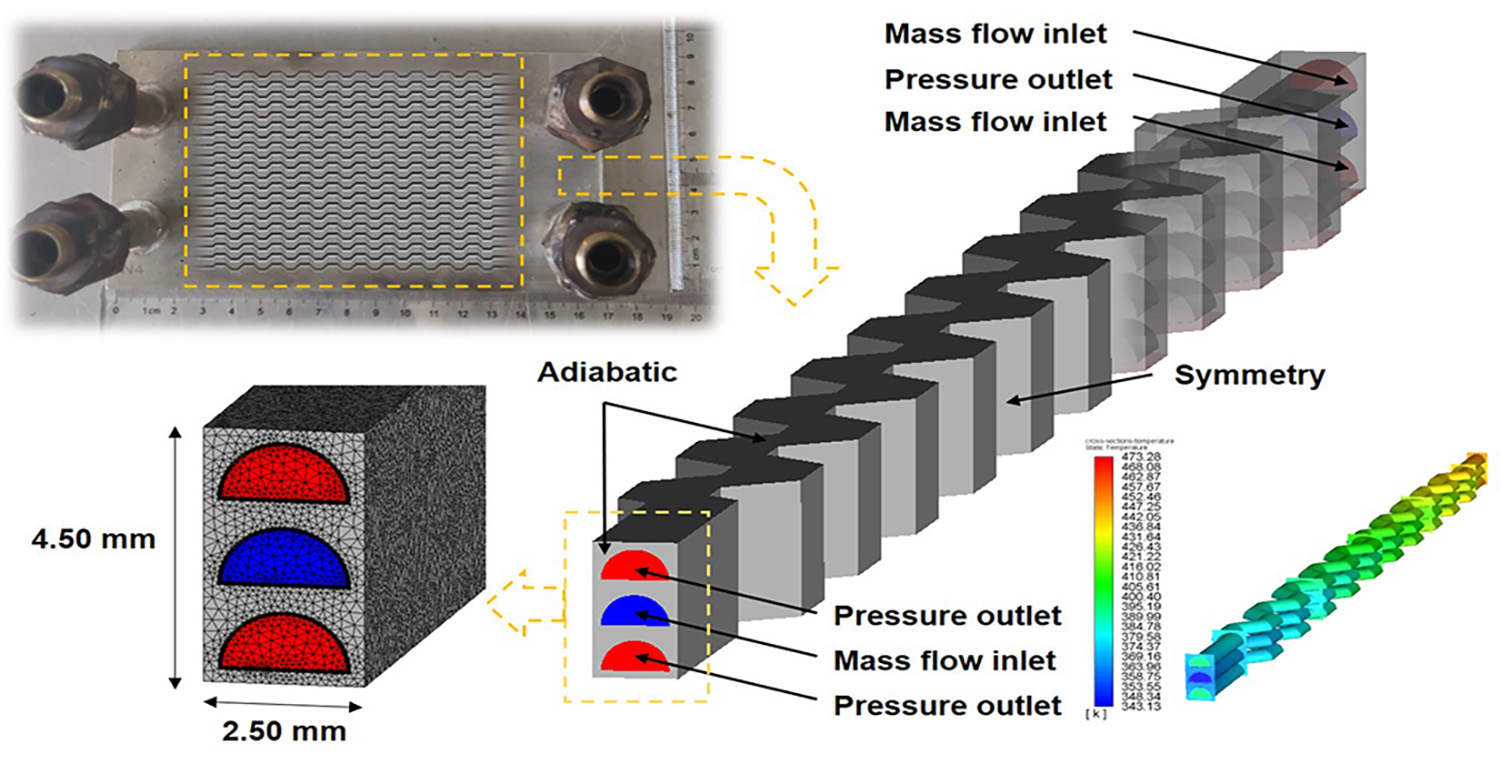
In this work, a new trapezoidal channel PCHE prototype is designed and manufactured to reach a higher heat transfer performance, and it is tested as a regenerator using sCO2. The heat transfer coefficient and heat recovery efficiency are calculated and analyzed under different thermal parameters. Correlations for Nusselt numbers on both trapezoidal channels are proposed with respect to Reynolds numbers and Prandtl numbers, and the pressure drop in the flow channels is evaluated by the peeling method through a single-plate test prototype. In addition, the numerical simulation results verify and expand the experimental conclusions. This work provides new trapezoidal channel experimental results and heat transfer correlations for an advanced PCHE regenerator design in the sCO2 Brayton cycle.

2. Experimental System and Method

2.1. Experimental System

A supercritical carbon dioxide heat transfer and circulation test loop was constructed, as shown in Figure 1, to investigate the heat transfer and pressure drop characteristics. The loop can be roughly divided into four parts, namely the CO2 gas source and pump, the cooling system, the PCHE test part, and the heat transfer test section. It also includes a pulsation damper, a mass flowmeter, a filter, various valves, thermocouples, pressure/differential pressure sensors, etc. The maximum temperature of the loop can reach 500 °C, the working pressure can be adjusted within 7–15 MPa, and the maximum mass flow rate is 60 kg/h [24].
The CO2 from the tank is first cooled to the liquid state by the condenser and pressurized to the working pressure by the CO2 pump. The pulsation damper is installed at the pump outlet to reduce the flow fluctuations. The preheater helps the high-pressure liquid CO2 cross the critical point and reach the steady inlet temperature for the PCHE test. Supercritical CO2 absorbs heat on the cold side of the test PCHE prototype and then passes through the four-stage heater and the straight tube heat transfer test section in sequence. The high-pressure and -temperature CO2 returns to the hot side of the PCHE and heats the own medium on the cold side. The cooler after the PCHE hot outlet is for further cooling to protect the back pressure valve. Finally, the working CO2 releases its pressure and returns to the condenser again for the next cycle.

2.2. Test PCHE Prototype

The test trapezoidal PCHE prototype is shown in Figure 2, which is the main research object in this work. Trapezoidal channels with a 2 mm diameter semicircular cross-section are chemically etched on 316 L stainless-steel plates with a thickness of 1.50 mm. The period of the trapezoidal structure is 10 mm, the amplitude is 1 mm, the upper base length is 3 mm, and the base angle is 45 degrees, which are designed based on previous research results [25]. There are 20 channels on one plate, each of which has a length of 120 mm, including ten periods and two straight channel zones at both ends, and a 4 mm interval is left between two adjacent channels. The prototype has two hot plates and one cold plate, resulting in the mass flow of the hot channel being half of the cold side in each heat transfer unit to balance the flow velocity and heat capacity. Using diffusion bonding, the plates are combined into a 168 mm × 90 mm × 10.50 mm device with a 120 mm × 80 mm × 4.50 mm heat transfer core. The total heat transfer area is about 0.36 m2 with a 0.30 m2 area in the heat transfer core. Four 90 mm long pipes are welded on the top of the prototype and connected to the test loop by tube fittings.
The experimental test conditions are shown in Table 1.

2.3. Calculation Method and Uncertainty

2.3.1. Heat Transfer Coefficient

The overall heat transfer coefficient U can be calculated by Equation (1).
U = Q A Δ T
where Q is the heat transfer rate in kW. In the thermal equilibrium state, Q can be obtained by Equation (2) according to previous research [7,17].
Q = m c ( H c , o u t H c , i n ) + m h ( H h , i n H h , o u t ) 2  
where m is the mass flow rate in kg/s; H is the enthalpy in kJ/kg; subscripts c and h correspond to the cold and the hot sides, and subscripts in and out correspond to the inlet and outlet, respectively.
A is the total heat transfer area in m2 and Δ T is the log-mean temperature difference, which is defined by Equation (3) as the pinch point of the PCHE occurs on the inlet of cold side.
Δ T = ( T h , i n T c , o u t ) ( T h , o u t T c , i n ) ln ( T h , i n T c , o u t T h , o u t T c , i n )
where T is the temperature of each port on the hot and cold sides in °C.
The average convective heat transfer coefficient h of either the hot or cold side is defined by Equation (4).
h = Q A s i d e | T a v e , w a l l T a v e , f l u i d |
where A s i d e corresponds to either the hot- or cold-side heat transfer area in m2; T a v e , f l u i d is the average fluid temperature of either side in °C; T a v e , w a l l is the average wall temperature in °C and cannot be measured for the narrow structure of the PCHE.
The heat transfer in the PCHE mainly occurs in the vertical flow direction. In a steady state, assuming that the heat transfer from the hot fluid to the cold fluid is linearly distributed along the direction of heat flow at every cross-sectional position, the heat conduction process that occurs in the stainless wall can be simplified to a one-dimensional problem.
A new parameter   T m i d , w a l l can be defined by Equation (5).
T m i d , w a l l = T a v e , h + T a v e , c 2
where T a v e , h and T a v e , c are the hot and the cold average fluid temperature in °C, respectively.
The T a v e , h , w a l l and T a v e , c , w a l l can be calculated by Equation (6).
Q = k T a v e , h , w a l l T m i d , w a l l δ 2 = k T m i d , w a l l T a v e , c , w a l l δ 2
where k is the thermal conductivity of 316 L in W/(m·K), which is a function of temperature; δ is the average heat conduction thickness in m, which can be roughly regarded as the thickness of the plates.
The average dimensionless Reynolds number R e is defined by Equation (7).
R e = ρ u d μ
where ρ is the mean density of the fluid in kg/m3; u is the mean velocity in m/s; d is the hydraulic diameter of the semicircle in m; μ is the mean viscosity of the fluid in Pa·s.
The average dimensionless heat transfer coefficient N u can be calculated by Equation (8).
N u = h d λ
where λ is the average thermal conductivity of the fluid in W/(m·K).

2.3.2. Heat Recovery Efficiency

To evaluate the performance of PCHE as a regenerator, the effectiveness of the heat exchanger is calculated as the heat recovery efficiency η , which is a ratio of the experimental heat transfer rate to the maximum possible heat transfer rate and can be written as Equation (9).
η = Q Q m a x = [ m c ( H c , o u t H c , i n ) + m h ( H h , i n H h , o u t ) ] / 2 m i n ( m h ( H h , i n , P h H c , i n , P h ) ,   m c ( H h , i n , P c H c , i n , P c ) )  
where Q m a x is the smaller one of the ideal heat transfer rates on the hot and cold sides. The subscripts P h and P c indicate that the enthalpy values of the hot inlet and cold inlet are calculated under the hot-side and cold-side pressure conditions, respectively.
As the maximum possible heat transfer rate on the hot side is smaller in experiments, Equation (9) can be further written as Equation (10).
η = [ m c ( H c , o u t H c , i n ) + m h ( H h , i n H h , o u t ) ] / 2 m h ( H h , i n , P h H c , i n , P h )

2.3.3. Pressure Drop Loss and Friction Factor

The measured pressure drop Δ P t o t a l of the test PCHE prototype is composed of multiple parts [7], which can be described as Equation (11).
Δ P t o t a l = Δ P c o r e + Δ P p i p e s + Δ P t u b e   f i t t i n g s + Δ P e l b o w s + Δ P d i v e r s i o n   a r e a s
where Δ P c o r e is the concerned pressure drop of the heat transfer core in kPa; other items include the pressure drop of inlet and outlet connecting pipes, tube fittings, elbows, and diversion areas.
In order to separate the pressure drop of the heat transfer core, an auxiliary single-plate test PCHE prototype is manufactured in Figure 3. The internal channels of the single-plate prototype are straight, in which the pressure loss can be calculated, and the other geometric structures, including external dimensions, diversion area, and internal channels length, are the same as the trapezoidal prototype. As there is only one plate and two ports, it is not possible for heat exchange.
The pressure drop of the heat transfer core can be calculated by Equation (12).
Δ P c o r e = Δ P t r a p e z o i d a l Δ P s i n g l e p l a t e + Δ P s t r a i g h t
where Δ P t r a p e z o i d a l is the experimental pressure drop of the trapezoidal prototype, Δ P s i n g l e p l a t e is the single-plate one under the same experimental conditions, and Δ P s t r a i g h t is the pressure drop in the straight channel, which can usually be ignored.
The friction factor f can be calculated by Equation (13).
f = 2 Δ P c o r e d ρ l u 2
where l is the length of the trapezoidal channel in m.

2.4. Uncertainty Analysis

For an indirect measurement composed of several independent direct measurements, the uncertainty of a single measurement is transferred according to Equation (14).
u R = i = 1 N ( f x i ) 2 ( u x i ) 2
where u x i is the uncertainty of the No. i measurement ( 1 i N ).
The errors of the prototype geometric size parameters are ignored here. The direct measurements in this test are mainly temperature, pressure, pressure loss, and mass flow rate. Their measuring instruments and accuracy are shown in Table 2. The maximum relative uncertainties of the calculated parameters are shown in Table 3.

3. Results and Analysis

3.1. Heat Transfer Performance

3.1.1. Overall Heat Transfer Coefficient

The overall heat transfer coefficient is introduced to evaluate the performance of the PCHE prototype. As the heat transfer area of the hot side is twice as large as the cold side, the U h is one-half of the U c when the energy balance is reached. The effects of the inlet temperature on both sides, the working pressure, and the mass flow rate on the cold overall heat transfer coefficient are shown in Figure 4. The U c slightly increases from 1.48 kW/(m2·K) and 1.59 kW/(m2·K) to 1.71 kW/(m2·K) and 1.67 kW/(m2·K) with the cold inlet temperature rising from 40 °C to 100 °C and the hot inlet temperature rising from 200 °C to 400 °C, respectively. This seems to indicate that the cold-side inlet temperature has a slightly greater effect on heat transfer than the hot side. As for the influences of the working pressure, it approximately linearly increases from 1.55 kW/(m2·K) to 2.10 kW/(m2·K) with the pressure increase from 7.5 MPa to 12 MPa. When the flow rate is increased by three times from 20 kg/h to 60 kg/h, U c is increased by more than 2 times from 1.18 kW/(m2·K) to 2.53 kW/(m2·K).

3.1.2. Average Convective Heat Transfer Coefficient

The average convective heat transfer coefficient is used to analyze the heat transfer characteristics of sCO2 on one side. The thermal resistance analysis method is described as Equation (15) [7], which is used to verify the calculation results of Equations (4)–(7).
1 U c A c = 1 h c A c + r w + r s + 1 h h A h
where r w and r s are the thermal conduction resistance and the fouling resistance, respectively. As the plates have good thermal conductivity and are clean enough, they can be ignored.
The verification is shown in Figure 5. The deviation between the calculated results and the thermal resistance analysis values does not exceed 5%, which proves the feasibility of the method.
As shown in Equations (16) and (17), dimensionless Nusselt numbers are calculated and fitted the correlations with the average Reynolds numbers and Prandtl numbers on the cold and the hot sides, respectively.
On the cold side:
N u c = 0.8937 R e c 0.5176 P r c 0.1106
[ 10 , 000 R e c 30 , 000 0.91 P r c 1.61 ]
On the hot side:
N u h = 0.1817 R e h 0.6741 P r h 0.6980
[ 4800 R e h 14 , 000 0.77 P r h 0.98 ]
Figure 6 reflects the difference between the correlations and the experimental results. All the correlations values are within a 15% deviation with the experimental results, and the 92% and 86% values are within a 10% deviation on the cold and the hot sides, respectively.

3.2. Heat Recovery Efficiency and Pressure Drop

The heat recovery efficiency represents the ability of a regenerator to recover the energy, while the pressure drop reflects the influence of a regenerator on the hydraulic performance of the power cycle. Detailed analysis has been performed on the PCHE prototype under different temperature, pressure, and mass flow rate test conditions.
Figure 7 shows the effects of the inlet temperature on the efficiency and pressure drop of the PCHE. With the cold inlet temperature increasing from 40 °C to 100 °C in Figure 7a, the heat recovery efficiency significant increases from 57.85% to 63.61%. The main reason for the generally low heat recovery efficiency is that the size of the prototype is small and the heat transfer area is limited. The cold pressure drop increases from 1.61 kPa to 4.13 kPa, and especially rises significantly at 40 °C due to the drastic change in properties of sCO2 in Figure 7c,d. The hot pressure drop remains almost stable at about 1.50 kPa. When the hot inlet temperature rises from 200 °C to 400 °C in Figure 7b, the efficiency rises slightly from 60.73% to 62.99%, and the pressure drop increases linearly regardless of the cold or the hot side. The main reason is that the difference in physical properties on both sides is small in the high-temperature zone, and the heat load matching is better.
Figure 8 shows the effects of the working pressure and the mass flow rate on the efficiency and pressure drop of the PCHE. The change in heat recovery efficiency is not obvious with the working pressure increasing from 7.50 MPa to 12 MPa in Figure 8a, while the pressure drop decreases by 58.51% and 53.41% on the cold and the hot side, respectively. It can be concluded that increasing the working pressure is helpful to reduce the pressure loss and improve the cycle performance. The opposite effect appears when increasing the mass flow rate from 20 kg/h to 60 kg/h in Figure 8b. The pressure drop on the cold side and hot side increases by 8 times and 10 times, respectively. In addition, the heat recovery efficiency decreases from 63.10% to 55.61%, which indicates that the mass flow should be selected as small as possible within the allowable range to obtain a higher heat recovery efficiency and lower pressure loss in the real operation process.

4. Simulation Verification

4.1. Model and Mesh

A three-dimensional CFD model is established in ANSYS software for numerical simulation verification, which is the same as the internal heat transfer unit of the test trapezoidal prototype. As shown in Figure 9, the model unit size is 2.50 mm × 4.50 mm × 120 mm, including two hot channels on the top and bottom and a cold channel in the middle. An unstructured tetrahedral mesh is selected for the complicated channel bending, and the k–ω SST turbulence model is used due to low-Reynolds-number conditions and many swirling flows [2]. The y plus parameter used for the first layer grid setting is selected as 1 in order to accurately reflect the flow and heat transfer performance near the wall. The mass flow inlet conditions are applied to the hot and cold inlets, and the pressure outlet conditions are used to the outlets. The top, bottom, and walls are under adiabatic conditions, and both sides are under symmetry conditions [25]. Their boundary condition parameters are shown in Table 4.
Five sets of grids are divided to verify the grid independence varying from 610,000 to 4,450,000. The outlet temperature and the pressure drop on both sides are compared in Table 5. When the number of grids exceeds 2,240,000, the parameters for comparison on both sides remain basically stable. The outlet temperature and the pressure drop fluctuate within 0.08% and 0.91%, respectively. It is preferred to select the 2,240,000 grids considering the cost of computing resources.

4.2. Verification with Experimental Results

As shown in Figure 10, the simulation work takes the inlet temperature of the hot and cold sides as variables, respectively, to analyze the outlet temperature and the pressure drop on both sides. The outlet temperature of the cold side of the simulation and experimental results are in good agreement with each other except at the point of 40 °C due to the drastic changes in physical properties in Figure 10a. The maximum deviation between the other simulated outlet temperature and the experimental value is 2.80% and 7.92% on the cold and the hot side, respectively. The pressure drop changes in a consistent trend in Figure 10b, with the maximum deviations of 9.22% and 24.54% on the cold and the hot side, respectively. The larger deviation on the hot side may be due to the roughness of the hot plate channels exceeding the design requirements. When changing the inlet temperature of the hot side in Figure 10c,d, the maximum deviation of the outlet temperature is reduced to 2.54% and 7.39%, and the maximum pressure drop deviation is significantly reduced to 2.20% and 18.45% on the cold and the hot side, respectively. Considering the influence caused by the plate processing, it is reasonable that the simulation model can accurately reflect the experimental situations.
Figure 11 shows the contours of the three flow channels, and seven cross-sections perpendicular to the inlet flow direction are divided. Among them, z = 0 mm and z = 120 mm are the inlet and outlet of the whole model; z = 10 mm and z = 110 mm are the connections between the straight channels and the trapezoidal channels on both sides; z = 35 mm, 60 mm, and 85 mm are 1/4, 1/2, and 3/4 of the total length of the trapezoidal channels, respectively. Although the temperature distribution of both hot and cold channels is uneven in the initial quarter of the flow, with the development of heat transfer, a relatively uniform temperature in the cross-sections can be presented after more than half of the process.

4.3. Low Reynolds Number Expansion

Due to the fluctuations caused by pump operation, it is difficult to accurately measure the heat transfer parameters when the inlet mass flow rate is less than 15 kg/h in the circulation loop. The above-verified numerical simulation model can effectively solve this problem, thereby extending the Nusselt number correlations to a lower Reynolds number range. The extended simulation works select four mass flow conditions of 15 kg/h, 12.50 kg/h, 10 kg/h, and 7.50 kg/h to calculate the flow and heat transfer performance below the Reynolds number range in Equations (16) and (17), as shown in Table 6. As the study by My et al. [1] showed that the Reynolds number corresponding to the transition from laminar flow to turbulent flow is 1700 in the PCHE channel, the lowest Reynolds number selected in the extended simulations is 1821 in order to make the turbulence model valid. The inlet temperature and pressure are 70 °C, 8.50 MPa and 200 °C, 8 MPa on the cold and the hot side, respectively.
The deviations between the expanded results and Equations (16) and (17) exceed 22% and 18%, respectively. Therefore, new Nusselt number correlations for the extended Reynolds number range are, respectively, proposed on the cold and the hot side, as shown in Equations (18) and (19).
On the cold side:
N u c = 0.1232 R e c 0.7193 P r c 0.1007
[ 3796 R e c 30 , 000 0.91 P r c 1.61 ]
On the hot side:
N u h = 0.0501 R e h 0.8131 P r h 0.5540
[ 1821 R e h 14 , 000 0.77 P r h 0.98 ]
The deviation of new correlations with all experimental and extended numerical simulation results are within 16%, and 85% of the data on both cold and hot side deviate within 10%, as shown in Figure 12.
Finally, Table 7 shows a comparison of the experimental heat transfer correlations for the straight, zigzag, S-shape, airfoil, and trapezoid-structure PCHE using sCO2 as the working fluid. This work complements the heat transfer correlations of the trapezoidal-channel PCHE.

5. Conclusions

In this work, a lab-scale trapezoidal PCHE prototype with two hot plates and one cold plate is experimentally studied as a regenerator of the sCO2 test loop. The thermal–hydraulic performance is analyzed with respect to the inlet temperature on both sides, the working pressure, and the mass flow rate, and the pressure drop of the trapezoidal channels is divided using a single-plate straight prototype.
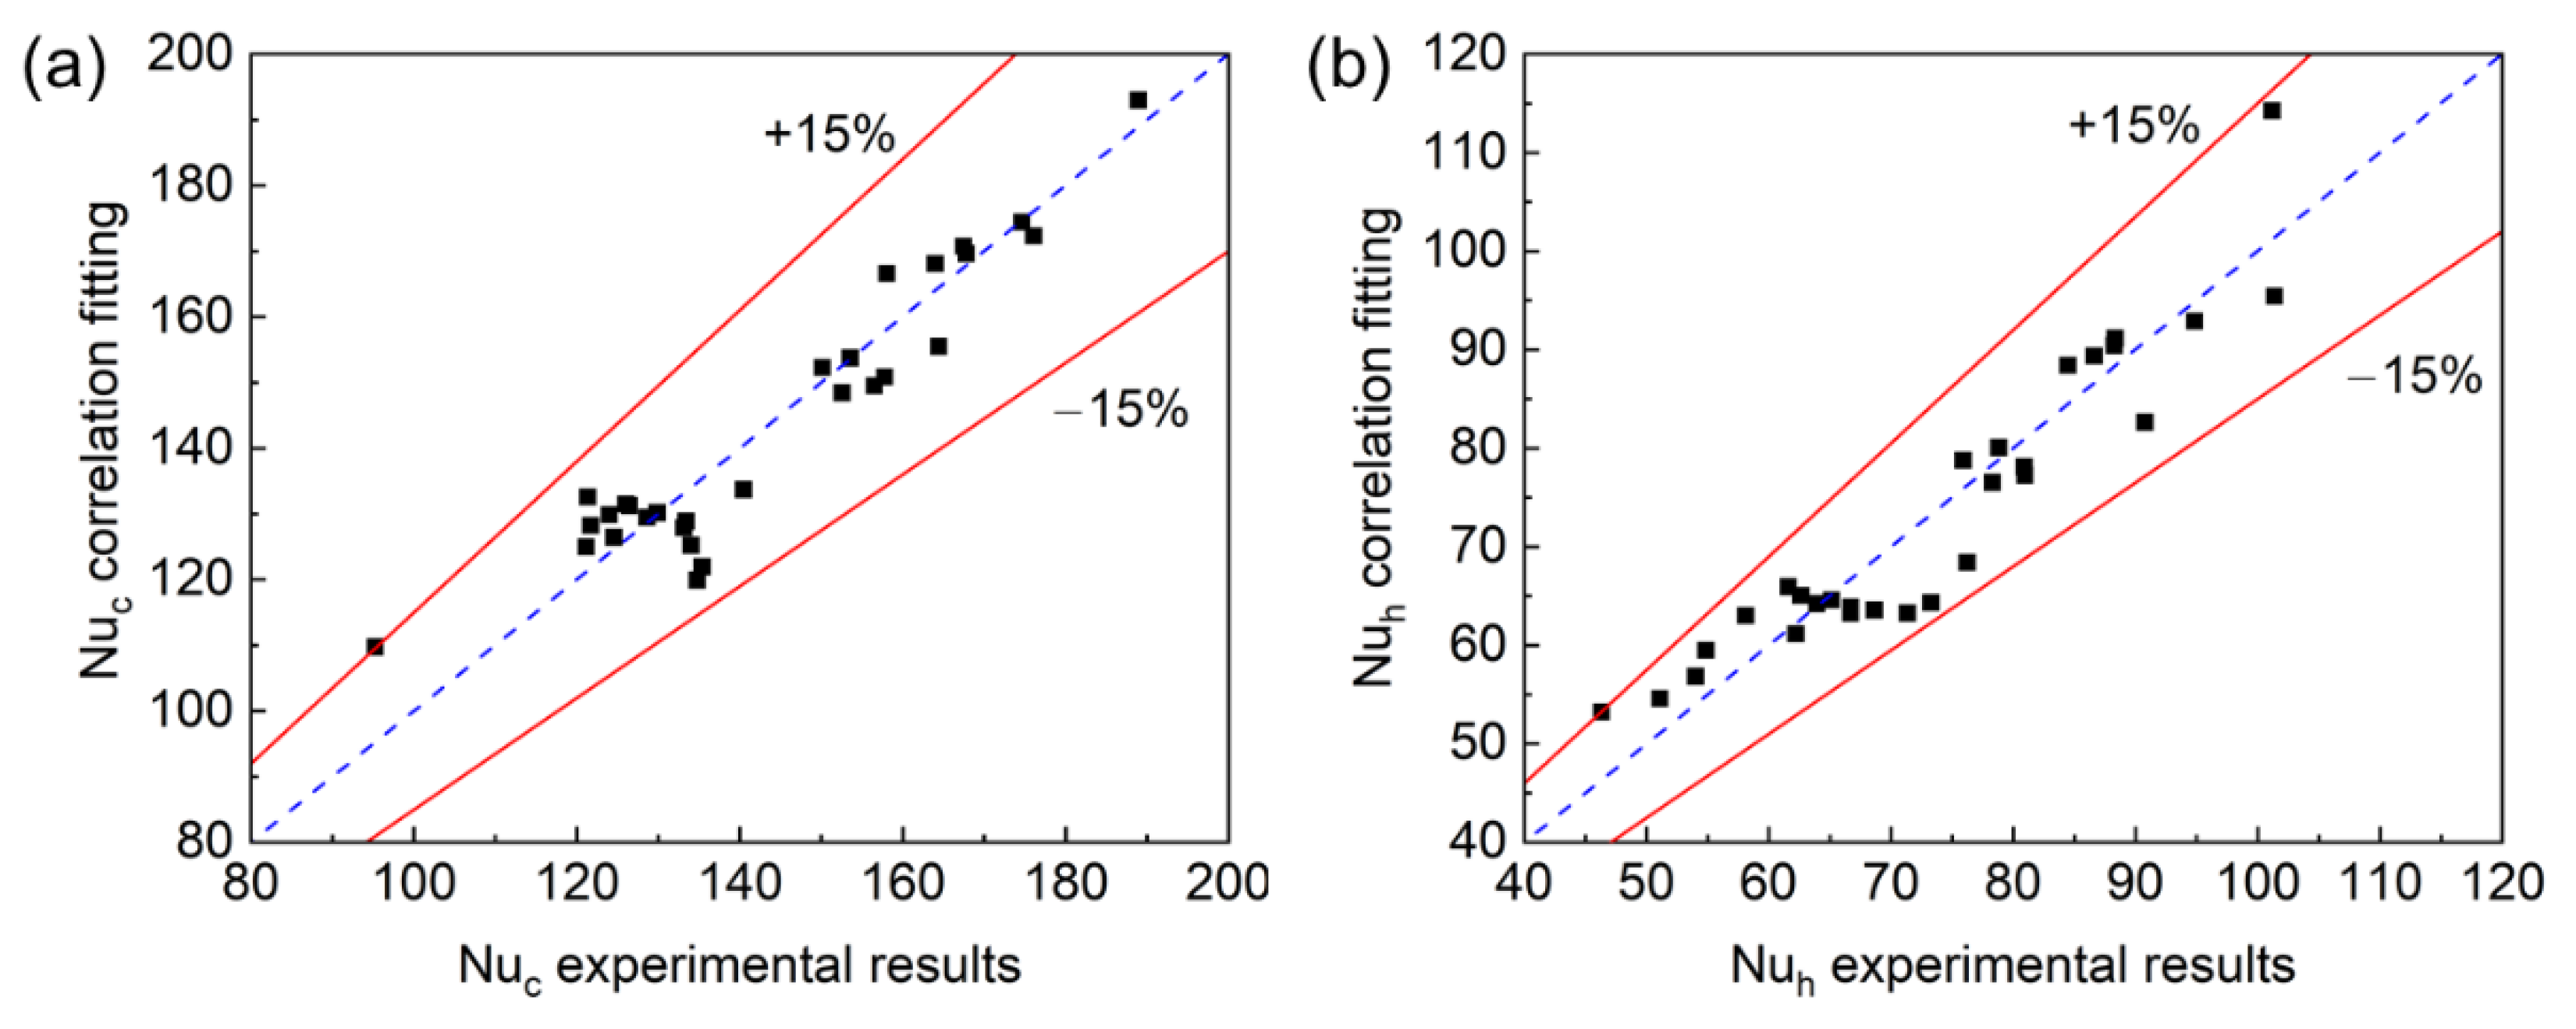
The overall heat transfer coefficient defined by the cold side exceeds 1.10 kW/(m2·K) and reaches a maximum of 2.53 kW/(m2·K) under the test conditions. The average heat transfer coefficient on either side is calculated by defining a new parameter T m i d , w a l l , and the results are verified by the thermal resistance analysis with a deviation within 5%. The correlations of the Nusselt numbers are proposed on both sides, with the Reynolds numbers ranging from 10,000 to 30,000 and 4800 to 14,000, and the Prandtl numbers ranging from 0.91 to 1.61 and 0.77 to 0.98 on the cold side and hot side, respectively. All experimental results are within a 15% deviation with the correlations, and 92% and 86% values are within a 10% deviation on the cold and the hot sides, respectively.
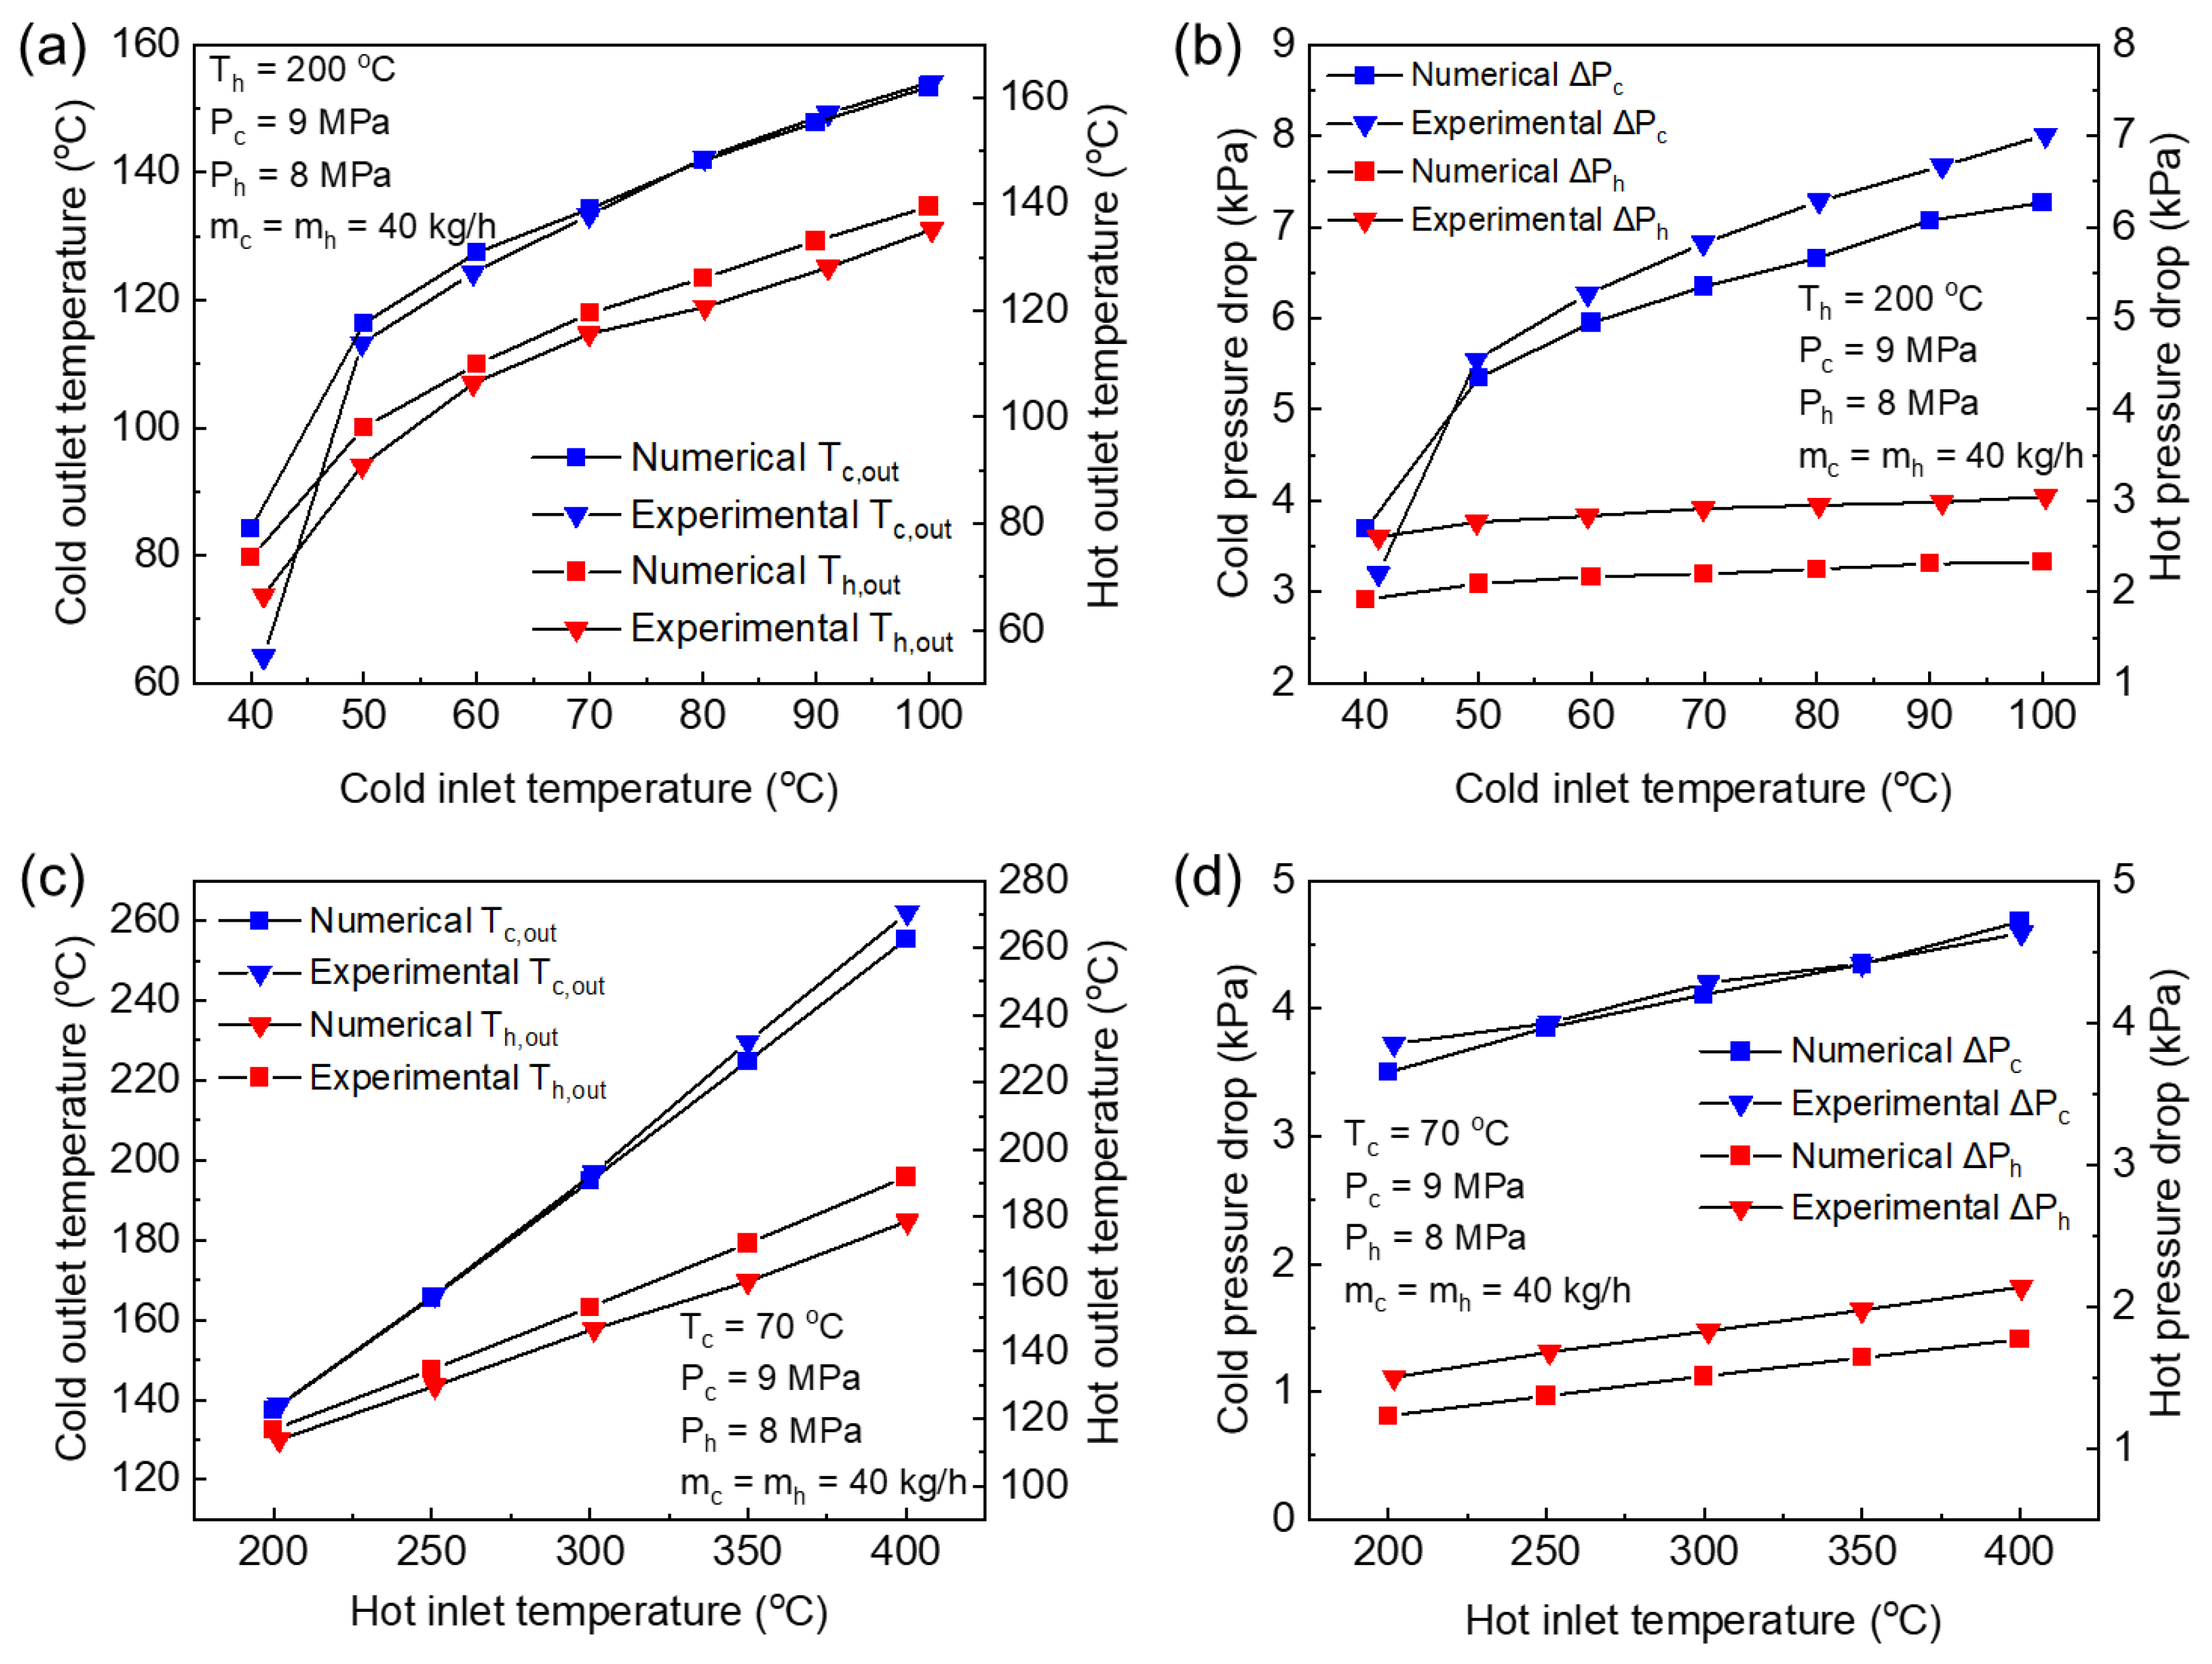
The pressure drop of the heat transfer core is separated from the measured pressure drop with the help of a single-plate prototype. The pressure drop on the hot and the cold side is less than 7 kPa and 15 kPa under test conditions, respectively. The heat recovery efficiency is defined to evaluate the performance of the PCHE as a regenerator. It decreases with the increase in mass flow rate, and basically remains unchanged with the increase in inlet temperature and working pressure.
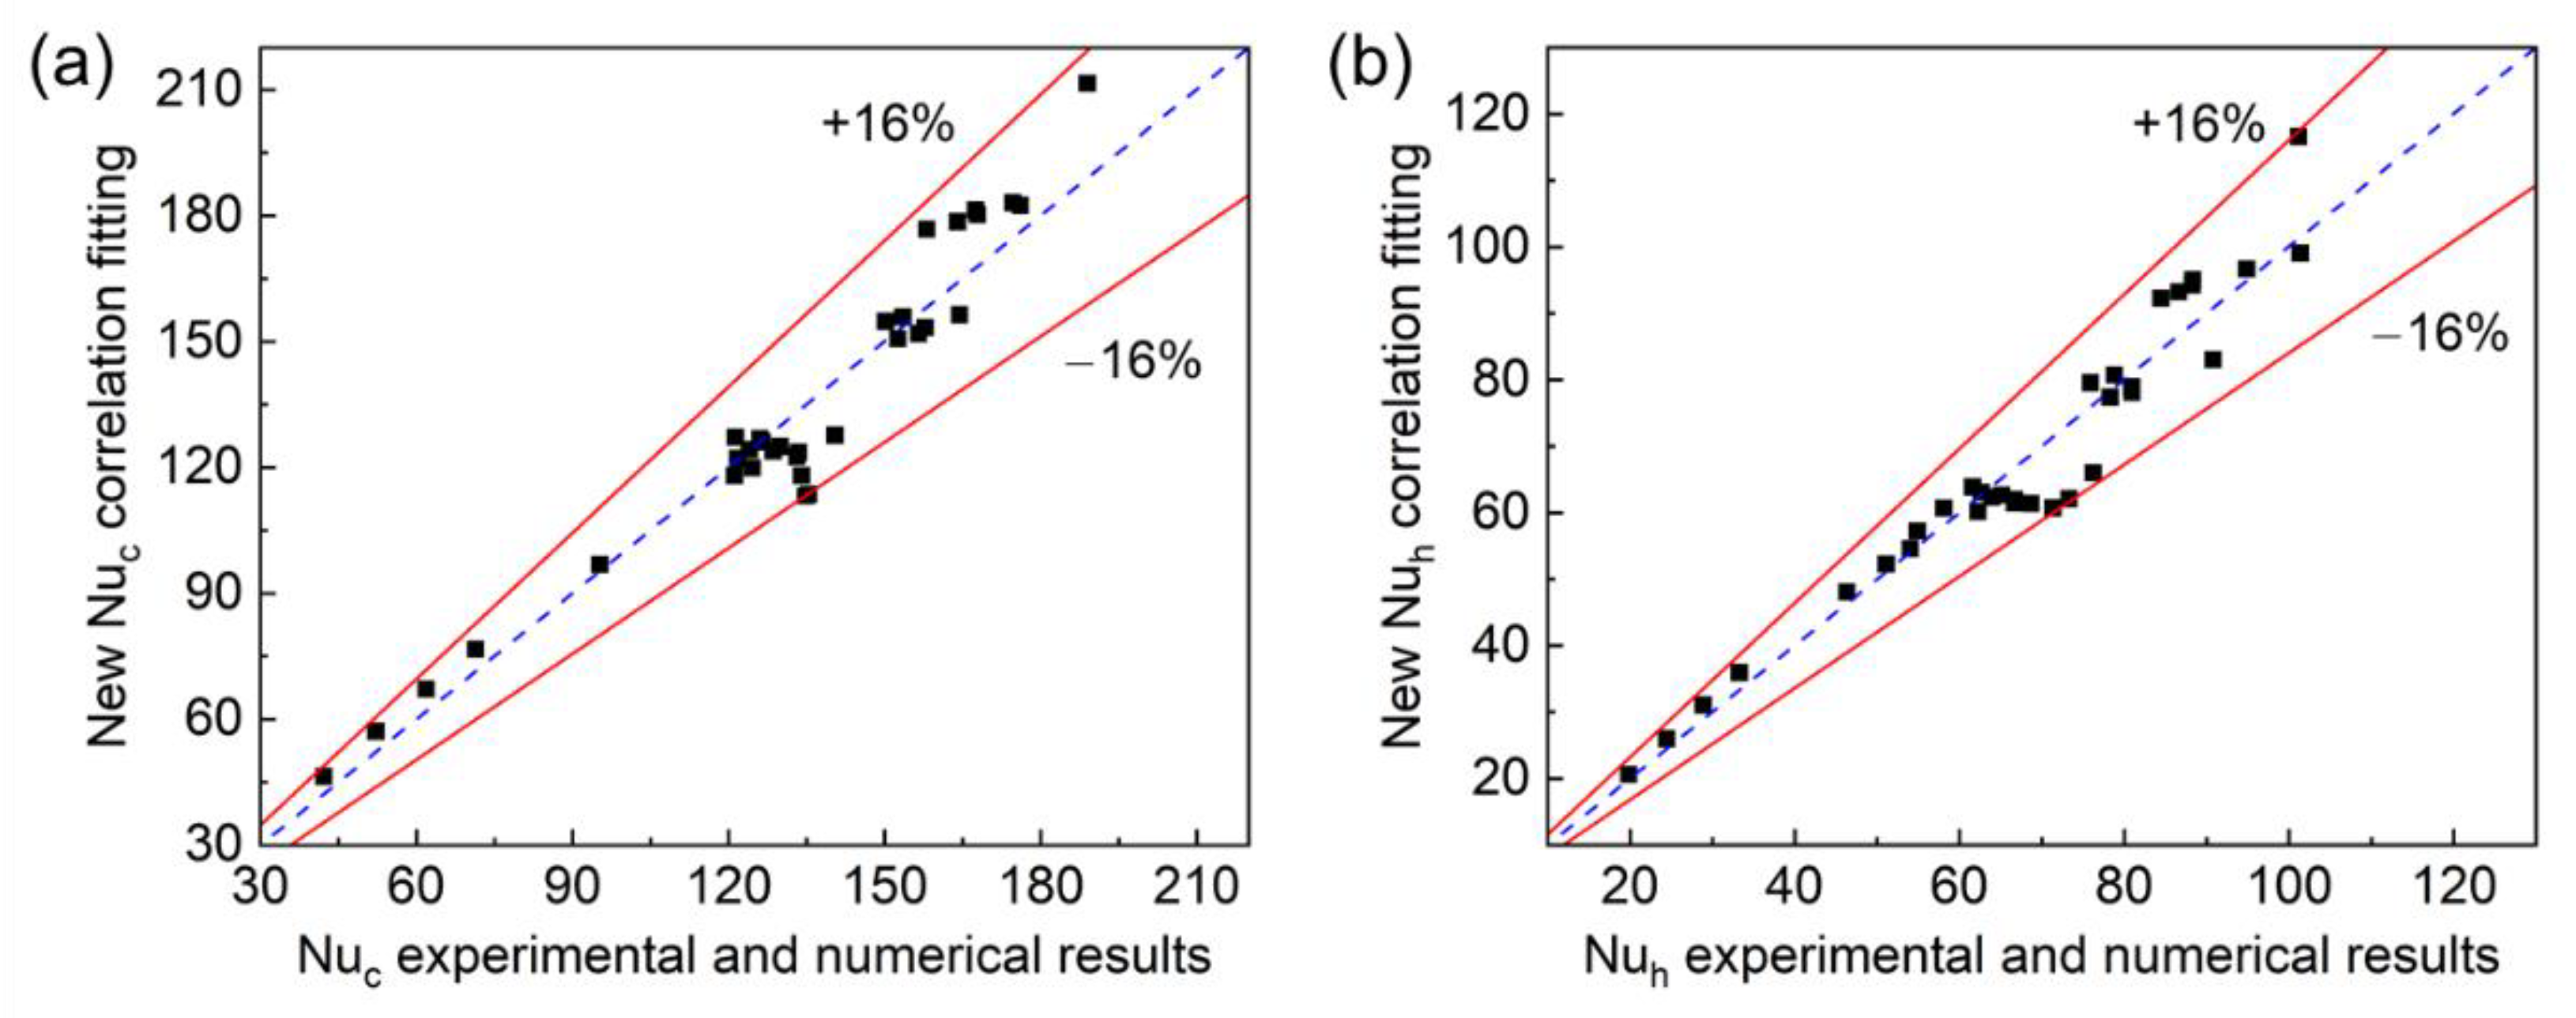
A simulation model is established for verification and expansion. It has been proven to reflect the experimental results well with a maximum temperature deviation of 2.80% and 7.92% on the cold and hot side, respectively. Extended simulations of low-Reynolds-number conditions are studied based on the model; new Nusselt number correlations are obtained with the Reynolds numbers ranging from 3796 to 30,000 and 1821 to 14,000, on the cold side and hot side, respectively; the extended correlations are within a 16% deviation with all numerical and experimental results.

Author Contributions

Conceptualization, Y.J. and G.X.; data curation, Y.J.; funding acquisition, Z.Y. and G.X.; investigation, Y.J., M.W. and Y.L.; methodology, Y.J. and Z.W.; project administration, P.Z., S.M. and G.X.; software, Y.J. and Z.W.; supervision, P.Z., S.M. and G.X.; validation, Z.W., M.W. and Y.L.; writing—original draft, Y.J.; writing—review and editing, H.X. and G.X. All authors have read and agreed to the published version of the manuscript.

Funding

This research was funded by the Zhejiang Provincial Key R&D Program (grant number NO. 2022C01043) and the Zhejiang Provincial Natural Science Foundation (grant number NO. LR20E060001).

Institutional Review Board Statement

Not applicable.

Informed Consent Statement

Not applicable.

Data Availability Statement

Not applicable.

Conflicts of Interest

The authors declare no conflict of interest.

Nomenclature

Abbreviation
sCO2Supercritical carbon dioxide
PCHEPrinted circuit heat exchanger
HTHFHigh-temperature helium test facility
PDFProbability density function
KAISTKorea Advanced Institute of Science and Technology
KAIST-HXDA PCHE design code developed by KAIST
NACANational Advisory Committee for Aeronautics
CFDComputational Fluid Dynamics
Roman alphabet
ATotal heat transfer area, m2
dHydraulic diameter of the semicircle, m
fFriction factor
HEnthalpy, kJ/kg
hAverage convective heat transfer coefficient, kW/(m2·K)
kThermal conductivity of 316 L, W/(m·K)
lLength of trapezoidal channel, m
mMass flow rate, kg/s
NuNusselt number
PrPrandtl number
ΔPPressure drop, kPa
QHeat transfer rate, kW
ReReynolds number
rThermal resistance
TTemperature, °C
ΔTLog-mean temperature difference, °C
UOverall heat transfer coefficient, kW/(m2·K)
uMean velocity, m/s
uRUncertainty of an indirect measurement
uxUncertainty of a direct measurement
Greek symbols
δAverage heat conduction thickness, m
ηHeat recovery efficiency
λAverage thermal conductivity of fluid, W/(m·K)
μMean viscosity, Pa·s
ρMean density, kg/m3
Subscripts
cCold side value
hHot side value
inInlet value
outOutlet value
aveAverage value
wallChannel wall value
fluidFluid value
midMiddle value between hot and cold channels
PhHot-side pressure value
PcCold-side pressure value
coreHeat transfer core
totalMeasured
pipesPressure drop in pipes
tube fittingsPressure drop in tube fittings
elbowsPressure drop in elbows
diversion areasPressure drop in diversion areas
trapezoidalPressure drop of trapezoidal prototype
single-platePressure drop of single-plate prototype
straightPressure drop in straight channel
iNumber of the direct measurement
wThermal conduction resistance in wall
sFouling resistance

References

  1. Mylavarapu, S.K.; Sun, X.; Glosup, R.E.; Christensen, R.N.; Patterson, M.W. Thermal hydraulic performance testing of printed circuit heat exchangers in a high-temperature helium test facility. Appl. Therm. Eng. 2014, 65, 605–614. [Google Scholar] [CrossRef]
  2. Li, H.; Zhang, Y.; Zhang, L.; Yao, M.; Kruizenga, A.; Anderson, M. PDF-based modeling on the turbulent convection heat transfer of supercritical CO2 in the printed circuit heat exchangers for the supercritical CO2 Brayton cycle. Int. J. Heat Mass Transf. 2016, 98, 204–218. [Google Scholar] [CrossRef]
  3. Chen, M.; Sun, X.; Christensen, R.N.; Shi, S.; Skavdahl, I.; Utgikar, V.; Sabharwall, P. Experimental and numerical study of a printed circuit heat exchanger. Ann. Nucl. Energy 2016, 97, 221–231. [Google Scholar] [CrossRef] [Green Version]
  4. Shin, C.W.; NO, H.C. Experimental study for pressure drop and flow instability of two-phase flow in the PCHE-type steam generator for SMRs. Nucl. Eng. Des. 2017, 318, 109–118. [Google Scholar] [CrossRef]
  5. Chu, W.; Li, X.; Ma, T.; Chen, Y.; Wang, Q. Experimental investigation on SCO2-water heat transfer characteristics in a printed circuit heat exchanger with straight channels. Int. J. Heat Mass Transf. 2017, 113, 184–194. [Google Scholar] [CrossRef]
  6. Xu, A.; Huang, Y.; Wang, J. An experimental study on a straight-channel printed circuit heat exchanger for supercritical CO2 power cycle applications. In Proceedings of the 2018 26th International Conference on Nuclear Engineering (ICONE26), London, UK, 22–26 July 2018. ICONE26-81588. [Google Scholar] [CrossRef]
  7. Park, J.H.; Kwon, J.G.; Kim, T.H.; Kim, M.H.; Cha, J.; Jo, H. Experimental study of a straight channel printed circuit heat exchanger on supercritical CO2 near the critical point with water cooling. Int. J. Heat Mass Transf. 2020, 150, 119364. [Google Scholar] [CrossRef]
  8. Arslan, F.; Guzel, B. Numerical and experimental thermal-hydraulic performance analysis of a supercritical CO2 Brayton cycle PCHE recuperator. Arab. J. Sci. Eng. 2021, 46, 7543–7556. [Google Scholar] [CrossRef]
  9. Nikitin, K.; Kato, Y.; Ngo, L. Printed circuit heat exchanger thermal–hydraulic performance in supercritical CO2 experimental loop. Int. J. Refrig. 2006, 29, 807–814. [Google Scholar] [CrossRef]
  10. Kim, I.H.; No, H.C.; Lee, J.I.; Jeon, B.G. Thermal hydraulic performance analysis of the printed circuit heat exchanger using a helium test facility and CFD simulations. Nucl. Eng. Des. 2009, 239, 2399–2408. [Google Scholar] [CrossRef]
  11. Kim, I.H.; No, H.C. Thermal hydraulic performance analysis of a printed circuit heat exchanger using a helium–water test loop and numerical simulations. Appl. Therm. Eng. 2011, 31, 4064–4073. [Google Scholar] [CrossRef]
  12. Kim, I.H.; No, H.C. Thermal–hydraulic physical models for a printed circuit heat exchanger covering He, He–CO2 mixture, and water fluids using experimental data and CFD. Exp. Therm. Fluid Sci. 2013, 48, 213–221. [Google Scholar] [CrossRef]
  13. Baik, S.; Kim, S.G.; Bae, S.G.; Ahn, Y.; Lee, J.; Lee, J.I. Preliminary experimental study of precooler in supercritical CO2 Brayton cycle. In Proceedings of the ASME Turbo Expo 2015: Turbine Technical Conference and Exposition (GT2015), Montréal, QC, Canada, 15–19 June 2015. GT2015-42915. [Google Scholar] [CrossRef]
  14. Dai, Z.; Zheng, Z.; Fletcher, D.F.; Haynes, B.S. Experimental study of transient behaviour of laminar flow in zigzag semi-circular microchannels. Exp. Therm. Fluid Sci. 2015, 68, 644–651. [Google Scholar] [CrossRef]
  15. Bae, S.J.; Kwon, J.; Kim, S.G.; Son, I.; Lee, J.I. Condensation heat transfer and multi-phase pressure drop of CO2 near the critical point in a printed circuit heat exchanger. Int. J. Heat Mass Transf. 2019, 129, 1206–1221. [Google Scholar] [CrossRef]
  16. Zhou, J.; Cheng, K.; Zhang, H.; Liu, B.; Huai, X.; Guo, J.; Zhang, H.; Cui, X. Test platform and experimental test on 100 kW class printed circuit heat exchanger for supercritical CO2 Brayton cycle. Int. J. Heat Mass Transf. 2020, 148, 118540. [Google Scholar] [CrossRef]
  17. Cheng, K.; Zhou, J.; Zhang, H.; Huai, X.; Guo, J. Experimental investigation of thermal-hydraulic characteristics of a printed circuit heat exchanger used as a pre-cooler for the supercritical CO2 Brayton cycle. Appl. Therm. Eng. 2020, 171, 115116. [Google Scholar] [CrossRef]
  18. Cheng, K.; Zhou, J.; Huai, X.; Guo, J. Experimental exergy analysis of a printed circuit heat exchanger for supercritical carbon dioxide Brayton cycles. Appl. Therm. Eng. 2021, 192, 116882. [Google Scholar] [CrossRef]
  19. Zhang, H.; Cheng, K.; Huai, X.; Zhou, J.; Guo, J. Experimental and numerical study of an 80-kW zigzag printed circuit heat exchanger for supercritical CO2 Brayton cycle. J. Therm. Sci. 2021, 30, 1289–1301. [Google Scholar] [CrossRef]
  20. Ngo, T.L.; Kato, Y.; Nikitin, K.; Tsuzuki, N. New printed circuit heat exchanger with S-shaped fins for hot water supplier. Exp. Therm. Fluid Sci. 2006, 30, 811–819. [Google Scholar] [CrossRef]
  21. Ngo, T.L.; Kato, Y.; Nikitin, K.; Ishizuka, T. Heat transfer and pressure drop correlations of microchannel heat exchangers with S-shaped and zigzag fins for carbon dioxide cycles. Exp. Therm. Fluid Sci. 2007, 32, 560–570. [Google Scholar] [CrossRef]
  22. Pidaparti, S.R.; Anderson, M.H.; Ranjan, D. Experimental investigation of thermal-hydraulic performance of discontinuous fin printed circuit heat exchangers for supercritical CO2 power cycles. Exp. Therm. Fluid Sci. 2019, 106, 119–129. [Google Scholar] [CrossRef]
  23. Aneesh, A.M.; Sharma, A.; Srivastava, A.; Chaudhury, P. Effects of wavy channel configurations on thermal-hydraulic characteristics of printed circuit heat exchanger (PCHE). Int. J. Heat Mass Transf. 2018, 118, 304–315. [Google Scholar] [CrossRef]
  24. Xing, K.; Xiao, G.; Xu, H.; Ji, Y. Experimental and numerical investigation on the dynamic characteristics of a lab-scale transcritical CO2 loop. Energy Conv. Manag. 2021, 245, 114384. [Google Scholar] [CrossRef]
  25. Ji, Y.; Xing, K.; Cen, K.; Ni, M.; Xu, H.; Xiao, G. Numerical study on flow and heat transfer characteristics of trapezoidal printed circuit heat exchanger. Micromachines 2021, 12, 1589. [Google Scholar] [CrossRef]
  26. Kim, S.G.; Lee, Y.; Ahn, Y.; Lee, J.I. CFD aided approach to design printed circuit heat exchangers for supercritical CO2 Brayton cycle application. Ann. Nucl. Energy 2016, 92, 175–185. [Google Scholar] [CrossRef]
Figure 1. Schematic of the sCO2 heat transfer and circulation test loop.
Energies 15 04940 g001
Figure 2. The test trapezoidal PCHE prototype and its channel geometric parameters.
Energies 15 04940 g002
Figure 3. Single-plate test PCHE prototype with straight channels.
Energies 15 04940 g003
Figure 4. The effects of (a) cold inlet temperature, (b) hot inlet temperature, (c) working pressure, and (d) mass flow rate on the cold overall heat transfer coefficient.
Energies 15 04940 g004
Figure 5. The verification of the thermal resistance analysis method.
Energies 15 04940 g005
Figure 6. The difference between the correlations and the experimental results on (a) the cold side and (b) the hot side.
Energies 15 04940 g006
Figure 7. The effects of (a) the cold inlet temperature and (b) the hot inlet temperature on the efficiency and pressure drop, and the change in (c) Cp and (d) density under both sides of working pressure.
Energies 15 04940 g007
Figure 8. The effects of (a) the working pressure and (b) the mass flow rate on the efficiency and pressure drop.
Energies 15 04940 g008
Figure 9. The model unit and boundary conditions.
Energies 15 04940 g009
Figure 10. Comparison of simulation and experimental results of (a,c) outlet temperature and (b,d) pressure drop on both sides.
Energies 15 04940 g010
Figure 11. The contours of the three flow channels and seven cross-sections.
Energies 15 04940 g011
Figure 12. The difference between the new correlations and the experimental and numerical results on (a) the cold side and (b) the hot side.
Energies 15 04940 g012
Table 1. The experimental test conditions.
ParametersHot SideCold Side
Inlet temperature, °C200–40040–100
Inlet pressure, MPa7.50–128.25–12.75
Mass flow rate, kg/h20–6020–60
Reynolds number range4800–14,00010,000–30,000
Table 2. The direct measuring instruments and accuracy.
ParametersPositionInstrumentsManufacturerTypeRangeMax Error
Mass flow ratePump outletCoriolis flowmeterRheonikRHM 030~300 kg/h0.20%
TemperaturePreheat outletPT100SinomeasureWZP-Pt100−50~200 °CA level
TemperaturePCHE cold inletK-type thermocoupleOmegaTJ36-CAIN-14U-6-CC-XSIB0~1150 °C0.75%
TemperaturePCHE cold outletK-type thermocoupleOmegaTJ36-CAIN-14U-6-CC-XSIB0~1150 °C0.75%
TemperaturePCHE hot inletK-type thermocoupleOmegaTJ36-CAIN-14U-6-CC-XSIB0~1150 °C0.75%
TemperaturePCHE hot outletK-type thermocoupleOmegaTJ36-CAIN-14U-6-CC-XSIB0~1150 °C0.75%
Pressure lossPCHE cold sideDifferential pressure sensorCEOPACPS843M0~500 kPa0.10%
Pressure lossPCHE hot sideDifferential pressure sensorCEOPACPS843M0~500 kPa0.10%
Table 3. The maximum relative uncertainties of the calculated parameters.
ParametersUNuReHeat Recovery EfficiencyPressure Drop
The maximum relative uncertainty5.06%6.34%4.86%5.24%0.14%
Table 4. Boundary condition parameters for simulation works.
Mass Flow Rate, kg/hPressure, MPaInlet Temperature, °C
Hot side408200–400
Cold side40940–100
Table 5. The grid independence results.
Number of Grids,
×104
Outlet Temperature, °CPressure Drop, kPa
Cold SideHot SideCold SideHot Side
61132.98120.756.612.31
164133.83120.016.472.23
224134.31119.556.352.20
347134.42119.516.342.18
445134.51119.486.332.18
Table 6. The extended simulation conditions.
Mass Flow Rate, kg/hCold Average Reynolds NumberHot Average Reynolds Number
7.5037961821
1050702424
12.5063463026
1576223628
Table 7. Comparison of the heat transfer correlations.
ChannelCorrelationRangeMethodReference
Straight N u b , p d f = C R e b , p d f m P r b , p d f n ( ρ w ρ b , p f ) p ( c ¯ p , p d f c p , b , p d f ) q -Experiment and simulationLi et al. [2]
Zigzag N u = ( 0.0292 ± 0.0015 ) R e 0.8742 ± 0.0050 2000 < R e < 58 , 000 ;  
0.7 < P r < 1.0
ExperimentKim et al. [26]
N u = 0.1696 R e 0.629 P r 0.317 3500 < R e < 23 , 000 ;
0.75 < P r < 2.2
ExperimentNgo et al. [21]
S-shape N u = 0.1740 R e 0.593 P r 0.430 3500 < R e < 23 , 000 ;
0.75 < P r < 2.2
ExperimentNgo et al. [21]
Airfoil N u = 0.0601 R e 0.7326 P r 0.3453 4000 < R e < 37 , 000 ;
1.35 < P r < 25
ExperimentPidaparti et al. [22]
Trapezoid N u c = 0.1232 R e c 0.7193 P r c 0.1007
N u h = 0.0501 R e h 0.8131 P r h 0.5540
[ 3796 R e c 30 , 000 0.91 P r c 1.61 ]
[ 1821 R e h 14 , 000 0.77 P r h 0.98 ]
ExperimentThis work
Publisher’s Note: MDPI stays neutral with regard to jurisdictional claims in published maps and institutional affiliations.

