Article

A Novel Hybrid MPPT Technique Based on Harris Hawk Optimization (HHO) and Perturb and Observer (P&O) under Partial and Complex Partial Shading Conditions

1
Department of Electrical and Computer Engineering, COMSATS University Islamabad, Lahore 54000, Pakistan
2
Department of Computer Engineering, Balochistan University of Information Technology, Engineering and Management Sciences, Quetta 87300, Pakistan
3
Department of Software Engineering, Balochistan University of Information Technology, Engineering and Management Sciences, Quetta 87300, Pakistan
4
School of Artificial Intelligence, University of Chinese Academy of Sciences, Beijing 100049, China
*
Authors to whom correspondence should be addressed.
Submission received: 17 June 2022 / Revised: 20 July 2022 / Accepted: 27 July 2022 / Published: 30 July 2022

Abstract

:
Photovoltaic (PV) systems have been used extensively worldwide over the past few years due to the mitigation of fossils fuels; it is the best source because of its eco-friendly nature. In PV systems, the main research area concerns its performance under partial shading (PS) and complex partial shading (CPS) conditions. PV sources perform perfectly under ideal conditions, but under practical conditions, their performance depends upon many factors, including shading conditions, temperature, irradiance, and the angle of inclination, which can bring a photovoltaic or solar system into a PS or CPS condition. In these conditions, many power peaks appear, and it is hard to find the global peak among many local peaks. The ability to track the maximum power peak and maintain it to avoid fluctuations depends on the maximum power point tracking (MPPT) technique used in a photovoltaic system. This article is based on the implementation of a hybrid algorithm, combining Harris hawk’s optimization (HHO), a new technique which is based on natural inspiration, and a conventional perturb and observe (P&O) technique. The hybrid technique was tested under different weather conditions in MATLAB Simulink and showed less computational time, a fast convergence speed, and zero oscillations after reaching a power point’s maximum limit. A performance comparison of the hybrid technique was made with bio-inspired particle swarm optimization (PSO), adaptive cuckoo search optimization (ACS), the dragonfly algorithm (DFO), and the water cycle algorithm (WCA). The hybrid technique achieves 99.8% efficiency on average and performs very well among the rest of the competing techniques.

1. Introduction

In the past few decades, the world has begun shifting towards renewable energy sources from fossil fuels (coal, petroleum, and natural gas) for many reasons. Some countries are using renewable sources because they do not have sufficient reservoirs of fossil fuels left; some countries are shifting to using renewable energy sources because they have not had fossil fuel reservoirs from the beginning, and they have to import from oil-producing countries, which affects their annual budget; and some countries are shifting towards renewable energy sources because of their pollution-free and noise-free nature. This means every single country is shifting towards renewable energy sources to fulfil their energy demands without affecting their atmosphere. Almost 25% of the total electricity as per 2019 came from renewable energy sources, and it is definitely more today [1].
Solar is the most popular renewable energy source because of its easy installation, low maintenance cost, and environmentally friendly nature. Solar energy is widely used to generate electricity by using photovoltaic (PV) cells. A PV cell, also called a solar cell, is an electronic device which directly coverts sunlight into electricity. For obtaining higher voltage, various PV modules are linked in series to form a PV string, and various strings are connected together in parallel to form a PV array [2]. A solar PV array is connected to an MPPT-based DC to DC converter (used to convert one voltage level to another voltage level); a charge controller, which is used to prevent the overcharging of batteries; DC/AC inverters, which are used to change direct current to alternating current; a battery, which is used to store the charge; and a filter and micro controller, which is used to control the performance of the overall system [3].
PV is reliable source of energy, but it faces challenges regarding maintaining better performance under different irradiance conditions. The current-voltage and power-voltage characteristics of photovoltaics are irregular in nature due to changes in weather conditions. However, to deal with non-linearity, maximum power point tracking (MPPT) algorithms are used to predict the maximum power point (MPP) in all environmental conditions and also pressurize the system to operate at that maximum power point. Many conventional as well as soft computing MPPT techniques/algorithms have been introduced to improve the effectiveness of the PV system.
The fractional short circuit current (FSCC) is a somewhat speedy and simple way to track the maximum power point but is an offline MPPT technique which cannot track the exact MPP [4,5]. Fractional open circuit voltage (FOCV) is a direct, simple, offline, and easy-to-implement technique; similar to FSCV, it is also not able to track the exact MPP [6]. Perturb and observe (P&O) is a technique which is widely used to track MPP. Its working is the same as that of hill climbing and is able to track MPP in both offline and online mode, but its performance degrades when a partial shading condition occurs [7]. Incremental conductance (InC) also works on the principle of hill climbing. It is better than (P&O) but does not extract exact MPP [8]. The above-mentioned techniques are conventional MPPT techniques; they are simple and fast in response, but in a uniform irradiance condition, their effectiveness degrades when a sudden change occurs in environmental conditions.
In order to obtain MPP in a non-uniform environmental condition, many soft computing techniques were also introduced that are best and perform better under a partial shading condition. The artificial neural network (ANN) is also used to detect the maximum power point in photovoltaic (PV) systems. The basic architecture of the artificial neural network consists of three layers, which are an input layer, an output layer, and a hidden layer. Essentially, artificial neural network algorithms use back propagation for training purposes. The correctness of the PV system is enhanced by incrementing the number of hidden nodes, which causes a computational complication. Therefore, artificial neural network-based algorithms are not so efficient for such controllers that have a low price and low computational speed [9].
Ant colony optimization is an optimization technique that is inspired by the food searching practices of ants in real life: if an ant finds the shortest and best path to food, then there is a great chance that other ants will follow that shortest path. Researchers found ant colony optimization more efficient than particle swarm optimization in a MATLAB simulation [10].
The genetic algorithm was presented in 1970. It is a bio-inspired theory that if children have higher health values, then they will have a higher chance to repeat, but it is slow. Similar to ANN, this algorithm also has high computational complexity due to which it requires a high-speed processor [11].
Particle swarm optimization (PSO) is a very effective optimization algorithm or technique. Its idea is based on swarm intelligence. The PSO technique reduces the drawbacks of the conventional maximum power point tracking methods, which are unable to track MPPT in partial shading (PS) conditions [12].
The optimization techniques for MPPT in PV systems include Harris Hawk optimization (HHO) [13], Flower Pollination (FP) [14], Cuckoo Search (CS) [15], Grey Wolf Optimization (GWO) [16], Artificial Bee Colony (ABC) [17], Differential Evolution (DE) [18], Simulated Annealing (SA) [19], Salp Swarm Optimization (SSO) [20], Slip Surface Sliding mode controller (SMC) [21], and Fruit Fly Optimization (FFO) [22]. The PV system’s efficiencies have been rated based on reaction speed, accuracy, efficiency, partial shading, and performance under quick response. Until recently, no technique has consistently produced the greatest outcomes. Table 1 shows the comparisons of several MPPT approaches. SAPVS and GCPVS are the abbreviations for standalone PV system and grid-connected PV system, respectively.
In this article, a hybrid technique is proposed, which is the combination of soft and classical computing techniques called Harris hawk optimization (HHO) and perturb and observe (P&O), to extract energy under PS and CPS conditions. P&O is fast and HHO is consistent for tracking the maximum power. We have discussed the conventional P&O MPPT technique and the soft computing Harris hawk optimization technique, including their tracking mechanism, their benefits, and their drawbacks. We performed hybrid Harris hawk optimization (HHO) and perturb and observe (P&O) to join the qualities of both techniques with the Cuk converter in order to enhance the performance of the entire PV system. A Cuk converter is a DC-DC converter having an output voltage greater than, less than, or somehow equal to its input voltage. Its output is controlled by the duty cycle.
The hybrid algorithm based on HHO and P&O starts with the beneficial characteristics of the P&O algorithm, which are simplicity and a fast settling time. P&O initializes the values, and after that, it calculates the output power that the PV cell perturbs the D-cycle of the DC-to-DC converter. It causes a change in the output voltage and output current, and after obtaining new voltage and current values, it calculates the fresh value of power. Finally, it matches the previous power with the new one. If the new power is larger than the old one, it keeps redoing the same change in the D-cycle. Although, after reaching to top of the hill, the new power begins decreasing, and it inverses the perturbing process; through this increasing and decreasing, P&O finds the global maxima. Now, from there, P&O transfers the parameters to the HHO algorithm because P&O has some drawbacks. Firstly, P&O cannot keep steady state: it oscillates around the global maxima; secondly, P&O cannot perform well in complex partial shading conditions, meaning in rapidly changing atmospheric conditions. Therefore, from this point, our hybrid algorithm introduces HHO, which takes charge and performs from there. Its major responsibility is to keep the output steady, meaning without any oscillation, and to harvest the maximum power from the solar system in partial and complex partial shading conditions. Once HHO obtains the maximum value from P&O in the fastest settling time, it performs its calculations according to the HHO mechanism [23,24].
The following are the advantages of using the hybrid technique based on HHO and P&O:
  • It uses a single constraint to control the exploration exploitation phase.
  • It tracks the global maxima with 100.03. It needs fewer iterations to find the global maxima, and it’s settling time is lowest.
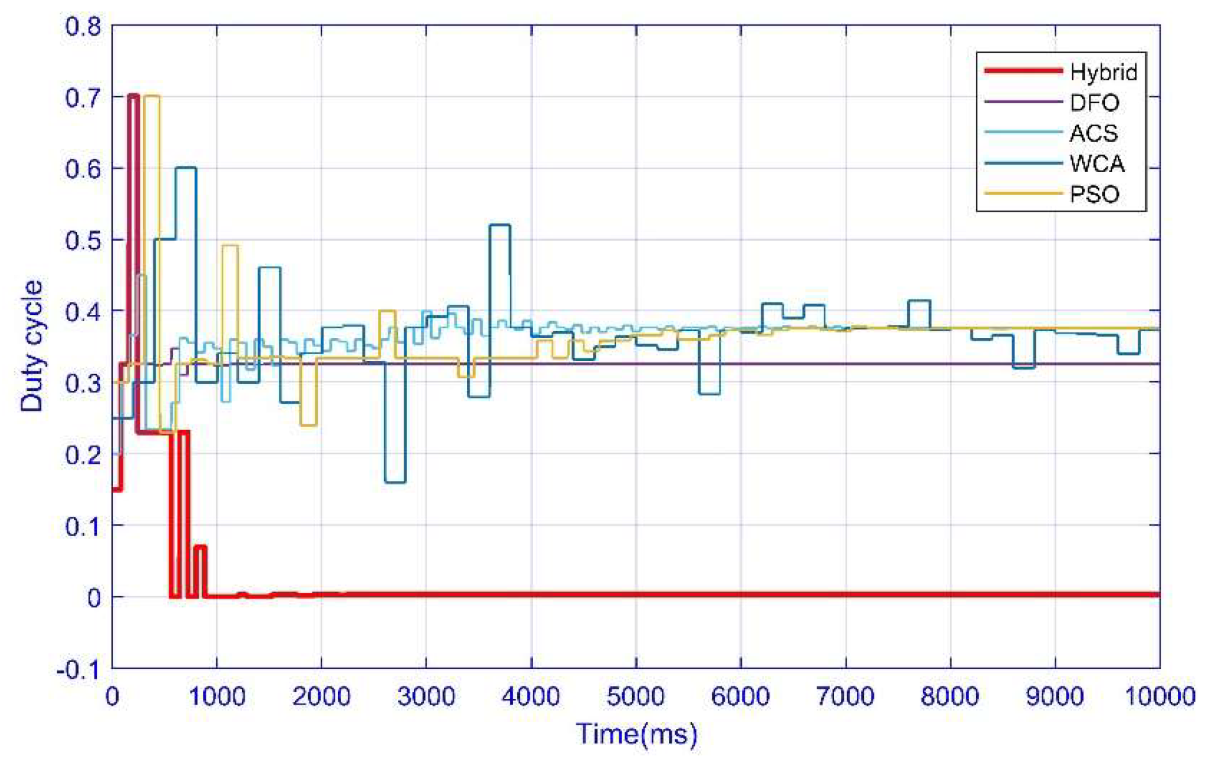
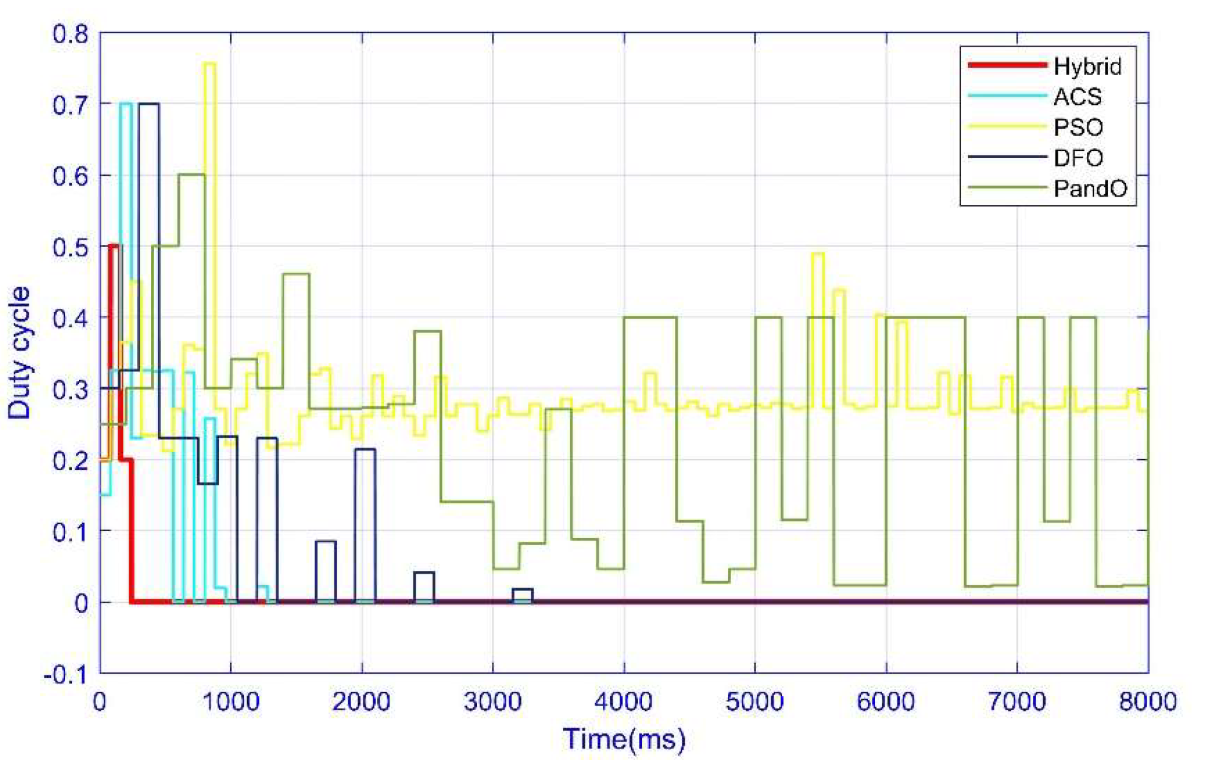
  • The ease zone borderline allows the hybrid particles to stay in stationary oscillation, the result of which is that the iteration cycles are nil. This property is not present in PSO, ACS, etc., which causes a loss in power and unwanted fluctuations.
  • Because of the efficiently planned structural comprehensive model of hawks, it can efficiently deal with complex PS. The power-convergence efficacy is up to 98.9%, and the steady-state fluctuation is compacted to zero at the global MPP.
  • The well-ordered model allows for the fast apprising of the velocity position of hawks, which is essential for high efficiency in maximum PPT problems.
  • A hybrid technique is implemented by using conventional P&O and HHO in order to minimize tracking time and also to improve efficiency.
  • A mathematical model is implemented to detect the uniform, PS, and CPS conditions in a PV system.
  • Four different cases are developed to identify the accuracy and response time of the proposed technique.
  • To check the robustness of the proposed hybrid technique, it is compared with five previously implemented techniques, i.e., DFO, PSO, WCA, ACS, and P&O.
The article has been divided into the following five sections. Section 1 covers a brief introduction of the PV system, its challenges, and the scope of PV systems. Section 2 covers the problems occurring in PV systems, as well as partial and complex partial shading. Section 3 covers the results, findings and discussion. Section 4 covers the conclusions of this article.

2. Materials and Methods

A PV system having controller with hybrid technique was connected to a DC-DC cuk converter to achieve best performance under PS and CPS conditions [25]. The cuk converter is followed by a buck converter used to convert one voltage level to another voltage level. This converter magically yields a zero-ripple current. The cuk converter can be incorporated to yield either voltage step-up or down, thus making it a top choice for a wide range of voltage requirements. Additionally, it uses a capacitor as the key energy storage component, whereas other converters use an indicator for that purpose. The design of the cuk is such that the current flowing through the input side is always continuous irrespective of the state of the switch, which is very important in hybrid techniques, in order to attain the best performance from the PV system [25,26]. The circuit in Figure 1 shows a cuk converter, and it is evident that LC filters are formed both at the input and output, which facilitates smooth current waveform.
This also aids in achieving a very low output voltage ripple, as a second-order low pass filter is formed by the combination of inductors and capacitors. The design of the inductor ensures zero-ripple behavior. Electromagnetic interference can be reduced by incorporating this converter. Thus, this leads to inherently low noise and high overall efficiency.
Figure 1 shows that the cuk converter consists of an input voltage source V g , a MOSFET switch Q 1 , an anti-parallel diode D 1 , a capacitor C 1 for transferring energy, a capacitor C 2 for storing energy, two inductors L 1 and L 2 , and a load resistance R . When switch Q 1 is closed, the circuit is in charging mode, and when switch Q 1 is open, the circuit is in discharging mode. The equations of the cuk converter are as follows [4].
The average output voltage and the load current are
Vo   = D / 1 D     E   Volts
Io   =   Vo / R   Ampere
where, E is supply voltage, D is the duty ratio, and   R is the load resistance.
The minimum value of the inductor for continuous conduction mode is given below; where H is Henry, and it is the unit of inductance.
L 1 = 1 D 2     R / 2 Df   H
L 2 = 1 D     R / 2 f   H  
where f is the switching frequency.
The minimum values of capacitor C 1 and C 2 for continuous conduction mode are below; F is Farad, and it is the unit of capacitance.
C 1 =   D / 2 fR   F
C 2 = 1 / 8 fR   F
For obtaining higher voltage, various photovoltaic modules are linked in a series configuration to construct a photovoltaic string, and various strings are linked together in parallel to form the photovoltaic array. There is no problem if all PV modules obtain the same irradiance from the sun, as the system works perfectly, but in partial shading conditions, there is the possibility that in practice, some PV modules are shaded due various reasons and obtain lower irradiance compared to those modules which are not shaded and obtaining higher irradiance. In series configuration, since the generated current from all devices linked in series configuration must be the same, if the modules which are under shade generate a lower amount of current compared to those modules which are not in shade, the shaded PV module, due to low current, will therefore start to work in reverse-bias domain to facilitate the larger current produced by the modules which are not shaded. This scenario can create effects which will be not favorable: for example, hot-spot effect, etc. For overcoming such reactions, bypass diodes are used across the plates in a solar array to provide an extra track to facilitate the larger amount of current produced by the other modules that are not shaded [14]. An example is shown in Figure 2.
P&O is a widely implemented technique for global maxima harvesting. It works on a hill climbing mechanism. Initially, it calculates output power that the PV cell perturbs the D-cycle of the DC-to-DC converter, which causes change in output voltage and output current, and after obtaining new voltage and current values, it calculates the fresh value of power. Finally, it matches the previous power with the new one. If the new power is larger than the old one, it keeps redoing the same change in D-cycle. Although, after reaching the top of the hill, the new power begins decreasing, and it inverses the perturbing process. Through this increasing and decreasing, P&O finds the global maxima. Equations (7) and (8) illustrate the mathematical expression of P&O for increment and decrement, respectively:
Vnew = Vprev + V   if   Pnew > Pprev
Vnew = Vprev V   if   Pnew < Pprev
HHO is inspired by the natural behavior of the Harris hawk. The core motivation of this algorithm is its co-operative behavior-chasing style in nature. It has been noticed that the Harris hawk manifests the following characteristics. The Harris hawk can reveal multiple chasing styles depending upon the dynamic nature-escaping pattern of the hunt. Several hawks cooperatively attack in the hunt from multiple directions in order to surprise the prey. This novel optimization technique allows the convergence of whole hawks towards GM. The best Harris hawk solution is considered nearly the optimum in each step. If we contemplate an equal chance q for every perching strategy, which depends on the position of other hawks and the prey (rabbit), q < 0.5, and the perches on random tall trees for q 0.5 are presented in Equations (9) and (10) [23,24]:
X t   + 1 =   Xrand t   r 1 Xrand t 2 r 2 X t   q     0.5
X t   + 1 =   Xrabbit     Xm t   r 3 LB   +   r 4 UB     LB   q   < 0.5
where X(t + 1) is the location of hawk in the next iteration t; Xrabbit(t) is the position of rabbit; X(t) is current position of hawks; r1, r2, r3, r4, and q are random numbers between 0 and 1, which are updated on each iteration. LB and UB show the upper and lower bounds of variables, Xm(t) is the average position of the current population of the hawks, and Xrand(t) is a randomly selected hawk from the current population. To achieve its target HHO, the following calculations for its characteristic’s parameters are performed. Average position of HHO, denoted by Xm(t), is the average position of hawks, and it is calculated by Equation (11) [23,24]:
Xm t = 1   N     N   i = 1   Xi t
where Xi(t) indicates the location of each hawk in iteration t, and N denotes the total number of hawks. Energy of the prey: the algorithm is transferred from exploration to exploitation and thus changes between them based on escaping energy of the prey [23,24]:
E   = 2 E 0 1   t T
where E represents the escaping energy of the prey, T is the maximum number of iterations, and Eo is the initial stage of its energy, which changes between the interval of −1 and 1 at each iteration. When the value of Eo decreases from 0 to −1, this means that the rabbit is physically weakening, and when the value increases from 0 to 1, this means that the rabbit is physically strengthening. In the exploration phase, when the value of |E|1, the hawk searches various regions to explore the rabbit’s location, and in the exploitation phase, when value of |E| < 1, the algorithm tries to exploit the neighborhood of the solution in this phase. Hard and soft besiege: the prey always tries to escape from alarming situations. Suppose that r is the chance that the prey is successful in escaping; thus, whatever the hunt does, the hawk will perform hard and soft besiege to catch the prey [6]. In order to switch between hard and soft besiege, parameter E is used. If |E|0.5, the soft besiege happens, and if |E| < 0.5, hard besiege happens. In soft besiege, when r0.5|E|0.5, the prey has some energy to try to escape by some misleading jumps, but at last, the hawk catches the prey. The behavior of the hawk in soft besiege is presented in Equation (13) [23,24]:
X t   + 1 = X t   E | JXrabbit t   X t
t =   Xrabbit t   X t
where X(t) is the difference between the position vector current location of prey, and J represents random jumps of the rabbit during escape. The value of the jumps changes in each iteration in order to simulate the nature of the prey motion. In hard besiege, when r 0.5 and |E| < 0.5, the prey has low escaping energy. In this condition, the current position is updated using Equation (15) [23,24]:
X t   + 1 =   Xrabbit t   E X t
Levy Flight: the LF utilizes the zigzag behavior of the prey during dodging the irregular rapid dive of hawks around the escaping prey. In LF, they compare the possible result with the previous dive to detect the prey and check weather this dive is good from the previous one or not. The behavior of their dive depends on the below-mentioned equations:
Z   =   Y   +   S   LF D  
where D is the dimension of the problem, S is the random vector of size 1 × D, and LF is the levy flight function calculated in Equation (17) [23,24]:
LF x = 0.01 u σ v 1 / β   ,   σ =   Γ 1 +   β sin π β 2 Γ 1 + β 2 β 2 β 1 2 1 / β  
where u and v are random variables between 0 and 1, and the default constant is set to 1.5. A flowchart of HHO for MPPT tracking is given below in Figure 3. Hence, the strategy for updating Figure 3: the flowchart of the Harris hawk algorithm position of the hawks can be accomplished by Equations (18) and (19) [23,24]:
X t   + 1 =   Y ,   ifF Y <   F X t  
X t   + 1 =   Z ,   ifF Z <   F ( X ( t
When soft besiege with progressive rapid dive, Equation (20) is used [23,24]:
Y   =   Xrabbit t   E JXrabbit t   X t  
When hard besiege with progressive rapid dive, Equation (21) is used [23,24]:
Y   =   Xrabbit t   E JXrabbit t   Xm t  

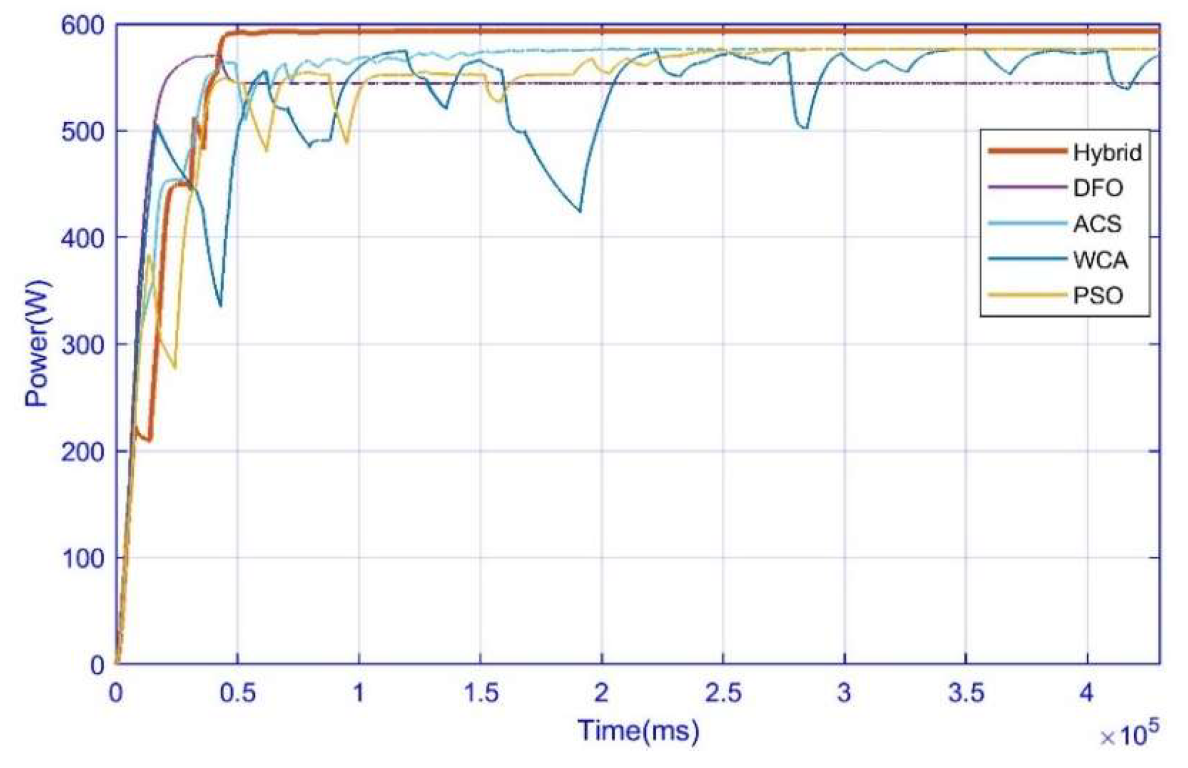
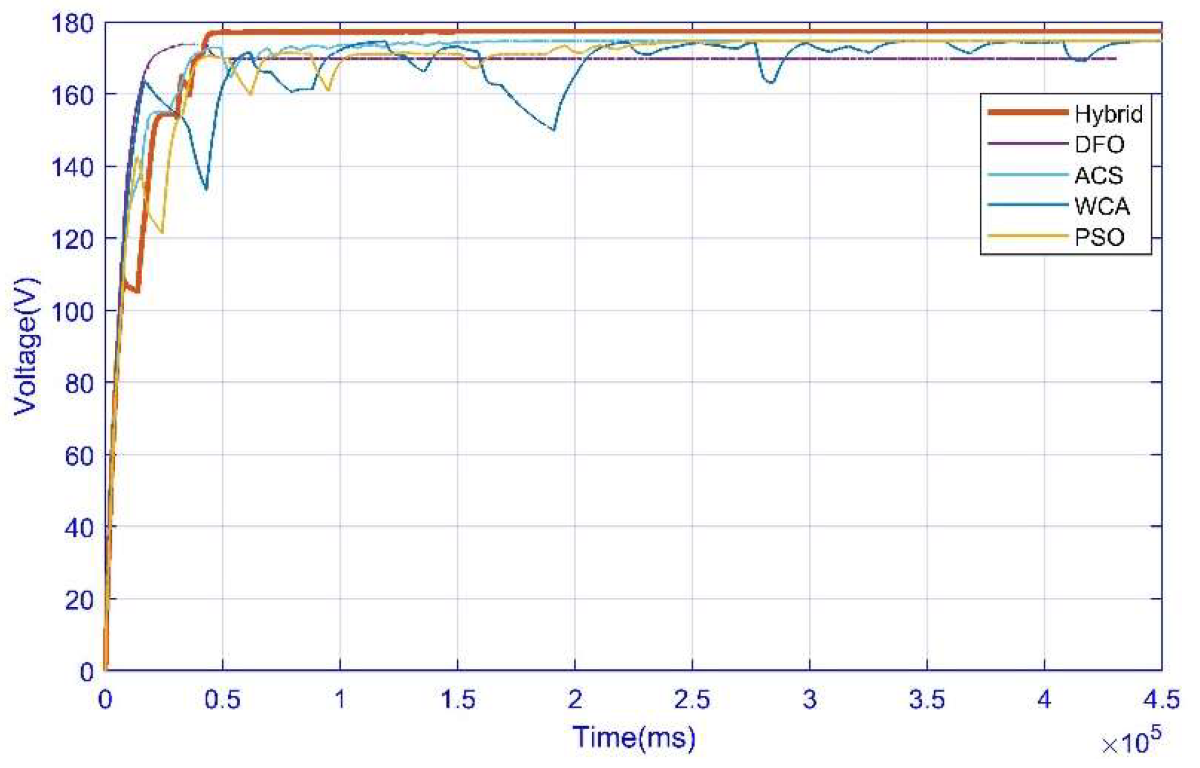
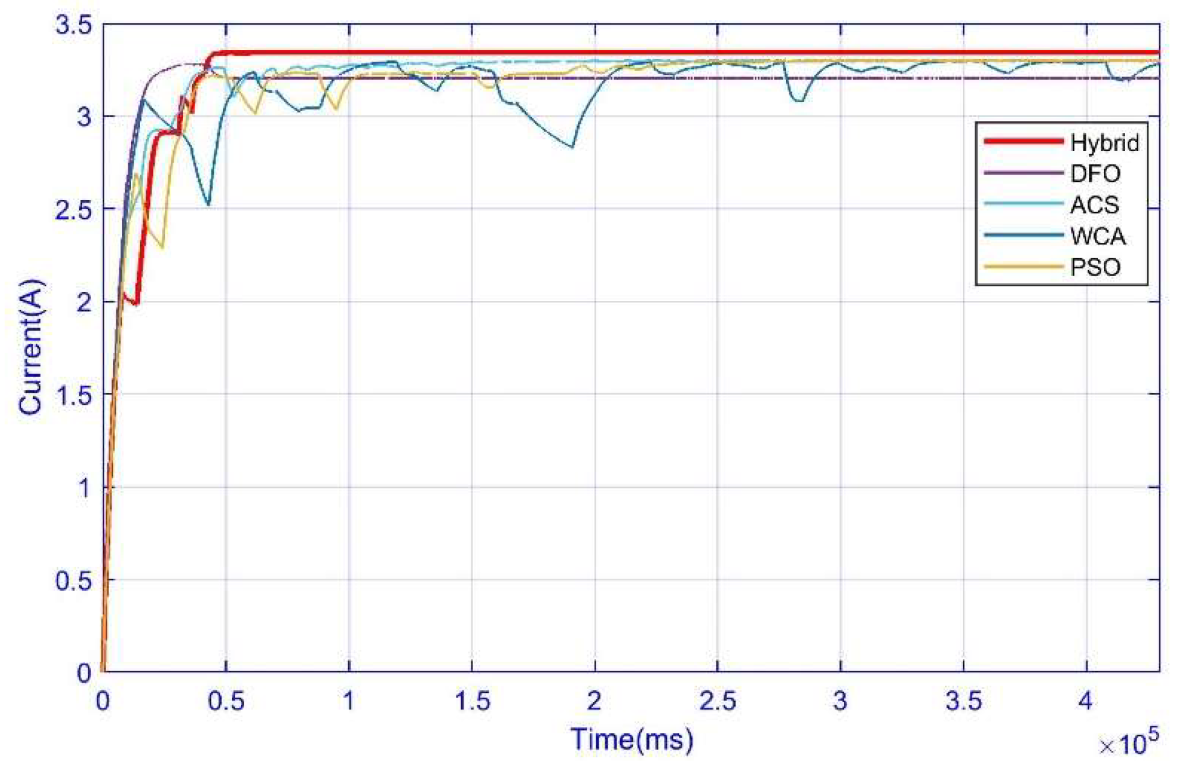
3. Results and Discussion

In this section, we will test our hybrid MPPT technique based on HHO and P&O on four unique cases expressing different working situations and will compare it with already implemented techniques, which are bio-inspired particle swarm optimization (PSO), adaptive cuckoo search optimization (ACS), the dragonfly (DA) algorithm, the water cycle algorithm (WCA), and perturb and observer (P&O). The details of the cases can be seen in the table below.
Case 1 is of a uniform irradiance condition in which all solar plates have the same irradiance from the light of the sun. Cases 2 and 3 are of a partial shading condition, and Case 4 is of a complex partial shading condition. Table 2 shows the four different operating conditions and their final comments are made on the attained performance. A comprehensive performance study is given in Table 3. The results are examined in terms of tracking time, power convergence, steady-state oscillations, settling time, voltage and current transients, power efficiency, and energy. These cases will be tested on a MATLAB simulation model.

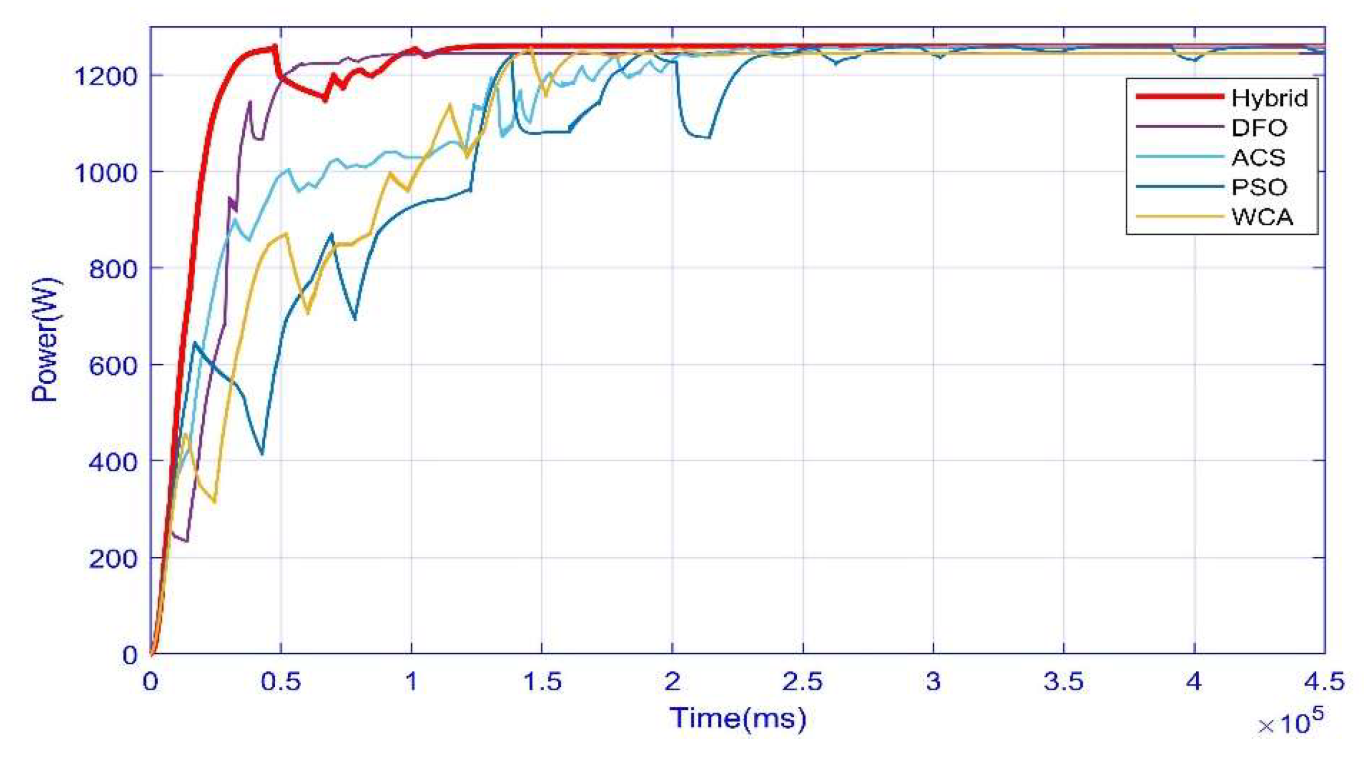
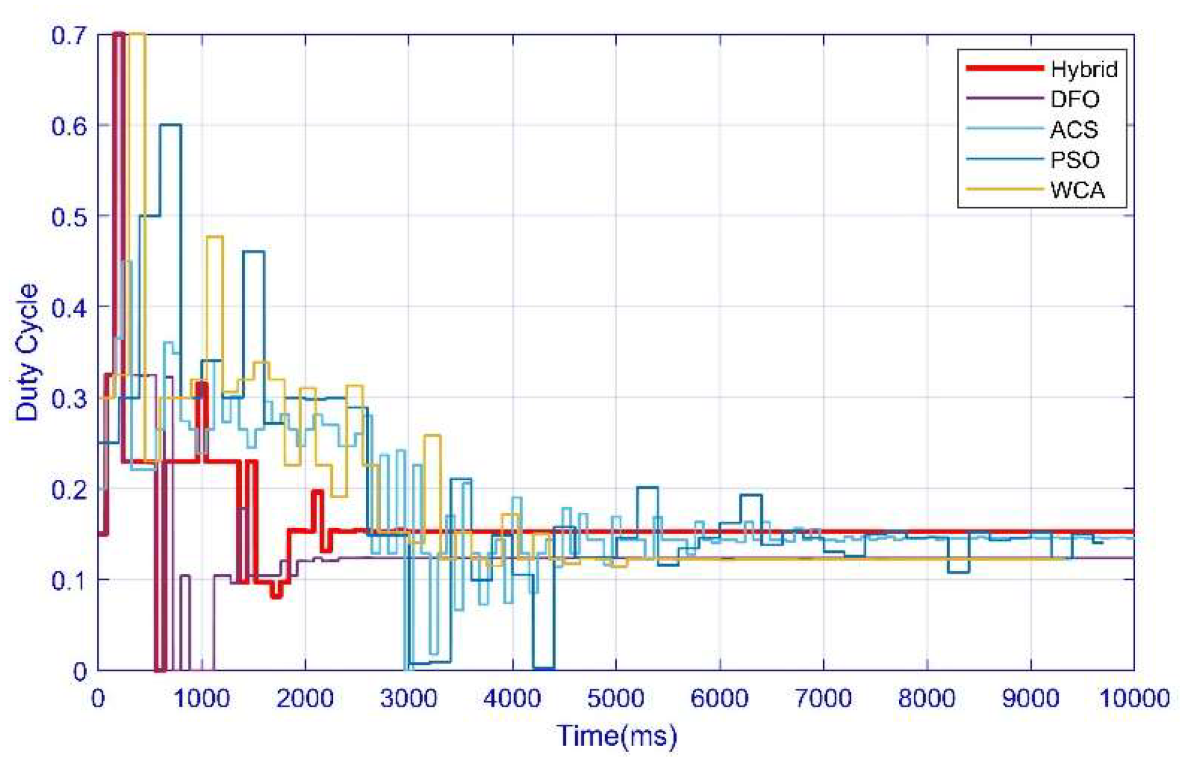
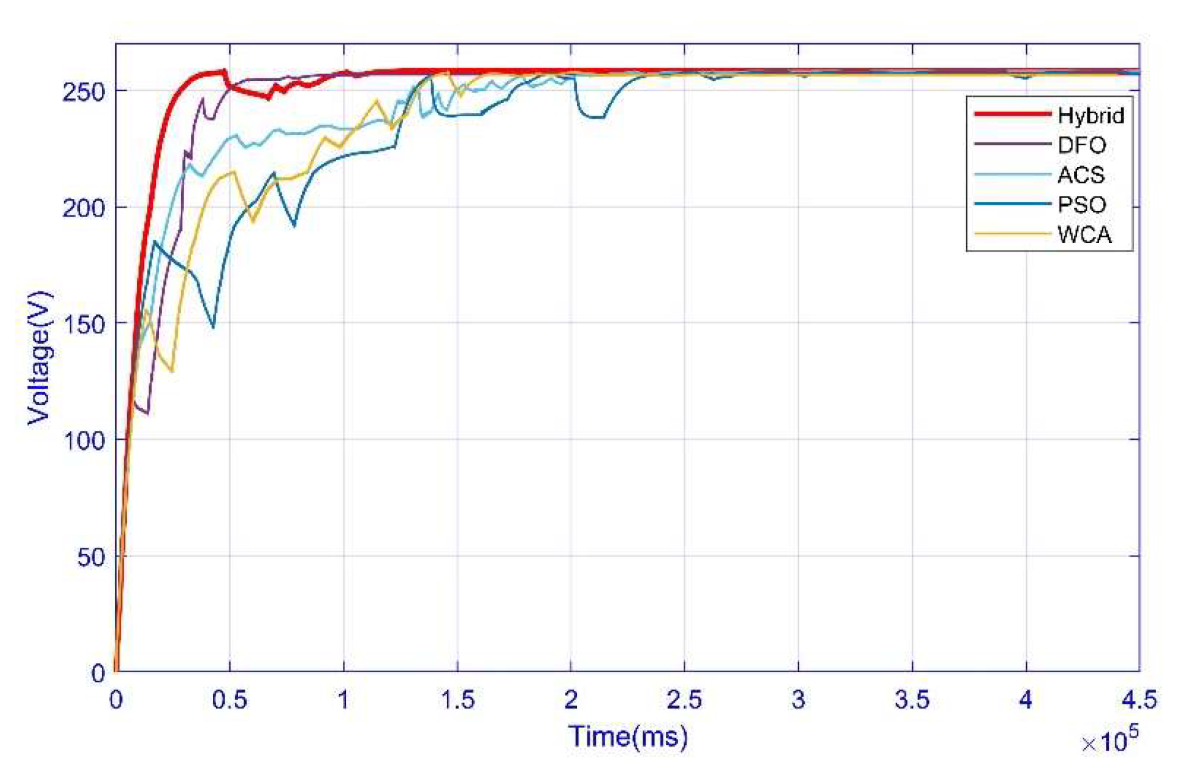
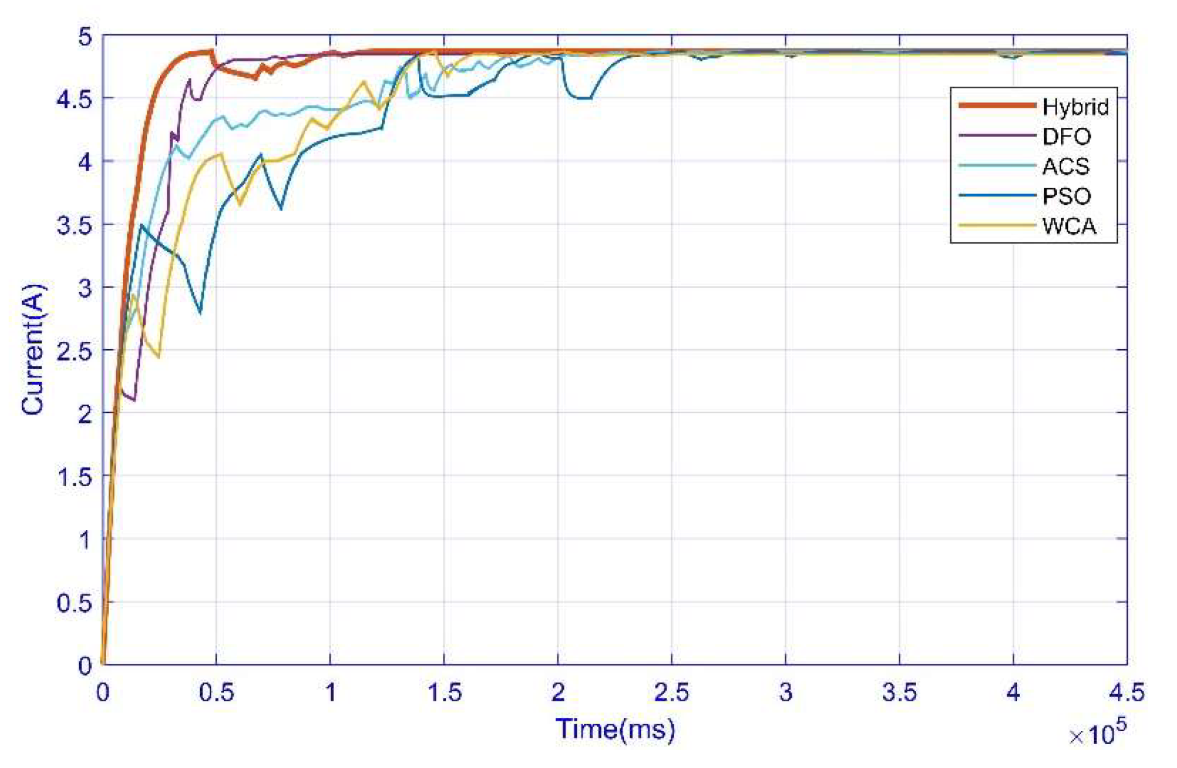
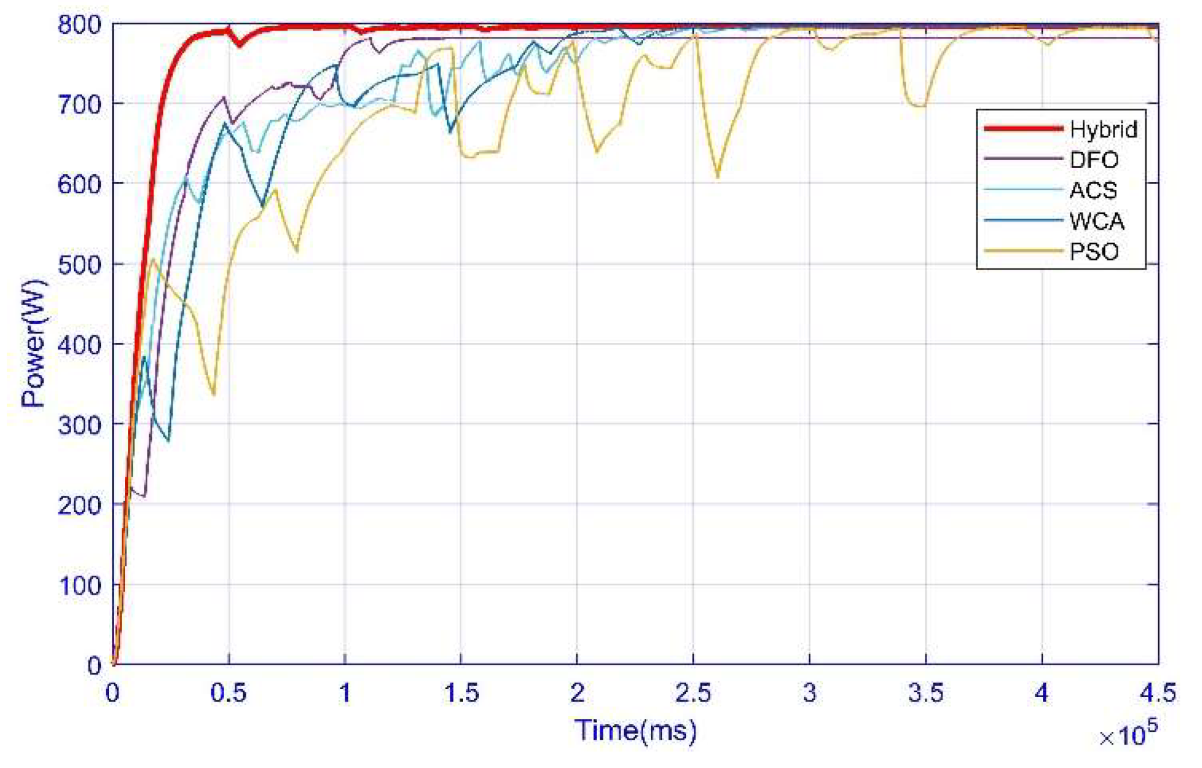
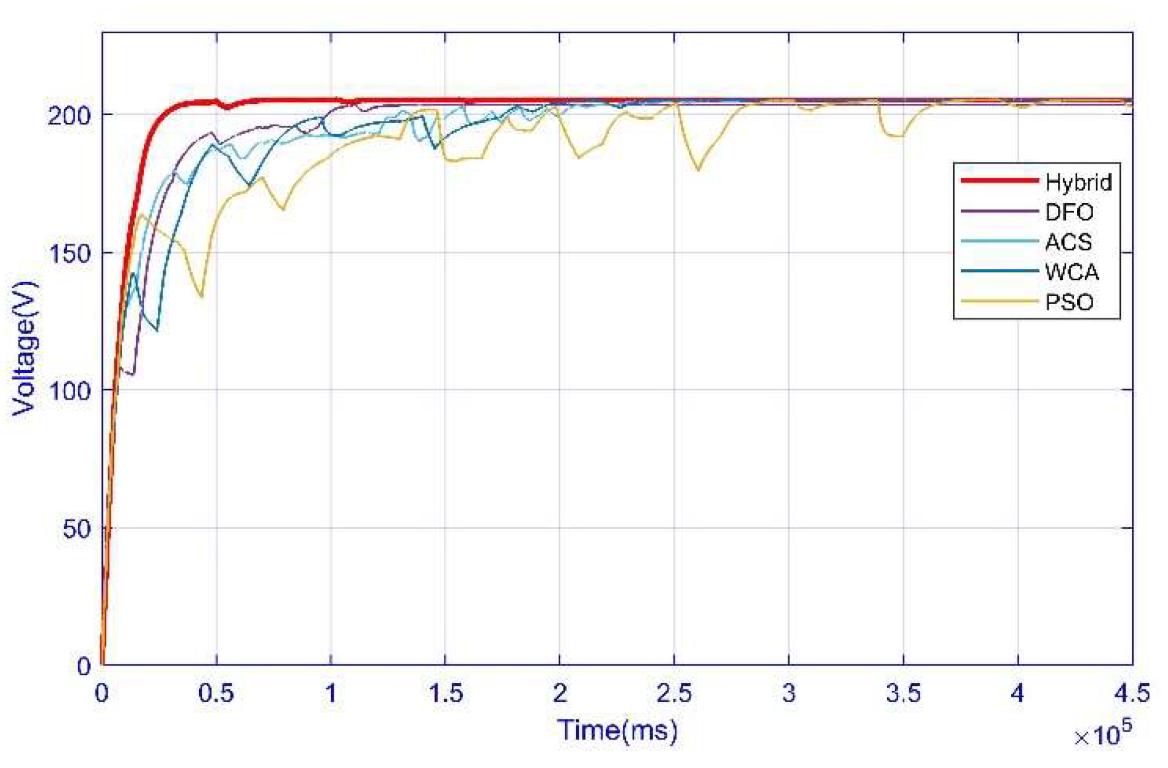
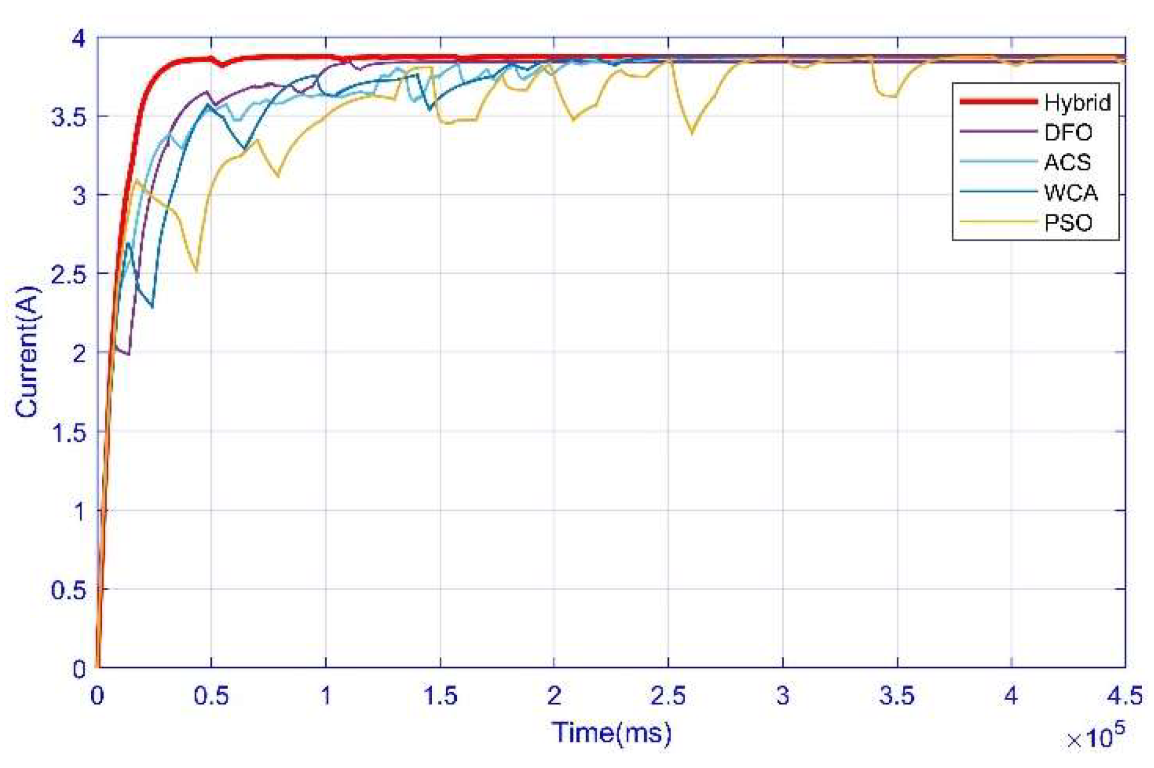
3.1. Case 1: Uniform Irradiance Condition

In Case 1, all photovoltaic modules receive the same levels of irradiance, which is called the uniform irradiance condition. The irradiance values are according to Table 2 of this article, having title descriptions of different cases. The power comparison is presented in Figure 4.
Table 2. Description of different cases.
Cases Irradiance   S i = k W m 2 Pmax
Case 1–4PV1PV2PV3PV4(W)
Case 110001000100010001260
Case 29001000800400796
Case 31000600900300594
Case 44002006003001078
500400200300
10008007001000
The red bold line in the graph represents our hybrid algorithm, while the blue line represents bio-inspired particle swarm optimization (PSO), the sky blue line represents adaptive cuckoo search optimization (ACS), the purple line represents the dragonfly (DF) algorithm, and the yellow line represents the water cycle algorithm (WCA). We can see clearly that the hybrid algorithm reached the maximum power point in less time, and after reaching the maximum power point, it had comparatively fewer oscillations. During the uniform irradiance condition, the power achieved by the hybrid was the maximum by achieving 1259.9 W, followed by the WCA achieving 1255 W, DFO achieving 1245 W, PSO achieving 1244 W, and ACS achieving the lowest 1236 W, respectively, out of 1260 W. Power convergence efficiency in the uniform irradiance condition consisted of the hybrid achieving 99.9%, the WCA achieving 99.6%, DFO achieving 98.4%, PSO achieving 99.7%, and ACS achieving the lowest 98.1%, respectively. The duty cycle, voltage, and current transient are presented in Figure 5, Figure 6 and Figure 7, respectively, which clearly shows that the performance of our hybrid algorithm is much better compared to dragon fly optimization (DFO), adaptive cuckoo search optimization (ACS), particle swarm optimization (PSO), and the water cycle algorithm (WCA).
Figure 5 shows the duty cycle, the fluctuation in the voltages and current are shown in Figure 6 and Figure 7, meaning that after reaching the maximum power point, our hybrid becomes comparatively stable, while other techniques have more fluctuations, due to which we can see the uncertainty in the duty cycle graph as well.

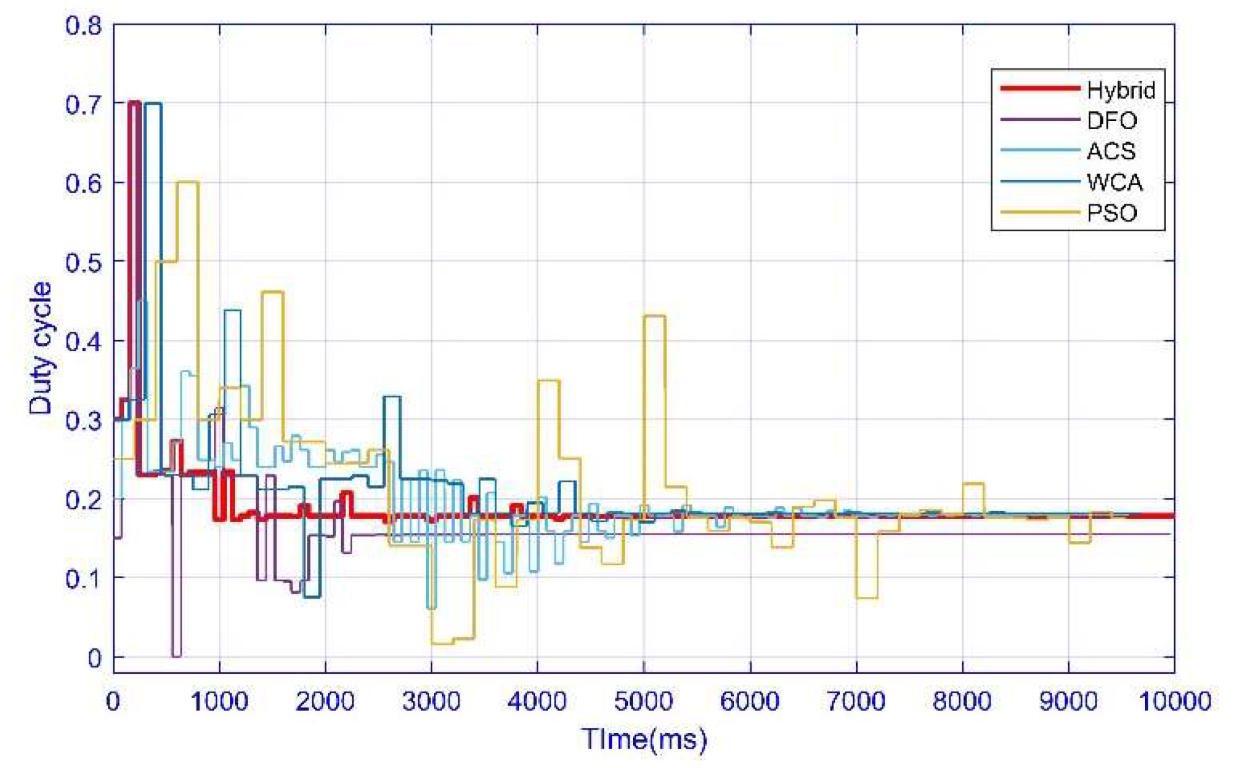
3.2. Case 2: Partial Shading Condition Scenario I

In this case, the global maximum power point is at 796 W. The illumination pattern is present in Table 2 of this article. The comparability of the duty cycle is presented in Figure 8.
We can clearly see the changes in the duty cycle graph: the red line shows the almost stable duty cycle of the hybrid algorithm after it achieved maximum power due to stable voltage and current, while the other lines have many fluctuations, which shows that the output voltage and current of the other techniques are not stable. The comparisons of the power, voltage, and current of the hybrid algorithm with the other techniques are presented in Figure 9, Figure 10 and Figure 11, respectively.
In this case, the power achieved by the hybrid is the maximum by achieving 794.8 W, followed by the WCA achieving 793.4 W, ACS achieving 793 W, DFO achieving 792.3 W, and PSO achieving the lowest 792 W, respectively, out of 796 W, as can be seen in Figure 9. The hybrid has the highest 99.84% efficiency as compared to the WCA at 99.67%, ACS at 99.2%, DFO at 99.53%, and PSO at 99.90%, in this case. The robustness of the MPP tracking is revealed by the fast-tracking of the global maxima efficient settling time at the global maxima. Experimental simulations show that it takes the hybrid 0.3 s, D.FO 1.4 s, P.SO 3.4 s, ACS 2.3 s, and the WCA 2.7 s.

3.3. Case 3: Partial Shading Condition Scenario II

In this case, we have tested another scenario of a partial shading condition, and in this case, the global maximum power point is at 594 W. The illumination pattern is present in Table 2 of this article. The comparability of the duty cycle is presented in Figure 12.
Similar to earlier cases (Cases 1 and 2), we can clearly see the changes in the duty cycle graph: the red line shows the almost stable duty cycle of the hybrid algorithm after it achieved maximum power due to stable voltage and current, while the other lines have many fluctuations, which shows that the output voltage and current of the other techniques are not stable. The comparisons of the power, voltage, and current of the hybrid algorithm with the other techniques are presented in Figure 13, Figure 14 and Figure 15, respectively.
In this case of the partial shading condition, the power achieved by the hybrid is the maximum by achieving 593.2 W, followed by ACS achieving 570.6 W, PSO achieving 570.5 W, the WCA achieving 568.2 W, and DFO achieving the lowest 552.7 W, respectively, out of 594 W, which can be seen in Figure 13. The hybrid has the highest 99.86% efficiency as compared to ACS at 96.06%, PSO at 96.04%, the WCA at 95.65%, and DFO at 93.04%, in this case. The robustness of the MPP tracking is revealed by the fast-tracking of the global maxima efficient settling-time at the global maxima. Experimental simulations show that it takes the hybrid 0.4 s, DFO 0.4 s, ACS 1.4 s, the WCA 1.3 s, and PSO 2.4 s to converge, and they can settle after 0.6 s, 0.6 s, 1.6 s, 2.4 s, and 2.5 s, respectively.

3.4. Case 4: Complex Partial Shading Condition

The final and most important case is the complex partial shading condition. In this case, we have used 12 solar plates PV(1)–PV(12) having illumination values mentioned in Table 2 of this article. In this case, the global maximum power point is at 1078 W. A slight change is made in the comparison: we have included the conventional technique simple P&O instead of the WCA so that the difference could be clear and prominent between the simple P&O and the hybrid P&O. The comparability of the duty cycle is presented in Figure 16.
The hybrid performance in this case is also much better: the red line shows the almost stable duty cycle of the hybrid algorithm after it achieved maximum power due to stable voltage and current. After the hybrid, DFO achieved a stable duty cycle, but it takes more time to become stable compared to the hybrid; the other remaining lines have many fluctuations, which shows that the output voltage and current of the other techniques are not stable. The comparisons of the power, voltage, and current of the hybrid algorithm with the other techniques are presented in Figure 17, Figure 18 and Figure 19 respectively.
In this, the power achieved by the hybrid is the maximum by achieving 1077 W, followed by DFO achieving 1075 W, PSO achieving 1068 W, ACS achieving 1067 W, and conventional P&O achieving the lowest 262 W, respectively, out of 1078 W, as can be seen in Figure 17. The hybrid has the highest 99.6% efficiency as compared to DFO at 99.5%, PSO at 99.2%, ACS at 99.2%, and conventional P&O at the lowest 24.7%.
The results indicate that the proposed hybrid technique outperforms in all the cases. Table 3 indicates the comparison and performance evaluation of all four (4) cases. The performance evaluation is based on arithmetical analysis of the hybrid with soft-competing techniques, which are commonly used for the MPPT problem. The hybrid algorithm performed very well and achieved the highest power point in all cases, including the uniform irradiance condition, partial shading condition, and complex partial shading condition. The average efficiency of the hybrid is 99.8%, PSO is 98.36%, the WCA is 98.30%, ACS is 98.14%, and DFO is 97.62%. Conventional perturb and observe (P&O) obtained the lowest average in the complex partial shading condition (Case 4) and obtained only 24.7% power of the 1078 W. The proposed technique is comparatively faster than all other techniques because it starts its algorithm with the P&O technique; if the system is in uniform irradiance conditions, then the algorithm immediately determines the MPP. However, if the system is in partial shading conditions or complex partial shading, the system initially converges with the P&O algorithm, and then it switches to HHO. Thus, in this case, the convergence time is automatically reduced compared to other techniques.
Table 3. Technical comparison of hybrid technique with other implemented techniques.
Performance ParametersHybrid (1–4)DFO (1–4)ACS (1–4)WCA (1–3)PSO (1–4)P&O (4)
Convergence Time (s)0.160.230.461.40.47-
0.251.21.62.23.0-
0.40.41.41.32.4-
0.170.190.40-0.42LM
Settling Time GM (s)0.200.270.691.70.70-
0.31.42.32.73.4-
0.60.61.62.42.5-
0.250.220.51-0.50LM
GM LocatedYESYESYESYESYES-
YESYESYESYESYES-
YESNONONONO-
YESYESYES-YESNO
Power at GM12601260126012601260-
796796796796796-
594594594594594-
107810781078-10781078
Power Tracked (W)1259.91245123612551244-
794.8792.3793793.4792-
593.2552.7570.6568.2570.4-
1077.010751067-1068262
Energy1.66 × 1031.65 × 1031.65 × 1031.4 × 1031.64 × 103-
1.273 × 1031.23 × 1031.48 × 1031.128 × 1031.263 × 103-
0.87 × 1030.46 × 1031.49 × 1032.21 × 1032.3 × 103-
2.12 × 1032.12 × 1032.12 × 103-2.12 × 1030.5 × 103
Efficiency99.9%98.41%98.1%99.6%98.7%-
99.84%99.53%99.2%99.67%99.49%-
99.86%93.04%96.06%95.65%96.04%-
99.6%99.5%99.2%-99.2%24.7%

4. Conclusions

The hybrid MPPT technique comprised of HHO and P&O is presented in this paper. The hybrid technique has been assessed based on qualitative and quantitative analysis in comparison with P&O, ACS, P.SO, the WCA, and D.FO. The experimental results were done for four different cases, changing irradiance conditions, and partial and complex partial shading. For uniform and partial shading cases, four PV panels are connected, but for the CPS case, twelve PV panels are connected in order to check the performance of the hybrid technique. On the basis of the above results and the findings summarized in the final comparison in Table 3, we can say that the conventional techniques in the complex partial shading condition completely fail because they can achieve only 25% of the actual power and can cause power loss up to 75%, while the hybrid and soft computing techniques performed well under the complex partial shading condition. The results show in Table 2 that the hybrid technique is very effective and performs very well among other techniques in terms of tracking time, power consumption efficiency, and fluctuation decrease.
Furthermore, the hybrid technique is efficient in tracking the global MPP within 90–315 ms, as associated with the time taken by other computing techniques. The hybrid achieves 99.5% efficiency on average and performs very well among the rest of the competing techniques. Under the hybrid, the oscillation is compacted to <1 W, and the re-tracking is tremendously effective. We may determine that the hybrid-based maximum PPT is a good technique to increase the output of the PV system in all environmental conditions.

Author Contributions

Conceptualization, M.A.H., A.N., M.A., M.Y.J. and A.B.A.; methodology, M.A.H., A.N., M.A., M.Y.J. and A.B.A.; software, M.A.H., A.N. and M.Y.J.; validation, M.A.H., A.N., M.Y.J. and A.B.A.; formal analysis, M.A.H. and M.Y.J.; investigation, M.A.H., A.N., M.A., M.Y.J., A.B.A. and Y.W.; resources, M.A.H., A.N., M.Y.J., A.B.A. and Y.W.; data curation, M.A.H. and A.N.; writing—original draft preparation, M.A.H. and A.N.; writing—review and editing, M.Y.J., A.B.A. and Y.W.; visualization, M.A.H., A.N., M.A., M.Y.J., A.B.A. and Y.W.; supervision, M.A.H., M.Y.J., A.B.A. and Y.W.; project administration, M.A.H., M.Y.J., A.B.A. and Y.W. All authors have read and agreed to the published version of the manuscript.

Funding

This work was supported by the National Natural Science Foundation of China under Grant U21B2049.

Institutional Review Board Statement

Not applicable.

Data Availability Statement

Not applicable.

Conflicts of Interest

The authors declare no conflict of interest.

References

  1. Capuano, L.U.S. Energy Information Administration’s International Energy Outlook 2020; US Department of Energy: Washington, DC, USA, 2020; p. 7. Available online: https://www.Eia.Gov/Outlooks/Ieo/ (accessed on 20 September 2021).
  2. Eldin, A.H.; Refaey, M.; Farghly, A. A Review on Photovoltaic Solar Energy Technology and Its Efficiency. In Proceedings of the 17th International Middle-East Power System Conference (MEPCON’15), Mansoura, Egypt, 15–17 December 2015; pp. 1–9. [Google Scholar]
  3. Sarwar, S.; Javed, M.Y.; Jaffery, M.H.; Arshad, J.; Rehman, A.U.; Shafiq, M.; Choi, J.-G. A Novel Hybrid MPPT Technique to Maximize Power Harvesting from PV System under Partial and Complex Partial Shading. Appl. Sci. 2022, 12, 587. [Google Scholar] [CrossRef]
  4. Javed, M.Y.; Mirza, A.F.; Hasan, A.; Rizvi, S.T.H.; Ling, Q.; Gulzar, M.M.; Safder, M.U.; Mansoor, M. A Comprehensive Review on a PV Based System to Harvest Maximum Power. Electronics 2019, 8, 1480. [Google Scholar] [CrossRef] [Green Version]
  5. Sher, H.A.; Murtaza, A.F.; Noman, A.; Addoweesh, K.E.; Chiaberge, M. An intelligent control strategy of fractional short circuit current maximum power point tracking technique for photovoltaic applications. J. Renew. Sustain. Energy 2015, 7, 013114. [Google Scholar] [CrossRef]
  6. Baimel, D.; Tapuchi, S.; Levron, Y.; Belikov, J. Improved Fractional Open Circuit Voltage MPPT Methods for PV Systems. Electronics 2019, 8, 321. [Google Scholar] [CrossRef] [Green Version]
  7. Devi, V.K.; Premkumar, K.; Beevi, A.B.; Ramaiyer, S. A modified Perturb & Observe MPPT technique to tackle steady state and rapidly varying atmospheric conditions. Sol. Energy 2017, 157, 419–426. [Google Scholar]
  8. Radjai, T.; Rahmani, L.; Mekhilef, S.; Gaubert, J.P. Implementation of a modified incremental conductance MPPT algorithm with direct control based on a fuzzy duty cycle change estimator using dSPACE. Sol. Energy 2014, 110, 325–337. [Google Scholar] [CrossRef]
  9. Almonacid, F.; Rus, C.; Hontoria, L.; Fuentes, M.; Nofuentes, G. Characterisation of Si-Crystalline PV Modules by Artificial Neural Networks; Elsevier: Amsterdam, The Netherlands, 2009; Volume 34, pp. 941–949. [Google Scholar] [CrossRef]
  10. Titri, S.; Larbes, C.; Toumi, K.Y.; Benatchba, K. A New MPPT Controller Based on the Ant Colony Optimization Algorithm for Photovoltaic Systems under Partial Shading Conditions; Elsevier: Amsterdam, The Netherlands, 2017; Volume 58, pp. 465–479. [Google Scholar] [CrossRef]
  11. Mohamed, A.; Berzoy, A.; Mohammed, O.A. Design and Hardware Implementation of FL-MPPT Control of PV Systems Based on GA and Small-Signal Analysis. IEEE Trans. Sustain. Energy 2017, 8, 279–290. [Google Scholar] [CrossRef]
  12. Ishaque, K.; Salam, Z.; Amjad, M.; Mekhilef, S. An improved particle swarm optimization (PSO)–based MPPT for PV with reduced steady-state oscillation. IEEE Trans. Power Electron. 2012, 27, 3627–3638. [Google Scholar] [CrossRef]
  13. Mansoor, M.; Mirza, A.F.; Ling, Q. Harris Howk optomization-Based MPPT Control for PV Systems under Partial Shading Conditions. J. Clean. Prod. 2020, 274, 122857. [Google Scholar] [CrossRef]
  14. Pei, T.; Hao, X.; Gu, Q. A novel global maximum power point tracking strategy based on modified flower pollination algorithm for photovoltaic systems under non-uniform irradiation and temperature conditions. Energies 2018, 11, 2708. [Google Scholar] [CrossRef] [Green Version]
  15. Hussaian Basha, C.; Bansal, V.; Rani, C.; Brisilla, R.; Odofin, S. Development of cuckoo search MPPT algorithm for partially shaded solar PV SEPIC converter. In Soft Computing for Problem Solving; Springer: Berlin/Heidelberg, Germany, 2020; pp. 727–736. [Google Scholar]
  16. Suhardi, D.; Syafaah, L.; Irfan, M.; Yusuf, M.; Effendy, M.; Pakaya, I. Improvement of Maximum Power Point Tracking (MPPT) Efficiency Using Grey Wolf Optimization (GWO) Algorithm in Photovoltaic (PV) System. In Proceedings of the IOP Conference Series: Materials Science and Engineering, Kazimierz Dolny, Poland, 23–25 July 2019; IOP Publishing: Bristol, UK, 2019; Volume 674, p. 012038. [Google Scholar]
  17. Fan, L.; Ma, X. Maximum power point tracking of PEMFC based on hybrid artificial bee colony algorithm with fuzzy control. Sci. Rep. 2022, 12, 4316. [Google Scholar] [CrossRef] [PubMed]
  18. Tajuddin, M.; Azmi, A.; Ayob, S.; Sutikno, T. Differential evolution based solar photovoltaic array reconfiguration algorithm for optimal energy extraction during partial shading condition. Int. J. Power Electron. Drive Syst. 2018, 9, 1397. [Google Scholar]
  19. Lin, Z.; Wang, J.; Fang, Z.; Hu, M.; Cai, C.; Zhang, J. Accurate maximum power tracking of wireless power transfer system based on simulated annealing algorithm. IEEE Access 2018, 6, 60881–60890. [Google Scholar] [CrossRef]
  20. Hosseinpour, M.; Mansoori, S.; Shayeghi, H. Selective Harmonics Elimination Technique in Cascaded H-Bridge Multi-Level Inverters Using the Salp Swarm Optimization Algorithm. J. Oper. Autom. Power Eng. 2020, 8, 32–42. [Google Scholar]
  21. Shahdadi, A.; Khajeh, A.; Barakati, S.M. A New Slip Surface Sliding Mode Controller to Implement MPPT Method in Photovoltaic System. In Proceedings of the 2018 9th Annual Power Electronics, Drives Systems and Technologies Conference (PEDSTC), Tehran, Iran, 13–15 February 2018; pp. 212–217. [Google Scholar]
  22. Yang, X.; Li, W.; Su, L.; Wang, Y.; Yang, A. An improved evolution fruit fly optimization algorithm and its application. Neural Comput. Appl. 2020, 32, 9897–9914. [Google Scholar] [CrossRef]
  23. Heidari, A.A.; Mirjalili, S.; Faris, H.; Aljarah, I.; Mafarja, M.; Chen, H. Harris hawks optimization (HHO): Algorithm and applications. Future Gener. Comput. Syst. 2019, 97, 849–872. [Google Scholar] [CrossRef]
  24. Gali, V.; Babu, B.C.; Mutluri, R.B.; Gupta, M.; Gupta, S.K. Experimental investigation of Harris Hawk optimization-based maximum power point tracking algorithm for photovoltaic systems under partial shading conditions. Optim. Control Appl. Methods 2021. [Google Scholar] [CrossRef]
  25. Arnold, F.; Komla, S.; Folly, A. A comparative study between deterministic and two meta-heuristic algorithms for solar PV MPPT control under partial shading conditions. Syst. Soft Comput. 2022, 4, 200040. [Google Scholar] [CrossRef]
  26. Zafar, M.H.; Khan, N.M.; Mirza, A.F.; Mansoor, M.; Akhtar, N.; Qadir, M.U.; Khan, N.A.; Moosavi, S.K.R. A novel me- ta-heuristic optimization algorithm based MPPT control technique for PV systems under complex partial shading condition. Sustain. Energy Technol. Assess. 2021, 47, 101367. [Google Scholar] [CrossRef]
Figure 1. DC-DC cuk converter.
Energies 15 05550 g001
Figure 2. Partial and complex partial shading conditions.
Energies 15 05550 g002
Figure 3. Flow-chart of hybrid technique.
Energies 15 05550 g003
Figure 4. Case 1: Power Comparison of hybrid with other techniques.
Energies 15 05550 g004
Figure 5. Case 1: Duty cycle comparison of hybrid with other techniques.
Energies 15 05550 g005
Figure 6. Case 1: Voltage comparison of hybrid with other techniques.
Energies 15 05550 g006
Figure 7. Case 1: Current comparison of hybrid with other techniques.
Energies 15 05550 g007
Figure 8. Case 2: Duty cycle comparison of hybrid with other techniques.
Energies 15 05550 g008
Figure 9. Case 2: Power comparison of hybrid with other techniques.
Energies 15 05550 g009
Figure 10. Case 2: Voltage comparison of hybrid with other techniques.
Energies 15 05550 g010
Figure 11. Case 2: Current comparison of hybrid with other techniques.
Energies 15 05550 g011
Figure 12. Case 3: Duty cycle comparison of hybrid with other techniques.
Energies 15 05550 g012
Figure 13. Case 3: Power comparison of hybrid with other techniques.
Energies 15 05550 g013
Figure 14. Case 3: Voltage comparison of hybrid with other techniques.
Energies 15 05550 g014
Figure 15. Case 3: Current comparison of hybrid with other techniques.
Energies 15 05550 g015
Figure 16. Case 4: Duty cycle comparison of hybrid with other techniques.
Energies 15 05550 g016
Figure 17. Case 4: Power comparison of hybrid with other techniques.
Energies 15 05550 g017
Figure 18. Case 4: Voltage comparison of hybrid with other techniques.
Energies 15 05550 g018
Figure 19. Case 4: Current comparison of hybrid with other techniques.
Energies 15 05550 g019
Table 1. Detailed comparison of MPPT Techniques.
Sr. No.Ref No.YearMPPT MethodTracking AccuracyEfficient for Partial ShadingConverter TypeVariable SensedType of PV Sys. UsedCan Be in Low Cost ControllerTracking SpeedLevel of ComplexityTotal Score = 15
01[5]2015FSSCMed./2No/1BoostV/3SAPVSYesMed./2Low/311
02[6]2019FOCVMed./2No/1BoostI/3SAPVSYesMed./2Low/311
03[7]2017P&OMed./2No/1BoostI,V/1GCPVSYesFast/3Low/310
04[8]2014InCHigh/3Yes/3BoostI,V/1SAPVSYesFast/3Med./212
05[9]2009ANNHigh/3Yes/3BuckI,V/1SAPVSYesMed./2Low/312
06[10]2017ACOHigh/3Yes/3BoostI,V/1SAPVSNoFast/3Low/313
07[11]2017GAMed./2Yes/3Buck-BoostI,V/1GCPVSYesMed./2Low/311
08[12]2012PSOMed./2Yes/3Buck-BoostI,V/1GCPVSNoMed./2Low/311
09[13]2020HHOHigh/3Yes/3BoostI,V/1SAPVSNoFast/3Low/313
10[14]2018FPHigh/3Yes/3BuckI,V/1SAPVSNoFast/3Low/313
11[15]2020CSHigh/3Yes/3SEPICI,V/1SAPVSNoFast/3High/111
12[16]2019GWOHigh/3Yes/3BuckI,V/1SAPVSNoFast/3Med./212
13[17]2022ABCHigh/3Yes/3BoostI,V/1GCPVSNoMed./2Low/312
14[18]2018DEHigh/3Yes/3BoostI,V/1GCPVSYesMed./2Low/312
15[19]2018SAHigh/3Yes/3BoostI,V/1GCPVSNoLow/1Med./210
16[20]2020SSOHigh/3Yes/3BoostI,V/1SAPVSNoFast/3Low/313
17[21]2022SMCHigh/3Yes/3BoostI,V/1SAPVSNoFast/3Med./212
18[22]2020FFOHigh/3Yes/3BoostI,V/1GCPVSNoMed./2Low/312
Publisher’s Note: MDPI stays neutral with regard to jurisdictional claims in published maps and institutional affiliations.

